Embed Size (px)
Citation preview
SECOND QUARTER PERFORMANCE REPORT
ACTING DIRECTOR-GENERAL: ARTS AND CULTURE
DATE: 24 FEBRUARY 2015
2
PRESENTATION OUTLINE
2
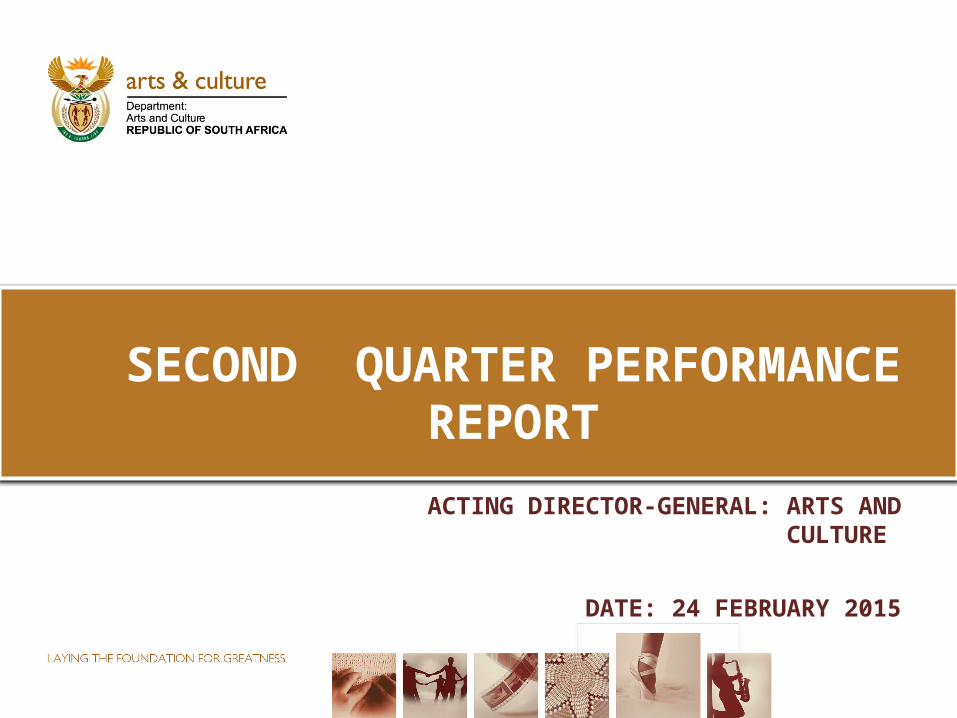
Performance Overview Budget and Expenditure Explanation of Expenditure per Economic Classification. Explanation of the Programme Performance on Key
Indicator
3
3
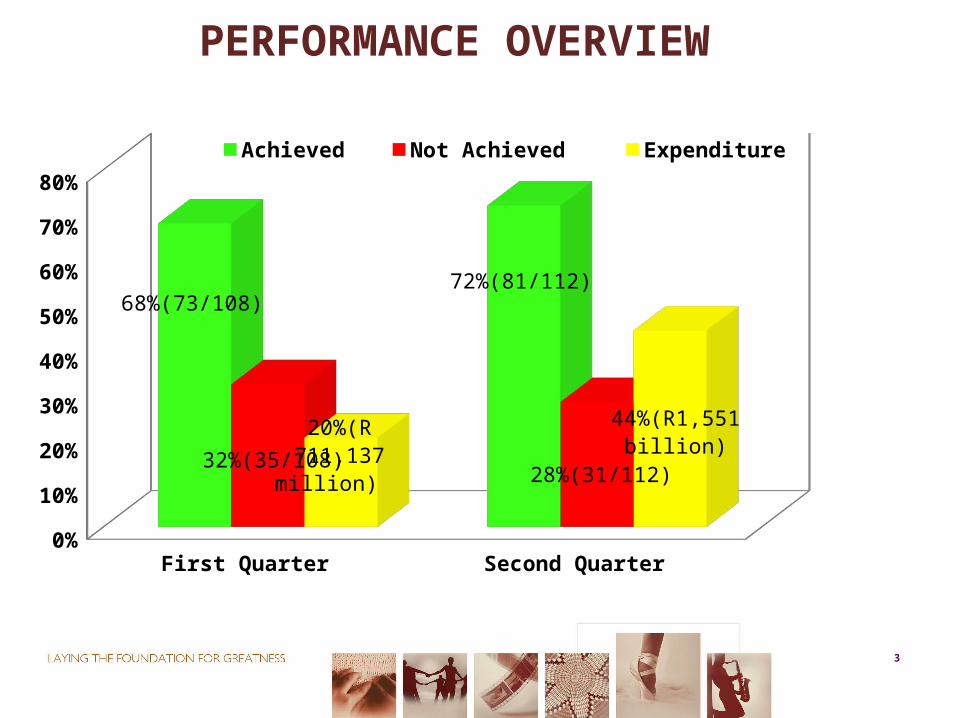
PERFORMANCE OVERVIEW
First Quarter Second Quarter 0%
10%
20%
30%
40%
50%
60%
70%
80%
68%(73/108)72%(81/112)
32%(35/108)28%(31/112)20%(R 711,137
million)
44%(R1,551 bil-lion)
Achieved Not Achieved Expenditure
4
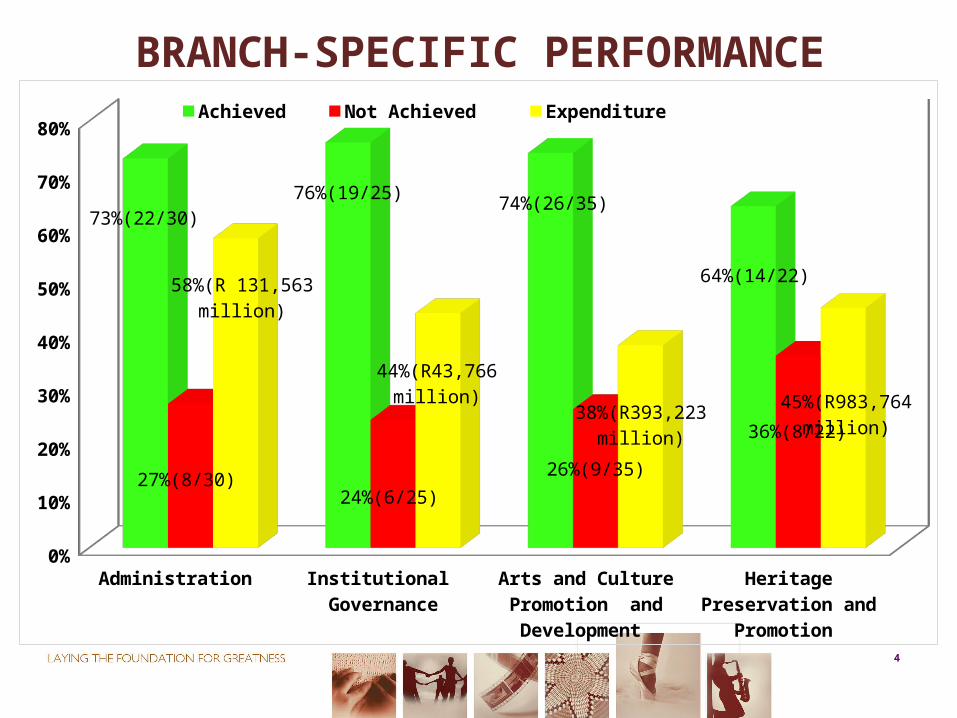
BRANCH-SPECIFIC PERFORMANCE
4
0%
10%
20%
30%
40%
50%
60%
70%
80%
73%(22/30)76%(19/25) 74%(26/35)
64%(14/22)
27%(8/30)24%(6/25)
26%(9/35)
36%(8/22)
58%(R 131,563 million)
44%(R43,766 million)
38%(R393,223 million) 45%(R983,764 million)
Achieved Not Achieved Expenditure
5
BUDGET AND EXPENDITURE
5
6
6
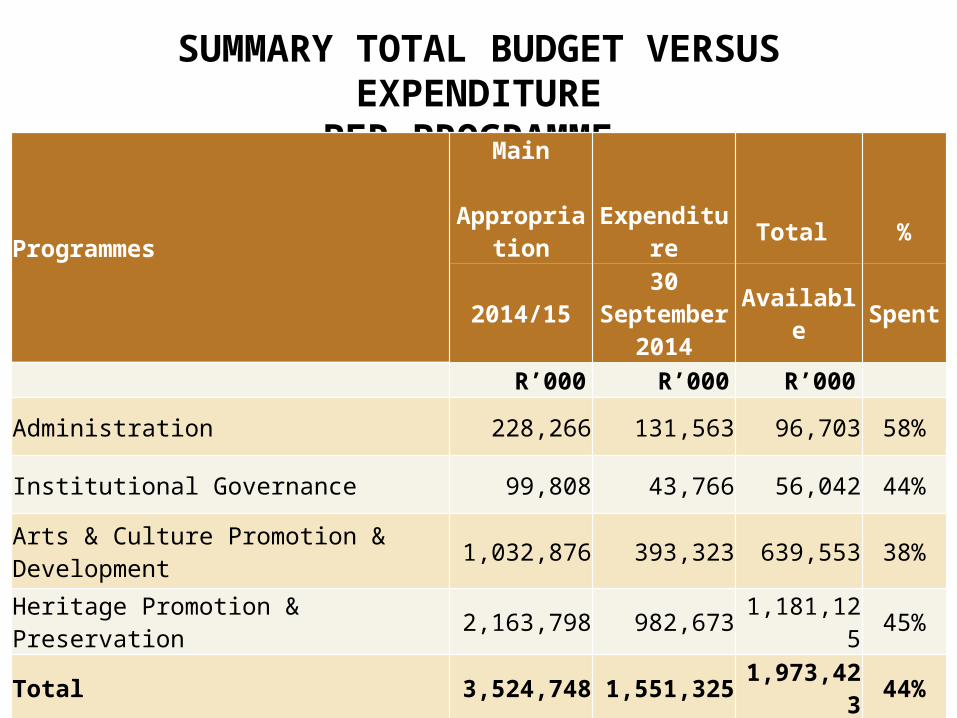
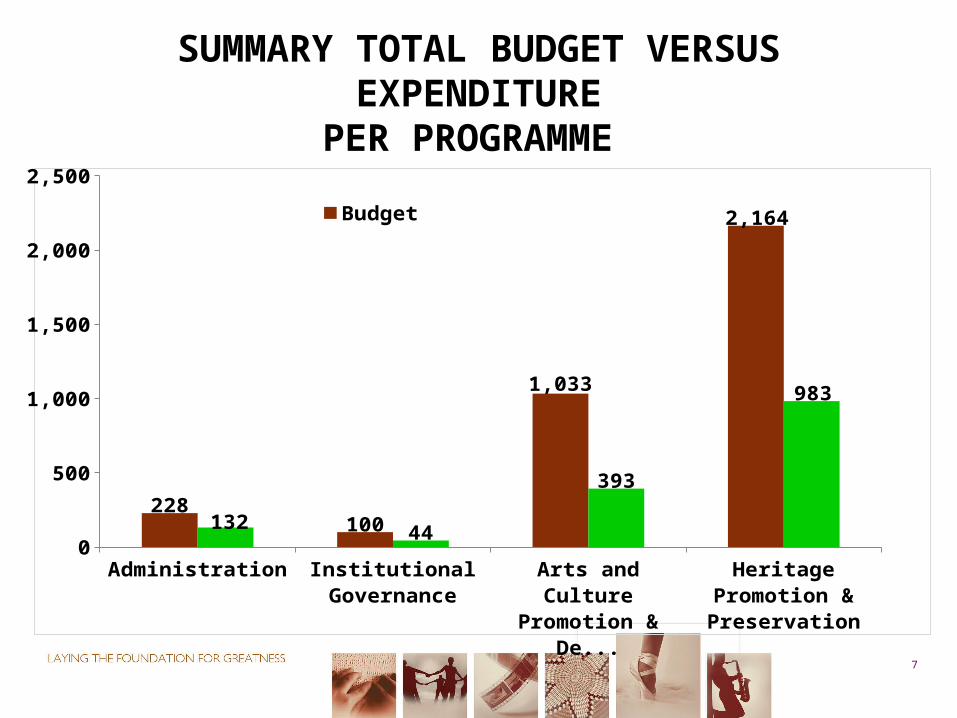
SUMMARY TOTAL BUDGET VERSUS EXPENDITUREPER PROGRAMME
Programmes
Main
Appropriation Expenditure Total %
2014/15 30 September 2014 Available Spent
R’000 R’000 R’000
Administration 228,266 131,563 96,703 58%
Institutional Governance 99,808 43,766 56,042 44%
Arts & Culture Promotion & Development 1,032,876 393,323 639,553 38%
Heritage Promotion & Preservation 2,163,798 982,673 1,181,125 45%
Total 3,524,748 1,551,325 1,973,423 44%
7
SUMMARY TOTAL BUDGET VERSUS EXPENDITUREPER PROGRAMME
7
0
500
1,000
1,500
2,000
2,500
228100
1,033
2,164
132 44
393
983
Budget Expenditure

8
8
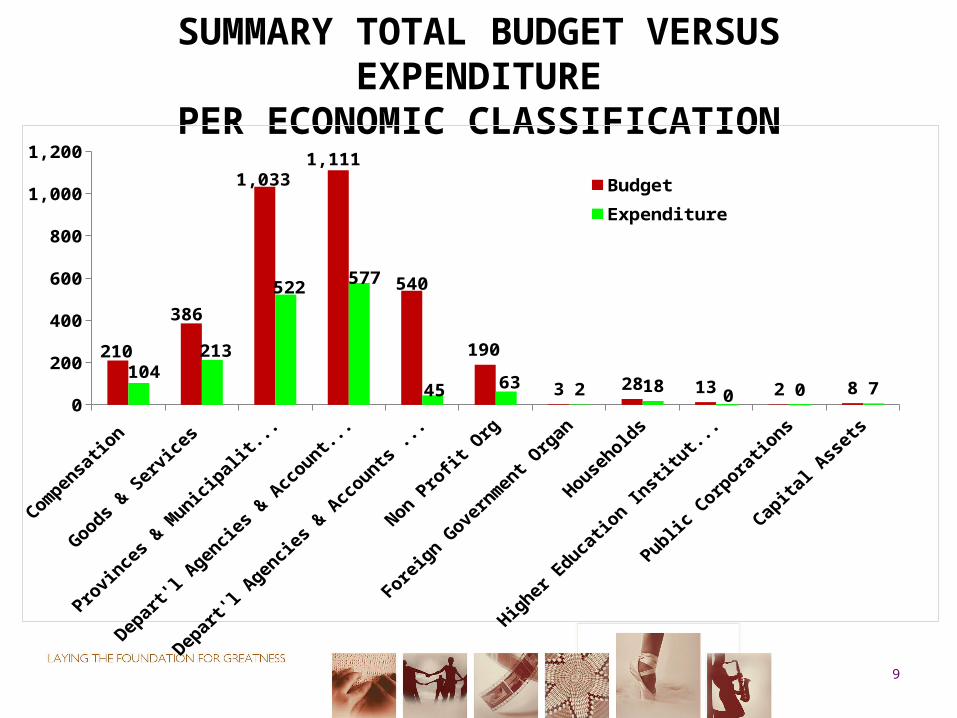
SUMMARY TOTAL BUDGET VERSUS EXPENDITUREPER ECONOMIC CLASSIFICATION
Economic ClassificationMain
Appropriation Expenditure Total %
2014/15 30 September 2014 Available Spent
R’000 R’000 R’000 Compensation 209,910 103,690 106,220 49%Goods & Services (include Payment for Financial Assets and Interest paid on Government Pension Funds)
386,288 212,947 173,341 55%
Provinces & Municipalities 1,032,810 521,960 510,850 51%Dept Agencies & Accounts (Current) 1,111,010 577,080 533,930 52%Dept Agencies & Accounts (Capital Works) 540,083 44,638 495,445 8%Non Profit Org 190,385 63,232 127,153 33%Foreign Government Organ 3,189 2,027 1,162 64%Households 28,405 18,471 9,934 65%Higher Education Institutions 12,870 - 12,870 0%Public Corporations 2,400 - 2,400 0%Capital Assets (Include software, intangible asset & DM’s motor vehicle) 7,398 7,280 118 98%
Grand Total 3 524 748 1 551 325 1 973 423 44%
9
9
SUMMARY TOTAL BUDGET VERSUS EXPENDITUREPER ECONOMIC CLASSIFICATION
0
200
400
600
800
1,000
1,200
210
386
1,0331,111
540
190
3 28 13 2 8104
213
522 577
45 63 2 18 0 0 7
Budget Expenditure
10
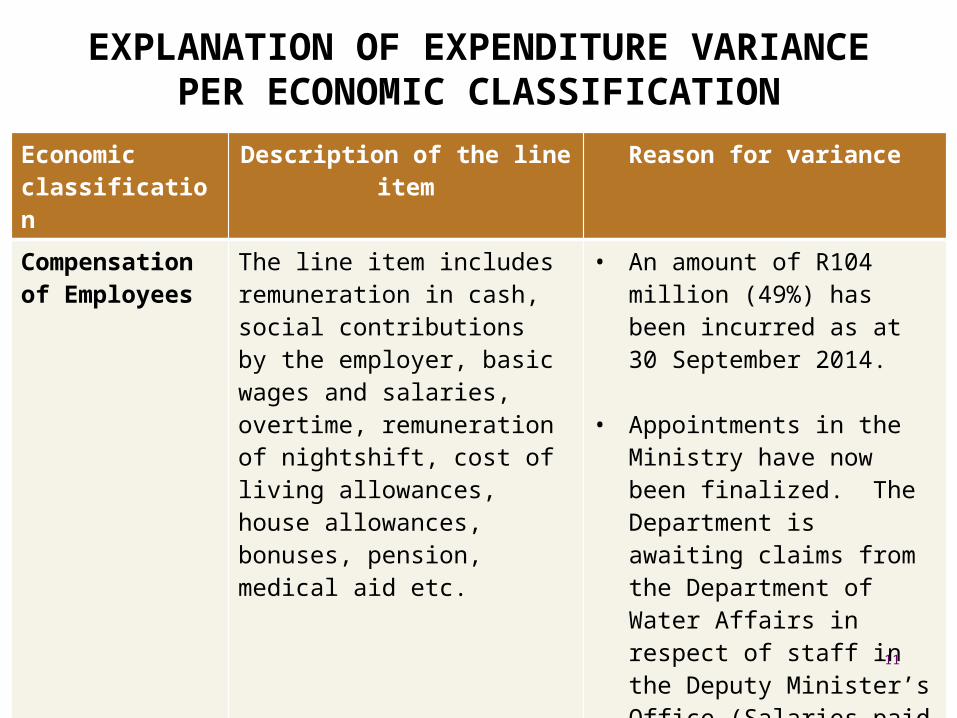
EXPLANATION OF EXPENDITURE VARIANCE PER ECONOMIC CLASSIFICATION
10
11
Economic classification
Description of the line item Reason for variance
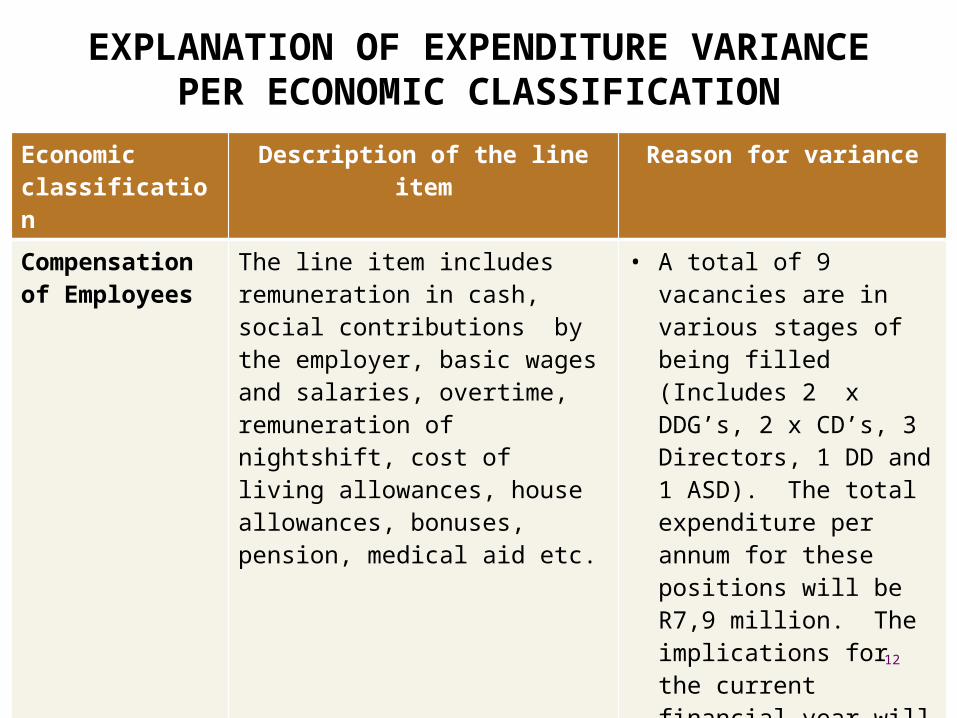
Compensation of Employees
The line item includes remuneration in cash, social contributions by the employer, basic wages and salaries, overtime, remuneration of nightshift, cost of living allowances, house allowances, bonuses, pension, medical aid etc.
• An amount of R104 million (49%) has been incurred as at 30 September 2014.
• Appointments in the Ministry have now been finalized. The Department is awaiting claims from the Department of Water Affairs in respect of staff in the Deputy Minister’s Office (Salaries paid from date of assumption of duty to end of September 2014).
11
EXPLANATION OF EXPENDITURE VARIANCE PER ECONOMIC CLASSIFICATION
12
Economic classification
Description of the line item Reason for variance
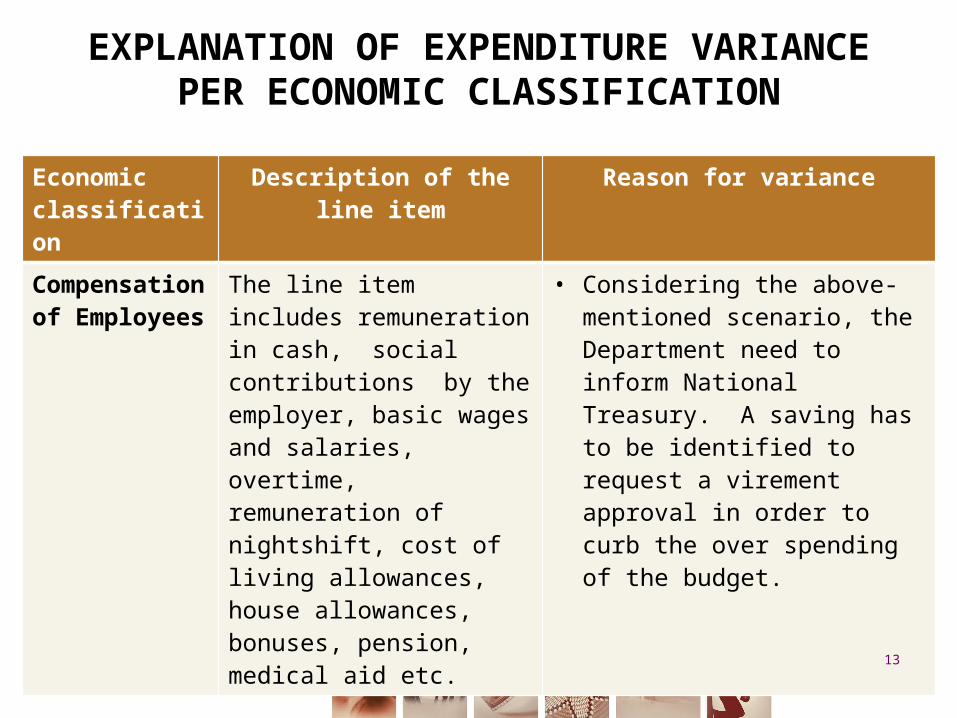
Compensation of Employees
The line item includes remuneration in cash, social contributions by the employer, basic wages and salaries, overtime, remuneration of nightshift, cost of living allowances, house allowances, bonuses, pension, medical aid etc.
• A total of 9 vacancies are in various stages of being filled (Includes 2 x DDG’s, 2 x CD’s, 3 Directors, 1 DD and 1 ASD). The total expenditure per annum for these positions will be R7,9 million. The implications for the current financial year will be R2,6 million (assuming that the positions will be filled by December 2014.
12
EXPLANATION OF EXPENDITURE VARIANCE PER ECONOMIC CLASSIFICATION
13
Economic classification
Description of the line item Reason for variance
Compensation of Employees
The line item includes remuneration in cash, social contributions by the employer, basic wages and salaries, overtime, remuneration of nightshift, cost of living allowances, house allowances, bonuses, pension, medical aid etc.
• Considering the above-mentioned scenario, the Department need to inform National Treasury. A saving has to be identified to request a virement approval in order to curb the over spending of the budget.
13
EXPLANATION OF EXPENDITURE VARIANCE PER ECONOMIC CLASSIFICATION
14
Economic classification
Description of the line item Reason for variance
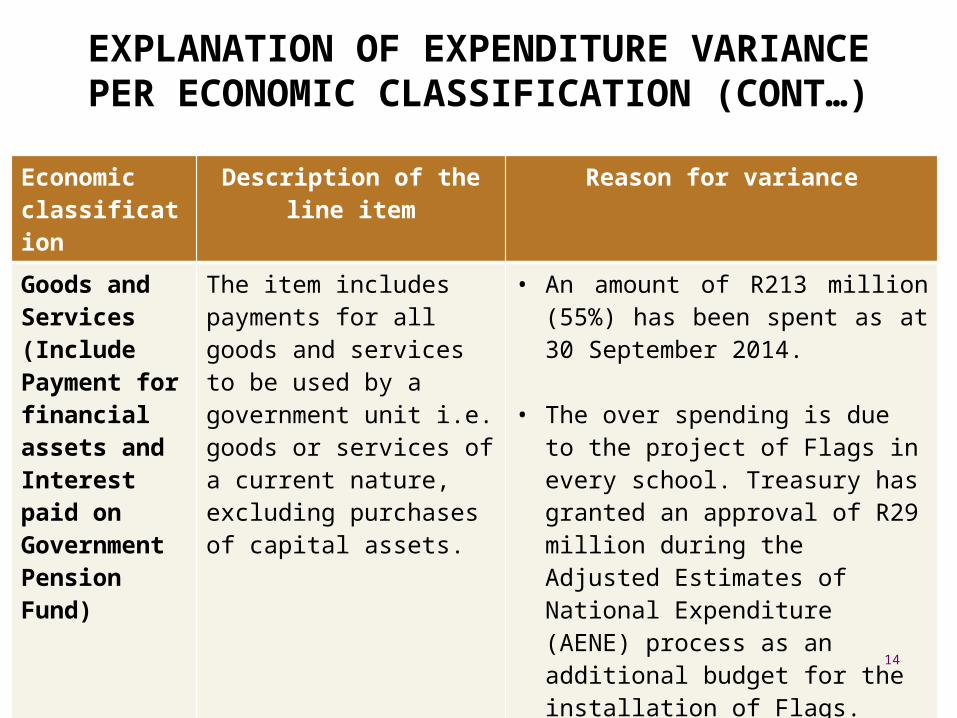
Goods and Services (Include Payment for financial assets and Interest paid on Government Pension Fund)
The item includes payments for all goods and services to be used by a government unit i.e. goods or services of a current nature, excluding purchases of capital assets.
• An amount of R213 million (55%) has been spent as at 30 September 2014.
• The over spending is due to the project of Flags in every school. Treasury has granted an approval of R29 million during the Adjusted Estimates of National Expenditure (AENE) process as an additional budget for the installation of Flags.
14
EXPLANATION OF EXPENDITURE VARIANCE PER ECONOMIC CLASSIFICATION (CONT…)
15
Economic Classification
Description of the line item Reason for variance
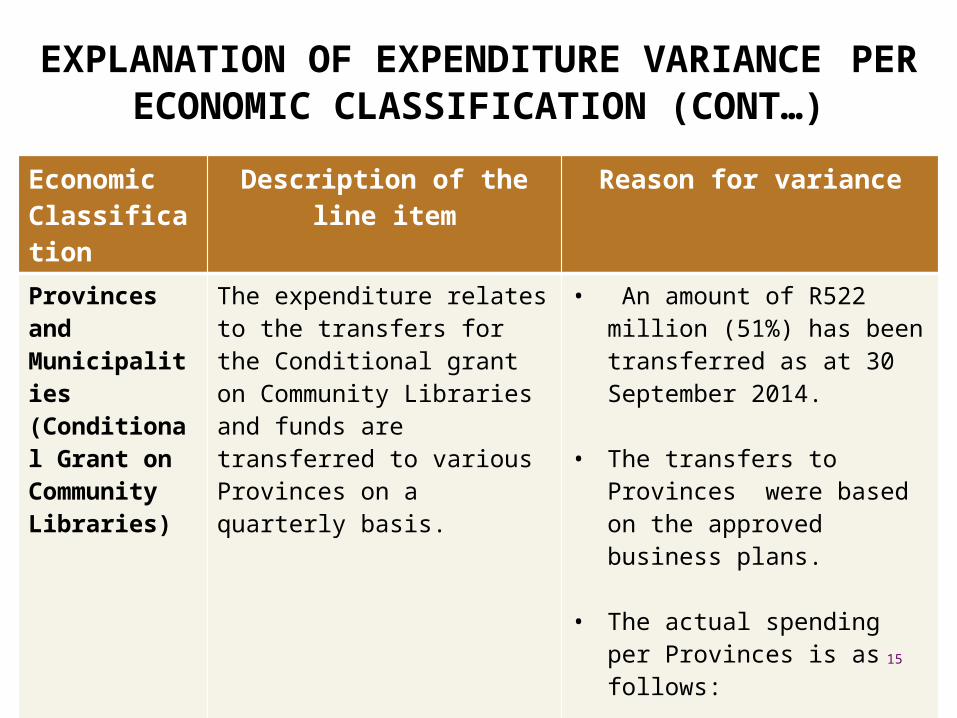
Provinces and Municipalities (Conditional Grant on Community Libraries)
The expenditure relates to the transfers for the Conditional grant on Community Libraries and funds are transferred to various Provinces on a quarterly basis.
• An amount of R522 million (51%) has been transferred as at 30 September 2014.
• The transfers to Provinces were based on the approved business plans.
• The actual spending per Provinces is as follows:
15
EXPLANATION OF EXPENDITURE VARIANCE PER ECONOMIC CLASSIFICATION (CONT…)
16
16
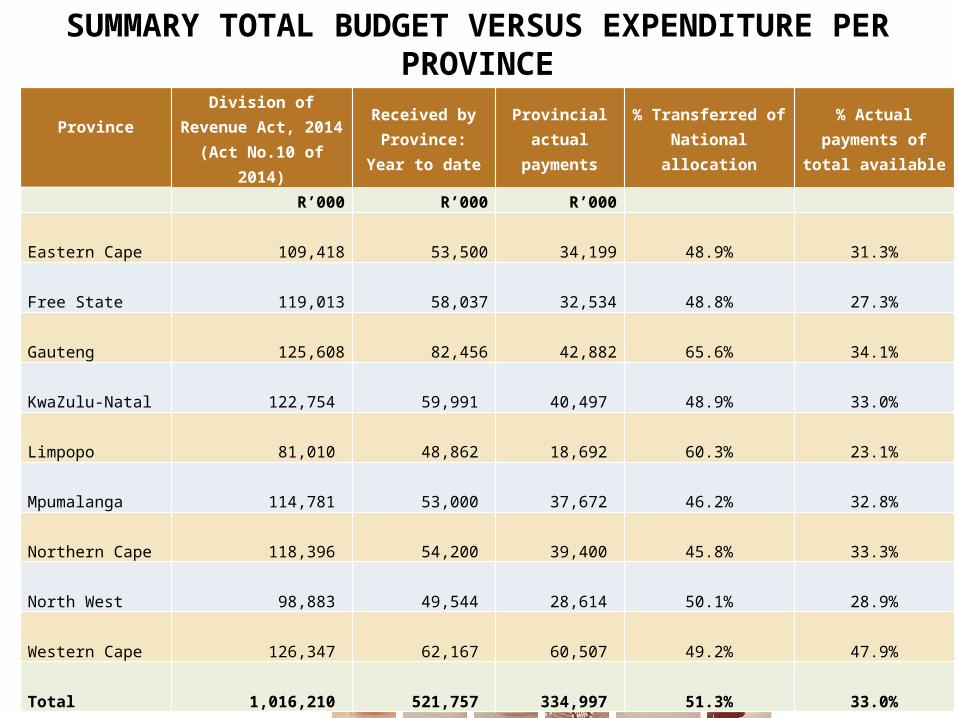
SUMMARY TOTAL BUDGET VERSUS EXPENDITURE PER PROVINCE
Province
Division of Revenue Act, 2014 (Act No.10 of 2014)
Received by Province: Year to
date
Provincial actual payments
% Transferred of National allocation
% Actual payments of total available
R’000 R’000 R’000 Eastern Cape
109,418
53,500
34,199
48.9%
31.3%
Free State
119,013
58,037
32,534
48.8%
27.3%
Gauteng
125,608
82,456
42,882
65.6%
34.1%
KwaZulu-Natal
122,754 59,991
40,497
48.9%
33.0% Limpopo
81,010 48,862
18,692
60.3%
23.1% Mpumalanga
114,781 53,000
37,672
46.2%
32.8% Northern Cape
118,396 54,200
39,400
45.8%
33.3% North West
98,883 49,544
28,614
50.1%
28.9% Western Cape
126,347 62,167
60,507
49.2%
47.9% Total
1,016,210
521,757
334,997
51.3%
33.0%
17
Economic Classification
Description of the line item Reason for variance
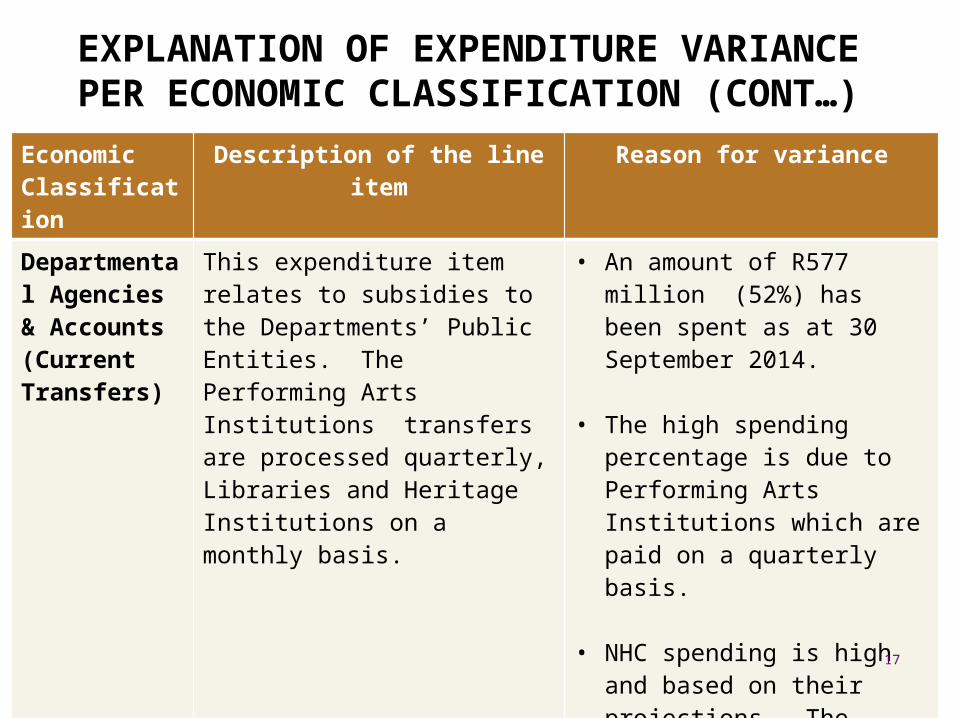
Departmental Agencies & Accounts (Current Transfers)
This expenditure item relates to subsidies to the Departments’ Public Entities. The Performing Arts Institutions transfers are processed quarterly, Libraries and Heritage Institutions on a monthly basis.
• An amount of R577 million (52%) has been spent as at 30 September 2014.
• The high spending percentage is due to Performing Arts Institutions which are paid on a quarterly basis.
• NHC spending is high and based on their projections. The transfer is processed on a monthly basis.
17
EXPLANATION OF EXPENDITURE VARIANCE PER ECONOMIC CLASSIFICATION (CONT…)
18
Economic Classification
Description of the line item Reason for variance
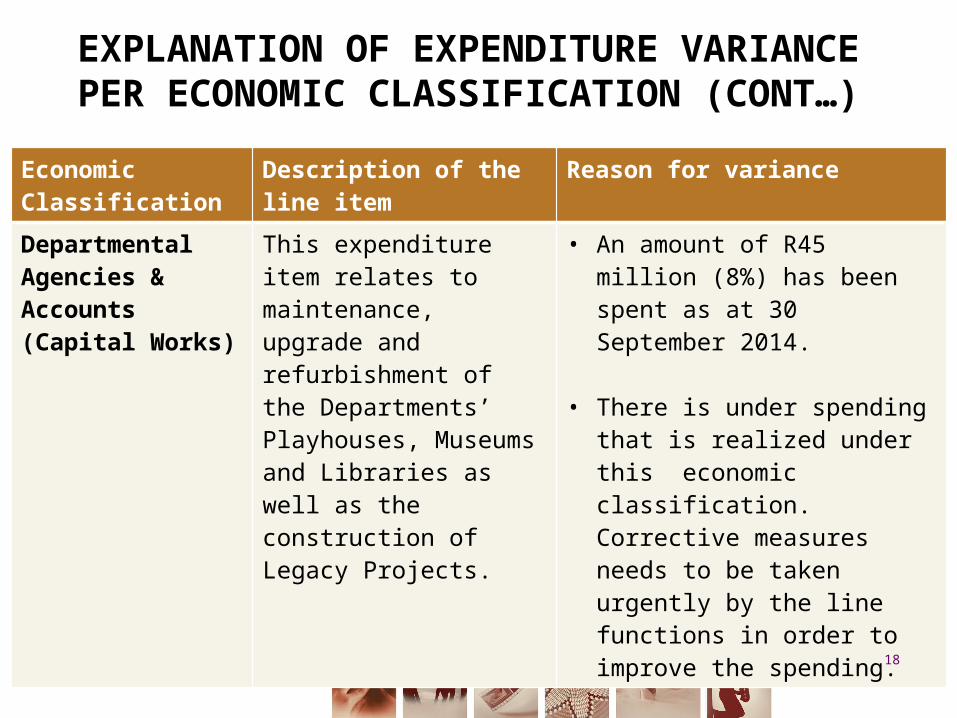
Departmental Agencies & Accounts (Capital Works)
This expenditure item relates to maintenance, upgrade and refurbishment of the Departments’ Playhouses, Museums and Libraries as well as the construction of Legacy Projects.
• An amount of R45 million (8%) has been spent as at 30 September 2014.
• There is under spending that is realized under this economic classification. Corrective measures needs to be taken urgently by the line functions in order to improve the spending.
18
EXPLANATION OF EXPENDITURE VARIANCE PER ECONOMIC CLASSIFICATION (CONT…)
19
Economic Classification
Description of the line item Reason for variance
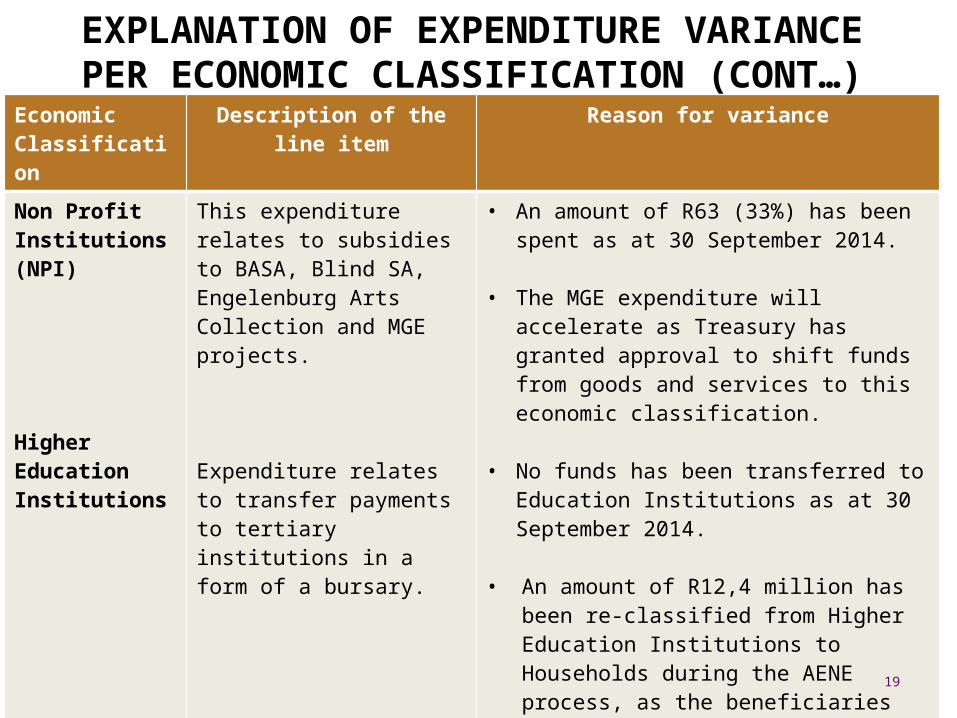
Non Profit Institutions (NPI)
Higher Education Institutions
This expenditure relates to subsidies to BASA, Blind SA, Engelenburg Arts Collection and MGE projects.
Expenditure relates to transfer payments to tertiary institutions in a form of a bursary.
• An amount of R63 (33%) has been spent as at 30 September 2014.
• The MGE expenditure will accelerate as Treasury has granted approval to shift funds from goods and services to this economic classification.
• No funds has been transferred to Education Institutions as at 30 September 2014.
• An amount of R12,4 million has been re-classified from Higher Education Institutions to Households during the AENE process, as the beneficiaries of the bursary scheme for language and heritage sectors are the students.
19
EXPLANATION OF EXPENDITURE VARIANCE PER ECONOMIC CLASSIFICATION (CONT…)
20
Economic Classification
Description of the line item Reason for variance
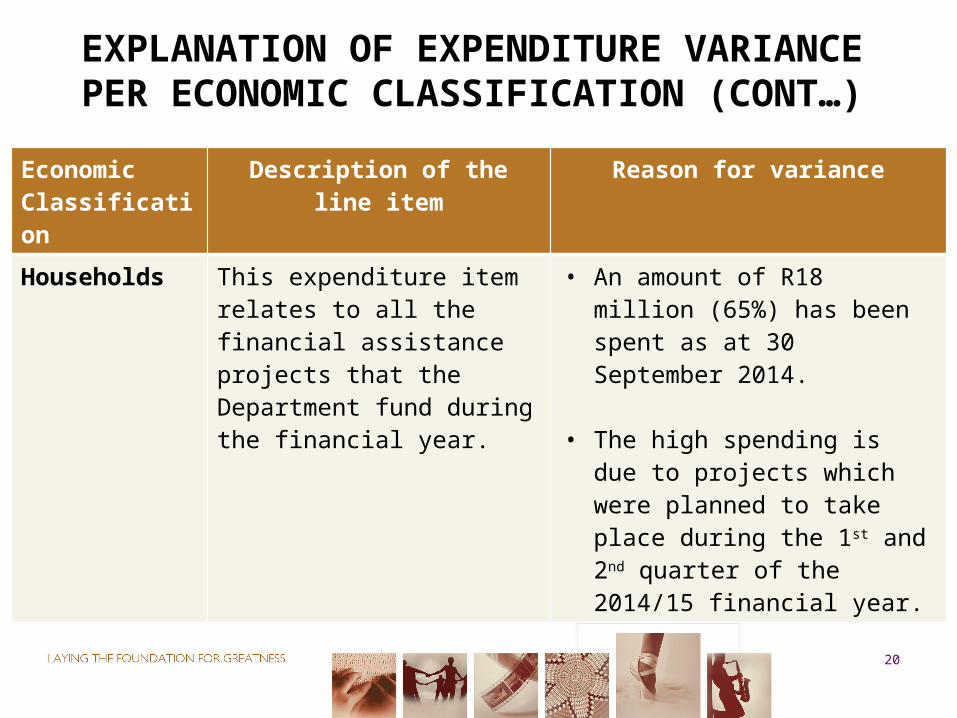
Households This expenditure item relates to all the financial assistance projects that the Department fund during the financial year.
• An amount of R18 million (65%) has been spent as at 30 September 2014.
• The high spending is due to projects which were planned to take place during the 1st and 2nd quarter of the 2014/15 financial year.
20
EXPLANATION OF EXPENDITURE VARIANCE PER ECONOMIC CLASSIFICATION (CONT…)
21
Economic Classification
Description of the line item Reason for variance
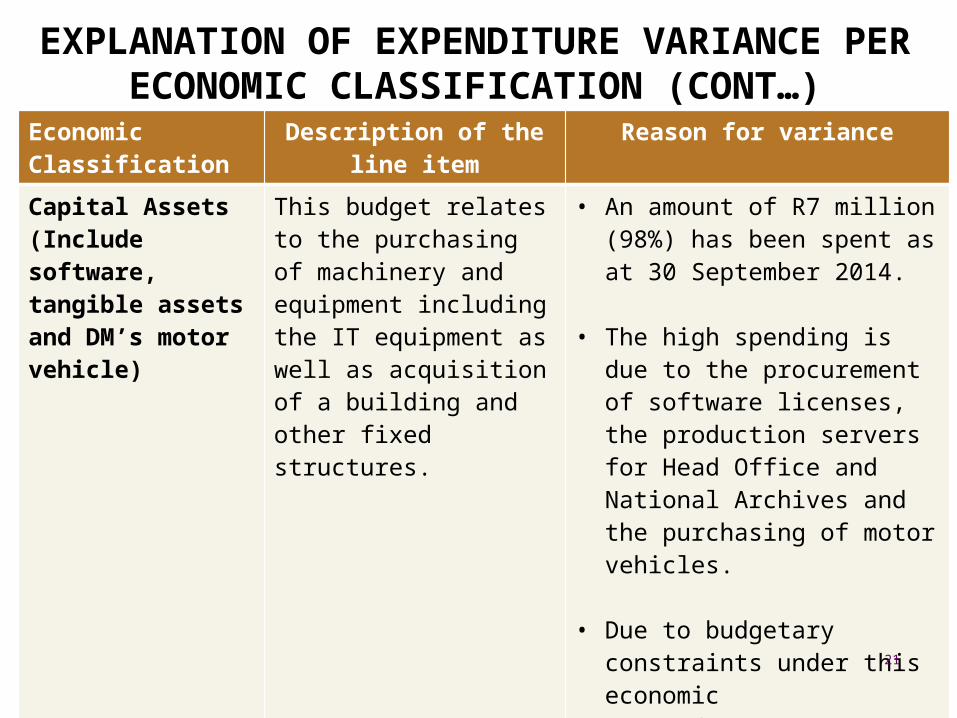
Capital Assets (Include software, tangible assets and DM’s motor vehicle)
This budget relates to the purchasing of machinery and equipment including the IT equipment as well as acquisition of a building and other fixed structures.
• An amount of R7 million (98%) has been spent as at 30 September 2014.
• The high spending is due to the procurement of software licenses, the production servers for Head Office and National Archives and the purchasing of motor vehicles.
• Due to budgetary constraints under this economic classification, new purchasing requests will only be addressed in the 2015/16 financial year.
21
EXPLANATION OF EXPENDITURE VARIANCE PER ECONOMIC CLASSIFICATION (CONT…)
22
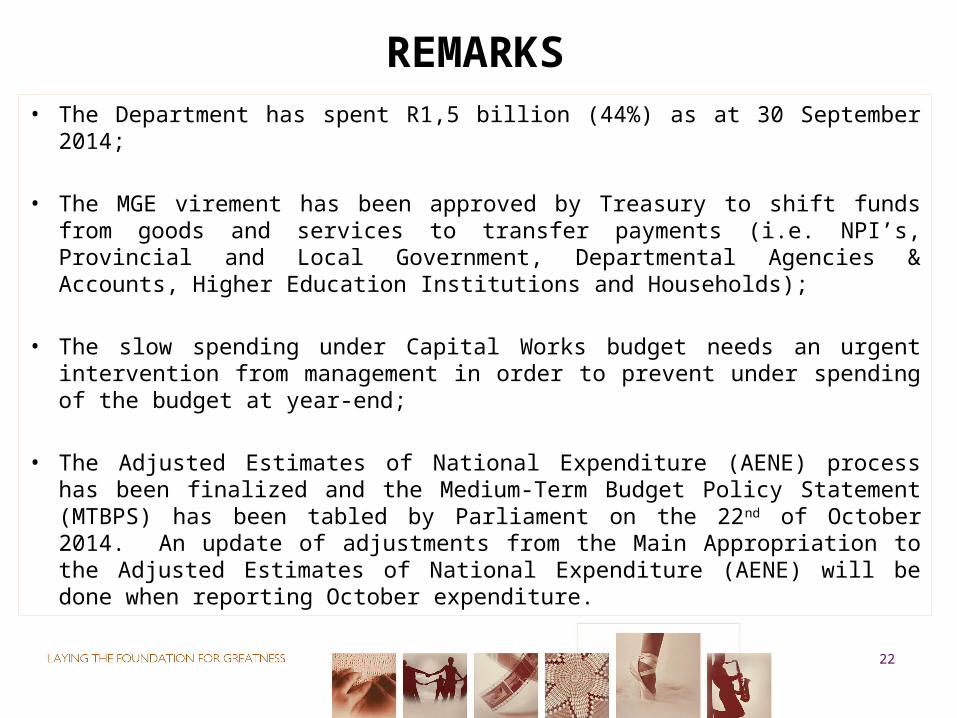
REMARKS• The Department has spent R1,5 billion (44%) as at 30 September 2014;
• The MGE virement has been approved by Treasury to shift funds from goods and services to transfer payments (i.e. NPI’s, Provincial and Local Government, Departmental Agencies & Accounts, Higher Education Institutions and Households);
• The slow spending under Capital Works budget needs an urgent intervention from management in order to prevent under spending of the budget at year-end;
• The Adjusted Estimates of National Expenditure (AENE) process has been finalized and the Medium-Term Budget Policy Statement (MTBPS) has been tabled by Parliament on the 22nd of October 2014. An update of adjustments from the Main Appropriation to the Adjusted Estimates of National Expenditure (AENE) will be done when reporting October expenditure.
22
23
EXPLANATION OF PROGRAMME PERFORMANCE ON KEY INDICATORS
23
24
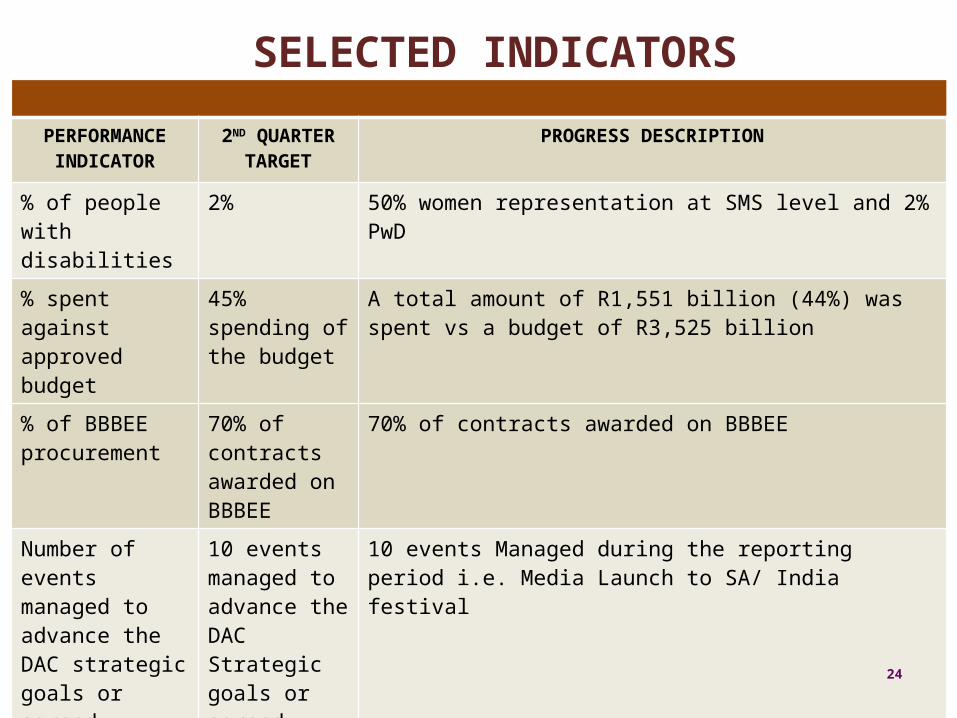
PERFORMANCE INDICATOR
2ND QUARTER TARGET
PROGRESS DESCRIPTION
% of people with disabilities
2% 50% women representation at SMS level and 2% PwD
% spent against approved budget
45% spending of the budget
A total amount of R1,551 billion (44%) was spent vs a budget of R3,525 billion
% of BBBEE procurement
70% of contracts awarded on BBBEE
70% of contracts awarded on BBBEE
Number of events managed to advance the DAC strategic goals or agreed Marketing objectives (30)
10 events managed to advance the DAC Strategic goals or agreed Marketing objectives
10 events Managed during the reporting period i.e. Media Launch to SA/ India festival
24
SELECTED INDICATORS
25
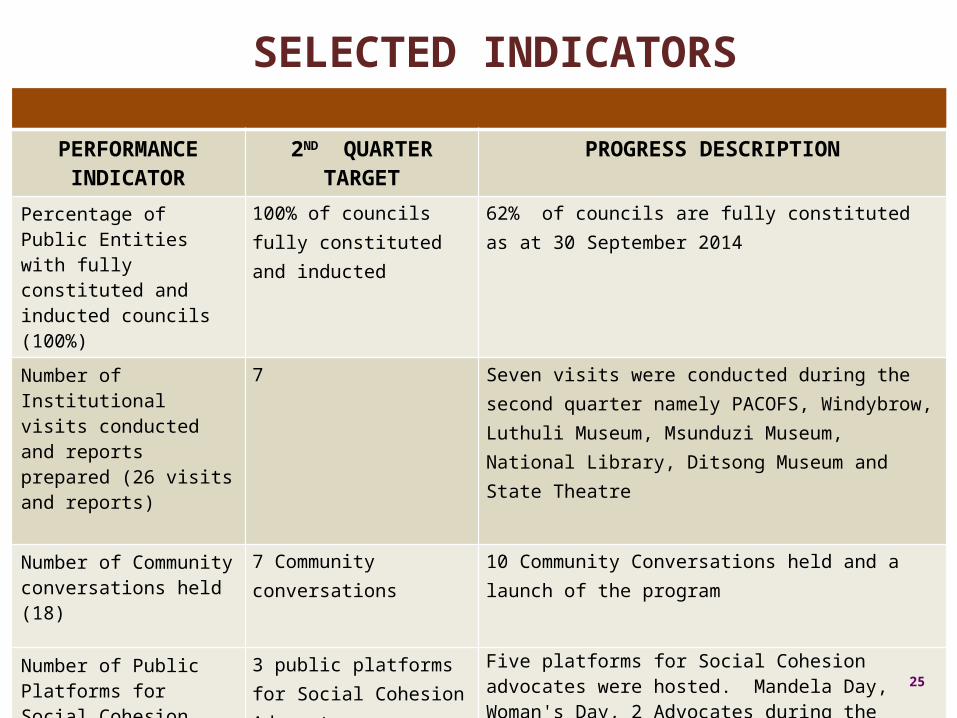
PERFORMANCE INDICATOR
2ND QUARTER TARGET PROGRESS DESCRIPTION
Percentage of Public Entities with fully constituted and inducted councils (100%)
100% of councils fully constituted and inducted
62% of councils are fully constituted as at 30 September 2014
Number of Institutional visits conducted and reports prepared (26 visits and reports)
7 Seven visits were conducted during the second quarter namely PACOFS, Windybrow, Luthuli Museum, Msunduzi Museum, National Library, Ditsong Museum and State Theatre
Number of Community conversations held (18)
7 Community conversations 10 Community Conversations held and a launch of the program
Number of Public Platforms for Social Cohesion Advocates
3 public platforms for Social Cohesion Advocates
Five platforms for Social Cohesion advocates were hosted. Mandela Day, Woman's Day, 2 Advocates during the launch of the Community Conversations, During the Youth Dialogue in September in Mafikeng
25
SELECTED INDICATORS
26
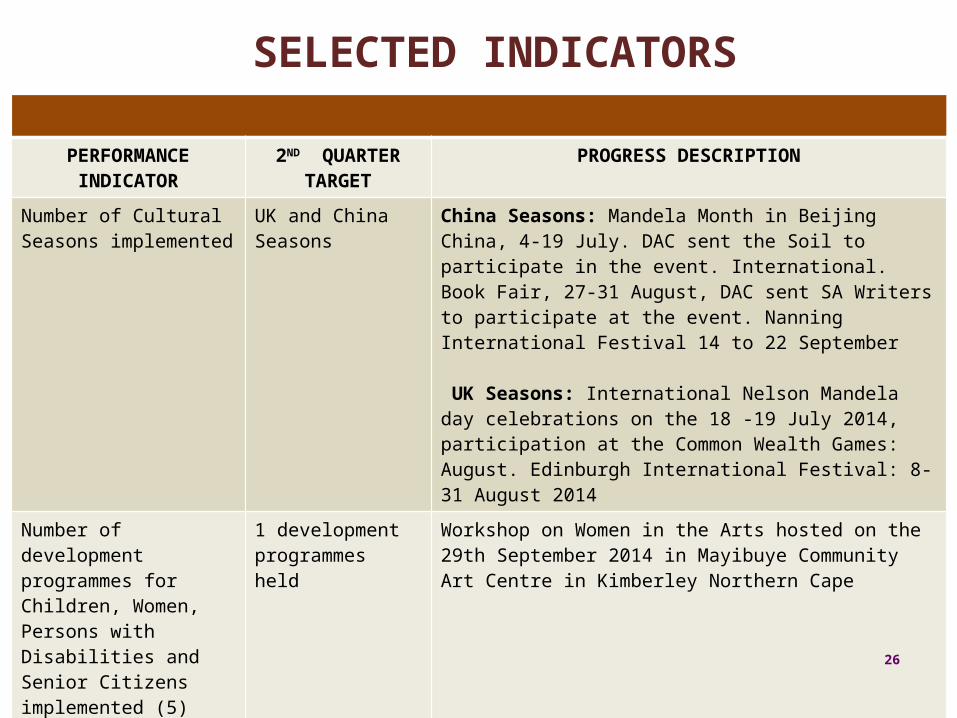
PERFORMANCE INDICATOR 2ND QUARTER TARGET
PROGRESS DESCRIPTION
Number of Cultural Seasons implemented
UK and China Seasons China Seasons: Mandela Month in Beijing China, 4-19 July. DAC sent the Soil to participate in the event. International. Book Fair, 27-31 August, DAC sent SA Writers to participate at the event. Nanning International Festival 14 to 22 September
UK Seasons: International Nelson Mandela day celebrations on the 18 -19 July 2014, participation at the Common Wealth Games: August. Edinburgh International Festival: 8-31 August 2014
Number of development programmes for Children, Women, Persons with Disabilities and Senior Citizens implemented (5)
1 development programmes held
Workshop on Women in the Arts hosted on the 29th September 2014 in Mayibuye Community Art Centre in Kimberley Northern Cape
26
SELECTED INDICATORS
27
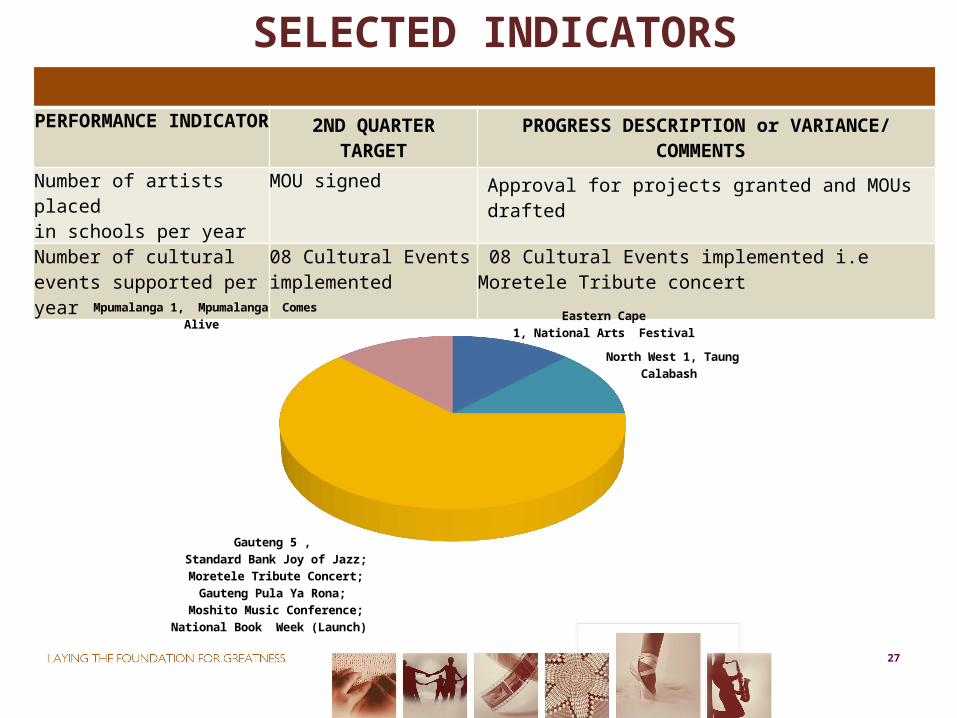
PERFORMANCE INDICATOR 2ND QUARTER TARGET PROGRESS DESCRIPTION or VARIANCE/ COMMENTS
Number of artists placedin schools per year
MOU signed Approval for projects granted and MOUs drafted
Number of cultural events supported per year
08 Cultural Events implemented
08 Cultural Events implemented i.e Moretele Tribute concert
27
SELECTED INDICATORS
Eastern Cape 1, National Arts Festival
North West 1, Taung Calabash
Gauteng 5 , Standard Bank Joy of Jazz;Moretele Tribute Concert;
Gauteng Pula Ya Rona; Moshito Music Conference;
National Book Week (Launch)
Mpumalanga 1, Mpumalanga Comes Alive
28
PERFORMANCE INDICATOR 2ND QUARTER TARGET PROGRESS DESCRIPTION
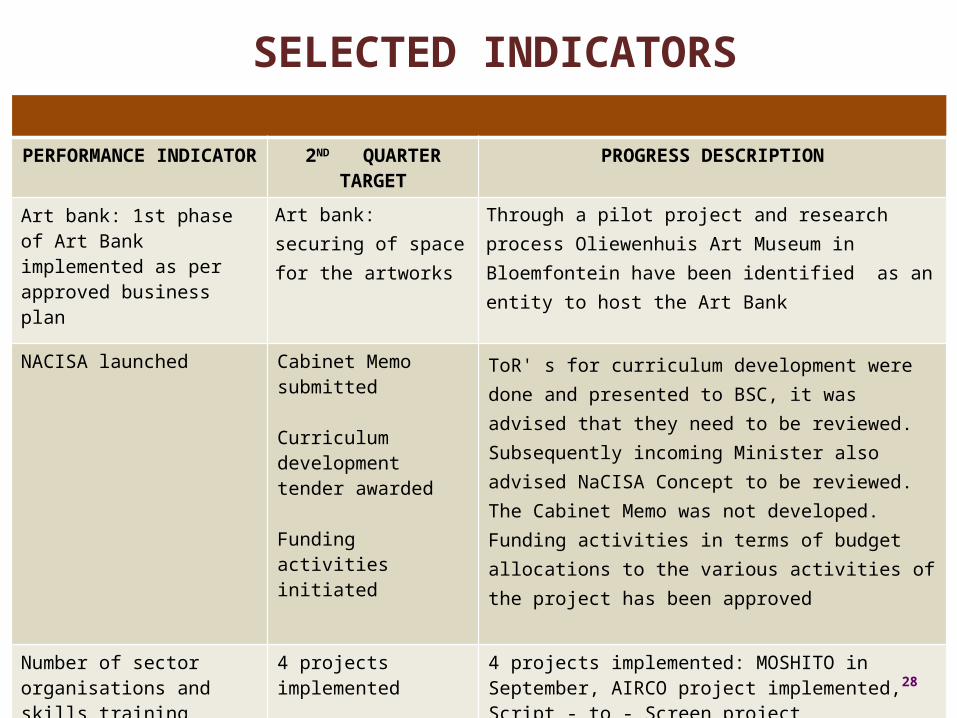
Art bank: 1st phase of Art Bank implemented as per approved business plan
Art bank: securing of space for the artworks
Through a pilot project and research process Oliewenhuis Art Museum in Bloemfontein have been identified as an entity to host the Art Bank
NACISA launched Cabinet Memo submitted
Curriculum development tender awarded
Funding activities initiated
ToR' s for curriculum development were done and presented to BSC, it was advised that they need to be reviewed. Subsequently incoming Minister also advised NaCISA Concept to be reviewed. The Cabinet Memo was not developed. Funding activities in terms of budget allocations to the various activities of the project has been approved
Number of sector organisations and skills training projects supported
4 projects implemented 4 projects implemented: MOSHITO in September, AIRCO project implemented, Script - to - Screen project implemented, establishment of CIFFSA supported
28
SELECTED INDICATORS
29
PERFORMANCE INDICATOR
2ND QUARTER TARGET PROGRESS DESCRIPTION
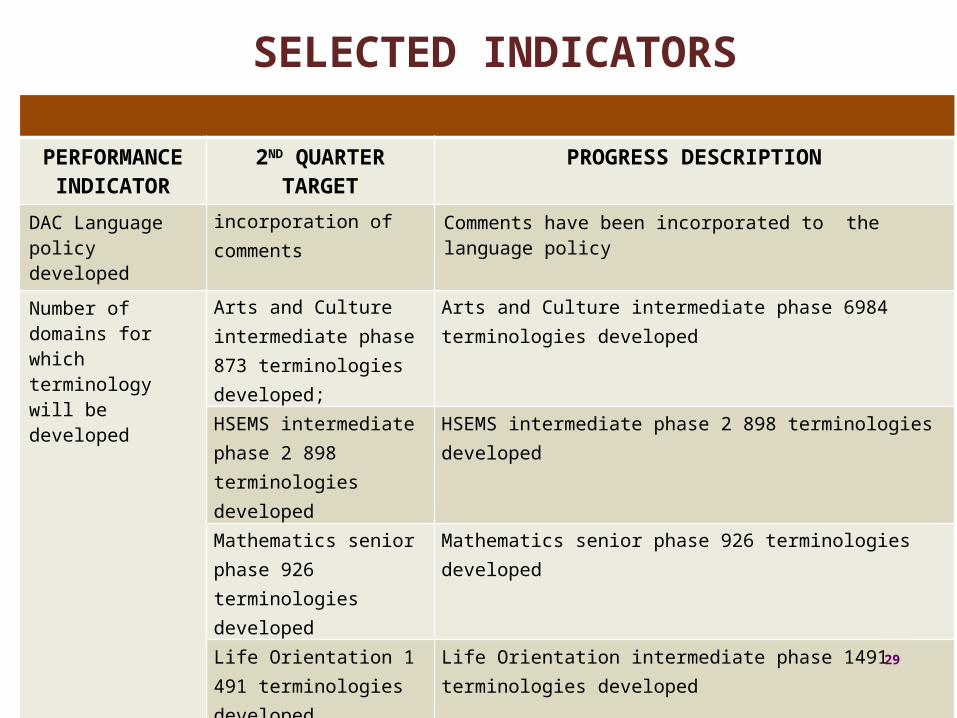
DAC Language policy developed
incorporation of comments Comments have been incorporated to the language policy
Number of domains for which terminology will be developed
Arts and Culture intermediate phase 873 terminologies developed;
Arts and Culture intermediate phase 6984 terminologies developed
HSEMS intermediate phase 2 898 terminologies developed
HSEMS intermediate phase 2 898 terminologies developed
Mathematics senior phase 926 terminologies developed
Mathematics senior phase 926 terminologies developed
Life Orientation 1 491 terminologies developed
Life Orientation intermediate phase 1491 terminologies developed
29
SELECTED INDICATORS
30
PERFORMANCE INDICATOR 2ND QUARTERTARGET
PROGRESS DESCRIPTION
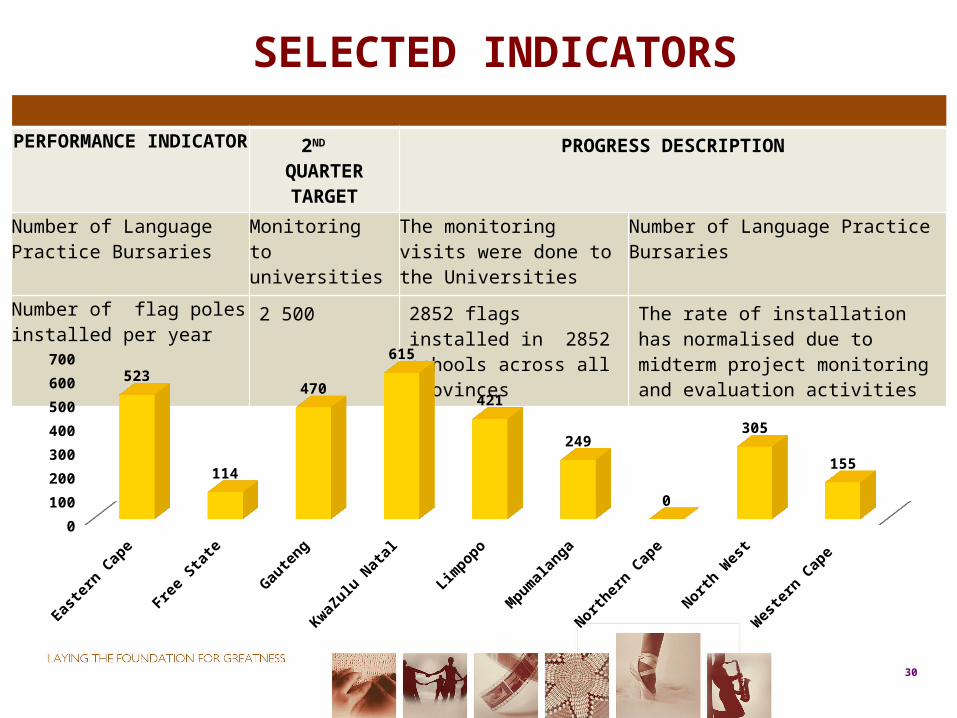
Number of Language Practice Bursaries
Monitoring to universities
The monitoring visits were done to the Universities
Number of Language Practice Bursaries
Number of flag poles installed per year
2 500 2852 flags installed in 2852 schools across all provinces
The rate of installation has normalised due to midterm project monitoring and evaluation activities
30
SELECTED INDICATORS
Eastern Cape Free State Gauteng KwaZulu Natal
Limpopo Mpumalanga Northern Cape
North West Western Cape
0
100
200
300
400
500
600
700
523
114
470
615
421
249
0
305
155
31
PERFORMANCE INDICATOR
2ND QUARTER TARGET PROGRESS DESCRIPTION
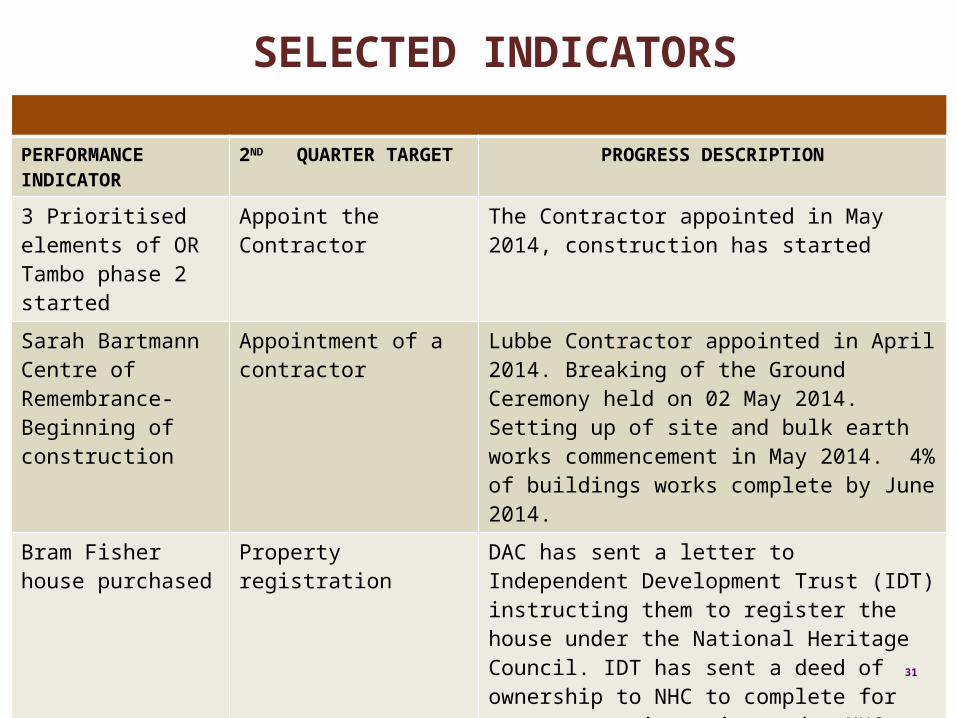
3 Prioritised elements of OR Tambo phase 2 started
Appoint the Contractor The Contractor appointed in May 2014, construction has started
Sarah Bartmann Centre of Remembrance-Beginning of construction
Appointment of a contractor
Lubbe Contractor appointed in April 2014. Breaking of the Ground Ceremony held on 02 May 2014. Setting up of site and bulk earth works commencement in May 2014. 4% of buildings works complete by June 2014.
Bram Fisher house purchased
Property registration DAC has sent a letter to Independent Development Trust (IDT) instructing them to register the house under the National Heritage Council. IDT has sent a deed of ownership to NHC to complete for property registration under NHC.
31
SELECTED INDICATORS
32
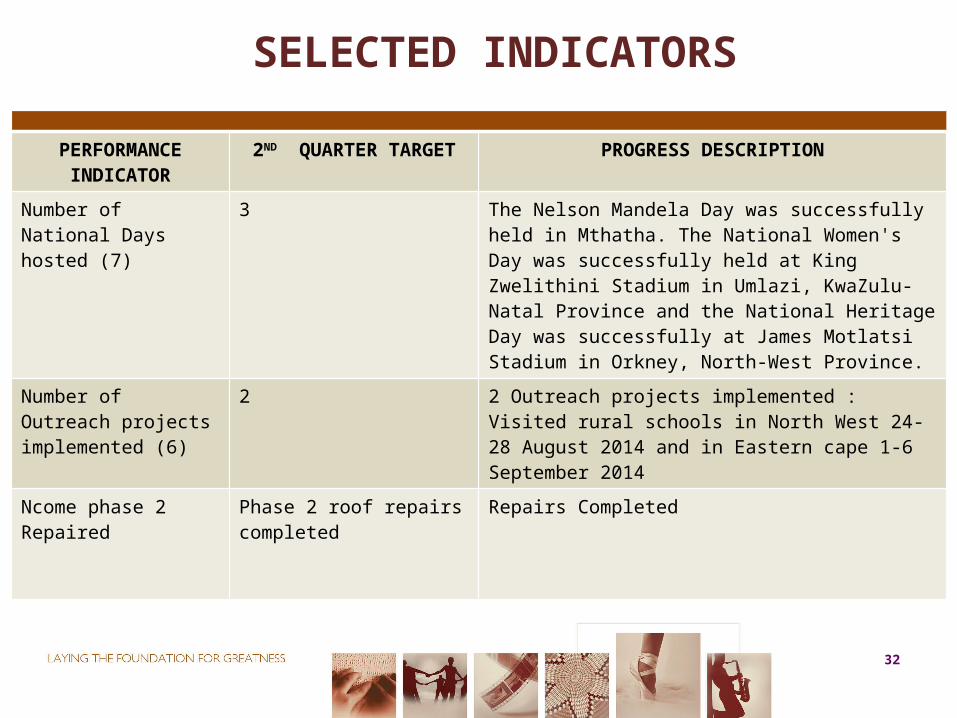
PERFORMANCE INDICATOR
2ND QUARTER TARGET PROGRESS DESCRIPTION
Number of National Days hosted (7)
3 The Nelson Mandela Day was successfully held in Mthatha. The National Women's Day was successfully held at King Zwelithini Stadium in Umlazi, KwaZulu-Natal Province and the National Heritage Day was successfully at James Motlatsi Stadium in Orkney, North-West Province.
Number of Outreach projects implemented (6)
2 2 Outreach projects implemented : Visited rural schools in North West 24-28 August 2014 and in Eastern cape 1-6 September 2014
Ncome phase 2 Repaired Phase 2 roof repairs completed
Repairs Completed
32
SELECTED INDICATORS
33
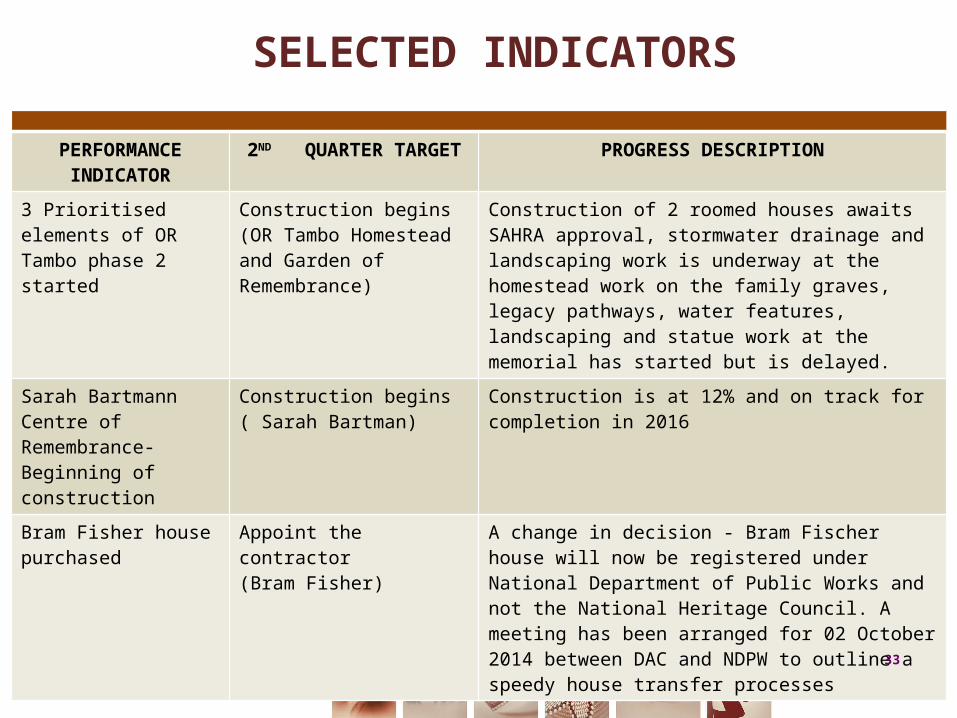
PERFORMANCE INDICATOR
2ND QUARTER TARGET PROGRESS DESCRIPTION
3 Prioritised elements of OR Tambo phase 2 started
Construction begins (OR Tambo Homestead and Garden of Remembrance)
Construction of 2 roomed houses awaits SAHRA approval, stormwater drainage and landscaping work is underway at the homestead work on the family graves, legacy pathways, water features, landscaping and statue work at the memorial has started but is delayed.
Sarah Bartmann Centre of Remembrance-Beginning of construction
Construction begins ( Sarah Bartman)
Construction is at 12% and on track for completion in 2016
Bram Fisher house purchased
Appoint the contractor (Bram Fisher)
A change in decision - Bram Fischer house will now be registered under National Department of Public Works and not the National Heritage Council. A meeting has been arranged for 02 October 2014 between DAC and NDPW to outline a speedy house transfer processes
33
SELECTED INDICATORS
34
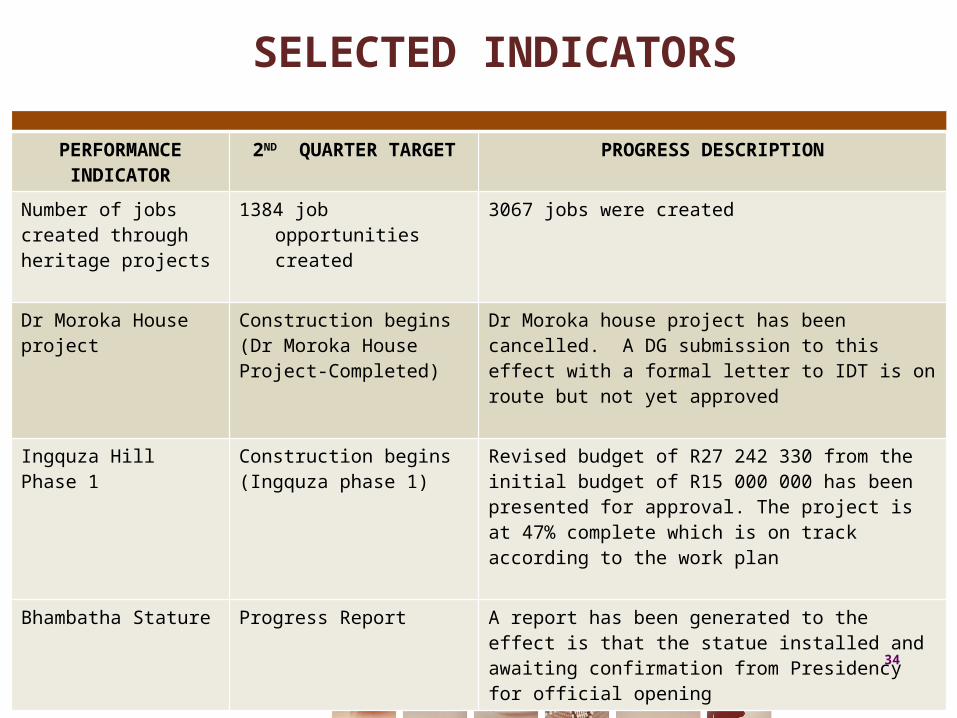
PERFORMANCE INDICATOR
2ND QUARTER TARGET PROGRESS DESCRIPTION
Number of jobs created through heritage projects
1384 job opportunities created
3067 jobs were created
Dr Moroka House project Construction begins (Dr Moroka House Project-Completed)
Dr Moroka house project has been cancelled. A DG submission to this effect with a formal letter to IDT is on route but not yet approved
Ingquza Hill Phase 1 Construction begins (Ingquza phase 1)
Revised budget of R27 242 330 from the initial budget of R15 000 000 has been presented for approval. The project is at 47% complete which is on track according to the work plan
Bhambatha Stature Progress Report A report has been generated to the effect is that the statue installed and awaiting confirmation from Presidency for official opening
34
SELECTED INDICATORS
35
35
THANK YOU