Embed Size (px)
Citation preview

SECOND QUARTER 2016Financial and Operational Review
August 3, 2016
Forward-Looking Statements and Other Matters
This presentation contains forward-looking statements within the meaning of Section 27A of the Securities Act of 1933 and Section 21E of the Securities Exchange Act of 1934. All statements, other than statements of historical fact, including without limitation statements regarding the Company's future performance, business strategy, reserve estimates, asset quality, production guidance, drilling plans, capital plans, cost and expense estimates, asset acquisitions and sales, future financial position, and other plans and objectives for future operations, are forward-looking statements. Words such as "anticipate," "believe," "could," "estimate," "expect," "forecast," "guidance," "intend," “may,” "plan," "project," "seek," “should,” "target," "will," "would," or similar words may be used to identify forward-looking statements; however, the absence of these words does not mean that the statements are not forward-looking. While the Company believes its assumptions concerning future events are reasonable, a number of factors could cause results to differ materially from those projected, including, but not limited to: conditions in the oil and gas industry, including supply/demand levels and the resulting impact on price; changes in expected reserve or production levels; changes in economic conditions in the jurisdictions in which the Company operates, including changes in foreign currency exchange rates, interest rates, inflation rates, and global and domestic market conditions; capital available for exploration and development; risks related to our hedging activities; our level of success in integrating acquisitions; well production timing; drilling and operating risks; availability of materials and labor; difficulty in obtaining necessary approvals and permits; non-performance by third parties of contractual obligations; unforeseen hazards such as weather conditions; political conditions and developments, including political instability, acts of war or terrorism, and the governmental or military response thereto; cyber-attacks; changes in safety, health, environmental, tax and other regulations; other geological, operating and economic considerations; and the risk factors, forward-looking statements and challenges and uncertainties described in the Company’s 2015 Annual Report on Form 10-K,Quarterly Reports on Form 10-Q and other public filings and press releases, available at www.MarathonOil.com. The Company undertakes no obligation to revise or update any forward-looking statements as a result of new information, future events or otherwise.
Cautionary Note to Investors: The U.S. Securities and Exchange Commission (“SEC”) permits oil and gas companies, in their filings with the SEC, to disclose only proved, probable and possible reserves that meet the SEC’s definitions for such terms. Any resource estimates in this presentation, such as 2P Resource or total resource, that are not specifically designated as being estimates of proved, probable or possible reserves, may include other estimated resources that the SEC's guidelines prohibit us from including in filings with the SEC. Investors are urged to closely consider the disclosures in the Company’s periodic filings with the SEC, available at www.MarathonOil.comor on the SEC’s website at www.sec.gov.
Reconciliations of the differences between non-GAAP financial measures used in this presentation and their most directly comparable GAAP financial measures are available at www.MarathonOil.com in the 2Q 2016 Investor Packet.
2

Marathon Oil Playbook
Strengthened balance sheet
Relentless focus on costs
Simplifying and concentrating portfolio
Profitable growth within cash flows
3
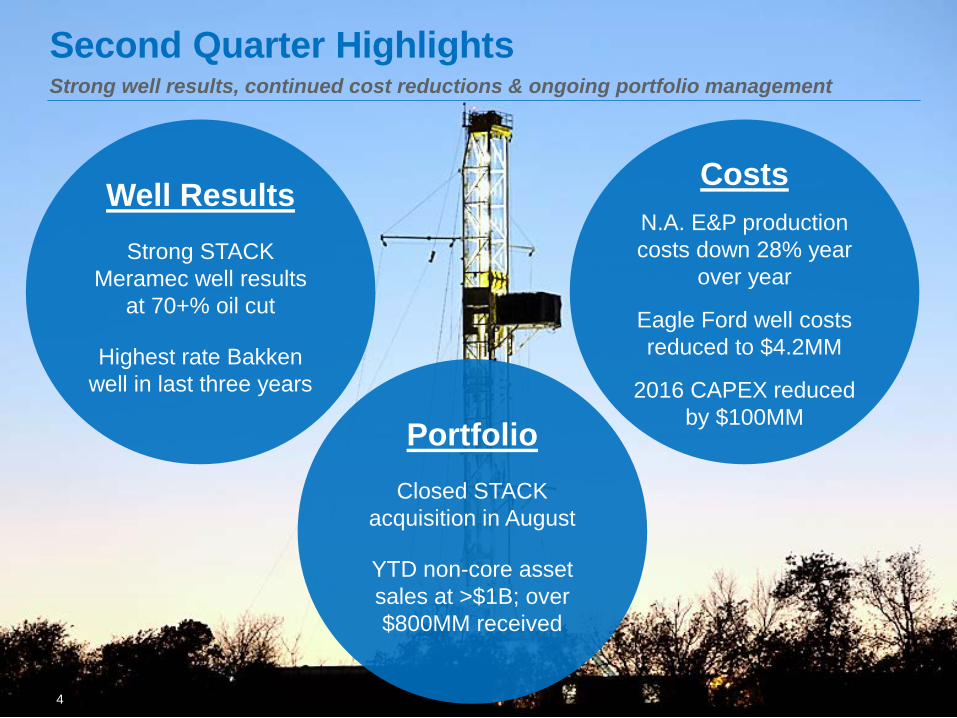
Second Quarter HighlightsStrong well results, continued cost reductions & ongoing portfolio management
Well ResultsStrong STACK
Meramec well results at 70+% oil cut
Highest rate Bakken well in last three years
CostsN.A. E&P production costs down 28% year
over year
Eagle Ford well costs reduced to $4.2MM
2016 CAPEX reduced by $100MMPortfolio
Closed STACK acquisition in August
YTD non-core asset sales at >$1B; over $800MM received
4
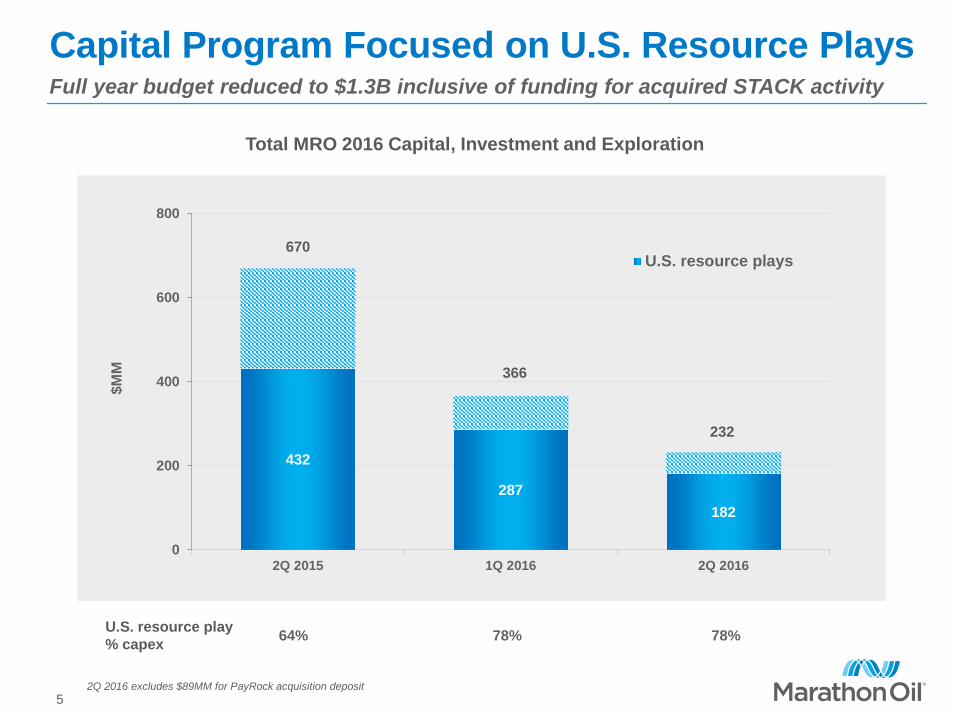
Capital Program Focused on U.S. Resource Plays
432
287 182
0
200
400
600
800
2Q 2015 1Q 2016 2Q 2016
$MM
U.S. resource plays
Full year budget reduced to $1.3B inclusive of funding for acquired STACK activity
U.S. resource play % capex 64% 78% 78%
Total MRO 2016 Capital, Investment and Exploration
2Q 2016 excludes $89MM for PayRock acquisition deposit
670
366
232
5

Divestiture-Adjusted Production Flat Sequentially
220 204 189
131*120* 142*
2549 40
0
100
200
300
400
500
2Q 2015 1Q 2016 2Q 2016 3Q 2016E YE 2016E
MB
OED
/ MSC
OD
U.S. resource plays Remaining E&P OSM Range
Updated full year E&P guidance for divestitures and acquisition
Available for Sale Volumes
*Adjusted for divestitures of 31 MBOED in 2Q15, 15 MBOED in 1Q16 and 13 MBOED in 2Q16Excluding Libya
376* 373* 371*
GuidanceOSM: 45 - 50
E&P: 325 - 345
Updated GuidanceOSM: 40 - 50
E&P: 330 - 345
6

7.19 6.17 6.28
3.97 5.38 4.80
0
2
4
6
8
10
12
14
16
2Q 2015 1Q 2016 2Q 2016
Production Other operating
$ / B
OE
Continued Cost Reductions in N.A. E&PLowering full year production expense guidance $1.00 per BOE
Other operating includes Shipping and Handling, General & Administrative, and Other Operating expenses
179134 129
99
11897
0
50
100
150
200
250
300
2Q 2015 1Q 2016 2Q 2016
Production Other operating
$MM
(18%) reduction
Production & Other Operating Expenses Unit Production & Other Operating Expenses
N.A. E&P production costs per BOE decreased 13% from year-ago quarterFY Guidance for production expense only
N.A. E&P production costs decreased 28% from year-ago quarter
7.00
6.00FY Guidance
7
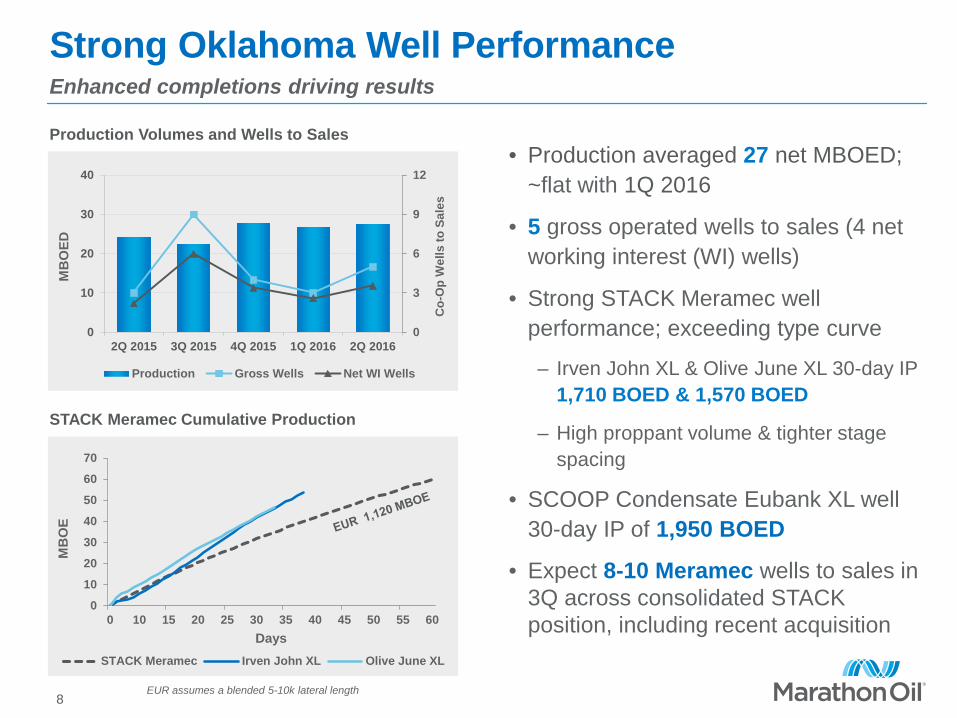
Strong Oklahoma Well PerformanceEnhanced completions driving results
• Production averaged 27 net MBOED; ~flat with 1Q 2016
• 5 gross operated wells to sales (4 net working interest (WI) wells)
• Strong STACK Meramec well performance; exceeding type curve
– Irven John XL & Olive June XL 30-day IP 1,710 BOED & 1,570 BOED
– High proppant volume & tighter stage spacing
• SCOOP Condensate Eubank XL well 30-day IP of 1,950 BOED
• Expect 8-10 Meramec wells to sales in 3Q across consolidated STACK position, including recent acquisition
0
3
6
9
12
0
10
20
30
40
2Q 2015 3Q 2015 4Q 2015 1Q 2016 2Q 2016
Co-
Op
Wel
ls to
Sal
es
Production Gross Wells Net WI Wells
MB
OED
Production Volumes and Wells to Sales
MB
OE
0
10
20
30
40
50
60
70
0 10 15 20 25 30 35 40 45 50 55 60Days
STACK Meramec Irven John XL Olive June XL
STACK Meramec Cumulative Production
EUR assumes a blended 5-10k lateral length8
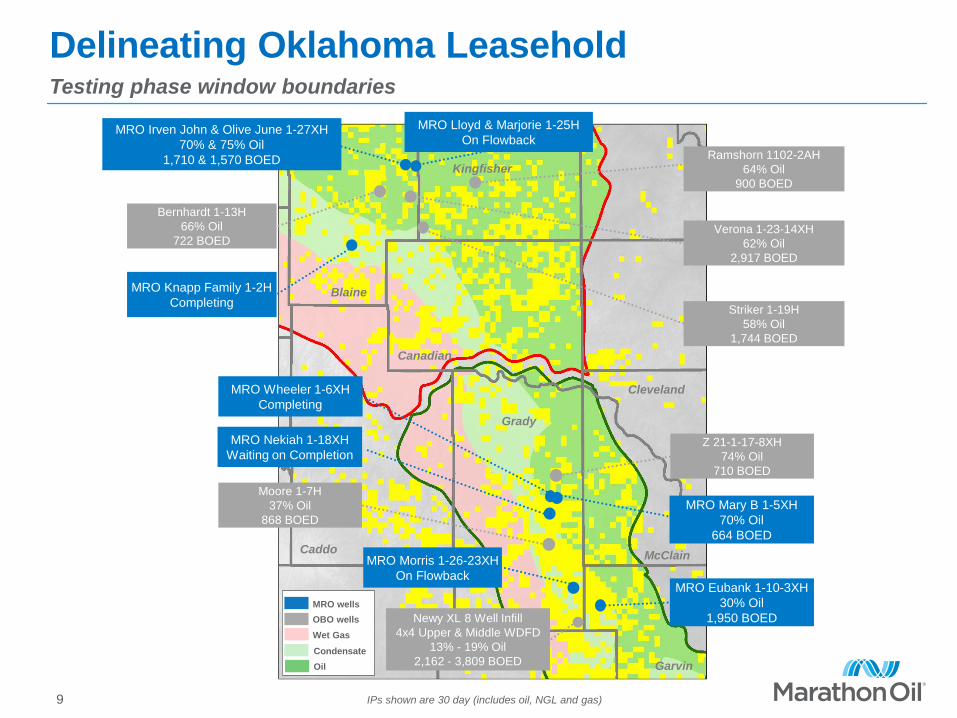
Delineating Oklahoma LeaseholdTesting phase window boundaries
IPs shown are 30 day (includes oil, NGL and gas)
Grady
Caddo
Wet GasCondensateOil
MRO Irven John & Olive June 1-27XH70% & 75% Oil
1,710 & 1,570 BOED
MRO Knapp Family 1-2HCompleting
Verona 1-23-14XH62% Oil
2,917 BOED
Ramshorn 1102-2AH64% Oil
900 BOED
Bernhardt 1-13H66% Oil
722 BOED
MRO Lloyd & Marjorie 1-25HOn Flowback
MRO Wheeler 1-6XHCompleting
MRO Nekiah 1-18XHWaiting on Completion
Z 21-1-17-8XH74% Oil
710 BOED
Newy XL 8 Well Infill4x4 Upper & Middle WDFD
13% - 19% Oil 2,162 - 3,809 BOED
Moore 1-7H37% Oil
868 BOEDMRO Mary B 1-5XH
70% Oil664 BOED
MRO Morris 1-26-23XHOn Flowback
Cleveland
Canadian
Blaine
Kingfisher
Striker 1-19H58% Oil
1,744 BOED
MRO Eubank 1-10-3XH30% Oil
1,950 BOED
Garvin
McClain
MRO wellsOBO wells
9
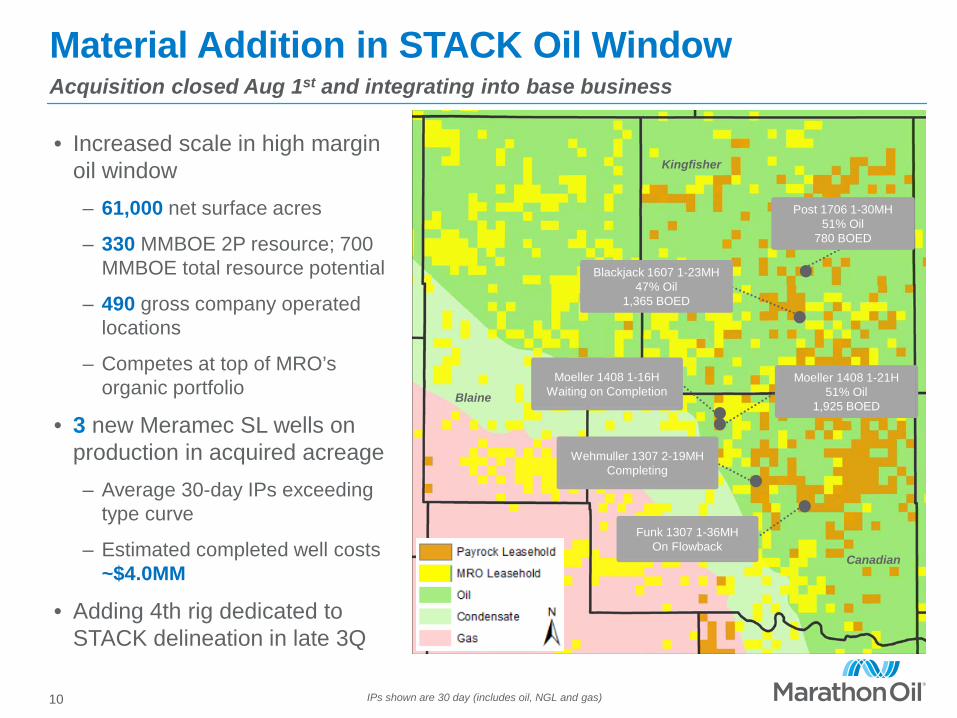
Material Addition in STACK Oil WindowAcquisition closed Aug 1st and integrating into base business
Post 1706 1-30MH51% Oil
780 BOED
Blackjack 1607 1-23MH47% Oil
1,365 BOED
Moeller 1408 1-21H51% Oil
1,925 BOED
Moeller 1408 1-16HWaiting on Completion
Funk 1307 1-36MHOn Flowback
Wehmuller 1307 2-19MHCompleting
Canadian
Blaine
Kingfisher
IPs shown are 30 day (includes oil, NGL and gas)
• Increased scale in high margin oil window– 61,000 net surface acres
– 330 MMBOE 2P resource; 700 MMBOE total resource potential
– 490 gross company operated locations
– Competes at top of MRO’s organic portfolio
• 3 new Meramec SL wells on production in acquired acreage– Average 30-day IPs exceeding
type curve
– Estimated completed well costs ~$4.0MM
• Adding 4th rig dedicated to STACK delineation in late 3Q
10

Eagle Ford Driving Down CostsCapturing efficiencies and adjusting development plan at lower activity
Production Volumes and Wells to Sales
Drilling Performance
• Production averaged 109 net MBOED; down 9% from 1Q 2016– Gross operated wells to sales down 40%
sequentially
– Reduced contribution from 2015 high-density pads drilled at tighter well spacing
• Development plan continues to evolve:– Austin Chalk well spacing widened to 80
acres; replaced with staggered UEF
– 200’ stage spacing and tighter in high GOR oil window progressing; testing concept in condensate
– Delineated 31,000 net acres in Upper Eagle Ford (UEF)
• $4.2MM completed well costs; down ~30% year over year
• Production expense per boe reduction of >10% year over year
MB
OED
0
30
60
90
120
0
40
80
120
160
2Q 2015 3Q 2015 4Q 2015 1Q 2016 2Q 2016
Co-
Op
Wel
ls to
Sal
es
Production Gross Wells Net WI Wells
75
100
125
150
175
0
10
20
30
40
2Q 2015 3Q 2015 4Q 2015 1Q 2016 2Q 2016
Dril
ling
Cos
t Per
Foo
t ($)
Wel
ls p
er R
ig Y
ear
Wells Per Rig Year Cost per Foot
11
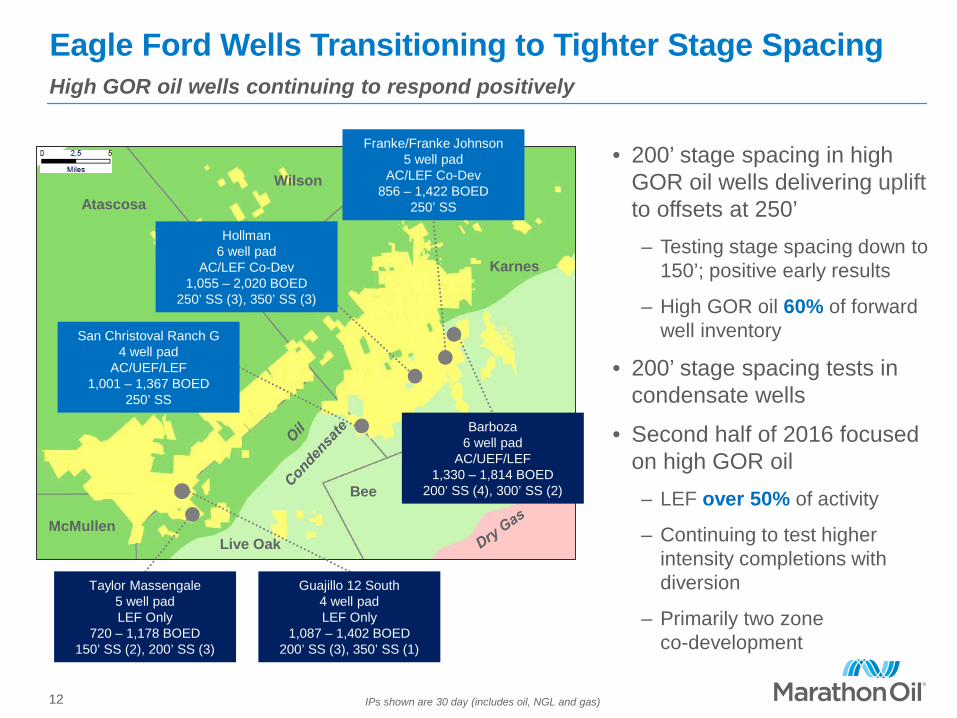
Eagle Ford Wells Transitioning to Tighter Stage SpacingHigh GOR oil wells continuing to respond positively
Live Oak
Bee
Karnes
Atascosa
Franke/Franke Johnson5 well pad
AC/LEF Co-Dev856 – 1,422 BOED
250’ SS
Taylor Massengale5 well padLEF Only
720 – 1,178 BOED150’ SS (2), 200’ SS (3)
San Christoval Ranch G4 well pad
AC/UEF/LEF1,001 – 1,367 BOED
250’ SS
Hollman6 well pad
AC/LEF Co-Dev1,055 – 2,020 BOED
250’ SS (3), 350’ SS (3)
Guajillo 12 South4 well padLEF Only
1,087 – 1,402 BOED200’ SS (3), 350’ SS (1)
McMullen
Wilson
IPs shown are 30 day (includes oil, NGL and gas)
• 200’ stage spacing in high GOR oil wells delivering upliftto offsets at 250’– Testing stage spacing down to
150’; positive early results
– High GOR oil 60% of forward well inventory
• 200’ stage spacing tests in condensate wells
• Second half of 2016 focused on high GOR oil – LEF over 50% of activity
– Continuing to test higher intensity completions with diversion
– Primarily two zone co-development
Barboza6 well pad
AC/UEF/LEF1,330 – 1,814 BOED
200’ SS (4), 300’ SS (2)
12

Bakken Moderating Decline Despite Limited ActivityStrong reliability, continuing to reduce costs and selective completion tests
• Production averaged 53 net MBOED; down 7% from 1Q 2016
• 4 gross operated wells to sales
• Combined 30-day IPs from 4 Clarks Creek wells total >10,000 BOED
‒ Highest rate well in Williston basin in the past three years with a 30-day IP of 2,840 BOED
‒ Higher intensity completions with 12 to 18MM lbs proppant per well
• CWC costs at $6.0MM with higher intensity frac design
• Production expense per boe reduction of ~25% year over year
MB
OED
Production Volumes and Wells to Sales
0
10
20
30
40
0
20
40
60
80
2Q 2015 3Q 2015 4Q 2015 1Q 2016 2Q 2016
Co-
Op
Wel
ls to
Sal
es
Production Gross Wells Net WI Wells
2013-2016 Well Performance
Clar
ks C
reek
Juan
ita
Char
mai
ne
1,500
1,800
2,100
2,400
2,700
3,000
30-d
ay IP
(BO
ED) Top 15 of +6,000 wells
MB = Middle Bakken, TF = Three Forks13
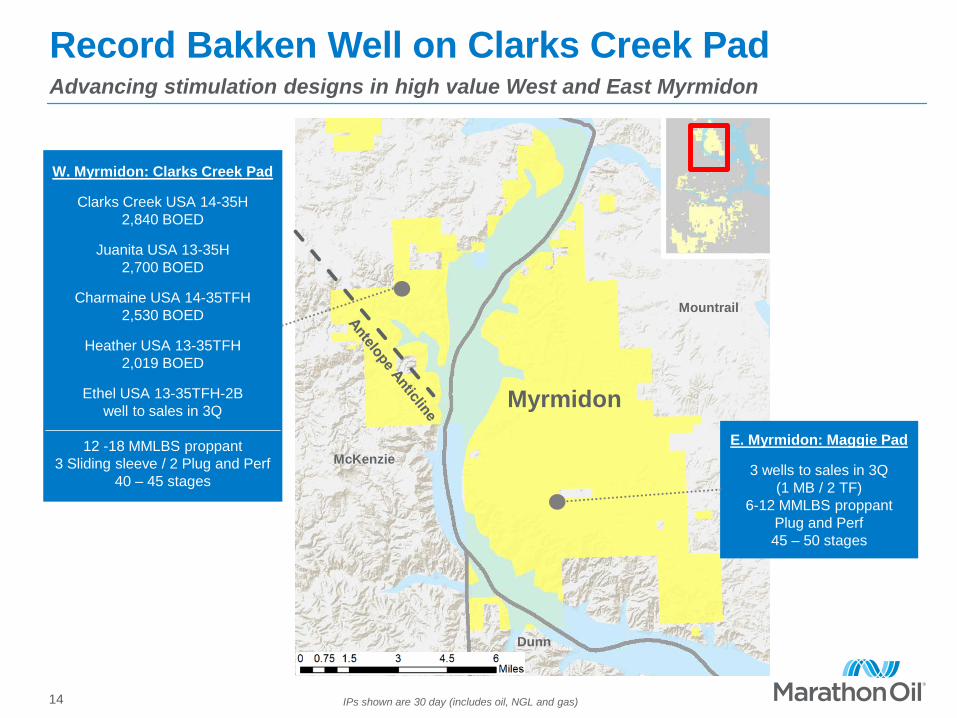
Myrmidon
Record Bakken Well on Clarks Creek PadAdvancing stimulation designs in high value West and East Myrmidon
E. Myrmidon: Maggie Pad
3 wells to sales in 3Q(1 MB / 2 TF)
6-12 MMLBS proppantPlug and Perf45 – 50 stages
IPs shown are 30 day (includes oil, NGL and gas)
W. Myrmidon: Clarks Creek Pad
Clarks Creek USA 14-35H2,840 BOED
Juanita USA 13-35H2,700 BOED
Charmaine USA 14-35TFH2,530 BOED
Heather USA 13-35TFH2,019 BOED
Ethel USA 13-35TFH-2B well to sales in 3Q
12 -18 MMLBS proppant3 Sliding sleeve / 2 Plug and Perf
40 – 45 stagesMcKenzie
Mountrail
Dunn
14
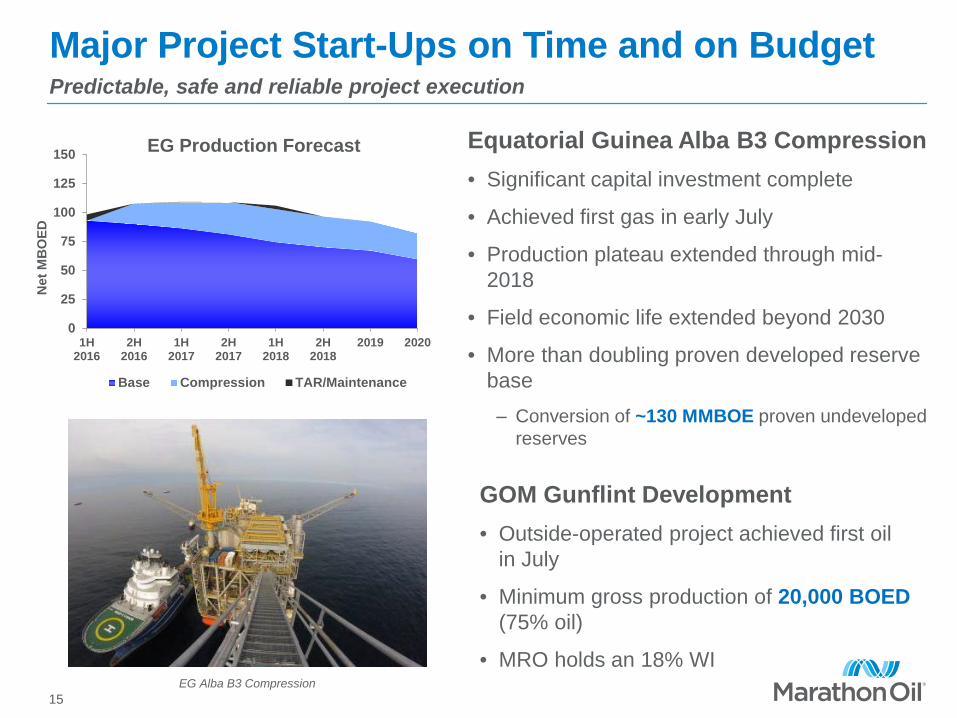
Major Project Start-Ups on Time and on BudgetPredictable, safe and reliable project execution
Equatorial Guinea Alba B3 Compression• Significant capital investment complete
• Achieved first gas in early July
• Production plateau extended through mid-2018
• Field economic life extended beyond 2030
• More than doubling proven developed reserve base‒ Conversion of ~130 MMBOE proven undeveloped
reserves
GOM Gunflint Development• Outside-operated project achieved first oil
in July
• Minimum gross production of 20,000 BOED (75% oil)
• MRO holds an 18% WI
0
25
50
75
100
125
150
1H2016
2H2016
1H2017
2H2017
1H2018
2H2018
2019 2020
Net
MB
OED
EG Production Forecast
Base Compression TAR/Maintenance
EG Alba B3 Compression15

OSM Continues Strong Operating PerformanceDelivers within guidance despite wildfire impacts
29
5949
0
10
20
30
40
50
60
70
2Q 2015 1Q 2016 2Q 2016
MSC
OD
OSM Synthetic Crude Oil Sales Volumes
Synthetic Crude Oil AvgRealizations($/BBL)
$52.46 $26.41 $40.88
OPEX per synthetic barrel ($/BBL)
$78.24 $28.80 $39.02
OPEX per synthetic barrel is before royalties
Includes blendstocks
• Production averaged 40 net MSCOD; down 18% from 1Q 2016
– 4,000 bbld impact from temporary suspension of mine operations during wildfire response efforts
• Mines & Upgrader performing well post TAR
– Record mine production in June
• Strong JV alignment on base business optimization / cash generation
• 2Q OPEX driven by TAR, wildfire suspension impacts and FX rates
16

Key Takeaways
FY 2016 N.A. E&P production expense guidance$1.00
Cost Reduction
28% 2Q N.A. E&P production costs from year-ago quarter
Operations
2Q 2016 Total Company Production
384 MBOEDin line with guidance
2,840 BOED30-day IP rate
Strong STACK Meramec 30-day IPs
1,570 - 1,710BOED (>70% oil)
Highest Rate Bakken Well in 3 years
Capital Discipline
Balance Sheet Strength Provides Flexibility
$5.9B 2Q liquidity, including $2.6B cash
Ongoing Portfolio Management
2016 Capital Program
Achieved asset sales
$100MM to $1.3B Budget
>$1.0B $888MMSTACK acquisition
17

APPENDIX

Volumes, Exploration Expenses & Effective Tax Rate2016 (excluding Libya)
1Q 2Q 3Q 4Q YearNorth America E&P Net Sales Volumes:
- Liquid Hydrocarbons (MBD) 186 173
- Natural Gas (MMCFD) 315 310
- North America E&P Total (MBOED) 239 224
International E&P Net Sales Volumes:
- Liquid Hydrocarbons (MBD) 32 44
- Natural Gas (MMCFD) 382 457
- International E&P Total (MBOED) 96 120
E&P Segments Combined Sales Volumes:
- Total Net Sales (MBOED) 335 344
- Total Available for Sale (MBOED) 339 344
Oil Sands Mining Net Sales Volumes (MBD)* 59 49
- Synthetic Crude Oil Production (MBD)** 49 40
Total Company Available for Sale (MBOED) 388 384
Equity Method Investment Net Sales Volumes:
- LNG (metric tonnes/day) 4,322 5,797
- Methanol (metric tonnes/day) 1,280 1,303
- Condensate and LPG (BOED) 10,208 11,306
Exploration Expenses (Pre-tax)***:
- North America E&P ($ millions) 18 37
- International E&P ($ millions) 6 4
Consolidated Effective Tax Rate (excl. Libya) 39% 26%
*Includes blendstocks**Upgraded bitumen excluding blendstocks***Excludes N.A. E&P impairments of $141MM reported as special items and OSM $7MM exploration expense in 2Q19

2016 EstimatesVolumes
Available for Sale 3QE
Available for Sale Year Estimate
Comments
North America E&P Total (MBOED) 200 – 210
- Liquid Hydrocarbons (MBD) 152 – 160
- Natural Gas (MMCFD) 285 – 300
International E&P Total (MBOED)* 125 – 135
- Liquid Hydrocarbons (MBD)* 44 – 52
- Natural Gas (MMCFD)* 485 – 495
Total both E&P Segments (MBOED)* 325 – 345 330 – 345 FY Guidance Updated**
Synthetic Crude Oil Production (MBD) (excludes royalty)*** 45 – 50 40 – 50 FY Guidance Unchanged
Equity Method Investment LNG (metric tonnes/day) 5,900 – 6,300 5,500 – 5,900
* Excluding Libya. ** Updated full year E&P guidance for divestitures and acquisitions closed to date*** Upgraded bitumen excluding blendstocks
20

2016 EstimatesExploration expenses & annual production operating costs per BOE
3QE Year Estimate Comments
Exploration Expenses (Pre-tax):
North America E&P ($ millions) 10 – 20
International E&P ($ millions) 5 – 10
Effective Consolidated Tax Rate (excluding Libya) 36 – 40%
North America E&P Cost Data
Production Operating $6.00 – 7.00 FY Guidance lowered $1.00
DD&A $20.75 – 23.25
Other* $4.50 – 5.00
International E&P Cost Data**
Production Operating $4.50 – 5.50 FY Guidance lowered $0.50
DD&A $6.00 – 7.50
Other* $1.75 – 2.25
* Other includes shipping and handling, general and administrative, and other operating expenses ** Excludes Libya
21

E&P Production Performance
N.A. E&P Sales Volumes
MB
OED
MB
OED
Intl E&P Production & Sales Volumes
108 108 100 96120 120
0
25
50
75
100
125
150
2Q 2015 1Q 2016 2Q 2016
Avg C&C Realizations($/BBL)
$56.70 $30.95 $42.21
Equity Earnings $26MM $14MM $37MM
EquityEBITDA $54MM $38MM $67MM
Combined total 2Q volumes increased sequentially
Equity earnings and EBITDA include pro rata share of LNG, Methanol and LPG onshore plants in Equatorial GuineaSee the 2Q 2016 Investor Packet at www.Marathonoil.com for non-GAAP reconciliations
Cumulative underlift of (2,465) MBOE in Libya, (381) MBOE in EG, (241) MBOE in UK and (1) MBOE in Kurdistan
SalesAvailable for Sale
274239 224
0
100
200
300
400
2Q 2015 1Q 2016 2Q 2016
Avg C&C Realizations ($/BBL)
Excluding Derivatives
$52.63 $28.21 $40.77
Including Derivatives
$52.69 $29.85 $40.89
Inclusive of divestitures of 31 MBOED in 2Q15, 15 MBOED in 1Q16 and 13 MBOED in 2Q16
22

2016 2Q Production MixU.S. resource plays ~60% oil and ~80% liquids
Bakken
56%
21%
23%
Eagle Ford
20%
30%
50%
83%
10%7%
Oklahoma Resource Basins
Crude Oil/Condensate NGLs Natural Gas
59%
19%
22%
Total U.S. Resource Plays
23
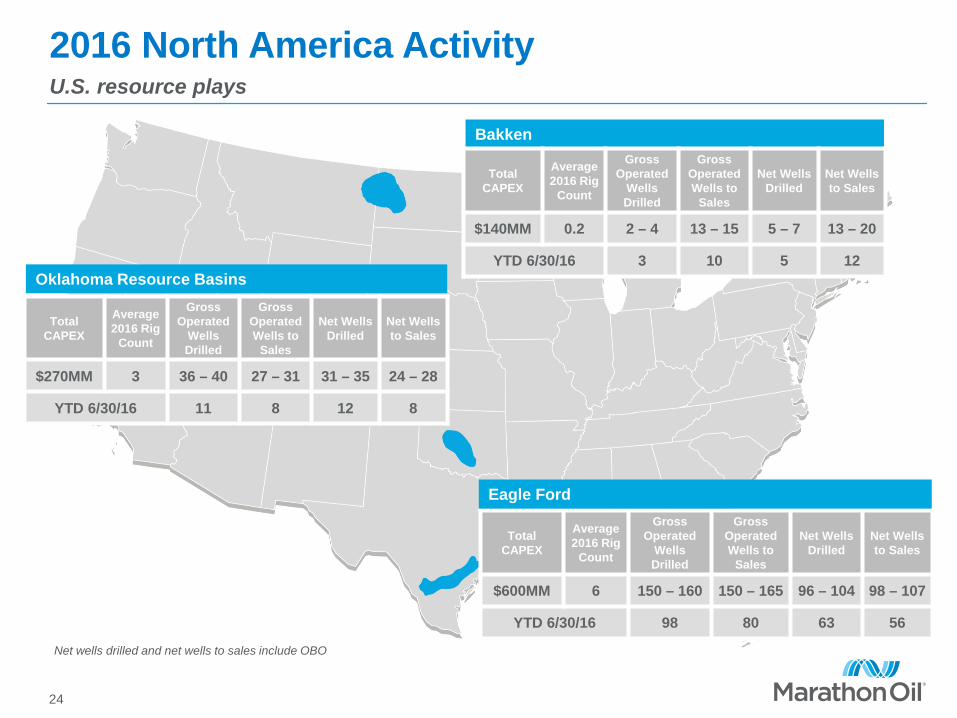
2016 North America Activity
Total CAPEX
Average 2016 Rig
Count
GrossOperated
Wells Drilled
GrossOperated Wells to
Sales
Net Wells Drilled
Net Wells to Sales
$600MM 6 150 – 160 150 – 165 96 – 104 98 – 107
YTD 6/30/16 98 80 63 56
Oklahoma Resource Basins
Bakken
Eagle Ford
U.S. resource plays
Net wells drilled and net wells to sales include OBO
Total CAPEX
Average 2016 Rig
Count
GrossOperated
Wells Drilled
GrossOperated Wells to
Sales
Net Wells Drilled
Net Wells to Sales
$140MM 0.2 2 – 4 13 – 15 5 – 7 13 – 20
YTD 6/30/16 3 10 5 12
Total CAPEX
Average 2016 Rig
Count
GrossOperated
Wells Drilled
GrossOperated Wells to
Sales
Net Wells Drilled
Net Wells to Sales
$270MM 3 36 – 40 27 – 31 31 – 35 24 – 28
YTD 6/30/16 11 8 12 8
24

North America E&P Crude Oil Derivatives
Crude Oil (Benchmark to WTI)
3Q 2016 4Q 2016 YE 2017
Three-Way Collars
Volume (Bbls/day) 47,000 47,000 -
Price per Bbl:
Ceiling $55.37 $55.37 -
Floor $50.23 $50.23 -
Sold put $40.96 $40.96 -
Sold call options(a)
Volume (Bbls/day) 10,000 10,000 35,000
Price per Bbl $72.39 $72.39 $61.91
Two-way Collars
Volume (Bbls/day) 10,000 10,000 -
Price per Bbl:
Ceiling $50.00 $50.00 -
Floor $41.55 $41.55 -
(a) Call Options settle monthly.
As of June 30, 2016
25
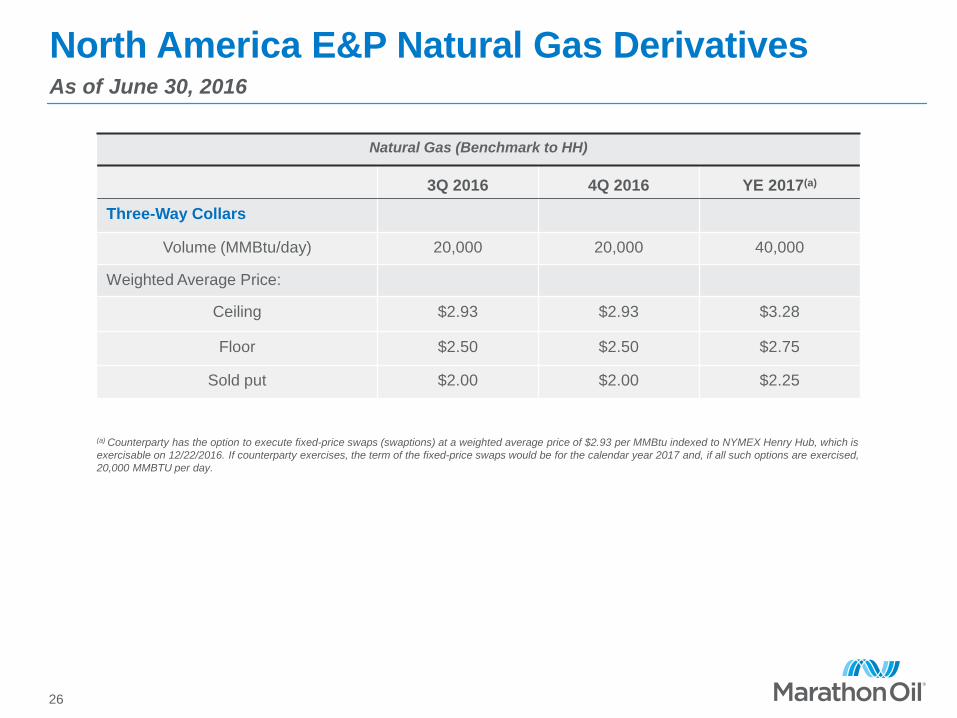
North America E&P Natural Gas Derivatives
(a) Counterparty has the option to execute fixed-price swaps (swaptions) at a weighted average price of $2.93 per MMBtu indexed to NYMEX Henry Hub, which is exercisable on 12/22/2016. If counterparty exercises, the term of the fixed-price swaps would be for the calendar year 2017 and, if all such options are exercised, 20,000 MMBTU per day.
As of June 30, 2016
Natural Gas (Benchmark to HH)
3Q 2016 4Q 2016 YE 2017(a)
Three-Way Collars
Volume (MMBtu/day) 20,000 20,000 40,000
Weighted Average Price:
Ceiling $2.93 $2.93 $3.28
Floor $2.50 $2.50 $2.75
Sold put $2.00 $2.00 $2.25
26

Capital, Investment & ExplorationBudget reconciliation $MM
2016Budget
2016 YTD*Actual
Capital expenditures, including acquisitions 1,401 625**
M&S Inventory 0 (26)
Investments in equity method investees & others 0 0
Exploration costs other than well costs 31 47
Prior period non-cash accrual adjustments 0 41
Capital, Investment & Exploration Budget 1,432 687
* YTD is through 6/30/16** Amounts contain $89MM acquisition deposit
27