Embed Size (px)
Citation preview

23 JULY 2010
SECOND QUARTER 2010

HENRY STÉNSONSENIOR VICE PRESIDENT COMMUNICATIONS

SECOND QUARTER 2010
THIS PRESENTATION CONTAINS FORWARD LOOKING STATEMENTS. SUCH STATEMENTS ARE BASED ON OUR CURRENT EXPECTATIONS AND ARE SUBJECT TO CERTAIN RISKS AND UNCERTAINTIES THAT COULD NEGATIVELY AFFECT OUR BUSINESS. PLEASE READ OUR EARNINGS REPORTS AND OUR MOST RECENT ANNUAL REPORT FOR A BETTER UNDERSTANDING OF THESE RISKS AND UNCERTAINTIES.

HANS VESTBERGPRESIDENT AND CEO

© Telefonaktiebolaget LM Ericsson 2010 | SECOND QUARTER REPORT 2010 | July 23, 2010
Q2
trends
Good demand for mobile broadband
Continued focus on network quality
and efficiency
Continued component shortage in
industry and supply chain constraints
Mixed operator investment
activities also this quarter

© Telefonaktiebolaget LM Ericsson 2010 | SECOND QUARTER REPORT 2010 | July 23, 2010
RECENT
EVENTS
› LG-Ericsson in Korea› Acquisition of Nortel’s stake completed on June 30
› Agreements with new industry segments› Sole managed services partner for energy company Endesa
› Sole managed services partner for China Mobile Hebei› Largest managed services contract in China to date
› New agreement with Telefónica and Indra› Pre-paid billing solution today serving 100 million subs
› Leader in LTE› More than 50 LTE trials across the world

© Telefonaktiebolaget LM Ericsson 2010 | SECOND QUARTER REPORT 2010 | July 23, 2010
NET
SALES
› Lower sales in Networks and Multimedia
› Global Services flat with decline in network rollout
› Increase in Professional Services 9% constant currencies
› Services share 42% of total sales
› Component shortage and supply chain bottlenecks
› Estimated impact SEK 3-4 b
SEK b
Comparable units and adj for net FX/hedgeY/Y: -15%
Net salesQ210Y/YQ/Q
SEK 48.0-8%+6%
0
10
20
30
40
50
60
70
80
Q1 Q2 Q3 Q4 Q1 Q2 Q3 Q4 Q1 Q2 Q3 Q4 Q1 Q2 Q3 Q4 Q1 Q2
2006 2007 2008 2009 2010

© Telefonaktiebolaget LM Ericsson 2010 | SECOND QUARTER REPORT 2010 | July 23, 2010
0
1
2
3
4
5
6
7
8
9
10
Q1 Q2 Q3 Q4 Q1 Q2 Q3 Q4 Q1 Q2 Q3 Q4 Q1 Q2 Q3 Q4 Q1 Q2
2006 2007 2008 2009 2010
0%
2%
4%
6%
8%
10%
12%
14%
16%
18%
20%
Adjusted
operating income and margin
› Gross margin improved (39%) – business mix and efficiency gains› Operating margin slight decrease YoY
Operating margin excl JVsQ210 11%Q209 12%
All numbers excl. restructuring charges and JVsExcl. capital gain of SEK 0.8 b. for divestment of Symbian shares Q4 2008 and SEK 0.8 b for divestment of TEMS Q2 2009
SEK b Operating income excl JVsQ210 SEK 5.3 bQ209 SEK 6.1 b
EBITA margin excl JVs, excl restr
Operating margin, excl JVs, excl restr

REGIONAL COMMENTS

© Telefonaktiebolaget LM Ericsson 2010 | SECOND QUARTER REPORT 2010 | July 23, 2010
Q2
Regional sales
split
2010 Q2
SEK48.0 b
North America27%
9% Latin America
6% Northern Europe and Central Asia
India 3%
Sub-Saharan Africa 6%
8%Middle East
12%Mediterranean 9%
Western and Central Europe
China andNorth East Asia
10%
Other3%
South East Asia and Oceania
8%
© Telefonaktiebolaget LM Ericsson 2010 | SECOND QUARTER REPORT 2010 | July 23, 2010
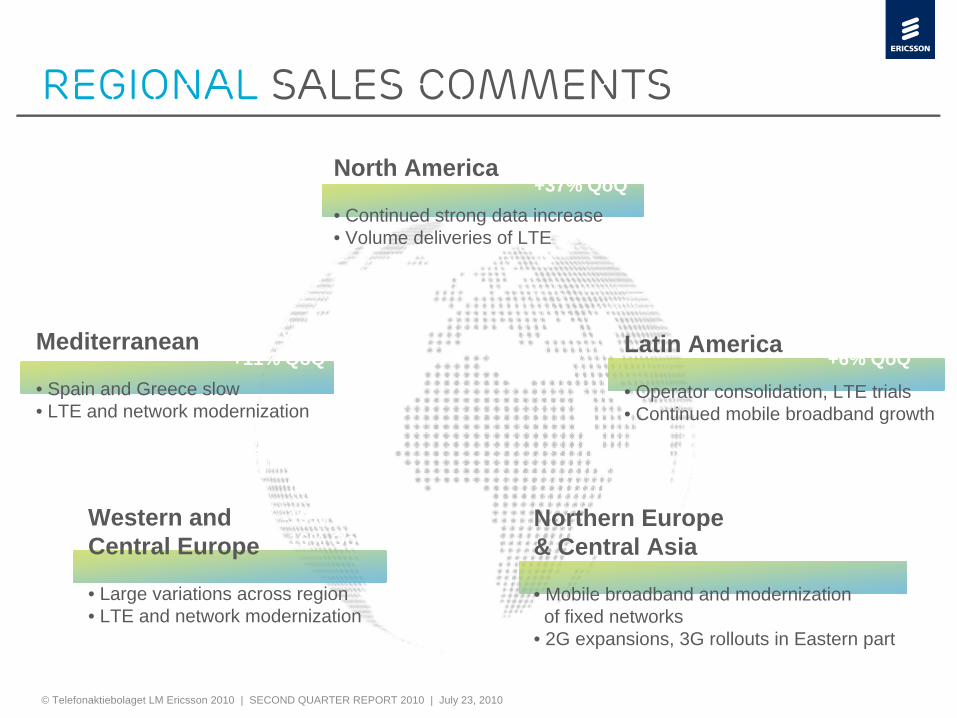
Regional
sales comments
North America
• Continued strong data increase • Volume deliveries of LTE
Northern Europe & Central Asia
• Mobile broadband and modernization of fixed networks
• 2G expansions, 3G rollouts in Eastern part
Western and Central Europe
• Large variations across region• LTE and network modernization
Mediterranean
• Spain and Greece slow• LTE and network modernization
Latin America
• Operator consolidation, LTE trials• Continued mobile broadband growth
+128% YoY+37% QoQ
-19% YoY-16% QoQ
-12% YoY+6% QoQ
-7% YoY+16% QoQ
-17% YoY+11% QoQ
© Telefonaktiebolaget LM Ericsson 2010 | SECOND QUARTER REPORT 2010 | July 23, 2010
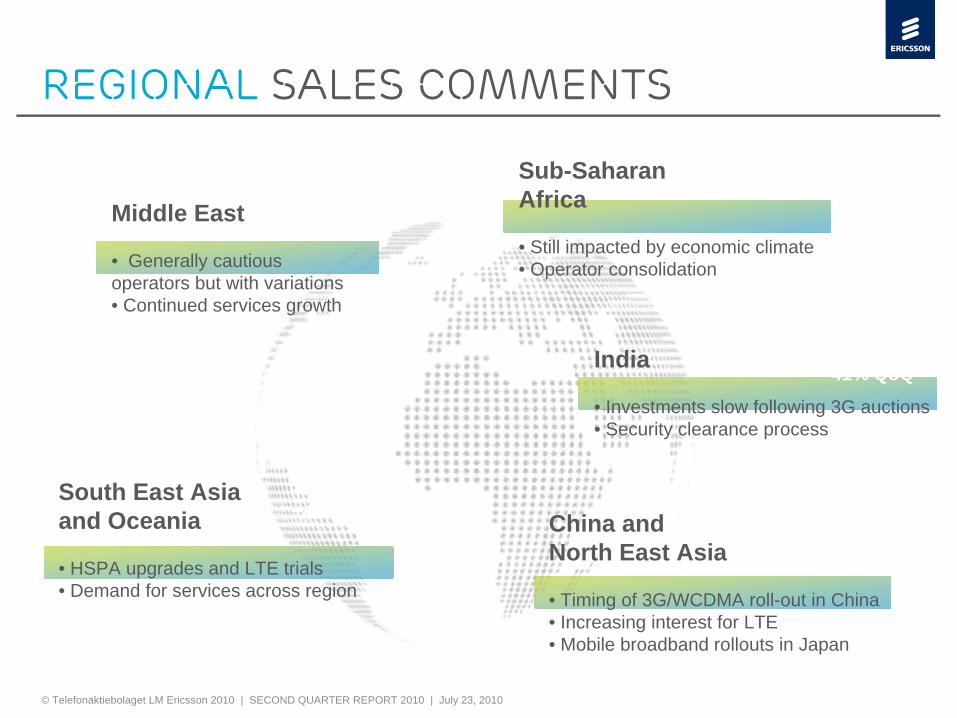
Regional
sales comments
Middle East
• Generally cautious operators but with variations• Continued services growth
China and North East Asia
• Timing of 3G/WCDMA roll-out in China • Increasing interest for LTE• Mobile broadband rollouts in Japan
Sub-Saharan Africa
• Still impacted by economic climate• Operator consolidation
India
• Investments slow following 3G auctions• Security clearance process
South East Asia and Oceania
• HSPA upgrades and LTE trials• Demand for services across region
-20% YoY-4% QoQ
-63% YoY-41% QoQ
-36% YoY-7% QoQ
-36% YoY+4% QoQ
-19% YoY+22% QoQ

© Telefonaktiebolaget LM Ericsson 2010 | SECOND QUARTER REPORT 2010 | July 23, 2010
0
2
4
6
8
10
Q1 Q2 Q3 Q4 Q1 Q2 Q3 Q4 Q1 Q2 Q3 Q4 Q1 Q2
2007 2008 2009 2010
INDIA
› Sales -63% YoY and -41% sequentially
› Lead up to the 3G auctions as well as security clearance process
› Lower volumes mainly affected mobile infrastructure sales
› Recurring services business maintained good development
› 3G deployments expected to start in the second half of the year
› Highly competitive market
MULTIMEDIA
GLOBAL SERVICES
NETWORKS
SalesSEK b

© Telefonaktiebolaget LM Ericsson 2010 | SECOND QUARTER REPORT 2010 | July 23, 2010
CHINA AND NORTH EAST ASIA
› Sales -36% YoY and -7% sequentially
› YoY decline related to timing of 3G/WCDMA roll-out – tough comparison
› Mainland China operators focus on successful 3G launches
› LTE on agendas across region› Strong mobile broadband in
Japan› Leading vendor in Korea
through acquisition of Nortel’s part of LG-Nortel
SEK b
0
2
4
6
8
10
Q1 Q2 Q3 Q4 Q1 Q2 Q3 Q4 Q1 Q2 Q3 Q4 Q1 Q2
2007 2008 2009 2010
MULTIMEDIA
GLOBAL SERVICES
NETWORKS
Sales

SEGMENTS

© Telefonaktiebolaget LM Ericsson 2010 | SECOND QUARTER REPORT 2010 | July 23, 2010
0%
5%
10%
15%
20%
25%
30%
Q1 Q2 Q3 Q4 Q1 Q2 Q3 Q4 Q1 Q2 Q3 Q4 Q1 Q2
2007 2008 2009 2010
0
10
20
30
40
50
networks
SEK bSalesY/Y -12%Q/Q +3%
EBITA marginQ210 17%Q209 14%Q110 16%
› Mobile broadband and CDMA developed favorably and partly offset the continued decline in voice related sales
› Segment sales negatively impacted by continued industry component shortages and supply chain bottlenecks
› EBITA margin increased YoY due to cost efficiency and business mix despite lower sales
All numbers excl. restructuring chargesNetworks EBITA
Networks sales

© Telefonaktiebolaget LM Ericsson 2010 | SECOND QUARTER REPORT 2010 | July 23, 2010
global
services
› Sales affected by decline in network rollout activity › Fewer turnkey projects
› Good growth in Professional Services up 9% YoY in constant currencies
› Managed Services up 23% YoY
All numbers excl. restructuring chargesSecond quarter 2009 adjusted for divestment of TEMS
SalesY/Y +0%Q/Q +11%
Global Services EBITA marginQ210 +12%Q209 +12%Q110 +12%
SEK b
Network Rollout
Managed Services
Professional Services excl. Managed Services
Global Services EBITA
Professional Services EBITA0%
2%
4%
6%
8%
10%
12%
14%
16%
18%
20%
0
4
8
12
16
20
24
2007 2008 2009 2010

© Telefonaktiebolaget LM Ericsson 2010 | SECOND QUARTER REPORT 2010 | July 23, 2010
global
services
>40,000service professionals
>450 msubscribers in network operations
2 bsubscribers in supported networks
>750 msubscribers in managed networks

© Telefonaktiebolaget LM Ericsson 2010 | SECOND QUARTER REPORT 2010 | July 23, 2010
multimedia
› Continued weak demand for revenue management solutions in India, Middle East and Sub-Saharan Africa
› Sales up 5% sequentially, driven by TV and Multimedia Brokering› Strengthened position in TV
SEK b
SalesY/Y -27%Q/Q +5%
EBITA marginQ210 -5%Q209 +15%Q110 -5%
Multimedia EBITA
Multimedia sales
0
1
2
3
4
5
6
2008 2009 2010-20%
-10%
0%
10%
20%
30%
All numbers excl. restructuring charges and adjusted for divestment of mobile platforms and PBX business in 2008Fourth quarter 2008 excl. capital gain of SEK 0.8 b. for divestment of Symbian shares
© Telefonaktiebolaget LM Ericsson 2010 | SECOND QUARTER REPORT 2010 | July 23, 2010
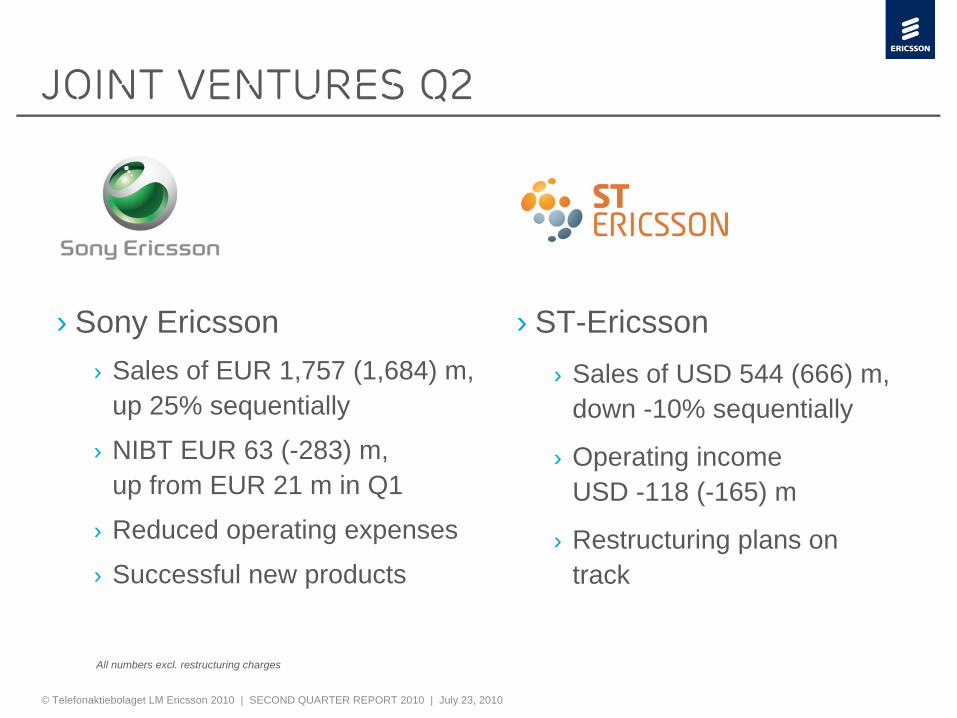
› Sony Ericsson› Sales of EUR 1,757 (1,684) m,
up 25% sequentially
› NIBT EUR 63 (-283) m, up from EUR 21 m in Q1
› Reduced operating expenses
› Successful new products
Joint ventures Q2
› ST-Ericsson› Sales of USD 544 (666) m,
down -10% sequentially
› Operating income USD -118 (-165) m
› Restructuring plans on track
All numbers excl. restructuring charges

JAN FRYKHAMMARCFO AND EXECUTIVE VICE PRESIDENT
FINANCIAL OVERVIEW

© Telefonaktiebolaget LM Ericsson 2010 | SECOND QUARTER REPORT 2010 | July 23, 2010
Q2
financial highlights› Improved gross margin due to business mix and efficiency gains › Operating margin declined mainly due to lower sales, improved sequentially› Continued improvement in share of earnings of JVs› Negative cash flow due to increased working capital
Second quarter First quarterSEK b 2010 2009 Change 2010 Change
Sales 48.0 52.1 -8% 45.1 6%
Gross margin 39% 36% - 39% -
Operating income excl JVs 5.3 6.1 -12% 4.5 17%
Share in earnings of JVs -0.1 -2.0 - -0.3 -
Net income 2.0 0.8 154% 1.3 59%
EPS, diluted SEK 0.58 0.26 123% 0.39 49%
Cash flow from operations -2.7 9.1 - 2.3 -
All numbers, excl. EPS and Net income and Cash flow from operations excl. restructuring chargesSecond quarter 2009 excl. capital gain of SEK 0.8 b from divested TEMS services operation

© Telefonaktiebolaget LM Ericsson 2010 | SECOND QUARTER REPORT 2010 | July 23, 2010
Balance sheet
and ratios
SEK bJun 30
2009Sep 30
2009Dec 31
2009Mar 31
2010Jun 30
2010
Trade receivables 69.4 62.4 66.4 62.7 69.4
Days sales outstanding 121 118 106 117 133
Inventory 29.0 26.8 22.7 24.1 29.4
Inventory days 78 77 68 75 81
Payable days 59 57 57 59 61
Return on capital employed 5% 4% 4% 5% 6%
Equity ratio 51% 52% 52% 53% 51%
› DSO and inventory impacted by higher proportion of deliveries late in quarter due to component shortage, supply chain bottlenecks, consolidation of LG-Nortel and currency
› Continued healthy equity ratio

© Telefonaktiebolaget LM Ericsson 2010 | SECOND QUARTER REPORT 2010 | July 23, 2010
40
45
50
55
60
65
70
75
80
85
90
Gross Cash1003A
Net Incomereconciled to
cash
Change in Netoperating
assets (excl.restructuring)
Restructuring Investingactivities
Financingactivities
Dividend FX on cash Gross Cash1006A
Change in gross cash SEK -10.3 b
Change in net cash -12.7 b (from 38.5 to 25.8 b)
67.6
77.9Adjusted cash flow SEK -2 b.
LG-Ericsson acquisition 1.5 SEK b
Operating Cash Flow -2.7 b b Investing -3.2 bb Financial 1.5 bb FX 0.6 bbDiv-6.4 bb
Change in gross cash q2 2010
SEK b

© Telefonaktiebolaget LM Ericsson 2010 | SECOND QUARTER REPORT 2010 | July 23, 2010
DEBT MATURITY PROFILE
0.0
1.0
2.0
3.0
4.0
5.0
6.0
7.0
2010 2011 2012 2013 2014 2015 2016 2017-
Notes and Bonds Other financial liabilities EIB SEK / EKN MTN Bond
SEK b
Undrawn back-up facility of USD 2 b available
Continued strong payment readiness SEK 79.3 b

© Telefonaktiebolaget LM Ericsson 2010 | SECOND QUARTER REPORT 2010 | July 23, 2010
Cost reduction
program
› Original plan announced January 2009› Total savings estimated to SEK 15-16 b from mid 2010› Total restructuring charges SEK 15.5 b
–
Restructuring charges SEK 2.0 b for Q2 2010
› Cash outlays also after completion of program in Q2–
Cash outlays of SEK 4.7 b remain to be done
Please note that not all restructuring charges lead to cash out
Cost and capital efficiency remain top of agenda

© Telefonaktiebolaget LM Ericsson 2010 | SECOND QUARTER REPORT 2010 | July 23, 2010
FOCUS
AREAS
GROW FASTER THAN THE MARKET
BEST IN CLASS MARGINS
STRONG CASH CONVERSION
GROWTH IN JV EARNINGS
SECOND quarter 2010Q & A