Embed Size (px)
Citation preview
SECOND GRADE SCIENCE AND MATH
3 WEEKS LESSON PLANS AND
ACTIVITIES
Math/Science Nucleus ©1990,2000 2
APPLIED SCIENCEOVERVIEW OF SECOND GRADE
SCIENCE AND MATHWEEK 1.PRE: Exploring perception.LAB: Experimenting and predicting volume, weight, and length.POST: Estimating and gathering data.WEEK 2.PRE: Comparing and contrasting two and three dimensional objects.LAB: Recognizing and comparing shapes.POST: Exploring unit cells to create patterns.WEEK 3.PRE: Investigating symmetry.LAB: Comparing symmetry in nature.POST: Discovering tessellations.
PHYSICSWEEK 4.PRE: Describing the physical world.LAB: Exploring the physics behind toys.POST: Investigating how things work.WEEK 5.PRE: Comparing different forms of energy.LAB: Investigating different forms of energy.POST: Exploring nuclear, heat, and chemical energy.
TECHNOLOGYWEEK 6.PRE: Investigating everyday simple machines.LAB: Investigating machines that produce work.POST: Comparing machines that produce energy.WEEK 7.PRE: Exploring technology.LAB: Investigating computer technology.POST: Comparing technologies used in the entertainment industry.
BUILT ENVIRONMENTWEEK 8.PRE: Comparing different energy machines.LAB: Investigating how solar energy produces power.POST: Contrasting different forms of energy.
Math/Science Nucleus ©1990,2000 3
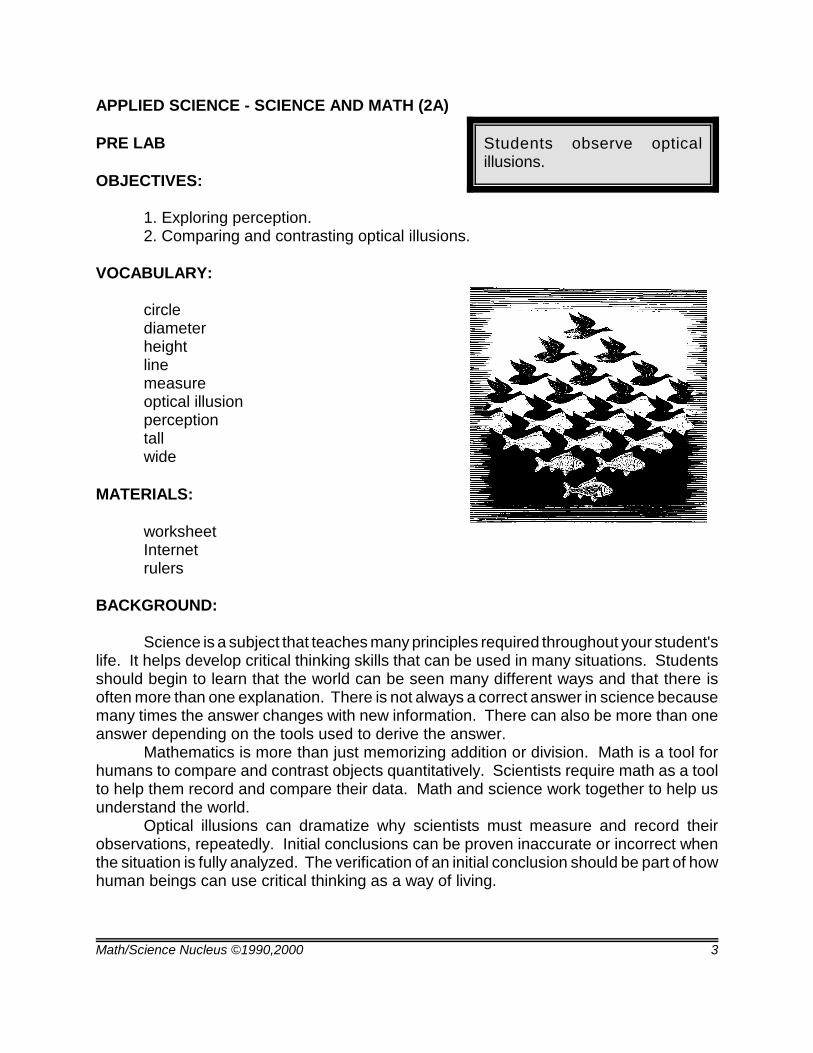
Students observe opticalillusions.
APPLIED SCIENCE - SCIENCE AND MATH (2A)
PRE LAB
OBJECTIVES:
1. Exploring perception.2. Comparing and contrasting optical illusions.
VOCABULARY:
circlediameterheightlinemeasureoptical illusionperceptiontallwide
MATERIALS:
worksheetInternetrulers
BACKGROUND:
Science is a subject that teaches many principles required throughout your student'slife. It helps develop critical thinking skills that can be used in many situations. Studentsshould begin to learn that the world can be seen many different ways and that there isoften more than one explanation. There is not always a correct answer in science becausemany times the answer changes with new information. There can also be more than oneanswer depending on the tools used to derive the answer.
Mathematics is more than just memorizing addition or division. Math is a tool forhumans to compare and contrast objects quantitatively. Scientists require math as a toolto help them record and compare their data. Math and science work together to help usunderstand the world.
Optical illusions can dramatize why scientists must measure and record theirobservations, repeatedly. Initial conclusions can be proven inaccurate or incorrect whenthe situation is fully analyzed. The verification of an initial conclusion should be part of howhuman beings can use critical thinking as a way of living.
Math/Science Nucleus ©1990,2000 4
PROCEDURE:
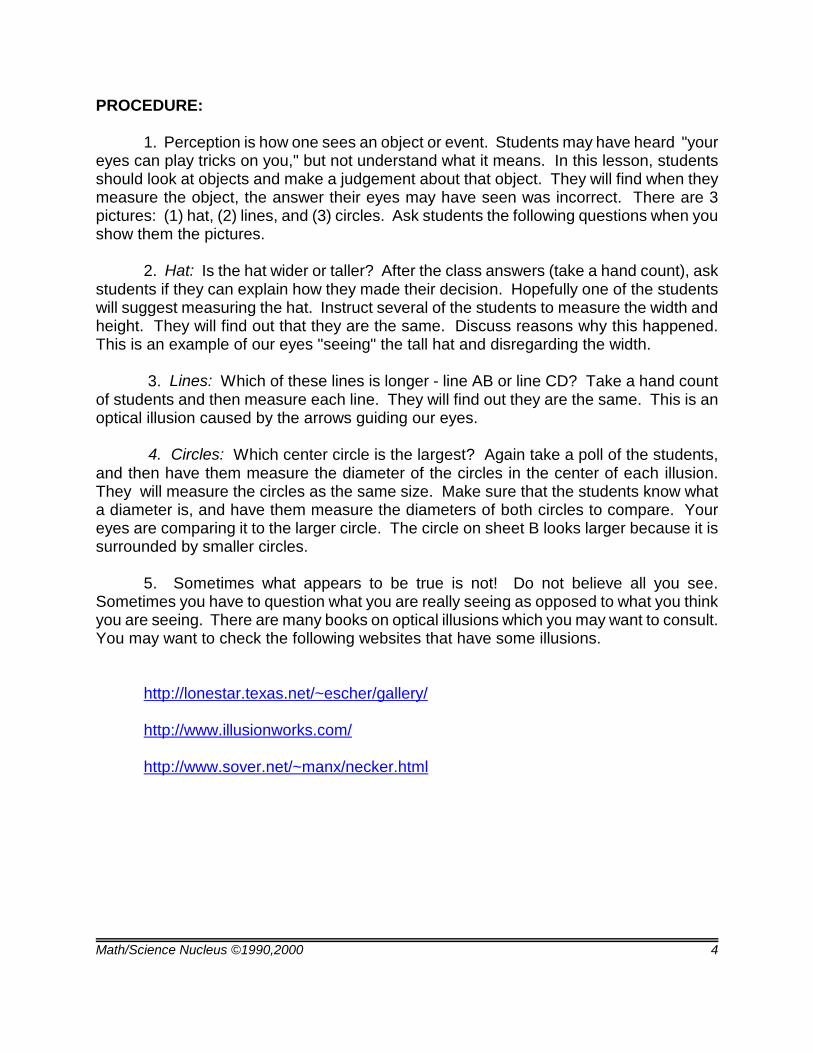
1. Perception is how one sees an object or event. Students may have heard "youreyes can play tricks on you," but not understand what it means. In this lesson, studentsshould look at objects and make a judgement about that object. They will find when theymeasure the object, the answer their eyes may have seen was incorrect. There are 3pictures: (1) hat, (2) lines, and (3) circles. Ask students the following questions when youshow them the pictures.
2. Hat: Is the hat wider or taller? After the class answers (take a hand count), askstudents if they can explain how they made their decision. Hopefully one of the studentswill suggest measuring the hat. Instruct several of the students to measure the width andheight. They will find out that they are the same. Discuss reasons why this happened.This is an example of our eyes "seeing" the tall hat and disregarding the width.
3. Lines: Which of these lines is longer - line AB or line CD? Take a hand countof students and then measure each line. They will find out they are the same. This is anoptical illusion caused by the arrows guiding our eyes.
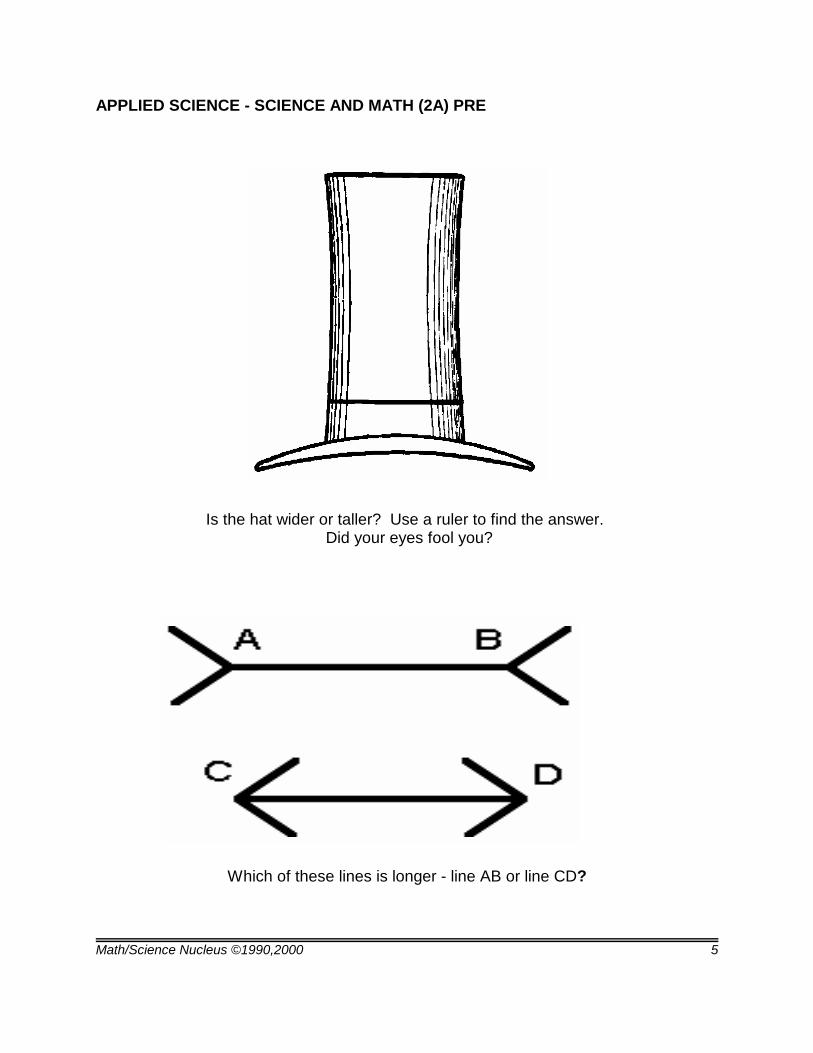
4. Circles: Which center circle is the largest? Again take a poll of the students,and then have them measure the diameter of the circles in the center of each illusion.They will measure the circles as the same size. Make sure that the students know whata diameter is, and have them measure the diameters of both circles to compare. Youreyes are comparing it to the larger circle. The circle on sheet B looks larger because it issurrounded by smaller circles.
5. Sometimes what appears to be true is not! Do not believe all you see.Sometimes you have to question what you are really seeing as opposed to what you thinkyou are seeing. There are many books on optical illusions which you may want to consult.You may want to check the following websites that have some illusions.
http://lonestar.texas.net/~escher/gallery/
http://www.illusionworks.com/
http://www.sover.net/~manx/necker.html
Math/Science Nucleus ©1990,2000 5
APPLIED SCIENCE - SCIENCE AND MATH (2A) PRE
Is the hat wider or taller? Use a ruler to find the answer. Did your eyes fool you?
Which of these lines is longer - line AB or line CD?
Math/Science Nucleus ©1990,2000 6
APPLIED SCIENCE - SCIENCE AND MATH (2A) PRE
Which center circle is the largest?
Math/Science Nucleus ©1990,2000 7
Students predict and thenmeasure volume, weight, andlength of different objects.
APPLIED SCIENCE - SCIENCE AND MATH (2A)
LAB
OBJECTIVE:
1. Comparing predictions.2. Experimenting and predicting volume, weight and length.
VOCABULARY:
estimatelengthpredictvolumeweight
MATERIALS:
Applied Science - Science and Math (2A)(or other appropriate materials)primary balance scale beakers water 2 types of yellow candy (one sour, one sweet) 2 liquids - one viscous (like honey) and one less viscous (like oil)
metric rulers
BACKGROUND:
Science and mathematics use the ability to predict or estimate to help guide theexperiment or the mathematical conclusion. These skills are learned, and with practice canincrease a person’s proficiency.
Prediction is based on prior knowledge or familiarity with an event or substance.Predicting what it would be like in space, would require prior experiences with flying on anairplane or riding on some amusement park rides. If a person has not experienced asimilar event, prediction is very difficult. The more experiences a child has, the better theywill be able to predict an experience.
Estimating is an attempt to determine an accurate answer. For instance, if you areestimating the arrival time of an airplane flying from San Francisco to New York, you wouldtake the time of departure and add about 5 hours. You would also have to take intoaccount a 3 hour difference in time. This information will allow you can estimate time ofarrival. An accurate answer would be considered a realistic answer. For example, if youask a student to estimate the number of beans in a cup and they answer, “20 million,” theanswer is not accurate. Estimation requires thinking, it is not just any answer.
Math/Science Nucleus ©1990,2000 8
PROCEDURE:
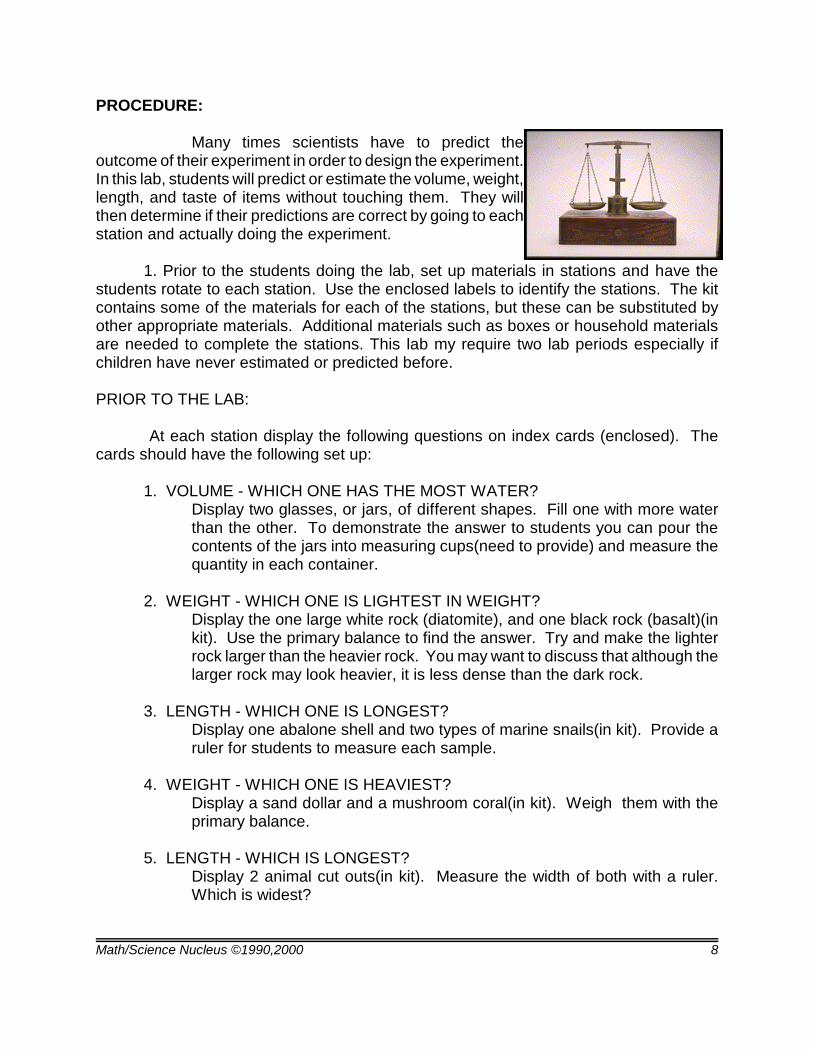
Many times scientists have to predict theoutcome of their experiment in order to design the experiment.In this lab, students will predict or estimate the volume, weight,length, and taste of items without touching them. They willthen determine if their predictions are correct by going to eachstation and actually doing the experiment.
1. Prior to the students doing the lab, set up materials in stations and have thestudents rotate to each station. Use the enclosed labels to identify the stations. The kitcontains some of the materials for each of the stations, but these can be substituted byother appropriate materials. Additional materials such as boxes or household materialsare needed to complete the stations. This lab my require two lab periods especially ifchildren have never estimated or predicted before.
PRIOR TO THE LAB:
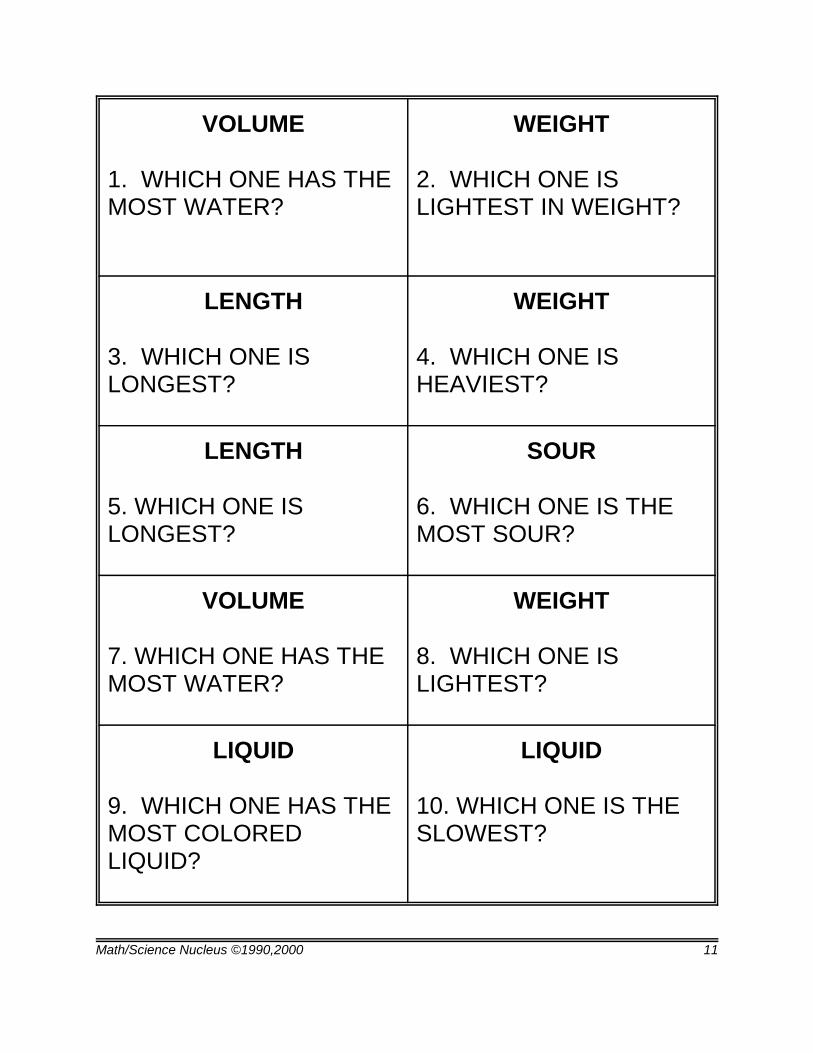
At each station display the following questions on index cards (enclosed). Thecards should have the following set up:
1. VOLUME - WHICH ONE HAS THE MOST WATER?Display two glasses, or jars, of different shapes. Fill one with more waterthan the other. To demonstrate the answer to students you can pour thecontents of the jars into measuring cups(need to provide) and measure thequantity in each container.
2. WEIGHT - WHICH ONE IS LIGHTEST IN WEIGHT?Display the one large white rock (diatomite), and one black rock (basalt)(inkit). Use the primary balance to find the answer. Try and make the lighterrock larger than the heavier rock. You may want to discuss that although thelarger rock may look heavier, it is less dense than the dark rock.
3. LENGTH - WHICH ONE IS LONGEST?Display one abalone shell and two types of marine snails(in kit). Provide aruler for students to measure each sample.
4. WEIGHT - WHICH ONE IS HEAVIEST?Display a sand dollar and a mushroom coral(in kit). Weigh them with theprimary balance.
5. LENGTH - WHICH IS LONGEST?Display 2 animal cut outs(in kit). Measure the width of both with a ruler.Which is widest?
Math/Science Nucleus ©1990,2000 9
6. SOUR - WHICH ONE IS MOST SOUR?Purchase 2 types of yellow candy, one sour and one sweet(need to provide).If available, make one sugarless. Allow students to "taste them" to get theanswer.
7. VOLUME - WHICH ONE HAS THE MOST WATER?This station is similar to number 1, but use tall and short glasses instead.Graduated cylinders are ideal(need to provide).
8. WEIGHT - WHICH ONE IS LIGHTEST?Display the pyrite crystal and quartz geode(in kit). Using a primary balancehave students see which mineral is the lightest.
9. LIQUID - WHICH ONE HAS THE MOST COLORED LIQUID?Display two timers(in kit) To test them, have students flip over both timersat the same time and determine which takes longer to empty. The one withthe most liquid will be the last to empty.
10. LIQUID - WHICH ONE IS THE SLOWEST?Display a jar of honey and another liquid (need to provide). Make sure thelids are tightly closed. Introduce the word viscous. Explain that viscousmeans thick. Turn the jars on their sides and upside down to observe themovement of the liquids to test the viscosity of the liquid.
2. Discuss length, volume, weight (make sure you discuss heavy and light), liquid,
and sour taste.
3. Explain to students that they will move from station to station as a group lookingat different things. They will have 2 to 3 minutes at each station. At each station have thempredict the answer to each question. They cannot touch anything at this time. Explain thatafter everyone has made their predictions, they will be able to "test" them.
4. After everyone has made their predictions let the students do the tests at thestations. If it is not practical to allow the groups to do all the testing, the teacher candemonstrate some or all of the stations. Allow up to five minutes per station. Studentsshould record the results of the tests in the corresponding column on their lab sheets.Remind the students that it does not matter if their predictions were correct or not. Scienceinvolves learning the true answers. In science we learn from right answers as well aswrong answers.
Math/Science Nucleus ©1990,2000 10
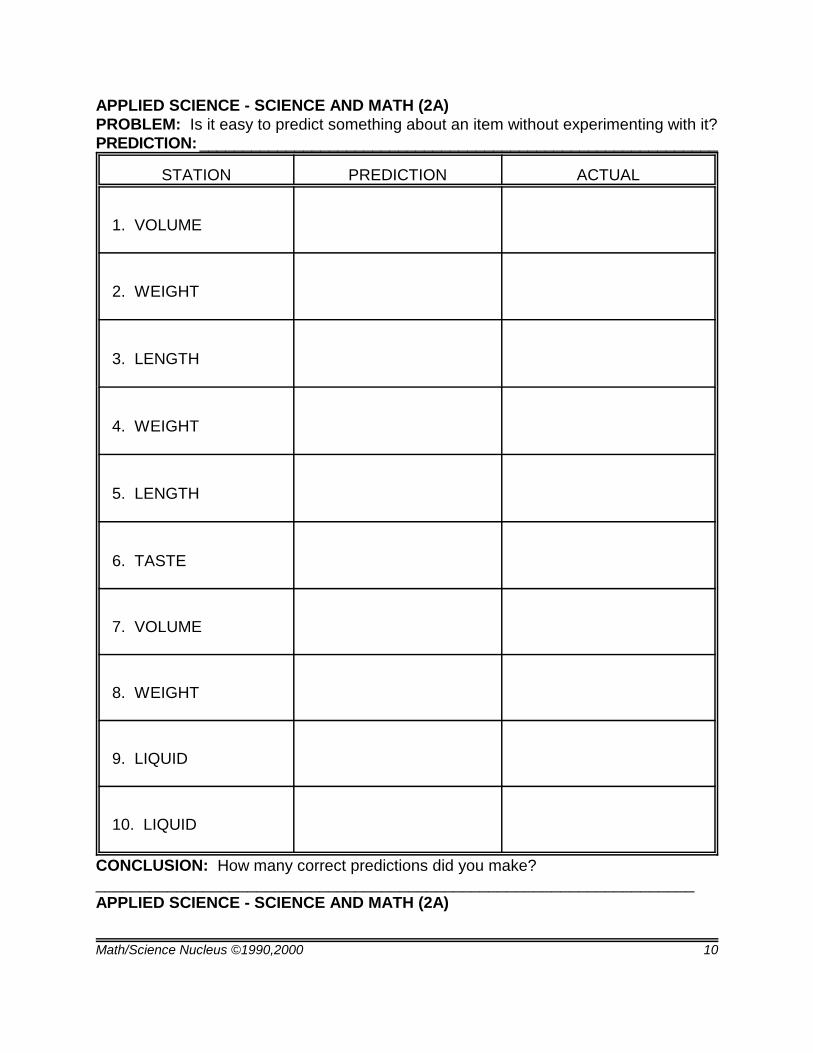
APPLIED SCIENCE - SCIENCE AND MATH (2A)PROBLEM: Is it easy to predict something about an item without experimenting with it?PREDICTION: ____________________________________________________________
STATION PREDICTION ACTUAL
1. VOLUME
2. WEIGHT
3. LENGTH
4. WEIGHT
5. LENGTH
6. TASTE
7. VOLUME
8. WEIGHT
9. LIQUID
10. LIQUID
CONCLUSION: How many correct predictions did you make?___________________________________________________________________APPLIED SCIENCE - SCIENCE AND MATH (2A)
Math/Science Nucleus ©1990,2000 11
VOLUME 1. WHICH ONE HAS THEMOST WATER?
WEIGHT
2. WHICH ONE ISLIGHTEST IN WEIGHT?
LENGTH
3. WHICH ONE ISLONGEST?
WEIGHT
4. WHICH ONE ISHEAVIEST?
LENGTH
5. WHICH ONE ISLONGEST?
SOUR
6. WHICH ONE IS THEMOST SOUR?
VOLUME
7. WHICH ONE HAS THEMOST WATER?
WEIGHT
8. WHICH ONE ISLIGHTEST?
LIQUID
9. WHICH ONE HAS THEMOST COLOREDLIQUID?
LIQUID
10. WHICH ONE IS THESLOWEST?
Math/Science Nucleus ©1990,2000 12
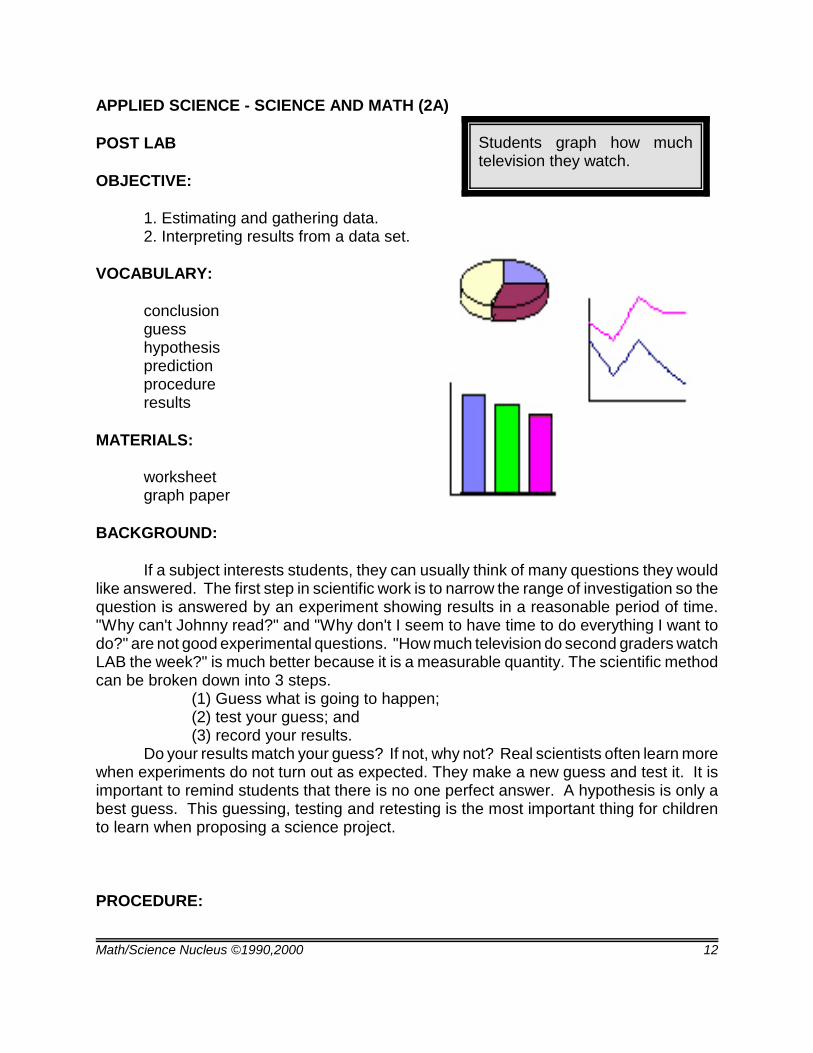
Students graph how muchtelevision they watch.
APPLIED SCIENCE - SCIENCE AND MATH (2A)
POST LAB
OBJECTIVE:
1. Estimating and gathering data.2. Interpreting results from a data set.
VOCABULARY:
conclusionguesshypothesispredictionprocedureresults
MATERIALS:
worksheet graph paper
BACKGROUND:
If a subject interests students, they can usually think of many questions they wouldlike answered. The first step in scientific work is to narrow the range of investigation so thequestion is answered by an experiment showing results in a reasonable period of time."Why can't Johnny read?" and "Why don't I seem to have time to do everything I want todo?" are not good experimental questions. "How much television do second graders watchLAB the week?" is much better because it is a measurable quantity. The scientific methodcan be broken down into 3 steps.
(1) Guess what is going to happen; (2) test your guess; and (3) record your results.
Do your results match your guess? If not, why not? Real scientists often learn morewhen experiments do not turn out as expected. They make a new guess and test it. It isimportant to remind students that there is no one perfect answer. A hypothesis is only abest guess. This guessing, testing and retesting is the most important thing for childrento learn when proposing a science project.
PROCEDURE:
Math/Science Nucleus ©1990,2000 13
1. Explain to students that over the next week they will become scientists testingthe question, "How much television do second graders watch LAB the week?” Beforescientists can answer a question they must first guess what they think will be the outcome.This guess is called a hypothesis. Ask students to decide how many hours of televisionthey usually watch from Monday through Thursday. You will get all sorts of numbers. Pickone in the middle and see if the class agrees by taking a vote. State their hypothesisformally: "The children in our class watch about X hours of television from Monday throughThursday."
2. Inform the students that a scientist must now test their hypothesis (guess). Forthis experiment a survey is sent home on Monday with each child. Each student writesdown how many hours of television he or she watches on Monday, Tuesday, Wednesday,and Thursday. The surveys should be returned on Friday. Ask the children to use wholehours or half hours. If they only watch a fraction of a program ask them to round the timeto the nearest half or whole hour. They can ask their parents to help them with this. If yousend home a weekly letter to parents you may want to include this lab into the letter. In thisway the parents can remind the children to write in their times accurately.
3. Reinforce the following points before they start the survey. The time must beaccurately recorded and there must be a number for each day. The children should followtheir normal viewing habits as much as possible. The idea is to get a real picture of howthey spend their time, not to see if they can fudge the data to come closer to the time theyguessed. Real scientist do not "fudge" data.
4. On Friday, each survey sheet should be checked to ensure that there are entriesfor all four days. The total will change if a child forgets to write the hours down one day.If there are blanks but the child thinks he/she can remember what programs were watched,fill in the data where missing.
5. Model for the children how to add up the total number of hours watched LAB thefour days.
6. Allow them time to add their own numbers. Ask them to have the student nextto them check their work.
7. Ask the children to decide into which of the following categories their hours fit. List the categories on the board: 0 to 3 hour, 3 ½ to 6 hours, 6 ½ to 9 hours, 9 ½ to 12hours.
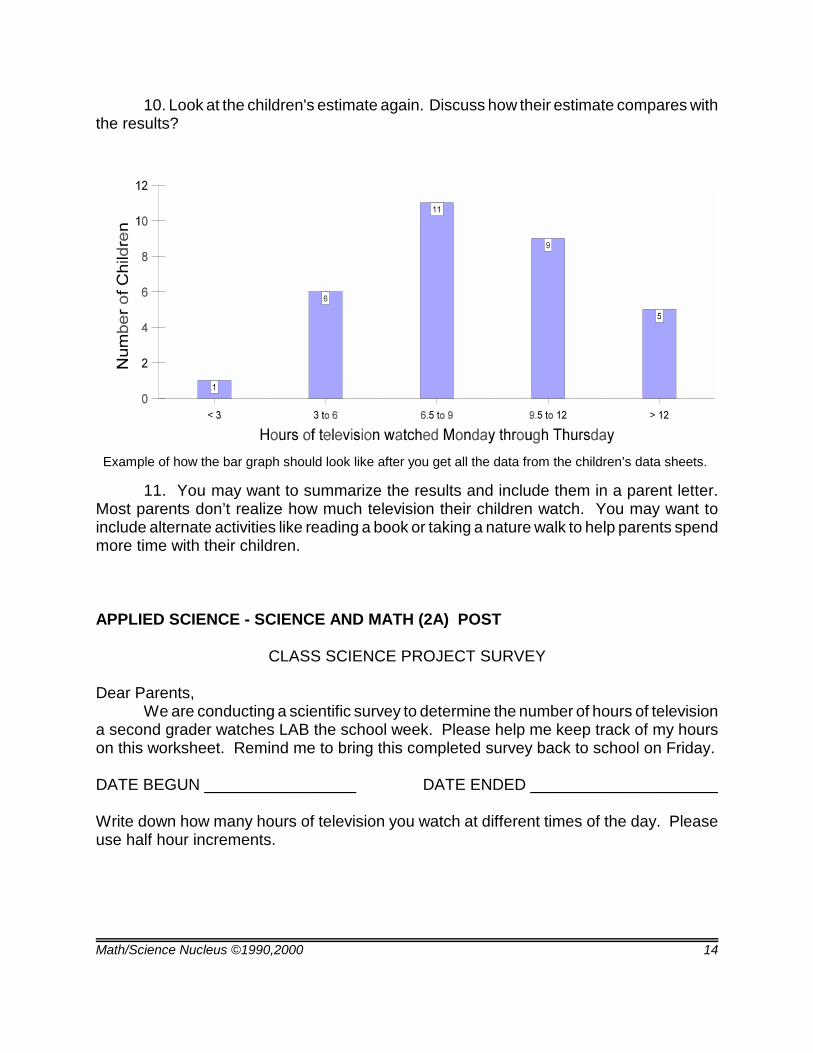
8. Total the number of children in each category and make a bar graph.
9. Report the range of results (the lowest number of hours watched and the highestnumber of hours watched). Look at the graph and determine the most common numberof hours watched.
Math/Science Nucleus ©1990,2000 14
Example of how the bar graph should look like after you get all the data from the children’s data sheets.
10. Look at the children's estimate again. Discuss how their estimate compares withthe results?
11. You may want to summarize the results and include them in a parent letter.Most parents don’t realize how much television their children watch. You may want toinclude alternate activities like reading a book or taking a nature walk to help parents spendmore time with their children.
APPLIED SCIENCE - SCIENCE AND MATH (2A) POST
CLASS SCIENCE PROJECT SURVEY
Dear Parents,We are conducting a scientific survey to determine the number of hours of television
a second grader watches LAB the school week. Please help me keep track of my hourson this worksheet. Remind me to bring this completed survey back to school on Friday.
DATE BEGUN _________________ DATE ENDED _____________________
Write down how many hours of television you watch at different times of the day. Pleaseuse half hour increments.
Math/Science Nucleus ©1990,2000 15
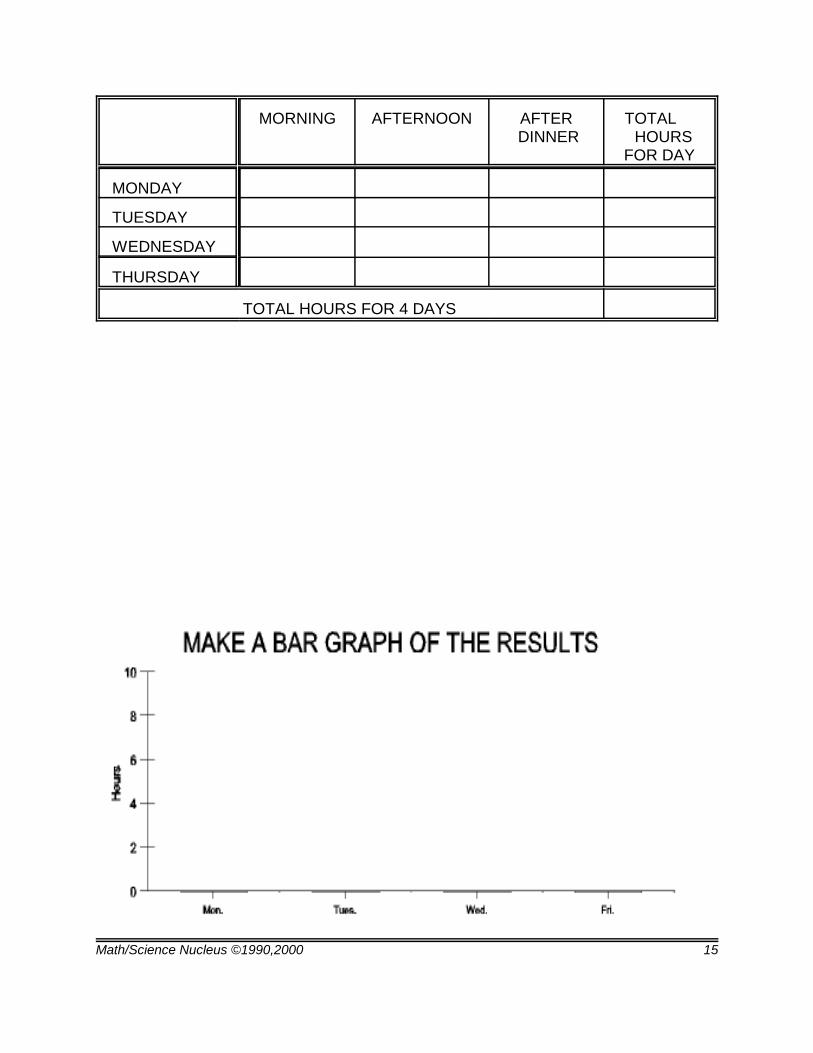
MORNING AFTERNOON AFTER DINNER
TOTAL HOURS
FOR DAY
MONDAY
TUESDAY
WEDNESDAY
THURSDAY
TOTAL HOURS FOR 4 DAYS
Math/Science Nucleus ©1990,2000 16
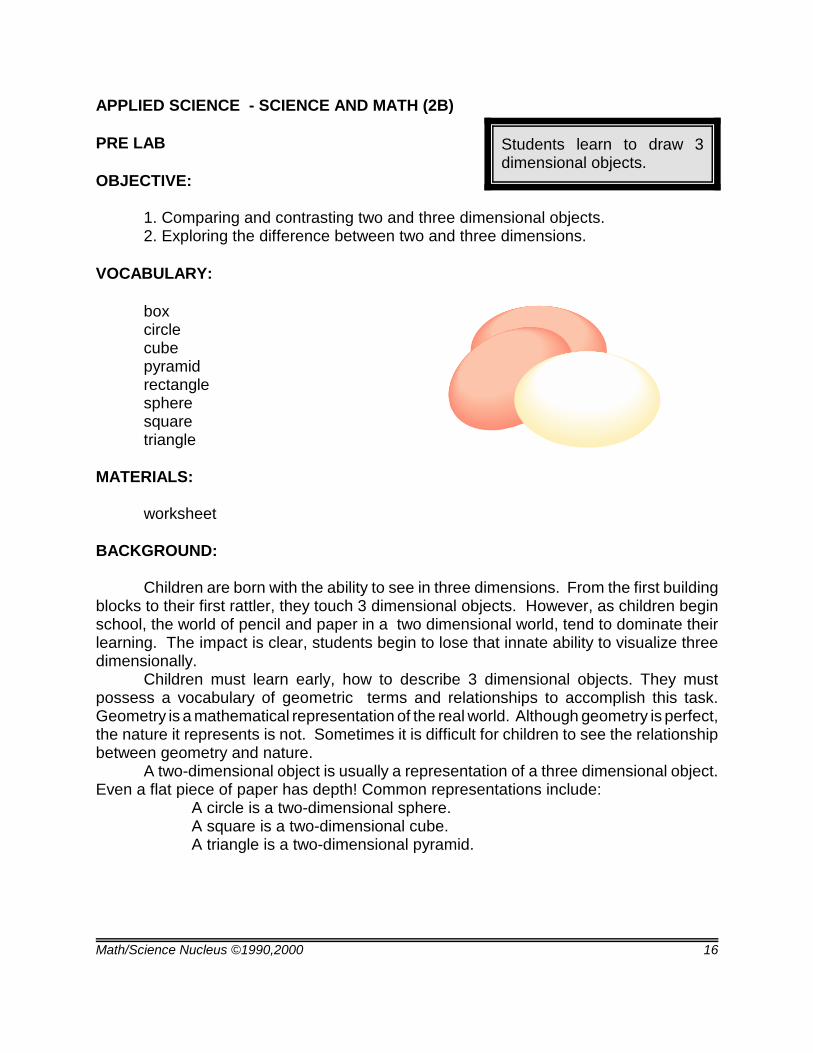
Students learn to draw 3dimensional objects.
APPLIED SCIENCE - SCIENCE AND MATH (2B)
PRE LAB
OBJECTIVE:
1. Comparing and contrasting two and three dimensional objects.2. Exploring the difference between two and three dimensions.
VOCABULARY:
boxcirclecubepyramidrectanglespheresquaretriangle
MATERIALS:
worksheet
BACKGROUND:
Children are born with the ability to see in three dimensions. From the first buildingblocks to their first rattler, they touch 3 dimensional objects. However, as children beginschool, the world of pencil and paper in a two dimensional world, tend to dominate theirlearning. The impact is clear, students begin to lose that innate ability to visualize threedimensionally.
Children must learn early, how to describe 3 dimensional objects. They mustpossess a vocabulary of geometric terms and relationships to accomplish this task.Geometry is a mathematical representation of the real world. Although geometry is perfect,the nature it represents is not. Sometimes it is difficult for children to see the relationshipbetween geometry and nature.
A two-dimensional object is usually a representation of a three dimensional object.Even a flat piece of paper has depth! Common representations include:
A circle is a two-dimensional sphere.A square is a two-dimensional cube. A triangle is a two-dimensional pyramid.
Math/Science Nucleus ©1990,2000 17
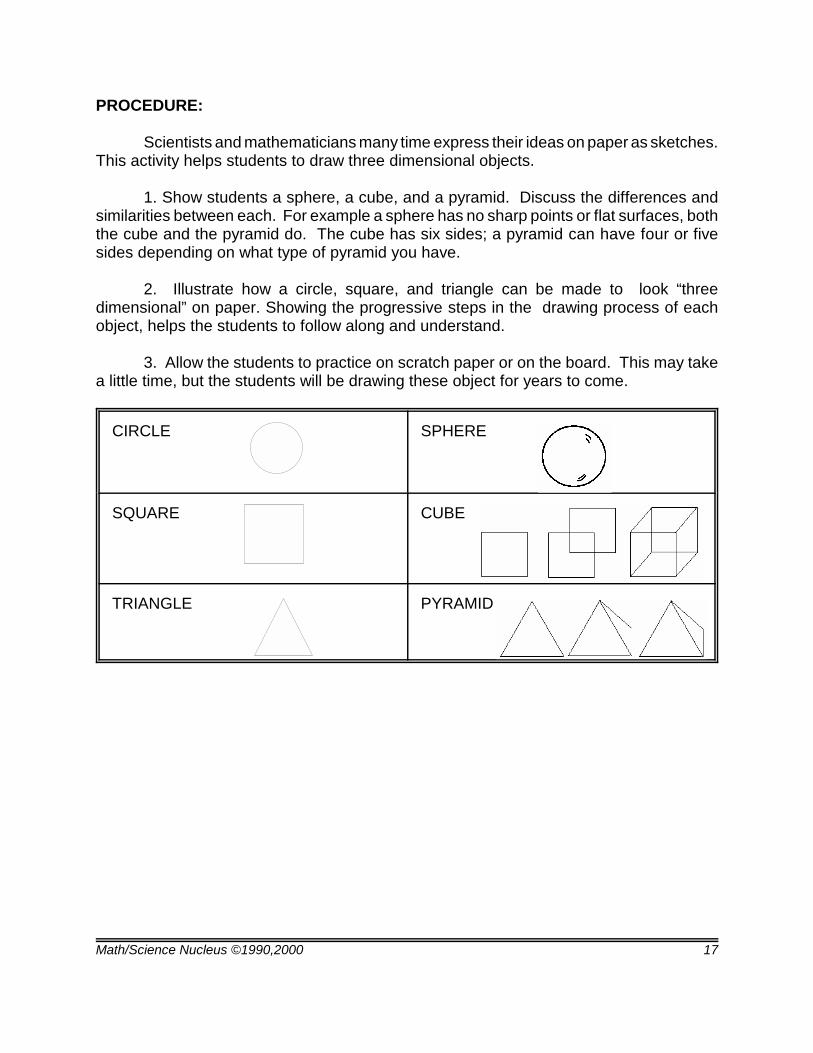
PROCEDURE:
Scientists and mathematicians many time express their ideas on paper as sketches.This activity helps students to draw three dimensional objects.
1. Show students a sphere, a cube, and a pyramid. Discuss the differences andsimilarities between each. For example a sphere has no sharp points or flat surfaces, boththe cube and the pyramid do. The cube has six sides; a pyramid can have four or fivesides depending on what type of pyramid you have.
2. Illustrate how a circle, square, and triangle can be made to look “threedimensional” on paper. Showing the progressive steps in the drawing process of eachobject, helps the students to follow along and understand.
3. Allow the students to practice on scratch paper or on the board. This may takea little time, but the students will be drawing these object for years to come.
CIRCLE SPHERE
SQUARE CUBE
TRIANGLE PYRAMID
Math/Science Nucleus ©1990,2000 18
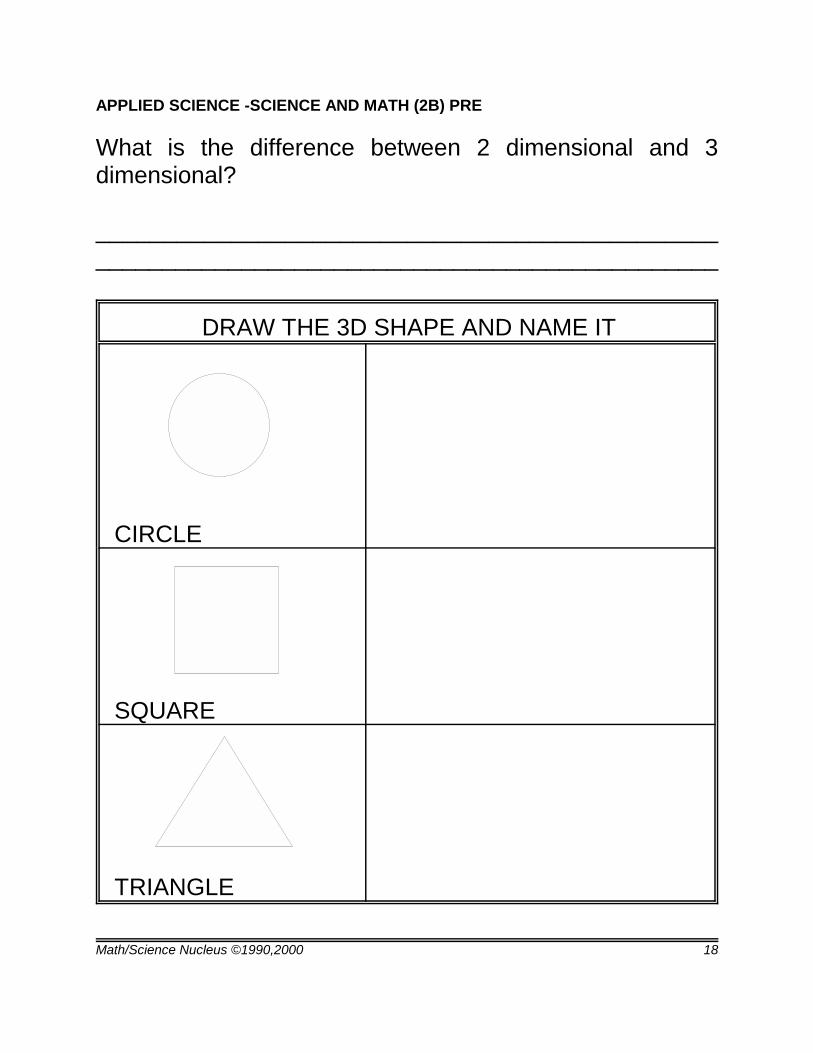
APPLIED SCIENCE -SCIENCE AND MATH (2B) PRE
What is the difference between 2 dimensional and 3dimensional?
_____________________________________________________________________________________________
DRAW THE 3D SHAPE AND NAME IT
CIRCLE
SQUARE
TRIANGLE
Math/Science Nucleus ©1990,2000 19
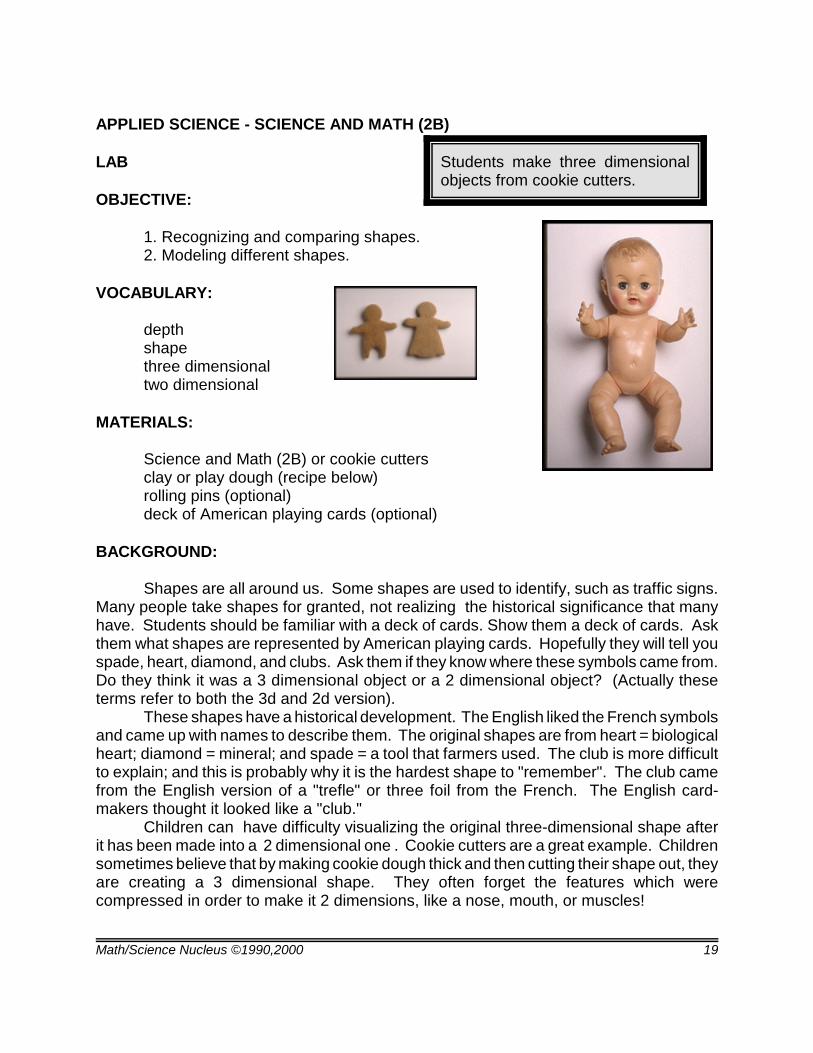
Students make three dimensionalobjects from cookie cutters.
APPLIED SCIENCE - SCIENCE AND MATH (2B)
LAB
OBJECTIVE:
1. Recognizing and comparing shapes.2. Modeling different shapes.
VOCABULARY:
depthshapethree dimensionaltwo dimensional
MATERIALS:
Science and Math (2B) or cookie cuttersclay or play dough (recipe below)rolling pins (optional)deck of American playing cards (optional)
BACKGROUND:
Shapes are all around us. Some shapes are used to identify, such as traffic signs.Many people take shapes for granted, not realizing the historical significance that manyhave. Students should be familiar with a deck of cards. Show them a deck of cards. Askthem what shapes are represented by American playing cards. Hopefully they will tell youspade, heart, diamond, and clubs. Ask them if they know where these symbols came from.Do they think it was a 3 dimensional object or a 2 dimensional object? (Actually theseterms refer to both the 3d and 2d version).
These shapes have a historical development. The English liked the French symbolsand came up with names to describe them. The original shapes are from heart = biologicalheart; diamond = mineral; and spade = a tool that farmers used. The club is more difficultto explain; and this is probably why it is the hardest shape to "remember". The club camefrom the English version of a "trefle" or three foil from the French. The English card-makers thought it looked like a "club."
Children can have difficulty visualizing the original three-dimensional shape afterit has been made into a 2 dimensional one . Cookie cutters are a great example. Childrensometimes believe that by making cookie dough thick and then cutting their shape out, theyare creating a 3 dimensional shape. They often forget the features which werecompressed in order to make it 2 dimensions, like a nose, mouth, or muscles!
Math/Science Nucleus ©1990,2000 20
PROCEDURE:
Emphasize that shapes are all around us. Some we can model easily, but othersare difficult. Tell students many people, even teachers, use 2 dimensional items forsomething that is 3-dimensional. Students will have to think before they name a shape.The difference between 2 dimensional and 3 dimensional is that 3d has depth or as it iscommonly referred to, the "third dimension.” The other two are length and width.
1. Instruct students they will be turning a cook cutter shape into a 3 dimensionalobject. Make sure clues are give on how to turn a 2 dimensional cookie into a 3dimensional object. However, do not show them an example, because the key is for thechildren to discover for themselves how “flat” or two dimensional they really see the world.
2. Give students a piece of wax paper to do their activity on. Provide enough clayor play dough so they can roll it out as “dough.” If you have rolling pins you may want thestudents to roll it out. You can prevent a mess by first putting another piece of wax paperover the clay and then rolling it. If you don’t have rolling pins the students can flatten theclay by pounding on it with their hands.
3. Each person in the group should make a cookie cutter shape. Direct them toconstruct a three dimensional model of the cookie cutter shape. For instance, a circleshould turn into a sphere, but you can also consider a cylinder correct. If you have a“gingerbread” type cutter, students should include a nose, mouth and other threedimensional characteristics of a person. Again children can have a difficult timeunderstanding three-dimensional objects.. They believe that thickness is enough. Guidethem to understand this concept and they will remember it their entire life.
RECIPE FOR PLAY DOUGH
MATERIALS:
250 ml flour125 ml salt5 ml cream of tartar
250 ml waterabout 1 ml food coloringabout 1 ml oil
Math/Science Nucleus ©1990,2000 21
DIRECTIONS:
Cook, with stirring, over medium heat until the gloppy mess looks like play dough.Knead briefly after the mixture has cooled a little. You will need to multiply this recipe by6 to get enough for a class of 30 students, but it should be made in two batches. Largeamounts of dough are difficult to stir because the mixture becomes firm. Store the playdough in a plastic bag or margarine tub.
Play dough can be made and saved for a long time if it doesn't dry out. Color thevarious play dough mixtures depending on the activity. Many activities do not require aspecific color.
Math/Science Nucleus ©1990,2000 22
APPLIED SCIENCE - SCIENCE AND MATH (2B)
PROBLEM: Can you make three dimensional shapes from two dimensional shapes?
PREDICTION: ___________________________________________________________
TRACE YOUR COOKIE CUTTERS. NAME THE SHAPES YOU ARE USING.
Roll out the playdough. Cut out shapes using cookie cutters. These are two-dimensionalshapes. Show your teacher. After your teacher has seen the shapes, make a three-dimensional model of the shapes and draw what they look like. Have your teacher seeyour final shape.
CONCLUSION: What is the difference between two dimensional and three dimensionalshapes?______________________________________________________________________________________________________________________________________________
Math/Science Nucleus ©1990,2000 23
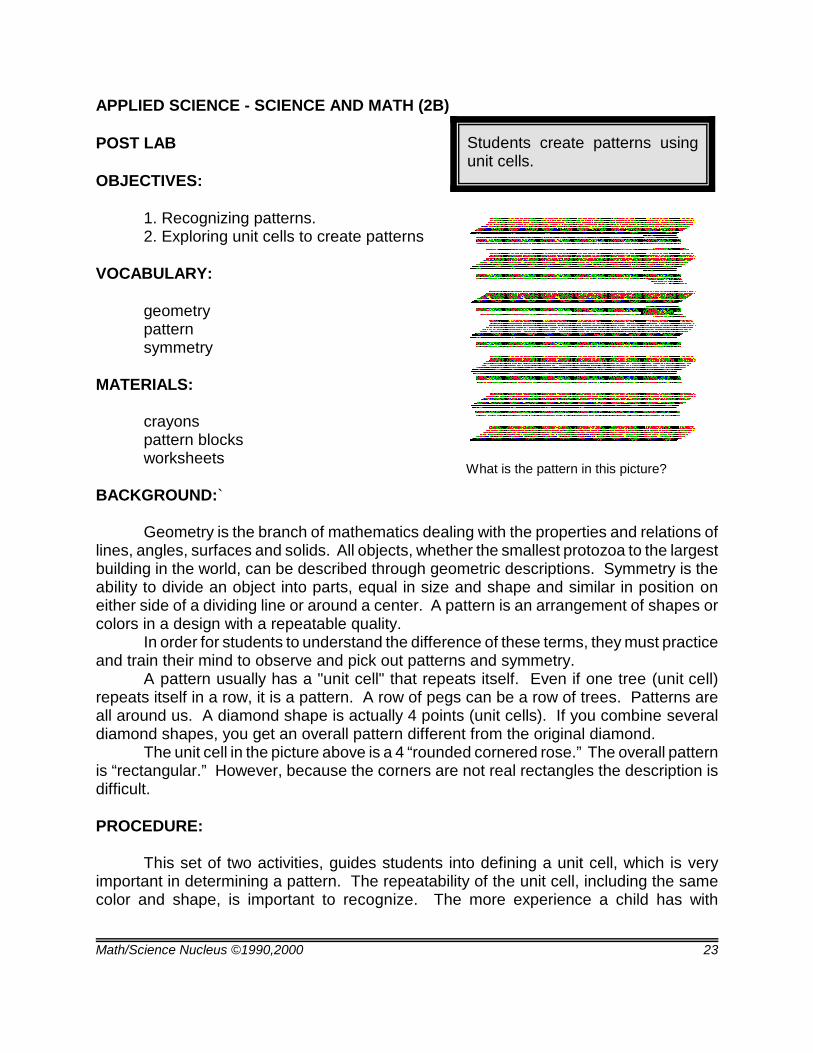
Students create patterns usingunit cells.
What is the pattern in this picture?
APPLIED SCIENCE - SCIENCE AND MATH (2B)
POST LAB
OBJECTIVES:
1. Recognizing patterns.2. Exploring unit cells to create patterns
VOCABULARY:
geometrypatternsymmetry
MATERIALS:
crayons pattern blocksworksheets
BACKGROUND:`
Geometry is the branch of mathematics dealing with the properties and relations oflines, angles, surfaces and solids. All objects, whether the smallest protozoa to the largestbuilding in the world, can be described through geometric descriptions. Symmetry is theability to divide an object into parts, equal in size and shape and similar in position oneither side of a dividing line or around a center. A pattern is an arrangement of shapes orcolors in a design with a repeatable quality.
In order for students to understand the difference of these terms, they must practiceand train their mind to observe and pick out patterns and symmetry. A pattern usually has a "unit cell" that repeats itself. Even if one tree (unit cell)repeats itself in a row, it is a pattern. A row of pegs can be a row of trees. Patterns areall around us. A diamond shape is actually 4 points (unit cells). If you combine severaldiamond shapes, you get an overall pattern different from the original diamond.
The unit cell in the picture above is a 4 “rounded cornered rose.” The overall patternis “rectangular.” However, because the corners are not real rectangles the description isdifficult.
PROCEDURE:
This set of two activities, guides students into defining a unit cell, which is veryimportant in determining a pattern. The repeatability of the unit cell, including the samecolor and shape, is important to recognize. The more experience a child has with
Math/Science Nucleus ©1990,2000 24
identifying the unit cells the easier it becomes.
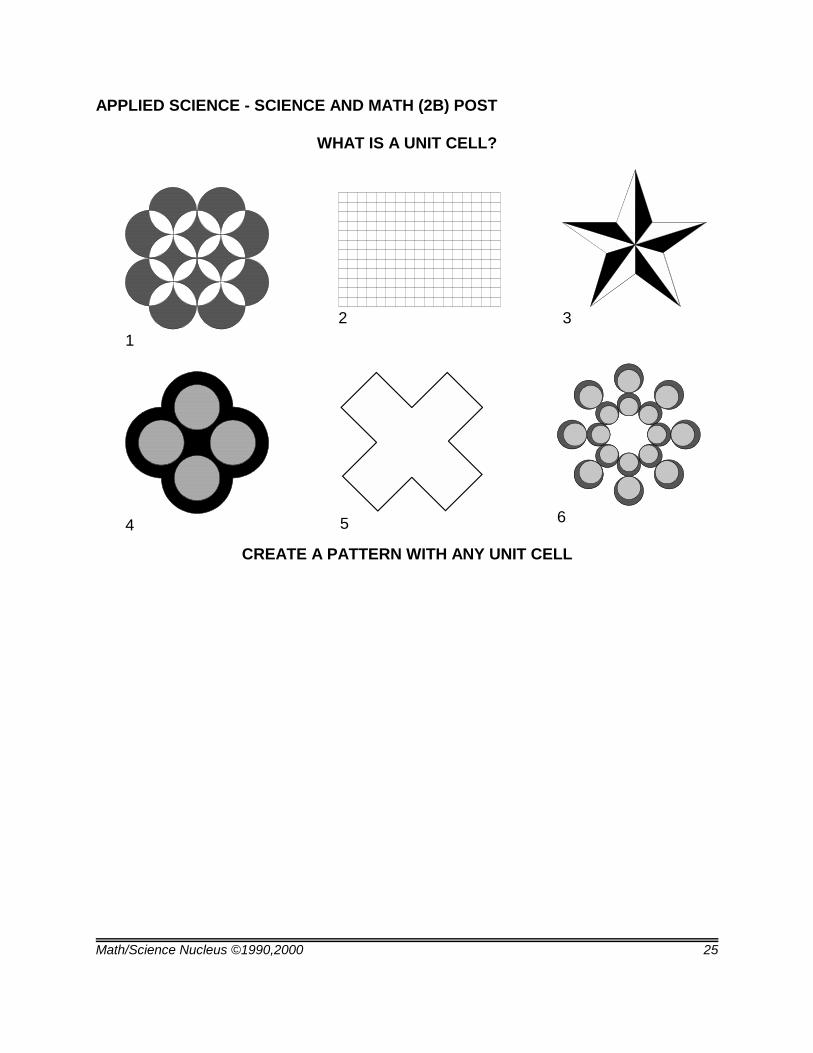
1. Give each student a worksheet and crayons. Instruct them to color or outline theunit cell on the worksheet. (Answers: 1. circle; 2. square; 3. triangle; 4. circle; 5. square;and 6. circle.)
After they complete that see if they can create a pattern with any unit cell theydecide on. Notice that we don’t write in the colors for the unit cell, let them decide if colorhelps determine the unit cell (it does!). This will give students practice on keeping the unitcell the same.
2. When students complete the worksheet give them one box of pattern blocks pergroup. Instruct students to work together to create a pattern with one or more unit cells.Let their creativity go. Group cooperation is important.
Math/Science Nucleus ©1990,2000 25
5
3
4 6
12
APPLIED SCIENCE - SCIENCE AND MATH (2B) POST
WHAT IS A UNIT CELL?
CREATE A PATTERN WITH ANY UNIT CELL
Math/Science Nucleus ©1990,2000 26
Students classify differentobjects into their symmetry.
APPLIED SCIENCE - SCIENCE AND MATH (2C)
PRE LAB
OBJECTIVES:
1. Investigating symmetry.2. Comparing symmetry of geometric shapes.
VOCABULARY:
bilateralcubichexagonalpatternpentagonalradialsymmetry
MATERIALS:
Googolplex
BACKGROUND:
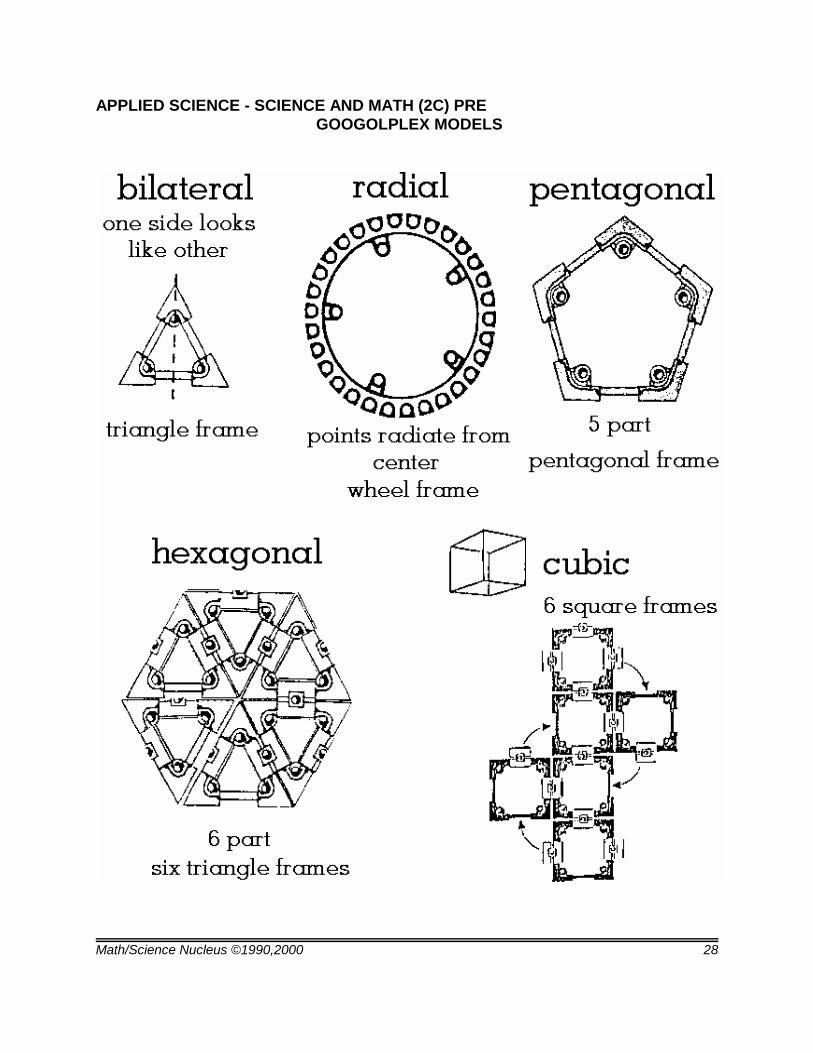
Symmetry refers to, "the correspondence in size, form, and arrangement of partson opposite sides of a plane, line, or point." If you look at the word in the dictionary, youwill notice a list of definitions for subjects as diverse as geometry, botany, physiology,chemistry, and geology. Symmetry can refer to two dimensional ans well as threedimensional objects. Some objects can have one or more symmetries. In naturesymmetry is not always perfect, but the terms are still applicable.
Bilateral symmetry is when one side looks like the other or is a mirror imagine.Humans are bilaterally symmetrical . If you make an imaginary line from the head to theground; one side basically looks like the other. However if you look at the organs insidea human, they are not bilaterally arranged.
Radial symmetry is when all segments are equal that radiate from a point. A ballor a circle has radial symmetry. Note that all objects that have radial symmetry also havebilateral symmetry.
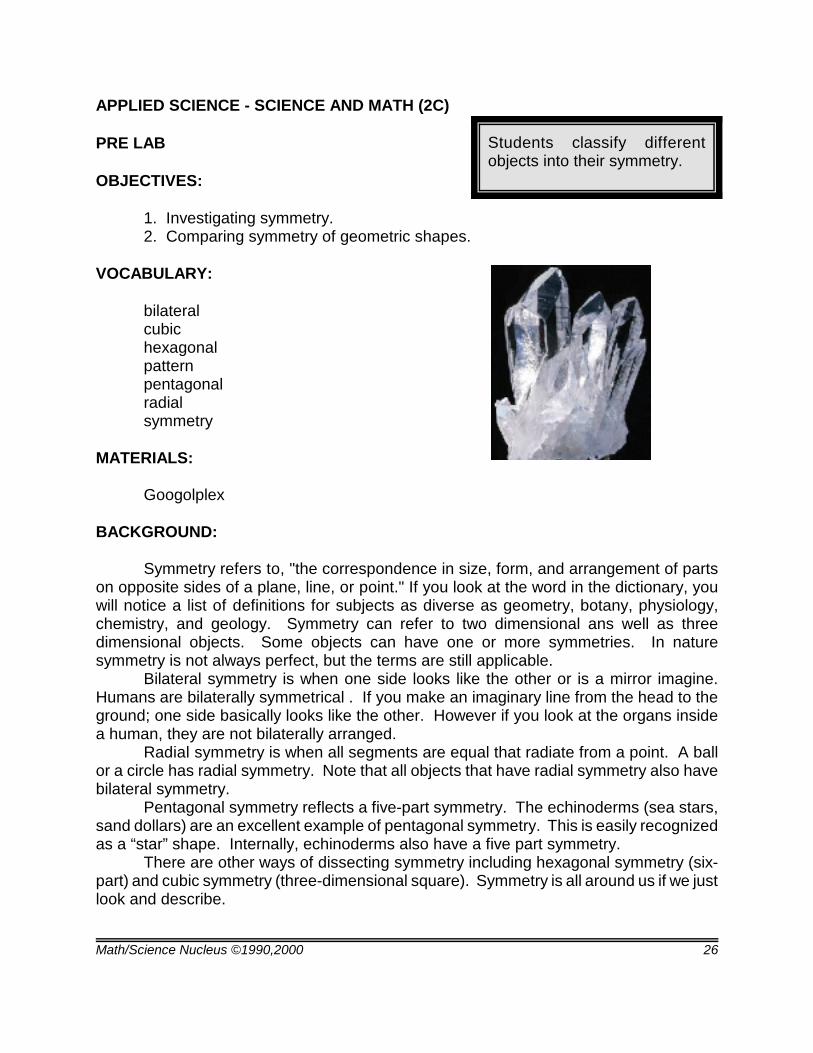
Pentagonal symmetry reflects a five-part symmetry. The echinoderms (sea stars,sand dollars) are an excellent example of pentagonal symmetry. This is easily recognizedas a “star” shape. Internally, echinoderms also have a five part symmetry.
There are other ways of dissecting symmetry including hexagonal symmetry (six-part) and cubic symmetry (three-dimensional square). Symmetry is all around us if we justlook and describe.
Math/Science Nucleus ©1990,2000 27
PROCEDURE:
1. The objectives of this week's activities are to illustrate the difference betweensymmetry and patterns, especially in nature. The first exposure to these concepts will givestudents a new vocabulary power to describe and observe the world. Go over each of theabove vocabulary words and illustrate with examples. Reinforce the types of symmetry sochildren can learn by experience. Listed below are a few ideas.
2. Use the Googolplex to illustrate the different types of symmetry. Includebilateral, radial, pentagonal, hexagonal, and cubic. Construct these examples (using thebook as a guide) before class or have students follow the patterns in the worksheet. Drawthe different types of symmetry on the board and have students think of examples. Theymight also try to construct their own geometric shapes. Reinforce the words using a modeland do not expect students to learn with just one introduction.
3. Students will continually use these terms throughout this program. This is onlyan introduction to symmetry. Start them off right!
The worksheet will help illustrate different types of symmetry using models. Lookat your worksheet and record the appropriate symmetry.
1. bilateral symmetry = one side looks like other2. radial symmetry = radiate from a point3. pentagonal symmetry = 5 part symmetry4. hexagonal symmetry = 6 part symmetry5. cubic symmetry = 4 part symmetry
Math/Science Nucleus ©1990,2000 28
APPLIED SCIENCE - SCIENCE AND MATH (2C) PRE GOOGOLPLEX MODELS
Math/Science Nucleus ©1990,2000 29
Students look at symmetryin nature.
APPLIED SCIENCE - SCIENCE AND MATH (2C)
LAB
OBJECTIVES:
1. Comparing symmetry nature.2. Describing organisms.
VOCABULARY:
patternssymmetry
MATERIALS:
Science and Math (2C) or appropriate materialsMagnifier Kit
BACKGROUND:
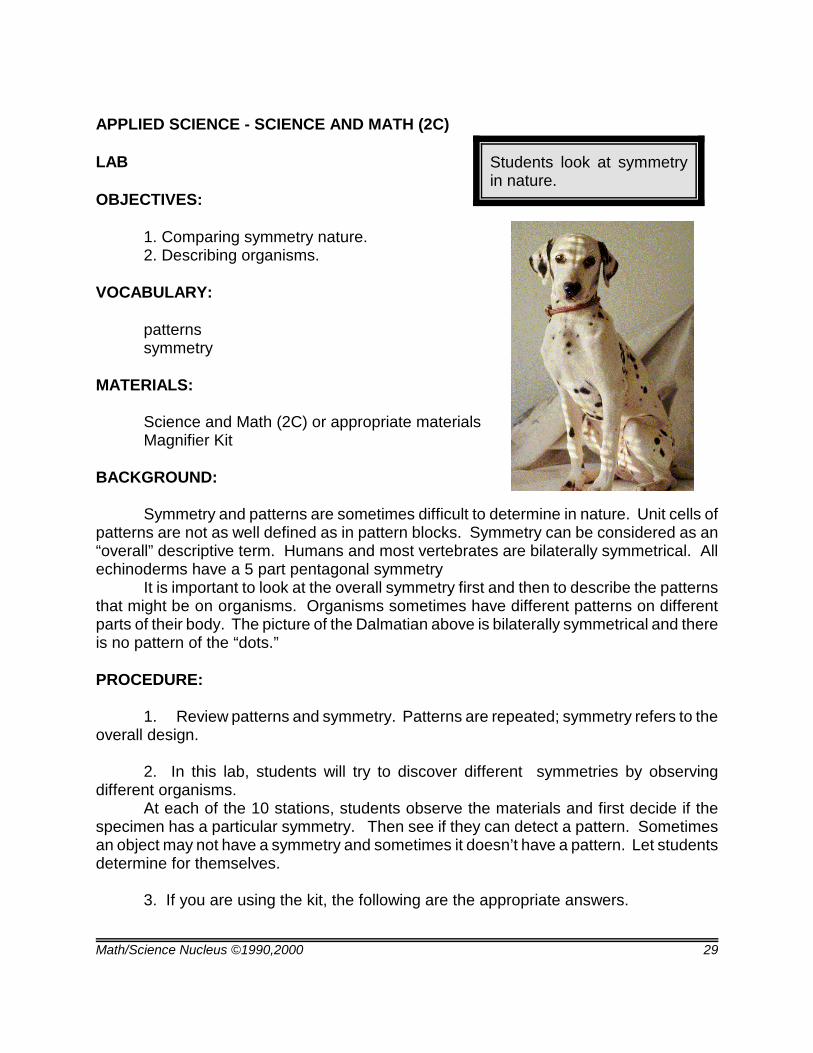
Symmetry and patterns are sometimes difficult to determine in nature. Unit cells ofpatterns are not as well defined as in pattern blocks. Symmetry can be considered as an“overall” descriptive term. Humans and most vertebrates are bilaterally symmetrical. Allechinoderms have a 5 part pentagonal symmetry
It is important to look at the overall symmetry first and then to describe the patternsthat might be on organisms. Organisms sometimes have different patterns on differentparts of their body. The picture of the Dalmatian above is bilaterally symmetrical and thereis no pattern of the “dots.”
PROCEDURE:
1. Review patterns and symmetry. Patterns are repeated; symmetry refers to theoverall design.
2. In this lab, students will try to discover different symmetries by observingdifferent organisms.
At each of the 10 stations, students observe the materials and first decide if thespecimen has a particular symmetry. Then see if they can detect a pattern. Sometimesan object may not have a symmetry and sometimes it doesn’t have a pattern. Let studentsdetermine for themselves.
3. If you are using the kit, the following are the appropriate answers.
Math/Science Nucleus ©1990,2000 30
1. Bubbles: Students should blow just once through the bubble-maker. Make sure this is clearly explained or you will have bubbles all over the room. Bubbleshave radial symmetry. There is no pattern.
2. Sea cookie, sand dollar, and sea star: Have students look closely. Have students observe the pattern with a hand lens. All of these organisms havepentagonal symmetry (5 part). The pattern is of very fine holes throughout the skeletonof the organisms.
3. Glass sponge: The sponge is very delicate and students shouldobserve only. This sponge is made up of silica dioxide (same ingredients as glass). The sponge has bilateral symmetry and has groups of four patterns.
4. Snail shells: These marine snails do not have any symmetry, but it hasa coiled or spiral pattern. This observation might be hard for students, but noticing thespiral pattern is important. The pattern is different than a whorl which is coiled on thesame plane; a spiral is off centered like a staircase.
5. Pyrite: This mineral has a "cubic" symmetry. The symmetry can notbe determined easily, because it is not continuous. This is difficult to see unless youhave a very good specimen.
6. Leaf: Collect a few leaves from outside. If your classroom has a liveplant, it may also be used. Have students look at the veins in the leaves. Many havebilateral symmetry as well as a pattern of veins (dendritic).
7. Coral: Many corals do not have symmetry because they grow inwhatever shape they want. The coral you have is not symmetrical, however, it has apattern of pores all over the skeleton. If you look at the individual pores they have aradial symmetry (may need hand lens or microscope).
8. Quartz: Has a hexagonal symmetry if the crystal is complete. There isno pattern.
9. Bivalves (clams): Please note that this is an entire bivalve and it hasbilateral symmetry. The pattern reflects ridges and spines.
10. Slice of Tree: Notice that it has not perfect radial symmetry. Therings make up its pattern.
Math/Science Nucleus ©1990,2000 31
APPLIED SCIENCE - SCIENCE AND MATH (2C)
PROBLEM: Do different organisms have different symmetries and patterns?
PREDICTION: ___________________________________________________
ITEM SYMMETRY PATTERN
1.
2.
3.
4.
5.
6.
7.
8.
9.
10.
CONCLUSION: Are the patterns and symmetry of different organisms similar? Explain.
_____________________________________________________________
_____________________________________________________________
Math/Science Nucleus ©1990,2000 32
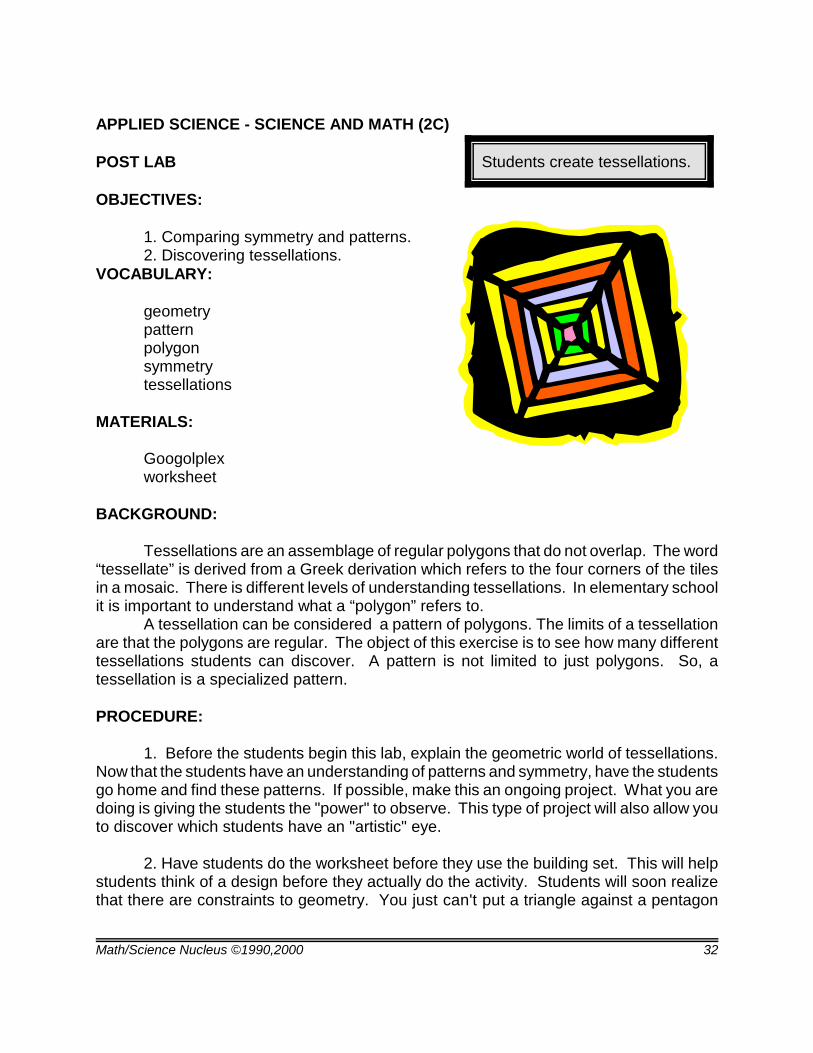
Students create tessellations.
APPLIED SCIENCE - SCIENCE AND MATH (2C)
POST LAB
OBJECTIVES:
1. Comparing symmetry and patterns.2. Discovering tessellations.
VOCABULARY:
geometrypatternpolygonsymmetrytessellations
MATERIALS:
Googolplexworksheet
BACKGROUND:
Tessellations are an assemblage of regular polygons that do not overlap. The word“tessellate” is derived from a Greek derivation which refers to the four corners of the tilesin a mosaic. There is different levels of understanding tessellations. In elementary schoolit is important to understand what a “polygon” refers to.
A tessellation can be considered a pattern of polygons. The limits of a tessellationare that the polygons are regular. The object of this exercise is to see how many differenttessellations students can discover. A pattern is not limited to just polygons. So, atessellation is a specialized pattern.
PROCEDURE:
1. Before the students begin this lab, explain the geometric world of tessellations.Now that the students have an understanding of patterns and symmetry, have the studentsgo home and find these patterns. If possible, make this an ongoing project. What you aredoing is giving the students the "power" to observe. This type of project will also allow youto discover which students have an "artistic" eye.
2. Have students do the worksheet before they use the building set. This will helpstudents think of a design before they actually do the activity. Students will soon realizethat there are constraints to geometry. You just can't put a triangle against a pentagon
Math/Science Nucleus ©1990,2000 33
without constraints on the overall design.
3. Students should each have a building set of Googolplex. Ask them to make a flatpattern. Use the connectors to join the triangles, pentagons, and squares. Remind themthat a pattern is repeatable. They should think of a design before they complete theproject.
Go over the symmetry of each of the pieces. The triangle has a three-partsymmetry, the pentagon has a five part symmetry, and the square has a four partsymmetry. Use the term "tessellation" to refer to the geometric mosaic that the studentsare creating. Remember if they are using a circle in their pattern, it is not a tessellation.
Math/Science Nucleus ©1990,2000 34
APPLIED SCIENCE - SCIENCE AND MATH (2C)
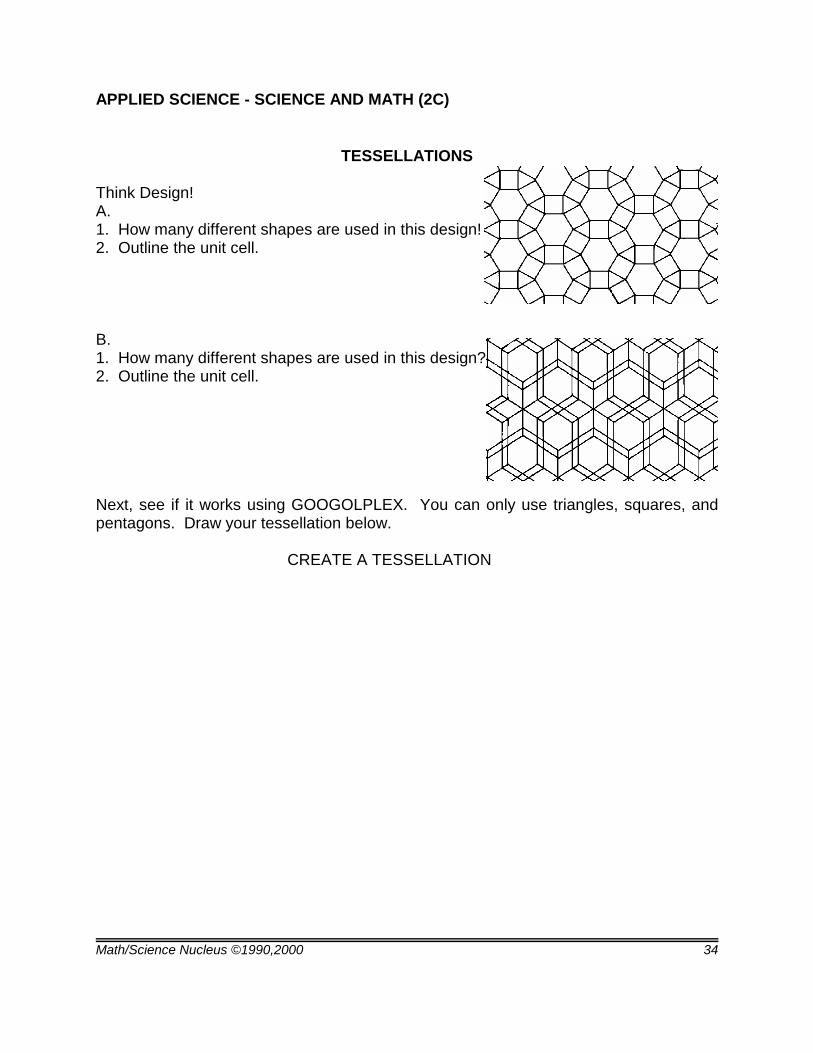
TESSELLATIONS
Think Design!A.1. How many different shapes are used in this design!2. Outline the unit cell.
B.1. How many different shapes are used in this design?2. Outline the unit cell.
Next, see if it works using GOOGOLPLEX. You can only use triangles, squares, andpentagons. Draw your tessellation below.
CREATE A TESSELLATION