Embed Size (px)
Citation preview
SEC Form 17Q – 2Q 2012
SEC Number 66381
File Number _____
ENERGY DEVELOPMENT CORPORATION
(Company’s full Name)
One Corporate Centre Julia Vargas cor. Meralco Ave., Ortigas Center, Pasig City
(Company’s Address)
(632) 755-2332
(Telephone Number)
June 30, 2012
(Quarter Ending)
SEC FORM 17-Q
(Form Type)

SEC Form 17Q – 2Q 2012 2
SECURITIES AND EXCHANGE COMMISSION
SEC FORM 17-Q
QUARTERLY REPORT PURSUANT TO SECTION 17 OF THE SECURITIES
REGULATION CODE AND SRC RULE 17(2)(b) THEREUNDER
1. For the quarterly period ended June 30, 2012
2. Commission identification number: 66381
3. BIR Tax Identification No. 000-169-125-000
4. Exact name of issuer as specified in its charter: ENERGY DEVELOPMENT CORPORATION
5. PHILIPPINES 6. (SEC Use Only)
Province, country or other jurisdiction of Industry Classification Code
Incorporation or organization
7. One Corporate Centre Julia Vargas cor. Meralco Ave.,
Ortigas Center, Pasig City 1605
Address of issuer's principal office Postal Code
8. (632) 755-2332
Issuer's telephone number, including area code:
9. Merritt Road, Fort Bonifacio, Taguig City
Former name, former address and former fiscal year, if changed since last report:
10. Securities registered pursuant to Sections 8 and 12 of the Code, or Sections 4 and 8 of the RSA
Title of each Class Number of shares outstanding
as of June 30, 2012
Common Stock, P1.00 par value 18,750,000,000
Preferred Stock, P0.01 par value 9,375,000,000
11. Are any or all of the securities listed on a Stock Exchange?
Yes [ √ ] No [ ]
If yes, state the name of such Stock Exchange and the class/es of securities listed therein:
Philippine Stock Exchange Common Stock
12. Indicate by check mark whether the registrant:
(a) has filed all reports required to be filed by Section 17 of the Code and SRC Rule 17 thereunder or
Sections 11 of the RSA and RSA Rule 11(a)-1 thereunder, and Sections 26 and 141 of the Corporation
Code of the Philippines, during the preceding twelve (12) months (or for such shorter period the
registrant was required to file such reports)
Yes [ √ ] No [ ]
(b) has been subject to such filing requirements for the past ninety (90) days.
Yes [ √ ] No [ ]

SEC Form 17Q – 2Q 2012
PART 1 FINANCIAL INFORMATION
ITEM 1. FINANCIAL STATEMENTS
Our unaudited consolidated financial statements for the quarter ended June 30, 2012
have been prepared in accordance with Philippine Financial Reporting Standards (PFRS)
and are filed as Annex I of this report.
ITEM 2. MANAGEMENT’S DISCUSSION AND ANALYSIS OF FINANCIAL CONDITION AND RESULTS OF OPERATIONS (“MD & A”) The following is a discussion and analysis of the Company’s consolidated financial
performance for the quarter ended June 30, 2012. The prime objective of this MD&A
is to help the readers understand the dynamics of our Company’s business and the key
factors underlying our financial results. Hence, our MD&A is comprised of a discussion of
our core business and an analysis of the results of operations. This section also focuses on
key statistics from the unaudited financial statements and pertains to risks and uncertainties
relating to the geothermal power industry in the Philippines where we operate up to the
stated reporting period. However, our MD&A should not be considered all inclusive, as it
excludes unknown risks, uncertainties and changes that may occur in the general economic,
political and environment condition after the stated reporting date.
Our MD&A should be read in conjunction with our unaudited consolidated financial
statements and the accompanying notes. All financial information is reported in Philippine
Pesos (PhP) unless otherwise stated.
Any references in this MD&A to “we”, “us”, “our”, “Company” means the Energy
Development Corporation and its subsidiaries.
Additional information about the Company can be found on our corporate website
www.energy.com.ph.
SEC Form 17Q – 2Q 2012 4
The following is a summary of the key sections of this MD&A:
OVERVIEW OF OUR BUSINESS ..............................................................................................5 Principal Products or Services ........................................................................................................ 5
Percentage of sales or revenues contributed by foreign sales ......................................................... 5
Distribution methods of products or services ................................................................................. 6
Competition..................................................................................................................................... 6
Dependence on one or a few major customers and identity of any such major customers ............ 7
Concessions and government share payments ............................................................................7 KEY PERFORMANCE INDICATORS ......................................................................................9 FINANCIAL HIGHLIGHTS .......................................................................................................10
RESULTS OF OPERATIONS ...................................................................................................11 CAPITAL AND LIQUIDITY RESOURCES ............................................................................16 FINANCIAL POSITION ............................................................................................................17
Horizontal and Vertical Analysis of Material Changes as of June 30, 2012 and December 31,
2011........................................................................................................................................... 17
Horizontal and Vertical Analysis of Material Changes as of June 30, 2012 and 2011. ........... 21
DISCUSSION ON THE SUBSIDIARIES .................................................................................27 FG Hydro .................................................................................................................................. 27
Green Core Geothermal Inc. ..................................................................................................... 27
Bac-Man Geothermal Inc. ......................................................................................................... 29
FOREIGN EXCHANGE AND INTEREST RATE EXPOSURE ...........................................30 OTHER MATTERS ....................................................................................................................30 MAJOR STOCKHOLDERS ......................................................................................................31
BOARD OF DIRECTORS ..........................................................................................................32 OFFICERS ...................................................................................................................................32
SEC Form 17Q – 2Q 2012 5
OVERVIEW OF OUR BUSINESS
Principal Products or Services
As of June 30, 2012, the Company operates twelve geothermal power plants in the five
geothermal service contract areas where it is principally involved in:
i. the production of geothermal steam for sale to National Power Corporation (NPC)
pursuant to Steam Sales Agreements (SSAs) and
ii. the generation and sale of electricity through Company-owned geothermal power plants
to NPC and privately-owned distribution utilities (DUs), pursuant to Power Purchase
Agreements (PPAs) and Electricity Sales Agreements (ESAs), respectively.
Starting September 3, 2010, on account of the extended waiver, the Company ceased billing to
NPC after Bacman Geothermal Inc’s (BGI) successful acquisition of the plants from NPC.
Through its 60% equity interest in First Gen Hydro Power Corporation (FG Hydro), the
Company indirectly operates the 120 MW Pantabangan and 12 MW Masiway Hydroelectric
Power Plants, located in Pantabangan, Nueva Ecija Province, Central Luzon. The power plants
supply electricity into the Luzon grid to service the consumption of its customers which include
the Wholesale Electricity Spot Market (WESM), distribution utilities covered by bilateral
contract quantities (BCQ) and the National Grid Corporation of the Philippines (NGCP) for
ancillary services.
For the Company’s third business segment, Energy Development Corporation (EDC) provides
drilling services to the Lihir Gold Limited in Papua New Guinea.
The Company has evolved into being the country’s premier pure renewable energy play,
possessing interests in geothermal energy and hydro power. For geothermal energy, its expertise
spans the entire geothermal value chain, i.e., from geothermal energy exploration and
development, reservoir engineering and management, engineering design and construction,
environmental management and energy research and development. With FG Hydro, the
Company has not only acquired expertise in hydropower operation and maintenance, but also the
capability to sell power on a merchant basis.
Percentage of sales or revenues contributed by foreign sales
The Company generated P345.2 million from the contract it entered into with Lihir Gold Limited
(LGL) in Papua, New Guinea. This represents 2.2% of the Company’s P15,368.6 million gross
revenues for the first semester of 2012. For the fifth consecutive time, the Company’s contract
with LGL was once again renewed last July 1, 2011 and extended up to December 31, 2012.

SEC Form 17Q – 2Q 2012 6
Distribution methods of products or services
The Company’s 3,636.7 GWh total sales volume comprised of 3,235.3 GWh coming from
electricity production in Leyte, Mindanao, Tongonan I and Palinpinon geothermal power plants;
194.1 GWh in Bac-Man geothermal power plants (BMGPP) and 207.3 GWh (inclusive of 69.1
GWh sold to BGI’s customer) from FG Hydro’s Pantabangan-Masiway hydro power plants.
About 61.0% or 2,218.5 GWh generated by Leyte and Mindanao was sold to NPC. The 1,016.7
GWh generated by Tongonan I, Palinpinon I and II was sold to electric cooperatives and
industrial customers in the Visayas region and the Wholesale Electricity Spot Market (WESM).
BGI purchased 263.3 GWh to serve its contractual obligations to BATELEC and Linde
Philippines. Electricity production of about 207.3 GWh, by FG Hydro’s power plants, was sold
to the distribution utility clients comprised of electric cooperatives in the province of Nueva
Ecija, BGI and the WESM.
The electricity generated by the Company’s geothermal power plants is transmitted to customers
i.e., distribution utilities, electric cooperatives or bulk power customers by the NGCP through its
high voltage backbone system.
FG Hydro generated 207.3 GWh of electricity as of first semester of 2012, of which 97% or
201.8 GWh was delivered to its contracted customers and 3% or 5.5 GWh was sold to the
WESM.
For the first semester of 2012, BGI generated 110.6 GWh, or P520.4 million, which was reported
as testing and commissioning revenues. This was netted off from the Property, Plant and
Equipment (PPE) as required by PAS 16.
Competition
The Company competes with other energy sources used for the production of power, particularly
coal, gas and oil, substantially all of which are imported.
Under the Company’s Geothermal Renewable Energy Service Contracts (GRESCs), it has long-
term exclusive rights to explore, develop, and utilize geothermal steam resources in specific
areas. Substantially all of the Company’s power capacity is sold through various offtake
agreements, such as PPAs for the supply of electricity to NPC and ESAs with DUs. Since most
of these agreements provide for take-or-pay quantities, the Company is not subject to direct
competition. Furthermore, the supply of steam is location-specific, such that each power plant
can only source its fuel from a dedicated nearby steam field.
On May 5, 2010, BGI, the Company’s wholly-owned subsidiary through EDC Geothermal
Corporation, submitted the winning bid of US$28.25 million for PSALM’s auction of the 150
MW BMGPP located in the towns of Bacon, Sorsogon Province and Manito, Albay Province.
The power plants were turned over to BGI in September 2010, and are currently under
rehabilitation to restore capacity and reliability.

SEC Form 17Q – 2Q 2012 7
The only other Philippine company engaged in the production of steam is Chevron Geothermal
Philippines Holdings. Aboitiz Power Corporation, a power distribution and generation company,
successfully bid for the 747 MW Tiwi-Makban geothermal power plant. Multinationals that
currently operate in the Philippines include Korea Electric Power Corporation, Marubeni,
CalEnergy, Tokyo Electric Power Company, AES, and Sumitomo.
Dependence on one or a few major customers and identity of any such major customers
Close to 43.1% of the Company’s total revenues are derived from existing long-term PPAs with
NPC.
Concessions and government share payments
The five geothermal service contract areas where the EDC’s geothermal production steam fields
are located are:
• Tongonan Geothermal Project (expiring in 2031)
• Southern Negros Geothermal Project (expiring in 2031)
• Bacon-Manito Geothermal Project (expiring in 2031)
• Mt. Apo Geothermal Project (expiring in 2042)
Northern Negros Geothermal Project (expiring in 2044)
The Company, through its subsidiaries Green Core Geothermal Inc. and Bac-Man Geothermal
Inc. secured three (3) Geothermal Operating Contracts covering power plant operations:
Tongonan Geothermal Power Plant (with a 25-year contract period expiring in 2037,
renewable for another 25 years)
Palinpinon Geothermal Power Plant (with a 25-year contract period expiring in 2037,
renewable for another 25 years)
Bacon-Manito Geothermal Power Plant (with a 25-year contract period expiring in 2037,
renewable for another 25 years)
The Company also holds service contracts for the following prospect areas:
Geothermal Resource
1. Mt Cabalian Geothermal Project (expiring by 2034)
2. Mt. Labo Geothermal Project (with a five-year pre-development period expiring in 2015,
25-year contract period expiring in 2035)
3. Mainit Geothermal Project (with a five-year pre-development period expiring in 2015,
25-year contract period expiring in 2035)
4. Ampiro Geothermal Project (with a five-year pre-development period expiring in 2017,
25-year contract period expiring in 2037)
5. Mandalagan Geothermal Project (with a five-year pre-development period expiring in

SEC Form 17Q – 2Q 2012 8
2017, 25-year contract period expiring in 2037)
6. Mt. Zion Geothermal Project (with a five-year pre-development period expiring in 2017,
25-year contract period expiring in 2037)
7. Lakewood Geothermal Project (with a five-year pre-development period expiring in
2017, 25-year contract period expiring in 2037)
8. Balingasag Geothermal Project (with a five-year pre-development period expiring in
2017, 25-year contract period expiring in 2037)
Wind Resource
1. Burgos Wind Project (WESC assigned by EDC to EDC Burgos Wind Power
Corporation; pre-development stage expiring in 2012, 25-year contract period expiring in
2034)
2. Pagudpud Wind Project (pre-development stage expiring in 2013, 25-year contract
period expiring in 2035)
3. Camiguin Wind Project (pre-development stage expiring in 2013, 25-year contract
period expiring in 2035)

SEC Form 17Q – 2Q 2012 9
KEY PERFORMANCE INDICATORS
The top five (5) key performance indicators are set forth below:
Ratio
Jun – 12
Jun – 11
Current Ratio 2.07:1 2.25:1
Debt-to-Equity Ratio 1.55:1 1.83:1
Net Debt-to-Equity Ratio 1.20:1 1.42:1
Return on Assets (%) 9.81 (4.24)
Return on Equity (%) 29.36 (11.72)
Current Ratio – Total current assets divided by total current liabilities
This ratio is a rough indication of a company’s ability to pay its short-term obligations.
Generally, a current ratio above 1.00 is indicative of a company’s greater capability to settle
its current obligations.
Debt-to-Equity Ratio – Total interest-bearing debts divided by stockholders’ equity
This ratio expresses the relationship between capital contributed by the creditors and the
owners. The higher the ratio, the greater the risk being assumed by the creditors. A lower
ratio generally indicates greater long-term financial safety.
Net-Debt-to-Equity Ratio – Total interest-bearing debts less cash & cash equivalents
divided by stockholders’ equity
This ratio measures the company’s financial leverage and stability. A negative net debt-to-equity
ratio means that the total of cash and cash equivalents exceeds interest-bearing
liabilities.
Return on Assets – Net income (annual basis) divided by total assets (average)
This ratio indicates how profitable a company is relative to its total assets. This also gives an
idea as to how efficient management is at using its assets to generate earnings.
Return on Equity – Net income (annual basis) divided by total stockholders’ equity (average)
This ratio reveals how much profit a company earned in comparison to the total amount of
shareholder equity found on the balance sheet. A business that has a high return on equity is
more likely to be one that is capable of internally generating cash. For the most part, the
company’s return on equity is compared with an industry average. The company is
considered superior if its return on equity is greater than the industry average.

SEC Form 17Q – 2Q 2012 10
OPERATING REVENUES AND EXPENSES
FINANCIAL HIGHLIGHTS
Net income for the first semester amounted to P5,730.9 million, or a 349.5% turnaraound
from the net loss of P2,296.8 million during the same period in 2011.
The following factors contributed to the increase:
P4,998.6 million impairment loss on property, plant and equipment of NNGP that
was recognized in June 2011;
P1,391.4 million FG Hydro’s revenues from sale of electricity as ancillary services;
and
P1,117.2 million GCGI’s higher revenues from Tongonan I and Palinpinon power
plants as per agreed contracts that became effective in mid-2011 and the additional
power supply agreements that were signed in December 2011.
Net income (loss) is equivalent to 37.3% of total revenues in 2012 as compared to the
(19.6%) from the same period in 2011.
Net income attributable to equity holders of the parent at P4,618.3 million for the first
semester of 2012, was a turnaround of the P2,331.1 million net loss attributable to equity
holders of the parent during the same period in 2011.
The recurring net income generated in the first semester of 2012 increased by 151.2% or
P3,035.0 million to P5,042.7 million from the P2,007.7 million posted during the same
period in 2011. This was mainly attributable to the P2,508.6 million increase in sale of
electricity by FG Hydro and GCGI and the P245.9 million decrease in interest expense.
Recurring net income attributable to equity holders of the parent was posted at
P3,929.9 million, up by 99.2%, as compared to the P1,973.1 million for the first semester
of 2011.
Cash and cash equivalents decreased by 9.9% or P1,237.4 million to P11,256.0 million as of
June 30, 2012 from the P12,493.4 million December 31, 2011 balance. The decrease was
mainly due to the following:
P4,712.1 million property, plant and equipment acquisition and other investments
P3,225.0 million payment of cash dividend;
P3,203.1 million debt servicing; and
P332.3 million payment of income tax.
These were offset by the P9,686.2 million cash generated from operations and
P520.4 million higher proceeds of incidental income from testing of property, plant and
equipment.
SEC Form 17Q – 2Q 2012 11
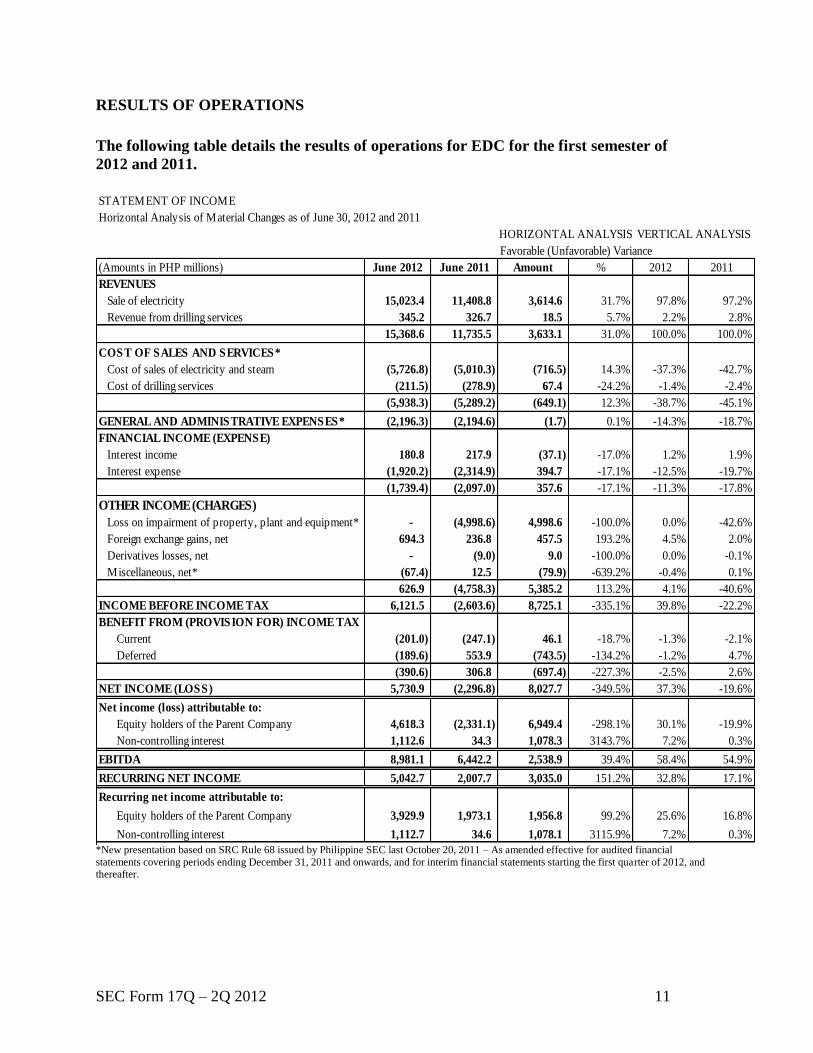
RESULTS OF OPERATIONS
The following table details the results of operations for EDC for the first semester of
2012 and 2011.
STATEMENT OF INCOME
Horizontal Analysis of Material Changes as of June 30, 2012 and 2011
Favorable (Unfavorable) Variance
(Amounts in PHP millions) June 2012 June 2011 Amount % 2012 2011
REVENUES
Sale of electricity 15,023.4 11,408.8 3,614.6 31.7% 97.8% 97.2%
Revenue from drilling services 345.2 326.7 18.5 5.7% 2.2% 2.8%
15,368.6 11,735.5 3,633.1 31.0% 100.0% 100.0%
COST OF SALES AND SERVICES*
Cost of sales of electricity and steam (5,726.8) (5,010.3) (716.5) 14.3% -37.3% -42.7%
Cost of drilling services (211.5) (278.9) 67.4 -24.2% -1.4% -2.4%
(5,938.3) (5,289.2) (649.1) 12.3% -38.7% -45.1%
GENERAL AND ADMINISTRATIVE EXPENSES* (2,196.3) (2,194.6) (1.7) 0.1% -14.3% -18.7%
FINANCIAL INCOME (EXPENSE)
Interest income 180.8 217.9 (37.1) -17.0% 1.2% 1.9%
Interest expense (1,920.2) (2,314.9) 394.7 -17.1% -12.5% -19.7%
(1,739.4) (2,097.0) 357.6 -17.1% -11.3% -17.8%
OTHER INCOME (CHARGES)
Loss on impairment of property, plant and equipment* - (4,998.6) 4,998.6 -100.0% 0.0% -42.6%
Foreign exchange gains, net 694.3 236.8 457.5 193.2% 4.5% 2.0%
Derivatives losses, net - (9.0) 9.0 -100.0% 0.0% -0.1%
Miscellaneous, net* (67.4) 12.5 (79.9) -639.2% -0.4% 0.1%
626.9 (4,758.3) 5,385.2 113.2% 4.1% -40.6%
INCOME BEFORE INCOME TAX 6,121.5 (2,603.6) 8,725.1 -335.1% 39.8% -22.2%
BENEFIT FROM (PROVISION FOR) INCOME TAX
Current (201.0) (247.1) 46.1 -18.7% -1.3% -2.1%
Deferred (189.6) 553.9 (743.5) -134.2% -1.2% 4.7%
(390.6) 306.8 (697.4) -227.3% -2.5% 2.6%
NET INCOME (LOSS) 5,730.9 (2,296.8) 8,027.7 -349.5% 37.3% -19.6%
Net income (loss) attributable to:
Equity holders of the Parent Company 4,618.3 (2,331.1) 6,949.4 -298.1% 30.1% -19.9%
Non-controlling interest 1,112.6 34.3 1,078.3 3143.7% 7.2% 0.3%
EBITDA 8,981.1 6,442.2 2,538.9 39.4% 58.4% 54.9%
RECURRING NET INCOME 5,042.7 2,007.7 3,035.0 151.2% 32.8% 17.1%
Recurring net income attributable to:
Equity holders of the Parent Company 3,929.9 1,973.1 1,956.8 99.2% 25.6% 16.8%
Non-controlling interest 1,112.7 34.6 1,078.1 3115.9% 7.2% 0.3%
HORIZONTAL ANALYSIS VERTICAL ANALYSIS
*New presentation based on SRC Rule 68 issued by Philippine SEC last October 20, 2011 – As amended effective for audited financial
statements covering periods ending December 31, 2011 and onwards, and for interim financial statements starting the first quarter of 2012, and thereafter.

SEC Form 17Q – 2Q 2012 12
YTD June 30, 2012 vs. YTD June 30, 2011
Revenues
Total revenues for the period ended June 30, 2012 increased by 31.0% or P3,633.1 million to
P15,368.6 million from P11,735.5 million in 2011.
Sale of electricity
Revenues from sale of electricity increased by 31.7% or P3,614.6 million to
P15,023.4 million in the first semester of 2012 from P11,408.8 million during the same
period in 2011. The increase in revenue was primarily due to the following:
P1,391.4 million FG Hydro’s revenues from sale of electricity as ancillary
services;
P1,308.2 million fresh contribution of BGI’s revenues coming from its PSAs; and
P1,117.2 million GCGI’s higher revenues from Tongonan I and Palinpinon power plants
as per agreed contracts that became effective in mid-2011 and the additional power
supply agreements that were signed in December 2011.
Revenue from drilling services
Revenue from drilling services increased by 5.7% or P18.5 million to P345.2 million in
the first semester of 2012 from P326.7 million during the same period in 2011. The
favorable variance was attributed to higher dollar revenues in 2012, i.e. US$8.1 million
versus the US$7.5 million as of June 2012 and June 2011, respectively. There were 23
non-revenue days reported in 2011 for the repair of Rig 11.
This was offset by lower average exchange rate by P0.791/US$1 (YTD June
2012=P42.697/US$1 vs. YTD June 2011=P43.488/US$1).
Cost of Sales and Services
Cost of sales and services increased by 12.3% or P649.1 million to P5,938.3 million in the first
semester of 2012 from P5,289.2 million during the same period in 2011.
Cost of sales of electricity and steam
Cost of sales of electricity and steam increased by 14.3% or P716.5 million to
P5,726.8 million in the first semester of 2012 from P5,010.3 million during the same
period in 2011 primarily due to BGI’s cost of replacement power.
Cost of drilling services
Cost of drilling services decreased by 24.2% or P67.4 million to P211.5 million in the
first semester of 2012 from P278.9 million during the same period in 2011 mainly due to
the major repair of Rig 11 undertaken in 2011.

SEC Form 17Q – 2Q 2012 13
Financial Income (Expenses)
Financial expenses-net decreased by 17.1% or P357.6 million to P1,739.4 million in the first
semester of 2012 from P2,097.0 million during the same period in 2011 due to the lower interest
charges on refinanced loans.
Interest income
Interest income decreased by 17.0% or P37.1 million to P180.8 million as of June 2012
from P217.9 million during the same period in 2011. The unfavorable variance was
mainly contributed by lower monthly average investible funds (YTD June 2012 =
P9.96 billion vs. YTD June 2011 = P14.78 billion).
Interest expense
Interest expense decreased by 17.1% or P394.7 million to P1,920.2 million as of June
2012 from P2,314.9 million during the same period in 2011. The favorable variance is
due to lower interest charges on refinanced loans.
Other Income (Charges)
Other income for the first semester amounted to P626.9 million, or a 113.2% improvement from
the other charges of P4,758.3 million in June 2011, primarily due to the absence of any provision
for impairment in 2012.
Loss on impairment of property, plant and equipment
Impairment loss on property, plant and equipment of NNGP amounting to
P4,998.6 million was recognized in June 2011 based on the result of the technical
assessment of the Northern Negros steam resource.
Foreign exchange gains (losses) - net
Net foreign exchange gains increased by P457.5 million, or 193.2%, to P694.3 million
from P236.8 million in 2011. The favorable variance was brought about by appreciation
of the peso against the US dollar.
The comparative foreign exchange rates against the USD were as follows:
JPY:US$ PHP:US$
December 31, 2010 81.659 43.840
June 30, 2011 80.473 43.330
December 31, 2011 77.912 43.840
June 30, 2012 79.447 42.120

SEC Form 17Q – 2Q 2012 14
Derivatives gain (loss) - net
The derivative loss as of June 30, 2011 amounting to P9.0 million came from the non-
deliverable forward (NDF) transactions for US dollar entered into with various banks.
Miscellaneous – net
The Company recognized miscellaneous charges – net of P67.4 million in June 2012
compared to miscellaneous income – net of P12.5 million in June 2011 mainly due to the
P114.7 million loss on debt extinguishment from the P3,108.0 million fixed rate
corporate notes in April 2012 and the P18.0 million lower gain on sale of obsolete
materials and supplies inventories and surplus assets. These were offset by the
P63.6 million recovery of allowance for impairment of NNGP power plant recognized in
2012.
Provision for Income Tax
The Company’s current tax expense decreased by 18.7% or P46.1 million to P201.0 million in
June 30, 2012 from P247.1 million in June 30, 2011. The favorable variance was due to the
Parent Company’s lower taxable income on steam and electricity operations mainly contributed
by the drop in revenues caused by the decrease in average steam price of Palinpinon and
Tongonan 1 and the absence of NNGP's revenues in 2012 (P89.7 million).
These were offset by:
Absence in 2012 of the additional deductible realized forex loss on full settlement of
various JBIC (OECF) loans in April 2011 and June 2011 (P24.0 million); and
BGI’s current tax expense due to its revenues from electricity (P20.0 million).
Deferred tax expense of P189.6 million in June 2012, or a 134.2% increase from the
P553.9 million deferred tax income in June 2011. The variance was primarily contributed by the
following:
Absence in 2012 of the deferred tax asset on provision for full impairment of NNGP's
PPE recognized in June 2011 (P499.9 million);
Parent Company’s deferred taxable income of P873.0 million in 2012 versus deferred
taxable loss of P148.8 million in 2011 mainly attributed to higher unrealized foreign
exchange gains on the realignment of foreign loans coupled with lower provision for
doubtful accounts on overdue receivables and impairment of non-moving inventory
materials (P107.4 million); and
GCGI’s deferred tax liability on the application of NOLCO (P119.7 million).
Net Income
As a result of the foregoing, the Company’s net income of P5,730.9 million for the first semester
of 2012 was an improvement over the P2,296.8 million net loss for the first semester of 2011.
Net income (loss) is equivalent to 37.3% of total revenues in 2012 as compared to the (19.6%) in
2011.

SEC Form 17Q – 2Q 2012 15
Net income attributable to equity holders of the parent at P4,618.3 million for the first semester
of 2012 was an improvement of the net loss attributable to equity holders of the parent at
P2,331.1 million during the same period in 2011.

SEC Form 17Q – 2Q 2012 16
CAPITAL AND LIQUIDITY RESOURCES
As of the quarter ended
(in millions of pesos)
Q2
2012
Q2
2011 YoY change
Balance Sheet Data
Total Assets …………………………… 91,939.5 84,277.4 9.1%
Total Liabilities………………………... 59,817.3 57,533.1 4.0%
Total Stockholder’s Equity …………… 32,122.2 26,744.3 20.1%
The Company’s assets as of June 30, 2012 amounted to P91,939.5 million, 9.1% higher as
compared to the P84,277.4 million level as of June 30, 2011.

SEC Form 17Q – 2Q 2012 17
FINANCIAL POSITION
Horizontal and Vertical Analysis of Material Changes as of June 30, 2012 and
December 31, 2011. STATEMENT OF FINANCIAL POSITION
Analysis of Material Changes as of June 30, 2012 and December 31, 2011
(Amounts In PHP millions) June 2012 Dec. 2011 Amount % 2012 2011
ASSETS
Current Assets
Cash and cash equivalents 11,256.0 12,493.4 (1,237.4) -9.9% 12.2% 13.9%
Trade and other receivables 3,718.9 3,411.3 307.6 9.0% 4.0% 3.8%
Available-for-sale (AFS) investments 140.8 673.9 (533.1) -79.1% 0.2% 0.7%
Parts and supplies inventories 3,271.8 3,355.8 (84.0) -2.5% 3.6% 3.7%
Other current assets 1,196.5 741.9 454.6 61.3% 1.3% 0.8%
Total Current Assets 19,584.0 20,676.3 (1,092.3) -5.3% 21.3% 23.0%
Noncurrent Assets
Property, plant and equipment 59,180.7 57,676.9 1,503.8 2.6% 64.4% 64.1%
Intangible assets 4,708.0 4,705.2 2.8 0.1% 5.1% 5.2%
Deferred tax assets 1,231.0 1,420.7 (189.7) -13.4% 1.3% 1.6%
Exploration and evaluation assets 1,490.1 1,087.1 403.0 37.1% 1.6% 1.2%
Other noncurrent assets 5,745.7 4,451.6 1,294.1 29.1% 6.2% 4.9%
Total Noncurrent Assets 72,355.5 69,341.5 3,014.0 4.3% 78.7% 77.0%
TOTAL ASSETS 91,939.5 90,017.8 1,921.7 2.1% 100.0% 100.0%
LIABILITIES AND EQUITY
LIABILITIES
Current Liabilities
Trade and other payables 7,624.8 6,704.1 920.7 13.7% 8.3% 7.4%
Income tax payable 36.9 18.7 18.2 97.3% 0.0% 0.0%
Due to related parties 45.8 60.1 (14.3) -23.8% 0.0% 0.1%
Current portion of:
Long-term debts 1,615.6 2,249.5 (633.9) -28.2% 1.8% 2.5%
Royalty fee payable 142.7 287.6 (144.9) -50.4% 0.2% 0.3%
Total Current Liabilities 9,465.8 9,320.0 145.8 1.6% 10.3% 10.4%
Noncurrent Liabilities
Long-term debts - net of current portion 48,273.5 49,240.1 (966.6) -2.0% 52.5% 54.7%
Net retirement and other post-employment
benefits 1,234.9 1,054.2 180.7 17.1% 1.3% 1.2%
Provisions and other long-term liabilities 793.5 756.8 36.7 4.8% 0.9% 0.9%
Derivative liabilities 49.6 - 49.6 100.0% 0.1% 0.1%
Total Noncurrent Liabilities 50,351.5 51,051.1 (699.6) -1.4% 54.8% 56.7%
EQUITY
Equity Attributable to Equity Holders of the Parent
Preferred stock 93.8 93.8 - 0.0% 0.1% 0.1%
Common stock 18,750.0 18,750.0 - 0.0% 20.4% 20.8%
Common stock in employee trust account (372.3) (372.3) - 0.0% -0.3% -0.4%
Additional paid-in capital 6,267.0 6,267.0 - 0.0% 6.8% 7.0%
Equity reserve (3,706.4) (3,706.4) - 0.0% -3.9% -4.1%
Net accumulated unrealized gain on AFS
investments 89.6 91.8 (2.2) -2.4% 0.1% 0.1%
Retained earnings 9,040.5 6,304.7 2,735.8 43.4% 9.8% 7.0%
Cumulative translation adjustment (27.6) 0.6 (28.2) -4700.0% 0.0% 0.0%
30,134.6 27,429.2 2,705.4 9.9% 32.8% 30.5%
Non-controlling interest 1,987.6 2,217.5 (229.9) -10.4% 2.2% 2.5%
Total Equity 32,122.2 29,646.7 2,475.5 8.4% 34.9% 32.9%
TOTAL LIABILITIES AND EQUITY 91,939.5 90,017.8 1,921.7 2.1% 100.0% 100.0%
HORIZONTAL VERTICAL
Increase (Decrease)

SEC Form 17Q – 2Q 2012 18
Assets
Cash and cash equivalents
The 9.9% or P1,237.4 million decrease to P11,256.0 million as of June 30, 2012 from the
P12,493.4 million December 31, 2011 balance was mainly due to the following:
P4,712.1 million property, plant and equipment acquisition and other investments
P3,225.0 million payment of cash dividend;
P3,203.1 million debt servicing; and
P332.3 million payment of income tax.
These were offset by the P9,686.2 million cash generated from operations and
P520.4 million higher proceeds of incidental income from testing of property, plant and
equipment.
Trade and other receivables
Trade and other receivables increased by 9.0% or P307.6 million to P3,718.9 million as of
June 30, 2012 from the P3,411.3 million balance as of December 31, 2011 mainly due to
BGI’s revenues and increase in GCGI revenues for the period.
Available-for-sale (AFS) investments
AFS investments decreased by 79.1% or P533.1 million to P140.8 million as of
June 30, 2012 from the P673.9 million balance in December 2011 due to the P488.3 million
reclassification to other non-current assets of ROP bonds maturing beyond 2013.
Other current assets
This account increased by 61.3% or P454.6 million to P1,196.5 million as of June 30, 2012
from the P741.9 million balance in December 2011 primarily due to the Parent Company’s
higher prepaid insurance on industrial all risk of P195.7 million and prepaid real property
taxes of P110.2 million. The increase was also caused by GCGI’s higher withholding tax
certificates of P68.8 million and prepaid insurance of P55.8 million.
Deferred tax assets
This account decreased by 13.4% or P189.7 million to P1,231.0 million as of June 30, 2012
from the P1,420.7 million balance as of December 31, 2011 mainly due to the Parent
Company’s P100.8 million lower recognition of deferred tax assets on unrealized forex gains
on translation of long-term foreign loans and GCGI’s P120.4 million application of NOLCO
to its taxable income for the period. These were offset by BGI’s P52.0 million recognized
deferred tax asset due to testing and commissioning revenues charged against PPE.
SEC Form 17Q – 2Q 2012 19
Exploration and evaluation assets
This account increased by 37.1% or P403.0 million to P1,490.1 million as of June 30, 2012
from the balance of P1,087.1 million as of December 31, 2011 mainly due to the
expenditures for the exploration activities in Bacman Rangas/Kayabon and Tanawon areas.
Other noncurrent assets
This account increased by 29.1% or P1,294.1 million to P5,745.7 million as of June 30, 2012
from the P4,451.6 million balance as of December 31, 2011 mainly due to the following:
P630.5 million increase in Input VAT;
P488.3 million reclassification from current AFS investment account of ROP bonds
maturing beyond 2013; and
P95.7 million investment in shares.
Liabilities
Trade and other payables
This account increased by 13.7% or P920.7 million to P7,624.8 million as of June 30, 2012
from the P6,704.1 million balance as of December 31, 2011 mainly due to the P738.2 million
increase in BGI’s accounts payable arising from purchases of electricity from WESM and.
P213.9 million increase in FG Hydro’s accounts payable.
Income tax payable
This account increased by 97.3% or P18.2 million, to P36.9 million as of June 30, 2012 from
the P18.7 million balance as of December 31, 2011 arising from the Parent Company’s
taxable income for the period.
Due to related parties
This account decreased by 23.8%, or P14.3 million, to P45.8 million as of June 30, 2012
from the P60.1 million balance as of December 31, 2011 mainly due to the Parent
Company’s partial settlement of its liabilities.
Long-term debts - current portion
Long-term debts - current portion decreased by 28.2% or P633.9 million, to P1,615.6 million
as of June 30, 2012 from the P2,249.5 million balance at year-end 2011 primarily due to
P1,534.9 million prepayment of the FCRN loans series 1, 2 & 3 and P20.3 million settlement
of outstanding balance of OECF 8th yen loan. These were offset by the P712.9 million,
P117.9 million and P64.9 million of this year’s current portion of U$175 syndicated loan,
IFC B loan and FXCN loan tranche 1 & 2, respectively.
SEC Form 17Q – 2Q 2012 20
Royalty fee payable - current portion
Royalty fee payable decreased by 50.4% or P144.9 million, to P142.7 million as of
June 30, 2012 from the P287.6 million balance at year-end 2011 due to the payment for the
period.
Net retirement and other post-employment benefits
This account increased by 17.1% or P180.7 million to P1,234.9 million as of June 30, 2012
from the P1,054.2 million balance as of December 31, 2011 due to the accrual of retirement
benefits for the period.
Derivative liabilities – non current
The account balance of P49.6 million as of June 30, 2012 is the fair value of the cross-
currency swaps designated as accounting hedges.
Retained earnings
Retained earnings increased by 43.4% or P2,735.8 million, to P9,040.5 million as of
June 30, 2012 from P6,304.7 million as of December 31, 2011 mainly due to the
P4,618.3 million net income for the first semester of 2012 offset by the P1,882.5 million
payment of cash dividend.
Non-controlling interest
Non-controlling interest decreased by 10.4% or P229.9 million to P1,987.6 million as of
June 30, 2012 from P2,217.5 million balance as of December 31, 2011 mainly due to the
P1,342.5 million payment of cash dividend offset by the P1,112.6 million net income for the
first semester of 2012.

SEC Form 17Q – 2Q 2012 21
Horizontal and Vertical Analysis of Material Changes as of June 30, 2012 and 2011.
STATEMENT OF FINANCIAL POSITION
Analysis of Material Changes as of June 30, 2012 and 2011
(Amounts In PHP millions) June 2012 June 2011 Amount % 2012 2011
ASSETS
Current Assets
Cash and cash equivalents 11,256.0 10,900.4 355.6 3.3% 12.2% 12.9%
Trade and other receivables 3,718.9 2,580.4 1,138.5 44.1% 4.0% 3.1%
Available-for-sale (AFS) investments 140.8 685.6 (544.8) -79.5% 0.2% 0.8%
Parts and supplies inventories 3,271.8 3,330.2 (58.4) -1.8% 3.6% 4.0%
Derivative assets - 63.2 (63.2) -100.0% 0.0% 0.1%
Other current assets 1,196.5 1,251.1 (54.6) -4.4% 1.3% 1.5%
Total Current Assets 19,584.0 18,810.9 773.1 4.1% 21.3% 22.3%
Noncurrent Assets
Property, plant and equipment 59,180.7 54,607.9 4,572.8 8.4% 64.4% 64.8%
Intangible assets 4,708.0 4,708.0 - 0.0% 5.1% 5.6%
Deferred tax assets 1,231.0 1,429.4 (198.4) -13.9% 1.3% 1.7%
Exploration and evaluation assets 1,490.1 1,030.8 459.3 44.6% 1.6% 1.2%
Other noncurrent assets 5,745.7 3,690.4 2,055.3 55.7% 6.2% 4.4%
Total Noncurrent Assets 72,355.5 65,466.5 6,889.0 10.5% 78.7% 77.7%
TOTAL ASSETS 91,939.5 84,277.4 7,662.1 9.1% 100.0% 100.0%
LIABILITIES AND EQUITY
LIABILITIES
Current Liabilities
Trade and other payables 7,624.8 5,997.5 1,627.3 27.1% 8.3% 7.1%
Income tax payable 36.9 78.2 (41.3) -52.8% 0.0% 0.1%
Due to related parties 45.8 124.7 (78.9) -63.3% 0.0% 0.1%
Derivative liabilities - 39.2 (39.2) -100.0% 0.0% 0.0%
Current portion of:
Long-term debts 1,615.6 1,833.0 (217.4) -11.9% 1.8% 2.2%
Royalty fee payable 142.7 295.9 (153.2) -51.8% 0.2% 0.4%
Total Current Liabilities 9,465.8 8,368.5 1,097.3 13.1% 10.3% 9.9%
Noncurrent Liabilities
Long-term debts - net of current portion 48,273.5 47,091.9 1,181.6 2.5% 52.5% 55.9%
Royalty fee payable - net of current portion - 133.7 (133.7) -100.0% 0.0% 0.2%
Net retirement and other post-employment benefits 1,234.9 1,370.1 (135.2) -9.9% 1.3% 1.6%
Provisions and other long-term liabilities 793.5 568.9 224.6 39.5% 0.9% 0.8%
Derivative liabilities 49.6 - 49.6 100.0% 0.1% 0.1%
Total Noncurrent Liabilities 50,351.5 49,164.6 1,186.9 2.4% 54.8% 58.3%
EQUITY
Equity Attributable to Equity Holders of the Parent
Preferred stock 93.8 93.8 - 0.0% 0.1% 0.1%
Common stock 18,750.0 18,750.0 - 0.0% 20.4% 22.2%
Common stock in employee trust account (372.3) (377.5) 5.2 -1.4% -0.3% -0.4%
Additional paid-in capital 6,267.0 6,265.6 1.4 0.0% 6.8% 7.4%
Equity reserve (3,706.4) (3,706.4) - 0.0% -3.9% -4.4%
Net accumulated unrealized gain on AFS investments 89.6 106.8 (17.2) -16.1% 0.1% 0.1%
Retained earnings 9,040.5 4,140.8 4,899.7 118.3% 9.8% 4.9%
Cumulative translation adjustment (27.6) 1.4 (29.0) -2071.4% 0.0% 0.0%
30,134.6 25,274.5 4,860.1 19.2% 0.0% 30.0%
Non-controlling Interest 1,987.6 1,469.8 517.8 35.2% 2.2% 1.7%
Total Equity 32,122.2 26,744.3 5,377.9 20.1% 34.9% 31.7%
TOTAL LIABILITIES AND EQUITY 91,939.5 84,277.4 7,662.1 9.1% 100.0% 100.0%
HORIZONTAL VERTICAL
Increase (Decrease)

SEC Form 17Q – 2Q 2012 22
Assets
Trade and other receivables
This account increased by 44.1% or P1,138.5 million to P3,718.9 million as of June 30, 2012
from the P2,580.4 million balance as of June 30, 2011. The increase is mainly due to BGI’s
revenues and increase in FGHPC and GCGI’s revenues for the period.
Available-for-sale (AFS) investments
AFS Investments decreased by 79.5% or P544.8 million to P140.8 million as of
June 30, 2012 from the P685.6 million balance as of June 30, 2011 due to the P488.3 million
reclassification to other non-current assets of ROP bonds maturing beyond 2013.
Derivative assets
The derivative assets P63.2 million balance as of June 30, 2011 pertains to the fair value of
the outstanding foreign currency forward and foreign exchange swap contracts.
Property, plant and equipment
This account increased by 8.4% or P4,572.8 million to P59,180.7 million as of June 30, 2012
from the balance of P54,607.9 million as of June 30, 2011 primarily due to the
P7,835.3 million net additions partially offset by the P3,274.4 million depreciation for the
period.
Deferred tax assets
This account decreased by 13.9% or P198.4 million to P1,231.0 million as of June 30, 2012
from the balance of P1,429.4 million as of June 30, 2011 mainly due to the Parent
Company’s P102.0 million lower recognition of deferred tax assets on unrealized forex gains
on translation of long-term foreign loans and GCGI’s P129.8 million application of NOLCO
to its taxable income for the period. These were offset by BGI’s P52.0 million recognized
deferred tax asset due to testing and commissioning revenues charged against PPE.
Exploration and evaluation assets
This account increased by 44.6% or P459.3 million to P1,490.1 million as of June 30, 2012
from the balance of P1,030.8 million as of June 30, 2011 primarily due to the expenses of
Mindanao III, Bacman Rangas/Kayabon, and Tanawon areas.

SEC Form 17Q – 2Q 2012 23
Other noncurrent assets
This account increased by 55.7% or P2,055.3 million, to P5,745.7 million as of
June 30, 2012 from the P3,690.4 million as of June 30, 2011 mainly due to the following:
P1,297.7 million increase in input VAT;
P488.3 million reclassification from current available for sale investment account of
ROP bonds maturing beyond 2013; and
P300.0 million increase in tax credit certificates.
Liabilities
Trade and other payables
This account increased by 27.1%, or P1,627.3 million, to P7,624.8 million as of
June 30, 2012 from the balance of P5,997.5 million in the same period of 2011 mainly due to
the P2,147.5 million increase in accounts payable offset by the P432.3 million decrease in
accrued interest and guarantee fees.
Income tax payable
Income tax payable decreased by 52.8% or P41.3 million to P36.9 million as of
June 30, 2012 from P78.2 million for the same period in 2011 arising from the Parent
Company’s lower taxable income.
Due to related parties
This account decreased by 63.3% or P78.9 million to P45.8 million as of June 30, 2012 from
the balance of P124.7 million as of June 30, 2011 primarily due to the settlement of advances
from First Gen.
Derivative liabilities - current
This account balance of P39.2 million as of June 30, 2011 is the fair value of the outstanding
foreign currency forward in 2011.
Long-term debts (current portion)
This account decreased by 11.9% or P217.4 million to P1,615.6 million as of June 30, 2012
from the balance of P1,833.0 million as of June 30, 2011 primarily due to the
P1,289.5 million regular and prepayment of the FCRN series 1, 2 & 3. This was offset by the
P1,060.9 million reclassification of the current portion of maturing US$175 million
syndicated loan, IFC A & B loans and FXCN loan tranche 1 & 2.
SEC Form 17Q – 2Q 2012 24
Royalty fee payable (current portion )
This account decreased by 51.8 % or P153.2 million to P142.7 million as of June 30, 2012
from the balance of P295.9 million as of June 30, 2011 mainly due to the Parent Company’s
P177.9 million payment to DOE and LGU’s offset by P18.5 million accretion on Day 1 gain
recognized from July 1, 2011 to June 30, 2012.
Royalty fee payable (net of current portion )
This account decreased by 100.0% or P133.7 million as of June 30, 2012 primarily due to the
reclassification to current portion of outstanding royalty fee payable in 2012.
Net retirement and other post-retirement benefits
This account decreased by 9.9% or P135.2 million to P1,234.9 million as of June 30, 2012
from P1,370.1 million balance as of June 30, 2011 mainly due to contribution to the fund in
2011 offset by the accrual of retirement benefits for the period.
Provisions and other long-term liabilities
This account increased by 39.5% or P224.6 million to P793.5 million as of June 30, 2012
from P568.9 million balance as of June 30, 2011 mainly due to the Parent Company’s
P131.9 million additional asset retirement obligation and P90.0 million accrual of sick leave
and vacation leave benefits.
Derivative liabilities – non current
The account balance of P49.6 million as of June 30, 2012 is the fair value of the cross-
currency swaps designated as accounting hedges.
Net accumulated unrealized gain on AFS investments
This account decreased by 16.1% or P17.2 million to P89.6 million as of June 30, 2012 from
P106.8 million as of June 30, 2011 mainly due to the decrease in fair value of the
investments for the period.
Retained earnings
Retained earnings increased by 118.3% or P4,899.7 million to P9,040.5 million as of
June 30, 2012 from P4,140.8 million balance as of June 30, 2011 mainly due to the
P4,618.3 million net income for the first semester of 2012.
Non-controlling interest
Non-controlling interest increased by 35.2% or P517.8 million to P1,987.6 million as of
June 30, 2012 from P1,469.8 million balance as of June 30, 2011 mainly due to the net

SEC Form 17Q – 2Q 2012 25
income of P747.7 million posted from June 30, 2011 to December 31, 2011 and
P1,112.6 million net income for the first semester of 2012. This was offset by
P1,342.5 million payment of cash dividend this year.

SEC Form 17Q – 2Q 2012 26
CASH FLOW
June 30, 2012 vs. June 30, 2011
Net cash flows from operating activities increased by 32.3% or P1,738.5 million to
P7,125.8 million in the first semester of 2012 from P5,387.3 million during the same period in
2011 mainly due to the P2,326.5 million improved cash generation from operations due to
increased revenues and absence of P80.0 million contribution to retirement and other post-
retirement benefits. These were offset by the P336.2 million increase in interest and financing
charges paid and P331.7 million increase in payment of income tax.
Net cash flows used in investing activities decreased by 19.9% or P1,011.9 million to
P4,072.0 million in June 2012 as compared to the P5,083.8 million during the same period in
2011. The decrease was primarily due to lower acquisition of property, plant and equipment by
P1,036.0 million.
The movement of P8,678.2 million, to P4,238.5 million on net cash flows used in financing
activities in June 2012 from the P4,439.6 million net cash flows from financing activities during
the same period in 2011 was mainly due to lower proceeds from the P7,000 million FXCN loan
this year as compared to the P20,980.0 million proceeds from the US$300 million notes issuance
and $175 million loan last year. This was offset by the lower payment of long-term debts by
P5,040.1 million this year.

SEC Form 17Q – 2Q 2012 27
DISCUSSION ON THE SUBSIDIARIES
FG Hydro
(Amounts in PHP millions)
As of and for the periods ended
June 30
2012 2011
Operating revenues 2,558.9 661.6
Operating expenses 459.5 372.3
Other expenses – net 218.6 209.4
Income before tax 1,880.8 79.9
Provision for income tax 0.4 0.6
Net income 1,880.4 79.3
Total current assets 1,792.7 1,260.0
Total noncurrent assets 7,066.6 7,334.6
Total current liabilities 767.1 514.8
Total noncurrent liabilities 4,024.2 4,405.4
Total equity 4,068.0 3,674.4
FG Hydro generated revenues of P2,558.9 million for the period ended June 30, 2012, 286.7% higher
than the revenues of P661.6 million for the same period in 2011. The favorable variance was mainly on
account of revenues earned from sale of electricity, as ancillary services to National Grid Corporation of
the Philippines (“NGCP”), amounting to P1,391.4 million, and the temporary assumption of BGI’s Power
Supply Agreements (PSAs) with Batangas Electric Cooperative II (“BATELEC II”) 48MW and Linde
Philippines 6MW amounting to P377.1 million. There were no revenues from the said entities for the
same period in 2011.
The unfavorable variance in operating expenses is mainly on account of higher depreciation, operations
and maintenance expenses and taxes and licenses in 2012. The unfavorable variances, however, were
partly offset by higher interest income from short-term deposits of P30.5 million in 2012 versus
P20.7 million in 2011. Overall, FG Hydro posted a record net income of P1,880.4 million for the period
ended June 30, 2012, P1,801.1 million higher than the P79.3 million reported income for the same period
in 2011.
Total assets as of June 30, 2012 stood at P8,859.3 million, P264.7 million or 3.1% higher than the 2011
level of P8,594.6 million. The favorable variance was mainly due to higher cash and accounts receivable
trade balances in 2012. As compared with the same period in 2011, there were no electricity sales for
ancillary services yet.
As of June 30, 2012, total liabilities stood at P4,791.3 million, P128.9 million or 2.6% lower than the
2011 level of P4,920.2 million. The decrease in liabilities was mainly due to the continuous pay-out of the
scheduled semi-annual loan repayments.
Total equity as of June 30, 2012 of P4,067.9 million is P393.5 million or 10.7% higher compared to the
June 30, 2011 level of P3,674.4 million.

SEC Form 17Q – 2Q 2012 28
Green Core Geothermal Inc.
(Amounts in PHP millions)
As of and for the periods ended
June 30
2012 2011
Revenues 4,902.3 3.933.2
Operating expenses* (3,616.2) (4,263.4)
Other income (charges) – net 64.1 (223.3)
Income (loss) before income tax 1,350.2 (553.5)
Benefit from (provision for) income tax (133.6) 55.4
Net income (loss) 1,216.6 (498.1)
Total Current Assets 1,912.0 1,412.8
Total Non-Current Assets 9,845.7 9,802.8
Total Liabilities 1,729.1 8,001.8
Total Equity 10,028.6 3,213.8
*Includes Cost of Sale of Electricity and General and Administrative Expenses
GCGI’s revenues increased by 24.6% or P969.1 million, to P4,902.3 million as of June 30, 2012 from
P3,933.2 million for the same period in 2011 due to higher revenues from the sale of electricity as per
agreed contracts that became effective in mid-2011 and the additional power supply agreements that were
signed in December 2011.
Operating expenses decreased by 15.2% or P647.2 million, to P3,616.2 million in 2012 from
P4,263.4 million in 2011 due to lower average cost of steam by P0.45/kWh (P409.9 million), lower
purchased services & utilities by P159.7 million and operations & maintenance by P140.5 million offset
by higher general & administrative expenses of P62.5 million.
This period’s other income of P64.1 million consists mainly of foreign exchange gains and the absence in
2012 of interest expense.
Provision of income tax – deferred of P133.6 million in 2012 was an increase from P55.4 million benefit
from income tax – deferred in 2011.
Total current assets increased by 35.3% or P499.2 million, to P1,912.0 million in 2012 from
P1,412.8 million in 2011 largely due to higher trade & other receivables of P356.4 million and other
current assets of P193.1 million offset by lower cash & cash equivalents of P35.5 million and parts &
supplies inventories of P14.2 million.
Total noncurrent assets increased by 0.4% or P42.9 million, to P9,845.7 million in 2012 from
P9,802.8 million in 2011 due to higher other noncurrent assets of P105.9 million and property, plant &
equipment of P86.5 million reduced by lower deferred tax asset of P149.5 million.
Total liabilities decreased by 78.4% or P6,272.7 million, to P1,729.1 million in 2012 from
P8,001.8 million in 2011 while total equity increased by 212.0% or P6,814.8 million, to
P10,028.6 million in 2012 from P3,213.8 million in 2011 due to the conversion of the P5,452.5 million
advances from EDC to equity coupled with the net income for the period July 1, 2011 to June 30, 2012
amounting to P1,362.3 million.
SEC Form 17Q – 2Q 2012 29
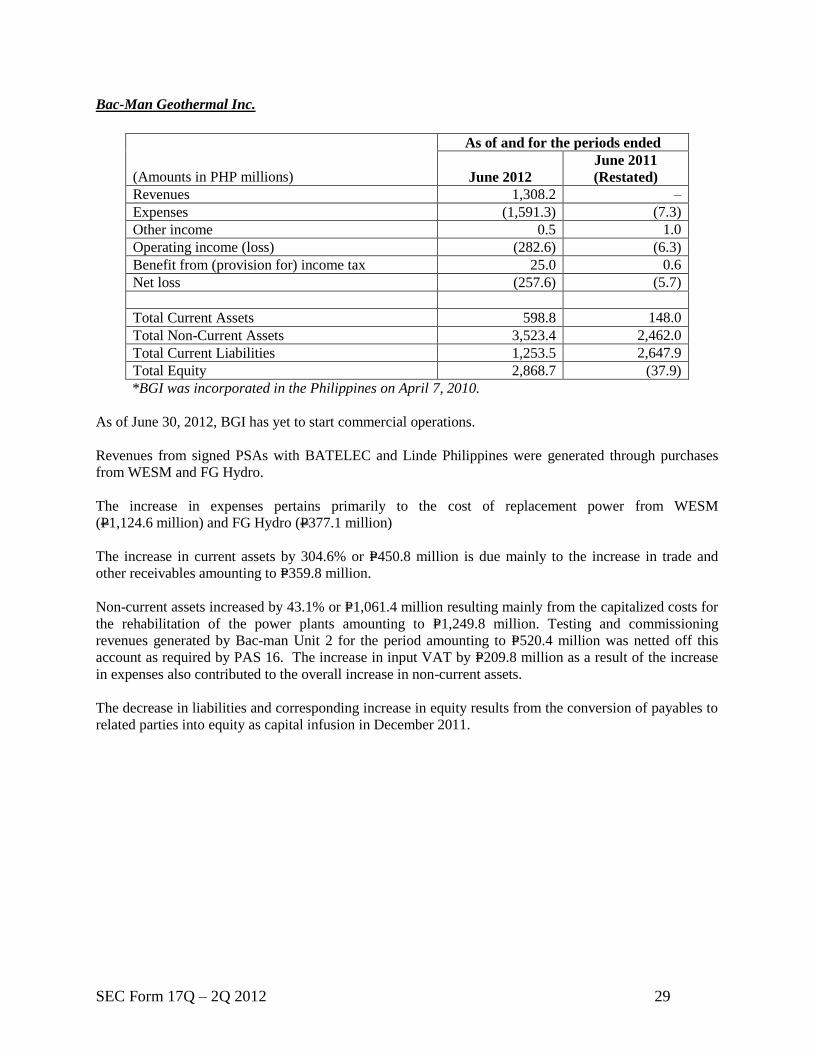
Bac-Man Geothermal Inc.
(Amounts in PHP millions)
As of and for the periods ended
June 2012
June 2011
(Restated)
Revenues 1,308.2 –
Expenses (1,591.3) (7.3)
Other income 0.5 1.0
Operating income (loss) (282.6) (6.3)
Benefit from (provision for) income tax 25.0 0.6
Net loss (257.6) (5.7)
Total Current Assets 598.8 148.0
Total Non-Current Assets 3,523.4 2,462.0
Total Current Liabilities 1,253.5 2,647.9
Total Equity 2,868.7 (37.9)
*BGI was incorporated in the Philippines on April 7, 2010.
As of June 30, 2012, BGI has yet to start commercial operations.
Revenues from signed PSAs with BATELEC and Linde Philippines were generated through purchases
from WESM and FG Hydro.
The increase in expenses pertains primarily to the cost of replacement power from WESM
(P1,124.6 million) and FG Hydro (P377.1 million)
The increase in current assets by 304.6% or P=450.8 million is due mainly to the increase in trade and
other receivables amounting to P=359.8 million.
Non-current assets increased by 43.1% or P=1,061.4 million resulting mainly from the capitalized costs for
the rehabilitation of the power plants amounting to P=1,249.8 million. Testing and commissioning
revenues generated by Bac-man Unit 2 for the period amounting to P=520.4 million was netted off this
account as required by PAS 16. The increase in input VAT by P=209.8 million as a result of the increase
in expenses also contributed to the overall increase in non-current assets.
The decrease in liabilities and corresponding increase in equity results from the conversion of payables to
related parties into equity as capital infusion in December 2011.

SEC Form 17Q – 2Q 2012 30
Commitments that will have an impact on the issuer’s liquidity
As of June 30, 2012, the company has unserved purchase orders and awarded contracts for the
purchase of various capital goods in the total amount of P103.3 million.
Other than these, we are not aware of any other material commitments that should impact the
Company’s liquidity.
Legal proceedings
There are no other material changes in the contingent liabilities since the last annual balance
sheet date.
FOREIGN EXCHANGE AND INTEREST RATE EXPOSURE
The Company has P=19,765.14 million in long-term US dollar denominated loans as of
June 30, 2012 which is 42.12% of the total company’s long-term loans.
OTHER MATTERS
CASH DIVIDEND
On March 13, 2012, the BOD of the Parent Company approved the following cash dividends
in favor of all stockholders of record as of March 28, 2012 and payable on or before
April 24, 2012:
cash dividend of P=0.0008 per share on the preferred shares
regular cash dividend of P=0.10 per share on the common shares.
In March and May 2012, FG Hydro declared and paid cash dividends to its preferred and
common shares amounting to P=88.5 million and P=1,254.0 million, respectively

SEC Form 17Q – 2Q 2012 31
MAJOR STOCKHOLDERS
As of June 30, 2012, the total number of stockholders was 700 and price was P6.03 per share.
The public float level was at 50.68% (or 9,501,587,389 common shares).
List of Top 20 Stockholders as of June 30, 2012
Rank Name Nationality
Number of Shares
% Preferred Common Total
1 Red Vulcan Holdings
Corporation
Filipino 9,375,000,000 7,500,000,000 16,875,000,000 60.00
2 PCD Nominee Corporation Foreign - 6,736,468,952 6,736,468,952 23.95
3 PCD Nominee Corporation Filipino - 2,757,421,191 2,757,421,191 9.80
4 First Gen Corporation Filipino - 991,782,700 991,782,700 3.53
5 Northern Terracotta Power
Corporation
Filipino - 726,450,200 726,450,200 2.58
6 Peter D. Garrucho, Jr. Filipino - 5,670,000 5,670,000 0.02
7 Benjamin K. Liboro Filipino - 3,525,500 3,525,500 0.01
8 Arthur A. De Guia Filipino - 2,200,000 2,200,000 0.01
9 CROSLO Holdings Corporation Filipino - 1,600,000 1,600,000 0.01
10 Hi-Light Corporation Filipino - 1,577,500 1,577,500 0.01
11 Mapazon Corporation Filipino - 1,470,000 1,470,000 0.01
12 ALG Holdings Corporation Filipino - 875,000 875,000 0.00
13 Raul I. Macatangay Filipino - 725,000 725,000 0.00
14 Rosalind Camara Filipino - 663,750 663,750 0.00
15 Rodolfo R. Waga, Jr. Filipino - 658,750 658,750 0.00
16 Emelita D. Sabella Filipino - 521,000 521,000 0.00
17 Rodolfo R. Waga, Jr. &/or Grace
B. Waga
Filipino - 501,200 501,200 0.00
19 Hiro Budhrani &/or Astrid J.
Budhrani
Filipino - 500,000 500,000 0.00
18 Ma. Consuelo R. Lopez Filipino - 500,000 500,000 0.00
20 Peter Mar & /or Annabelle C.
Mar
Filipino - 500,000 500,000 0.00

SEC Form 17Q – 2Q 2012 32
BOARD OF DIRECTORS
As of June 30, 2012, the members of Board of Directors of EDC are as follows:
Oscar M. Lopez Chairman Emeritus
Federico R. Lopez Chairman and Chief Executive Officer
Peter D. Garrucho, Jr. Director
Elpidio L. Ibañez Director
Ernesto B. Pantangco Director and Executive Vice President
Francis Giles B. Puno Director
Richard B. Tantoco Director, President and Chief Operating Officer
Jonathan C. Russell Director
Edgar O. Chua Independent Director
Francis Ed. Lim Independent Director
Arturo T. Valdez Independent Director
OFFICERS
As of June 30, 2012, the officers of EDC are as follows:
Name Position
Federico R. Lopez Chief Executive Officer
Richard B. Tantoco President and Chief Operating Officer
Ernesto B. Pantangco Executive Vice President
Agnes C. de Jesus Senior Vice President for Environment and
External Relations, and Compliance Officer
Nestor H. Vasay Senior Vice President, Chief Financial
Officer and Treasurer
Marcelino M. Tongco Senior Vice President for Strategic
Contracting
Manuel S. Ogena Senior Vice President for Technical Services
Dominic M. Camu Senior Vice President for Power Generation
Danilo C. Catigtig Senior Vice President for Strategic Initiatives
Office
Rico G. Bersamin Senior Vice President for Steam Field
Operations
Ernesto G. Espinosa Vice President for Human Resource
Management
Vincent Martin C. Villegas Vice President for Business Development
Erwin O. Avante Vice President for Corporate Finance
Ferdinand B. Poblete Vice President, Chief Information Officer
Ariel Arman V. Lapus Vice President for Business Development
International
Ellsworth R. Lucero Vice President - Power

SEC Form 17Q – 2Q 2012 33
Name Position
Dwight A. Maxino Vice President - So. Negros Geothermal
Project
Manuel C. Paete Vice President - Leyte Geothermal Project
Liberato S. Virata Vice President - Bacon-Manito Geothermal
Project
Wilfredo A. Malonzo Vice President for Supply Chain
Management
Maribel A. Manlapaz Comptroller
Teodorico Jose R. Delfin Corporate Secretary
Ana Maria A. Katigbak Assistant Corporate Secretary
Glenn L. Tee Senior Manager, Internal Audit
Erudito S. Recio Senior Manager, Investor Relations


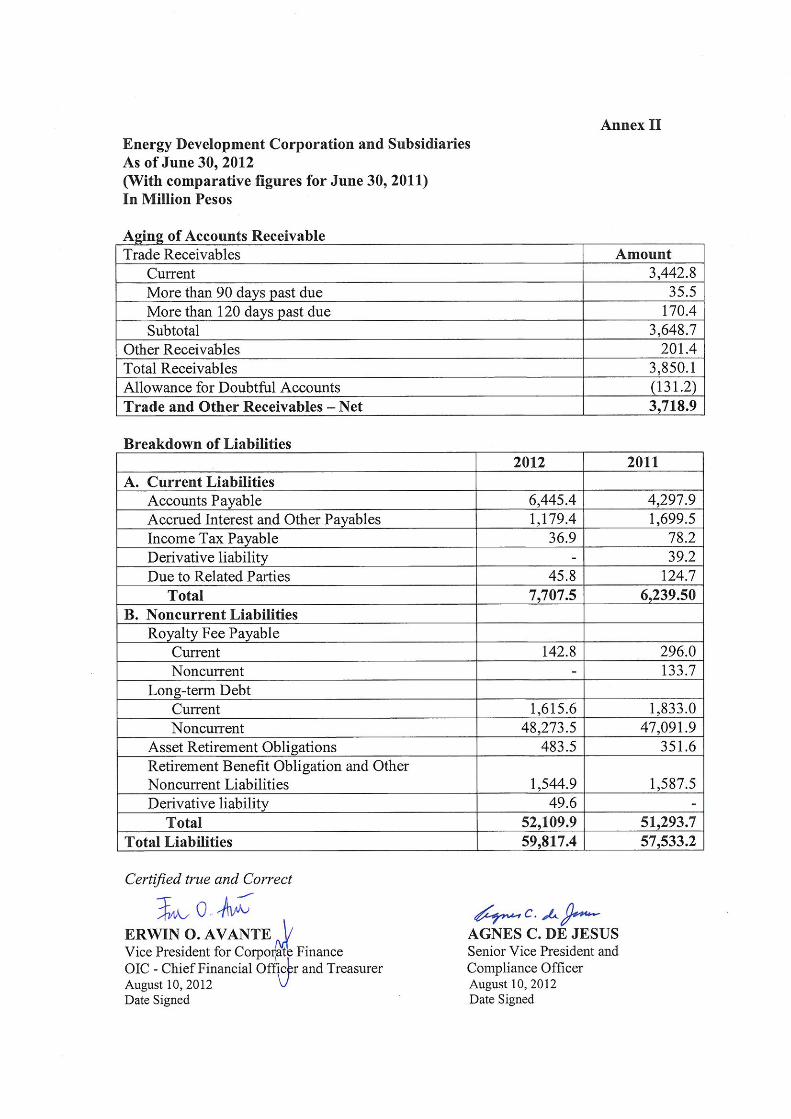
Annex I
Energy Development Corporation (A Subsidiary of Red Vulcan Holdings Corporation) and Subsidiaries
Unaudited Interim Condensed Consolidated Financial Statements June 30, 2012 and 2011 (With Comparative Figures as of December 31, 2011 )

ENERGY DEVELOPMENT CORPORATION (A Subsidiary of Red Vulcan Holdings Corporation)
AND SUBSIDIARIES
UNAUDITED INTERIM CONSOLIDATED STATEMENTS OF
FINANCIAL POSITION
June 30,
2012
(Unaudited)
December 31,
2011
(Audited)
June 30,
2011
(Unaudited,
Restated,
Note 26)
ASSETS
Current Assets
Cash and cash equivalents (Notes 5 and 24) P=11,255,972,999 P=12,493,406,963 P=10,900,365,601
Trade and other receivables (Notes 6 and 24) 3,718,889,023 3,411,309,528 2,580,364,278
Available-for-sale (AFS) investments (Note 24) 140,849,280 673,853,680 685,593,258
Parts and supplies inventories (Note 7) 3,271,835,082 3,355,767,653 3,330,190,461
Derivative assets (Note 24) – – 63,203,930
Due from related parties (Notes 23 and 24) – 7,812 –
Other current assets 1,196,452,814 741,911,257 1,251,099,445
Total Current Assets 19,583,999,198 20,676,256,893 18,810,816,973
Noncurrent Assets
Property, plant and equipment (Note 8) 59,180,658,433 57,676,929,006 54,607,901,317
Intangible assets (Note 9) 4,707,978,675 4,705,245,708 4,708,046,218
Deferred tax assets - net 1,231,044,680 1,420,656,657 1,429,366,220
Exploration and evaluation assets 1,490,058,527 1,087,079,413 1,030,820,685
Other noncurrent assets (Note 10) 5,745,750,905 4,451,649,107 3,690,386,752
Total Noncurrent Assets 72,355,491,220 69,341,559,891 65,466,521,192
TOTAL ASSETS P=91,939,490,418 P=90,017,816,784 P=84,277,338,165
LIABILITIES AND EQUITY
Current Liabilities
Trade and other payables (Notes 11 and 24) P=7,624,847,376 P=6,704,075,261 P=5,997,455,447
Income tax payable 36,903,844 18,736,456 78,157,460
Due to related parties (Notes 23 and 24) 45,782,567 60,090,825 124,680,299
Derivative liabilities (Note 24) – – 39,227,456
Current portion of:
Long-term debts (Notes 12 and 24) 1,615,630,737 2,249,517,382 1,833,048,809
Royalty fee payable (Notes 13 and 24) 142,740,508 287,626,313 295,914,471
Total Current Liabilities 9,465,905,032 9,320,046,237 8,368,483,942
(Forward)
- 2 -
June 30,
2012
(Unaudited)
December 31,
2011
(Audited)
June 30,
2011
(Unaudited,
Restated,
Note 26)
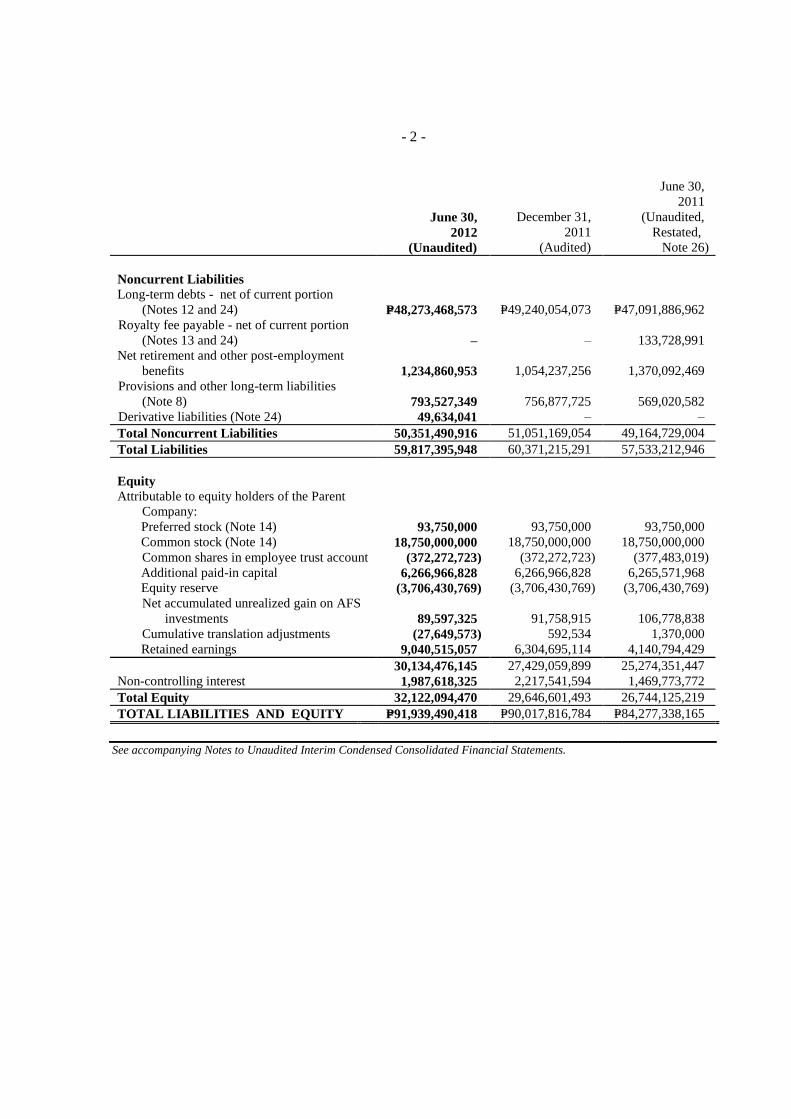
Noncurrent Liabilities
Long-term debts - net of current portion
(Notes 12 and 24) P=48,273,468,573 P=49,240,054,073 P=47,091,886,962
Royalty fee payable - net of current portion
(Notes 13 and 24) – – 133,728,991
Net retirement and other post-employment
benefits 1,234,860,953 1,054,237,256 1,370,092,469
Provisions and other long-term liabilities
(Note 8) 793,527,349 756,877,725 569,020,582
Derivative liabilities (Note 24) 49,634,041 – –
Total Noncurrent Liabilities 50,351,490,916 51,051,169,054 49,164,729,004
Total Liabilities 59,817,395,948 60,371,215,291 57,533,212,946
Equity
Attributable to equity holders of the Parent
Company:
Preferred stock (Note 14) 93,750,000 93,750,000 93,750,000
Common stock (Note 14) 18,750,000,000 18,750,000,000 18,750,000,000
Common shares in employee trust account (372,272,723) (372,272,723) (377,483,019)
Additional paid-in capital 6,266,966,828 6,266,966,828 6,265,571,968
Equity reserve (3,706,430,769) (3,706,430,769) (3,706,430,769)
Net accumulated unrealized gain on AFS
investments 89,597,325 91,758,915 106,778,838
Cumulative translation adjustments (27,649,573) 592,534 1,370,000
Retained earnings 9,040,515,057 6,304,695,114 4,140,794,429
30,134,476,145 27,429,059,899 25,274,351,447
Non-controlling interest 1,987,618,325 2,217,541,594 1,469,773,772
Total Equity 32,122,094,470 29,646,601,493 26,744,125,219
TOTAL LIABILITIES AND EQUITY P=91,939,490,418 P=90,017,816,784 P=84,277,338,165
See accompanying Notes to Unaudited Interim Condensed Consolidated Financial Statements.

ENERGY DEVELOPMENT CORPORATION (A Subsidiary of Red Vulcan Holdings Corporation)
AND SUBSIDIARIES
UNAUDITED INTERIM CONSOLIDATED STATEMENTS OF INCOME
Three-month Periods Ended
June 30
Six-month Periods Ended
June 30
2012 2011 2012 2011
REVENUES (Note 4)
Sale of electricity P=7,486,654,065 P=5,610,615,517 P=15,023,410,507 P=11,408,776,024
Revenue from drilling services 177,640,053 172,094,892 345,221,433 326,711,529
7,664,294,118 5,782,710,409 15,368,631,940 11,735,487,553
COST OF SALES AND SERVICES
Cost of sales of electricity (Note 15) (2,985,460,975) (2,248,047,719) (5,726,765,662) (5,010,268,447)
Cost of drilling services (Note 16) (116,042,471) (170,601,063) (211,481,811) (278,924,490)
(3,101,503,446) (2,418,648,782) (5,938,247,473) (5,289,192,937)
GENERAL AND ADMINISTRATIVE
EXPENSES (Note 17)
(1,276,743,732) (1,305,240,938)
(2,196,326,904)
(2,194,646,589)
FINANCIAL INCOME (EXPENSES)
Interest expense (Notes 4 and 18) (904,899,021) (1,276,004,963) (1,920,244,374) (2,314,926,228)
Interest income - net of final tax (Notes 4 and
19) 86,905,261 93,955,446 180,775,443 217,873,134
(817,993,760) (1,182,049,517) (1,739,468,931) (2,097,053,094)
OTHER INCOME (CHARGES)
Foreign exchange gains - net (Note 20) 356,381,872 48,272,813 694,335,378 236,833,940
Loss on impairment of property, plant and
equipment (Notes 4 and 8)
–
(4,998,608,008)
–
(4,998,608,008)
Derivative losses - net (Note 24) – (46,526,531) – (8,973,485)
Miscellaneous - net (Note 21) (126,793,423) (18,243,498) (67,386,140) 12,459,014
229,588,449 (5,015,105,224) 626,949,238 (4,758,288,539)
INCOME (LOSS) BEFORE INCOME
TAX 2,697,641,629 (4,138,334,052) 6,121,537,870 (2,603,693,606)
BENEFIT FROM (PROVISION FOR)
INCOME TAX
Current (13,064,619) (78,641,622) (200,996,142) (247,075,683)
Deferred (100,506,067) 465,729,835 (189,611,977) 553,886,596
(113,570,686) 387,088,213 (390,608,119) 306,810,913
NET INCOME (LOSS) P=2,584,070,943 (P=3,751,245,839) P=5,730,929,751 (P=2,296,882,693)
Net income (loss) attributable to:
Equity holders of the Parent Company P=1,919,043,288 (P=3,709,034,962) P=4,618,319,943 (P=2,331,092,842)
Non-controlling interest 665,027,655 (42,210,877) 1,112,609,808 34,210,149
P=2,584,070,943 (P=3,751,245,839) P=5,730,929,751 (P=2,296,882,693)
Basic/Diluted Earnings (Loss) Per Share
for Net Income (Loss) Attributable to
Equity Holders of the Parent Company
(Note 22) P=0.102 (P=0.198) P=0.246 (P=0.125)
See accompanying Notes to Unaudited Interim Condensed Consolidated Financial Statements.
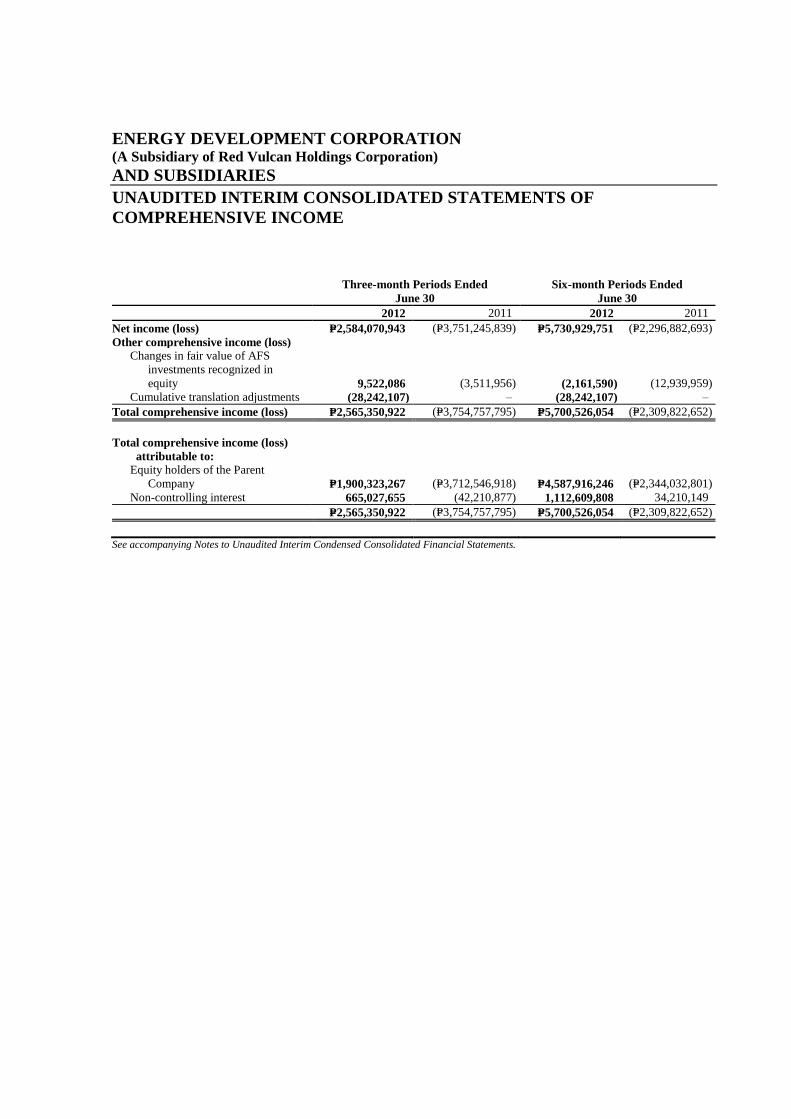
ENERGY DEVELOPMENT CORPORATION (A Subsidiary of Red Vulcan Holdings Corporation)
AND SUBSIDIARIES
UNAUDITED INTERIM CONSOLIDATED STATEMENTS OF
COMPREHENSIVE INCOME
Three-month Periods Ended
June 30
Six-month Periods Ended
June 30 2012 2011 2012 2011
Net income (loss) P=2,584,070,943 (P=3,751,245,839) P=5,730,929,751 (P=2,296,882,693)
Other comprehensive income (loss)
Changes in fair value of AFS
investments recognized in
equity 9,522,086 (3,511,956) (2,161,590) (12,939,959)
Cumulative translation adjustments (28,242,107) – (28,242,107) –
Total comprehensive income (loss) P=2,565,350,922 (P=3,754,757,795) P=5,700,526,054 (P=2,309,822,652)
Total comprehensive income (loss)
attributable to:
Equity holders of the Parent
Company P=1,900,323,267 (P=3,712,546,918) P=4,587,916,246 (P=2,344,032,801)
Non-controlling interest 665,027,655 (42,210,877) 1,112,609,808 34,210,149
P=2,565,350,922 (P=3,754,757,795) P=5,700,526,054 (P=2,309,822,652)
See accompanying Notes to Unaudited Interim Condensed Consolidated Financial Statements.
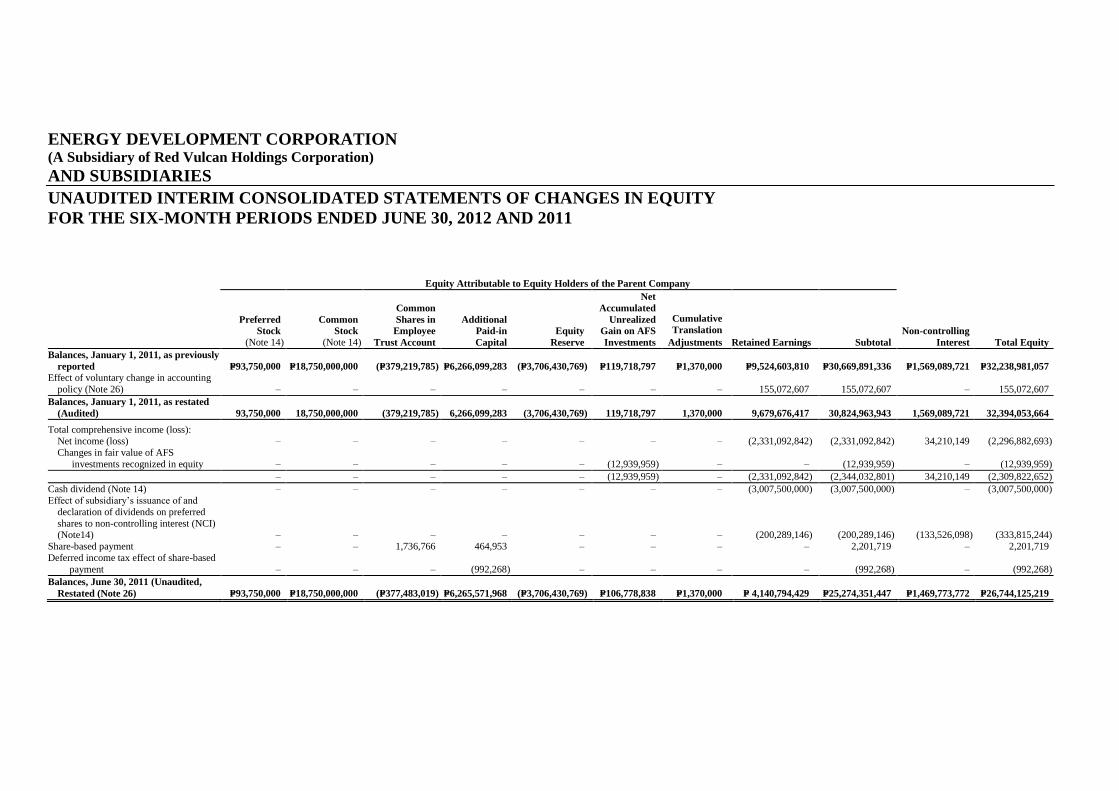
ENERGY DEVELOPMENT CORPORATION (A Subsidiary of Red Vulcan Holdings Corporation)
AND SUBSIDIARIES
UNAUDITED INTERIM CONSOLIDATED STATEMENTS OF CHANGES IN EQUITY
FOR THE SIX-MONTH PERIODS ENDED JUNE 30, 2012 AND 2011
Equity Attributable to Equity Holders of the Parent Company
Preferred
Stock
(Note 14)
Common
Stock
(Note 14)
Common
Shares in
Employee
Trust Account
Additional
Paid-in
Capital
Equity
Reserve
Net
Accumulated
Unrealized
Gain on AFS
Investments
Retained Earnings Subtotal
Non-controlling
Interest Total Equity
Cumulative
Translation
Adjustments
Balances, January 1, 2011, as previously
reported P=93,750,000 P=18,750,000,000 (P=379,219,785) P=6,266,099,283 (P=3,706,430,769) P=119,718,797
P=1,370,000 P=9,524,603,810 P=30,669,891,336 P=1,569,089,721 P=32,238,981,057
Effect of voluntary change in accounting
policy (Note 26) – – – – – – – 155,072,607 155,072,607 – 155,072,607
Balances, January 1, 2011, as restated
(Audited) 93,750,000 18,750,000,000 (379,219,785) 6,266,099,283 (3,706,430,769) 119,718,797 1,370,000 9,679,676,417 30,824,963,943 1,569,089,721 32,394,053,664
Total comprehensive income (loss):
Net income (loss) – – – – – – – (2,331,092,842) (2,331,092,842) 34,210,149 (2,296,882,693)
Changes in fair value of AFS
investments recognized in equity
–
–
–
–
– (12,939,959)
–
– (12,939,959)
– (12,939,959)
– – – – – (12,939,959) – (2,331,092,842) (2,344,032,801) 34,210,149 (2,309,822,652)
Cash dividend (Note 14) – – – – – – – (3,007,500,000) (3,007,500,000) – (3,007,500,000)
Effect of subsidiary’s issuance of and
declaration of dividends on preferred
shares to non-controlling interest (NCI) (Note14) – – – – – – – (200,289,146) (200,289,146) (133,526,098) (333,815,244)
Share-based payment – – 1,736,766 464,953 – – – – 2,201,719 – 2,201,719
Deferred income tax effect of share-based
payment – – – (992,268) – – – – (992,268) – (992,268)
Balances, June 30, 2011 (Unaudited,
Restated (Note 26) P=93,750,000 P=18,750,000,000 (P=377,483,019) P=6,265,571,968 (P=3,706,430,769) P=106,778,838 P=1,370,000 P= 4,140,794,429 P=25,274,351,447 P=1,469,773,772 P=26,744,125,219

- 2 -
Equity Attributable to Equity Holders of the Parent Company
Preferred
Stock
(Note 14)
Common
Stock
(Note 14)
Common
Shares in
Employee
Trust Account
Additional
Paid-in
Capital
Equity
Reserve
Net
Accumulated
Unrealized
Gain on AFS
Investments
Cumulative
Translation
Adjustments Retained Earnings Subtotal
Non-controlling
Interest Total Equity
Balances, December 31, 2011 (Audited) P=93,750,000 P=18,750,000,000 (P=372,272,723) P=6,266,966,828 (P=3,706,430,769) P=91,758,915 P=592,534 P=6,304,695,114 P=27,429,059,899 P=2,217,541,594 P=29,646,601,493
Total comprehensive income (loss):
Net income – – – – – – – 4,618,319,943 4,618,319,943 1,112,609,808 5,730,929,751
Changes in fair value of AFS
investments recognized in equity
–
–
–
–
– (2,161,590)
–
– (2,161,590)
– (2,161,590)
Cumulative translation adjustments (28,242,107) (28,242,107) – (28,242,107)
– – – – – (2,161,590) (28,242,107) 4,618,319,943 4,587,916,246 1,112,609,808 5,700,526,054
Cash dividend (Note 14) – – – – – – – (1,882,500,000) (1,882,500,000) – (1,882,500,000)
Cash dividend on preferred shares to NCI
(Note 14) – – – – – – – – – (1,342,533,077) (1,342,533,077)
Balances, June 30, 2012 (Unaudited) P=93,750,000 P=18,750,000,000 (P=372,272,723) P=6,266,966,828 (P=3,706,430,769) P=89,597,325 (P=27,649,573) P=9,040,515,057 P=30,134,476,145 P=1,987,618,325 P=32,122,094,470
See accompanying Notes to Unaudited Interim Condensed Consolidated Financial Statements.

ENERGY DEVELOPMENT CORPORATION (A Subsidiary of Red Vulcan Holdings Corporation)
AND SUBSIDIARIES
UNAUDITED INTERIM CONSOLIDATED STATEMENTS OF CASH FLOWS
FOR THE SIX-MONTH PERIODS ENDED JUNE 30, 2012 AND 2011
Six-Month Periods Ended June 30
2012 2011
CASH FLOWS FROM OPERATING ACTIVITIES
Income (loss) before income tax P=6,121,537,870 (P=2,603,693,606)
Adjustments for:
Interest expense (Notes 4 and 18) 1,920,244,374 2,314,926,228
Depreciation and amortization (Notes 4 and 8) 1,744,729,127 1,815,972,247
Unrealized foreign exchange gains - net (779,247,270) (390,812,859)
Interest income (Notes 4 and 19) (180,775,443) (217,873,134)
Provision for:
Retirement and post-employment benefits 180,645,235 142,955,424
Doubtful accounts 39,969,032 211,273,157
Share-based benefits cost – 2,201,719
Loss on debt extinguishment (Note 21) 114,683,892 –
Recovery of impairment loss on property plant and
equipment (Note 8 and 21) (63,614,885) –
Loss on retirement of property, plant and equipment 469,116 251,147
Impairment loss on property, plant and equipment of
Northern Negros Geothermal Project (NNGP)
(Notes 4 and 8) – 4,998,608,008
Derivative losses (gains) - net (Note 32) – (23,976,474)
Operating income before working capital changes 9,098,641,048 6,255,910,580
Decrease (increase) in:
Trade and other receivables (313,019,362) 694,557,855
Due from related parties 7,812 (7,812)
Parts and supplies inventories 119,728,106 (504,419,807)
Other current assets (305,051,085) 92,256,606
Increase (decrease) in:
Trade and other payables 1,266,184,065 1,040,944,177
Due to related parties (27,332,385) (76,256,562)
Royalty fee payable (152,986,423) (143,276,596)
Cash generated from operations 9,686,171,776 7,359,708,441
Interest and financing charges paid (2,228,000,955) (1,891,819,261)
Income taxes paid including creditable withholding taxes (332,319,226) (608,155)
Retirement and other post-employment benefits paid (21,538) (80,000,000)
Net cash from operating activities 7,125,830,057 5,387,281,025
CASH FLOWS FROM INVESTING ACTIVITIES
Acquisition of property, plant and equipment (Note 8) (3,483,763,152) (4,519,768,470)
Proceeds from incidental income from testing of property,
plant and equipment 520,417,469 –
Interest received 169,659,092 230,776,903
Proceeds from sale of property, plant and equipment 973,266 –
Increase in:
Exploration and evaluation assets (402,979,114) (18,077,698)
Intangible assets (50,828,546) –
Other noncurrent assets (825,369,702) (776,694,551)
Net cash used in investing activities (4,071,890,687) (5,083,763,816)
(Forward)
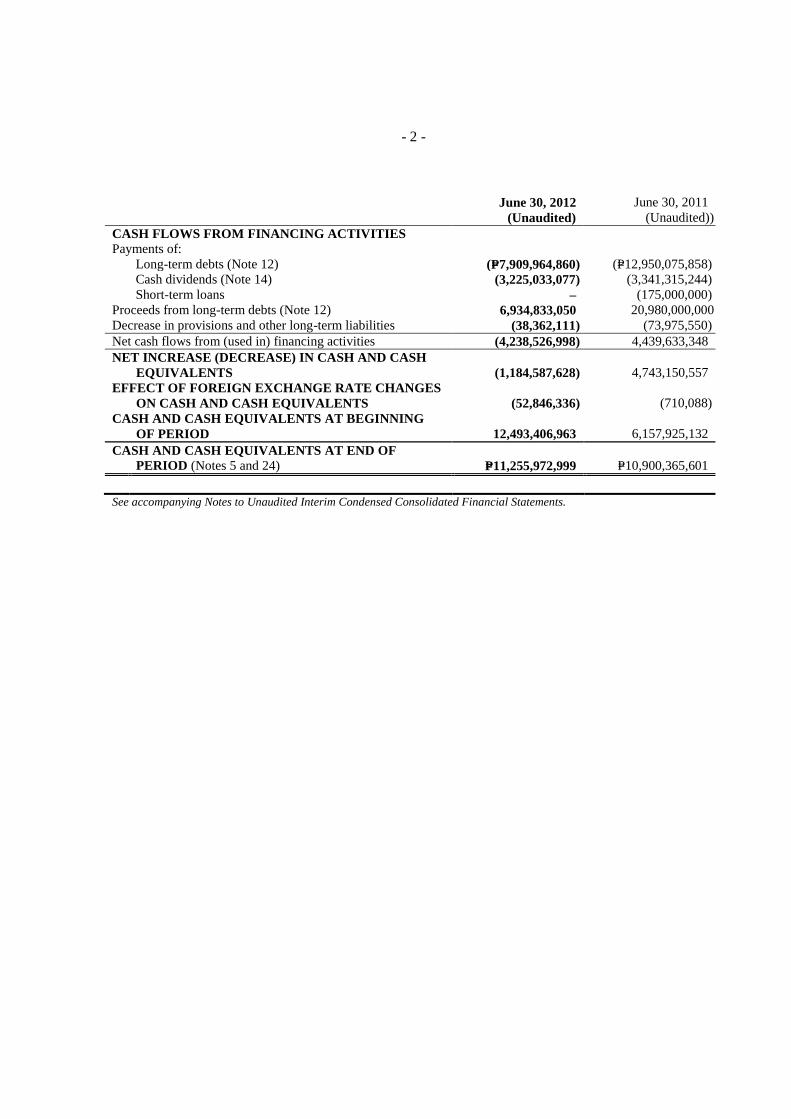
- 2 -
June 30, 2012
(Unaudited)
June 30, 2011
(Unaudited))
CASH FLOWS FROM FINANCING ACTIVITIES
Payments of:
Long-term debts (Note 12) (P=7,909,964,860) (P=12,950,075,858)
Cash dividends (Note 14) (3,225,033,077) (3,341,315,244)
Short-term loans – (175,000,000)
Proceeds from long-term debts (Note 12) 6,934,833,050 20,980,000,000
Decrease in provisions and other long-term liabilities (38,362,111) (73,975,550)
Net cash flows from (used in) financing activities (4,238,526,998) 4,439,633,348
NET INCREASE (DECREASE) IN CASH AND CASH
EQUIVALENTS (1,184,587,628) 4,743,150,557
EFFECT OF FOREIGN EXCHANGE RATE CHANGES
ON CASH AND CASH EQUIVALENTS (52,846,336) (710,088)
CASH AND CASH EQUIVALENTS AT BEGINNING
OF PERIOD 12,493,406,963 6,157,925,132
CASH AND CASH EQUIVALENTS AT END OF
PERIOD (Notes 5 and 24) P=11,255,972,999 P=10,900,365,601
See accompanying Notes to Unaudited Interim Condensed Consolidated Financial Statements.

ENERGY DEVELOPMENT CORPORATION (A Subsidiary of Red Vulcan Holdings Corporation)
AND SUBSIDIARIES
NOTES TO THE UNAUDITED INTERIM CONDENSED CONSOLIDATED
FINANCIAL STATEMENTS
1. Corporate Information
Corporate Structure
Energy Development Corporation (the “Parent Company” or “EDC”) is a subsidiary of Red
Vulcan Holdings Corporation (Red Vulcan). The Parent Company and its subsidiaries
(collectively hereinafter referred to as the “Company”), were separately incorporated and
registered with the Philippine Securities and Exchange Commission (SEC) except for its foreign
subsidiaries. Below are the Parent Company’s ownership interests in its subsidiaries:
Percentage of Ownership
June 30, 2012 December 31, 2011
Direct Indirect Direct Indirect
EDC Drillco Corporation (EDC Drillco) 100.00% – 100.00% –
EDC Geothermal Corp. (EGC) 100.00% – 100.00% –
Green Core Geothermal Inc. (GCGI) – 100.00% – 100.00%
Bac-Man Geothermal Inc. (BGI) – 100.00% – 100.00%
Unified Leyte Geothermal Energy Inc.
(ULGEI) – 100.00% – 100.00%
Southern Negros Geothermal, Inc. (SNGI)**
– 100.00% – 100.00%
EDC Mindanao Geothermal Inc. (EMGI)**
– 100.00% – 100.00%
Bac-Man Energy Development Corporation
(BEDC)**
–
100.00%
–
100.00%
Kayabon Geothermal, Inc. (KGI)**
– 100.00% – 100.00%
Energy Development (EDC) Corporation Chile
Limitada [EDC Chile Limitada] 99.99%
0.01% 99.99%
0.01%
EDC Holdings International Limited (EHIL)**
100.00% – 100.00% –
Energy Development Corporation Hong Kong
Limited (EDC HKL)**
–
100.00%
–
100.00%
EDC Chile Holdings SPA* – 100.00% – –
EDC Geotermica Chile* – 100.00% – –
EDC Peru Holdings S.A.C. * – 100.00% – –
EDC Geotermica Peru S.A.C. * – 100.00% – –
EDC Wind Energy Holdings, Inc. (EWEHI) 100.00% – 100.00% –
EDC Burgos Wind Power Corporation (EBWPC) 33.33% 66.67% 33.33% 66.67%
EDC Pagudpud Wind Power Corporation
(EPWPC)* –
100.00% –
–
First Gen Hydro Power Corporation (FG Hydro) 60.00% – 60.00% –
* Incorporated in 2012 and has not yet started commercial operations.
**Incorporated in 2011 and has not yet started commercial operations.

- 2 -
History of Ownership
Beginning December 13, 2006, the common shares of EDC were listed and traded on the
Philippine Stock Exchange (PSE). Up to November 2007, EDC was controlled by the Philippine
National Oil Company (PNOC), a government-owned and controlled corporation, and the
PNOC EDC Retirement Fund.
On November 29, 2007, PNOC and PNOC EDC Retirement Fund sold their combined interests
in EDC to Red Vulcan (a Philippine corporation). Red Vulcan was then a wholly owned
subsidiary of First Gen Corporation (First Gen, a publicly listed Philippine corporation) through
Prime Terracota Holdings Corporation (Prime Terracota). First Gen’s indirect interest in EDC
consists of 6.0 billion common shares and 7.5 billion preferred shares. Control was then
established through First Gen’s 60% indirect voting interest in EDC. Meanwhile, First Philippine
Holdings Corporation (First Holdings) directly owns 66.2% of the common shares of First Gen.
Accordingly, First Holdings became then the ultimate parent of the Company.
On May 12, 2009, First Gen’s indirect voting interest in Red Vulcan was reduced to 45% with the
balance taken up by Lopez Inc. Retirement Fund (40%) and Quialex Realty Corporation (15%)
through the issuance of preferred shares by Prime Terracota. As a result of this transaction, Prime
Terracota replaced First Holdings as the ultimate parent of EDC effective May 12, 2009.
Nature of Operations
The Parent Company operates 12 geothermal energy projects in five Geothermal Service Contract
(GSC) areas, namely:
1. Bacon-Manito Geothermal Project (BMGP);
2. Mt. Apo Geothermal Project (MGP);
3. Northern Negros Geothermal Project (NNGP);
4. Southern Negros Geothermal Project (SNGP); and,
5. Tongonan Geothermal Project (TGP).
These GSCs are entered into with the Department of Energy (DOE) pursuant to the provisions of
Presidential Decree 1442. These GSCs were replaced by Geothermal Renewable Energy Service
Contracts (GRESCs) on October 23, 2009.
Geothermal steam produced is delivered to the National Power Corporation (NPC) and fed to the
Parent Company and subsidiary’s power plants to produce electricity. EDC sells steam and power
to NPC under the Steam Sales Agreements (SSAs) and Power Purchase Agreements (PPAs),
respectively. EDC also has drilling activities in Papua New Guinea. In August 2011, the Parent
Company assigned its electricity sales agreement with Iloilo I Electric Cooperative, Inc.
(ILECO I) to GCGI.
Subsidiaries
EGC
EGC, originally named as First Luzon Geothermal Energy Corporation, is a special-purpose
company incorporated on April 9, 2008 to participate in the bid for another local power plant. The
bid was won by and awarded to another local entity. Thereafter, EGC became an investment
holding company of its wholly owned subsidiaries, namely GCGI, BGI, ULGEI, SNGI, EMGI,
BEDC and KGI. EGC also has a 0.01% stake in EDC Chile Limitada.
On March 8, 2011, the Philippine SEC approved the change of its corporate name to EGC.

- 3 -
Further details on EGC’s wholly-owned subsidiaries follow:
GCGI was incorporated on June 22, 2009 with primary activities on power generation,
transmission, distribution, and other energy related businesses. GCGI is currently operating
the 192.5 Megawatt (MW) Palinpinon and 112.5 MW Tongonan 1 geothermal power plants in
Negros Oriental and Leyte, respectively, following its successful acquisition from the Power
Sector Assets and Liabilities Management Corporation (PSALM) in 2009.
BGI was incorporated on April 7, 2010 primarily to carry on the general business of
generating, transmitting, and/or distributing energy. BGI has successfully acquired the
150 MW Bac-Man Geothermal Power Plants (BMGPP) from PSALM in 2010. BMGPP is
currently under rehabilitation to restore its capacity and reliability.
On February 4, 2011, the Philippine SEC approved the incorporation of SNGI and EMGI,
wholly owned subsidiaries of EGC, to carry on the general business of generating,
transmitting, and/or distributing energy derived from any and all forms, types and kinds of
energy sources for lighting and power purposes and whole-selling the electric power to power
corporations, public electric utilities and electric cooperatives.
ULGEI is a company incorporated on June 23, 2010 to carry on the general business of
generating, transmitting, and/or distributing energy.
On September 22 and 28, 2011, the Philippine SEC approved the incorporation of BEDC and
KGI, wholly owned subsidiaries of EGC, to carry on the general business of generating,
transmitting, and/or distributing energy derived from any and all forms, types and kinds of
energy sources for lighting and power purposes and whole-selling the electric power to power
corporations, public electric utilities and electric cooperatives.
As of June 30, 2012, SNGI, EMGI, ULGEI, BEDC and KGI remain non-operating.
FG Hydro
On October 20 and November 17, 2008, in line with its objective of focusing on renewable
energy, the Parent Company acquired a total of 60% interest in FG Hydro from First Gen. FG
Hydro operates the 132 Megawatt (MW) Pantabangan and Masiway Hydro-Electric Power Plants
(PAHEP/MAHEP) located in Nueva Ecija, Philippines. FG Hydro buys from and sells electricity
to the Wholesale Electricity Spot Market (WESM) and to various privately-owned distribution
utilities (DUs) under the Transition Power Supply Contracts (TPSCs).
EDC Drillco
EDC Drillco is a company incorporated on September 28, 2009 to act as an independent service
contractor, consultant, specialized technical adviser for well construction and drilling, and other
allied activities.
EWEHI
EWEHI is a holding company incorporated on April 15, 2010.
EBWPC is a company incorporated on April 13, 2010 to carry on the general business of
generating, transmitting, and/or distributing energy. EBPWC is currently developing an
86 MW wind energy concession in Burgos, Ilocos Norte.
EPWPC is a company incorporated on February 29, 2012 to carry on the general business of
generating, transmitting, and/or distributing energy.

- 4 -
EDC Chile Limitada
EDC Chile Limitada is a limited liability company incorporated on February 11, 2010 in Santiago,
Chile with the purpose of exploring, evaluating and extracting any mineral or substance to
generate geothermal energy. On January 10, 2012, the Chilean Ministry of Energy awarded to
EDC the geothermal exploration concession of Newen, while San Rafael and Batea geothermal
exploration concessions were awarded on January 19, 2012.
On February 2, 2012, EDC entered into Joint Venture Agreements (JVA) with Hot Rock Limited
of Australia (HRL) to co-develop four geothermal exploration projects: the Calerias and Longavi
projects in Chile, and the Quellaapacheta and Chocopata projects in Peru. EDC and HRL
successfully concluded negotiations after discussions began with the signing of the Heads of
Terms Agreement last November 28, 2011.
On May 2, 2012, EDC executed Shareholders Agreements (SHA) with HRL to establish project
companies for each of the Calerias and Longavi geothermal concessions in Chile, as well as the
Chocopata and Quellaapacheta geothermal authorizations in Peru, allowing the joint venture to
commence exploration activities at each of the foregoing sites. Pursuant to the terms of the SHA,
EDC will hold 70% of the outstanding capital stock of each of the project companies, with HRL
taking the remaining 30%.
On July 23, 2012, EDC decided not to pursue the Calerias and Longavi projets pursuant to its
rights under the foregoing agreements (see Note 25).
EHIL
EHIL was incorporated on August 17, 2011 in British Virgin Islands and will serve as an
investment holding company of EDC’s international subsidiaries. EHIL is the holding company
of EDC HKL which was incorporated on November 22, 2011 in Hong Kong and will also serve as
a holding company. EDC HKL holds 99.9% stake in EDC Peru Holdings S.A.C., a foreign
subsidiary incorporated on the first quarter of the year in Lima, Peru. EDC Peru Holdings
S.A.C.holds 99.9% stake in EDC Geotermica Peru S.A.C., a foreign subsidiary incorporated on
the first quarter of the year in Lima, Peru. EHIL owns the remaining 0.1% stake in EDC Peru
Holdings S.A.C. and EDC Geotermica Peru S.A.C.
EDC Chile Holdings SPA, which was incorporated on the first quarter of the year in Santiago,
Chile, is wholly owned subsidiary of EDC HKL and is the holding company of EDC Geotermica
Chile, a foreign subsidiary was incorporated on the first quarter of the year in Santiago, Chile.
Corporate Address
In November 2011, the Parent Company changed its corporate address to One Corporate Centre,
Julia Vargas Avenue corner Meralco Avenue, Ortigas Center, Pasig City from Merritt Road, Fort
Bonifacio, Taguig City.
Authorization for Issuance of the Unaudited Interim Condensed Consolidated
Financial Statements
The consolidated financial statements were reviewed and approved by the Audit and Governance
Committee on August 9, 2012.
2. Basis of Preparation
The unaudited interim condensed consolidated financial statements have been prepared in
accordance with Philippine Accounting Standard (PAS) 34, “Interim Financial Reporting.”

- 5 -
Accordingly, the unaudited interim condensed consolidated financial statements do not include all
of the information and footnotes required in the annual consolidated financial statements, and
should be read in conjunction with the Company’s audited annual consolidated financial
statements as of and for the year ended December 31, 2011.
The unaudited interim condensed consolidated financial statements have been prepared on a
historical cost basis, except for derivative instruments, and AFS investments measured at fair
value. The unaudited interim condensed consolidated financial statements are presented in
Philippine peso (Peso), the Parent Company’s functional currency. All values are rounded to the
nearest peso, except when otherwise indicated.
As of June 30, 2012, the Company did not conduct an evaluation of the impact of the Philippine
Financial Reporting Standards 9, Financial Instruments: Classification and Measurement, in its
financial statements. The Company does not also intend to adopt PFRS 9 in its December 31,
2012 annual financial statements. The Company will assess the impact of PFRS 9 in its financial
statements upon completion of all the phases of PFRS 9.
3. Significant Accounting Policies
The accounting policies adopted in the preparation of the unaudited interim condensed
consolidated financial statements are consistent with those followed in the preparation of the
Company’s annual consolidated financial statements as of and for the year ended December 31,
2011, except for the accounting for cash flow hedge.
Cash flow hedges
Cash flow hedges are hedges of the exposure to variability in cash flows that are attributable to a
particular risk associated with a recognized asset, liability or highly probable forecast transaction
and could affect the consolidated statement of income. The effective portion of the gain or loss on
the hedging instrument is recognized as other comprehensive income (loss) in the "Cumulative
translation adjustments" account in the consolidated statement of financial position while the
ineffective portion is recognized as "Mark-to-market gain (loss) on derivatives" in the
consolidated statement of income.
Amounts taken to other comprehensive income (loss) are transferred to the consolidated statement
of income when the hedge transaction affects profit or loss, such as when hedged financial income
or expense is recognized or when a forecast sale or purchase occurs. Where the hedged item is the
cost of a non-financial asset or liability, the amounts taken to other comprehensive income (loss)
are transferred to the initial carrying amount of the non-financial asset or liability.
If the forecast transaction is no longer expected to occur, amounts previously recognized in other
comprehensive income (loss) are transferred to the consolidated statement of income. If the
hedging instrument expires or sold, terminated or exercised without replacement or rollover, or if
its designation as hedge is revoked, amounts previously recognized in other comprehensive
income (loss) remain in equity until the forecast transaction occurs. If the related transaction is
not expected to occur, the amount is recognized in the consolidated statement of income.
The company uses cross currency swaps to partially hedge its exposure to foreign currency and
interest rate risks on its floating rate Club Loan that is benchmarked against US LIBOR and with
flexible interest reset feature
- 6 -
The following new and amended accounting standards have became effective beginning
January 1, 2012.
PAS 12, Income Taxes - Recovery of Underlying Assets
The amendment clarified the determination of deferred tax on investment property measured
at fair value. The amendment introduces a rebuttable presumption that deferred tax on
investment property measured using the fair value model in PAS 40, Investment Property,
should be determined on the basis that its carrying amount will be recovered through sale.
Furthermore, it introduces the requirement that deferred tax on non-depreciable assets that are
measured using the revaluation model in PAS 16, Property, Plant and Equipment, always be
measured on a sale basis of the asset. The amendment becomes effective for annual periods
beginning on or after January 1, 2012. The amendment has no impact on the Company’s
financial position or performance.
PFRS 7, Financial Instruments: Disclosures - Enhanced Derecognition Disclosure
Requirements
The amendment requires additional disclosure about financial assets that have been transferred
but not derecognized to enable the user of the Company’s financial statements to understand
the relationship with those assets that have not been derecognized and their associated
liabilities. In addition, the amendment requires disclosures about continuing involvement in
derecognized assets to enable the user to evaluate the nature of, and risks associated with, the
entity’s continuing involvement in those derecognized assets. The amendment becomes
effective for annual periods beginning on or after July 1, 2011. The amendment affects
disclosures only and has no impact on the Company’s financial position or performance
4. Operating Segment Information
The Company’s operating businesses are organized and managed separately according to the
nature of the products and services provided, with each segment representing a strategic business
unit that offers different products and serves different markets.
The Company’s identified operating segments below are consistent with the segments reported to
the Board of Directors (BOD), which is the Chief Operating Decision Maker (CODM) of the
Company.
a. Electricity segment - This segment pertains to: (1) EDC’s power plants covered mainly by
long-term PPAs with NPC; (2) FG Hydro’s spot sales to the WESM and with various DUs
covered by TPSCs; and (3) GCGI’s sales to WESM and to various NPC-assigned and new
customers covered by Power Supply Contracts and Power Supply Agreements, respectively.
b. Steam segment - This segment relates to EDC’s sale of steam to NPC plants covered by SSAs.
c. All other segments - This segment relate to segment performing drilling services for Lihir
Gold Ltd. in Papua New Guinea.

- 7 -
The Company has one geographical segment since it derives principally all its revenues from
domestic operations. Revenue from drilling services outside the Philippines is not material.
Management monitors the operating results of the business segments separately for the purpose of
making decisions about resources to be allocated and of assessing performance. Finance costs,
finance income, income taxes and other charges and income are managed on a group basis.
All of the Company’s operations are in the Philippines and revenues generated are from domestic
operations except for revenue included in “All Other Segments” category, which is from drilling
services rendered to Lihir Gold Ltd.
Segment performance is evaluated based on net income (loss) for the period and earnings before
interest, taxes, and depreciation and amortization (EBITDA). Net income (loss) for the period is
measured consistent with consolidated net income (loss) in the unaudited interim condensed
consolidated financial statements. EBITDA is calculated as total revenues minus total operating
expenses except non-cash items such as depreciation and amortization, impairment loss on
property, plant and equipment, and loss on disposal of property, plant and equipment of a
subsidiary among others.
NPC is the main customer for the electricity segment which comprised 44% of the total electricity
revenue for the period ended June 30, 2012 and 59% for the period ended June 30, 2011 and the
only external customer for the steam segment, particularly for the BMGPP. However, following
the acquisition by BGI of the BMGPP in September 2010 and the subsequent rehabilitation of
these assets, the Parent Company ceased to bill NPC. In 2011, PSALM approved the request of
EDC to extend the waiver of billings and collections under Bac-Man steam contracts until: (a) the
execution of the deed of assignment from NPC/PSALM to BGI; or (b) such time that the BMGPP
resumes operations.
Financial information on the operating segments are summarized as follows:
Electricity Steam
All Other
Segments
Eliminations Total
For the Six-Month Period Ended
June 30, 2012
Segment revenue from external
customers P=15,023,410,507 P=– P=345,221,433 P=– P=15,368,631,940
Intersegment revenue 377,058,607 2,917,010,371 – (3,294,068,978) –
Total segment revenue 15,400,469,114 2,917,010,371 345,221,433 (3,294,068,978) 15,368,631,940
Segment expenses (9,207,712,237) (1,871,673,030) (225,153,847) 3,294,068,978 (8,010,470,136)
Segment results P=6,192,756,877 P=1,045,337,341 P=120,067,586 P=– 7,358,161,804
Unallocated interest expense (1,920,244,374)
Unallocated other income - net 626,949,238
Unallocated income taxes (390,608,119)
Unallocated interest income 180,775,443
Unallocated segment expenses (124,104,241)
Net income P=5,730,929,751
EBITDA P=7,736,106,419 P=1,239,476,480 P=129,529,267 P=– P=9,105,112,166
Unallocated expenses (124,015,066)
P=8,981,097,100

- 8 -
Electricity Steam All Other Segments
Eliminations Total
For the Six- Month Period Ended
June 30, 2011
Segment revenue from external customers P=11,408,776,024 P=– P=326,711,529 P=– P=11,735,487,553
Intersegment revenue 148,099,226 3,326,903,205 – (3,475,002,431) –
Total segment revenue 11,556,875,250 3,326,903,205 326,711,529 (3,475,002,431) 11,735,487,553 Segment expenses (13,599,011,990) (2,032,735,518) (297,657,553) 3,475,002,431 (12,454,402,630)
Segment results (P=2,042,136,740) P=1,294,167,687 P=29,053,976 P=– (718,915,077)
Unallocated interest expense (2,314,926,228) Unallocated income taxes 306,810,913
Unallocated other income - net 240,319,469
Unallocated interest income 217,873,134 Unallocated segment expenses (28,044,904)
Net loss (P=2,296,882,693)
EBITDA P=4,693,314,878 P=1,738,491,733 P=38,312,316 P=– P=6,470,118,927
Unallocated expenses
(27,898,355)
P=6,442,220,572
Electricity Steam
All Other
Segments
Eliminations Total
As of and for the Six-Month
Period Ended June 30, 2012
Segment assets P=40,075,039,522 P=13,857,039,775 P=2,693,280,852 P=– P=56,625,360,149
Unallocated corporate assets 35,314,130,269 35,314,130,269
Total assets P=91,939,490,418
Segment liabilities P=37,041,076,692 P=19,915,770,034 P=1,692,111,455 P=– P= 58,648,958,181
Unallocated corporate liabilities 1,168,437,767
Total liabilities P=59,817,395,948
Capital expenditure P=1,811,017,956 P=1,314,196,764 P=166,829,831 P=– P=3,292,044,551
Unallocated capital expenditure 470,379,610
Total capital expenditure P=3,762,424,161
Depreciation and amortization (P=1,512,181,485) (P=222,996,785) (P=9,461,681) P=– (P=1,744,639,951)
Unallocated depreciation and
amortization
(89,176)
Total depreciation and
amortization
(P=1,744,729,127)
Other non-cash items (P=139,206,463) (P=38,429,108) P=788 P=– (P=177,634,783)
Unallocated non-cash items 728,321,965
Total other non-cash items P=550,687,182
Electricity Steam All Others Eliminations Total
As of and for the Year Ended
December 31, 2011
Segment assets P=59,324,793,038 P=12,376,428,799 P=4,066,696,844 P=– P=75,767,918,681
Unallocated corporate assets 14,249,898,103
Total assets P=90,017,816,784
Segment liabilities P=36,727,310,548 P=20,589,217,647 P=1,774,574,665 P=– P=59,091,102,860
Unallocated corporate liabilities 1,280,112,431
Total liabilities P=60,371,215,291
Capital expenditure P=4,711,615,736 P=3,832,071,716 P=158,656,411 P=– P=8,702,343,863
Unallocated capital expenditure 596,087,898
Total capital expenditure P=9,298,431,761

- 9 -
Electricity Steam All Others Eliminations Total
Depreciation and amortization (P=3,035,691,787) (P=386,991,348) (P=18,973,159) P=– (P=3,441,656,294)
Unallocated depreciation and
amortization
(218,203)
Total depreciation and amortization (P=3,441,874,497)
Impairment loss P=4,998,608,008 P=– P=– P=– P=4,998,608,008
Other non-cash items (P=305,215,436) (P=340,416,065) (P=198,180) P=– (P=645,829,681)
Unallocated non-cash items 23,722,640
Total other non-cash items (P=622,107,041)
Electricity Steam
All Other
Segments
Eliminations Total
As of and for the Six-month
Period Ended June 30, 2011
Segment assets P=57,186,600,811 P=10,607,904,902 P=1,657,575,734 P=– P=69,452,081,447
Unallocated corporate assets 14,825,256,718
Total assets P=84,277,338,165
Segment liabilities P=35,440,653,954 P=18,715,194,955 P=1,481,933,257 P=– P=55,637,782,166
Unallocated corporate liabilities 1,895,430,780
Total liabilities P=57,533,212,946
Capital expenditure P=2,533,841,495 P=1,848,004,895 P=42,566,663 P=– P=4,424,413,053
Unallocated capital expenditure 95,355,417
Total capital expenditure P=4,519,768,470
Depreciation and amortization (P=1,620,820,910) (P=185,746,448) (P=9,258,340) P=– (P=1,815,825,698)
Unallocated depreciation and amortization
(146,549)
Total depreciation and amortization (P=1,815,972,247)
Impairment loss (P=4,998,608,008) P=– P=– P=– (P=4,998,608,008)
Other non-cash items (P=207,307,140) (P=299,159,920) (P=198,180) P=– (P=506,665,240)
Unallocated non-cash items 405,435,404
Total other non-cash items (P=101,229,836)
The following table shows the Company’s reconciliation of EBITDA to the consolidated net
income (loss) for the six-month periods ended June 30, 2012 and 2011.
2012 2011
EBITDA P=8,981,097,100 P=6,442,220,572
Add (Deduct):
Interest expense (Note 18) (1,920,244,374) (2,314,926,228)
Depreciation and amortization (Note 8) (1,744,729,127) (1,815,972,247)
Foreign exchange gains - net (Note 20) 694,335,379 236,833,940
Benefit from (provision for) income tax (390,608,119) 306,810,913
Interest income (Note 19) 180,775,443 217,873,134
Provision for doubtful accounts (Note 17) (40,564,481) (211,273,157)
Reversal of (provision for) impairment of parts and supplies
inventories (Note 17) 38,254,070 (163,327,141)
Impairment loss on property, plant and equipment of NNGP
(Note 8) – (4,998,608,008)
Derivatives loss - net (Note 24) – (8,973,485)
Miscellaneous - net (Note 21) (67,386,140) 12,459,014
Consolidated net income (loss) P=5,730,929,751 (P=2,296,882,693)
The Parent Company has intersegment revenue from/to GCGI for the sale of steam/electricity.
Intersegment revenues are all eliminated in consolidation. Segment information is measured in

- 10 -
conformity with the accounting policies adopted for preparing and presenting the consolidated
financial statements. Intersegment revenue are made at normal commercial terms and conditions.
Unallocated expenses pertain to expenses of the corporate, technical and administrative support
groups while unallocated corporate assets and liabilities which include among others certain cash
and cash equivalents, property, plant and equipment, parts and supplies inventories, trade and
other payables and retirement and post-employment benefits, pertain to the Head Office and are
managed on a group basis.
5. Cash and Cash Equivalents
June 30,
2012
(Unaudited)
December 31,
2011
(Audited)
June 30,
2011
(Unaudited)
Cash on hand and in banks P=1,759,636,785 P=692,764,092 P=584,586,674
Cash equivalents 9,496,336,214 11,800,642,871 10,315,778,927
P=11,255,972,999 P=12,493,406,963 P=10,900,365,601
Cash in banks earn interest at the respective bank deposit rates. Cash equivalents consist of
money market placements, which are made for varying periods of up to three months depending
on the immediate cash requirements of the Company.
6. Trade and Other Receivables
June 30,
2012
(Unaudited)
December 31,
2011
(Audited)
June 30,
2011
(Unaudited)
Trade P=3,648,645,683 P=3,336,433,682 P=2,559,872,060
Others:
Loans and notes receivables 67,834,139 59,331,933 56,370,413
Non-trade accounts receivable 66,851,887 99,398,810 54,110,493
Advances to employees 58,268,872 37,934,595 30,148,448
Employee receivables 8,294,501 8,896,656 9,563,941
Claims receivable 147,473 153,322 133,971
Total other receivables 201,396,872 205,715,316 150,327,266
3,850,042,555 3,542,148,998 2,710,199,326
Less allowance for doubtful accounts 131,153,532 130,839,470 129,835,048
P=3,718,889,023 P=3,411,309,528 P=2,580,364,278
Trade receivables are noninterest-bearing and are generally collectible in 30 to 60 days. Majority
of the Company’s trade receivables came from revenues from sale of electricity to NPC.
Provision for doubtful accounts recognized for the six-month periods ended June 30, 2012 and
2011 amounted to P=0.31 million and P=94.45 million, respectively (see Note 17).

- 11 -
7. Parts and Supplies Inventories
June 30,
2012
(Unaudited)
December 31,
2011
(Audited)
June 30,
2011
(Unaudited,
Restated)
On hand:
Drilling tubular products and
equipment spares P=1,681,624,312 P=1,648,876,310 P=1,478,183,479
Power plant spares 712,182,128 718,777,618 752,853,323
Pump, production/steam gathering
system, steam turbine, valves
and valve spares
437,749,545 305,461,738
293,616,617
Electrical, cable, wire product and
compressor spares
104,793,187 83,543,105
81,931,813
Heavy equipment spares 92,515,925 90,293,956 59,003,908
Chemical products, gases and catalyst 91,043,513 113,397,104 260,853,086
Automotive, mechanical, bearing,
seals, v-belt, gasket, tires and
batteries
51,060,278 39,385,963
39,915,598
Construction and hardware supplies,
stationeries and office supplies,
hoses, communication and other
spares and supplies
60,567,182 20,268,296
13,099,285
Measuring instruments, indicators and
tools, safety equipment and
supplies
38,102,971 28,640,098
34,007,586
3,269,639,041 3,048,644,188 3,013,464,695
In transit 2,196,041 307,123,465 316,725,766
P=3,271,835,082 P=3,355,767,653 P=3,330,190,461
Inventories in transit include items not yet received but ownership or title to the goods has already
passed to the Company.

- 12 -
8. Property, Plant and Equipment
June 30, 2012 (Unaudited)
Land Power Plants
Fluid Collection
and Recycling
System (FCRS)
and Production
Wells
Buildings,
Improvements
and Other
Structures
Exploration,
Machinery and
Equipment
Transportation
Equipment
Furniture,
Fixtures and
Equipment
Laboratory
Equipment
Major Spares
and Others
Construction
in-Progress Total
Cost
Balances at January 1, 2012 P=379,809,254 P=37,204,980,737 P=20,651,972,508 P= 2,246,291,592 P=4,074,330,782 P=85,355,600 P=659,065,713 P=580,618,276 P=57,649,072 P= 9,517,751,748 P=75,457,825,282
Additions 46,069 100,491 60,019,734 112,429,723 440,048,897 12,791,764 109,975,382 12,166,095 66,812,672 2,868,068,419 3,682,459,246
Disposals/Retirements/Write-off – – – (97,658) (8,681,303) (280,022) (546,394) (116,185) (333,685) – (10,055,247)
Reclassifications – (2,251,994) 1,257,705,873 (29,276,489) (20,457,594) (12,738,218) (30,528,686) (16,760,810) (14,720,657) (1,701,995,178) (571,023,753)
Balances at June 30, 2012 379,855,323 37,202,829,234 21,969,698,115 2,329,347,168 4,485,240,782 85,129,124 737,966,015 575,907,376 109,407,402 10,683,824,989 78,559,205,528
Accumulated Depreciation and Impairment
Balances at January 1, 2012 17,255,629 7,867,549,819 6,368,571,711 429,037,601 1,949,150,666 34,764,668 347,350,269 172,673,077 3,678,839 590,863,997 17,780,896,276
Depreciation for the year – 1,049,861,783 400,726,949 45,578,046 74,707,556 6,055,893 89,323,721 30,379,601 – – 1,696,633,549
Reversal of impairment – NNGP (Note 8) – (63,614,885) – – – – – – – – (63,614,885)
Disposals/Retirements/Write-off – – – (97,657) (7,642,148) (235,522) (515,903) (116,177) – – (8,607,407)
Reclassifications – (589,307) – (3,364,204) 35,709,135 (13,049,054) (33,436,925) (12,030,083) – – (26,760,438)
Balances at June 30, 2012 17,255,629 8,853,207,410 6,769,298,660 471,153,786 2,051,925,209 27,535,985 402,721,162 190,906,418 3,678,839 590,863,997 19,378,547,095
Net Book Value P=362,599,694 P=28,349,621,824 P=15,200,399,455 P=1,858,193,382 P=2,433,315,573 P=57,593,139 P= 335,244,853 P= 385,000,958 P=105,728,563 P=10,092,960,992 P=59,180,658,433
December 31, 2011 (Audited)
Land Power Plants
FCRS and
Production Wells
Buildings,
Improvements
and Other
Structures
Exploration,
Machinery and
Equipment
Transportation
Equipment
Furniture,
Fixtures and
Equipment
Laboratory
Equipment
Major Spares
and Others
Construction
in-Progress Total
Cost
Balances at January 1, 2011 P=333,924,551 P=36,607,352,559 P=17,392,141,146 P=1,798,591,948 P=3,803,840,502 P=67,240,415 P=495,684,907 P=456,421,470 P=53,030,079 P=5,021,702,358 P=66,029,929,935
Additions 45,884,703 – 344,150,911 419,864,968 278,703,487 36,618,569 210,525,800 132,783,958 44,533,825 8,023,408,213 9,536,474,434
Disposals/Retirements/Write-off – (35,988,750) – (1,094,655) (1,812,341) (1) (1,899,186) (344,455) (583,522) – (41,722,910)
Reclassifications – 633,616,928 2,915,680,451 28,929,331 (6,400,866) (18,503,383) (45,245,808) (8,242,697) (39,331,310) (3,527,358,822) (66,856,176)
Balances at December 31, 2011 379,809,254 37,204,980,737 20,651,972,508 2,246,291,592 4,074,330,782 85,355,600 659,065,713 580,618,276 57,649,072 9,517,751,749 75,457,825,283
Accumulated Depreciation and Impairment
Balances at January 1, 2011 – 4,054,656,189 3,256,620,699 287,626,674 1,462,628,729 42,658,867 233,098,901 89,502,206 – – 9,426,792,265
Depreciation for the year – 2,158,122,126 692,852,385 84,957,014 258,849,165 4,939,887 85,937,845 60,024,918 – – 3,345,683,340
Impairment - NNGP 17,255,629 1,662,635,857 2,419,098,627 56,658,530 141,579,492 8 74,681,583 32,155,446 3,678,839 590,863,997 4,998,608,008
Disposals/Retirements/Write-off – (7,864,353) – (248,578) (1,805,755) – (1,667,039) (344,417) – – (11,930,142)
Reclassifications – – – 43,961 87,899,035 (12,834,094) (44,701,020) (8,665,076) – – 21,742,805
Balances at December 31, 2011 17,255,629 7,867,549,819 6,368,571,711 429,037,601 1,949,150,666 34,764,668 347,350,270 172,673,077 3,678,839 590,863,997 17,780,896,277
Net Book Value P=362,553,625 P=29,337,430,918 P=14,283,400,797 P=1,817,253,991 P=2,125,180,116 P=50,590,932 P=311,715,443 P=407,945,199 P=53,970,233 P=8,926,887,752 P=57,676,929,006

- 13 -
June 30, 2011 (Unaudited)
Land Power Plants
FCRS and
Production Wells
Buildings,
Improvements
and Other
Structures
Exploration,
Machinery and
Equipment
Transportation
Equipment
Furniture,
Fixtures and
Equipment
Laboratory
Equipment
Major Spares
and Others
Construction
in-Progress Total
Cost
Balance at January 1, 2011 P=333,924,551 P=36,607,352,559 P=17,392,141,146 P=1,798,591,947 P=3,803,840,502 P=67,240,415 P=495,684,907 P=456,421,470 P=53,030,079 P=5,097,727,288 P=66,105,954,864
Additions 45,811,538 6,089,286 304,026,186 284,926,579 101,637,695 22,324,167 25,236,964 63,485,929 – 3,970,256,312 4,823,794,656
Retirements/Write-off – – – (1,705,554) (4,991,340) (9,706,446) (33,879,055) (3,268,931) 5,208,787 – (48,342,539)
Reclassifications – 458,192,273 653,455,054 7,787,852 (2,880,241) – (2,641,774) – – (1,191,959,288) (78,046,124)
Balance at June 30, 2011 379,736,089 37,071,634,118 18,349,622,386 2,089,600,824 3,897,606,616 79,858,136 484,401,042 516,638,468 58,238,866 7,876,024,312 70,803,360,857
Accumulated Depreciation and Impairment
Balance at January 1, 2011 – 4,054,656,188 3,256,620,699 287,626,673 1,462,628,729 42,658,867 233,098,900 89,502,206 – – 9,426,792,262
Depreciation for the period – 1,106,456,718 372,518,855 51,115,148 162,892,046 5,424,497 43,798,156 25,671,249 – – 1,767,876,669
Impairment – NNGP 17,255,629 1,662,635,857 2,419,098,627 56,658,530 141,579,499 – 74,681,583 32,155,446 3,678,839 590,863,998 4,998,608,008
Retirements/Write-off – – – (926,227) (4,950,214) (9,706,432) (29,833,362) (2,668,003) (7,154) – (48,091,392)
Reclassifications – – – (539,402) 55,048,756 (143,177) (3,653,752) (438,432) – – 50,273,993
Balance at June 30, 2011 17,255,629 6,823,748,763 6,048,238,181 393,934,722 1,817,198,816 38,233,755 318,091,525 144,222,466 3,671,685 590,863,998 16,195,459,540
Net Book Value P=362,480,460 P=30,247,885,355 P=12,301,384,205 P=1,695,666,102 P=2,080,407,800 P=41,624,381 P=166,309,517 P=372,416,002 P=54,567,181 P=7,285,160,314 P=54,607,901,317
Impairment Assessment of NNGP
In 2011, after the five-month shutdown of the NNGP since November 22, 2010, the Northern Negros Geothermal Plant was operated during April to June to
complete the geothermal resource testing. Based on of the he subsequent technical assessment, EDC has come to a conclusion that the sustainable operation
of NNGP is only at 5-10 MW.
The Company evaluates the assets on a CGU basis for any indication of impairment at each reporting date. The Company assessed that there continues to be
an indication of impairment for NNGP and based on its impairment testing, recognized an impairment loss of P=4,998.6 million in June 2011.
In February 2012, EDC transferred vacuum pumps from NNGP to the Tongonan Power Plant (TPP) owned by GCGI. Since these assets can still be utilized
and included in the CGU of the TPP, the Company recognized a corresponding reversal of impairment loss amounting to P=63.6 million, representing the book
value of the assets transferred had no impairment loss been previously recognized (Note 21).
Estimated Rehabilitation and Restoration Costs
FCRS and production wells include the estimated rehabilitation and restoration costs of the Company’s steam fields and power plants’ contract areas at the
end of the contract period. These costs, net of accumulated amortization, amounted to P=362.98illion and P=311.98 million as of June 30, 2012 and December
31, 2011, respectively. As of June 30, 2012 and December 31, 2011, the provision for rehabilitation costs under “Other long-term liabilities” amounted to P=
483.49 million and P=406.78 million, respectively.

- 14 -
Details of depreciation and amortization charges recognized in the consolidated statements of income are shown below:
June 30,
2012
(Unaudited)
December 31,
2011
(Audited)
June 30,
2011
(Unaudited)
Property, plant and equipment P=1,696,633,549 P=3,345,683,340 P=1,767,876,669
Water rights (Note 9) 48,095,578 96,191,157 48,095,578
P=1,744,729,127 P=3,441,874,497 P=1,815,972,247
Cost of sales of electricity (Note 15) P=1,570,463,185 P=3,173,306,732 P=1,688,336,647
Cost of drilling services (Note 16) 575,835 1,110,041 430,145
General and administrative (Note 17) 173,690,107 267,457,724 127,205,455
P=1,744,729,127 P=3,441,874,497 P= 1,815,972,247

- 15 -
9. Intangible Assets
June 30, 2012 (Unaudited)
Goodwill Water Rights
Other
Intangible Asset Total
Cost
Balances at January 1, 2012 P=2,535,051,530 P=2,404,778,918 P=258,394,939 P=5,198,225,387
Additions – – 50,828,544 50,828,544
Balances at June 30, 2012 2,535,051,530 2,404,778,918 309,223,483 5,249,053,931
Accumulated Amortization
Balances at January 1, 2012 – 492,979,678 – 492,979,678
Amortization (Note 8) – 48,095,578 – 48,095,578
Balances at June 30, 2012 – 541,075,256 – 541,075,256
Net Book Value P=2,535,051,530 P=1,863,703,662 P=309,223,483 P=4,707,978,675
December 31, 2011 (Audited)
Goodwill Water Rights
Other
Intangible Asset Total
Cost
Balances at January 1, 2011 P=2,535,051,530 P=2,404,778,918 P=– P=4,939,830,448
Additions – – 258,394,939 258,394,939
Balances at December 31, 2011 2,535,051,530 2,404,778,918 258,394,939 5,198,225,387
Accumulated Amortization
Balances at January 1, 2011 – 396,788,522 – 396,788,522
Amortization (Note 8) – 96,191,157 – 96,191,157
Balances at December 31, 2011 – 492,979,679 – 492,979,679
Net Book Value P=2,535,051,530 P=1,911,799,239 P=258,394,939 P=4,705,245,708
June 30, 2011 (Unaudited)
Goodwill Water Rights
Other
Intangible Asset Total
Cost
Balances at January 1, 2011 P=2,535,051,530 P=2,404,778,918 P=– P=4,939,830,448
Additions – – 213,099,870 213,099,870
Accumulated Amortization
Balances at January 1, 2011 – 396,788,522 – 396,788,522
Amortization (Note 8) – 48,095,578 – 48,095,578
Balances at June 30, 2011 – 444,884,100 – 444,884,100
Net Book Value P=2,535,051,530 P=1,959,894,818 P=213,099,870 P=4,708,046,218
Water rights are amortized using the straight-line method over 25 years, which is the term of the
Agreement with National Irrigation Administration. The remaining amortization period of water
rights is 19.4 years as of June 30, 2012.
Other intangible asset pertains to the Company’s wind energy project development costs.

- 16 -
10. Other Noncurrent Assets
June 30,
2012
(Unaudited)
December 31,
2011
(Audited)
June 30,
2011
(Unaudited)
Input value-added tax (VAT) P=3,900,803,376 P=3,270,286,773 P=2,506,756,658
Tax credit certificates 1,338,884,446 1,338,884,447 1,038,884,446
AFS investments 605,639,146 20,443,924 20,756,197
Special deposits and funds 134,321,328 123,278,392 98,513,069
Long-term receivables 62,985,259 81,561,056 51,470,083
Prepaid expenses 12,262,967 12,246,824 13,584,248
Others 153,545,818 27,670,094 186,823,992
6,208,442,340 4,874,371,510 3,916,788,693
Less allowance for doubtful
accounts
462,691,435 422,722,403
226,401,941
P=5,745,750,905 P=4,451,649,107 P=3,690,386,752
Provision for doubtful accounts pertaining to input VAT and long-term receivables amounted to
P=40.25 million and P=116.82 million for the six-month periods June 30, 2012 and 2011,
respectively (Note 17).
11. Trade and Other Payables
June 30,
2012
(Unaudited)
December 31,
2011
(Audited)
June 30,
2011
(Unaudited)
Accounts payable:
Third parties P=6,179,538,202 P=4,653,828,081 P=4,171,338,859
Related parties (Note 23) 265,921,114 145,143,240 126,572,784
Accrued interest and guarantee
fees
779,443,062 1,047,605,943
1,211,742,356
Withholding and other taxes
payable
288,852,053 328,466,441
215,087,460
SSS and other contributions
payable
2,269,373 1,893,569
2,361,164
Deferred credits 22,974,635 22,095,129 184,725,515
Other payables 85,848,937 505,042,858 85,627,309
P=7,624,847,376 P=6,704,075,261 P=5,997,455,447
Accounts payable are noninterest-bearing and are normally settled on a 30 to 60 days payment
term.
The accrued interest represents interest accrual on outstanding loans.

- 17 -
12. Long-term Debts
June 30,
2012
(Unaudited)
December 31,
2011
(Audited)
June 30,
2011
(Unaudited)
US Dollar-denominated debts P=19,765,140,505 P=13,003,311,706 P=20,289,811,386
Japanese Yen-denominated debts – 20,252,444 62,936,059
Peso-denominated debts 30,123,958,805 38,466,007,305 28,572,188,326
49,889,099,310 51,489,571,455 48,924,935,771
Less current portion 1,615,630,737 2,249,517,382 1,833,048,809
Noncurrent portion P=48,273,468,573 P=49,240,054,073 P=47,091,886,962
Issuance of Fixed Rate Note (FXCN) and Prepayment of Fixed Rate Corporate Note (FRCN)
On April 4, 2012, EDC signed a 10-year FXCN facility agreement amounting to P=7,000.00
million. EDC used the proceeds to pay off in full its existing FRCN loan. On April 4, 2012, EDC
prepaid series one and three for P=1,774.32 million and P=1,007.07 million, respectively.
Subsequently, on May 3, 2012, the FRCN series two was also prepaid for P=4,211.10 million. The
extinguished FRCN series one and three loans are originally scheduled to mature in July 2014
while the extinguished FRCN series two is originally scheduled to mature on July 2016.
EDC recognized loss amounting to P=114.68 million arising from early extinguishment of debt
(Note 21).
Debt issuance costs amounting to P=51.05 million was capitalized as part of the new FXCN.
Overseas Economic Cooperation Fund (OECF)
On April 8, 2011, the Parent Company prepaid the JP¥8.1 billion (P=4,260.6 million) 21st Yen loan
with Japan International Cooperation Agency (JICA), a successor institution of the OECF (Japan).
The 21st Yen loan is originally scheduled to mature in March 2027.
On June 10, 2011, the Parent Company prepaid the OECF 19th Yen loan balance of JP¥218.6
million (P=117.4 million) originally scheduled to mature in December 2024. On June 17, 2011, the
Company has fully settled its OECF 9th Yen loan of JP¥207.7 million (P=111.5 million).
On July 20, 2011, the Parent Company prepaid the OECF 18th Yen loan balance of JP¥45.3
million (P=24.3 million) originally scheduled to mature in January 2023.
On January 31, 2012, EDC fully settled its matured JP¥1.5 billion OECF 8th Yen loan amounting to
P=20.25 million.
US$300.0 million Notes
On January 20, 2011, EDC issued a 10-year US$300.0 million Notes (P=13,350.0 million) at 6.50%
interest per annum which will mature on January 2021. The notes are intended to be used by the
Company to support the business expansion plans, finance capital expenditures, service debt
obligations and for general corporate purposes.
International Finance Corporation (IFC)
On May 20, 2011, the Parent Company signed a 15-year US$75.0 million loan facility with the
IFC to fund its medium-term capital expenditures program. The loan was drawn in Peso on
September 30, 2011, amounting to P=3,262.5 million. The loan is payable in 24 equal semi-annual
installments after a three-year grace period at an interest rate of 6.657% per annum.

- 18 -
Syndicated Loan Facility
On June 17, 2011, the Parent Company entered into a credit agreement for US$175.00 million
(P=7,630.00 million) syndicated term loan facility (Club Loan) with Australia New Zealand
Banking Group Limited, The Bank of Tokyo-Mitsubishi UFJ, Ltd., Chinatrust (Philippines)
Commercial Banking Corporation, ING Bank N.V., Manila Branch, Maybank Group, Mizuho
Corporate Bank, Ltd., and Standard Chartered Bank as Mandated Lead Arrangers and
Bookrunners, and Standard Chartered Bank as Facility Agent. The purpose of the Club Loan is to
refinance the old US$175.00 million syndicated term loan which was availed on June 30, 2010 to
mature on June 30, 2013. The Club Loan, which was fully drawn as of agreement date, bears
interest based on the prevailing LIBOR plus spread of 175 basis points. The prevailing LIBOR
shall be based on term of 1-month, 3-month or 6-month depending on what interest reset
frequency EDC selects at the end of each term. The Club Loan will mature on June 17, 2017.
The Company’s foreign-currency denominated long-term debts were translated into Peso based on
the prevailing foreign exchange rates at financial reporting date (US$1=JP¥ 79.447:
US$1=P=42.12 as of June 30, 2012, US$1=JP¥77.912 USD1=P=43.84 as of December 31, 2011 and
US$1=JP¥80.743: USD1=P=43.330 as of June 30, 2011).
13. Royalty Fee Payable
June 30,
2012
(Unaudited)
December 31,
2011
(Audited)
June 30,
2011
(Unaudited)
Due to DOE and Local
Government Units (LGUs) P=142,740,508 P=287,626,313 P=429,643,462
Less current portion 142,740,508 287,626,313 295,914,471
Noncurrent portion P=– P=– P=133,728,991
As discussed in the nature of operations in Note 1, the Parent Company entered into five GSCs
with the DOE, which granted the Company the right to explore, develop, and utilize the country’s
geothermal resources subject to sharing of net proceeds with the Philippine Government. The
Parent Company pays royalty fees to the DOE and LGUs under the agreements.
14. Equity
As required under the Philippine Constitution, the Parent Company is subject to the nationality
requirement that at least sixty percent (60%) of its capital stock must be owned by Filipino citizens
since it is engaged in the exploration and exploitation of the country’s energy resources. The
Parent Company is compliant with the said nationality requirement.
Beginning December 13, 2006, the 15.0 billion common shares of the EDC were listed and traded
on the Philippine Stock Exchange (PSE) at an Initial Public Offering (IPO) price of P=3.20 per
share. After the initial IPO, there are no subsequent listings of shares by the Parent Company.
The combined interest of Red Vulcan entitles it to 60% voting interest and 40% economic interest
in EDC.

- 19 -
The ownership of the Parent Company’s preferred shares is limited to Filipino citizens. The
preferred shares have voting rights and subject to 8% cumulative interest. Red Vulcan holds the
entire 9.4 billion preferred shares equivalent to 20% voting interest in EDC. The common shares
are majority held by Filipinos, with Red Vulcan holding 7.5 billion shares or an equivalent of 40%
interest.
Issued and outstanding preferred and common shares as of June 30, 2012 and 2011 and
December 31, 2011 are as follows:
Number of Shares
Preferred stock - P=0.01 par value per share
Authorized 15,000,000,000
Issued and outstanding 9,375,000,000
Common stock - P=1 par value per share
Authorized 30,000,000,000
Issued and outstanding 18,750,000,000
The number of stockholders of the Parent Company as of June 30, 2012 and 2011, and
December 31, 2011 are as follows:
June 30,
2012
December 31,
2011
June 30,
2011
Preferred shares 1 1 1
Common shares 700 702 712
Retained Earnings
On March 13, 2012, the BOD of the Parent Company approved the following cash dividends in
favor of all stockholders of record as of March 28, 2012 and payable on or before April 24, 2012:
cash dividend of P=0.0008 per share on the preferred shares totaling P=7.5 million
cash dividend of P=0.10 per share on the common shares totaling P=1,875.0 million
On March 15, 2011, the BOD of the Parent Company approved the following cash dividends in
favor of all stockholders of record as of March 29, 2011 and payable on or before April 22, 2011:
cash dividend of P=0.0008 per share on the preferred shares totaling P=7.5 million
cash dividend of P=0.16 per share on the common shares totaling P=3,000.0 million
NCI
In March and May 2012, FG Hydro declared and paid cash dividends to its preferred and common
shares amounting to P=88.5 million and P=1,254.0 million, respectively.
In June 2011 and May 2010, FG Hydro declared and paid cash dividends to its preferred shares
and common shares amounting to P=333.8 million and P=240.0 million, respectively.

- 20 -
15. Cost of Sales of Electricity
June 30,
2012
(Unaudited)
June 30,
2011
(Unaudited)
Purchased services and utilities (Note 23) P=1,790,337,621 P=848,735,460
Depreciation and amortization 1,570,463,185 1,688,336,647
Personnel costs 815,553,989 748,535,029
Rental, insurance and taxes 547,195,669 503,289,303
Repairs and maintenance 532,366,303 624,865,933
Parts and supplies issued 427,026,017 446,194,240
Royalty fees 96,168,845 103,958,994
Proceeds from insurance claims (85,903,339) –
Business and related expenses 33,557,372 46,352,841
P=5,726,765,662 P=5,010,268,447
16. Cost of Drilling Services
June 30,
2012
(Unaudited)
June 30,
2011
(Unaudited)
Purchased services and utilities P=138,427,486 P=145,006,530
Rental, insurance and taxes 42,473,409 19,513,545
Parts and supplies issued 22,806,096 40,812,644
Repairs and maintenance 3,701,564 29,702,687
Business and related expenses 3,281,875 25,883,315
Depreciation 575,835 430,145
Personnel costs 215,546 17,575,624
P=211,481,811 P=278,924,490
17. General and Administrative Expenses
June 30,
2012
(Unaudited)
June 30,
2011
(Unaudited)
Personnel costs P=768,641,981 P=713,533,751
Purchased services and utilities 565,476,339 443,374,398
Rental, insurance and taxes 371,235,918 287,502,613
Business and related expenses 204,931,743 126,750,101
Depreciation 173,690,107 127,205,455
Parts and supplies issued 86,643,883 89,166,625
Provision for doubtful accounts (Notes 4, 6 and 10) 40,564,481 211,273,157
Provision for (reversal of) impairment of parts and
supplies inventories (Note 7) (38,254,070) 163,327,141
Repairs and maintenance 23,396,522 32,513,348
P=2,196,326,904 P=2,194,646,589

- 21 -
18. Interest Expense
June 30,
2012
(Unaudited)
June 30,
2011
(Unaudited)
Interest on long-term debts including amortization
of transaction costs P=1,892,449,285 P=2,244,779,424
Interest accretion on provision for rehabilitation
and restoration costs 14,992,001 47,208,390
Interest accretion of “Day 1” gain 8,100,618 18,136,486
Interest on liability from litigation 4,702,470 3,905,553
Interest on loans payable – 896,375
P=1,920,244,374 P=2,314,926,228
19. Interest Income
June 30,
2012
(Unaudited)
June 30,
2011
(Unaudited)
Interest on placements P=158,405,283 P=198,155,762
Interest on overdue accounts/others 18,639,846 16,180,875
Interest on savings/current accounts 1,538,029 3,536,497
Accretion of “Day 1 loss” on security deposit 540,752 – Others 1,651,533 –
P=180,775,443 P=217,873,134
20. Foreign Exchange Gains - net
June 30,
2012
(Unaudited)
June 30,
2011
(Unaudited)
Foreign exchange gains on long-term debts P=799,220,321 P=702,295,276
Foreign exchange losses on other accounts (104,884,943) (465,461,336)
P=694,335,378 P=236,833,940
This account pertains to foreign exchange gains adjustments realized on repayment of loans and
restatement of outstanding balances of foreign currency-denominated loans, short-term placements
and cash in banks. The following table shows the exchange rates used to restate outstanding
balances at financial reporting dates:
Equivalent to US$1.00
Currency June 30, 2012 December 31, 2011 June 30, 2011
Japanese Yen 79.447 77.912 80.743
Philippine Peso 42.120 43.840 43.330
- 22 -
21. Miscellaneous Income (Charges)
June 30,
2012
(Unaudited)
June 30,
2011
(Unaudited)
Loss on debt extinguishment (P=114,683,892) P=–
Recovery of impairment loss on property, plant and
equipment (Note 8) 63,614,885 –
“Day 1” loss on security deposit – (6,078,723)
Others (16,317,133) 18,537,737
(P=67,386,140) P=12,459,014
22. Earnings (Loss) Per Share (EPS)
The EPS amounts were computed as follows:
June 30,
2012
(Unaudited)
June 30,
2011
(Unaudited)
(a) Net income (loss) attributable to equity
shareholders of the Parent Company P=4,618,319,943 (P=2,331,092,842)
Less dividends on preferred shares 7,500,000 7,500,000
(b) Net income attributable to common
shareholders of the Parent Company P=4,610,819,943 (P=2,338,592,842)
(c) Weighted average number
of common shares outstanding 18,750,000,000 18,750,000,000
Basic/diluted earnings (loss) per share (b/c) P=0.246 (P=0.125)
The Parent Company does not have dilutive common stock equivalents as of June 30, 2012 and
2011.
23. Related Party Transactions
Parties are considered to be related if one party has the ability, directly or indirectly, to control the
other party or exercise significant influence over the other party in making financial and operating
decisions. Parties are also considered to be related if they are subject to common control or
common significant influence.
The following are the transactions that the Company had with related parties for the six-month
periods ended June 30, 2012 and 2011.
a. Thermaprime Well Services, Inc. (Thermaprime)
Thermaprime is a subsidiary of First Balfour, a wholly owned subsidiary of First Holdings.
Thermaprime provides drilling services such as, but not limited to, rig operations, rig
maintenance, well design and engineering.
As of June 30, 2012 and 2011, the outstanding balance amounted to P=100.22 million and
P=67.00 million, respectively, recorded under “Trade and other payables” account in the
condensed consolidated financial statements.
- 23 -
b. First Balfour, Inc. (First Balfour)
First Balfour is a wholly owned subsidiary of First Holdings. In 2011, the Company awarded
to First Balfour procurement contracts for various works such as Palinpinon 1 zero condensate
disposal system, civil, structural and mechanical/ piping works in Leyte and Bac-Man, and
refurbishment of BGI’s geothermal power plants.
As of June 30, 2012 and 2011, the outstanding balance amounted to P=141.50 million and
P=56.51 million, respectively, recorded under “Trade and other payables” account in the
condensed consolidated financial statements.
c. First Gen
First Gen provides financial consultancy, business development and other related services to
the Parent Company under a consultancy agreement beginning September 1, 2008. Such
agreement is for a period of three years up to August 31, 2011. Under the terms of the
agreement, billings for consultancy services shall be P=8.70 million per month plus applicable
taxes. This was increased to P=11.80 million per month plus applicable taxes effective
September 2009 to cover the cost of additional officers and staff assigned to the Parent
Company. The consultancy agreement was subsequently extended for another 16 months
from September 1, 2011 to December 31, 2012. Total consultancy services amounted to
P=82.67 million and P=80.80 million for the six-month periods ended June 30, 2012 and 2011,
respectively and were included in the “Cost of sales of electricity” under “Purchased services
and utilities”.
d. IFC
On May 20, 2011, the Parent Company signed a 15-year US$75.0 million loan facility with
IFC, a shareholder of the Parent Company. IFC has approximately 5% ownership interest in
the Parent Company. The loan was drawn in Peso on September 30, 2011, amounting to
P=3,262.5 million. As of June 30, 2012 and December 31, 2011, the outstanding balance of the
loan amounting to P=3,199.38 million and P=3,196.11 million, respectively, is included under
the “Long-term debts” account in the condensed consolidated statements of financial position
(see Note 12).
On November 27, 2008, the Parent Company entered into a loan agreement with IFC for
US$100.0 million or its Peso equivalent of P=4.10 billion. On January 7, 2009, the Parent
Company opted to draw the loan in Peso and received the proceeds amounting to
P=4,048.75 million, net of P=51.25 million front-end fee. As of June 30, 2012 and December
31, 2011, the outstanding loan amounted to P=3,704.40 million and P=3,871.27 million,
respectively.
e. Other Related Parties
In the ordinary course of business, the Company avails of or grants advances from/to its
related parties for working capital requirements. Such advances are payable/collectible within
12 months and are non-interest bearing.
Bauang Private Power Corporation is a subsidiary of First Private Power Corporation, an
associate of First Gen. First Gas Holdings Corporation and First Gas Power Corporation are
subsidiaries of First Gen. First Holdings, parent company of First Gen, is an associate of
Lopez Holdings Corporation (formerly Benpres Holdings Corporation).

- 24 -
Bayan Telecommunications Inc. (Bayantel) is 97.3%-owned by Bayantel Holdings on which
Lopez Holdings Corporation has 47.3% ownership.
Sky Cable Corporation (Sky Cable) is 80.72%-owned by ABS-CBN Corp. on which Lopez
Holdings Corporation has 57.3% interest.
Lopez Group Foundation, Inc. is the coordinative hub for the corporate social responsibility
initiatives of Lopez Holdings Corporation.
First Philec Manufacturing Technologies Corp., Securities Transfer Services, Inc. and First
Philippine Realty Corp. (FPRC), formerly known as INAEC Development Corp, are wholly
owned subsidiary of First Holdings.
Following are the amounts of related party transactions for the periods ended June 30, 2012 and
2011, and the outstanding balances as of June 30, 2012 and 2011, and December 31, 2011:
Transactions for the
periods ended June 30
Net amount due from/to
related parties
Related Party Nature of Transaction 2012
(Unaudited)
2011
(Unaudited) June 30, 2012
(Unaudited)
December 31, 2011
(Audited)
June 30, 2011
(Unaudited)
Due from related parties
First Gen Interest-free advances P=– P=– P=– P=3,437 P=– First Gen Northern Energy
Corp.
Interest-free advances – – – 2,511 –
First GES Interest-free advances – – – 1,864 –
P=– P=– P=– P=7,812 P=–
Due to related parties
First Gen Consultancy fee P=82,668,148 P=80,795,294 P=41,079,083 P=53,863,530 P=26,931,765
Interest-free advances 13,043,328 48,952,271 4,696,479 6,061,620 97,425,988
Lopez Group Foundation, Inc.
Interest-free advances 1,095,000 318,400 – – –
Baung Private Power
Corporation
Interest-free advances 57,330 – – – – First Gas Power
Corporation
Interest-free advances 92,182 409,913 7,005 165,675 322,546
First Gas Holdings Corporation
Interest-free advances – 482,600 – – –
P=96,955,988 P=130,958,478 P=45,782,567 P=60,090,825 P=124,680,299
Trade and other payables
Thermaprime Work fees P=599,645,524 P=328,428,450 P=100,218,386 P=101,171,006 P=67,000,000
First Balfour, Inc. Refurbishment of BMGPP
and ancillary facilities 194,127,948 99,380,895 141,497,438 38,989,273 56,509,595 First Philec Manufacturing
Technologies Corp.
Purchase of services and
utilities 2,478,782 – 21,493,219 – –
FPRC Purchase of services and utilities 874,409 1,496,636 – 458,150 –
Bayantel
Purchase of services and
utilities 355,408 6,403,501 2,672,701 4,524,811 3,063,189 Securities Transfer
Services, Inc.
Purchase of services and
utilities 67,200 – 39,370 – –
Sky Cable Purchase of services and utilities – 25,182 – – –
P=797,549,271 P=435,734,664 P=265,921,114 P=145,143,240 P=126,572,784
Long-term debt
IFC Interest-bearing loans P=261,511,762 P=3,878,502 P=6,903,775,964 P=7,067,386,686 P=4,038,145,409

- 25 -
The purchases from related parties are made at normal commercial terms and conditions. The
amounts outstanding are unsecured and will be settled in cash. Except for the US$80.0 million
letters of credit issued by the Parent Company in favor of EDC Chile Limitada as mentioned
above, there were no guarantees that have been given to and/or received from any related party in
2012 and 2011.
The Company did not recognize any impairment losses on receivables from related parties for the
six-month periods ended June 30, 2012 and 2011.
24. Financial Risk Management Objectives and Policies
The Company’s financial instruments consist mainly of cash and cash equivalents, AFS
investments and long-term debts. The main purpose of these financial instruments is to finance
the Company’s operations. The Company has other various financial assets and liabilities such as
trade receivables, trade payables and other liabilities, which arise directly from operations.
Overview of the Company’s Risk Management
The Company has an Enterprise Risk Management (ERM) System in place covering all areas of
its organization, and it is aligned with ISO 31000:2009 (Risk Management - Principles and
Guidelines).
The risk management process involves a systematic application of management policies,
procedures, and practices to the activities of communicating, consulting, establishing the context,
and identifying, analyzing, evaluating, treating, monitoring, and reviewing risk. It is aligned and
integrated in the Company’s business model through the annual Strategy Execution Process which
integrates strategic planning, balanced scorecard, risk management, budget and performance
management processes.
The implementation of the Company’s ERM System provides the following benefits and
advantages:
a. Proactively identifies and manages the key exposures of the Company to protect corporate
assets and profits by identifying and preventing risks before they occur. Thus, it helps avoid
losses which can impair the operations or financial position of the Company in case of
fortuitous events;
b. Identifies and exploits areas of “risk-based advantage”;
c. Provides management at all levels with the required information to make informed decisions on
issues critical to the success of the business and its projects;
d. Establishes the accountability of risk owners in the management of risks;
e. Provides balance in the management of risks and an objective basis for allocating resources;
f. Ensures that efforts and initiatives are well-coordinated so that the Company does not manage
risks in silo;
g. Monitors the implementation and effectiveness of the risk treatment options;
h. Ensures compliance with the policies and processes that are established to manage risks; and
i. Reduces the reliance on increasingly expensive insurance protection. Insurance may provide
the financial relief in case of loss. However, certain risks are not insurable, while some though
insurable, may be too costly and uneconomical to insure.

- 26 -
Risk Assessment
One major activity in the Company’s ERM System is the risk assessment. It is the overall process
of risk identification, risk analysis, and risk evaluation (ISO 31000:2009). It is performed at the
project level by project teams, at the operational level by the line and middle management, at the
executive level by the Management Committee, and at the strategic level by the BOD through its
Risk Management Committee.
Risk Treatment
Risk management strategies and action plans are formulated once the risks have been evaluated
and the top risks have been identified. Risk treatment is a process to modify risk (ISO
Guide 73:2009) and is synonymous with risk mitigation, risk elimination, risk prevention, and risk
reduction. It can involve:
a. Avoiding the risk by deciding not to start or continue with the activity that gives rise to the
risk;
b. Taking or increasing risk in order to pursue an opportunity;
c. Removing the risk source;
d. Changing the likelihood;
e. Changing the consequences;
f. Sharing the risk with another party or parties (including contracts and risk financing); and
g. Retaining the risk by informed decision.
Financial Risk Management Policy
The main financial risks arising from the Company’s financial instruments are credit risk, foreign
currency risk, interest rate risk, equity price risk and liquidity risk. The Company’s policies for
managing the aforementioned risks are summarized hereinafter below.
Credit Risk
Credit risk is the risk that the Company will incur a loss arising from customers, clients or
counterparties that fail to discharge their contracted obligations.
The Company’s geothermal and power generation business trades with only one major customer,
NPC, a government-owned-and-controlled corporation. Any failure on the part of NPC to pay its
obligations to the Company would significantly affect the Company’s business operations. As a
practice, the Company monitors closely its collection from NPC and charges interest on delayed
payments following the provision of its respective SSAs and PPAs. Receivable balances are
monitored on an ongoing basis to ensure that the Company’s exposure to bad debts is not
significant. The Company does not hold any collateral from its trade receivables hence, its
maximum exposure to credit risk equals on these trade receivables equals its carrying amount.
With respect to the credit risk arising from other financial assets of the Company, which comprise
of cash and cash equivalents excluding cash on hand, other receivables, amounts due from related
parties and AFS investments in debt securities, the Company’s exposure to credit risk arises from
default of the counterparty, with a maximum exposure equal to the carrying amount of these
instruments.
The Company trades only with recognized, creditworthy third parties and/or transacts only with
institutions and/or banks which have demonstrated financial soundness and which have passed the
financial evaluation and accreditation of the Company.

- 27 -
The following tables below show the Company’s aging analysis of past due but not impaired
financial assets as of June 30, 2012 and 2011, and December 31, 2011:
June 30, 2012 (Unaudited)
Past Due but Not Impaired
Neither Past
Due nor
Impaired
Less than
30 Days
31 Days
to 1 Year
Over 1 Year
up to
3 Years
Over
3 Years
Past
Due and
Impaired Total
(In Thousand Pesos)
Loans and receivables:
Cash and cash
equivalents (excluding cash on
hand) P=11,249,819 P=– P=– P=– P=– P=– P=11,249,819
Trade receivables 3,266,030 176,769 35,480 39,213 – 131,154 3,648,646
Loans and notes
receivables 53,381 4,100 6,183 4,170 – – 67,834
Employee receivables* 16,535 – – – – – 16,535
Non-trade receivables 29,645 31,337 5,646 224 – – 66,852
Advances to employees 33,465 9,939 12,187 2,678 – – 58,269
Long-term receivables – – – – – 63,733 63,733
AFS debt investments: 629,168 – – – – – 629,168
Total P=15,278,043 P=222,145 P=59,496 P=46,285 P=– P=194,887 P=15,800,856
*Includes noncurrent portion of employee receivables under other noncurrent assets.
December 31, 2011 (Audited)
Past Due but Not Impaired
Neither Past
Due nor Impaired
Less than 30 Days
31 Days to 1 Year
Over 1 Year
up to 3 Years
Over 3 Years
Past
Due and Impaired Total
(In Thousand Pesos)
Loans and receivables:
Cash and cash
equivalents (excluding cash on
hand) P=12,486,732 P=– P=– P=– P=– P=– P=12,486,732
Trade receivables 2,942,461 75,181 150,377 37,576 – 130,839 3,336,434 Non-trade receivables 54,130 6,792 38,477 – – – 99,399
Loans and notes
receivables 59,332
– –
– –
– 59,332 Advances to
employees 26,025
1,416 7,727 2,767 –
– 37,935
Employee receivables* 19,949 – – – – – 19,949 Long-term receivables – – – – – 61,062 61,062
Due from related
parties 8 – – – – – 8 AFS debt investments: 673,854 – – – – – 673,854
Total P=16,262,491 P=83,389 P=196,581 P=40,343 P=– P=191,901 P=16,774,705
*Includes noncurrent portion of employee receivables under other noncurrent assets.
June 30, 2011 (Unaudited)
Past Due but Not Impaired
Neither Past Due nor
Impaired
Less than
30 Days
31 Days
to 1 Year
Over 1 Year up to
3 Years
Over
3 Years
Past Due and
Impaired Total
(In Thousand Pesos)
Loans and receivables: Cash and cash
equivalents
(excluding cash on hand) P=10,822,984 P=– P=– P=– P=– P=– P= 10,822,984
Trade receivables 1,238,381 708,705 471,616 11,335 – 129,835 2,559,872
Loans and notes receivables 56,371 – – – – – 56,371
Employee receivables* 24,367 – – – – – 24,367
Non-trade receivables 17,470 – 36,640 – – – 54,110
(Forward)

- 28 -
June 30, 2011 (Unaudited)
Past Due but Not Impaired
Neither Past Due nor
Impaired
Less than
30 Days
31 Days
to 1 Year
Over 1 Year up to
3 Years
Over
3 Years
Past Due and
Impaired Total
(In Thousand Pesos)
Advances to employees P=30,148 P=– P=– P=– P=– P=– P=30,148
Long-term receivables 918 – – – – 50,552 51,470 AFS investments:
Debt investments 685,593 – – – – – 685,593
Financial assets at FVPL: Derivative assets 63,204 – – – – – 63,204
Total P=12,939,436 P=708,705 P=508,256 P=11,335 P=– P=180,387 P=14,348,119
*Includes noncurrent portion of employee receivables under other noncurrent assets.
Credit Quality of Neither Past due nor Impaired Financial Assets
Financial assets are classified as high grade if the counterparties are not expected to default in
settling their obligations. These counterparties normally include customers, banks and related
parties who pay on or before due date. Thus, the credit risk exposure is minimal. Financial assets
are classified as a standard grade if the counterparties settle their obligation with the Company
with tolerable delays. Low grade accounts are accounts, which have probability of impairment
based on historical trend. These accounts show propensity of default in payment despite regular
follow-up actions and extended payment terms.
As of June 30, 2012 and 2011 and December 31, 2011, all financial assets categorized as neither
past due nor impaired are viewed by management as high grade, considering the collectibility of
the receivables and the credit history of the counterparties.
Foreign Currency Risk
Foreign currency risk is the risk that the fair value or future cash flows of a financial instrument
will fluctuate because of changes in foreign exchange rates.
The Company’s exposure to foreign currency risk resulted primarily from the financial assets and
liabilities that are denominated in US dollar and Japanese yen. These financial assets and
liabilities consist of foreign currency denominated loans and the Company’s investment in
marketable securities and ROP Bonds.
The Company’s exposure to foreign currency risk to some degree is mitigated by some provisions
in the Company’s GRESCs, SSAs and PPAs. The service contracts allow full cost recovery while
the sales contracts include billing adjustments covering the movements in Philippine peso and the
US dollar rates, US Price and Consumer Indices, and other inflation factors.
To mitigate further the effects of foreign currency risk, the Company will prepay, refinance or
hedge its foreign currency denominated loans, whenever deemed feasible. The Company also
enters into derivative contracts to mitigate foreign currency risk. Accordingly, in the first half of
2012, the Company entered into non-deliverable cross currency swaps to hedge its foreign
currency risk exposure on its US dollar-denominated Club Loan.

- 29 -
The Company’s foreign currency-denominated financial assets and liabilities (translated into
Philippine peso) as of June 30, 2012 and 2011, and December 31, 2011, are as follows:
June 30, 2012 (Unaudited) June 30, 2011 (Unaudited)
Original Currency Original Currency
Japanese Yen US Dollar
Sweden
Kroner
(SEK)
Peso
Equivalent1 Japanese Yen US Dollar
Peso
Equivalent2
Financial Assets
Loans and receivables:
Cash equivalents − 60,871,823 − 2,563,921,185 − 138,592,260 6,005,202,626
Cash on hand and in banks 2,275 2,937,852 − 123,743,531 − 4,111,631 178,156,971
Trade and other receivables − 2,355,053 − 99,194,832 − 3,844,202 166,569,264 AFS debt investments: − 14,937,500 − 629,167,500 − 15,822,600 685,593,258
Financial assets at FVPL:
Derivative assets − − − − − 260,415 11,283,802
Total financial assets 2,275 81,102,228 − 3,416,027,053 − 162,631,108 7,046,805,921
Current Financial Liabilities
Liabilities at amortized cost:
Trade and other payables 20,507,389 60,882,278 2,295,717 2,589,067,560 83,869,656 16,002,232 756,266,984
Accrued interest and guarantee
fees 51,773,878
10,212,245 − 457,693,817 393,129,203 10,219,768 653,792,209
Current portion of long-term debts −
16,350,521 − 688,683,945 75,758,477 − 40,655,184
Financial assets at FVPL:
Derivative liabilities − 1,178,396 − 49,634,040 − 36,428 1,578,425
Total current financial liabilities 72,281,267 88,623,440 2,295,717 3,785,079,362 552,757,336 26,258,428 1,452,292,802
Noncurrent Financial Liability
Liability at amortized cost:
Long-term debts - net of current
portion −
407,907,326 − 17,181,056,571 41,519,062 468,262,437 20,312,092,260
Total financial liabilities 72,281,267 496,530,766 2,295,717 20,966,135,933 594,276,398 494,520,865 21,764,385,062 1USD1=JPY79.447,USD1= P=42.12 and SEK1=P=6.01 as of June 30, 2012
2USD1=JPY80.743 and USD1= P=43.33 as of June 30, 2011
December 31, 2011 (Audited)
Original Currency
Yen US Dollar SEK
Peso
Equivalent1
Financial Assets Loans and receivables:
Cash equivalents − 99,562,576 − 4,364,823,332 Cash on hand and in banks 125,208 1,909,007 − 83,761,320 Trade and other receivables − 1,802,580 − 79,025,107 AFS debt investments: − 15,370,750 − 673,853,680
Total financial assets 125,208 118,644,913 − 5,201,463,439
Current Financial Liabilities
Liabilities at amortized cost:
Trade and other payables 53,561,520 69,067,270 10,776,022 3,126,615,268 Current portion of
long-term debts 35,992,417 − − 20,252,433 Accrued interest and
guarantee fees 52,256,670 10,214,835 − 477,222,468
Total current financial liabilities 141,810,607 79,282,105 10,776,022 3,624,090,169
Noncurrent Financial Liability
Liability at amortized cost: Long-term debts - net of
current portion − 468,600,735 − 20,543,456,222
Total financial liabilities 141,810,607 547,882,840 10,776,022 24,167,546,391 1US$1=JP¥77.912, US$1= P=43.840 and SEK1=P=6.363 as of December 31, 2011

- 30 -
The following tables demonstrate the sensitivity to a reasonably possible change in the US dollar
and Japanese yen and Sweden kroner exchange rates, with all other variables held constant, of the
Company’s income (loss) before income tax and equity for the periods ended June 30, 2012 and
2011 and year ended December 31, 2011 (arising from revaluation of financial assets and
liabilities and derivative instruments).
June 30, 2012 (Unaudited)
Foreign Currency
Appreciates
(Depreciates) By
Effect on Income
before Income Tax
Effect on Equity
USD 10% or P=4.212 (P=1,749,785,002) P=24,042,659
(10% or P=4.212) 1,749,785,002 (24,042,659
JPY 10% or P=0.05302 (3,831,975) –
(10% or P=0.05302) 3,831,975 –
SEK 10% or P=0.60077 (1,379,198) –
(10% or P=0.60077) 1,379,198 –
December 31, 2011 (Audited)
Foreign Currency
Appreciates
(Depreciates) By
Effect on Income
Before Income Tax Effect on Equity
USD 10% or P=4.38 (P=1,947,447,488) P=67,385,368
(10% or P=4.38) 1,947,447,488 (67,385,368)
JPY 10% or P=0.05627 (P=7,972,441) –
(10% or P=0.05627) 7,972,441 –
SSEK 10% or P=0.6363 (6,856,783) –
(10% or P=0.6363) 6,856,783 –
June 30, 2011 (Unaudited)
Foreign Currency
Appreciates
(Depreciates) By
Effect on Loss
Before Income Tax Effect on Equity
USD 10% or P=4.333 (P=1,509,888,315) P=68,559,326
(10% or P=4.333) 1,509,888,315 (68,559,326
JPY 10% or P=0.05366 (31,891,305) –
(10% or P=0.05366) 31,891,305 –
The effect of changes in foreign exchange rates in equity pertains to the fair valuation of AFS
investments and derivatives designated as cash flow hedges, and is exclusive of the impact of
changes affecting the Company’s condensed consolidated statements of income.
Equity Price Risk
Equity price risk is the risk that the fair value of traded equity instruments decreases as the result
of the changes in the levels of equity indices and the value of the individual stocks.
As of June 30, 2012 and 2011 and December 31, 2011, the Company’s exposure to equity price
risk is minimal.

- 31 -
Interest Rate Risk
The Company’s exposure to the risk of changes in market interest rates relates primarily to the
Company’s long-term debt obligations with floating interest rates, derivative assets, derivative
liabilities and AFS investments.
The interest rates of some of the Company’s long-term borrowings and AFS debt investments and
are fixed at the inception of the loan agreement.
The Company regularly evaluates its interest rate risk by taking into account the cost of qualified
borrowings being charged by its creditors. Prepayment, refinancing or hedging the risks are
undertaken when deemed feasible and advantageous to the Company.
Interest Rate Risk Table
The following tables provide for the effective interest rates and interest payments by period of
maturity of the Company’s long-term debts.
Interest Rates
Within 1
Year
More than 1
Year but less
than 4 Years
More than 4
Years but
less than 5
Years
More than
5 Years Total
June 30, 2012
(Unaudited)
Fixed Rate
In Thousand Pesos
IFC A 7.40% P=275,563 P=673,285 P=172,943 P=499,147 P=1,620,938
IFC B 6.657% 285,958 572,086 156,630 647,150 1,661,824
PNB & Allied 9.03% 398,115 950,339 219,721 321,860 1,890,035
FXCN-Tr1 6.62% 198,023 582,157 190,082 920,632 1,890,894
FXCN-Tr2 6.61% 263,771 775,447 253,194 1,226,303 2,518,715
Public Bonds Series 1 8.64% 734,553 1,469,106 – – 2,203,659
Public Bonds Series 2 9.33% 326,645 979,934 163,322 – 1,469,901
USD300M Notes 6.50% 821,340 2,464,020 821,340 3,285,360 7,392,060
Floating Rate
USD 175M
Syndicated Club
Loan
1.75%%+
LIBOR
149,206
328,539
78,139
–
555,884
Interest
Rates
Within
1 Year
More than 1
year but less
than 4 years
More than 4
Years but
less than 5
Years
More than
5 Years
Total
December 31, 2011
(Audited)
In Thousand Pesos
Fixed Rate
OECF
PNB and Allied Bank
IFC 1
IFC 2
3.20%
9.03%
7.40%
6.66%
P=327
416,291
289,163
273,799
P=–
1,014,291
711,135
608,541
P=–
246,520
186,262
165,548
P=–
423,956
582,174
723,131
P=327
2,101,058
1,768,734
1,771,019
FRCN
Series 1
8.37%
180,117
207,851
–
–
387,968
Series 2 9.40% 423,750 816,579 92,983 – 1,333,312
Series 3
US$ 300M Notes
8.43%
6.50%
102,907
854,880
118,752
2,564,640
–
854,880
–
3,846,960
221,659
8,121,360
Peso Public Bonds:
Series 1 8.64% 734,553 1,836,383 – – 2,570,936
Series 2 9.33% 326,645 979,934 326,645 – 1,633,224 (forward)

- 32 -
Floating Rate
US$ 175.0M
Refinanced
Syndicated Club
Loan
1.75% +
LIBOR
155,724
372,675
89,541
38,506
656,446
Interest Rates Within 1 Year
More than 1
Year but less
than 4 Years
More than 4
Years but
less than 5
Years
More than
5 Years Total
June 30, 2011 (Unaudited)
Fixed Rate
In Thousand Pesos
OECF 3%-5.7% P=2,252 P=3,307 P=875 P=2,966 P=9,400
IFC 7.40%/7.90% 329,298 825,555 212,064 769,456 2,136,373
PNB & Allied 9.025% 431,232 1,076,563 271,891 541,581 2,321,267
FRCN Series 1 8.37% 179,471 235,708 – – 415,179
FRCN Series 2 9.4% 422,450 868,716 115,562 23,087 1,429,815
FRCN Series 3 8.43% 102,538 134,668 – – 237,206
Public Bonds Series 1 8.64% 734,553 2,203,659 – – 2,938,212
Public Bonds Series 2 9.33% 326,645 979,934 326,645 163,322 1,796,546
USD300M Notes 6.50% 844,935 2,534,805 844,935 4,224,675 8,449,350
Floating Rate
USD 175M
Syndicated Club
Loan
1.75% +
LIBOR
153,913
395,274
96,195
80,594
725,976
The following tables demonstrate the sensitivity to a reasonably possible change in interest rates,
with all other variables held constant, of the Company’s income (loss) before income tax and
equity as of June 30, 2012 and 2011 and December 31, 2011. The effect on equity includes
impact of change in interest rates on derivatives designated as cash flow hedges as well as AFS
debt investments.
June 30, 2012 (Unaudited)
Increase/Decrease
in Basis Points
Effect on Income
Before Income Tax Effect on Equity
USD +100 (P=54,756,000) P=41,260,961 -100 54,756,000 (31,790,195)
December 31, 2011 (Audited)
Increase/Decrease
in Basis Points
Effect on Income
Before Tax Effect on Equity
USD +100 (P=76,720,000) (P=8,929,578)
-100 76,720,000 19,217,468
June 30, 2011 (Unaudited)
Increase/Decrease
in Basis Points
Effect on Loss
Before Income Tax Effect on Equity
USD +100 P=75,704,355 (P=15,589,828)
-100 (76,299,877) 18,759,833
The effect of changes in interest rates in equity pertains to the fair valuation of AFS investments
and derivatives designated as cash flow hedges, and is exclusive of the impact of the changes
affecting the Company’s condensed consolidated statement of income.
- 33 -
Liquidity Risk
The Company’s objective is to maintain a balance between continuity of funding and sourcing
flexibility through the use of available financial instruments. The Company manages its liquidity
profile to meet its working and capital expenditure requirements and service debt obligations. As
part of the liquidity risk management program, the Company regularly evaluates and considers the
maturity of both its financial investments and financial assets (e.g. trade receivables, other
financial assets) and resorts to short-term borrowings whenever its available cash or matured
placements is not enough to meet its daily working capital requirements. To ensure immediate
availability of short-term borrowings, the Company maintains credit lines with banks on a
continuing basis.
Liquidity risk arises primarily when the Company has difficulty collecting its receivables from its
major customer, NPC. Other instances that contribute to its exposure to liquidity risk are when the
Company finances long-term projects with internal cash generation and when there is credit
crunch especially at times when the company has temporary funding gaps.
The tables below show the maturity profile of the Company’s financial assets used for liquidity
purposes based on contractual undiscounted cash flows as of June 30, 2012 and 2011 and
December 31, 2011.
June 30, 2012 (Unaudited)
On
Demand
Less than
3 Months
3 to
6 Months
>6 to
12 Months
>1 to
5 Years
More than
5 Years Total
(In Thousand Pesos)
AFS debt investments P=– P=140,849 P=– P=– P=– P=524,173 P=665,022
Loans and receivables
Cash equivalents – 9,496,336 – – – – 9,496,336
Trade receivables 251,462 3,266,030 – – – – 3,517,492
Total P=251,462 P=12,903,215 P=– P=– P=– P=524,173 P=13,678,850
December 31, 2011 (Audited)
On
Demand
Less than
3 Months
3 to
6 Months
>6 to
12 Months
>1 to
5 Years
More than
5 Years Total
(In Thousand Pesos)
AFS debt investments P=– P=673,854 P=– P=– P=– P=– P=673,854 Loans and receivables
Cash equivalents – 11,800,643 – – – – 11,800,643
Trade receivables 263,133 2,942,461 – – – – 3,205,594
Total P=263,133 P=15,416,958 P=– P=– P=– P=– P=15,680,091
June 30, 2011 (Unaudited)
On
Demand Less than 3 Months
3 to 6 Months
>6 to 12 Months
>1 to 5 Years
More than 5 Years Total
(In Thousand Pesos)
AFS debt investments P=− P=685,593 P=− P=− P=− P=− P=685,593
Loans and receivables
Cash equivalents − 10,315,779 − − − − 10,315,779 Trade receivables 1,191,656 1,238,381 − − − − 2,430,037
Total P=1,191,656 P=12,239,753 P=− P=− P=− P=− P=13,431,409
The tables below summarize the maturity analysis of the Company’s financial liabilities as of
June 30, 2012 and 2011 and December 31, 2011 based on contractual undiscounted payments:
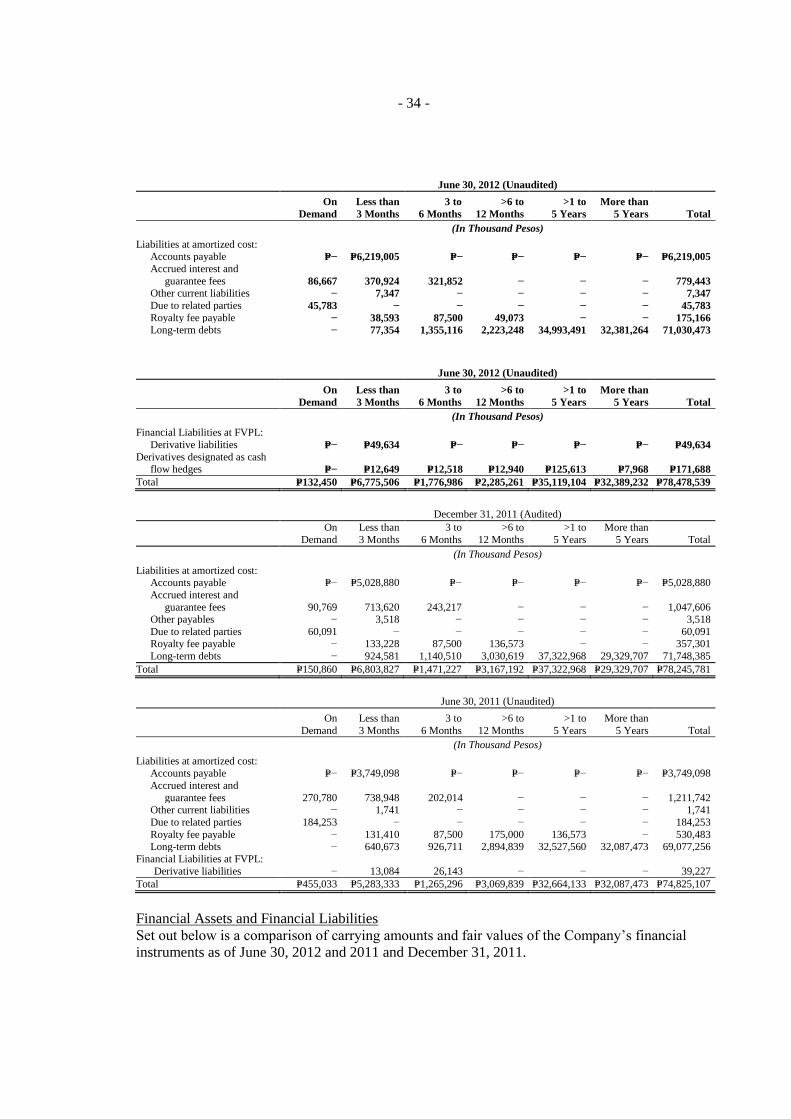
- 34 -
June 30, 2012 (Unaudited)
On
Demand
Less than
3 Months
3 to
6 Months
>6 to
12 Months
>1 to
5 Years
More than
5 Years Total
(In Thousand Pesos)
Liabilities at amortized cost:
Accounts payable P=− P=6,219,005 P=− P=− P=− P=− P=6,219,005
Accrued interest and
guarantee fees 86,667 370,924 321,852 − − − 779,443
Other current liabilities − 7,347 − − − − 7,347
Due to related parties 45,783 − − − − − 45,783
Royalty fee payable − 38,593 87,500 49,073 − − 175,166
Long-term debts − 77,354 1,355,116 2,223,248 34,993,491 32,381,264 71,030,473
June 30, 2012 (Unaudited)
On
Demand
Less than
3 Months
3 to
6 Months
>6 to
12 Months
>1 to
5 Years
More than
5 Years Total
(In Thousand Pesos)
Financial Liabilities at FVPL:
Derivative liabilities P=− P=49,634 P=− P=− P=− P=− P=49,634
Derivatives designated as cash flow hedges P=− P=12,649 P=12,518 P=12,940 P=125,613 P=7,968 P=171,688
Total P=132,450 P=6,775,506 P=1,776,986 P=2,285,261 P=35,119,104 P=32,389,232 P=78,478,539
December 31, 2011 (Audited)
On
Demand
Less than
3 Months
3 to
6 Months
>6 to
12 Months
>1 to
5 Years
More than
5 Years Total
(In Thousand Pesos)
Liabilities at amortized cost: Accounts payable P=− P=5,028,880 P=− P=− P=− P=− P=5,028,880
Accrued interest and
guarantee fees 90,769 713,620 243,217 − − − 1,047,606 Other payables − 3,518 − − − − 3,518
Due to related parties 60,091 − − − − − 60,091 Royalty fee payable − 133,228 87,500 136,573 − − 357,301
Long-term debts − 924,581 1,140,510 3,030,619 37,322,968 29,329,707 71,748,385
Total P=150,860 P=6,803,827 P=1,471,227 P=3,167,192 P=37,322,968 P=29,329,707 P=78,245,781
June 30, 2011 (Unaudited)
On
Demand
Less than
3 Months
3 to
6 Months
>6 to
12 Months
>1 to
5 Years
More than
5 Years Total
(In Thousand Pesos)
Liabilities at amortized cost:
Accounts payable P=− P=3,749,098 P=− P=− P=− P=− P=3,749,098
Accrued interest and
guarantee fees 270,780 738,948 202,014 − − − 1,211,742 Other current liabilities − 1,741 − − − − 1,741
Due to related parties 184,253 − − − − − 184,253
Royalty fee payable − 131,410 87,500 175,000 136,573 − 530,483 Long-term debts − 640,673 926,711 2,894,839 32,527,560 32,087,473 69,077,256
Financial Liabilities at FVPL:
Derivative liabilities − 13,084 26,143 − − − 39,227
Total P=455,033 P=5,283,333 P=1,265,296 P=3,069,839 P=32,664,133 P=32,087,473 P=74,825,107
Financial Assets and Financial Liabilities
Set out below is a comparison of carrying amounts and fair values of the Company’s financial
instruments as of June 30, 2012 and 2011 and December 31, 2011.

- 35 -
June 30, 2012 (Unaudited) June 30, 2011 (Unaudited)
Carrying
Amount Fair Value
Carrying
Amount Fair Value
Financial Assets
Loans and receivables:
Cash and cash equivalents P=11,255,972,999 P=11,255,972,999 P=10,900,365,601 P=10,900,365,601
Trade receivables 3,517,492,151 3,517,492,151 2,430,037,012 2,430,037,012
Loans and notes receivables 67,834,139 67,834,139 56,370,413 56,370,413
Non-trade receivables 66,851,887 66,851,887 54,110,493 54,110,494
Advances to employees 58,268,872 58,268,872 30,148,448 30,148,448
Employee receivables 16,534,538 16,534,538 24,367,295 24,367,295
Long-term receivables – – 918,278 873,840
AFS investments:
Debt investments 629,167,500 629,167,500 685,593,258 685,593,258
Equity investments 117,320,926 117,320,926 20,756,197 20,756,197
Financial assets at FVPL:
Derivative assets – – 63,203,930 63,203,930
P=16,290,912,865 P=16,290,912,865 P=14,265,870,925 P=14,265,826,488
June 30, 2012 (Unaudited) June 30, 2011 (Unaudited)
Carrying
Amount Fair Value
Carrying
Amount Fair Value
Financial Liabilities
Financial liabilities at amortized cost:
Accounts payable P=6,219,004,991 P=6,219,004,991 P=3,749,097,516 P=3,749,097,516
Accrued interest and guarantee fees 779,443,062 779,443,062 1,211,742,356 1,211,742,356
Other current liabilities 7,346,926 7,346,926 1,740,917 1,740,917
Due to related parties 45,782,567 45,782,567 184,253,083 184,253,083
Royalty fee payable 142,740,508 144,937,508 429,643,462 432,904,425
Long-term debts 49,889,099,310 55,226,948,456 48,924,935,771 53,859,660,280
Derivatives designated as cash flow
hedges
49,634,041
49,634,041
–
–
Financial Liabilities at FVPL:
Derivative Liabilities – – 39,227,456 39,227,456
P=57,133,051,405 P=62,473,097,551 P=54,540,640,561 P=59,478,626,033
December 31, 2011 (Audited)
Carrying
Amounts Fair Values
Financial Assets
Loans and receivables:
Cash and cash equivalents P=12,493,406,963 P=12,493,406,963
Trade receivables 3,205,594,212 3,205,594,212
Non-trade receivables 99,398,810 99,398,810
Loans and notes receivables 59,331,933 59,331,933
Advances to employees 37,934,595 37,934,595
Employee receivables 19,948,544 19,948,544
Due from related parties 7,812 7,812
Long-term receivables − −
AFS investments:
Debt investments 673,853,680 673,853,680
Equity investments 20,443,924 20,443,924
P=16,609,920,473 P=16,609,920,473
Financial Liabilities
Financial liabilities at amortized cost:
Accounts payable P=5,028,879,595 P=5,028,879,595
Accrued interest and guarantee fees 1,047,605,943 1,047,605,943
Other payables 3,517,746 3,517,746
Loan payable − −
Due to related parties 60,090,825 60,090,825

- 36 -
December 31, 2011 (Audited)
Carrying
Amounts Fair Values
Royalty fee payable 287,626,313 290,907,188
Long-term debts 51,489,571,455 59,055,715,275
P=57,917,291,877 P=65,486,716,572
The methods and assumptions used by the Company in estimating the fair value of financial
instruments are:
Cash and Cash Equivalents. Carrying amounts approximate fair values due to its short-term
nature.
Trade and Other Receivables, Royalty Fee Chargeable to NPC, Due to Related Parties, Trade and
Other Payables and Loan Payable. These are instruments with relatively short maturity ranging
one to three months, and thus, the carrying amounts approximate fair values.
Long-term Receivables. The fair value of long-term receivables was computed by discounting the
expected cash flow.
AFS Investments. Fair values of quoted debt and equity securities are based on quoted market
prices. For equity investments that are not quoted, the investments are carried at cost less
allowance for impairment losses due to the unpredictable nature of future cash flows and the lack
of suitable methods of arriving at a reliable fair value.
Derivative Assets and Derivative Liabilities. The fair value of the non-deliverable cross currency
swaps as of June 30, 2012 is based on quote provided by the counterparty bank while the fair
value of non-deliverable forwards outstanding as of June 30, 2011 are calculated by reference to
the prevailing forward rates.
Long-term Debts and Royalty Fee Payable. The fair values for the Company’s long-term debts are
estimated using the discounted cash flow methodology with the applicable rates ranging from
1.75% to 10.83%, 1.91% to 10.88%, and 1.19% to 10.89% on June 30, 2012, December 31, 2011
and June 30, 2011, respectively. On the other hand, the fair value of the newly acquired peso loan
of FG Hydro is discounted using discount rates ranging from 4.93% to 7.91% on June 30, 2012.
Fair values of royalty fee payable are determined using discount rates ranging from 5.23% to
5.49%, from 5.32% to 6.43% and from 6.20% to 7.23%, as of June 30, 2012, December 31, 2011
and June 30, 2011, respectively.
The following tables show the fair value information of financial instruments classified under
FVPL , derivatives designated as cash flow hedges and AFS investments analyzed by sources of
inputs on fair valuation as follows:
Quoted prices in active markets for identical assets or liabilities (Level 1);
Those involving inputs other than quoted prices included in Level 1 that are observable for the
asset or liability, either directly (as prices) or indirectly (derived from prices) (Level 2); and
Those with inputs for the asset or liability that are not based on observable market data
(unobservable inputs) (Level 3).
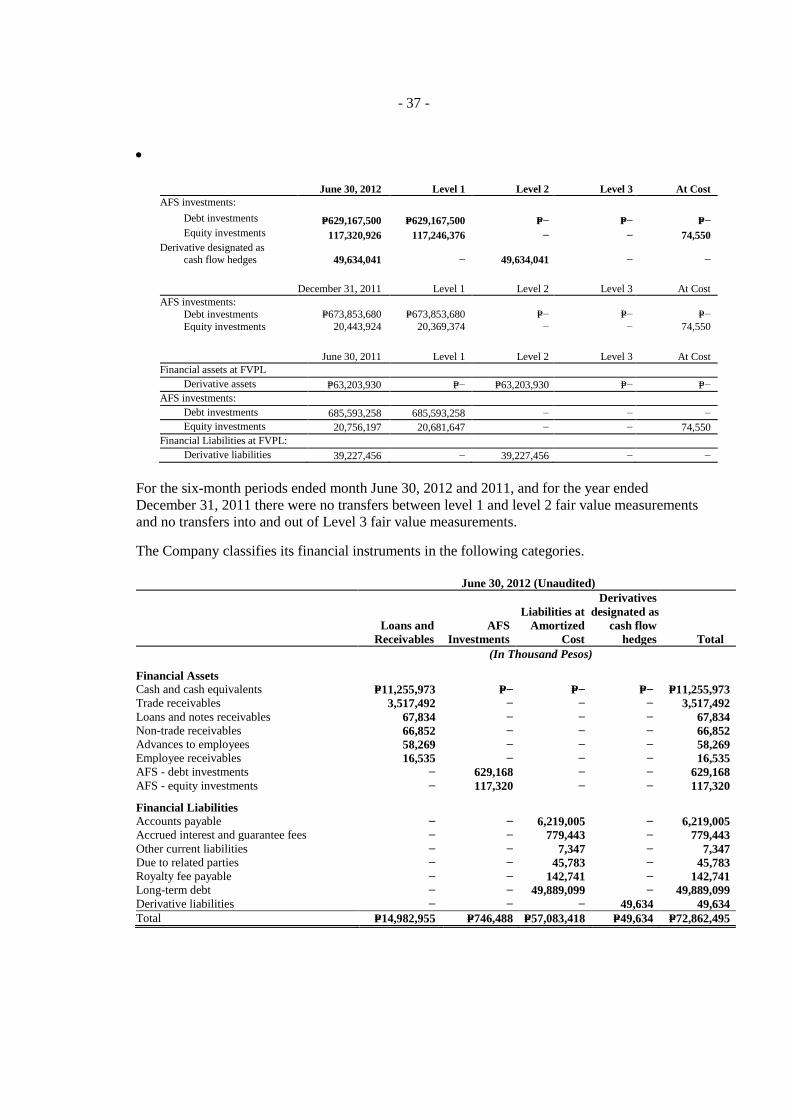
- 37 -
June 30, 2012 Level 1 Level 2 Level 3 At Cost
AFS investments:
Debt investments P=629,167,500 P=629,167,500 P=− P=− P=−
Equity investments 117,320,926 117,246,376 − − 74,550
Derivative designated as cash flow hedges 49,634,041 − 49,634,041 − −
December 31, 2011 Level 1 Level 2 Level 3 At Cost
AFS investments:
Debt investments P=673,853,680 P=673,853,680 P=− P=− P=−
Equity investments 20,443,924 20,369,374 − − 74,550
June 30, 2011 Level 1 Level 2 Level 3 At Cost
Financial assets at FVPL
Derivative assets P=63,203,930 P=− P=63,203,930 P=− P=−
AFS investments:
Debt investments 685,593,258 685,593,258 − − −
Equity investments 20,756,197 20,681,647 − − 74,550
Financial Liabilities at FVPL:
Derivative liabilities 39,227,456 − 39,227,456 − −
For the six-month periods ended month June 30, 2012 and 2011, and for the year ended
December 31, 2011 there were no transfers between level 1 and level 2 fair value measurements
and no transfers into and out of Level 3 fair value measurements.
The Company classifies its financial instruments in the following categories.
June 30, 2012 (Unaudited)
Loans and
Receivables
AFS
Investments
Liabilities at
Amortized
Cost
Derivatives
designated as
cash flow
hedges Total
(In Thousand Pesos)
Financial Assets
Cash and cash equivalents P=11,255,973 P=− P=− P=− P=11,255,973
Trade receivables 3,517,492 − − − 3,517,492
Loans and notes receivables 67,834 − − − 67,834
Non-trade receivables 66,852 − − − 66,852
Advances to employees 58,269 − − − 58,269
Employee receivables 16,535 − − − 16,535
AFS - debt investments − 629,168 − − 629,168
AFS - equity investments − 117,320 − − 117,320
Financial Liabilities
Accounts payable − − 6,219,005 − 6,219,005
Accrued interest and guarantee fees − − 779,443 − 779,443
Other current liabilities − − 7,347 − 7,347
Due to related parties − − 45,783 − 45,783
Royalty fee payable − − 142,741 − 142,741
Long-term debt − − 49,889,099 − 49,889,099
Derivative liabilities − − − 49,634 49,634
Total P=14,982,955 P=746,488 P=57,083,418 P=49,634 P=72,862,495

- 38 -
December 31, 2011 (Audited)
Loans and
Receivables
AFS
Investments
Liabilities at
Amortized
Cost Total
(In Thousand Pesos)
Financial Assets
Cash and cash equivalents P=12,493,407 P=− P=− P=12,493,407
Trade receivables 3,205,594 − − 3,205,594
Non-trade receivables 99,399 − − 99,399
Loans and notes receivables 59,332 − − 59,332
Advances to employees 37,935 − − 37,935
Employee receivables 19,949 − − 19,949
Due from related parties 8 − − 8
AFS - debt investments − 673,854 − 673,854
AFS - equity investments − 20,444 − 20,444
Financial Liabilities
Accounts payable − − 5,028,880 5,028,880
Accrued interest and guarantee fees − − 1,047,606 1,047,606
Other payables − − 3,518 3,518
Due to related parties − − 60,091 60,091
Royalty fee payable − − 287,626 287,626
Long-term debts − − 51,489,571 51,489,571
Total P=15,915,624 P=694,298 P=57,917,292 P=74,527,214
June 30, 2011 (Unaudited)
Loans and
Receivables
AFS
Investments
Financial
Assets at
FVPL
Liabilities at
Amortized
Cost
Financial
Liabilities
at FVPL Total
(In Thousand Pesos)
Financial Assets
Cash and cash equivalents P=10,900,366 P=– P=– P=– P=– P=10,900,366
Trade receivables 2,430,037 − − − − 2,430,037
Loans and notes receivables 56,370 − − − − 56,370
Non-trade receivables 54,110 − − − − 54,110
Advances to employees 30,148 − − − − 30,148
Employee receivables 24,367 − − − − 24,367
Other long-term receivables 918 − − − − 918
AFS - debt investments − 685,593 − − − 685,593
AFS - equity investments − 20,756 − − − 20,756
Derivative Assets − − 63,204 − − 63,204
Financial Liabilities
Accounts payable − − − 3,749,098 − 3,749,098
Accrued interest and
guarantee fees − − − 1,211,742 − 1,211,742
Other current liabilities − − − 1,741 − 1,741
Due to related parties − − − 184,253 − 184,253
Royalty fee payable − − − 429,643 − 429,643
Long-term debt − − − 48,924,936 − 48,924,936
Derivative liabilities − − − − 39,227 39,227
Total P=13,496,316 P=706,349 P=63,204 P=54,501,413 P=39,227 P=40,274,771
The table below demonstrates the income, expense, gains or losses of the Company’s financial
instruments for the six-month periods ended June 30, 2012 and 2011.
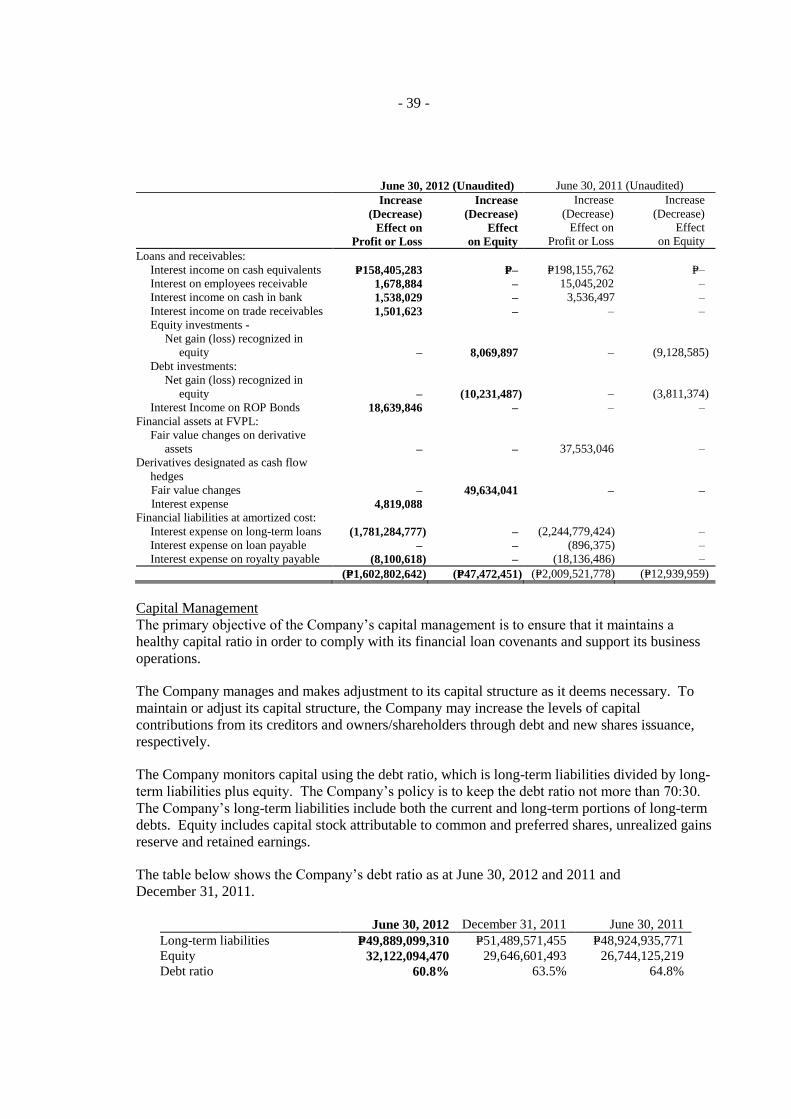
- 39 -
June 30, 2012 (Unaudited) June 30, 2011 (Unaudited)
Increase
(Decrease)
Increase
(Decrease)
Increase
(Decrease)
Increase
(Decrease)
Effect on
Profit or Loss
Effect
on Equity
Effect on
Profit or Loss
Effect
on Equity
Loans and receivables:
Interest income on cash equivalents P=158,405,283 P=– P=198,155,762 P=–
Interest on employees receivable 1,678,884 – 15,045,202 –
Interest income on cash in bank 1,538,029 – 3,536,497 –
Interest income on trade receivables 1,501,623 – – –
Equity investments -
Net gain (loss) recognized in
equity – 8,069,897 – (9,128,585)
Debt investments:
Net gain (loss) recognized in
equity – (10,231,487) – (3,811,374)
Interest Income on ROP Bonds 18,639,846 – – –
Financial assets at FVPL:
Fair value changes on derivative
assets – – 37,553,046 –
Derivatives designated as cash flow
hedges
Fair value changes – 49,634,041 – – Interest expense 4,819,088
Financial liabilities at amortized cost:
Interest expense on long-term loans (1,781,284,777) – (2,244,779,424) –
Interest expense on loan payable – – (896,375) –
Interest expense on royalty payable (8,100,618) – (18,136,486) –
(P=1,602,802,642) (P=47,472,451) (P=2,009,521,778) (P=12,939,959)
Capital Management
The primary objective of the Company’s capital management is to ensure that it maintains a
healthy capital ratio in order to comply with its financial loan covenants and support its business
operations.
The Company manages and makes adjustment to its capital structure as it deems necessary. To
maintain or adjust its capital structure, the Company may increase the levels of capital
contributions from its creditors and owners/shareholders through debt and new shares issuance,
respectively.
The Company monitors capital using the debt ratio, which is long-term liabilities divided by long-
term liabilities plus equity. The Company’s policy is to keep the debt ratio not more than 70:30.
The Company’s long-term liabilities include both the current and long-term portions of long-term
debts. Equity includes capital stock attributable to common and preferred shares, unrealized gains
reserve and retained earnings.
The table below shows the Company’s debt ratio as at June 30, 2012 and 2011 and
December 31, 2011.
June 30, 2012 December 31, 2011 June 30, 2011
Long-term liabilities P=49,889,099,310 P=51,489,571,455 P=48,924,935,771
Equity 32,122,094,470 29,646,601,493 26,744,125,219
Debt ratio 60.8% 63.5% 64.8%

- 40 -
Derivative Financial Instruments
The Company engages in derivative transactions, particularly foreign currency forwards, foreign
currency swaps and cross-currency swaps, to manage its foreign currency risk and/or interest rate
risk arising from its foreign-currency denominated loans and to take advantage of market
opportunities. These derivatives are accounted for either as derivatives designated as accounting
hedges or derivatives not designated as accounting hedges.
The table below shows the derivative financial instruments of the Company for the periods ended
June 30, 2012 and 2011, and year ended December 31, 2011.
June 30, 2012
(Unaudited)
December 31, 2011
(Audited)
June 30, 2011
(Unaudited)
Derivative
Assets
Derivative
Liabilities
Derivative
Assets
Derivative
Liabilities
Derivative
Assets
Derivative
Liabilities
Derivatives designated as
accounting hedges
Cross-currency swaps P=– P=49,634,041 P=– P=– P=– P=–
Derivatives not designated as
accounting hedges
Foreign currency forwards – – – – 63,203,930 39,227,456
Foreign currency swaps – – – – – –
Total derivatives P=– P=49,634,041 P=– P=– P=63,203,930 P=39,227,456
Presented as:
Current P=– P=– P=– P=– P=63,203,930 P=39,227,456
Noncurrent – 49,634,041 – – – –
Total derivatives P=– P=49,634,041 P=– P=– P=63,203,930 P=39,227,456
Derivatives Not Designated as Accounting Hedges
Foreign Currency Forward Contracts. These are contractual agreements to buy or sell a foreign
currency at an agreed rate on a future date. These are customized contracts transacted with a bank
or financial institution.
As of December 31, 2011 and June 30, 2011, the Company has entered into a total of 38 and 27
foreign currency forward contracts, respectively. These include 6 deliverable buy JP¥ - sell US$,
16 non-deliverable buy US$ - sell PHP= and 16 non-deliverable sell US$ - buy PHP= forward
contracts. The aggregate notional amounts and weighted average forward rates of these foreign
currency forward contracts are as follows:
December 31, 2011 June 30, 2011
Position
Aggregate
notional amount
Average
forward rate
Aggregate
notional amount
Average
forward rate
Buy JP¥ - sell US$ JP¥2,441.00 million JP¥83.00 JP¥2,441.00 million JP¥83.00
Buy US$ - sell PHP= US$255.00 million P=43.12 US$155.00 million P=43.29
Sell US$ - buy PHP= US$255.00 million P=43.34 US$155.00 million P=43.52
In relation to the non-deliverable forward contracts, the Company entered into sell US$ - buy PHP=
transactions with onshore banks and simultaneously entered into buy US$ - sell PHP= transactions
with offshore banks as offsetting positions to lock-in gains at inception.
For the year ended December 31, 2011 and for the six-month period ended June 30, 2011, the
Company recognized P=68.25 million gain and P=35. 91 million gain, respectively, from fair value
changes of these currency forwards contracts. Such amount is recorded under “Derivative gains -
net” in the condensed consolidated statements of income.
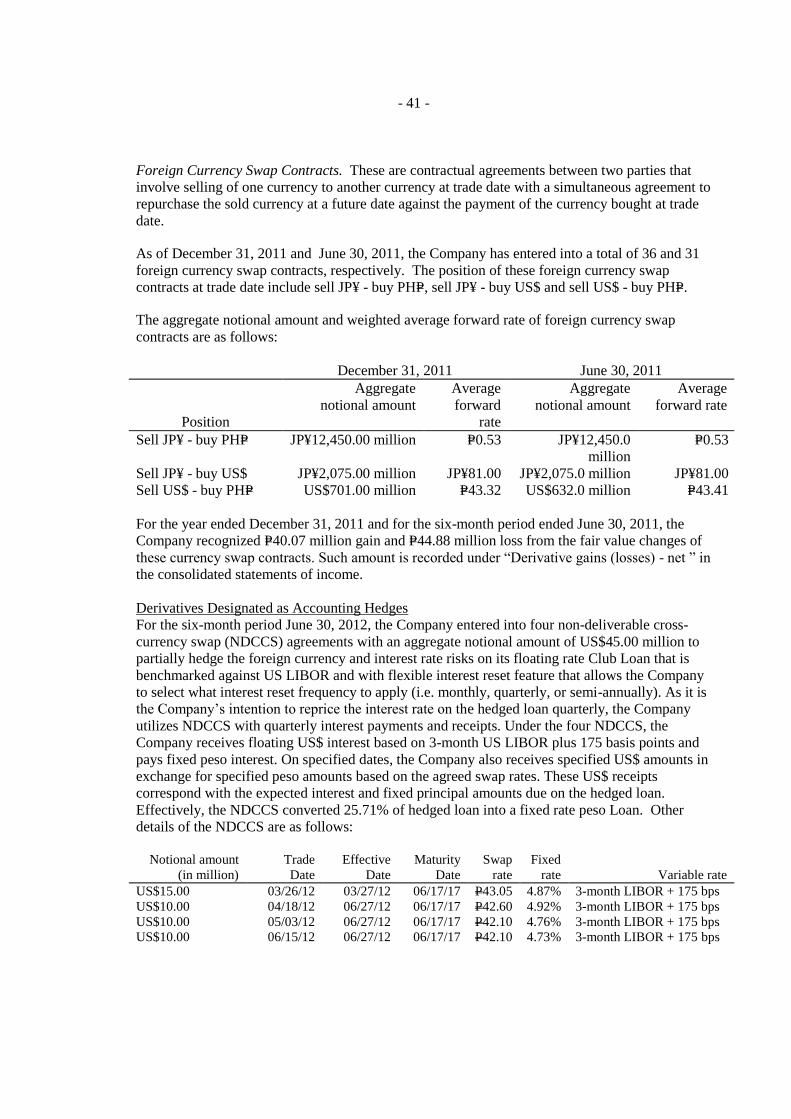
- 41 -
Foreign Currency Swap Contracts. These are contractual agreements between two parties that
involve selling of one currency to another currency at trade date with a simultaneous agreement to
repurchase the sold currency at a future date against the payment of the currency bought at trade
date.
As of December 31, 2011 and June 30, 2011, the Company has entered into a total of 36 and 31
foreign currency swap contracts, respectively. The position of these foreign currency swap
contracts at trade date include sell JP¥ - buy PHP=, sell JP¥ - buy US$ and sell US$ - buy PHP=.
The aggregate notional amount and weighted average forward rate of foreign currency swap
contracts are as follows:
December 31, 2011 June 30, 2011
Position
Aggregate
notional amount
Average
forward
rate
Aggregate
notional amount
Average
forward rate
Sell JP¥ - buy PHP= JP¥12,450.00 million P=0.53 JP¥12,450.0
million
P=0.53
Sell JP¥ - buy US$ JP¥2,075.00 million JP¥81.00 JP¥2,075.0 million JP¥81.00
Sell US$ - buy PHP= US$701.00 million P=43.32 US$632.0 million P=43.41
For the year ended December 31, 2011 and for the six-month period ended June 30, 2011, the
Company recognized P=40.07 million gain and P=44.88 million loss from the fair value changes of
these currency swap contracts. Such amount is recorded under “Derivative gains (losses) - net ” in
the consolidated statements of income.
Derivatives Designated as Accounting Hedges
For the six-month period June 30, 2012, the Company entered into four non-deliverable cross-
currency swap (NDCCS) agreements with an aggregate notional amount of US$45.00 million to
partially hedge the foreign currency and interest rate risks on its floating rate Club Loan that is
benchmarked against US LIBOR and with flexible interest reset feature that allows the Company
to select what interest reset frequency to apply (i.e. monthly, quarterly, or semi-annually). As it is
the Company’s intention to reprice the interest rate on the hedged loan quarterly, the Company
utilizes NDCCS with quarterly interest payments and receipts. Under the four NDCCS, the
Company receives floating US$ interest based on 3-month US LIBOR plus 175 basis points and
pays fixed peso interest. On specified dates, the Company also receives specified US$ amounts in
exchange for specified peso amounts based on the agreed swap rates. These US$ receipts
correspond with the expected interest and fixed principal amounts due on the hedged loan.
Effectively, the NDCCS converted 25.71% of hedged loan into a fixed rate peso Loan. Other
details of the NDCCS are as follows:
Notional amount
(in million)
Trade
Date
Effective
Date
Maturity
Date
Swap
rate
Fixed
rate
Variable rate
US$15.00 03/26/12 03/27/12 06/17/17 P43.05 4.87% 3-month LIBOR + 175 bps
US$10.00 04/18/12 06/27/12 06/17/17 P42.60 4.92% 3-month LIBOR + 175 bps
US$10.00 05/03/12 06/27/12 06/17/17 P42.10 4.76% 3-month LIBOR + 175 bps
US$10.00 06/15/12 06/27/12 06/17/17 P42.10 4.73% 3-month LIBOR + 175 bps

- 42 -
The maturity date of the four NDCCS coincides with the maturity date of the hedged loan.
As of June 30, 2012, the outstanding aggregate notional amount of the Company’s NDCCS
amounted to US$45.00 million. The aggregate fair value changes on these NDCCS amounting to
P=49.63 million loss was recognized by the Company under “Cumulative Translation Adjustment”
account.
Hedge Effectiveness Results
Since the critical terms of the hedged loan and the NDCCS match, except for one to two days
timing difference on the interest reset date, the hedges were assessed to be highly effective. As
such, there was no ineffectiveness recognized immediately in the condensed consolidated
statement of income for the six-month period June 30, 2012.
June 30, 2012
(Unaudited)
Balance at beginning of year P=–
Changes in fair value of the cash flow hedges (54,453,129)
Transferred to consolidated statement of income 26,119,088)
Balance at end of year 28,334,041
(P=28,334,041)
Of the amounts transferred to the condensed consolidated statement of comprehensive income,
P=21.30 million and P=4.82 million are included in “Forex exchange gains (losses) - net” and
“Interest expense”, respectively.
Fair Value Changes of Derivatives
The tables below summarize the net movement in fair values of the Company’s derivatives as of
June 30, 2012, December 31, 2011 and June 30, 2011.
Derivatives not designated as accounting hedges
December 31, 2011 June 30, 2011
Derivative
Assets
Derivative
Liabilities Derivative
Assets
Derivative
Liabilities
Balance at beginning of year P=– P=– P=– P=–
Net changes in fair value 381,813,015 (273,493,638) 220,382,780 (229,356,265)
Settlement (381,813,015) 273,493,638 (157,178,850) 190,128,809
Balance at end of period P=– P=– P=63,203,930 (P=39,227,456)
There are no derivatives not designated as accounting hedges as of June 30, 2012. The net
changes in fair value of the Company’s derivatives not designated as accounting hedges for the
year ended December 31, 2011 and for the six-month period ended June 30, 2011, amounting to
P=108.32 million gain and P=8.97 million loss, respectively, were taken to the “Derivatives gain
(loss)” account in the condensed consolidated statements of income.
Derivatives designated as accounting hedges
Derivative Liabilities June 30, 2012
Balance at beginning of year P=–
Net changes in fair value (54,453,129)
Settlement (4,819,088)
Balance at end of year (P=49,634,041)
- 43 -
The effective portion of the changes in the fair value of the NDCCS designated as accounting
hedges were deferred in equity under “Cumulative Translation Adjustment” account.
25. Event After the Financial Reporting Period
On July 23, 2012, as a result of the initial geo-scientific surveys of the Calerias and Longavi
projects, EDC decided not to pursue the two geothermal projects covered by EDC’s Chilean JVA
with HRL dated February 2, 2012 and by the Longavi SHA dated May 2, 2012. EDC’s decision
not to pursue these projects pursuant to its rights under the foregoing agreements does not have a
material effect on EDC’s existing operations and financial condition since such projects were still
in its preliminary stages.
26. Restatements
Voluntary Change in Accounting Policy
Prior to 2011, the Company accounted for rig consumables as direct expense upon purchase since
these are primarily intended for immediate use. Over the years, the Company has accumulated a
large stock of unused rig consumables. As a result, starting January 1, 2011, the Company
adopted the policy of recognizing rig consumables as inventories.
PAS 8, Accounting Policies, Changes in Accounting Estimates and Errors, requires retrospective
application for a change in accounting policy, except when it is impracticable to determine period-
specific effects. If retrospective application is impracticable, the entity shall apply the new
accounting policy at the beginning of the earliest period for which retrospective application is
practicable. Because prior to January 1, 2011, the Company does not monitor the unused portion
of rig consumable, management determined that it is impracticable to establish the balance of rig
consumables in prior years. Accordingly, the effect of the voluntary change in accounting policy
was presented as an adjustment to the opening balance of 2011 retained earnings.
As at January 1, 2011, the voluntary change in accounting policy resulted to an increase in parts
and supplies inventories, retained earnings and deferred tax liability amounting to P=172.3 million,
P=155.1 million and P=17.2 million, respectively.
27. Other Matters
Seasonality or Cyclicality of Interim Operations
Except for FG Hydro’s sale of electricity coming from hydroelectric power/operations, seasonality
or cyclicality of interim operations is not applicable to the Parent Company’s type of business
because of the nature of its contracts with NPC, which includes guaranteed volume under the
applicable take-or-pay, minimum energy off-take or contracted energy provisions. GCGI’s sales
to cooperatives and industries are also not subject to seasonality or cyclicality.
Changes in Estimates of Amounts Reported in Prior Financial Years
The key assumptions concerning the future and other key sources of estimation uncertainty used in
preparation of the unaudited interim condensed consolidated financial statements are consistent

- 44 -
with those followed in the preparation of the Company’s annual consolidated financial statements
as of and for the year ended December 31, 2011, except for the following estimates that follows:
Impairment of Intangible Asset not yet available for Use
On July 27, 2012, the Energy Regulatory Commission approved the initial Feed-in Tariff (FIT)
rates that shall apply to generation from renewable energy sources, particularly. For wind energy,
the approved FIT rate amounted Php8.53 per kwh. Accordingly, the Company used the new FIT
rate in the impairment assessment of the Company’s wind energy project development costs.
Based on the Company’s impairment assessment, the Company’s wind energy project
development remain to be recoverable. For the period June 30, 2012, no impairment loss was
recognized pertaining to this asset.
Provision for rehabilitation and restoration costs
Provision for rehabilitation and restoration costs is based on technical estimates of probable costs,
which may be incurred by the Company in the rehabilitation and restoration of the Company’s
steam fields and power plants’ contract areas from 2031 up to 2044. As of December 31, 2011, the
estimated rehabilitation and restoration costs are discounted using the Company’s risk-adjusted
rate. On June 30, 2012, the Company used risk-free rate in the computation of the provision. The
Company also changed the amounts of cash flow assumptions to reflect the best estimate of its
rehabilitation and restoration costs. As of June 30, 2012 and December 31, 2011, the provision for
rehabilitation and restoration costs amounted to P=483.49 million and P=406.78 million,
respectively.
Changes in the Composition of the Company During the Interim Period
On January 10, 2012, the Chilean Ministry of Energy awarded to EDC the geothermal exploration
concession of Newen, while San Rafael and Batea geothermal exploration concessions were
awarded on January 19, 2012.
On February 2, 2012, EDC entered into JVA with HRL to co-develop four geothermal exploration
projects: the Calerias and Longavi projects in Chile, and the Quellaapacheta and Chocopata
projects in Peru. EDC and HRL successfully concluded negotiations after discussions began with
the signing of the Heads of Terms Agreement last November 28, 2011.
On May 2, 2012, EDC executed SHA with HRL to establish project companies for each of the Calerias and Longavi geothermal concessions in Chile, as well as the Chocopata and
Quellaapacheta geothermal authorizations in Peru, allowing the joint venture to commence
exploration activities at each of the foregoing sites. Pursuant to the terms of the SHA, EDC will
hold 70% of the outstanding capital stock of each of the project companies, with HRL taking the
remaining 30%.
Changes in Contingent Liabilities or Contingent Assets Since the Last Annual Reporting Date
There are no material changes in the contingent liabilities or contingent assets since the last annual
reporting date.
Existence of Material Contingencies and Any Other Events or Transactions that are Material to
an Understanding of the Current Interim Period
There are no material contingencies and any other events or transactions during the period.
Unusual items
There are no assets, liabilities, equity, net income or cash flows that are unusual because of their
nature, size or incidence during the current period.