Embed Size (px)
Citation preview

savillsim.com
Dissolution Report as of 31 May 2017
SEB ImmoPortfolio Target Return Fund

Table of Contents
Editorial 4
Information on the Continued Liquidation of SEB ImmoPortfolio Target Return Fund 5
Risk Management 6
Real Estate Markets – An Overview 8
Results of the Fund in Detail 11
Structure of Fund assets 11
Liquidity 11
Investment performance 12
Income components 13
Portfolio Structure 14
Changes to the Portfolio 18
Outlook 21
Overview: Returns, Valuation and Letting 22
Development of Fund Assets 24
Condensed Statement of Assets 26
Regional Distribution of Fund Properties 30
Statement of Assets, Part I: Property Record 32
Statement of Assets, Part II: Liquidity Portfolio 37
Statement of Assets, Part III: Other Assets, Liabilities and Provisions, Additional Disclosures 38
Statement of Income and Expenditure 41
Application of Fund Income 45
Auditors’ Report 46
Fund Bodies 47
Graphics
Geographical distribution of Fund properties 14
Types of use of Fund properties 14
Allocation of Fund properties by value class 15
Economic age distribution of Fund properties 15
Remaining lease terms 16
Tenant structure by sector 17
Terms used in the Kapitalanlagegesetzbuch (KAGB – German Investment Code) Terms used in the Investmentgesetz (InvG – German Investment Act)
General Fund Rules (AAB) General Fund Rules (AVB)
Special Fund Rules (BAB) Special Fund Rules (BVB)
External valuers Experts, Expert Committee
Investment company (KVG) Investment company (KAG)
Overview of assets Condensed statement of assets
Depositary Custodian Bank
Notice
SEB ImmoPortfolio Target Return Fund has not amended its Fund Rules in line with the Kapitalanlagegesetzbuch (German Investment Code), which has been in force since 2014, due to the suspension of the issuance and redemption of units and the subsequent dissolution of the Fund. This Dissolution Report has been prepared in accordance with the provisions of the Investmentgesetz (InvG – German Investment Act), and in this case especially section 44 of the InvG, and of the Investment- Rechnungslegungs- und Bewertungsverordnung (InvRBV – German Investment Fund Accounting and Valuation Regulation). For this reason, we will continue to use the relevant InvG terminology in this Dissolution Report.
SEB ImmoPortfolio Target Return Fund – Dissolution Report as of 31 May 2017 2

SEB ImmoPortfolio Target Return Fund at a Glance as of 31 May 2017
Poland – Warsaw, Ulica Domaniewska 49
1) One real estate company does not hold any properties and one real estate company holds four properties.2) The estimated gross rental corresponds to the estimated net rental plus incidental expenses.3) Based on the Fund’s average directly and indirectly held property assets financed by equity 4) Based on the Fund’s average liquid assets5) Calculated according to the BVI method6) Total costs as a percentage of average Fund assets within a financial year, calculated as of 31 December 2016
* The key return figures were not included in the audit for which the Auditors’ Report was issued.
German Securities Code Number: 980231 ISIN: DE0009802314 Launched as SEB ImmoSpezial I, a special fund, on 15 October 2001; transformed into a mutual fund on 1 October 2004.
Fund assets EUR 282.1 million
Total property assets (market values) EUR 200.4 million
thereof held directly EUR 40.1 million
thereof held via real estate companies EUR 160.3 million
Total Fund properties 10 1)
thereof held via real estate companies 7 1)
Changes during the period under review 1 January 2017 to 31 May 2017
Sales 7
Disposals 3
Letting rate (estimated gross rental) 2) 68.1%
Letting rate (estimated net rental) 68.8%
Final distribution for the 2016 financial year on 3 April 2017 EUR 19.4 million
Final distribution per unit EUR 3.00
Total property return 3) for the period 1 January 2017 to 31 May 2017 * – 14.6%
Liquidity return 4) for the period 1 January 2017 to 31 May 2017 * 0.0%
Investment performance 5) for the period 1 January 2017 to 31 May 2017 * 9.3%
Investment performance 5) since Fund launch * 93.3%
Unit value/redemption price EUR 43.63
Issuing price EUR 44.94
Total expense ratio (TER) 6) 1.02%
3 SEB ImmoPortfolio Target Return Fund – Dissolution Report as of 31 May 2017

Carolina von Groddeck and Hermann Löschinger
Editorial
Dear investor,
In the last five months before the management mandate for SEB ImmoPortfolio Target Return Fund was transferred to the Custodian Bank, the Fund management sold a number of additional properties as part of the dissolution process. A total of 10 properties were sold since the end of the last financial year, i.e. from 1 January to 31 May 2017.
Following an international structured bidding process, a sales agreement was signed at the end of April for a pan-European package comprising a total of 42 buildings in seven countries. Nine of these, with an aggregate market value of EUR 189 mil-lion, were from SEB ImmoPortfolio Target Return Fund’s port-folio. Two of these properties, which are located in Vantaa/Helsinki in Finland, have already been recognised as disposals from the Fund, whereas the risks and rewards of ownership for the three properties in France and the four in Poland still have to be transferred. In addition, an office building in New Providence, USA, changed hands in April in the course of an individual sale. Following these transactions, the residual portfolio comprises two equity interests in student residences in Florida.
The Fund’s performance in the period under review was nega-tively influenced firstly by the sales in the USA and Finland and secondly by decreases in the market values of a number of properties. These were determined in the course of the regular reappraisals and were due to the age of the properties con-cerned or to changes in the leasing or market situation.
The proceeds from the sales of the six office properties in Germany in the autumn of 2016 and the sale of the equity interest in the China Town Point development project in Singa-pore in December 2016 allowed a further distribution to be made. On 3 April 2017, investors received EUR 3.00 per unit or EUR 19.4 million in total.
All in all, the results of the approximately three-year dissolution period that started on 5 June 2014 have been highly positive. Almost all properties have been sold (44 out of the original 46), although seven will only be recognised as disposals from the portfolio after the Fund has been transferred to the Custodian Bank. The debt ratio has declined from the previous figure of 37.6% to 0%. In addition, 54% of Fund assets (EUR 421 million) have already been distributed to investors. The Fund’s cumu-lative return since its launch in 2001 is 93.3%; this corresponds to an average return of 4.3% per annum.
SEB ImmoPortfolio Target Return Fund – Dissolution Report as of 31 May 2017 4

Information on the Continued Liquidation of SEB ImmoPortfolio Target Return Fund
SEB ImmoPortfolio Target Return Fund has been in liquidation since 5 June 2014, the date on which the investment company, Savills Fund Management GmbH, gave notice to terminate its management mandate. After expiration of the notice period on 31 May 2017, ownership of the Fund’s assets, which are held in trust for investors, was transferred by law to CACEIS Bank S.A., Germany Branch (hereinafter referred to as CACEIS).
Since midnight on 31 May 2017, CACEIS’s role, as the Depositary, has been to sell the assets left in the Fund within three years while preserving investors’ interests and acting in accordance with the requirements of the Bundesanstalt für Finanzdienstleistungsaufsicht (BaFin – the Federal Finan-cial Supervisory Authority). The Depositary’s task is not to manage the Fund on a permanent basis but to wind it up and to distribute the proceeds to investors. In accordance with BaFin’s requirements, the Depositary is obliged to sell the assets transferred “at the best possible price that can be realised on the market” (BaFin Circular GZ WA 42-Wp-2136-2012/0039 of 27 November 2012, available in German only at http://www.bafin.de). Otherwise, however, it is not subject to any requirements with respect to the size of the proceeds to be generated. In particular, it is not bound by the most recent appraisal value.
To ensure that this task is performed efficiently, CACEIS has entrusted Savills Fund Management GmbH with certain operational subtasks. These include both property manage-ment and providing support for the sale of the properties, thus ensuring the continuity of Fund management. Savills Fund Management GmbH’s role in this capacity is to continue per-forming its existing Fund administration tasks, e.g. to manage the properties and perform the Fund’s accounting, to continue its efforts to sell the remaining properties under the changed legal conditions mentioned above and, in the interests of investors, to propose and prepare transactions in such a way that CACEIS can review the sales documentation and make a final decision on the sale.
Transfer of the Fund as required by law
When Savills Fund Management GmbH’s right to manage SEB ImmoPortfolio Target Return Fund ended, the real estate fund was transferred by law to the Custodian Bank/Depositary. Forty-four of the 46 properties that originally formed part of the Fund’s asset pool as of 5 June 2014 had been sold, or sales agreements had been signed for them, as of 31 May 2017. A total of nine properties and all other assets still belonging to the Fund were transferred to CACEIS on 31 May 2017. Sales agreements had already been signed for seven of the nine properties transferred to the Depositary. The risks and rewards associated with ownership are scheduled to be transferred to the buyer in the coming months. Two properties are in the advanced stages of marketing. In addition to the properties and other assets, certain obligations still exist; these are the Fund’s responsibility.
The transfer of the Fund to CACEIS marks the point at which the investment agreement between Savills Fund Management GmbH and the investors is terminated. Investors no longer have any claim against Savills Fund Management GmbH for the payment of the Fund’s unit value as evidenced by the unit cer-tificates; rather, they have a contractual claim against CACEIS for payment of the liquidation proceeds that are generated.
Remuneration payable to CACEIS
CACEIS is entitled both to be reimbursed for reasonable expenses and to be remunerated for its activities in winding up the Fund. It bases this remuneration on the remuneration that was agreed with Savills Fund Management. Since 31 May 2017, CACEIS has received remuneration of 0.90% p.a. of average Fund assets; this arrangement remains in force until further notice. CACEIS also covers the costs of the services to be provided by Savills Fund Management GmbH out of this remuneration. The Custodian Bank fee that CACEIS previously received is no longer levied.
Distributions
CACEIS will take over responsibility for distributing the liquida-tion proceeds to investors in accordance with the statutory requirements. Please note in this context that it will only make distributions when and to the extent that there is no possibility of the funds belonging to the Fund still being needed to meet actual and potential expenses that have been or will be incurred on the Fund’s behalf.
Valuation
CACEIS will continue to obtain annual valuations of the properties remaining in the Fund from the experts who were previously commissioned to perform appraisals. A unit price will be published every day, as before.
Reporting
CACEIS will work together with Savills Fund Management GmbH to continue publishing information on the progress made in liquidating SEB ImmoPortfolio Target Return Fund online at http://www.savillsim-publikumsfonds.de/de/startseite-fonds-finder/seb-immoportfolio-target-return-fund/. In addition, CACEIS will prepare liquidation reports, which will be granted an audit opinion by its auditor, annually and on the date on which the liquidation of the Fund ends, and will publish them in the elec-tronic Bundesanzeiger (Federal Gazette).
Contact for questions
Investors can continue to address questions and comments to Savills Fund Management GmbH using the existing contact data – [email protected] and the telephone infoline +49 (0)69 15 34 01 86 – as well as to the Fund’s sales partners and brokers.
5 SEB ImmoPortfolio Target Return Fund – Dissolution Report as of 31 May 2017

Risk Management
Risk management is a continuous, integral process that covers all areas of the business, comprising all of the measures applied to systematically deal with risk. One of the key aims of this process is identifying, mitigating and managing any potential risks at an early stage. The early identification of risk creates room for manoeuvre that can be used to help safeguard exist-ing potential for success over the long term and create new opportunities. Savills Fund Management GmbH (formerly SEB Investment GmbH) established a risk management process for this consisting of a risk strategy and the identification, analysis and assessment, management and monitoring, and communi-cation and documentation of risks. The risks will continue to be covered by the risk management process until the manage-ment mandate expires, in line with statutory and contractual requirements in particular.
In keeping with the relevant legal provisions, a distinction is made between the following main risk types:
Counterparty risk
Default by a securities issuer, tenant or counterparty could lead to losses for the Fund. Issuer risk describes the effect of a specific development at an individual issuer that impacts the price of a security in addition to general capital market trends. Default by tenants is countered through active management and regular monitoring. Other measures include credit rating checks and the avoidance to a large extent of cluster risk in the rental segment.
Even when securities and tenants are carefully selected, losses due to the financial collapse of issuers or tenants cannot be ruled out.
Counterparty risk describes the risk that a party to an agree-ment will partially or fully default. This applies to all contracts signed for the account of a fund, but particularly in connection with derivative transactions that are entered into, for example, to hedge currency risk.
Interest rate risk
The liquidity portfolio is exposed to interest rate risk and influ-ences the Fund return. If market interest rates change in relation to the rate applicable when the investment was made, this may affect the price and yield of the investment and lead to fluctuations. However, these price movements vary depending on the investment duration. Fixed-interest securi-ties with shorter maturities generally entail lower price risks than fixed-interest securities with longer maturities. By con-trast, fixed-interest securities with shorter maturities generally have lower returns than fixed-interest securities with longer maturities. Liquidity was held in bank account balances and as securities during the reporting period.
Loans are also exposed to interest rate risk. In order to minimise negative leverage effects as far as possible, fixed interest rate periods and the final maturity of loans are aligned carefully with the planned holding period of the properties, letting rate
trends and expected interest rate developments. If loans are terminated early, there is a risk of early repayment penalties.
The Fund management company may employ derivatives to reduce exchange rate and interest rate risks. Derivatives are used exclusively for hedging purposes to mitigate risk.
Currency risk
If the assets belonging to a fund are invested in currencies other than the fund currency, the fund receives the income, repayments and proceeds from such investments in the relevant currency. If the value of this currency falls against the fund currency, the value of the fund declines. In principle, foreign currency items are largely hedged as part of a low-risk currency strategy. Thus, in addition to taking out loans in the relevant currencies, foreign currency items are normally hedged using forward exchange transactions.
Real estate risk
The properties owned by open-ended real estate funds are the basis for their returns. Such real estate investments are subject to risks that may have an effect on the unit value of the fund. For this reason, a large number of factors can cause both property valuations and income from properties to fluctuate:
W In any investment decision, political, economic and legal risks – including those posed by tax law – should be considered, along with how transparent and well developed the real estate market in question is.
W In decisions to invest outside the eurozone, the volatility of the national currency must be taken into consideration as well. Exchange rate fluctuations and the costs of currency hedging have an impact on the property return.
W Any change in the quality of the location may have a direct effect on lettability and the current situation. If the location increases in attractiveness, lease contracts can be signed for higher rents; however, in the worst possible case a decrease could mean lasting vacancies.
W Building quality and condition also have a direct impact on the capacity of a property to generate income. The condition of the building may require expenditures for maintenance that exceed budgeted maintenance costs. Additional invest-ment costs may impact the return over the short term, but may also be necessary to achieve long-term positive development.
W Risks posed by fire and storm damage as well as natural forces (such as flooding and earthquakes) are covered internationally by insurance if this is possible, reasonable from a financial point of view and objectively necessary.
SEB ImmoPortfolio Target Return Fund – Dissolution Report as of 31 May 2017 6

Poland – Warsaw, Szturmowa 2 and 2a
W Vacancies and expiring leases can mean either earnings potential or risk. Regular observation of the markets invested in, and the implementation of measures based on this knowledge with a view to reacting in good time to market movements, are crucial parts of the process. At the same time, vacancies result in income shortfalls and increased costs to enhance the attractiveness of the property for rental.
W The creditworthiness of tenants is also a significant risk component. Poor creditworthiness can lead to high out-standings and insolvencies can lead to a total loss of income. One of the tasks of portfolio management is to aim to reduce dependencies on individual tenants or sectors.
W Equity interests in real estate companies, i.e. indirect real estate investments, may be exposed to the risk of changes to company or tax law, particularly abroad.
W Market risks specific to real estate, such as letting rates, lease expiries and the performance of the real estate port-folio, are regularly monitored. An appropriate department is responsible for monitoring performance and its main components, and for financial control of performance components (e.g. returns on real estate, returns on the liquidity portfolio, other income and fees). A reporting system has been set up for the relevant performance indicators.
Operational risk
The investment company is responsible for ensuring the orderly management of the Fund. It has made the appropriate arrangements for this and implemented risk minimisation measures for all operational risks identified. The Fund is also exposed to operational risks such as legal and tax risks.
Liquidity risk
Unlike exchange-traded securities, for example, real estate cannot always be sold quickly. Depending on internal cash flows, the Fund therefore holds liquidity over and above the minimum required by law.
Risks existing during the reporting period are addressed in the individual chapters.
7 SEB ImmoPortfolio Target Return Fund – Dissolution Report as of 31 May 2017

Real Estate Markets – An Overview
Economic environment
The political and economic environment in the period until spring 2017 was dominated by ongoing uncertainty, although this became somewhat less acute as time went on. For example, the surprise vote by the British to leave the European Union – a decision that was officially communicated in March 2017 – has not yet had any direct negative effects, despite expectations to the contrary. Equally, the radical change in course that led to uncertainty in the United States following the election of Donald Trump as president has not materialized in more than rudimentary form to date. Additionally, the elections in the Netherlands and France checked the rise of the populists in Europe.
Following global economic growth of 2.5% in 2016 – the lowest figure recorded since the financial crisis – there have been increasing signs of an upturn since autumn last year, especially in Europe and Asia. Inflation turned around in the period from mid-2016 onwards due to the temporary recovery in oil prices. Fears of deflation receded as a result, although no significant increase in inflation rates has been seen so far.
Global monetary policy trends diverged, triggered by the United States. The US Federal Reserve continued the change of course it started implementing in December 2016, raising key interest rates three times to date. By contrast, the ECB and the Japanese central bank maintained their expansionary monetary policy. The increase in capital market interest rates that was triggered by the change of course in the USA subsided again in the year to date as the rise in inflation that had been feared failed to materialize.
Looking to the future, current forecasts are for a slight accel-eration in global growth to approximately 3.0% in the period up to 2018. The increase in inflation is expected to peter out over the same time frame. At present, the Federal Reserve is expected to continue moderately increasing key interest rates, whereas in Europe and Japan a turnaround is only expected in the medium to longer term. Significant uncertainties remain, despite positive signs. For example, the marathon round of elections scheduled for 2017/2018 in Europe, which may affect whether the EU stays together, is not yet over. The start of the Brexit negotiations and a US government agenda that includes among other things deregulation, increased protec-tionism and a more expansionary fiscal policy also pose political risks. The possibility of a debt crisis in the emerging markets is another latent risk. Finally, the conflicts in the Middle East, Africa and Asia represent a geopolitical risk.
Global real estate markets
Take-up on the world’s key office markets was robust in the period up to the spring of 2017, despite the challenging environment. This was primarily due to strong closing quarters in the USA and the United Kingdom, as political uncertainties eased. Vacancies declined on average in Europe and the USA, but rose in the Asia-Pacific region. Average office rents on the markets that we track saw a moderate rise, although the trend
was mixed. Global take-up is expected to be stable in 2017. Although the economic environment remains positive, political uncertainty is likely to lead to muted letting activity in some cases. Transaction volumes on the global investment markets continued to ease at the start of 2017. At a regional level, Europe and North American declined while Asia-Pacific saw a slight rise. Overall, domestic and intraregional investments were the dominant feature, whereas the proportion of cross- border investments declined.
Initial yields remained under pressure worldwide in an environ-ment that was characterised by the pressure on institutional investors to invest, a flight to safety, the less than promising yields offered by other forms of investment and the scarcity of suitable real estate products. This situation is unlikely to change much in 2017/20 18, as real estate investments remain attractive despite rising interest rates. Consequently, initial yields still have downside potential in selected cases. A further increase in capital market rates due to higher key interest rates in the USA is currently still being mitigated in Europe and Japan in particular by ongoing expansionary monetary poli-cies. The continued rise in interest rates that is expected will probably only lead to a trend reversal in initial yields after a time lag.
Germany
After their record performance in 2016, most of Germany’s top seven office markets got off to a flying start in the new year. Strong demand and ongoing low levels of completions ensured vacancy rates continued to fall, with markets in Berlin, Hamburg, Cologne, Munich and Stuttgart being almost fully let. High preletting rates for office properties under con-struction mean that supply-side pressure is unlikely to ease in the foreseeable future. Surplus demand is expressed in rising prime and average rents. This trend will probably continue in the medium term, although the tight supply means that no further increases in take-up are expected.
Transaction volumes on the commercial investment market in Germany were down somewhat year-on-year in 2016. However, investors overcame the caution they had displayed following the Brexit vote as from the fourth quarter of 2016. Measured in terms of volumes, the first quarter of 2017 was the best start to a year on record. Demand for all types of property increased tangibly, with the two higher-yield sectors of logistics and hotel properties benefiting more than average from this. Yields – which are already at record lows – are likely to fall further due to continued high demand for core proper-ties in particular.
SEB ImmoPortfolio Target Return Fund – Dissolution Report as of 31 May 2017 8

United Kingdom
Growth in the UK was down year-on-year in 2016, but was still pretty robust, especially in the second half of the year. By contrast, the letting and investment markets were clearly impacted by the results of the UK referendum on the EU. This led to more subdued, though still relatively solid, letting activity on the office markets. Prime rents remained stable in principle, but effective rents came under pressure. Activity levels on the British investment market stabilised over the course of the cur-rent year following their initial clear decline in the wake of the Brexit vote. At the same time, initial yields stopped falling and some submarkets even saw a rise. Prime yields fell again recently, with clear capital gains being seen in the logistics sector and alternative investments.
The medium-term future of the British economy depends on the results of the Brexit negotiations. Although many of the effects that were feared for the real estate market have not materialised, unsuccessful negotiations could impact economic growth, and hence the market, by increasing uncertainty. Rental markets are forecast to see relatively robust growth for core locations, whereas secondary locations will probably remain under pressure. On the investment market, British property prices are now considerably more appealing to foreign investors due to the sharp fall in the pound. This should mute any further increase in initial yields.
France
Economic development in France has been moderate since the autumn of 2016, despite a slight rally. Nevertheless, the situation on the labour market has improved thanks to the services sector. 2017/2018 is expected to see stronger growth, buoyed by the reforms that the newly elected Macron govern-ment is expected to introduce. Take-up of office space in the top four markets continued at a record level in 2016 and also remained robust in the new year. Vacancy rates in Paris expe-rienced a further decline, a fact that was also reflected in rising rents. By contrast, regional markets did not see much move-ment in office rents. The positive trend in Paris will probably continue in the short term, but will hit the buffers as completions rise significantly. This also applies to the potentially positive effects of relocations triggered by Brexit.
Transaction volumes in France also saw a further slight decrease in 2017 to date. Office properties, especially in Paris, remained the preferred sector for investors. Prime office yields continued to decline, albeit more slowly than before. Although there is still room for a further drop in yields in some cases, this is becoming more and more limited.
Netherlands
The upturn in the Netherlands continued, with extremely robust growth being seen once again at the start of 2017, an upside surprise. The situation on the office markets is gradually improv-ing. Vacancies are declining thanks to a recovery in demand for space, a trend that is being flanked by repurposings.
However, tenant interest is focused on high-quality properties in downtown locations. Amsterdam, where prime rents con-tinued to rise, is leading the recovery, but Utrecht also saw a positive rental trend. A sustained moderate increase in prime rents in Amsterdam in particular is forecast for 2017/2018. The Netherlands remains a popular investment location for foreign investors in particular. Transaction volumes last year recovered to the level last seen in 2007 thanks to numerous foreign purchases. Activity in the year to date has been somewhat slower, although yield compression has continued. The positive yield trend is likely to continue, albeit it in a more subdued form.
Italy
Italy’s economy has been on a gradual growth path since the beginning of 2015. A stronger recovery is being held back by the latent banking crisis and political instability. Office take-up has picked up in the period since 2016, but is largely dominated by relocations.
Since the high vacancy rates have remained almost unchanged as a result and the economy is unlikely to pick up any further in 2017/2018, expectations of a recovery in rents remain muted. Retail demand for space is showing further signs of polarisation, with strong demand from international chains continuing for attractive prime locations, especially in tourist centres. Such properties have therefore been the only ones to see slight rental increases so far. This trend is likely to remain stable in 2017/2018.
Activity on Italy’s investment market has eased in the period since 2016. Transaction volumes declined across all sectors. However, prime yields continued to retreat, although in weaker form. The danger of new elections means that foreign investors can be expected to take an innately cautious approach. Never-theless, initial yields will probably remain under pressure in the prime segment.
Northern Europe
The economic recovery in Northern Europe continued, with regional differences becoming less pronounced. The strong growth in Sweden eased, while other countries saw a slight increase.
Demand for office space in Stockholm remains robust and the tighter supply of state-of-the-art space in downtown locations is fuelling a rise in prime rents. This trend is expected to continue even though the upturn is easing for cyclical reasons. In Helsinki, vacancies remain at high levels despite an upturn in demand for office space. Since relocations are the dominant factor, no across-the-board improvement in vacancies and office rents is expected for 2017/2018.
Trends on the transaction markets in Northern Europe were also mixed. Sweden and Finland both recorded a rise in investment volumes. In contrast, initial yields declined across
9 SEB ImmoPortfolio Target Return Fund – Dissolution Report as of 31 May 2017

a broad front. Northern Europe, like other countries and regions, has room in some cases for a further decline in yields. However, this is likely to be limited in Sweden in particular since historically low levels have already been reached.
Central/Eastern Europe
Economic growth in Central and Eastern Europe has clearly picked up recently. As a result, the economy is set to grow more strongly again in 2017/20 18 and to be in line with or even above the historical average in the Czech Republic and Hungary. Take-up of office space in the top three metropolises declined slightly but remained at a record level in 2017. Vacancies in Prague and Budapest eased tangibly, but a similar development in Warsaw was prevented by substantial additions of space – something that was also reflected in office rents. Prime rents are expected to remain under pressure in Warsaw in 2017/2018, but to increase slightly in Prague and Budapest. However, in Budapest there are longer-term downside risks to the rental trend from supply-side factors.
Transaction volumes in Central and Eastern Europe eased in 2017 to date. This was due exclusively to Poland, whereas investment in the Czech Republic and Hungary remained robust. The decline in initial yields continued in Prague and Budapest in 2017, while in Warsaw yields remained flat. However, only a moderate continuation of this trend is expected in 2017/2018.
USA
The US economy has regained momentum since summer 2016 after a period of temporary weakness. Higher growth is forecast for 2017/2018 than for 2016 due to the more expan-sionary economic policy that has been announced. Rising interest rates are only likely to dampen the economy again in the medium term.
The recent blip in the economy has somewhat muted the recovery on the US office markets. Both the decline in vacancies and the rise in office rents slowed in the period up to early 2017. Only a moderate continued decline in vacancies is expected in 2017/2018, due to an increase in construction activity and the more efficient use of space. However, office rents are still rising slightly on the back of the ongoing positive demand for space.
The recovery in the US retail sector was also more subdued. Construction remains at a low level but the sector is under-going rapid structural change in the United States as elsewhere, triggered by the trend towards e-commerce and demographic effects. Trends are mixed, depending on the region and format concerned, and this is likely to continue in 2017/2018.
As in many other countries, US investment market activity has cooled off since the start of 2016. Only the apartment sector was relatively stable, while office investments experienced the smallest losses. Initial yields declined more slowly against this backdrop, with isolated submarkets even seeing a slight rise. Yield compression is expected to come to an end as capital market interest rates will probably rise.
Asia-Pacific
Growth in the Asia-Pacific region has picked up gradually since the beginning of 2016. The main drivers for this were the industrialised nations in the region, although the emerging market economies, and particularly China, were stable. Growth is forecast to remain at a constant 4.7% in the coming years, with the further slowdown that is expected in China being offset by other countries. Thus Singapore and Australia will probably pick up slightly, while Japan will record more or less stable figures. Overall, this means that the growth rate in the region will still be substantially above that in the USA or Europe.
Office market trends in the region remained mixed until the start of 2017. Japan, Hong Kong, parts of Australia and certain Tier 1 metropolises in China were the main places to see rental increases. By contrast, office rents declined in oversupplied locations in Singapore and many Tier 2 markets in China, as well as in Australian markets connected to the raw materials sector. These trends are expected to continue in 2017/2018, although supply pressure will tend to ease as the construction cycle should have peaked. Japanese and Australian metropolises are forecast to record a further, if weaker, increase in rents. The disparate trend being seen in China will continue, with a moderate increase in rents being expected in certain Tier 1 metropolises. Elsewhere, high levels of completions and vacancy rates are depressing rental performance. Singapore is also dominated by a supply-side driven decline in rents in 2017. There is no end in sight before 2018. Initial signs of stabilisation should become visible on Australian markets connected to the raw materials sector.
Investment activity in the Asia-Pacific region eased slightly following the record volume recorded in 2015. This was mainly due to Japan and Australia, whereas China, Hong Kong, Singapore and South Korea, among other places, all recorded a rise in transaction volumes. The decline affected all types of use with the exception of residential properties. In China, development activity – which is dominated by the residential sector – was the main area to recover. Initial yields on most real estate markets in the region softened further. Only in Hong Kong was a slight increase in yields noticeable. The positive yield trend is likely to continue at a moderate pace in 2017/2018. By contrast, a slight rise in yields is forecast for Hong Kong and Singapore.
SEB ImmoPortfolio Target Return Fund – Dissolution Report as of 31 May 2017 10

Results of the Fund in Detail
Development of SEB ImmoPortfolio Target Return Fund
Structure of Fund assets
SEB ImmoPortfolio Target Return Fund’s assets decreased by EUR 50.3 million to EUR 282.1 million in the reporting period from 1 January to 31 May 2017. The number of units in circu-lation was unchanged, at 6,465,095.
Liquidity
The gross liquidity ratio as of the reporting date was 29.9%; all liquid assets were held as demand deposits as of the end of the reporting period. The average liquidity ratio during the last 12 months, including the equity interests’ liquid assets, amounted to 24.1% of Fund assets.
1) Payable after the end of the financial year
France – Labège / Toulouse, 2480 L’Occitane
Reporting date 31 Dec. 2014
EUR thousand
Reporting date 31 Dec. 2015
EUR thousand
Reporting date 31 Dec. 2016
EUR thousand
Reporting date 31 May 2017
EUR thousand
Properties 843,533 348,100 187,400 40,100
Equity interests in real estate companies 106,868 102,280 49,375 192,502
Liquidity portfolio 48,224 16,079 104,832 84,233
Other assets 84,415 68,792 47,181 27,502
Less: liabilities and provisions – 436,819 – 134,944 – 56,371 – 62,247
Fund assets 646,221 400,307 332,417 282,090
Number of units in circulation 6,465,095 6,465,095 6,465,095 6,465,095
Unit value (EUR) 99.95 61.91 51.41 43.63
Interim distribution per unit (EUR) 18.00 – – –
Date of interim distribution 1 October 2014 – – –
Final distribution per unit (EUR) 1) 37.00 7.10 3.00 –
Date of final distribution 15 April 2015 12 August 2016 3 April 2017 –
11 SEB ImmoPortfolio Target Return Fund – Dissolution Report as of 31 May 2017

Overview of exchange rate risks as of 31 May 2017
1) A Norwegian real estate company was recorded as a disposal in financial year 2014. As of the reporting date, there are still Fund assets reported in Norwegian kroner. No new currency hedges were entered into in Norwegian kroner for these Fund assets.
2) Overhedged as of the reporting date3) Hedges of Fund assets held in foreign currency amounted to 97.7% of Fund assets as of the reporting date of 31 May 2017.
Investment performance *
The Fund generated a total performance of – 9.3%, or EUR – 4.78 per unit, over the reporting period. Its performance since its launch on 15 October 2001 amounts to 4.3% p.a.
Return according to the BVI method *
Note: Calculated according to the BVI standard for funds in dissolution; no reinvestment of distributions in fund units since notice was given to terminate the management mandate. Historical performance data are no indication of future performance.
* The tables and the explanatory text were not included in the audit for which the Auditors’ Report was issued.
France – Labège / Toulouse, 2480 L’Occitane
Unit value as of 31 May 2017 EUR 43.63
Plus final distribution on 3 April 2017 EUR 3.00
Minus unit value on 1 January 2017 EUR – 51.41
Investment performance EUR – 4.78
Return in %
Return in % p.a.
Current year – 9.3
1 year – 8.8 – 8.8
3 years – 9.6 – 3.3
5 years – 9.2 – 1.9
10 years 20.7 1.9
Since launch 93.3 4.3
Currency
Open currency items as of reporting date
in % of Fund assets (incl. loans)
per currency zone
in % of Fund assets per currency zone
PLN (Poland) PLN 305,135 EUR 73,125 – 0.3 – 0.3
NOK (Norway) NOK 857,004 EUR 90,606 100.0 100.0 1)
USD (USA) USD – 14,168 EUR – 12,629 0.0 0.0 2)
SGD (Singapore) SGD 47,066 EUR 30,347 3.5 3.5
GBP (United Kingdom) GBP 176 EUR 201 0.0 0.0
Total EUR 181,650 2.3 2.3 3)
SEB ImmoPortfolio Target Return Fund – Dissolution Report as of 31 May 2017 12

Income components *
The properties generated gross income of 4.8% in the period under review. Management costs reduced gross income at the portfolio level by 2.7%.
The changes in value item comprises both the changes in the value of portfolio properties resulting from expert opinions and the disposal gains or losses for the properties recorded as disposals.
Capital growth in France and the Netherlands was negative (– 16.6%) due to downward revaluations of the properties and losses on disposals.
Income components of Fund return in % *
1) Countries which continue to contribute to total income after the properties are recorded as disposals are also included in the calculation.
2) Based on the Fund’s average property assets in the period under review3) Based on the Fund’s average property assets financed by equity in the period under review4) Exchange rate differences include both changes in exchange rates and currency hedging
costs for the period under review.5) The total income in Fund currency was generated with an average share of Fund assets
invested in property and financed by equity of 75.9% in the twelve-month period and 66.1% in the reporting period.
6) Based on the Fund’s average liquid assets in the period under review7) The average share of Fund assets invested in the liquidity portfolio was 24.1% in the twelve-
month period and 33.9% in the reporting period.8) Based on the average Fund assets in the period under review
* The table and the explanatory text were not included in the audit for which the Auditors’ Report was issued.
Foreign income taxes decreased the result by 0.2%, while foreign deferred taxes resulting from downward revaluations increased it by 0.7%.
Income from properties after borrowing costs amounted to – 15.2%.
Due to current interest rate levels, no return was generated from the investments in the liquidity portfolio. These figures resulted in an overall return before Fund costs of – 9.6% in the period from 1 January 2017 to 31 May 2017; the return in accordance with the BVI method (after Fund costs) was – 9.3%.
Twelve-month period from 1 June 2016 to 31 May 2017
Reporting period from 1 January 2017 to 31 May 2017
Dire
ct
acq
uisi
tions
1)
Eq
uity
inte
rest
s 1)
Tota
l
Dire
ct
acq
uisi
tions
1)
Eq
uity
inte
rest
s 1)
Tota
l
I. Properties
Gross income 2) 8.0 5.2 7.0 4.9 4.6 4.8
Management costs 2) – 4.2 – 5.2 – 4.5 – 2.1 – 3.8 – 2.7
Net income 2) 3.8 0.0 2.5 2.8 0.8 2.1
Changes in value 2) – 2.0 – 31.9 – 12.7 – 11.1 – 26.5 – 16.6
Foreign income taxes 2) 2.5 – 0.1 1.6 – 0.3 0.0 – 0.2
Foreign deferred taxes 2) 1.0 – 0.8 0.3 1.8 – 1.1 0.7
Income before borrowing costs 2) 5.3 – 32.8 – 8.3 – 6.8 – 26.8 – 14.0
Income after borrowing costs 3) 6.4 – 51.3 – 12.6 – 7.1 – 29.7 – 15.2
Exchange rate differences 3) 4) – 0.2 1.9 0.5 – 0.3 2.1 0.6
Total income in Fund currency 3) 5) 6.2 – 49.4 – 12.1 – 7.4 – 27.6 – 14.6
II. Liquidity 6) 7) 0.0 0.0
III. Total Fund income before Fund costs 8) – 9.2 – 9.6
Total Fund income after Fund costs (BVI method) – 8.8 – 9.3
13 SEB ImmoPortfolio Target Return Fund – Dissolution Report as of 31 May 2017

Office
Residential
Car park
Industrial (warehouses,
halls)
Retail/ catering
Other
0% 20% 40% 60% 80%
68.4%
1.5%
29.1%
67.0%
21.5%
2.3%
1.3%1.3%
6.8%0.0%
0.5%0.3%
Poland: 67.1% (4) USA: 12.9% (3)
France: 20.0% (3)
Portfolio Structure
As of 31 May 2017, the portfolio comprised six properties held via equity interests and three directly held properties. One real estate company no longer holds any properties and one real estate company holds four properties. The Fund has property assets totalling EUR 200.4 million, compared with EUR 250.8 million at the end of 2016. The portfolio is diversified across three countries.
Measured in terms of their market values, 100% of the property assets were invested outside Germany as of the reporting date. The portfolio’s largest regional focus was on Poland.
40.7% of property assets were invested in properties with an economic age of no more than ten years. Measured in terms of the estimated net rental for the year, the dominant type of use for the portfolio was offices (68.4%).
Letting
The Fund’s management signed 133 new leases for 7,630 m² of space in the period from 1 January to 31 May 2017. In addition, 263 existing leases for 13,360 m² of space were extended, corresponding in the aggregate to 13.6% of the Fund’s total estimated net rental. The number of leases signed and the total letting volume are influenced in particular by the student residences in Florida, which are also leased on a quarterly basis.
Geographical distribution of Fund properties
Number of properties in bracketsBasis: market values (incl. properties held via equity interests)
Types of use of Fund properties
Basis: By estimated net rental for the year By rental space (incl. properties held via equity interests)
USA – Tallahassee, 235 Ocala Road South
SEB ImmoPortfolio Target Return Fund – Dissolution Report as of 31 May 2017 14

5 to 10 years: 40.7% (2 properties) 15 to 20 years: 43.5% (4 properties)
10 to 15 years: 15.8% (3 properties) more than 20 years: 0.0% (1 property)
up to EUR 10 million: 4.3% (2 properties) EUR 25 < 50 million: 20.0% (1 property)
EUR 10 < 25 million: 45.7% (6 properties) EUR 50 < 100 million: 30.0% (1 property)
Basis: market values (incl. properties held via equity interests)
Basis: estimated net rental for the year (incl. properties held via equity interests)
The letting rate for SEB ImmoPortfolio Target Return Fund as of the reporting date was 68.8% of the estimated net rental (– 1.4 percentage points as against 31 December 2016), or 68.1% of the estimated gross rental (– 1.4 percentage points). The average letting rate during the period under review was 70.3% of the estimated net rental (– 7.4 percentage points), or 69.7% of the estimated gross rental (– 7.6 percentage points).
The decline in the letting rate was due in particular to the sales and expiring leases in Poland, as well as to the ongoing vacancies in France and the USA.
In France, a lease extension for approximately 600 m2 of space in the 320 Avenue Archimède property in Aix-en-Provence was signed with an existing tenant.
A well-known insurance company entered into a new lease for roughly 1,100 m2 of space for the 290 Avenue Galilée property, which is also located in Aix-en-Provence. The lease has a typical duration for the country.
In Lodz, Poland, a new lease for roughly 950 m2 of space was signed for the property at Aleja Pilsudskiego 22. It has been in force since March 2017 and runs for five years.
Allocation of Fund properties by value class
Basis: market values (incl. properties held via equity interests)
Economic age distribution of Fund properties
Basis: market values (incl. properties held via equity interests)
Top tenants
Hewlett-Packard Polska Sp. z o.o., Warsaw, Szturmowa 2 and 2a
Mondelez Europe Services GmbH, Warsaw, Ulica Domaniewska 49
Emerson Process Management Sp. z o.o., Warsaw, Szturmowa 2 and 2 a
VIMN Poland Sp. z o.o., Warsaw, Ulica Domaniewska 49
PPD Poland, Warsaw, Ulica Domaniewska 49
Top properties
Warsaw, Ulica Domaniewska 49
Warsaw, Szturmowa 2a
Aix-en-Provence, 290 Avenue Galilée
Warsaw, Szturmowa 2
Tallahassee, 2700 West Pensacola Street
15 SEB ImmoPortfolio Target Return Fund – Dissolution Report as of 31 May 2017

2017
2018
2019
2020
2021
2022
2023
2024
2025
2026
2027 +
indefinite
0% 10% 20% 30%
21.0%
19.3%
9.4%
8.4%
8.8%
8.6%
0.7%
16.2%
5.7%
1.3%
0.0%
0.6%
Remaining lease terms
Basis: estimated net rental for the year (incl. properties held via equity interests)France – Aix-en-Provence, 320 Avenue Archimède
New leases or lease renewals were signed for roughly 30% of the total space in the student residences in Tallahassee, Florida, in the first five months of the calendar year; in all, the properties comprise approximately 38,800 m2 of space.
At present, 32.6% of all leases have a term of more than five years, a fact that safeguards SEB ImmoPortfolio Target Return Fund’s stability and earnings power.
For further information on the portfolio structure, please also refer to the section entitled “Overview: Returns, Valuation and Letting” on pages 22 and 23.
Letting situation for individual properties
The following part of the report on the letting situation provides a detailed overview of properties with a vacancy rate of over
33% of the estimated (gross) rental for the property as of the reporting date, 31 May 2017.
Property
Vacancy rate at property
level in %
Vacancy rate at Fund
level in %
Warsaw, Szturmowa 2 75.7 7.9Leasing properties in Warsaw is extremely difficult due to high vacancy rates and the large number of office completions.
Warsaw, Ulica Domaniewska 49 52.4 16.4Leasing is a challenge since a large number of new builds are hitting the market in Warsaw. Negotiations are currently being held with an existing tenant to extend a lease for approximately 2,000 m² of space for five years as from early 2018.
Labège / Toulouse, 2480 L’Occitane 33.9 1.2Although leasing activities are ongoing, no leases could be signed as yet for market-related reasons.
SEB ImmoPortfolio Target Return Fund – Dissolution Report as of 31 May 2017 16

by rental space
Consumer goods industry and retail
Technology and software
Chemical and pharmaceutical industry
Banks and financial services providers
Utilities and telecommunications companies
Engineering, raw materials extraction and processing
Media and entertainment
Hotels and catering
Management consulting, legal and tax advisory
Insurance companies
Other sectors
by total estimated net rental
Consumer goods industry and retail
Technology and software
Chemical and pharmaceutical industry
Media and entertainment
Banks and financial services providers
Utilities and telecommunications companies
Engineering, raw materials extraction and processing
Hotels and catering
Management consulting, legal and tax advisory
Insurance companies
Other sectors
0% 10% 20% 30% 40% 50%
11.6% (5)
19.3% (8)
14.6% (14)
9.7% (5)
3.7% (5)
2.9% (18)
2.8% (2)
2.7% (1)
0.4% (1)
0.3% (1)
0.2% (1)
43.4% (939)
21.7% (8)
15.8% (14)
4.3% (1)
3.9% (5)
3.6% (18)
3.0% (2)
0.4% (1)
0.4% (1)
0.3% (1)
35.0% (939)
France – Aix-en-Provence, 320 Avenue Archimède
Tenant structure by sector
Number of tenants in brackets (incl. properties held via equity interests)
17 SEB ImmoPortfolio Target Return Fund – Dissolution Report as of 31 May 2017

Changes to the Portfolio
1) The property was recorded as a disposal from the equity interest in the 41 Spring Street, LLC, real estate company, which is domiciled in Jenkintown, USA. The company consists of a legal shell and no longer holds any properties. It is currently being liquidated.
2) The selling price has not been published because of the provisions to this effect contained in the sale agreement.
The Fund management sold ten properties in the reporting period from 1 January to 31 May 2017. Three properties have already been recorded as disposals from the Fund. The risks and rewards associated with ownership for all the others will be transferred at the latest in the third quarter of 2017.
Sales and disposals
USA – New Providence, 41 Spring Street The property in New Providence is located roughly 45 kilo-metres to the east of New York. It is situated on the corner of Central Avenue and Spring Street and is a good kilometre from Murray Hill Train Station, which also has a direct train link to New York (Penn Station). The single-storey building, which offers a total of approximately 15,700 m2 of space, is in the vicinity of a large number of multi-tenant buildings. The property was recorded as a disposal from the Fund on 10 April 2017.
Finland – Vantaa, Äyritie 8b The Allegro building with its 4,600 m2 or so of space and the equity interest in a parking garage with 115 parking spaces are located in the established Gate 8 Business Park in Aviapolis, Finland, in the vicinity of Helsinki’s international airport. It has good links to Ring Road III, one of the country’s main traffic arteries. The two real estate companies were derecognised from the Fund’s portfolio effective 1 May 2017.
Finland – Vantaa, Äyritie 8b
Sales and disposals
Properties held via equity interests in real estate companies in countries with other currencies
Country Postcode City Street
Transfer of risks and rewards of
ownership as of
Selling price
in millions
Market value at the time of sale
in millions
USA 07974 New Providence 41 Spring Street Apr. 2017 1) USD 8.2 USD 16.2
Equity interests in real estate companies in eurozone countries
Country Domicile Company
Equity interest held
Transfer of risks and rewards of
ownership as of
Selling price
in millions
Market value at the time of sale
in millions
Finland Helsinki Kiinteistö Oy Plaza Allegro, c/o Newsec Asset Management Oy
100.00% May 2017 2) EUR 11.3
Finland Vantaa Kiinteistö Oy Plaza 2 Park 17.70% May 2017 2) EUR 1.7
SEB ImmoPortfolio Target Return Fund – Dissolution Report as of 31 May 2017 18

Sales
The goal is for the risks and rewards associated with owner-ship of the following properties from SEB ImmoPortfolio Target Return Fund’s portfolio to be finally transferred in the third quarter of 2017.
France – Aix-en-Provence, 320 Avenue Archimède and 290 Avenue Galilée The two three-storey buildings at 320 Avenue Archimède and 290 Avenue Galilée are located at the heart of the Pôle d’activité d’Aix-en-Provence, which comprises five business parks within a radius of roughly six kilometres. The first was opened in 2006 and has approximately 5,640 m2 of office space. The second property has total leasable space of approximately 11,480 m2. Electronics, IT, pharmaceuticals and aviation companies are located in the vicinity. There are also good links to the A8 motorway, the airport and the TGV (high- speed train) station.
France – Labège / Toulouse, Regent Park, 2480 L’Occitane This three-storey multi-tenant building with roughly 6,160 m2 of space and 260 parking spaces is located in an office park roughly 13 kilometres south-west of Toulouse. The location offers hotels and restaurants as well as office buildings. The park has direct access to the A61 motorway, as well as a railway station nearby.
Poland – Lodz, Aleja Pilsudskiego 22
Poland – Warsaw, Szturmowa 2 The multi-tenant UBC I building was constructed in 1979 in the Mokotów district of the city and was thoroughly modernized in 1997. The office block has around 12,370 m2 of leasable space and a flexible floor plan. A canteen is located on the ground floor. Parking spaces are available both in the under-ground parking garage and outside. The property was trans-ferred to real estate company IPTR IV GmbH on 19 May 2017.
Poland – Warsaw, Szturmowa 2a The 11-storey UBC II building dates back to 2000. The 20,050 m2 or so of space, which can be used as individual, open plan or multifunctional offices, is designed primarily for multi-tenant use. Tenants can use the neighbouring UBC I canteen and also have access to a kiosk in the building itself as well as an underground parking garage and outside parking spaces. This property was also transferred to real estate company IPTR IV GmbH on 19 May 2017.
Poland – Warsaw, Ulica Domaniewska 49 Trinity Park III, which has roughly 32,500 m2 of office space, is located in the Służewiec Przemysłowy area of the Mokotów district, a major office location to the south of the Polish capital’s centre. Among other things, the building has restaurants on the ground floor, along with six /seven office floors and three floors of parking spaces. Another 65 parking spaces are available outside. The property is roughly three kilometres away from Warsaw's Frédéric Chopin Airport and seven kilo-metres from Warsaw’s Central Station and the city centre. This property was also transferred to real estate company IPTR IV GmbH, in this case on 23 May 2017.
Poland – Lodz, Aleja Piłsudskiego 22 This four-storey building in a good downtown location was constructed in 2006. The approximately 6,430 m2 of space is spread across two three-storey wings with two connecting entrances. In addition, it boasts 130 outside parking spaces plus good links to the public transport network. The building has belonged to real estate company IPTR IV GmbH since 12 May 2017.
Restructuring
The four Polish properties – Szturmowa 2 and 2a and Ulica Domaniewska 49 (all in Warsaw) and Aleja Piłsudskiego 22 (in Lodz) – were acquired by real estate company IPTR IV GmbH.
19 SEB ImmoPortfolio Target Return Fund – Dissolution Report as of 31 May 2017

1) The selling price has not been published because of the provisions to this effect contained in the sale agreement.
France – Aix-en-Provence, 290 Avenue Galilée
Sales
Directly held properties in eurozone countries
Country Postcode City Street
Transfer of risks and rewards of
ownership as of
Selling price
in millions
Market value at the time of sale
in millions
France 13090 Aix-en-Provence Avenue Archimède 320 Q3 / 2017 1) EUR 10.1
France 92981 Aix-en-Provence Avenue Galilée 290 Q3 / 2017 1) EUR 21.4
France 31670 Labège / Toulouse L’Occitane 2480 Q3 / 2017 1) EUR 8.6
Restructuring sales
Sale of the directly held property in Poland to the IPTR IV GmbH real estate company in Germany
Country Postcode City Street
Transfer of risks and rewards of
ownership as of
Selling price
in millions
Market value at the time of sale
in millions
Poland 99-051 Lodz Aleja Pilsudskiego 22 Apr. 2017 1) EUR 13.0
Poland 02-678 Warsaw Szturmowa 2 Apr. 2017 1) EUR 21.3
Poland 02-678 Warsaw Szturmowa 2a Apr. 2017 1) EUR 40.0
Poland 02-672 Warsaw Ulica Domaniewska 49 Apr. 2017 1) EUR 60.2
SEB ImmoPortfolio Target Return Fund – Dissolution Report as of 31 May 2017 20

Outlook
Effective 1 June 2017, CACEIS Bank S.A., Germany Branch (hereinafter referred to as CACEIS) has been responsible by law for SEB ImmoPortfolio Target Return Fund’s continued dissolution. Its main job is to dispose of the remaining assets within three years while preserving investors’ interests, and to distribute the proceeds to investors.
To ensure that the expertise about the Fund acquired since its launch in 2001 can be used in this process, CACEIS has commissioned Savills Fund Management GmbH as a service provider to perform the ongoing dissolution at an operational level. This covers both the management of the Fund and the sale of the remaining properties. Under the agreement, Savills Fund Management GmbH will prepare the sales, provide support during the sales process, and produce the relevant decision documents for the Custodian Bank. CACEIS will then take the final decision on the sales.
Nine properties in three countries were transferred to the Cus-todian Bank on 1 June 2017. Purchase agreements already exist for seven of the properties; two equity interests still need to be sold.
The sales of the seven properties in Poland and France, which were sold as part of a large pan-European portfolio transaction, will probably close in the coming months. The transfer of the risks and rewards associated with ownership of these prop-erties is expected to have a negative effect on the unit value. Although the proceeds of the sale of the portfolio were below the most recent appraisal values, the deal was still the best option from an economic perspective. The bidding process and the cost benefits achieved by packaging the properties together rather than selling them individually represented the best possible result for investors under the circumstances.
Negotiations to sell the two equity interests in the American student residences in Tallahassee, Florida, have reached an advanced stage. The properties are expected to be recorded as disposals in the third quarter of 2017.
After the last properties have been sold, SEB ImmoPortfolio Target Return Fund’s management must retain liquidity reserves for several years in order to be able to meet all obligations that
arise. These include potential claims for back taxes on the part of the fiscal authorities, warranty and guarantee claims arising from sales, and Fund administration and management costs. Since the Fund was widely invested in Europe, Asia and the USA and, in particular, the tax audits depend on the applica-ble tax law in the countries concerned, no forecast can be given as to when it can finally be wound up. For this reason, the legislation does not specify a final statutory deadline for the dissolution.
As in the past, free liquidity will gradually be distributed to investors as successive cash inflows are received from the disposal of the properties that have been sold, as risks decline over time and as reserves are released. The Custodian Bank, which has been entrusted with managing the Fund, decides on the timing and amount of future distributions.
As in the past, CACEIS and Savills Fund Management GmbH will provide information on the Fund’s ongoing dissolution at regular intervals. Additionally, a liquidation report will be prepared once a year as of 31 December. Your contacts at Savills Fund Management GmbH remain available to answer any questions you may have. In addition, information about the Fund is available as before on the website at http://www.savillsim-publikumsfonds.de/.
We would like to offer our warmest thanks for the confidence you have shown in us.
Savills Fund Management GmbH
Carolina von Groddeck Hermann Löschinger
Frankfurt am Main, August 2017
21 SEB ImmoPortfolio Target Return Fund – Dissolution Report as of 31 May 2017

Overview: Returns, Valuation and Letting
1) Countries which continue to contribute to total income after the properties are recorded as disposals are also included in the calculation.
2) The weighted average figures in the period under review are calculated using 6 month-end values (31 December 2016 to 31 May 2017).
3) Based on the Fund’s average property assets in the period under review4) Based on the Fund’s average property assets financed by equity in the period under review5) Exchange rate differences include both changes in exchange rates and currency hedging
costs for the period under review. 6) The total income in Fund currency was generated with an average share of Fund assets
invested in property and financed by equity for the period of 66.1%.7) Based on the Fund’s average liquid assets in the period under review8) The average share of Fund assets invested in the liquidity portfolio for the period was
33.9%.9) Based on the average Fund assets in the period under review
10) Rental valuations (expert opinions) are defined as the gross profit from rental determined by experts. Gross profit in this case equates to the sustainable net basic rent estimated by the experts.
11) Total changes in market values established by experts12) Other changes in value comprise changes in carrying amounts such as the amortisation of
transaction costs and purchase price settlements.
The “Changes in value” item in the “Key return figures” table includes disposal gains and losses realised in the period under review from properties recorded as disposals. The “Information on changes in value” table only includes data for properties held in the Fund as of the reporting date of 31 May 2017.
* This table or line was not included in the audit for which the Auditors’ Report was issued.
Fra
nce
Po
land
Res
t o
f w
orl
d
(A, D
, E,
NL,
UK
) 1)
Tota
l dire
ct
inve
stm
ents
Eq
uity
inte
rest
s (F
IN, S
G, S
K,
US
A, P
L) 1)
Tota
l
Key return figures (in % of average Fund assets) 2) *
I. Properties
Gross income 3) 3.9 3.4 2.0 4.9 4.6 4.8
Management costs 3) – 1.6 – 1.0 – 1.5 – 2.1 – 3.8 – 2.7
Net income 3) 2.3 2.4 0.5 2.8 0.8 2.1
Changes in value 3) – 7.1 – 10.4 – 1.7 – 11.1 – 26.5 – 16.6
Foreign income taxes 3) – 1.2 0.0 0.0 – 0.3 0.0 – 0.2
Foreign deferred taxes 3) 2.6 1.4 0.0 1.8 – 1.1 0.7
Income before borrowing costs 3) – 3.4 – 6.6 – 1.2 – 6.8 – 26.8 – 14.0
Income after borrowing costs 4) – 4.2 – 6.6 – 1.2 – 7.1 – 29.7 – 15.2
Exchange rate differences 4) 5) 0.0 – 0.3 0.0 – 0.3 2.1 0.6
Total income in Fund currency 4) 6) – 4.2 – 6.9 – 1.2 – 7.4 – 27.6 – 14.6
II. Liquidity 7) 8) 0.0
III. Total Fund income before Fund costs 9) – 9.6
Total Fund income after Fund costs (BVI method) – 9.3
Net asset information (weighted average figures in EUR thousand) 2) *
Directly held properties 37,929 107,379 – 7,970 137,338 0 137,338
Properties held via equity interests 0 0 0 0 76,357 76,357
Total properties 37,929 107,379 – 7,970 137,338 76,357 213,695
of which equity-financed property assets 31,790 107,379 – 7,970 131,199 72,972 204,171
Loan volume 6,139 0 0 6,139 3,385 9,524
Liquidity 6,024 1,322 88,721 96,067 8,586 104,653
Total Fund assets 37,814 108,701 80,751 227,266 81,558 308,824
Information on changes in value (at the reporting date in EUR thousand)
Portfolio market values (expert opinions) 40,100 0 0 40,100 160,332 200,432
Portfolio rental valuations (expert opinions) 10) * 3,054 0 0 3,054 16,761 19,815
Positive changes in value acc. to expert opinions 11) 0 0 0 0 0 0
Other positive changes in value 12) 0 0 0 0 1,668 1,668
Negative changes in value acc. to expert opinions 11) – 2,600 0 0 – 2,600 – 6,672 – 9,272
Other negative changes in value 12) – 10 0 0 – 10 – 1,849 – 1,859
Total changes in value acc. to expert opinions 11) – 2,600 0 0 – 2,600 – 6,672 – 9,272
Total other changes in value 12) – 10 0 0 – 10 – 181 – 191
Addition / reversal (capital gains tax) 968 0 0 968 – 1,061 – 93
Total changes in value – 1,642 0 0 – 1,642 – 7,914 – 9,556
SEB ImmoPortfolio Target Return Fund – Dissolution Report as of 31 May 2017 22

1) Based on the ratio of the estimated net rental for the year from directly or indirectly held properties to the total estimated net rental for the Fund. In the case of the equity interests, the estimated rental is included in proportion to the equity interest held.
2) The estimated gross rental comprises net rental (“basic rent”) along with service charges to be paid by the tenant, e.g. heating, power, cleaning and insurance, which are represented by the advance service charge payments.
* This table was not included in the audit for which the Auditors’ Report was issued.
Fra
nce
Tota
l dire
ct
inve
stm
ents
Eq
uity
inte
rest
s
(PL,
US
A)
Tota
l
Letting information (in % of estimated net rental for the year) 1) *
Office 16.5 16.5 51.9 68.4
Retail /catering 0.1 0.1 1.2 1.3
Industrial (warehouses, halls) 0.0 0.0 1.5 1.5
Residential 0.0 0.0 21.5 21.5
Car park 0.2 0.2 6.6 6.8
Miscellaneous 0.0 0.0 0.5 0.5
% of total annual rental income 16.8 16.8 83.2 100.0
Vacancy rate (in % of estimated net rental for the year) 1) *
Office 3.1 3.1 21.3 24.4
Retail /catering 0.1 0.1 0.0 0.1
Industrial (warehouses, halls) 0.0 0.0 0.8 0.8
Residential 0.0 0.0 3.1 3.1
Car park 0.0 0.0 2.8 2.8
Miscellaneous 0.0 0.0 0.0 0.0
% of total vacancies 3.2 3.2 28.0 31.2
Letting rate (at the reporting date) in % of the estimated net rental for the year and country 1) 80.8 80.8 66.3 68.8
Letting rate (at the reporting date) in % of the estimated gross rental for the year and country 2) 81.0 81.0 65.6 68.1
Remaining lease terms (in % of estimated net rental for the year) 1) *
indefinite 0.0 0.0 0.6 0.6
2017 0.9 0.9 20.1 21.0
2018 1.4 1.4 17.9 19.3
2019 0.9 0.9 8.5 9.4
2020 3.8 3.8 4.6 8.4
2021 0.5 0.5 8.3 8.8
2022 0.3 0.3 8.3 8.6
2023 0.7 0.7 0.0 0.7
2024 3.3 3.3 12.9 16.2
2025 4.5 4.5 1.2 5.7
2026 1.3 1.3 0.0 1.3
2027 + 0.0 0.0 0.0 0.0
% of estimated net rental for the year 17.6 17.6 82.4 100.0
23 SEB ImmoPortfolio Target Return Fund – Dissolution Report as of 31 May 2017

Development of Fund Assets from 1 January 2017 to 31 May 2017
EUR EUR EUR
I. Fund assets at start of the reporting period on 1 January 2017 332,416,847.36
1. Distribution for the previous year – 19,395,285.00
of which distribution in accordance with annual report – 19,395,285.00
2. Ordinary net income 14,003,694.90
2 a. Amortisation of transaction costs – 9,595.52
of which for properties – 9,595.52
3. Realised gains
on equity interests in real estate companies 291,564.11
of which in foreign currency 0.00
on forward exchange transactions 51,679.55
of which in foreign currency 0.00
Miscellaneous 1,388,064.02
of which in foreign currency 0.00 1,731,307.68
4. Realised losses
on properties – 50,642,952.29
of which in foreign currency 0.00
on equity interests in real estate companies – 4,062,676.88
of which in foreign currency 0.00
on forward exchange transactions – 977,600.84
of which in foreign currency 0.00 – 55,683,230.01
5. Net change in value of unrealised gains/losses
on properties 38,125,833.48
of which in foreign currency 0.00
on equity interests in real estate companies – 29,849,517.79
of which in foreign currency – 27,583,143.38
on forward exchange transactions 2,654,199.84
of which in foreign currency 0.00
Changes in exchange rates – 1,904,720.67 9,025,794.86
II. Fund assets at end of the reporting period on 31 May 2017 282,089,534.27
SEB ImmoPortfolio Target Return Fund – Dissolution Report as of 31 May 2017 24

Disclosures on the Development of Fund Assets
The development of Fund assets shows which transactions entered into during the period under review are responsible for the new assets disclosed in the Fund’s statement of assets. It thus presents a breakdown of the difference between the assets at the beginning and the end of the reporting period.
The distribution for the previous year is the distribution amount reported in the annual report for the previous year (see the total distribution item under the Application of Fund Income in that document).
The ordinary net income can be seen from the statement of income and expenditure.
The amortisation of transaction costs item is used to report the amounts by which the transaction costs for properties were amortised using the straight-line method in the period under review. This includes both straight-line amortisation and write-offs on the disposal of assets in the period under review.
Realised gains and losses on properties, equity interests in real estate companies, forward exchange transactions and currency transactions contained in the miscellaneous item can be seen from the statement of income and expenditure.
The net change in value of unrealised gains / losses on properties and on equity interests in real estate companies is the result of remeasurement gains and losses and changes in carrying amounts during the period under review. Changes in market value due to subsequent appraisals by the Expert Committees are recognised, as are all other changes in the carrying amounts of the properties/equity interests. These can be the result of the recognition or reversal of provisions, subsequent purchase price adjustments or cost refunds, the acquisition of additional minor spaces, etc.
The net change in value of unrealised gains / losses on forward exchange transactions is the result of exchange rate changes during the reporting period.
This item also includes changes in value resulting from exchange rate fluctuations.
25 SEB ImmoPortfolio Target Return Fund – Dissolution Report as of 31 May 2017

Condensed Statement of Assets as of 31 May 2017
EUR EUR EUR EUR
% of Fund
assetsGermany
EUR
Other EU countries
EURUSA EUR
Asia EUR
I. Properties
(see Statement of Assets Part I, page 32ff.)
1. Commercial properties 40,100,000.00 14.22 0.00 40,100,000.00 0.00 0.00
of which in foreign currency 0.00
Total properties 40,100,000.00 14.22 0.00 40,100,000.00 0.00 0.00
Total in foreign currency 0.00
II. Equity interests in real estate companies
(see Statement of Assets Part I, page 34ff.)
1. Majority interests 192,502,167.81 68.24 0.00 162,902,131.99 29,600,035.82 0.00
of which in foreign currency 26,610,035.82
Total equity interests in real estate companies 192,502,167.81 68.24 0.00 162,902,131.99 29,600,035.82 0.00
Total in foreign currency 26,610,035.82
III. Liquidity portfolio
(see Statement of Assets Part II, page 37)
1. Bank deposits 84,232,495.24 75,745,655.01 8,486,840.23 0.00 0.00
of which in foreign currency 5,237,421.80
Total liquidity portfolio 84,232,495.24 29.86 75,745,655.01 8,486,840.23 0.00 0.00
Total in foreign currency 5,237,421.80
IV. Other assets
(see Statement of Assets Part III, page 38f.)
1. Receivables from real estate management 3,545,954.47 2,648,894.98 897,059.49 0.00 0.00
of which in foreign currency 2,560,554.23
2. Receivables from real estate companies 6,899,764.18 0.00 0.00 6,899,764.18 0.00
of which in foreign currency 6,899,764.18
3. Transaction costs
for properties 105,907.61 0.00 105,907.61 0.00 0.00
of which in foreign currency 0.00
4. Miscellaneous 16,950,569.20 1,815,190.85 13,805,273.54 1,329,820.47 284.34
of which in foreign currency 7,787,332.53
Total other assets 27,502,195.46 9.75 4,464,085.83 14,808,240.64 8,229,584.65 284.34
Total in foreign currency 17,247,650.94
Total 344,336,858.51 122.07 80,209,740.84 226,297,212.86 37,829,620.47 284.34
Total in foreign currency 49,095,108.56
SEB ImmoPortfolio Target Return Fund – Dissolution Report as of 31 May 2017 26

Disclosures on the Statement of Assets
Fund assets decreased by EUR 50.3 million to EUR 282.1 mil-lion in the reporting period from 1 January to 31 May 2017.
I. Properties
The four Polish properties were sold to real estate company IPTR IV GmbH during the reporting period in connection with the transfer of the Fund to the Custodian Bank (Depositary) and the tax restructuring that became necessary as a result (see the Restructuring sales table on page 20).
The commercial properties were included in the Fund assets at the market values calculated by the experts in each case. Property assets decreased by EUR 147.3 million to EUR 40.1 million in the reporting period and comprised three directly held properties as of the 31 May 2017 reporting date.
II. Equity interests in real estate companies
The property held by a real estate company in the USA and two equity interests in real estate companies in Finland were sold in the reporting period (see the table of sales and disposals on page 18).
The equity interests in real estate companies item now comprises four companies with six properties with an aggre-gate market value of EUR 160.3 million.
IPTR IV GmbH holds a total of four properties in Poland. VDL Tallahassee Associates, LLC and Ocala Road Tallahassee Associates, LLC, USA, each hold one property. 41 Spring Street, LLC, USA, no longer holds any properties.
After adjustment for the companies’ other assets and liabilities (EUR 39.1 million) and the shareholder loans (EUR 6.9 million), the value of the equity interests amounts to EUR 192.5 million.
EUR EUR EUR EUR
% of Fund
assetsGermany
EUR
Other EU countries
EURUSA EUR
Asia EUR
I. Properties
(see Statement of Assets Part I, page 32ff.)
1. Commercial properties 40,100,000.00 14.22 0.00 40,100,000.00 0.00 0.00
of which in foreign currency 0.00
Total properties 40,100,000.00 14.22 0.00 40,100,000.00 0.00 0.00
Total in foreign currency 0.00
II. Equity interests in real estate companies
(see Statement of Assets Part I, page 34ff.)
1. Majority interests 192,502,167.81 68.24 0.00 162,902,131.99 29,600,035.82 0.00
of which in foreign currency 26,610,035.82
Total equity interests in real estate companies 192,502,167.81 68.24 0.00 162,902,131.99 29,600,035.82 0.00
Total in foreign currency 26,610,035.82
III. Liquidity portfolio
(see Statement of Assets Part II, page 37)
1. Bank deposits 84,232,495.24 75,745,655.01 8,486,840.23 0.00 0.00
of which in foreign currency 5,237,421.80
Total liquidity portfolio 84,232,495.24 29.86 75,745,655.01 8,486,840.23 0.00 0.00
Total in foreign currency 5,237,421.80
IV. Other assets
(see Statement of Assets Part III, page 38f.)
1. Receivables from real estate management 3,545,954.47 2,648,894.98 897,059.49 0.00 0.00
of which in foreign currency 2,560,554.23
2. Receivables from real estate companies 6,899,764.18 0.00 0.00 6,899,764.18 0.00
of which in foreign currency 6,899,764.18
3. Transaction costs
for properties 105,907.61 0.00 105,907.61 0.00 0.00
of which in foreign currency 0.00
4. Miscellaneous 16,950,569.20 1,815,190.85 13,805,273.54 1,329,820.47 284.34
of which in foreign currency 7,787,332.53
Total other assets 27,502,195.46 9.75 4,464,085.83 14,808,240.64 8,229,584.65 284.34
Total in foreign currency 17,247,650.94
Total 344,336,858.51 122.07 80,209,740.84 226,297,212.86 37,829,620.47 284.34
Total in foreign currency 49,095,108.56
27 SEB ImmoPortfolio Target Return Fund – Dissolution Report as of 31 May 2017
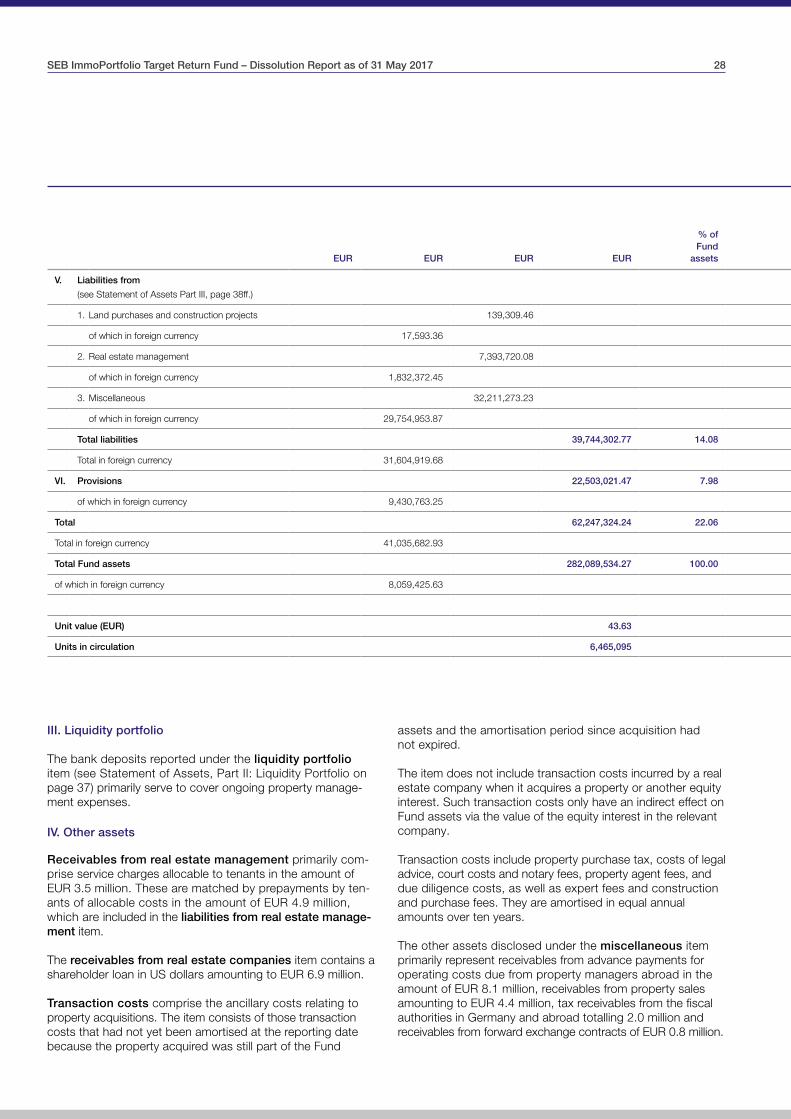
assets and the amortisation period since acquisition had not expired.
The item does not include transaction costs incurred by a real estate company when it acquires a property or another equity interest. Such transaction costs only have an indirect effect on Fund assets via the value of the equity interest in the relevant company.
Transaction costs include property purchase tax, costs of legal advice, court costs and notary fees, property agent fees, and due diligence costs, as well as expert fees and construction and purchase fees. They are amortised in equal annual amounts over ten years.
The other assets disclosed under the miscellaneous item primarily represent receivables from advance payments for operating costs due from property managers abroad in the amount of EUR 8.1 million, receivables from property sales amounting to EUR 4.4 million, tax receivables from the fiscal authorities in Germany and abroad totalling 2.0 million and receivables from forward exchange contracts of EUR 0.8 million.
III. Liquidity portfolio
The bank deposits reported under the liquidity portfolio item (see Statement of Assets, Part II: Liquidity Portfolio on page 37) primarily serve to cover ongoing property manage-ment expenses.
IV. Other assets
Receivables from real estate management primarily com-prise service charges allocable to tenants in the amount of EUR 3.5 million. These are matched by prepayments by ten-ants of allocable costs in the amount of EUR 4.9 million, which are included in the liabilities from real estate manage-ment item.
The receivables from real estate companies item contains a shareholder loan in US dollars amounting to EUR 6.9 million.
Transaction costs comprise the ancillary costs relating to property acquisitions. The item consists of those transaction costs that had not yet been amortised at the reporting date because the property acquired was still part of the Fund
EUR EUR EUR EUR
% of Fund
assetsGermany
EUR
Other EU countries
EURUSA EUR
Asia EUR
V. Liabilities from
(see Statement of Assets Part III, page 38ff.)
1. Land purchases and construction projects 139,309.46 43,421.06 95,888.40 0.00 0.00
of which in foreign currency 17,593.36
2. Real estate management 7,393,720.08 3,168,289.60 4,225,430.48 0.00 0.00
of which in foreign currency 1,832,372.45
3. Miscellaneous 32,211,273.23 717,451.89 31,359,884.61 133,936.73 0.00
of which in foreign currency 29,754,953.87
Total liabilities 39,744,302.77 14.08 3,929,162.55 35,681,203.49 133,936.73 0.00
Total in foreign currency 31,604,919.68
VI. Provisions 22,503,021.47 7.98 6,394,935.50 10,556,962.54 5,551,123.43 0.00
of which in foreign currency 9,430,763.25
Total 62,247,324.24 22.06 10,324,098.05 46,238,166.03 5,685,060.16 0.00
Total in foreign currency 41,035,682.93
Total Fund assets 282,089,534.27 100.00 69,885,642.79 180,059,046.83 32,144,560.31 284.34
of which in foreign currency 8,059,425.63
Unit value (EUR) 43.63
Units in circulation 6,465,095
SEB ImmoPortfolio Target Return Fund – Dissolution Report as of 31 May 2017 28

Fund assets held in foreign currency are hedged against changes in exchange rates using forward exchange transac-tions. An overview of open currency items is given in the Statement of Assets, Part III.
A total of 23 forward exchange transactions with an aggregate volume of USD 107.2 million, 11 forward exchange trans-actions with an aggregate volume of PLN 172.2 million, three forward exchange transactions with an aggregate volume of GBP 4.6 million, and two forward exchange transactions with an aggregate volume of SGD 2.6 million were entered into in the reporting period to hedge exchange rate risks.
V. Liabilities
Liabilities from land purchases and construction projects are the result of outstanding payment obligations relating to the acquisition of properties.
Liabilities from real estate management primarily consist of EUR 4.9 million for prepaid allocable costs, EUR 1.1 million for cash security bonds and EUR 1.2 million for advance rental payments.
The miscellaneous item primarily includes EUR 29.4 million in sales tax liabilities to domestic and foreign fiscal authorities, EUR 0.6 million in liabilities from property sales, EUR 0.5 million in liabilities from management and Custodian Bank fees and EUR 0.5 million in liabilities to creditors.
VI. Provisions
Provisions relate primarily to transaction costs (EUR 11.0 mil-lion), maintenance measures and construction services (EUR 6.8 million) and taxes (EUR 4.2 million). EUR 3.1 million of the latter figure relates to provisions for capital gains taxes on deferred foreign capital gains, while EUR 1.1 million relates to current taxes on income abroad.
Capital gains tax
Taxes on foreign capital gains are only incurred if a property is disposed of and actually generates a book profit. The timing and amount of such taxes is uncertain, as both market conditions and the basis for tax assessment can change constantly. Deferred tax liabilities were recognised in full (100%) and classified as provisions. The difference between the current market values and the carrying amounts for tax purposes of the properties was taken as the basis for assess-ment in calculating the size of the provision for deferred taxes on foreign capital gains, using country-specific tax rates; generally applicable sales costs were taken into consideration during this process. The provision was charged to Fund capital, as it is not classified as a distributable reserve.
The US real estate companies were also included in the calculation. These are treated as direct acquisitions for tax purposes, with the result that any gain on the disposal of shares in the companies is subject to capital gains tax. Capital gains tax was calculated in the same manner as the method described above.
EUR EUR EUR EUR
% of Fund
assetsGermany
EUR
Other EU countries
EURUSA EUR
Asia EUR
V. Liabilities from
(see Statement of Assets Part III, page 38ff.)
1. Land purchases and construction projects 139,309.46 43,421.06 95,888.40 0.00 0.00
of which in foreign currency 17,593.36
2. Real estate management 7,393,720.08 3,168,289.60 4,225,430.48 0.00 0.00
of which in foreign currency 1,832,372.45
3. Miscellaneous 32,211,273.23 717,451.89 31,359,884.61 133,936.73 0.00
of which in foreign currency 29,754,953.87
Total liabilities 39,744,302.77 14.08 3,929,162.55 35,681,203.49 133,936.73 0.00
Total in foreign currency 31,604,919.68
VI. Provisions 22,503,021.47 7.98 6,394,935.50 10,556,962.54 5,551,123.43 0.00
of which in foreign currency 9,430,763.25
Total 62,247,324.24 22.06 10,324,098.05 46,238,166.03 5,685,060.16 0.00
Total in foreign currency 41,035,682.93
Total Fund assets 282,089,534.27 100.00 69,885,642.79 180,059,046.83 32,144,560.31 284.34
of which in foreign currency 8,059,425.63
Unit value (EUR) 43.63
Units in circulation 6,465,095
29 SEB ImmoPortfolio Target Return Fund – Dissolution Report as of 31 May 2017

Capital with investmentTown/city with investment
Porto
Lisbon
Barcelona
Bordeaux
Labège/Toulouse
Paris
Berne
London
Amsterdam
Brussels
Berlin
Copenhagen
Oslo
Ljubljana
Rome
Prague
Marseille
Madrid
Europe: 7 properties
Aix-en-Provence
Regional Distribution of Fund Properties
SEB ImmoPortfolio Target Return Fund – Dissolution Report as of 31 May 2017 30

USA: 2 properties
Stockholm
Tallinn
Helsinki
Riga
San Francisco
Tallahassee
New York
Washington, D.C.
Warsaw
Lodz
Bratislava
Budapest
BelgradeSarajevo
Zagreb
Tirana
Athens
Vienna
Europe: 7 properties
31 SEB ImmoPortfolio Target Return Fund – Dissolution Report as of 31 May 2017

Type of property:C = Commercial propertyH = Heritable building rightR = Residential property for letting
Project/portfoliodevelopment measures:Po = Portfolio development measurePr = Project development measure
Features:D = District heatingA = Air conditioning / auxiliary coolingG = Goods liftP = Passenger lift
S = Sprinkler systemH = Hot water (central /decentralised)C = Central heating
Statement of Assets, Part I: Property Record as of 31 May 2017
Location of property Type of use (as a % of estimated net rental)
Area in m2 Property data Letting Property performance Results of expert valuation
Typ
e o
f p
rop
erty
Pro
ject
/ p
ort
folio
d
evel
op
men
t m
easu
res
Off
ice
Ret
ail /
cate
ring
Ind
ustr
ial (
war
eho
uses
, hal
ls)
Ho
tel
Res
iden
tial
Leis
ure
Car
par
k
Oth
er
Acq
uisi
tion
dat
e
Year
bui
lt /r
eno
vate
d
Site
are
a in
m2
Co
mm
erci
al
Res
iden
tial
Num
ber
of
par
king
sp
aces
Fea
ture
s
Pro
per
ty q
ualit
y
Loca
tion
cate
go
ry
Num
ber
of
tena
nts
Ave
rag
e re
mai
ning
le
ase
term
s in
yea
rs
Rem
aini
ng le
ase
term
s ex
pir
ing
in
the
nex
t 12
mo
nths
in %
Vaca
ncy
rate
in %
of
estim
ated
gro
ss r
enta
l
Mar
ket
valu
e / p
urch
ase
pri
ce
(at
the
rep
ort
ing
dat
e) in
EU
R
Tran
sact
ion
cost
s in
EU
R
of
whi
ch f
ees
and
ta
xes
in E
UR
of
whi
ch o
ther
co
sts
in E
UR
Tota
l tra
nsac
tion
cost
s in
%
of
pur
chas
e p
rice
Tran
sact
ion
cost
s am
ort
ised
in
the
rep
ort
ing
per
iod
in E
UR
Tran
sact
ion
cost
s st
ill t
o b
e am
ort
ised
in E
UR
Exp
ecte
d r
emai
ning
am
ort
isat
ion
per
iod
in y
ears
Deb
t ra
tio in
% o
f m
arke
t va
lue
/ p
urch
ase
pri
ce
Ren
tal i
nco
me
p.a
. in
EU
R *
Fo
reca
st r
enta
l inc
om
e
for
one
yea
r in
EU
R *
Pro
per
ty r
etur
n p
.a. i
n %
*
Gro
ss p
rofit
in E
UR
Rem
aini
ng u
sefu
l life
in
yea
rs
I. Directly held properties in eurozone countries
France
13090 Aix-en-Provence320 Avenue Archimède C – 100 0 0 0 0 0 0 0 06/2006 2006 16,408 5,638 0 300 A, P, H, C 2 C 9 5.8 14.9 26.7 10,100,000 – – – – – – – – 1) 1) 1) 732,927 59
13290 Aix-en-Provence290 Avenue Galilée C – 97 1 0 0 0 0 2 0 12/2007 2011 42,588 11,476 0 576 A, P, H, C 3 C 8 5.2 0.0 9.2 21,400,000 232,135 – 232,135 0.9 9,596 105,908 5.0 – 1) 1) 1) 1,582,375 64
31670 Labège / Toulouse2480 L’Occitane C – 100 0 0 0 0 0 0 0 06/2006 2006 11,103 6,156 0 260 A, P, H, C 2 C 10 5.4 0.0 33.9 8,600,000 – – – – – – – – 1) 1) 1) 738,720 59
Total properties 40,100,000 9,596 105,908
SEB ImmoPortfolio Target Return Fund – Dissolution Report as of 31 May 2017 32

Location category:A = Central business district (CBD)B = Other city centre locationsC = Local office centreD = Commercial estateE = City centre (1a)
F = Solo location (shopping centre)G = Established logistics locationH = Other locationsI = Urban district centre
Property quality:1 = Very high2 = High3 = Medium4 = Simple
Footnotes see page 35
* This column was not included in the audit for which the Auditors’ Report was issued.
Location of property Type of use (as a % of estimated net rental)
Area in m2 Property data Letting Property performance Results of expert valuation
Typ
e o
f p
rop
erty
Pro
ject
/ p
ort
folio
d
evel
op
men
t m
easu
res
Off
ice
Ret
ail /
cate
ring
Ind
ustr
ial (
war
eho
uses
, hal
ls)
Ho
tel
Res
iden
tial
Leis
ure
Car
par
k
Oth
er
Acq
uisi
tion
dat
e
Year
bui
lt /r
eno
vate
d
Site
are
a in
m2
Co
mm
erci
al
Res
iden
tial
Num
ber
of
par
king
sp
aces
Fea
ture
s
Pro
per
ty q
ualit
y
Loca
tion
cate
go
ry
Num
ber
of
tena
nts
Ave
rag
e re
mai
ning
le
ase
term
s in
yea
rs
Rem
aini
ng le
ase
term
s ex
pir
ing
in
the
nex
t 12
mo
nths
in %
Vaca
ncy
rate
in %
of
estim
ated
gro
ss r
enta
l
Mar
ket
valu
e / p
urch
ase
pri
ce
(at
the
rep
ort
ing
dat
e) in
EU
R
Tran
sact
ion
cost
s in
EU
R
of
whi
ch f
ees
and
ta
xes
in E
UR
of
whi
ch o
ther
co
sts
in E
UR
Tota
l tra
nsac
tion
cost
s in
%
of
pur
chas
e p
rice
Tran
sact
ion
cost
s am
ort
ised
in
the
rep
ort
ing
per
iod
in E
UR
Tran
sact
ion
cost
s st
ill t
o b
e am
ort
ised
in E
UR
Exp
ecte
d r
emai
ning
am
ort
isat
ion
per
iod
in y
ears
Deb
t ra
tio in
% o
f m
arke
t va
lue
/ p
urch
ase
pri
ce
Ren
tal i
nco
me
p.a
. in
EU
R *
Fo
reca
st r
enta
l inc
om
e
for
one
yea
r in
EU
R *
Pro
per
ty r
etur
n p
.a. i
n %
*
Gro
ss p
rofit
in E
UR
Rem
aini
ng u
sefu
l life
in
yea
rs
I. Directly held properties in eurozone countries
France
13090 Aix-en-Provence320 Avenue Archimède C – 100 0 0 0 0 0 0 0 06/2006 2006 16,408 5,638 0 300 A, P, H, C 2 C 9 5.8 14.9 26.7 10,100,000 – – – – – – – – 1) 1) 1) 732,927 59
13290 Aix-en-Provence290 Avenue Galilée C – 97 1 0 0 0 0 2 0 12/2007 2011 42,588 11,476 0 576 A, P, H, C 3 C 8 5.2 0.0 9.2 21,400,000 232,135 – 232,135 0.9 9,596 105,908 5.0 – 1) 1) 1) 1,582,375 64
31670 Labège / Toulouse2480 L’Occitane C – 100 0 0 0 0 0 0 0 06/2006 2006 11,103 6,156 0 260 A, P, H, C 2 C 10 5.4 0.0 33.9 8,600,000 – – – – – – – – 1) 1) 1) 738,720 59
Total properties 40,100,000 9,596 105,908
33 SEB ImmoPortfolio Target Return Fund – Dissolution Report as of 31 May 2017

Type of property:C = Commercial propertyH = Heritable building rightR = Residential property for letting
Project/portfoliodevelopment measures:Po = Portfolio development measurePr = Project development measure
Features:D = District heatingA = Air conditioning / auxiliary coolingG = Goods liftP = Passenger lift
S = Sprinkler systemH = Hot water (central /decentralised)C = Central heating
Location of property Type of use (as a % of estimated net rental)
Area in m2 Property data Letting Property performance Results of expert valuation
Company Typ
e o
f p
rop
erty
Pro
ject
/ p
ort
folio
d
evel
op
men
t m
easu
res
Off
ice
Ret
ail /
cate
ring
Ind
ustr
ial (
war
eho
uses
, hal
ls)
Ho
tel
Res
iden
tial
Leis
ure
Car
par
k
Oth
er
Acq
uisi
tion
dat
e
Year
bui
lt / r
eno
vate
d
Site
are
a in
m2
Co
mm
erci
al
Res
iden
tial
Num
ber
of
par
king
sp
aces
Fea
ture
s
Pro
per
ty q
ualit
y
Loca
tion
cate
go
ry
Num
ber
of
tena
nts
Ave
rag
e re
mai
ning
le
ase
term
s in
yea
rs
Rem
aini
ng le
ase
term
s ex
pir
ing
in
the
nex
t 12
mo
nths
in %
Vaca
ncy
rate
in %
of
estim
ated
gro
ss r
enta
l
Value of the equity interest (at the report- ing date) in EUR
Tran
sact
ion
cost
s in
EU
R
of
whi
ch f
ees
and
ta
xes
in E
UR
of
whi
ch o
ther
co
sts
in E
UR
Tota
l tra
nsac
tion
cost
s in
%
of
pur
chas
e p
rice
Tran
sact
ion
cost
s am
ort
ised
in
the
rep
ort
ing
per
iod
in E
UR
Tran
sact
ion
cost
s st
ill t
o b
e am
ort
ised
in E
UR
Exp
ecte
d r
emai
ning
am
ort
isat
ion
per
iod
in y
ears
Deb
t ra
tio in
% o
f m
arke
t va
lue
/ p
urch
ase
pri
ce
Ren
tal i
nco
me
p.a
. in
EU
R *
Fo
reca
st r
enta
l inc
om
e
for
one
yea
r in
EU
R *
Pro
per
ty r
etur
n p
.a. i
n %
*
Gro
ss p
rofit
in E
UR
Rem
aini
ng u
sefu
l life
in
yea
rs
Market value/ purchase price (at the report- ing date) in EUR
II. Properties held via real estate companies in countries with other currencies
USA
41 Spring Street, LLC 2), USA, 19046 Jenkintown, 165 Township Line Road –
Company’s capital: EUR 4,820,692.35
Shareholder loans: EUR 6,899,764.18
Equity interest held: 90.00000%
1. 07974 New Providence
41 Spring Street n.a. – n.a. n.a. n.a. n.a. n.a. n.a. n.a. n.a. 09/2006 n.a. n.a. n.a. n.a. n.a. n.a. n.a. n.a. n.a. n.a. n.a. n.a. – – – – – – – – – n.a. n.a. n.a. n.a. n.a.
VDL Tallahassee Associates, LLC, USA, 32601 Gainesville, 220 North Main Street 15,780,430
Company’s capital: EUR 22,574,760.55
Shareholder loans: EUR 0.00
Equity interest held: 90.00000%
1. 32304 Tallahassee
2700 West Pensacola Street R – 0 0 0 0 100 0 0 0 04/2006 1988/2004 76,149 0 26,507 563 A, H 4 H 576 – – 18.3 14,039,310 – – – – – – – – 2,844,918 2,962,473 20.3 3,269,369 34
Ocala Road Tallahassee Associates, LLC, USA, 32601 Gainesville, 220 North Main Street 13,819,606
Company’s capital: EUR 11,362,350.15
Shareholder loans: EUR 0.00
Equity interest held: 90.00000%
1. 32304 Tallahassee
235 Ocala Road South R – 0 0 0 0 100 0 0 0 04/2006 1996/2003 30,022 0 12,281 292 A, H 4 H 353 – – 8.2 11,793,020 – – – – – – – – 1,822,379 1,934,517 15.5 2,040,334 33
Poland
IPTR IV GmbH, Rotfeder-Ring 7, 60327 Frankfurt am Main 162,902,132
Company’s capital: EUR 162,725,000.00
Shareholder loans: EUR 0.00
Equity interest held: 100.00000%
1. 99-051 Lodz
Aleja Pilsudskiego 22 C – 88 0 1 0 0 0 8 3 07/2008 2006 10,078 6,433 0 130 D, A, P, S, H 2 A 10 3.2 22.8 1.3 13,000,000 – – – – – – – – 1) 1) 1) 926,467 59
2. 02-678 Warsaw
Szturmowa 2 C / H – 87 2 2 0 0 0 8 1 06/2005 1997 9,928 12,242 0 244 D, A, P, H 3 C 11 – – 75.7 21,300,000 – – – – – – – – 1) 1) 1) 1,869,156 51
3. 02-678 Warsaw
Szturmowa 2a C / H – 88 0 3 0 0 0 8 1 06/2005 2000 5,667 20,050 0 404 D, A, P, H 2 C 14 6.2 0.3 9.6 40,000,000 – – – – – – – – 1) 1) 1) 3,110,426 54
4. 02-672 Warsaw
Ulica Domaniewska 49 C / H – 80 3 3 0 0 0 14 0 03/2010 2009 10,838 32,496 0 869 D, A, G, P, H, C 2 C 14 2.7 8.2 52.4 60,200,000 – – – – – – – – 1) 1) 1) 5,544,891 62
Total equity interests in real estate companies 192,502,168
SEB ImmoPortfolio Target Return Fund – Dissolution Report as of 31 May 2017 34

Location category:A = Central business district (CBD)B = Other city centre locationsC = Local office centreD = Commercial estateE = City centre (1a)
F = Solo location (shopping centre)G = Established logistics locationH = Other locationsI = Urban district centre
Property quality:1 = Very high2 = High3 = Medium4 = Simple
Footnotes:1) The rental income p.a., the forecast rental income for one year
and the property return p.a. are no longer disclosed because a purchase agreement already exists for this property.
2) The company consists of a legal shell and does not hold any properties. It is being liquidated.
* This column was not included in the audit for which the Audi-tors’ Report was issued.
Location of property Type of use (as a % of estimated net rental)
Area in m2 Property data Letting Property performance Results of expert valuation
Company Typ
e o
f p
rop
erty
Pro
ject
/ p
ort
folio
d
evel
op
men
t m
easu
res
Off
ice
Ret
ail /
cate
ring
Ind
ustr
ial (
war
eho
uses
, hal
ls)
Ho
tel
Res
iden
tial
Leis
ure
Car
par
k
Oth
er
Acq
uisi
tion
dat
e
Year
bui
lt / r
eno
vate
d
Site
are
a in
m2
Co
mm
erci
al
Res
iden
tial
Num
ber
of
par
king
sp
aces
Fea
ture
s
Pro
per
ty q
ualit
y
Loca
tion
cate
go
ry
Num
ber
of
tena
nts
Ave
rag
e re
mai
ning
le
ase
term
s in
yea
rs
Rem
aini
ng le
ase
term
s ex
pir
ing
in
the
nex
t 12
mo
nths
in %
Vaca
ncy
rate
in %
of
estim
ated
gro
ss r
enta
l
Value of the equity interest (at the report- ing date) in EUR
Tran
sact
ion
cost
s in
EU
R
of
whi
ch f
ees
and
ta
xes
in E
UR
of
whi
ch o
ther
co
sts
in E
UR
Tota
l tra
nsac
tion
cost
s in
%
of
pur
chas
e p
rice
Tran
sact
ion
cost
s am
ort
ised
in
the
rep
ort
ing
per
iod
in E
UR
Tran
sact
ion
cost
s st
ill t
o b
e am
ort
ised
in E
UR
Exp
ecte
d r
emai
ning
am
ort
isat
ion
per
iod
in y
ears
Deb
t ra
tio in
% o
f m
arke
t va
lue
/ p
urch
ase
pri
ce
Ren
tal i
nco
me
p.a
. in
EU
R *
Fo
reca
st r
enta
l inc
om
e
for
one
yea
r in
EU
R *
Pro
per
ty r
etur
n p
.a. i
n %
*
Gro
ss p
rofit
in E
UR
Rem
aini
ng u
sefu
l life
in
yea
rs
Market value/ purchase price (at the report- ing date) in EUR
II. Properties held via real estate companies in countries with other currencies
USA
41 Spring Street, LLC 2), USA, 19046 Jenkintown, 165 Township Line Road –
Company’s capital: EUR 4,820,692.35
Shareholder loans: EUR 6,899,764.18
Equity interest held: 90.00000%
1. 07974 New Providence
41 Spring Street n.a. – n.a. n.a. n.a. n.a. n.a. n.a. n.a. n.a. 09/2006 n.a. n.a. n.a. n.a. n.a. n.a. n.a. n.a. n.a. n.a. n.a. n.a. – – – – – – – – – n.a. n.a. n.a. n.a. n.a.
VDL Tallahassee Associates, LLC, USA, 32601 Gainesville, 220 North Main Street 15,780,430
Company’s capital: EUR 22,574,760.55
Shareholder loans: EUR 0.00
Equity interest held: 90.00000%
1. 32304 Tallahassee
2700 West Pensacola Street R – 0 0 0 0 100 0 0 0 04/2006 1988/2004 76,149 0 26,507 563 A, H 4 H 576 – – 18.3 14,039,310 – – – – – – – – 2,844,918 2,962,473 20.3 3,269,369 34
Ocala Road Tallahassee Associates, LLC, USA, 32601 Gainesville, 220 North Main Street 13,819,606
Company’s capital: EUR 11,362,350.15
Shareholder loans: EUR 0.00
Equity interest held: 90.00000%
1. 32304 Tallahassee
235 Ocala Road South R – 0 0 0 0 100 0 0 0 04/2006 1996/2003 30,022 0 12,281 292 A, H 4 H 353 – – 8.2 11,793,020 – – – – – – – – 1,822,379 1,934,517 15.5 2,040,334 33
Poland
IPTR IV GmbH, Rotfeder-Ring 7, 60327 Frankfurt am Main 162,902,132
Company’s capital: EUR 162,725,000.00
Shareholder loans: EUR 0.00
Equity interest held: 100.00000%
1. 99-051 Lodz
Aleja Pilsudskiego 22 C – 88 0 1 0 0 0 8 3 07/2008 2006 10,078 6,433 0 130 D, A, P, S, H 2 A 10 3.2 22.8 1.3 13,000,000 – – – – – – – – 1) 1) 1) 926,467 59
2. 02-678 Warsaw
Szturmowa 2 C / H – 87 2 2 0 0 0 8 1 06/2005 1997 9,928 12,242 0 244 D, A, P, H 3 C 11 – – 75.7 21,300,000 – – – – – – – – 1) 1) 1) 1,869,156 51
3. 02-678 Warsaw
Szturmowa 2a C / H – 88 0 3 0 0 0 8 1 06/2005 2000 5,667 20,050 0 404 D, A, P, H 2 C 14 6.2 0.3 9.6 40,000,000 – – – – – – – – 1) 1) 1) 3,110,426 54
4. 02-672 Warsaw
Ulica Domaniewska 49 C / H – 80 3 3 0 0 0 14 0 03/2010 2009 10,838 32,496 0 869 D, A, G, P, H, C 2 C 14 2.7 8.2 52.4 60,200,000 – – – – – – – – 1) 1) 1) 5,544,891 62
Total equity interests in real estate companies 192,502,168
35 SEB ImmoPortfolio Target Return Fund – Dissolution Report as of 31 May 2017

Disclosures on the Property Record
The property record on the preceding pages contains information on properties requiring further explanation.
In the case of properties held via investment companies, rents and market values are indicated in proportion to the respective equity interest held. The individual values cannot be extrapolated to the Fund’s assets as a whole.
Please read the following information in order to interpret the data:
The year built/renovated relates to the last year in which major conversions, extensions, or modernisations took place.
The area corresponds to the leased area at the reporting date.
The average remaining lease terms in years do not include any indefinite leases.
The market value is determined by the price that would be obtained within a short time in the normal course of business in accordance with the legal situation and actual characteristics, the other attributes and the location of the property, disregarding
unusual or personal factors. The valuation procedure is based on the income approach (Ertragswertverfahren), in which a property’s value is calculated on the basis of the sustainable rental income that it will generate. The market value is deter-mined at least once a year by a committee of external, pub-licly certified and sworn experts.
The purchase price and transaction costs are only reported for properties that were purchased/added to the Fund after the changeover to the new Investmentgesetz (InvG – German Investment Act) on 15 January 2010.
The long-term gross profit corresponds to the rental valuations determined by an external expert that are used as a basis to calculate the income obtainable. This net basic rent that can be generated from a property in the long term if it is fully let represents the long-term income achievable from a property – regardless of short-term fluctuations in demand. Premiums or discounts that reflect the property’s current market situation (such as vacancies or leases signed at above-market condi-tions) are deducted from or added to the market value sepa-rately. For this reason, the rental valuation based on the expert opinion may differ from the actual estimated position. Rather, it provides a current estimate of a property’s long-term earnings power.
Property quality – standard of appointments according to normal production costs 2000
Type
of use
Part of building Skeleton construction / timbering / frame
Solid construction Windows Roofs Sanitary installations Interior wall finishing of wetrooms
Floor coverings Interior doors Heating Electrical fittings Installations and other fittings
Office simple Simple walls, wooden / sheet metal / fibre cement siding
Brickwork with plaster or com-bined bedding and pointing and paint
Wood, single glazing Corrugated fibre cement / sheet metal roofing, bitumen / plastic film seal
Small number of basic toilet facilities, surface-mounted fittings
Oil-based paintwork Wooden floorboards, needle felt, linoleum, PVC, wetrooms: PVC
Panel framed doors, painted leaves and frames
Individual stoves, electric storage heating, boilers for hot water
One lighting outlet and 1 – 2 surface-mounted sockets per room
n.a.
medium Lightweight concrete walls with thermal insulation, con-crete sandwich elements, 12 – 25 cm infill
Thermal insulation plaster / com-posite system, exposed brickwork with combined bedding and point-ing and paint, medium thermal insulation standard
Wood, plastic, insulation glazing
Concrete roof tiles, medium thermal insulation standard
Adequate number of toilet facilities, flush-mounted fittings
Part-tiled walls (1.50 m) Carpet, PVC, tiles, linoleum, wetrooms: tiles
Plastic / wooden leaves, steel frames
Central heating with radiators (gravity hot water system)
1 – 2 lighting outlets and 2 – 3 sockets per room, IT facili-ties, surface-mounted fittings
n.a.
high High-density concrete plates, faced brickwork, clinker, up to 30 cm infill
Faced brickwork, metal siding, curtain facade, high thermal standard
Aluminium, shutters, solar shading system, thermal protection glazing
Clay roof tiles, slate / metal covering, high thermal insulation standard
Good quality toilet fittings Floor-to-ceiling tiles Large tiles, parquet, cast stone, wetrooms: large tiles, special coated tiles
Leaves with high-quality wood veneer, glass doors, wooden frames
Central heating / pumped heating system with flat radiators, central water heating
Several lighting outlets and sockets per room, sill trunking with IT cabling
n.a.
very high Glass siding, over 30 cm infill Natural stone Floor-to-ceiling glazing, large sliding panels, electric shutters, soundproof glazing
Large number of skylights, elabo-rate roof extensions and roof heightening, glass roof cut-outs
Generous toilet facilities with sanitary facilities, high standard
Natural stone, elaborately laid
Natural stone, elaborately laid, wetrooms: natural stone
Solid construction, intruder protection, wheelchair-enabled, automatic doors
Underfloor heating, air conditioning and other HVAC systems
Elaborate fittings, security facilities
n.a.
Retail simple Simple walls, wooden / sheet metal / fibre cement siding
Brickwork with plaster or combined bedding and pointing and paint
Wood, steel, single glazing Corrugated fibre cement / sheet metal roofing, bitumen / plastic film seal
Small number of basic toilet facilities, surface-mounted fittings
Oil-based paintwork Wooden floorboards, linoleum, PVC, wetrooms: PVC
n.a. Individual stoves, electric storage heating, boilers for hot water
Basic surface-mounted fittings n.a.
medium Lightweight concrete walls with thermal insulation, con-crete sandwich elements, 12 – 25 cm infill
Thermal insulation plaster / com-posite system, exposed brickwork with combined bedding and point-ing and paint, medium thermal insulation standard
Wood, plastic, insulation glazing
Concrete roof tiles, medium thermal insulation standard
Adequate number of toilet facilities, flush-mounted fittings
Part-tiled walls (1.50 m) Coated screed, mastic asphalt, wetrooms: tiles
n.a. Warm air heating units, warm air heating units connected to cen-tral boiler system, district heating
Adequate flush-mounted fittings n.a.
high High-density concrete plates, faced brickwork, clinker, up to 30 cm infill
Faced brickwork, metal siding, curtain facade, high thermal standard
Aluminium, shutters, solar shading system, thermal protection glazing
Clay roof tiles, slate / metal cover-ing, prefabricated glass concrete elements, web concrete planks, high thermal insulation standard
Generous toilet facilities with good-quality fittings
Floor-to-ceiling tiles Tiles, wood block flooring, cast stone, wetrooms: large tiles
n.a. Central heating / pumped heating system with flat radiators, central water heating
Elaborate fittings, security facilities
n.a.
Logistics simple Simple walls, wooden / sheet metal / fibre cement siding
Brickwork with plaster or combined bedding and pointing and paint
Wood, single glazing Corrugated fibre cement / sheet metal roofing, bitumen / plastic film seal
Basic toilet facilities, small number of showers, surface-mounted fittings
Oil-based paintwork Rough concrete, paint n.a. Warm air heating with a direct-fired system
n.a. Surface-mounted power and water outlets, cook-ing facilities, sink
medium Lightweight concrete walls with thermal insulation, con-crete sandwich elements, 12 – 25 cm infill
Thermal insulation plaster / com-posite system, exposed brickwork with combined bedding and point-ing and paint, medium thermal insulation standard
Wood, plastic, insulation glazing
Concrete roof tiles, medium thermal insulation standard
Adequate toilet facilities, several showers, some surface-mounted fittings
Part-tiled walls (1.50 m) Screed, mastic asphalt, block paving without bedding
n.a. Central heating n.a. Surface-mounted power and water outlets, kitch-enette
SEB ImmoPortfolio Target Return Fund – Dissolution Report as of 31 May 2017 36
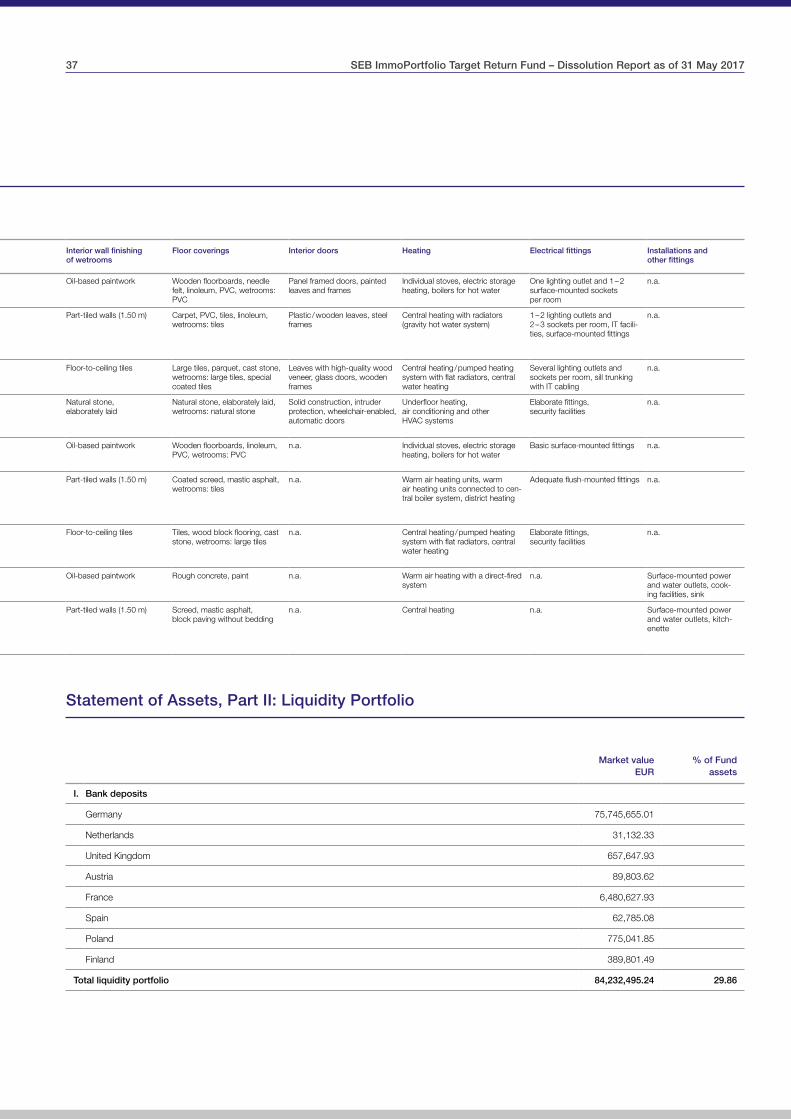
Statement of Assets, Part II: Liquidity Portfolio
Market value EUR
% of Fund assets
I. Bank deposits
Germany 75,745,655.01
Netherlands 31,132.33
United Kingdom 657,647.93
Austria 89,803.62
France 6,480,627.93
Spain 62,785.08
Poland 775,041.85
Finland 389,801.49
Total liquidity portfolio 84,232,495.24 29.86
Property quality – standard of appointments according to normal production costs 2000
Type
of use
Part of building Skeleton construction / timbering / frame
Solid construction Windows Roofs Sanitary installations Interior wall finishing of wetrooms
Floor coverings Interior doors Heating Electrical fittings Installations and other fittings
Office simple Simple walls, wooden / sheet metal / fibre cement siding
Brickwork with plaster or com-bined bedding and pointing and paint
Wood, single glazing Corrugated fibre cement / sheet metal roofing, bitumen / plastic film seal
Small number of basic toilet facilities, surface-mounted fittings
Oil-based paintwork Wooden floorboards, needle felt, linoleum, PVC, wetrooms: PVC
Panel framed doors, painted leaves and frames
Individual stoves, electric storage heating, boilers for hot water
One lighting outlet and 1 – 2 surface-mounted sockets per room
n.a.
medium Lightweight concrete walls with thermal insulation, con-crete sandwich elements, 12 – 25 cm infill
Thermal insulation plaster / com-posite system, exposed brickwork with combined bedding and point-ing and paint, medium thermal insulation standard
Wood, plastic, insulation glazing
Concrete roof tiles, medium thermal insulation standard
Adequate number of toilet facilities, flush-mounted fittings
Part-tiled walls (1.50 m) Carpet, PVC, tiles, linoleum, wetrooms: tiles
Plastic / wooden leaves, steel frames
Central heating with radiators (gravity hot water system)
1 – 2 lighting outlets and 2 – 3 sockets per room, IT facili-ties, surface-mounted fittings
n.a.
high High-density concrete plates, faced brickwork, clinker, up to 30 cm infill
Faced brickwork, metal siding, curtain facade, high thermal standard
Aluminium, shutters, solar shading system, thermal protection glazing
Clay roof tiles, slate / metal covering, high thermal insulation standard
Good quality toilet fittings Floor-to-ceiling tiles Large tiles, parquet, cast stone, wetrooms: large tiles, special coated tiles
Leaves with high-quality wood veneer, glass doors, wooden frames
Central heating / pumped heating system with flat radiators, central water heating
Several lighting outlets and sockets per room, sill trunking with IT cabling
n.a.
very high Glass siding, over 30 cm infill Natural stone Floor-to-ceiling glazing, large sliding panels, electric shutters, soundproof glazing
Large number of skylights, elabo-rate roof extensions and roof heightening, glass roof cut-outs
Generous toilet facilities with sanitary facilities, high standard
Natural stone, elaborately laid
Natural stone, elaborately laid, wetrooms: natural stone
Solid construction, intruder protection, wheelchair-enabled, automatic doors
Underfloor heating, air conditioning and other HVAC systems
Elaborate fittings, security facilities
n.a.
Retail simple Simple walls, wooden / sheet metal / fibre cement siding
Brickwork with plaster or combined bedding and pointing and paint
Wood, steel, single glazing Corrugated fibre cement / sheet metal roofing, bitumen / plastic film seal
Small number of basic toilet facilities, surface-mounted fittings
Oil-based paintwork Wooden floorboards, linoleum, PVC, wetrooms: PVC
n.a. Individual stoves, electric storage heating, boilers for hot water
Basic surface-mounted fittings n.a.
medium Lightweight concrete walls with thermal insulation, con-crete sandwich elements, 12 – 25 cm infill
Thermal insulation plaster / com-posite system, exposed brickwork with combined bedding and point-ing and paint, medium thermal insulation standard
Wood, plastic, insulation glazing
Concrete roof tiles, medium thermal insulation standard
Adequate number of toilet facilities, flush-mounted fittings
Part-tiled walls (1.50 m) Coated screed, mastic asphalt, wetrooms: tiles
n.a. Warm air heating units, warm air heating units connected to cen-tral boiler system, district heating
Adequate flush-mounted fittings n.a.
high High-density concrete plates, faced brickwork, clinker, up to 30 cm infill
Faced brickwork, metal siding, curtain facade, high thermal standard
Aluminium, shutters, solar shading system, thermal protection glazing
Clay roof tiles, slate / metal cover-ing, prefabricated glass concrete elements, web concrete planks, high thermal insulation standard
Generous toilet facilities with good-quality fittings
Floor-to-ceiling tiles Tiles, wood block flooring, cast stone, wetrooms: large tiles
n.a. Central heating / pumped heating system with flat radiators, central water heating
Elaborate fittings, security facilities
n.a.
Logistics simple Simple walls, wooden / sheet metal / fibre cement siding
Brickwork with plaster or combined bedding and pointing and paint
Wood, single glazing Corrugated fibre cement / sheet metal roofing, bitumen / plastic film seal
Basic toilet facilities, small number of showers, surface-mounted fittings
Oil-based paintwork Rough concrete, paint n.a. Warm air heating with a direct-fired system
n.a. Surface-mounted power and water outlets, cook-ing facilities, sink
medium Lightweight concrete walls with thermal insulation, con-crete sandwich elements, 12 – 25 cm infill
Thermal insulation plaster / com-posite system, exposed brickwork with combined bedding and point-ing and paint, medium thermal insulation standard
Wood, plastic, insulation glazing
Concrete roof tiles, medium thermal insulation standard
Adequate toilet facilities, several showers, some surface-mounted fittings
Part-tiled walls (1.50 m) Screed, mastic asphalt, block paving without bedding
n.a. Central heating n.a. Surface-mounted power and water outlets, kitch-enette
37 SEB ImmoPortfolio Target Return Fund – Dissolution Report as of 31 May 2017

Statement of Assets, Part III: Other Assets, Liabilities and Provisions, Additional Disclosures
EUR EUR EUR EUR % of Fund
assets
I. Other assets
1. Receivables from real estate management 3,545,954.47
of which in foreign currency 2,560,554.23
of which rent receivable 51,352.51
of which advance payments for operating costs 3,494,601.96
2. Receivables from real estate companies 6,899,764.18
of which in foreign currency 6,899,764.18
3. Transaction costs
for properties 105,907.61
of which in foreign currency 0.00
4. Miscellaneous 16,950,569.20
of which in foreign currency 7,787,332.53
of which from hedging transactions 835,180.21
Currency Market value sale EUR
Market value rept. date
EUR
Preliminary result EUR
GBP 2,465,041.03 – 2,436,976.74 28,064.29
USD 34,286,153.50 – 33,501,083.61 785,069.89
PLN – 29,046,325.15 29,068,371.18 22,046.03
Total other assets 27,502,195.46 9.75
Total in foreign currency 17,247,650.94
II. Liabilities from
1. Land purchases and construction projects 139,309.46
of which in foreign currency 17,593.36
2. Real estate management 7,393,720.08
of which in foreign currency 1,832,372.45
3. Miscellaneous 32,211,273.23
of which in foreign currency 29,754,953.87
of which from hedging transactions 2,215.80
Currency Market value sale EUR
Market value rept. date
EUR
Preliminary result EUR
SGD 821,856.37 – 824,072.17 2,215.80
Total liabilities 39,744,302.77 14.08
Total in foreign currency 31,604,919.68
SEB ImmoPortfolio Target Return Fund – Dissolution Report as of 31 May 2017 38

* Assets denominated in foreign currencies are translated into euros at the exchange rate for the currency calculated using Reuters AG’s midday fixing at 1.30 p.m.
EUR EUR EUR EUR % of Fund
assets
III. Provisions 22,503,021.47 7.98
of which in foreign currency 9,430,763.25
Total Fund assets 282,089,534.27 100.00
of which in foreign currency 8,059,425.63
Units (EUR) 43.63
Units in circulation 6,465,095
Exchange rates * as of 31 May 2017
Sterling (GBP) 0.87375 = EUR 1
US dollar (USD) 1.12185 = EUR 1
Polish zloty (PLN) 4.17280 = EUR 1
Singapore dollar (SGD) 1.55095 = EUR 1
39 SEB ImmoPortfolio Target Return Fund – Dissolution Report as of 31 May 2017

Disclosures on the Measurement Policies
Forward exchange transactions were measured at their forward rate on 31 May 2017.
Bank deposits and time deposits are valued at their nominal amount plus interest accrued.
Liabilities are recognised at their repayment amounts.
Provisions are recognised at their settlement amounts.
Disclosures on financial instruments
Purchases Market value EUR
from 1 Jan. 2017 to 31 May 2017
Sales Market value EUR
from 1 Jan. 2017 to 31 May 2017
Purchases and sales of financial instruments that were entered into during the reporting period; no transactions were entered into with affiliated companies
GBP 2,800,601.35 2,436,976.69
USD 55,602,027.15 41,966,321.13
PLN 35,053,458.38 3,449,016.03
SGD 830,973.22 824,072.18
Total 94,287,060.10 48,676,386.03
SEB ImmoPortfolio Target Return Fund – Dissolution Report as of 31 May 2017 40

Statement of Income and Expenditure
for the period from 1 January 2017 to 31 May 2017 EUR EUR EUR
I. Income
1. Income from properties 6,136,089.85
of which in foreign currency 4,026,402.16
2. Other income 19,536,142.17
of which in foreign currency 17,192,289.40
Total income 25,672,232.02
II. Expenditure
1. Management costs
1.1 Operating costs 5,839,751.40
of which in foreign currency 4,581,376.59
1.2 Maintenance costs 2,019,246.84
of which in foreign currency 1,640,000.13
1.3 Property management costs 109,576.03
of which in foreign currency 96,541.61
1.4 Other costs 631,355.07
of which in foreign currency 466,035.09
2. Foreign taxes 518,061.01
of which in foreign currency 51,924.73
3. Interest on loans 26,449.87
of which in foreign currency 0.00
4. Remuneration of Fund management 1,133,650.79
5. Custodian Bank fee 24,231.60
6. Audit and publication costs 148,989.17
7. Other expenditure 1,217,225.34
of which remuneration of experts (in accordance with section 12 of the BVB) 33,793.58
Total expenditure 11,668,537.12
41 SEB ImmoPortfolio Target Return Fund – Dissolution Report as of 31 May 2017

for the period from 1 January 2017 to 31 May 2017 EUR EUR EUR
III. Ordinary net income 14,003,694.90
IV. Disposals
1. Realised gains
plus unrealised changes in value from previous years
1.1 on equity interests in real estate companies in the period under review – 1,095,325.39
Changes in value from previous years 1,386,889.50 291,564.11
of which in foreign currency 0.00
1.2 on forward exchange transactions in the period under review 14,141.87
Changes in value from previous years 37,537.68 51,679.55
of which in foreign currency 0.00
1.3 Miscellaneous 1,388,064.02
of which in foreign currency 0.00
2. Realised losses
plus unrealised changes in value from previous years
2.1 on properties in the period under review – 12,319,998.14
Changes in value from previous years – 38,322,954.15 – 50,642,952.29
of which in foreign currency 0.00
2.2 on equity interests in real estate companies in the period under review – 1,378,353.40
Changes in value from previous years – 2,684,323.48 – 4,062,676.88
of which in foreign currency 0.00
2.3 on forward exchange transactions in the period under review 881,172.21
Changes in value from previous years – 1,858,773.05 – 977,600.84
of which in foreign currency 0.00
Net loss on disposals – 53,951,922.33
V. Net loss for the financial year – 39,948,227.43
Total expense ratio 1.02%
Transaction-based remuneration 0.05%
Transaction costs 1,009,401.54
SEB ImmoPortfolio Target Return Fund – Dissolution Report as of 31 May 2017 42

Disclosures on the Statement of Income and Expenditure
Income
Income from properties comprises the Fund’s rental income. Of the total figure, EUR 2.1 million is attributable to properties in the eurozone and EUR 4.0 million to properties outside this area.
Other income mainly comprises income from the reversal of writedowns on loans and advances to equity interests in the amount of EUR 15.0 million that were recognised in previous years. In addition, the item comprises income from the rever-sal of provisions in the amount of EUR 2.8 million.
Expenditure
Management costs consist of operating costs (EUR 5.8 mil-lion), maintenance costs (EUR 2.0 million) and property management costs that cannot be passed on to the tenants (EUR 0.1 million). Other costs amount to EUR 0.6 million and primarily contain valuation allowances on rent receivables of EUR 0.4 million.
The Fund incurred expenses and recognised provisions amounting to EUR 0.5 million for the payment of foreign taxes. This tax expense relates primarily to France (EUR 0.5 million).
Provisions for taxes on deferred capital gains are taken directly from Fund assets.
Interest on loans resulted from debt finance taken out to fund property acquisitions.
The remuneration of Fund management item amounts to EUR 1.1 million, or 0.9% p.a. of average Fund assets. In accordance with the Fund Rules, remuneration of up to 1.5% p.a. of average Fund assets may be charged. The invest-ment company pays regular – usually annual – brokerage fees (trailer fees) to brokers such as credit institutions from the management fee paid to it.
In accordance with section 11(4) of the BVB, the Custodian Bank receives a Custodian Bank fee of 0.005% of Fund assets at the end of each calendar quarter.
Other expenditure in accordance with section 11(5) of the BVB mainly comprises consultancy costs, external accounting costs, bank fees and financing costs.
The members of the Expert Committees receive remuneration for the statutory annual valuations.
Ordinary net income on the reporting date amounted to EUR 14.0 million.
Realised gains on equity interests in real estate companies represent the difference between the proceeds of sale and cost. Unrealised changes in value from previous years on equity interests in real estate companies are a result of measurement gains and losses and changes in carrying amounts up to the end of the previous year. Deducting the unrealised gains from the previous year results in the realised gains for the period under review.
Realised gains on forward exchange transactions represent the difference between the lower purchase prices and the prices at sale or maturity. Unrealised changes in the value of the forward exchange transactions consist of changes up to the end of the previous year in the market values of the financial instruments that matured during the financial year. Deducting the unrealised gains from the previous year results in the real-ised gains for the period under review.
The realised gains / losses reported in the miscellaneous item are the result of currency transactions.
Realised losses on properties and equity interests in real estate companies represent the difference between the proceeds of sale or transfer values and cost. Unrealised changes in value from previous years on properties /equity interests in real estate companies are a result of measurement gains and losses and changes in carrying amounts up to the end of the previous year. Deducting the unrealised losses from the previous year results in the realised losses for the period under review.
Realised losses on forward exchange transactions repre-sent the difference between the higher purchase prices and the prices at sale or maturity. Unrealised changes in the value of the forward exchange transactions consist of changes up to the end of the previous year in the market values of the financial instruments that matured during the financial year. Deducting the unrealised losses from the previous year results in the realised losses for the period under review.
The net loss on disposals (EUR 54.0 million) represents the aggregate realised gains and losses.
43 SEB ImmoPortfolio Target Return Fund – Dissolution Report as of 31 May 2017

The net loss for the financial year amounted to EUR 39.9 mil-lion as of the reporting date.
The total expense ratio (TER) shows the impact of costs on Fund assets. It takes into account management and Custodian Bank fees, the costs of the Expert Committees and other costs in accordance with section 11 of the BVB, with the exception of transaction costs. The TER expresses the total amount of these costs as a percentage of average Fund assets within a financial year, thus providing results that comply with international cost transparency standards. The method of calculation used is in line with the BVI’s recommended method.
The TER for SEB ImmoPortfolio Target Return Fund calculated as of 31 December 2016 is 1.02%.
The transaction-based remuneration comprises the sales fee of EUR 159,243.98. This represents 0.05% of the average Fund assets.
Transaction costs comprise the incidental costs of sale of properties and equity interests in real estate companies that are recorded as disposals, measured at the time of the transfer of the risks and rewards of ownership in the reporting period. The transaction costs amount to EUR 1,009,401.54 and are attributable in full to other costs.
SEB ImmoPortfolio Target Return Fund – Dissolution Report as of 31 May 2017 44

Application of Fund Income as of 31 May 2017
Payouts after termination of the management mandate on 5 June 2014
Payout in financial year
Payoutdate
Payout per unit
EUR
of which return of capital
distributionEUR
2014 1 October 2014 18.00 13.81
2015 15 April 2015 37.00 37.00
2016 12 August 2016 7.10 0.00
2017 3 April 2017 3.00 3.00
Disclosures on the Application of Fund Income
In accordance with section 44(4) of the InvG in the version applicable until 27 December 2007, this Dissolution Report as of 31 May 2017 must correspond to an annual report. However, this report does not relate to the end of a financial year, which means that a distribution within the meaning of section 12 of the Special Fund Rules does not apply.
Net loss for the reporting period
The net loss for the reporting period from 1 January 2017 to 31 May 2017 in the amount of EUR 39.9 million can be seen from the statement of income and expenditure (see page 41ff.).
Total in EUR
Per unit in EUR
I. Calculation of the distribution
1. Net loss for the reporting period – 39,948,227.43 – 6.18
45 SEB ImmoPortfolio Target Return Fund – Dissolution Report as of 31 May 2017

Auditors’ Report
To Savills Fund Management GmbH, Frankfurt am Main
Savills Fund Management GmbH, Frankfurt am Main, appointed us to audit the Dissolution Report of SEB ImmoPortfolio Target Return Fund for the short financial year from 1 January 2017 to 31 May 2017 in accordance with section 44(5) of the Investmentgesetz (InvG – German Investment Act).
Responsibility of the management
The preparation of the Dissolution Report in compliance with the provisions of the InvG is the responsibility of the manage-ment of the investment company.
Responsibility of the auditors
Our responsibility is to express an opinion on the Dissolution Report based on our audit.
We conducted our audit in accordance with section 44(5) of the InvG and the German generally accepted standards for the audit of financial statements promulgated by the Institut der Wirtschaftsprüfer (IDW). Those standards require that we plan and perform the audit such that misstatements materially affecting the Dissolution Report are detected with reasonable assurance. Knowledge of the management of the Fund and evaluations of possible misstatements are taken into account in the determination of audit procedures. The effectiveness of the internal accounting control system and the evidence sup-porting the disclosures in the Dissolution Report are examined primarily on a test basis within the framework of the audit. The audit includes assessing the accounting principles used for the Dissolution Report and the significant estimates made by the investment company’s management. We believe that our audit provides a reasonable basis for our opinion.
Auditors’ opinion
In our opinion, based on the findings of our audit, the Dissolution Report for the short financial year from 1 January 2017 to 31 May 2017 complies with the statutory regulations.
Additional information
Without qualifying our opinion, we draw attention to the fact that the Company gave notice of termination of the manage-ment mandate of the Fund effective 31 May 2017 in accord-ance with section 38(1) of the InvG in conjunction with section 16(1) of the General Fund Rules. When the termination took effect, the right to manage the Fund was transferred to CACEIS Bank S.A., Germany Branch, Munich, which is liquidating the Fund and distributing the proceeds to the unitholders. We refer in this context to the information given by the Company in the section of the Dissolution Report entitled “Information on the Continued Liquidation of SEB ImmoPortfolio Target Return Fund”.
Frankfurt am Main, 11 August 2017
PricewaterhouseCoopers GmbHWirtschaftsprüfungsgesellschaft
Eva Handrick ppa. Fatih Agirman Auditor Auditor
SEB ImmoPortfolio Target Return Fund – Dissolution Report as of 31 May 2017 46

Fund Bodies
Investment Company Savills Fund Management GmbH Rotfeder-Ring 7, 60327 Frankfurt am Main, Germany Phone: +49 (0)69 2 72 99 – 1000 Fax: +49 (0)69 2 72 99 – 090 Subscribed and paid-up capital EUR 5.113 million Liable capital EUR 8.920 million (as of 31 May 2017) Frankfurt am Main Commercial Register, HRB 29859 Established: 30 September 1988
Management
Carolina von Groddeck Hermann Löschinger
Supervisory Board
Luke Justin O’Connor Chief Executive Officer, Savills Investment Management LLP, Stockholm, Sweden – Chairman – Dr. Anton Heinrich Wiegers Winterbach, Germany – Deputy Chairman – Dr. Stefan Frank Zeranski Professor of Financial Services and Financial Management, Bergisch Gladbach, Germany Auditors
PricewaterhouseCoopers GmbH Wirtschaftsprüfungsgesellschaft, Frankfurt am Main
Shareholders
TOMASO Verwaltung GmbH (6%) Savills Fund Management Holding AG (94%)
Depositary (Custodian Bank)
CACEIS Bank S.A., Germany Branch Lilienthalallee 36 80939 Munich Expert Committee A
Ulrich Renner, Dipl.-Kfm. Publicly certified and sworn expert for the valuation of developed and undeveloped properties, Wuppertal
Prof. Michael Sohni, Dr.-Ing. Publicly certified and sworn expert for the valuation of developed and undeveloped properties, Darmstadt
Klaus Thelen, Dipl.-Ing. Publicly certified and sworn expert for the valuation of developed and undeveloped properties, Gladbeck
Expert Committee B
Klaus Peter Keunecke, Dr.-Ing. Publicly certified and sworn expert for the valuation of rents and developed and undeveloped properties, Berlin
Günter Schäffler, Dr.-Ing. Publicly certified and sworn expert for the planning and control of construction costs, the valuation of developed and undeveloped properties, and rents for properties and buildings, Stuttgart
Bernd Fischer-Werth, Dipl.-Ing., Dipl.-Wirtsch.-Ing. Publicly certified and sworn expert for the valuation of developed and undeveloped properties, Wiesbaden
47 SEB ImmoPortfolio Target Return Fund – Dissolution Report as of 31 May 2017

savillsim.com
Investment Company:Savills Fund Management GmbHRotfeder-Ring 760327 Frankfurt am Main, GermanyPhone: +49 (0)69 2 72 99 - 1000Fax: +49 (0)69 2 72 99 - 090
Sales: Savills Fund Management GmbHRotfeder-Ring 760327 Frankfurt am Main, Germany