Embed Size (px)
Citation preview

Seattle/King County: Homeless System Performance Assessment and Recommendations with
Particular Emphasis on Single Adults
Commissioned by United Way of King County, the City of Seattle, and King County
Prepared by Focus Strategies
September 2016

Seattle/King County:Homeless System Performance Assessment and Recommendations with Particular Emphasis on Single Adults
Commissioned by United Way of King County, the City ofSeattle, and King County
Seattle/King County Client GroupMark Putnam, All HomeKira Zylstra, All HomeSola Plumacher, City of Seattle Josh Hall, City of Seattle Hedda McLendon, King County Mark Ellerbrook, King CountyWayne Wilson, United Way of King CountyVince Matulionis, United Way of King County
Prepared by Focus StrategiesMegan Kurteff Schatz, PrincipalTracy Bennett, Director of Analytics and EvaluationKate Bristol, Director of ConsultingGenevieve Heidenreich, Senior AnalystKatharine Gale, Principal Associate

Visit Focus Strategies’ website
focusstrategies.net to find this and other reports, research, news, and more information about who we are and what we do. Focus Strategies offers services to help communities tackle homelessness at project and systems levels. Our services include data-driven planning and performance measurement, coordinated entry design, point in time counts, system and program evaluations, and supportive housing system development.

2 Seattle/King County Homeless Performance Assessment and Recommendations
Acknowledgements
Acknowledgements We would like to thank Mark Putnam and Kira Zylstra from All Home, Sola Plumacher, Dusty Olson and Josh Hall from the City of Seattle, Mark Ellerbrook, and Hedda McLendon from King County, as well as Vince Matulionis and Wayne Wilson from United Way of King County for their time, dedication, and collaboration on this project.
Thanks also to all the individuals who participated in the stakeholder interviews, for their willingness to share their knowledge and expertise. A detailed list of those who provided input is included in Appendix 3 of this report.
We would also like to acknowledge Tiffany Von Armin Photography for supplying photographs of Seattle and King County for this report.

Seattle/King County Homeless Performance Assessment and Recommendations 3
Table of Contents
Table of Contents Acknowledgements ...........................................................................................................................2
Executive Summary ...........................................................................................................................5
I. Background ....................................................................................................................................9
II. Methodology ...............................................................................................................................10 A. Data Sources and Analytics ................................................................................................ 10 B. Projects Included in SWAP ................................................................................................. 11
III. Context ......................................................................................................................................12 A. National Policy Context: Shift to Homeless Crisis Response ............................................ 12 B. Promising Models in Serving Homeless Single Adults ...................................................... 13 C. Local Context – “Current State” in Seattle/King County .................................................. 15
IV. Analysis & Key Findings ..............................................................................................................23 A. System Performance .......................................................................................................... 23
B. Proposed Performance Targets for Seattle and King County..........................................29 C. Single Adult Analysis .......................................................................................................... 33 D. Modeling Results ................................................................................................................ 41 E. Assessment of Leadership and Governance Structure Effectiveness .............................. 47
V. Recommendations .................................................................................................................... .49 A. General Recommendations ............................................................................................... 49 B. Leadership, Funding, and Governance Recommendations ............................................. 51 C. System Performance Improvement Recommendations .................................................. 54 D. Investments Over Five Years ............................................................................................ 62

4 Seattle/King County Homeless Performance Assessment and Recommendations
Table of Contents
Appendix 1: Glossary .............................................................................................................. A-1
Appendix 2: Document List .................................................................................................... A-6
Appendix 3: Interview Summary & Interviewees................................................................... A-8 A. Summary of Key Stakeholder Interviews ................................................................ A-8 B. Interviewees for Single Adult Strategic Planning .................................................. A-13
Appendix 4: Promising Models ............................................................................................. A-14
Appendix 5: Projects Included in the Seattle/King County Analysis ...................................... A-19
Appendix 6: Homeless Crisis Resolution System Component ............................................... A-27
Appendix 7: High, Moderate, & Low Performance Graphs ................................................... A-32 A. Bed and Unit Utilization Rate by Program Type by Performance Level .............. A-32 B. Entries from Homelessness ................................................................................... A-34 C. Lengths of Stay ...................................................................................................... A-37 D. Exits to Permanent Housing .................................................................................. A-38 E. Cost Per Exit to Permanent Housing...................................................................... A-41
Appendix 8: Disparity Analysis ............................................................................................. A-44 A. Age Group Disparities ............................................................................................ A-44 B. Gender Disparities ................................................................................................. .A-45 C. Racial Disparities ..................................................................................................... A-46 D. Ethnic Disparities .................................................................................................... A-47 E. Disability-Related Disparities ................................................................................. A-48
Appendix 9: Typology Data Quality ..........................................................................................A-51
Appendix 10: Number of Days Stayed By Quartile ..................................................................A-52
Appendix 11: Project Count by Project Type and Performance Level ....................................A-53
Appendix 12: Utilizing a “Moving On” Approach ....................................................................A-54
Appendix 13: Modeling Assumptions to Decrease Unsheltered Homelessness ................... A-59
Appendix 14: Programmatic Changes For 2015 and 2016 Incorporated in the Model...........A-62

Seattle/King County Homeless Performance Assessment and Recommendations 5
Executive Summary
Executive Summary INTRODUCTION United Way of King County alongside its partners, the City of Seattle, King County, and All Home (the “client group”), have engaged Focus Strategies to assess the performance of the existing homeless system and the community’s efforts to reduce homelessness, with a particular focus on the single adult homeless population. Between July 2015 and May 2016, we collected and analyzed data to assess the performance of individual programs, program types, and the system as a whole. We also conducted telephone interviews with key stakeholders to better understand the strengths and weaknesses of the current system, and to assess what kinds of changes the community should consider to support its goals of making homelessness a rare, brief, and one-time occurrence. The results of our analysis will be used by the client group to inform next steps in its homeless system planning and implementation work.
SUMMARY OF FINDINGS AND RECOMMENDATIONS
Act with Urgency and Boldness Our overarching recommendation to Seattle/King County is to act urgently and with boldness to implement impactful solutions. Homelessness is on the rise in the community and leaders have implemented a number of initiatives that are helping to turn the curve towards an improved response to the problem. However, our analysis reveals that the pace of change is slow and resources continue to be invested in interventions that have limited results. We believe homelessness in King County can be dramatically reduced using existing resources and even given the significant unaffordability of the current housing market. Urgent and bold action are required.
Create a Funder-Driven, Person-Centered System There are an estimated 4,000 people living outdoors in Seattle and King County at any given time – some of them families with children. Even more people are cycling in and out of emergency shelter. The United Way, All Home, the City of Seattle, and King County collaboratively commissioned this work with the intention of determining a path forward to dramatically reduce, and potentially functionally end homelessness. To achieve that goal, the work of creating a system out of an array of homeless programs must be completed. All initiatives and programs have to be understood and measured in relation to what they contribute to the overall goal of reducing the number of homeless households.
It is critical that Seattle/King County’s homeless crisis response system shift to become more funder- driven and person-centered: all decision-making needs to be based on what will yield the greatest results for people who are unsheltered or cycling in and out of emergency shelter. Policies, programmatic initiatives, and investment strategies have to be shaped by this person-centered approach. In a system centered on homeless people, all interventions are designed to target and prioritize those who are unsheltered or living in shelters. Funders invest only in interventions that can be measurably demonstrated to move homeless people into housing and providers are held accountable for results. The effectiveness of the system is measured by the number of homeless people who are housed and do not subsequently return to homelessness.
Establish an Action Oriented and Data Informed Governance and Funding Structure Local leadership has appointed All Home to serve as the community’s Continuum of Care, and to oversee coordination and planning for homelessness-related activities more broadly. Yet, All Home does not have the authority to make and implement decisions. Its governance is designed to solicit input, identify
6 Seattle/King County Homeless Performance Assessment and Recommendations
Executive Summary
problems, and discuss solutions. It can convene but cannot make critical decisions, so leading significant changes may not be possible as currently structured. Typically, successful, large-scale shifts are made when public agencies identify the changes needed and hold all stakeholders accountable for the use of public dollars. Although the All Home governance structure has recently been re-organized, Focus Strategies recommends that local leadership consider further changes. Most importantly, we advise re-structuring the All Home Executive Committee to include only funders and designate it as the entity empowered to make and implement decisions related to design and implementation of the community’s homeless crisis response system. The Executive Committee needs to oversee the community’s investment strategy for all targeted homelessness funding, and ensure that investment decisions are data-driven. Much faster progress can be made to reduce homelessness if all funders can agree on a shared set of objectives and performance targets and hold all providers accountable to meeting them.
Improve Performance throughout the System Our analysis found a wide range of performance levels amongst programs and program types. There are some highly effective projects and system components, while some are performing poorly. Focus Strategies has recommended a set of performance targets for all program types that have been accepted by the client group. We have also recommended some strategic shifts in how the system operates to yield improved results and reductions to the size of the homeless population:
1. Use Outreach and Coordinated Entry to Target and Prioritize Unsheltered People and Frequent Shelter Users.
Our analysis found a significant number of households entering homeless programs in King County who are not literally homeless – meaning they are not living outdoors, in vehicles, or in an emergency shelter. Many are housed or doubled-up, but assessed as being at-risk of homelessness. This means system capacity to serve people who are unsheltered is diverted away from solving homelessness. At the same time, there are approximately 5,000 people cycling repeatedly in and out of emergency shelter – long-term shelter stayers who may be “stuck” in temporary crisis beds and not effectively being connected to housing. The community is investing in a Coordinated Entry system – Coordinated Entry for All (CEA) that is establishing policies to ensure literally homeless people are prioritized for assistance. Yet, to ensure this system is as effective as possible, we further recommend that people be prioritized not just on whether they are currently homeless, but how long they have been homeless. Finding housing solutions for those who have been homeless the longest and who are repeatedly accessing shelter will significantly improve the movement of people from homelessness into housing.
2. Expand Shelter Diversion/More Effective Targeting of Prevention Resources.
A significant number of people currently enter homeless programs in the community who are doubled-up or otherwise housed. As part of CEA, some households receive shelter diversion – an approach designed to prevent entry into shelter by helping people who are still housed to stay in place or to move directly to other housing using problem solving, mediation, and small amounts of financial assistance. To maximize the use of homeless system resources for people who are unsheltered, we recommend that shelter diversion must be attempted for all households seeking shelter.
3. Improve Effectiveness of Shelter in Exiting People to Permanent Housing.
Our analysis found that the emergency shelter system in Seattle/King County does not perform to maximum effectiveness. Significant reductions in homelessness could be achieved if households had

Seattle/King County Homeless Performance Assessment and Recommendations 7
Executive Summary
shorter lengths of stay in shelters and exited into permanent housing at a higher rate. One key strategy for accomplishing this will involve bringing rapid re-housing to scale and connecting it to shelter, so that those households in shelter beds have a rapid pathway to exit. Shelters also need to be required to meet performance targets and re-orient their work to focus on helping people exit to permanent housing as quickly as possible. Long-term shelter stayers must be prioritized for housing assistance, based on how long they have been homeless.
4. Shift Funding from Low Performing to High Performing Interventions and Programs.
Seattle/King County currently invests significant resources in interventions that are not achieving strong results on the key measures, which assess progress in rapidly moving homeless households into housing in a cost effective manner. To make faster progress, we recommend investing in intervention types that are high performing, while disinvesting in those that are less effective. This includes bringing rapid re-housing to scale and cutting back investment in lower performing transitional housing, permanent supportive housing, and other permanent housing (OPH). This does not mean that funds are lost to the system – they are re-invested in strategies that are the most effective at reducing the numbers of homeless people.
5. Make More Strategic Use of Permanent Affordable Housing to Provide Pathways out of Homelessness.
The rental market in Seattle/King is incredibly challenging, with low vacancy rates and extremely high rents. Continuing efforts to expand the supply of deeply affordable housing are critical for the community to meet its goals for continued economic and racial diversity, and to be a welcoming place for lower income families and individuals. However, expanded affordable housing is not a precondition for reducing homelessness. The community has to commit to making an impact on the problem with the existing housing inventory or there may never be a significant reduction. Waiting for enough housing to be produced means continuing to tolerate the current situation in which thousands of people, including some families with children, are living on the streets and in tents. Focus Strategies recommends a number of strategies to help improve access to the existing supply of affordable housing, including ensuring that affordable housing for homeless people is targeted towards assisting those who are unsheltered or are long-term shelter stayers, and lowering or removing barriers to entry. We also recommend a large-scale “moving on” effort that identifies current tenants in permanent supportive housing, who are stabilized and no longer need intensive services. This program would help them transition to regular affordable housing. This approach has been successfully implemented and utilized in several communities and has proven to be a highly effective way to free up capacity in the existing permanent supportive housing inventory for chronically homeless, unsheltered individuals.
Our analysis concludes that if all of the above approaches were implemented, it would have a huge impact on the size of the homeless population. All unsheltered families and single adults could be sheltered by the end of 2017 and significant system resources could be shifted to rapid re-housing. Available funding is sufficient to rapidly re-house all family households currently using emergency shelter in a single year, and to house all long-term shelter stayers over a four year period using a combination of rapid re-housing and permanent supportive housing.

8 Seattle/King County Homeless Performance Assessment and Recommendations
Executive Summary
CONCLUSION The elected and political leadership of Seattle and King County have recognized the urgency of homelessness and affirmed a need for a new approach to the problem. Our analysis is intended to provide a path to an action-oriented, data-driven, and person-centered solution. The work shows that if the community is willing to take bold action, tremendous results can be achieved. Homelessness can truly become rare, brief, and one-time.

Seattle/King County Homeless Performance Assessment and Recommendations 9
I. Background
I. Background
The United Way of King County (UWKC) and its partners the City of Seattle, King County and All Home have engaged Focus Strategies to assess the performance of the community’s efforts to reduce homelessness. Community leaders and funders have made a strong local commitment to addressing this urgent problem. However, as the number of homeless people has increased in recent years, leadership has recognized a need to determine what strategies and interventions are needed to turn the curve from a situation in which homelessness is increasing to a system that dramatically reduces it. While All Home has recently issued a new Strategic Plan that aims to make homelessness rare, brief and one-time, shifting from vision to action requires a data-driven approach that assesses current system performance and re-directs resources to the most effective strategies and interventions.
The client group, UWKC and partners, have asked Focus Strategies to support their efforts by conducting an in-depth assessment of the performance of all programs in Seattle/King County’s current system, with a particular focus on single adults. Focus Strategies was also asked to use these results to support recommendations for system improvement. The goal of our technical assistance is to assist community leaders and funders to set new objectives and implement strategies that will be more effective at reducing homelessness. This includes recommendations on how to create a more effective governing structure for homeless activities that can advance the identified objectives.
Focus Strategies has completed our analysis of the performance of the existing homeless programs in Seattle/King County and the system as a whole. The results of our analysis are presented in this report, alongside our recommendations for a system re-design and changes to the governance structure for homeless-related initiatives. While our scope of work encompasses the entire system, much of the work was focused specifically on homeless single adults, who comprise the vast majority of the homeless population in Seattle/King County. The analysis and recommendations delve deeper into the needs of this specific population and recommended system changes to yield improved outcomes for single individuals experiencing homelessness.

10 Seattle/King County Homeless Performance Assessment and Recommendations
II. Methodology
II. Methodology A. DATA SOURCES AND ANALYTICS
This report is based on work conducted by Focus Strategies between July 2015 and May 2016. To compile this report, we conducted several different types of analysis: Document Review: Focus Strategies reviewed existing planning and governance documents, as well as reports, including All Home’s 2015-2016 Strategic Plan: Making Homelessness in King County Rare, Brief and One-time; All Home’s Comprehensive Plan to Prevent and End Youth and Young Adult Homelessness in King County by 2020; the 2015 Point in Time Count; the 2016 Point in Time Count; Seattle and King County State of Emergency documents; City of Seattle Human Services Department Homelessness Investment Analysis (March 2015), Single Adult Shelter Task Force Findings and Recommendations Highlights, and a range of other studies and reports. For a complete list of documents reviewed see Appendix 2.
Stakeholder Interviews: To support our work on the single adult homeless system, we conducted a series of interviews with key stakeholders identified by All Home’s Single Adult Advisory Group. Interviewees spanned a range of different organizations and intervention types, including outreach programs, shelters, transitional housing, and permanent supportive housing that serve a range of subpopulations (veterans, chronically homeless people, and individuals with mental illness). These interviews were designed to learn more about currently existing programs for single adults, and identify opportunities and challenges for system improvement.
Interviewees included representatives from the Veteran’s Administration, the City of Bellevue, the City of Seattle Office of Housing, the King County Behavioral Health and Recovery Division (BHRD), Supportive Services for Veteran Families (SSVF), as well as funders and representatives from key housing and service providers. A complete list of individuals who participated in the interview process is provided in Appendix 3.
Performance Analysis – System Wide Analytics and Projection (SWAP): To understand the performance of the Seattle/King County homeless system and the programs within the system, Focus Strategies worked alongside the City of Seattle, All Home, and the King County Department of Community and Human Services (DCHS) to collect the data needed to populate our System Wide Analytics and Projection (SWAP) suite of tools. Focus Strategies designed SWAP for the National Alliance to End Homelessness (NAEH) to help communities plan and prioritize changes to bring about the greatest possible reduction in homelessness. To conduct this analysis, data was collected from three main sources: (1) Seattle/King County’s inventory of emergency shelter, transitional housing, rapid re-housing, and permanent supportive housing units as documented in the 2015 Housing Inventory Count (HIC) prepared by All Home and DCHS; (2) client data exported from the community’s Homeless Management Information System (HMIS) for the two year period from January 2013 to December 2014; and (3) program budget data collected by DCHS directly from homeless program providers. King County staff entered this data into the SWAP Base Year Calculator (BYC) tool, one for each project type, then transmitted the BYCs to Focus Strategies. Following a series of data clarification and reconciliation steps, Focus Strategies used the tools to generate an analysis of the performance of each project and the system as a whole across a range of measures. The results of this analysis are summarized in Section IV. Subpopulations, including Veterans and Youth and Young Adults (YYA): Subpopulations, are included in the analyses throughout this report. However, program performance results for those subpopulations were not generated because the dataset did not include many Youth and Young Adult (YYA) programs or the Support Services for Veteran Families (SSVF) program, which is a significant portion of the capacity specifically available to Veterans. Therefore, there was not enough information about subpopulations to produce

Seattle/King County Homeless Performance Assessment and Recommendations 11
II. Methodology
population-specific performance results and recommendations. However, those two populations are included in the overall analysis and therefore considered in what it will take to dramatically reduce homelessness in Seattle/King County. Single Adult System Data Analysis: In addition to the SWAP performance analysis, Focus Strategies also conducted an analysis of data on single adults who use emergency shelters in Seattle and King County. To conduct this work, we received an extract of HMIS data containing all services and demographic data for single adults who stayed in an emergency shelter at least once during a three year period (calendar years 2013, 2014, and 2015). We used this information to develop an analysis of the characteristics of homeless single adults in relation to the frequency and length of their shelter stays. Results of this analysis are summarized in Section IV. Modeling the Impact of System Shifts: Focus Strategies used the modeling features of our SWAP tools to project the potential impact of a range of changes in system design and investment strategies, including improvement in program performance and addition of new system components. Results of the modeling are presented in Section IV and were used to develop our recommendations in Section V. Review of Promising Models from Other Communities: We conducted research to identify innovative programs that are meeting the housing needs of homeless single adults. Results of this research is summarized in Appendix 4. Discussions with Client Group: Over the course of the project, Focus Strategies held regular discussions with representatives of the client group to gather information, discuss our preliminary findings, and explore the implications of results.
B. PROJECTS INCLUDED IN SWAP (SYSTEM PERFORMANCE ANALYSIS AND MODELING WORK) The performance analysis presented in this report incorporates data on programs in Seattle/King County that provide housing, shelter, and services to homeless people. The programs analyzed fall into five categories: (1) emergency shelters; (2) transitional housing; (3) rapid re-housing; (4) permanent supportive housing; and (5) other permanent housing, or OPH. Descriptions of each program type is provided in Section IIIC. The universe of programs analyzed is limited to those programs that are listed in the community’s Housing Inventory Count (HIC), participate in the Homeless Management Information System (HMIS), and for which there were two years of data available. A number of programs were excluded from the analysis, as they did not contain two years of HMIS data. Additionally, SWAP directly analyzes the intervention types included in the HIC. Other types of homeless programs – such as outreach, homelessness prevention, or other types of safety net assistance or mainstream system services provided to people experiencing homelessness – are included only to the extent that they are specifically geared to reducing homelessness. The impact of these programs is modeled in the aggregate, in terms of anticipated reductions to the number of newly homeless people. A list of programs included in the SWAP analysis is provided in Appendix 5.

12 Seattle/King County Homeless Performance Assessment and Recommendations
III. Context
III. Context A. NATIONAL POLICY CONTEXT: SHIFT TO HOMELESS CRISIS RESPONSE In recent years, federal homelessness policy has shifted increasingly towards a data-driven approach that seeks to hold communities accountable for measurable reductions in the numbers of people experiencing homelessness. The United States Interagency Council on Homelessness (USICH) has set specific goals and timelines for ending homelessness that include:
• Prevent and end homelessness among Veterans in 2015; • Finish the job of ending chronic homelessness in 2017; • Prevent and end homelessness for families with children and youth in 2020; and • Set a path to ending all types of homelessness.
The USICH’s Federal Strategic Plan to End Homelessness, Opening Doors, articulates a definition of what it means to end homelessness:
“An end to homelessness means that every community will have a systematic response in place that ensures homelessness is prevented whenever possible, or if it can’t be prevented, it is a rare, brief, and non-recurring experience. Specifically, every community will have the capacity to:
• Quickly identify and engage people at risk of and experiencing homelessness.
• Intervene to prevent the loss of housing and divert people from entering the homelessness services system.
• When homelessness does occur, provide immediate access to shelter and crisis services, without barriers to entry, while permanent stable housing and appropriate supports are being secured, and quickly connect people to housing assistance and services—tailored to their unique needs and strengths—to help them achieve and maintain stable housing.”
Opening Doors, as well as many policy directives from the Department of Housing and Urban Development (HUD), all point to communities developing a Homeless Crisis Response or Housing Crisis Resolution System. Opening Doors calls for communities to “transform homeless services into crisis response systems”1 that prevent homelessness when possible and quickly respond to homelessness when it occurs. HUD’s newly established system performance measures call for each community to monitor the performance of their entire homeless crisis response system (and thus the programs that comprise it) on factors including:
• Number of new entries to homelessness; • Rates at which people leave the system to permanent housing; • Time that people spend being homeless; and • Frequency of subsequent returns to homelessness.
Homeless crisis response systems respond to the urgency of homelessness – the focus is on people who are living outside or who have been cycling in and out of shelter, helping them secure housing as rapidly as possible and prevent returns to homelessness. While the system helps link people to services and resources they need to address other issues, its primary focus is on ensuring everyone has a safe and stable place to live. To be effective, the homeless crisis response system must provide an appropriate response to everyone who needs it, especially those with the greatest needs. It must not screen out from assistance anyone experiencing literal homelessness – that is, living outside, on the streets, or in shelter. This also means limited
1 Opening Doors: Federal Strategic Plan to Prevent and End Homelessness, 2010, page 49

Seattle/King County Homeless Performance Assessment and Recommendations 13
III. Context
system resources must not be used to serve people who would be more appropriately served elsewhere. In other words, the system must target and prioritize. Underlying the idea of a homeless crisis response system is the philosophy of Housing First. A Housing First orientation means that the system is organized around helping people secure a place to live, without preconditions, which they can use as the foundation to address other needs. While gaining income, self-sufficiency, and improved health are all desirable goals, they are not prerequisites to people being housed. In a system organized around Housing First principles, shelter and housing programs have minimal entry barriers and do not require clients to participate in services or gain skills/income as a condition of receiving housing assistance. Services in the system are focused on doing what it takes to rapidly secure housing for each client, with linkages and connections to mainstream systems in order to address other service needs (e.g. employment, health, behavioral health). Housing First “is guided by the belief that people need basic necessities like food and a place to live before attending to anything less critical, such as getting a job, budgeting properly, or attending to substance use issues. Housing First is supported by evidence that most people experiencing homelessness do not return to homelessness after they have been housed, even if they have not addressed other life challenges.”2 In a homeless crisis response system, all of the parts of the system work together toward a common goal. Every actor in the system, regardless of the role they play, views each person who is literally homeless as someone with a housing need that can be addressed within 30 days. There are no people who are not “housing ready.” When a person becomes homeless, a system is in place to determine where they can live and provide the appropriate amount of assistance to help them re-enter housing. Data systems are used to continuously collect and analyze information regarding who remains housed and who does not. The system does not make assumptions about what services people need in order to sustain housing, but uses data to understand who is returning to homelessness and why. If patterns emerge, these are analyzed and adjustments are made accordingly. An overview of the key elements of a homeless crisis response system is provided in Appendix 6, along with references and links to evidence about the effectiveness of different intervention types.
B. PROMISING MODELS IN SERVING HOMELESS SINGLE ADULTS As part of this scope of work, Focus Strategies conducted a review of new and emerging models for addressing homelessness amongst single adults. We sought to identify innovative strategies that utilize less-traditional methods or resources to serve single adults. These programs or practices were selected based on their potential as models to fill gaps in the continuum of services for single adults in Seattle/King County. They may be considered emerging and promising, but are not necessarily proven practices. For additional details, please see Appendix 4. 1. Targeted outreach with priority for interim or permanent housing beds: These models are designed to reach groups of unsheltered single adults and move them quickly and directly into permanent housing or dedicated shelter/interim housing tied to permanent housing placement. This model has been adopted in several cities, including San Francisco, San Diego, and Berkeley, and relies heavily on targeted outreach to individuals who are homeless, chronically homeless, and/or considered most vulnerable on the streets. Berkeley’s AC Impact program utilizes partnerships with local law enforcement, emergency services, and nearby jurisdictions to identify and target unsheltered individuals who are most visible and use the greatest amount of costly emergency services. San Francisco’s Navigation Center, which can accommodate 70 people at a time, is
2 NAEH Fact Sheet: Housing First. Updated April 2016. http://www.endhomelessness.org/page/-/files/2016-04-20%20Housing%20First%20Fact%20Sheet.pdf

14 Seattle/King County Homeless Performance Assessment and Recommendations
III. Context
designed to serve people who will not access traditional shelter, and accommodates many needs that most single adult shelters do not. A similar program in San Diego called Connections Housing and the PATH Depot combines 89 units of permanent supportive housing, 134 interim housing beds (30-90 days), a health center, and a multi-service center in one building in the heart of the city’s downtown. In both San Francisco and San Diego, shelter beds are reserved for direct referral from outreach. All three programs have successfully exited between 69% and 73% of participants to permanent housing. 2. Targeting Long-term Shelter Stayers: Like Seattle and King County, many community across the country have found that a relatively small number of long-term shelter stayers (LTSS) – individuals who stay extended durations of time and/or frequency in emergency shelter – account for a large portion of available shelter capacity. Several programs across the country – including Pine Street Inn in Boston, Massachusetts; Oxford Street Shelter in Portland, Main; and the Top 51 pilot program in Hennepin County, Minnesota – have worked to target long-term shelter stayers by reallocating resources to permanent housing dedicated to LTSS. Common amongst these programs was the use of data to understand exactly who to target, as well as how to focus housing and other resources for LTSS. Programs utilized a variety of housing settings, including dedicated units, scattered site/private market housing, single room occupancy, transitional housing, and nursing homes to house participants. Hennepin County reported seeing great reductions in shelter stays longer than 180 days, as well as dramatic decreases in hospitalization and interactions with law enforcement for many of the individuals served. By focusing efforts and dedicating resources to housing LTSS, Oxford Street Shelter was able to house 66 people and close one of its two overflow emergency shelters within its first year. 3. Targeted Rapid Rehousing: Tying shelter more closely to rapid rehousing resources is a particularly useful strategy in reducing lengths of stay at shelters for single adults who do not qualify for, or for whom no Permanent Supportive Housing (PSH) is available. While many communities have added rapid rehousing to their system mix, few are focusing specifically on ensuring rapid re-housing (RRH) is regularly offered to single adults. To ensure rapid rehousing resources are offered to shelter guests, North Virginia Rapid Rehousing has trained its staff around rapid rehousing principles and practices. Staff develop a targeted, personal housing plan for every shelter resident immediately upon program entry. In Phoenix, Arizona, a pilot program uses HMIS data to outreach to persons identified as most in-need of housing; participants are then connected with case management and rental assistance to ensure a long-term stay in housing. Since their start dates, the programs have seen dramatic decreases in average lengths of stay, as well as high rates of housing retention. 4. Single Adult Shelter Diversion: Diversion is a practice of targeted prevention aimed specifically at those individuals and families who are seeking shelter. However, we found that only a few communities have embraced full-scale diversion for both single adults and families. Diversion programs, including those in Cleveland, Ohio and Montgomery County, Pennsylvania, provide light financial assistance and mediation/problem solving services. Montgomery County offers a specialized over-the-phone screening process to determine whether an individual could be successfully diverted. The County believes that, in order to successfully divert people from shelter, their focus must be on helping individuals develop the skills necessary to being successful in shared housing situations by becoming respectful household members. In many situations, light cash assistance is provided, as the County has found that the majority of its clients who seek shelter cannot afford housing on their own. This program has successfully diverted 60% of its single adult clients, while Cleveland’s program has diverted 19% of single adult males and 27% single adult females. 5. Uses of and Variations on Critical Time Intervention (CTI) in Different Permanent Housing Models: Permanent Supportive Housing (PSH) is a proven intervention for chronically homeless single adults and those with disabilities and other barriers to housing. Unlike PSH, which is costly and of unlimited duration, Critical Time Intervention (CTI) is a time-limited evidence-based practice that mobilizes support for vulnerable individuals during periods of transition, facilitating community integration, and continuity of care. CTI uses a phased

Seattle/King County Homeless Performance Assessment and Recommendations 15
III. Context
approach lasting nine months, comprised of three 3-month phases focused on Transition, Trying-Out, and Transition of Care. CTI was traditionally used to assist persons making a transition to community living from shelter, hospital, or other institutional settings. However, in recent years, communities have been pairing or adapting the CTI model to additional forms of housing and cross-sector coordination. In Montgomery County, a CTI program is operated by national non-profit Resources for Human Development in partnership with staff at a network of local housing resource centers. The CTI program works with mentally ill homeless individuals to gain housing, build and maintain positive landlord relations, and transition to community-based services. Similarly, in Fairfield County, Connecticut, the Housing First Collaborative has paired Housing Choice Vouchers with CTI services to target chronically homeless adults. In both programs, clients are transferred to community-based care by the end of their nine-month CTI period with occasional check-ins by CTI staff, in order to prevent future returns to homelessness.
C. LOCAL CONTEXT – “CURRENT STATE” IN SEATTLE/KING COUNTY Current efforts in Seattle and King County to address homelessness are strongly shaped by the national context. In recent years, the community has shifted its approach to homeless crisis response to emphasize the need for a more coordinated effort and a focus on housing as the solution. This section provides a general overview of the “current state” of housing and services for homeless people in Seattle/King County, including data on who is represented within the community’s homeless population; the strategies and initiatives that have been put in place; the inventory of homeless programs; and a summary of key system strengths and challenges. 1. Numbers and Characteristics of Homeless People in Seattle/King County The number of homeless people in Seattle/King County is on the rise. The 2016 annual One Night Count of homeless people conducted by All Home found 10,730 people living in unsheltered situations (such as streets and vehicles), shelters, safe havens, and transitional housing. This was a 6% increase from 2015 when 10,122 homeless people were counted and a 20% increase from the 2014 count, which found 8,949 homeless people. The next table presents data from the 2016 One Night Count – otherwise known as the Homeless Point in Time Count (PIT) – conducted on January 29, 2016. The data shows that the majority of the homeless population in Seattle/King County was sheltered, with approximately 30% of people counted living in emergency shelters and 29% living in transitional housing. The 4,505 unsheltered people comprised 42% of the total people counted. Many of these unsheltered individuals live in encampments and other outdoor locations around the City of Seattle – a highly visible problem that the community has grappled with for over a decade. Additionally, approximately a quarter of unsheltered individuals live in vehicles. The 10,730 people counted represent 8,673 households, including 7,713 households without minor children; 932 families with children, and 30 unaccompanied minors. The majority of homeless people in Seattle/King County are adults without children – approximately 89% of households counted. Among the families with children, most were living in shelters or transitional housing and only a handful were unsheltered at the time of the count. However, other data sources, including the community’s Coordinated Entry for All (CEA) system, indicate there are close to 400 unsheltered families in the community, many living in vehicles or encampments. Of more than 10,000 homeless individuals counted, 814 were chronically homeless, defined as: (1) currently unsheltered or in emergency shelter; (2) having been continually homeless for at least a year, or four or more

16 Seattle/King County Homeless Performance Assessment and Recommendations
III. Context
times within the last three years; and (3) having a disability that significantly impairs ability to secure and sustain housing.3 Significant racial disparities exist in Seattle/King County’s homeless population. The annual counts and other data sources have consistently shown that people of color are disproportionally represented among the homeless population. This is particularly the case for African American, Hispanic, and multi-race households, who are represented in the homeless population at far higher rates than in the community’s general population.
2016 Homeless Populations4 Sheltered
Unsheltered TOTAL All Households/All persons
Emergency Transitional Safe Haven
Number of Persons (Children
under 18) 474 1,200 0 29 1,703
Number of Persons (age 18 to
24) 229 404 0 334 967
Number of Persons (Adults)
2,497 1,379 42 4,142 8,060
Total Households 2,666 1,488 42 4,477 8,673
Total Persons 3,200 2,983 42 4,505 10,730
3 The data does not reflect the current HUD definition of chronic homelessness that went into effect in January 2016. 4 This is data submitted by All Home to HUD and may differ slightly from figures in other publications.
2016 Homeless Subpopulations Sheltered Unsheltered Total
Chronically Homeless Individuals 427 358 785
Persons in Chronically Homeless Families 29 0 29
Veterans 536 120 656
Severely Mentally Ill 647 199 846
Chronic Substance Abuse 424 276 700
Persons with HIV/AIDS 26 15 41

Seattle/King County Homeless Performance Assessment and Recommendations 17
III. Context
2. King County’s Strategic Response to Homelessness
a. Leadership and Governance The leadership of King County and the City of Seattle have established All Home as the entity designed to lead the Continuum of Care (CoC) and oversee homeless system planning efforts more broadly. All Home is housed within the King County Department of Community and Human Services (DCHS), which provides its fiscal management and administrative infrastructure, and is funded by the federal Continuum of Care grant, King County, Bill & Melinda Gates Foundation, United Way of King County, and the City of Seattle. All Home is funded by a combination of public and private funding. All Home convenes the Coordinating Board – the designated CoC planning body that includes representation from organizations and individuals actively engaged in addressing homelessness in the community. Applications for membership to the Board are open to the public and representatives are selected by the Coordinating Board Executive Committee to fill specifically designated categories, including local government, non-profit homeless providers, people experiencing homelessness, representatives of other systems (e.g. health, criminal justice), faith, philanthropy and community members. The categories are designed to ensure that membership “comprises an appropriate array of committed private and public sector community leaders who reflect the diversity of people experiencing homelessness and regional differences.” All Home also convenes a set of topic-specific committees working on specific strategies and needs of particular subpopulations, as well as a Consumer Advisory Council. While All Home guides preparation of the community’s annual application for HUD CoC funds, there are a number of other funding sources supporting homeless system initiatives, managed by other local funders, including the City of Seattle, King County, the housing authorities of both the City and County, Veterans Administration, other municipalities, and private funders. All Home’s Funder Alignment Committee helps organize and coordinate these multiple funding streams; the charge of this group is to evaluate, allocate, and monitor resources and funding strategies to support the All Home Strategic Plan. b. Key Strategies and Initiatives All Home and other funders in King County have undertaken a coordinated effort to develop a more systematic approach to homelessness. Below is a brief summary of some of the key efforts currently underway to develop a community-wide response to homelessness. All Home Strategic Plan: As the body tasked with coordinating the community’s response to homelessness, All Home has been leading a process to update the community’s strategic approach. In 2015, they completed a new Community Strategic Plan 2015-2019, updating the previous ten-year plan. All Home’s vision is that homelessness is rare in King County, racial disparities are eliminated, and if one becomes homeless, it is brief and only a one-time occurrence. This new plan is strongly informed by the paradigm of homeless crisis response and includes three key strategy areas: 1. Make Homelessness Rare – These strategies include an expanded focus on prevention and shelter diversion, as well as expansion of affordable housing opportunities; 2. Make Homelessness Brief and One-Time – This goal includes a commitment to rapid re-housing and use of data to understand program and system performance; and

18 Seattle/King County Homeless Performance Assessment and Recommendations
III. Context
3. Community Engagement – This includes engaging the broader community and a range of partners in solutions to end homelessness. Population specific plans are in place for Youth and Young Adults (YYA), being refreshed for families, and under development for single adults. HMIS System Transition: In April 2016, Seattle/King County’s Homeless Management Information System (HMIS) transitioned from the City of Seattle Human Services (HSD) to King County Department of Community and Human Services (DCHS). All Home’s Coordinating Board and HMIS Steering Committee approved this transfer and the selection of a new vendor and system administrator – BitFocus Clarity. Coordinated Entry for All (CEA): A key system initiative currently underway will transform the existing coordinated intake systems for families (Family Homeless Connection), youth and young adults (Youth Housing Connection) and veterans (Veteran By-Name List) and add in single adults to create a single, comprehensive Coordinated Entry for All (CEA) system for all populations. Planning and implementation of CEA has accelerated over the past six months, with an official phased in launch beginning in June 2016. As of May 2016, the daily operations and oversight of CEA is managed by DCHS and informed by community stakeholders through All Home. The technology platform for CEA is the BitFocus Clarity HMIS system, also managed by DCHS. CEA uses standardized tools and practices to ensure those with the most severe service needs are prioritized. The selected triage tool is the VI-SPDAT (family and youth versions are used for those populations). The CEA is organized around Regional Access Points (RAP) that serve as hubs for access into the homeless system. Clients who are literally homeless (unsheltered or living in shelter) receive a standardized vulnerability assessment at the RAPs and then are entered into a community queue for referral to transitional housing, rapid re-housing, permanent supportive housing, and other permanent housing for homeless households. Families with children also access shelter through CEA, with planning underway for youth and single adult shelters to be integrated into the system. Single adult resources will be integrated into CEA in phases, beginning with permanent supportive housing in September 2016. The implementation of CEA includes an expansion of diversion services, with an objective of offering diversion to all families and individuals as part of the CEA assessment process. Landlord Liaison Project/Housing Locator: King County, the City of Seattle, United Way and All Home are working on a re-visioning of the existing Landlord Liaison Project to have a greater emphasis on partnership with landlords to identify and secure units for households participating in rapid re-housing and other rental assistance programs. The Landlord Liaison Project, launched in 2009, is a partnership among landlords, property managers, service providers, and people with barriers to accessing housing. King County will be releasing an RFP in summer 2016 to implement a renewed vision of this project with an increased focus on developing partnerships with housing providers and property owners and exploring creative housing solutions in order to expand the inventory of housing options for people experiencing homelessness. Current features of the program will be maintained and expanded, including landlord engagement and recruitment, negotiating reduced screening criteria, landlord education, and ongoing development of landlord incentives. In addition, key changes will include the addition of housing locators, services integrated into CEA, data entered into HMIS, expanded provider access to available units, and expanded housing options. Outreach Continuum: The City of Seattle and King County have been working towards a more coordinated approach to outreach and engagement in an effort to create a countywide outreach continuum. All Home is leading this effort currently underway which will include an assessment of existing outreach activities and alignment with other system initiatives such as Coordinated Entry for All.

Seattle/King County Homeless Performance Assessment and Recommendations 19
III. Context
King County Best Starts for Kids Youth and Family Homeless Prevention Initiative (BSK): The King County Best Starts for Kids levy approved in 2015 includes $19 million for a new Youth and Family Homelessness Prevention initiative designed to prevent and divert children and youth and their families from becoming homeless. This initiative is based on a highly successful Domestic Violence Housing First pilot program implemented by the Washington State Coalition Against Domestic Violence and funded by the Bill & Melinda Gates Foundation and the Medina Foundation. The Youth and Family Homelessness Prevention Initiative will include mobile case management coupled with flexible financial assistance intended to address the immediate issue that is placing the family or youth at imminent risk of homelessness from a person-centered approach. Funder Coordination and Alignment: There are a number of efforts underway within the community to bring together and align the community’s investments in addressing homelessness. These include a recent report commissioned by the City of Seattle to inventory and assess its homeless system investments (being developed by Barbara Poppe and Associates), and the ongoing convening of a Funder Alignment Committee as part of the All Home committee structure. Frequent Users Initiatives: Several important initiatives are underway to identify high utilizers of emergency services and ensure they are prioritized for housing and services, including the Familiar Faces initiative (part of a broader King County Health and Human Services System Transformation) and a long-term shelter stayers (LTSS) initiative.
c. Available Intervention Types The Seattle/King County community has put in place a broad range of service, shelter, and housing options for homeless people, representing all types of primary interventions typical in most communities. These include programs and projects offering temporary and permanent housing, as well as a variety of services. This section briefly describes the available resources in the community as general context for this report, but is not intended to be comprehensive. Later sections of the report provide recommendations for shifting many investments, strategies, and models based on Focus Strategies’ analysis of system performance and to fit with evidence-based and best practices. Outreach and Engagement: Existing outreach efforts include teams and programs targeted to single adults and youth/young adults – providing ongoing outreach, engagement, assessment, and connections to housing and services. Key programs include the Multi-Disciplinary Team (MDT) serving the downtown core, Housing and Health Outreach Team (HHOT) funded by Health Care for the Homeless, and Youth Outreach Team. As noted above, outreach is a critical element of CEA planning, and there are a number of efforts underway to expand and target outreach to unsheltered single adults. All Home is currently convening outreach funders and providers to improve coordination and targeting of county-wide outreach efforts. Day Services: Seattle/King County has a number of day, hygiene, and drop-in centers for single adults, families, youth and young adults. These programs provide a variety of supports and services, including meals, hygiene (bathrooms, showers), laundry, and storage. Many also provide services on a drop in basis, such as nursing, mental health and substance abuse counseling, employment services, and general case management. Emergency Shelters: Shelters offer very short lengths of stay, connections to a range of services and, in some cases, assistance developing a plan to secure permanent housing. Seattle/King County has a range of emergency shelter facilities for single adults, families, youth, and DV survivors.

20 Seattle/King County Homeless Performance Assessment and Recommendations
III. Context
Transitional Housing: Seattle/King County has a relatively large inventory of transitional housing programs for single adults, families with children, youth/young adults, veterans and DV survivors. These programs are designed to offer longer stays and intensive case management to help residents make the transition to permanent housing upon exit. HUD-funded transitional housing programs are allowed to have stays of up to two years, but the majority of programs in Seattle/King County are designed for 12 to 18 month stays. Rapid Re-Housing: Rapid re-housing is a relatively new program type that provides homeless individuals and families with a short term rental subsidy (usually up to about six months), after which they take over responsibility for paying their own rent. Services include help with locating housing, as well as time-limited case management focused on maintaining stability in housing. Currently, there are only a handful of rapid re-housing programs operating in the community, though inventory is expanding. Permanent Supportive Housing: Permanent supportive housing (PSH) is housing that is not time-limited, which provides deeply affordable rent and intensive ongoing support services. It is designed for those homeless people with the most acute needs, particularly those who are chronically homeless and/or have significant behavioral disabilities. Seattle/King County’s PSH inventory includes both voucher programs (Shelter Plus Care) and a range of dedicated site-based PSH projects. Other Permanent Housing (OPH): The community’s inventory of programs for homeless people also includes a number of service-enriched affordable housing projects targeting homeless people, but with lower service intensity than in PSH. “Other Permanent Housing,” or OPH, is how these projects are categorized in the annual Housing Inventory Count (HIC) submitted to HUD. Shelter Diversion and Homelessness Prevention Programs: Significant resources are invested in a range of homelessness prevention activities. Shelter diversion is also offered to some families, who are seeking shelter but are identified as being able to remain in place or move directly to other housing options. Diversion assistance is expanding to young adults and single adults, and being connected to CEA as a strategy to help prevent people from entering the homeless system who are not literally homeless.
d. System Capacity
The table below presents a summary of the homeless system’s overall capacity. This tables includes only those programs that have physical beds or housing units and are listed in the 2015 Housing Inventory Count (HIC). The last column shows the number of unduplicated people served in each intervention type, based on data extracted from HMIS for the two-year period from January 2014 to December 2015.

Seattle/King County Homeless Performance Assessment and Recommendations 21
III. Context
Program Type Number of Providers
Number of Programs
Number of Beds
Number of Unduplicated
People Served in 2013 and
2014 Emergency Shelter 32 89 3,691 23,428 Transitional Housing 44 119 3,358 5,666 Rapid Re-Housing 13 29 2,503 2,012 Permanent Supportive Housing 25 90 5,939
6,186 Other Permanent Housing 14 27 1,411 Total 128 354 16,902 34,2275
e. Funding Sources and Amounts Seattle/King County invests significant resources in interventions to end homelessness, including federal (CoC, ESG, CDBG, HOME, HCV, VA); State (CHG, HEN); County (General Fund, Veterans and Human Services Levy); City of Seattle (General Fund, Housing Levy, Human Services), and private funds (United Way, Raikes, Gates). Focus Strategies collected budget and funding source data for a subset of the programs in the community, as part of our SWAP analysis. The table below shows the estimated total funding for just the programs analyzed. This $85 million does not include all programs in the community.6
Project Type # of
projects Budget
Emergency Shelter 44 $20,595,219 Transitional Housing 73 $19,702,016 Rapid Re-Housing 5 $2,651,767 Permanent Supportive Housing
50 $38,162,007
Other Permanent Housing 20 $3,882,397
Total 192 $84,993,406
All Home’s Strategic Plan estimates that the total investment in homelessness in the community is closer to $178.7 million, including crisis response strategies, ongoing housing vouchers for permanent housing for formerly homeless people, and auxiliary services, such as healthcare, treatment services, food, and employment/education services. 3. Community Perceptions of Key Strengths and Challenges
5 This is less than the sum of the individual program types because some households were served in more than one program. 6 Focus Strategies’ performance analysis was limited only to those programs that enter data into HMIS and are listed in the community’s Housing Inventory Count (HIC). This does not include all of the community’s housing and services for homeless people.

22 Seattle/King County Homeless Performance Assessment and Recommendations
III. Context
As part of our information gathering, Focus Strategies asked key stakeholders to identify what they viewed as the main strengths and accomplishments of the current system, with a particular focus on single adults. Their responses are presented in detail in Appendix 3 and also briefly summarized here. Strengths and Assets: Stakeholders we interviewed were in strong agreement that the community benefits from strong collaboration, as well as a commitment from governmental and non-profit leadership to work hand-in-hand to end homelessness. The transformation of the King County Committee to End Homelessness into All Home and process of developing the Strategic Plan were both mentioned as important, recent accomplishments. Many noted that the community has come a long way towards embracing a Housing First approach, which has helped to increase their success in housing people with high housing barriers. Local government representatives pointed to the community’s array of financial resources as a strength, including the Housing Levy and other levies. However, providers seemed more inclined to note a lack of resources as a system-wide challenge. Challenges: The stakeholders uniformly pointed to high rents and low vacancy rates as the single greatest challenge to making progress on reducing homelessness in Seattle/King County. Lack of affordable units and the slow pace of new unit creation were identified as the main obstacle to helping more people exit from homelessness. At the same time, stakeholders identified a number of other challenges relating to homeless system design, particularly the lack of overall coordination amongst programs and clear pathways for people to be matched to the appropriate intervention. There was a pervasive view that what services or housing a person receives depends to a great degree on luck and which case manager they happen to be working with. A related theme was the lack of data coordination and sharing of data across agencies and programs. Funders and providers also noted that many programs continue to have high barriers to entry and people with the greatest needs are typically the most difficult to place into shelter and housing. Stakeholders also noted disparities in the distribution of resources among subpopulations – with single adults and youth noted as those with the greatest unmet needs. There were also a number of stakeholders who spoke of geographic differences in resource allocation, in particular the lack of system capacity on the east side of the County.

Seattle/King County Homeless Performance Assessment and Recommendations 23
IV. Analysis & Key Findings
IV. Analysis & Key Findings A. SYSTEM PERFORMANCE The sections below present our analysis of homeless system performance using data drawn from HMIS, the Housing Inventory Count (HIC), and provider project budget information. We have also included information provided by key stakeholders where relevant to help provide context for the data, or in cases where the data does not appear to align with what we learned from stakeholders. In the next section, we have summarized the system performance targets that the client group has agreed to adopt moving forward. 1. HMIS Data Quality A key precondition to any assessment of system performance is the availability of quality data. The BYC produces assessments of four dimensions of data quality for each project type including: the amount of “missing” data, the amount of “unknown” data, the validity of calculated lengths of stay, and utilization rate. Overall, the most pressing data quality issue identified is the degree of “unknown” exit destinations for those who exit, particularly from emergency shelter, but also from transitional housing, permanent supportive housing, and rapid rehousing. Understanding the difference between “missing” and “unknown” data is key in terms of developing a data quality improvement effort. “Missing” data includes data that are not recorded in HMIS by the project serving that client. The table below illustrates that the amount of missing data is minimal for each project type; all less than 5% of possible responses.7 On the other hand, “unknown” data reflects the percent of entries and exits that do not have a score-able response in HMIS; it includes missing data, but also responses like “data not collected,” “client doesn’t know,” “client refused,” “no exit interview conducted,” and “unknown.” The pattern of responses, therefore, suggests that providers are recording information in HMIS in a compliant manner (no missing data for the most part), but not in a useful manner (with responses relevant to performance measurement and system improvement). The difference is most apparent with regard to exit destination, but also applies in the case of prior living.
7 There are a few emergency shelter (ES) projects that are responsible for almost all of the missing exit destinations in 2014; we suspect that operationally, HMIS exit information is not expected or required of these projects.
Missing/Unknown (% of all Households)
Project Type # of projects
Prior Living Destination %
Missing
% Unknow
n
% Missi
ng
% Unkno
wn Emergency Shelter 44 0.3% 6.2% 4.4% 42.9%
Transitional Housing 73 1.1% 4.5% 0.1% 10.1%
Permanent Supportive Housing / Other Permanent Housing 70 0.1% 6.2% 0.8% 19.3%
Rapid Re-Housing 5 0.0% 2.4% 0.0% 14.2%
Total 192 0.5% 5.4% 1.3% 21.1%

24 Seattle/King County Homeless Performance Assessment and Recommendations
IV. Analysis & Key Findings
It is essential to consider the impact of data quality issues in terms of how the pattern of HMIS data impacts the performance assessment and modeling. If the unknown exit data represents non-permanent housing exits, the impact on the report is little to none. The performance assessment and modeling use the exit rate as it is calculated from the known values. If the unknown exit data represents permanent housing exits, this report understates project performance in terms of exit rate to permanent housing; more successful exits would have been taken into account had the data been recorded. The most likely case, however, and the assumption we have used for the purposes of the performance analysis presented in this report, is that the rate of permanent housing (PH) exits for the unknown cases is no different than the rate of permanent housing exits for the known cases. With regard to the modeling, the only impact of the unknown data is that the actual number of permanent housing exits across the system may be understated, because the flow out of the system is assumed to be less than it really is. Therefore, reductions in homelessness might occur more swiftly if the unknown exits are to permanent housing. 2. Alignment of Inventory and Investment with Need The graph below illustrates the relationship between Seattle/King County’s adult only and family households in terms of population size, current system capacity and investment levels. Though family households comprise just 12% of the total homeless population, 21% of financial investments are allocated to families. A similar disparity is found in the system inventory, where 22% of the bed/unit capacity is designated for just 12% of the total homeless population. On the single adult household side, 79% of investment and 78% of bed capacity is allocated to the remaining 88% of King County’s homeless population. This disproportional allocation of resources toward families in relation to the size of the population of homeless families is quite common and evident in a number of communities Focus Strategies has analyzed.
88%78% 79%
12%22% 21%
0%
10%
20%
30%
40%
50%
60%
70%
80%
90%
100%
Population Capacity Investment
Homeless Population, Capacity, and Investment
Adult HHs Family HHs

Seattle/King County Homeless Performance Assessment and Recommendations 25
IV. Analysis & Key Findings
3. Performance Measures In recent years, federal homelessness policy as developed by federal agencies including the Department of Housing and Urban Development (HUD) has shifted towards looking at how well communities perform in their efforts to reduce homelessness. To further these objectives, HUD has strongly encouraged communities to evaluate the effectiveness of individual programs, as well as the overall system in meeting specific performance measures. Focus Strategies has developed a set of performance metrics that build upon HUD’s measures as articulated in the Homeless Emergency Assistance and Rapid Transition to Housing (HEARTH) Act and Opening Doors: The Federal Strategic Plan to End Homelessness. While the measures we use are all aligned with HUD’s goals, we also incorporate cost effectiveness, so that communities can understand not only system performance, but also performance in relation to the level of investment and the likely outcomes and impact of investing in alternative solutions. This section presents our analysis of Seattle/King County’s system performance on five measures:
a) Bed and Unit Utilization Rate b) Program Entries from Homelessness c) Lengths of Stay d) Rate of Exit to Permanent Housing e) Cost per Permanent Housing Exit 8
a. Bed and Unit Utilization Rate This metric measures the average daily bed/unit occupancy of programs in the system, as calculated using HMIS data. Maximizing the use of available bed capacity is essential to ensuring that system resources are being used most wisely and to maximize the number of homeless people served with existing bed/unit inventory. Over time, this measure is also crucial to determining whether sufficient progress has been made in reducing homelessness such that emergency shelter capacity can be reduced to only the level needed to shelter everyone who becomes homeless. The next graph presents the utilization rate for emergency shelter, transitional housing, permanent supportive housing and other forms of permanent housing.9 This data uses bed utilization for single adult programs and unit utilization for family programs, as a unit within a family program may have unfilled beds simply due to housing a smaller sized family than the unit was designed to accommodate. These results show that, in general, the bed inventory in Seattle/King County is being well utilized. The main exception is in the area of emergency shelter, where average utilization is 89% for adult households and 69% for families. This suggests that there is unused capacity to house many of the unsheltered families with children in the community with the existing inventory and available beds should be prioritized for this purpose (see recommendations). Our modeling analysis also shows that there is sufficient capacity in the existing shelter system to shelter all unsheltered people if strong coordinated entry and diversion is implemented (see Modeling Results and also Recommendations sections). The utilization rate for some PSH and OPH is above 100%, which is not unusual given that voucher programs sometimes over-lease, or lease more units that the contracted capacity. These results are not a cause for concern. 8 See Appendix 7 for additional graphs that show a breakdown of performance level by project type. 9 Note: Rapid re-housing is not included in this analysis because this program type does not have a fixed bed capacity and so the methodology applied to the other program types does not generate comparable results.

26 Seattle/King County Homeless Performance Assessment and Recommendations
IV. Analysis & Key Findings
b. Entries from Homelessness This measure looks at the degree to which programs are serving people with the most acute housing needs, particularly those who are literally homeless, meaning they are living outdoors, in a vehicle, or in an emergency shelter. While certain funders may allow programs to serve people who are living in other situations (e.g. people living in motels, people in doubled-up situations, people living in their own apartments but at-risk of eviction), successfully reducing homelessness depends on prioritizing those with the highest need for available units. This measure reflects the federal policy goals of ending chronic homelessness and prioritizing literally homeless people for permanent housing. To create a “right sized” system in which there is an appropriate housing intervention for all homeless people, those who are not literally homeless (e.g. doubled up or otherwise “at risk”) must be diverted from ever entering the homeless system, thereby making resources available for those with nowhere to live. The graph below presents the rate of entry from literal homeless situations to the five program types we analyzed. All of the intervention types are accepting significant numbers of households that are not literally homeless. The most effective programs in this measure were Rapid Re-Housing, where 88% of families served were literally homeless upon entry.10 The lowest performing program type on this metric were emergency shelters, where only 66% of single adults and 64% of families entering were literally homeless. Further, when literal homelessness is broken down by whether entries are from unsheltered and sheltered locations, results indicate that only 22% of adults and 36% of families enter shelter from an unsheltered location. Given the size of the shelter inventory in Seattle/King County and the large unsheltered population, this represents a significant missed opportunity to help unsheltered people move into shelter (and from there, into permanent housing). As discussed in the modeling section, significantly improving performance on this
10 Our analysis did not include any Rapid Re-Housing programs for single adults because there was not sufficient data available on these programs.
89%
69%
92%
101% 118%98%
143% 118%
40%
50%
60%
70%
80%
90%
100%
Adult HHs Family HHs Adult HHs Family HHs Adult HHs Family HHs Adult HHs Family HHs
Emergency Shelter Transitional Housing Permanent SupportiveHousing
Other Permanent Housing
Perc
ent U
tiliza
tion
Average Utilization Rate for Adult and Family Households by Program Type

Seattle/King County Homeless Performance Assessment and Recommendations 27
IV. Analysis & Key Findings
measure alone will drive unsheltered homelessness effectively to zero. We would also note that both transitional housing and other permanent housing perform poorly on this measure. In recent years, HUD has restricted PSH funded with CoC dollars to serving only literally homeless households. However, many PSH tenants entered units before this change in policy, which explains why PSH entries from literal homelessness are only 66% and 82%. Newer entries to PSH are likely closer to 100% from literal homelessness.
c. Lengths of Stay Achieving relatively short lengths of stay in emergency shelter, transitional housing, and rapid re-housing programs is an essential goal to ending homelessness. Every day that a person spends homeless, an associated cost is incurred. Reducing lengths of stay results in a quicker rate of exit and a lower cost per exit, which in turn allows more people to be housed. The HEARTH Act has established a goal that no one is homeless longer than 30 days. As part of system right-sizing, the entire system must strive for the shortest stays needed to reach this goal.
1751
328
527
179
0
100
200
300
400
500
600
Adult HHs Family HHs Adult HHs Family HHs Family HHs
Emergency Shelter Transitional Housing Rapid Re-Housing
Num
ber o
f Day
s Sta
yed
Average Length of Stay per Household for Adults and Families by Project Type
66% 64%54%
71% 66%
82%88%
49% 48%
0%10%20%30%40%50%60%70%80%90%
100%
Adult HHs Family HHs Adult HHs Family HHs Adult HHs Family HHsFamily HHs Adult HHs Family HHs
Emergency Shelter Transitional Housing PermanentSupportive Housing
Rapid Re-Housing
Other PermanentHousingPe
rcen
t of E
ntrie
s fro
m H
omel
ess
Prio
r Li
ving
Rate of Entry from Homeless Prior Living for Adult and Family Households by Project Type

28 Seattle/King County Homeless Performance Assessment and Recommendations
IV. Analysis & Key Findings
The graph presents average length of stay by program type in Seattle/King County. The length of stay (LOS) for emergency shelter is relatively low, which is a bright spot in the overall system performance on this measure. However, when viewed in conjunction with exit rate to permanent housing (see next section), this performance is less impressive, demonstrating that many people are staying for short periods and subsequently exiting back to homelessness. Lengths of stay in transitional housing are shockingly long at 328 days for single adults and 527 days for families – more than 10 times the goal of housing people in 30 days. This measure should also be considered in relation to the cost per permanent housing exit, which shows that transitional housing is tremendously expensive when viewed from the perspective of what it costs to help one household secure housing. Long lengths of stay correlate to higher costs and have not been shown to be necessary for successful program exits.11 The 179-day length of stay for rapid re-housing is above what would be recommended, but could be acceptable for programs targeting households with high housing barriers.
d. Exits to Permanent Housing While helping households exit shelter and transitional housing quickly is a key strategy to end homelessness, it is just as important to understand where people go when they exit. The rate of exit to permanent housing is the metric that defines whether exits are successful, and one that HUD has asked communities to report on for several years. This measures the degree to which a project assists clients to move to a housed situation, and is a critical aspect of project performance. As noted above, the exit rate from emergency shelter in Seattle/King County to permanent housing is extremely low. This correlates with our single adult analysis (see next section), which found a significant number of households cycling repeatedly through shelter. Performance of transitional housing is also lower than would be expected, especially given the very long lengths of stay in these programs. Rapid re-housing at 52% is well below what is common in high-performing RRH programs. As a general matter, the system as a whole is not performing well on this measure and data suggests that programs are not oriented to successfully help households identify immediate housing solutions.
11 See Appendix 6 for links to specific studies.

Seattle/King County Homeless Performance Assessment and Recommendations 29
IV. Analysis & Key Findings
e. Cost per Exit to Permanent Housing
To create a more efficient system, it is essential that investments are aligned with the objective of ending homelessness. Cost per permanent housing exit is a key performance measure because it assesses not only whether a program is helping clients to move to permanent housing, but also whether they do so in a cost effective manner. As funds are shifted from expensive programs to those that are more cost effective per person served, system capacity will increase and the numbers of homeless people will be reduced. The graph below shows the average cost per permanent housing exit for all program types in Seattle/King County. These figures are calculated using the total program cost, utilization of beds/units and client length of stay (cost per day is calculated and then multiplied by the number of days the individual/family was in the program). Emergency shelter generally is very low in cost per exit, but this also reflects the fact that very few people are exiting to permanent housing. Transitional housing is extraordinarily expensive at more than $20,000 for each single adult exit and $32,627 for each family. By contrast, rapid re-housing, despite exit rates being less than ideal, only costs $11,507 per household, about a third the cost of transitional housing. As our modeling shows (Section IV.D.), shifting funds from low performing transitional housing to higher performing rapid re-housing will yield a significant reduction in the size of the homeless population.
12%
31%
60%
73%
52%
0%10%20%30%40%50%60%70%80%90%
100%
Adult HHs Family HHs Adult HHs Family HHs Family HHs
Emergency Shelter Transitional Housing Rapid Re-Housing
Perc
ent o
f Exi
ts to
Per
man
ent H
ousin
gRate of Exit to Permanent Housing for Adult and Family
Households by Project Type

30 Seattle/King County Homeless Performance Assessment and Recommendations
IV. Analysis & Key Findings
$981
$5,677
$20,396
$32,627
$11,507
$-
$5,000
$10,000
$15,000
$20,000
$25,000
$30,000
$35,000
Adult HHs Family HHs Adult HHs Family HHs Family HHs
Emergency Shelter Transitional Housing Rapid Re-Housing
Average Cost per Household Exit to Permanent Housing for Adult and Family Households by Project Type

Seattle/King County Homeless Performance Assessment and Recommendations 31
IV. Analysis & Key Findings
B. PROPOSED PERFORMANCE TARGETS FOR SEATTLE & KING COUNTY In order to begin moving towards stronger system level performance, the client group has worked with Focus Strategies to develop a set of proposed performance targets for each system component and measure. These targets are summarized in the table below. The numbers “used in modeling” are the figures used in the modeling throughout this report. These figures are intended to incorporate improvements made, and assume the performance targets will be fully reached over the course of the five-year modeling period. In other words, these projected results assume strong but realistic progress toward the ideal system performance targets over the next few years.
Emergency Shelter
Transitional Housing
Rapid Rehousing
Permanent Supportive
Housing Utilization RateA Recommended Target* 95% 95% NA 95% Recommended Minimum**
85% 85% NA 85%
Current Performance (BYC)
82% 96% NA 114%
Used in Modeling 90% 96% NA 100% improve to
midpoint between target and minimum
maintain current performance
maintain current
performance
Length of StayA Recommended Target* 30 days 90 days 120 days See Note*** Recommended Minimum** 90 days 150 days 180 days
Current Performance (BYC) 27 days 419 days 179 days
Used in Modeling 27 days 285 days 150 days
maintain current performance
improve to midpoint between
current and minimum
improve to midpoint
between target and minimum

32 Seattle/King County Homeless Performance Assessment and Recommendations
IV. Analysis & Key Findings
Emergency
Shelter Transitional
Housing Rapid Rehousing Permanent
Supportive Housing
Exit Rate to PHA
Recommended Target* 50%(S)/80%(F) 85% - 90% 85% - 90% See Note***
Recommended Minimum** 40%(S)/65%(F) 80% Between 80% and
95%
Current Performance (BYC) 13%(S)/32%(F) 66% 52%
Used in Modeling 40%(S)/65%(F) 80% 80%
improve to minimum
improve to minimum
improve to minimum
Entries From HomelessnessAB
Recommended Target* 85% unsheltered (10% housed, 5%
other)
10% unsheltered, 85% ES (total 95%)
10% unsheltered, 85% ES (total
95%)
10% unsheltered, 85% ES (total
95%) Recommended Minimum** 75% unsheltered 75% unsheltered/ES 75%
unsheltered/ES 75%
unsheltered/ES
Current Performance (BYC)
28% unsheltered (32% housed)
19% unsheltered, 42% ES (total 61%)
14% unsheltered, 74% ES (total
85%)
26% unsheltered, 40% ES (total
66%)
Used in Modeling 75% unsheltered 75% unsheltered/ES 10% unsheltered,
85% ES (total 95%)
75% unsheltered/ES
improve to minimum
improve to minimum improve to target improve to
minimum
ARecommendations for Youth: additional analysis of youth programs to determine appropriate measures and targets. BEntries from Homelessness: Focus Strategies understands that holding providers accountable for this measure only makes sense until Coordinated Entry for All (CEA) is implemented and fully functional. *"Recommended Target" refers to an attainable program ideal, or the ultimate goal programs should work towards. ** "Recommended Minimum" refers to the point below which local contracting consequences are initiated (e.g., loss of funding, performance improvement plans). *** PSH performance requires a more nuanced approach on these dimensions which takes into account turnover rate.

Seattle/King County Homeless Performance Assessment and Recommendations 33
IV. Analysis & Key Findings
C. SINGLE ADULT ANALYSIS In addition to the system level performance analysis presented above, the Client Group also asked Focus Strategies to complete a more in-depth analysis of data on the single adult population. This analysis had two main goals:
• To develop a typology of homeless single adults that may help inform the development of more effective strategies for housing this group; and
• To identify racial and other disparities in the homeless single adult population.
To conduct this analysis, Focus Strategies received an extract of HMIS data that contained all services and demographic data for single adults who had at least one emergency shelter stay during a three year period (calendar years 2013, 2014, and 2015). The key results of our analysis are presented below; additional details may be found in Appendix 8. 1. Typology – Frequency of Shelter Stays
a. General Approach and Key Findings
As noted above, the client group requested that we develop a typology of homeless single adults served in the Seattle/King County shelter system. A typology is essentially a classification system that attempts to differentiate subtypes of people into categories that are useful in advancing a key priority. As a starting point for our work, we reviewed existing typologies from the field and determined that they are all very different in regards to their goals/purpose and their utility for policy development.12 For example, Kuhn and Culhane (1998) identified three categories of homelessness (transitional, episodic, and chronic) based on two dimensions (frequency of homelessness and duration of homelessness).13 The identification of the chronic type ultimately triggered federal, state, and local initiatives focused on preventing and ending chronic homelessness.14 To develop our typology, Focus Strategies considered the data available and the types of policy recommendations that will be most useful to help inform system change efforts in Seattle/King County. As discussed in the previous section, our analysis of the performance of the homeless system shows that the emergency shelter system in particular is in need of improvement. There are many people sleeping on the streets and in encampments, while at the same time, the shelters are overcrowded. As we have noted, the shelters are serving a significant number of people who are NOT unsheltered when they enter, and rate of exit to permanent housing is very low. We therefore developed a typology that helps to identify those homeless individuals for whom a housing intervention would generate a significant systemic impact – with the goal that this will support the client group in developing priority populations to target for intervention. We used HMIS data from 2015 to develop groups representing two dimensions: (1) frequency of shelter stays in 2015; and (2) number of shelter days associated with the 2015 shelter stay(s). A total of 12,102 people were included in the dataset of those who had a shelter stay in 2015.
12 National Health Care for the Homeless Council (January 2013). “Typologies of Homelessness: Moving Beyond a Homogenous Perspective.” In Focus: A Quarterly Research Review of the National HCH Council. Nashville, TN. 13 Kuhn & Culhane (1998), Applying cluster analysis to test a typology of homelessness by pattern of shelter utilization: results from the analysis of administrative data. American Journal of Community Psychology, 26(2), p 207-232. 14 McCallister, Lennon & Kuang (2011), Rethinking research on forming typologies of homelessness. American Journal of Public Health, 101(4), p. 596-601.

34 Seattle/King County Homeless Performance Assessment and Recommendations
IV. Analysis & Key Findings
From a policy perspective, the most important finding from this analysis is the impact on the shelter system of shelter users who have frequent and/or lengthy shelter stays. About 30% of all single adult shelter stayers in Seattle/King County had two or more stays in 2015, with about half of these having three or more stays. Additionally, about 10% of single adults have single but lengthy stays. These 40% of shelter stayers account for 74% of the shelter bed days used in the system.
b. Defining Frequency of Shelter Stays The number of shelter stays reflected in the 2015 data ranged from one to 63, with an average of just under two stays during the year (actual value is 1.8). About 70% (8,421 people) had only one entry to shelter, resulting in an extremely skewed distribution. To create a meaningful variable to use in further analyses, people were grouped by whether they had one, two, or three and/or more shelter stays. The next table illustrates key characteristics of these groups. In general, the data suggest that:
• Those in the 2 stay and 3+ stay groups are more likely to be male than single stayers, although all emergency shelter (ES) stayers are more likely to be male than female;
• Those in the 3+ stay group are more likely to have physical and mental health disabilities than the single stay and 2 stay groups;
• Those in the single stay and 3+ stays groups are more likely to have a substance abuse disability than those in the 2 stay group; and
• Age at entry to shelter, race, and veteran status do not appear to differ between the 3 groups.
The table below presents a summary of demographic data for the three groups.
1 Stay in 2015 (N=8,421)
2 Stays in 2015 (N=1,849)
3+ Stays in 2015 (N=1,832)
% of people 70% 15% 15% Male 59% 68% 71% Female 40% 31% 27% Age at Entry 18-24 15% 13% 12% 25-60 77% 79% 79% 60+ 9% 8% 8%

Seattle/King County Homeless Performance Assessment and Recommendations 35
IV. Analysis & Key Findings
c. Defining Number of Days in Shelter In order to define this variable, first we calculated the total number of days associated with any shelter stay that had at least one day within 2015. The number of shelter days associated with 2015 stays ranged from one to 10,249, with an average of 211 days and a median of 65 days. Again, this distribution was extremely skewed. To create a meaningful variable to use in further analyses, people were grouped into quartiles based on the number of days associated with their 2015 shelter stay. The quartiles were bound in the following way:
• 1st quartile included 0 to 16 days
• 2nd quartile included 17 to 65 days
• 3rd quartile included 66 to 225 days
• 4th quartile included those with 226+ days
The next table illustrates key characteristics of these groups. In general, the data suggest that:
• Men are less likely to comprise the 4th quartile than the 1st, 2nd or 3rd quartiles
• People in the 3rd and 4th quartile are somewhat less likely to have a mental health disability than those in the 1st or 2nd quartile.
0 – 16 days (N=3072)
17 – 65 days (N=2984)
66 – 225 days (N=3026)
226+ days (N=3020)
% of people 25% 25% 25% 25% Average # Days 13 31 55 187 Male 63% 66% 68% 50% Female 35% 32% 30% 49%
1 Stay in 2015 (N=8,421)
2 Stays in 2015 (N=1,849)
3+ Stays in 2015 (N=1,832)
White 45% 49% 49% Black 26% 28% 29% Native Hawaiian/PI 2% 1% 1% US Indian/Alaska Native 5% 4% 6% Asian 3% 3% 2% More than One Race 5% 4% 4% Veteran 10% 12% 11% Chronic Health Disability 11% 12% 15% Mental Health Disability 22% 19% 30% Substance Abuse Disability 21% 12% 20%

36 Seattle/King County Homeless Performance Assessment and Recommendations
IV. Analysis & Key Findings
0 – 16 days (N=3072)
17 – 65 days (N=2984)
66 – 225 days (N=3026)
226+ days (N=3020)
Age at Entry 18-24 15% 12% 14% 14% 25-60 76% 79% 76% 78% 60+ 8% 8% 10% 7% White 45% 46% 47% 49% Black 24% 27% 28% 27% Native Hawaiian/PI 2% 1% 1% 2% US Indian/ Alaska Native 4% 4% 4% 5%
Asian 3% 2% 2% 3% More than One Race 4% 4% 5% 6% Veteran 11% 12% 12% 9% Chronic Health Disability 7% 9% 9% 8%
Mental Health Disability 18% 18% 14% 11%
Substance Abuse Disability 11% 10% 8% 9%
d. Using Number of Stays and Number of Days in Shelter to Define Subtypes Crossing the number of shelter stays in 2015 with the number of days associated with those stays provides the distribution shown in the next table. Most people fall into the single stay group (N=8,421, 70%). There are substantially fewer people who have two stays (15%) or three or more stays (15%).
Focus Strategies next investigated whether looking at the subtypes by their shelter activity in 2015 would predict historical shelter use. That is, do people who stay infrequently always do so? Likewise, do those who stay frequently show that pattern historically? The table below provides the average number of stays over a three year period (2013-2015) for the subtypes defined by their 2015 shelter usage. As the rightmost column indicates, the historical average number of stays increases substantially, depending on the 2015 number of stays. Therefore, we concluded that the people who frequently access shelter in Seattle/King County continue to do so over time.
Number of People in Each Number of Stays by Days Category
Quartiles for Number of ES Days 2015 Stay Total People
Q1 Q2 Q3 Q4
Number of Stays in 2015
1 stay 2,572 2,024 1,678 2,147 8,421
2 stays 321 492 643 393 1,849 3+ stays 179 468 705 480 1,832
Total People 3,072 2,984 3,026 3,020 12,102

Seattle/King County Homeless Performance Assessment and Recommendations 37
IV. Analysis & Key Findings
The next area we looked at was the proportion of shelter days in 2015 each of the subtypes was responsible for occupying. The next table presents the proportion associated with each.15 The data suggest that 74% of shelter days are taken by those who stay two or more times, as well as those single stayers with the longest lengths of stay.
2. Disparity Analysis a. General Approach and Key Findings
For the disparity analysis, Focus Strategies adopted two different approaches. For both analyses, we looked at the 12,102 people who used shelter in 2015. First, we compared the characteristics of the single adult population served in emergency shelter to those of the general and poverty populations of Seattle/King County (where data are available). Differences between the groups on these characteristics indicate disparities in who is able to access shelter resources. Second, within the single adult population served in emergency shelter, we investigated whether disparities in the characteristics of shelter stays are evident based on age, gender, race, ethnicity, or disability. Differences found here indicate disparities in the shelter use experience for different groups. Both views of disparity are important from a policy perspective.
Our general conclusion is that there are disparities in both areas, some more pronounced than others:
Our analysis found dramatic disparities when comparing the population of single adult shelter users to the general Seattle/King County population and the population of people living in poverty. Men, people with disabilities, African-Americans, and Native Americans are disproportionally represented in the shelter population compared to the broader population. White, Asian, and Hispanic people are under-represented in the shelter population.
Looking specifically at single adult shelter users, we found some less dramatic disparities relating to age, gender, race, ethnicity and disability. Men tend to have longer stays and lower rates of exit to permanent housing than women. Race did not appear to strongly impact outcomes, though Native Americans have a slightly lower rate of exit to permanent housing than other groups. Latinos have somewhat longer stays and
15 See Appendix 10 for how the number of days were adjusted due to the data quality issue identified earlier.
Average Number of Stays Over a Three Year Period for Each Subtype
Quartiles for Number of ES Days 2015 Stay Average Number of Stays Q1 Q2 Q3 Q4
Number of Stays in 2015
1 stay 2.1 1.8 1.8 2.4 2.1 2 stays 4.7 4.2 3.7 4.3 4.1 3+ stays 9.0 11.4 11.9 10.6 11.2
Average Number of Stays 2.8 3.7 4.6 3.9 3.8
Percent of Days in Shelter for People in Each Number of Stays by Days Category
Quartiles for Number of ES Days in 2015 Total Days
Q1 Q2 Q3 Q4
Number of Stays in 2015
1 stay 4% 8% 15% 17% 43% 2 stays 1% 3% 7% 12% 23% 3+ stays <1% 4% 11% 19% 34%
Total Days 5% 15% 33% 47% 100%

38 Seattle/King County Homeless Performance Assessment and Recommendations
IV. Analysis & Key Findings
lower rates of exit to permanent housing than non-Latinos. Additional details are provided below, and in Appendix 8.
b. Disparities in Single Adult Shelter Population Compared to General/Poverty Population
We noted earlier that Seattle/King County has found racial disparities in annual homeless point in time counts and other data sources indicating that people of color are disproportionally represented among the homeless population. This is particularly the case for African American/Black and Native American households, who have been found to be represented in the homeless population at higher rates than in the community’s general population. The table below contains the available data for King County’s General Population, 200% Poverty Population, Poverty Population, 2016 PIT Shelter Population, and the 2015 Single Adult Shelter Population analyzed by Focus Strategies.16 The following are key findings:
1. The percent of single adults served in shelter in 2015 is a very small portion of both the general population (<1%) and of the poverty population (5%); most people in poverty do not access shelter resources.
2. Men are more likely than women to use shelter resources as compared to the gender breakdown of
general population.
3. Several findings are associated with the race of people using shelter: • White: A large disparity exists between the percentage of white people in the general population
(70%), poverty population (54%), and the shelter population (47%).
• Black: Large disparities exist between the percentage of black people in the general population (7%), the poverty population (15%), and the shelter population (27%).
• Native American: Large disparities exist between the percentage of Native American people in the general population (1%), the poverty population (2%), and the shelter population (5%).
• Asian: Large disparities also exist here, but in a unique way. Specifically, the percentage of Asian people in the general and poverty populations are essentially the same (16% and 15%, respectively). In contrast, the shelter population is comprised of only 3% of people identifying as Asian.
16 All sources are referenced within the table.

Seattle/King County Homeless Performance Assessment and Recommendations 39
IV. Analysis & Key Findings
4. Ethnicity is also related to disparities, with a much large percentage of Latinos in the poverty population (31%) than in the general population (10%). A finding similar to the Asian/Native Hawaiian population exits here, with an apparent underutilization of shelter resources by Latinos (10%).
5. The rate of disability appears to be somewhat higher in those who use shelter (38%) when compared to the general population (24%).
In summary, compared to other data, being female, White, Asian and/or Latino is related to less shelter use than may be expected, and being male, Black, Native American, and/or disabled is related to more shelter use than may be expected.
17 http://www.census.gov/quickfacts 18 http://allhomekc.org/wp-content/uploads/2015/09/2016-KC-ONC-numbers.pdf; all values except male/female represent all shelter use, rather than single adults only 19http://www.kingcounty.gov/healthservices/health/data/~/media/health/publichealth/documents/indicators/Demographics/DemographicsSocial.ashx; the % of population under 200% and 100% poverty level were obtained here 20 https://www.uwkc.org/wp-content/uploads/ftp/RacialDisparityDataReport_Nov2015.pdf 21http://www.kingcounty.gov/healthservices/health/data/~/media/health/publichealth/documents/indicators/Demographics/DemographicsIndividual.ashx
General Population
(2015)17
200% Poverty Population
(2012)
Poverty Population
(2012)
2016 PIT Shelter
Population18
Single Adult Shelter
Population (2015)
Estimated Number 2,117,125 491,173 230,767 3,200 12,102 % of General Pop 23.219 10.9 0.2 0.6 % of 200% Poverty Pop 47 0.7 2.5 % of Poverty Pop 1.4 5.2 % Male 50 74 62 % Female 50 26 36 % White 70 5420 52 47 % Black 7 15 30 27 % Native American 1 2 4 5 % Asian 16 15
7 3
% Native Hawaiian 1 1 1 % More than 1 race 5 6 7 5 % Latino/Hispanic 10 31 18 10 % Disabled 2421 ~ 30% 38%

40 Seattle/King County Homeless Performance Assessment and Recommendations
IV. Analysis & Key Findings
c. Disparities in Shelter Stay Characteristics In this section, we investigate whether disparities in the characteristics of shelter stays are evident, based on age, gender, race, ethnicity, or disability. We looked at the length of stay, total number of stays, entry location and exit destination.22 The table below presents each of these shelter stay variables by the demographic characteristics of interest. There are a number of group differences (i.e., disparities) evident in the data. Further analysis of disparities found in regards to age, gender, race, ethnicity, and disability are provided in Appendix 8.
Length of Stay (Days)
Number of Stays
% Enter From Unsheltered % Exit to PH
18-24 years old 108 5 30 31 25-59 years old 55 15 54 21 60 + years old 51 23 61 25 Male 69 13 55 20 Female 41 18 55 30 White 60 14 58 23 Black 61 18 52 25 Native American 57 11 53 18 Asian 62 21 51 23 Native Hawaiian 61 8 48 21 More than 1 race 92 9 28 23 Latino/Hispanic 72 14 51 20 Non-Latino/Hispanic 57 16 57 24 Chronic Health Disability 54 20 63 40 Mental Health Disability 36 23 72 36 Substance Use Disability 36 24 74 31
Age Disparities The young adult population (those aged 18-24) have longer (108 days) and fewer (5) stays than the other two age groups. They are also less likely to enter shelter from an unsheltered location (30%) and are more likely to exit to a permanent housing destination (31%). Older adults (age 60+) on the other hand appear to have more frequent stays and are most likely to enter from unsheltered locations. The graphs in Appendix 8 provide more detailed information for both prior living situation and exit destination by age group. These data show that young adults are more likely than the other age groups to have entered shelter after staying with friends and family. 22 See Appendices 9 and 10 for a significant data quality issue associated with exit destination.

Seattle/King County Homeless Performance Assessment and Recommendations 41
IV. Analysis & Key Findings
Gender Disparities With regard to gender, men have longer (69 days) and fewer (13) stays than women (41 days and 18 times). They are also less likely to exit to a permanent housing destination (20%) than women (30%). The graphs in Appendix 8 provide more detailed information for both prior living situation and exit destination by gender. These data show that male and female shelter stayers show little difference in their prior living situation, and that men more frequently exit to unsheltered locations than women. Racial Disparities Looking at race, there are some subtle and relatively minor differences in shelter stay characteristics. The most outstanding difference is one that is difficult to interpret. Specifically, people with more than one race have longer lengths of stay (92 days), stay less often (9), and are least likely to enter from an unsheltered location (28%). Native Americans appear to have slightly shorter lengths of stay (57 days) and are less likely to exit to permanent housing (18%). Additionally, Asians, followed by African Americans have more frequent stays (21 and 18, respectively). The graphs in Appendix 8 provide more detailed information for both prior living situation and exit destination by race. Ethnic Disparities With regard to ethnicity, Latinos have longer (72 days) and fewer (14) stays than Non-Latinos (57 days and 16 times). They are also somewhat less likely to enter from an unsheltered situation (51%) than non-Latinos (57%) and to exit to a permanent housing destination (20%) than Non-Latinos (30%). The graphs in Appendix 8 provide more detailed information for both prior living situation and exit destination by ethnicity. Disparities Related to Disability Finally, in terms of disability, those with Chronic Health Disabilities have longer (54 days) and somewhat fewer (20) stays than those with Mental Health or Substance Use Disabilities. They are also somewhat less likely to enter from an unsheltered situation (63%) and to exit to a permanent housing destination (40%). Those with a Substance Abuse Disability are the most likely to enter from unsheltered homelessness (74%) and least likely to exit to permanent housing (31%). The graphs in Appendix 8 provide more detailed information for both prior living situation and exit destination by whether people have these disabilities. D. MODELING RESULTS
1. General Approach and Summary of Results No modeling work can predict the future. The economy, the housing and job markets, current practice in mainstream benefit administration, the availability of health care, and many other factors are related directly and indirectly to the size of the homeless population. The purpose of the modeling work presented in this report is not to try to accurately predict what will happen in the larger community, but to make reasonable assumptions and estimates about the state of the community and homeless population dynamics in the relatively near future. For example, this analysis assumes that unsheltered homelessness will rise without significant system changes because the population has been rising under the current set of circumstances and there is no reason to assume that the community context is likely to change significantly (i.e. the housing market will continue to be challenged with high costs and low vacancies). The modeling is designed to demonstrate the extent to which funders and leadership in King County and the City of Seattle can enact system design and resource allocation decisions that change homeless population dynamics. By definition, people experiencing homelessness include people in emergency shelters, transitional housing, and living on the streets and other places not meant for human habitation. Some of those locations are entirely in the control of system leadership: for example, whether people who are already living outdoors

42 Seattle/King County Homeless Performance Assessment and Recommendations
IV. Analysis & Key Findings
get access to emergency shelter has an impact on the size of the unsheltered homeless population. To further illustrate these dynamics: since most people do not become homeless straight from an eviction, it does not make sense to prioritize sheltering that group of people who are facing eviction. Instead, sheltering people who are already unsheltered ensures that they can access a safe place to stay and a pathway to housing. The goal of modeling work is to determine what changes need to be made, size the interventions and changes needed, and assign timelines that achieve the goal of functionally zero homeless people. Modeling is estimation based on existing information. The highest and best use of this information is to see and understand how the different parts fit together as a whole. Individual recommendations cannot be taken out of context, as the results will not achieve the intended purpose. For example, sheltering unsheltered people instead of imminently or precariously housed people will not reduce the size of the homeless population alone; people staying in shelters must receive skilled assistance and adequate resources to obtain housing. Also, it is important to note that implementing the changes recommended based on modeling typically requires strong and effective leadership at all levels; skilled use of analytic tools, and the full commitment of and engagement with the provider community. (See Appendix 13 for a list of assumptions that were used throughout the modeling.) Summary of Modeling Results: Our modeling work revealed the following key results:
• Seattle/King County has sufficient emergency shelter capacity to shelter all unsheltered single adult and family households by the end of 2017 by combining three initiatives: (1) eliminating low and moderately performing transitional housing (TH) projects; (2) reaching recommended system and program performance targets; and (3) implementing a well-functioning coordinated entry and diversion system.
• Efforts to help unsheltered households enter shelter must be coupled with a bold effort to secure permanent housing for those who already have frequent or lengthy shelter stays. We estimate this includes 4,974 single adult households.
• Available funding is sufficient to rapidly re-house all family households currently using emergency shelter. This suggests that in a single year, Seattle/King County could reduce the inventory of emergency shelter beds and reallocate money elsewhere. This also suggests that some existing funding could shift to help house the large number of single adults currently using shelter.
• Available, existing funding is sufficient to rapidly re-house all long-term shelter stayers using a combination of Permanent Supportive Housing and Rapid Re-Housing plus CTI, over a period of four years. An additional $14 million per year would be needed to utilize rapid re-housing for one-time shelter stayers. The recommendations section includes suggestions about where this funding may be found based on reallocating funds from existing, low performing projects.
. 2. Methodology The base dataset used for the modeling work was the two years of data collected for the system performance assessment (presented in Section IV.A.), which covered calendar years 2013 and 2014. Because the data only went through 2014, the Client Group staff provided Focus Strategies with information about any programmatic changes (additions/deletions of programs) that had happened in the intervening 2 years. These
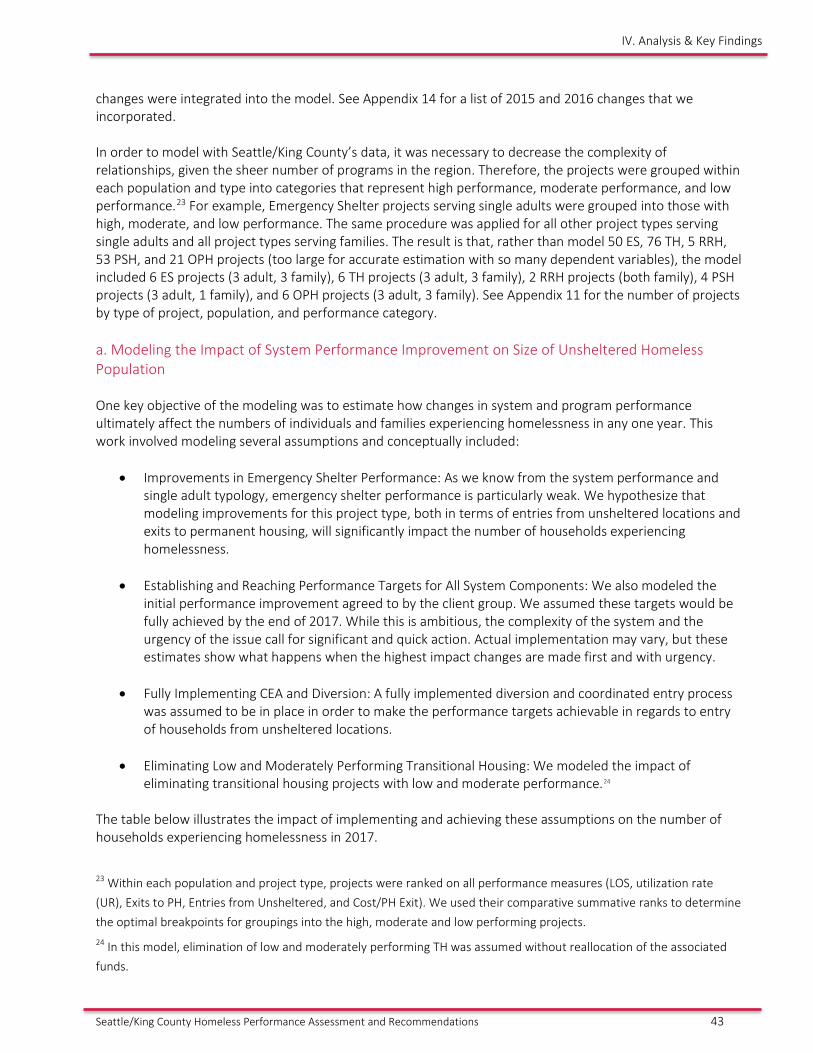
Seattle/King County Homeless Performance Assessment and Recommendations 43
IV. Analysis & Key Findings
changes were integrated into the model. See Appendix 14 for a list of 2015 and 2016 changes that we incorporated. In order to model with Seattle/King County’s data, it was necessary to decrease the complexity of relationships, given the sheer number of programs in the region. Therefore, the projects were grouped within each population and type into categories that represent high performance, moderate performance, and low performance.23 For example, Emergency Shelter projects serving single adults were grouped into those with high, moderate, and low performance. The same procedure was applied for all other project types serving single adults and all project types serving families. The result is that, rather than model 50 ES, 76 TH, 5 RRH, 53 PSH, and 21 OPH projects (too large for accurate estimation with so many dependent variables), the model included 6 ES projects (3 adult, 3 family), 6 TH projects (3 adult, 3 family), 2 RRH projects (both family), 4 PSH projects (3 adult, 1 family), and 6 OPH projects (3 adult, 3 family). See Appendix 11 for the number of projects by type of project, population, and performance category. a. Modeling the Impact of System Performance Improvement on Size of Unsheltered Homeless Population One key objective of the modeling was to estimate how changes in system and program performance ultimately affect the numbers of individuals and families experiencing homelessness in any one year. This work involved modeling several assumptions and conceptually included:
• Improvements in Emergency Shelter Performance: As we know from the system performance and single adult typology, emergency shelter performance is particularly weak. We hypothesize that modeling improvements for this project type, both in terms of entries from unsheltered locations and exits to permanent housing, will significantly impact the number of households experiencing homelessness.
• Establishing and Reaching Performance Targets for All System Components: We also modeled the initial performance improvement agreed to by the client group. We assumed these targets would be fully achieved by the end of 2017. While this is ambitious, the complexity of the system and the urgency of the issue call for significant and quick action. Actual implementation may vary, but these estimates show what happens when the highest impact changes are made first and with urgency.
• Fully Implementing CEA and Diversion: A fully implemented diversion and coordinated entry process
was assumed to be in place in order to make the performance targets achievable in regards to entry of households from unsheltered locations.
• Eliminating Low and Moderately Performing Transitional Housing: We modeled the impact of eliminating transitional housing projects with low and moderate performance.24
The table below illustrates the impact of implementing and achieving these assumptions on the number of households experiencing homelessness in 2017.
23 Within each population and project type, projects were ranked on all performance measures (LOS, utilization rate (UR), Exits to PH, Entries from Unsheltered, and Cost/PH Exit). We used their comparative summative ranks to determine the optimal breakpoints for groupings into the high, moderate and low performing projects. 24 In this model, elimination of low and moderately performing TH was assumed without reallocation of the associated funds.

44 Seattle/King County Homeless Performance Assessment and Recommendations
IV. Analysis & Key Findings
The modeling indicates that Seattle/King County has the ES capacity to shelter all unsheltered single adult and family households by the end of 2017 by combining three initiatives:
• Eliminating low and moderately performing TH projects; • Reaching recommended system and program performance targets; and • Implementing a well-functioning coordinated entry and diversion system.
All Households 2015 2017 Change
Emergency Shelter 56,950 45,442 ↓-20%
Transitional Housing 613 302 ↓-51%
Unsheltered 3,803 0 ↓-100% Total 61,366 45,744 ↓-25% Single Adult Households 2015 2017 Change
Emergency Shelter 54,893 44,202 ↓-19%
Transitional Housing 399 133 ↓-67%
Unsheltered 3,772 0 ↓-100% Total 59,064 44,335 ↓-25% Family Households 2015 2017 Change
Emergency Shelter 2,057 1,240 ↓-40%
Transitional Housing 214 169 ↓-21%
Unsheltered 31 0 ↓-100% Total 2,302 1,409 ↓-39%
b. Modeling Shifts and Resources Needed to House People Staying in Shelters While the shifts described above will ensure that unsheltered people are able to access shelter, data still show more than 44,000 single adult households and 1,200 families are served annually in shelter. The next steps of modeling were designed to identify the impact of potential strategies to help these households exit to permanent housing and the implication for investments. As a starting place, we assumed that eliminating low and moderately performing transitional housing frees up $15,881,164 (approximately $10+ million for single adults and $5+ millions for families). We then assessed how to best reinvest these funds. In order to generate this assessment, we brought together several pieces of the analyses presented thus far. The next table presents the estimated number of single adult and family households living in shelter that we recommend targeting. The data in the table present the following assumptions and results:
• Households Served in Emergency Shelter: Derived from the modeling; this represents the estimated number of households served in shelter in 2017, given increased system performance and defunded low and moderately performing transitional housing.

Seattle/King County Homeless Performance Assessment and Recommendations 45
IV. Analysis & Key Findings
• Unique Households: Derived from the BYC performance analysis; this represents the number of unique households served in shelter in the 2014 data provided by King County.25
• Mean stays/household: Derived by dividing the number of households served by the number of unique households.
• Number of 2/3+ Stayers: Derived from the Single Adult Analysis; represents the proportion of single adults who fall into the 2 and 3+ stay categories, multiplied by the unique number of households. This estimate is not available for family households.
• Number of Long-Term Single Stayers: Derived from the Single Adult Analysis; represents the proportion of single adults who are long-term single stayers, multiplied by the unique number of households. This estimate is not available for family households.
• Households to Target: The number of single adult and family households we recommend targeting for permanent housing exits. The single adult number is based on those clients who use the greatest number of shelter days, while the family number is based on the assumption that all families can be housed.
Using the analysis described above, we arrived at a proposal to target 4,974 single adult households (HH) and all of the 805 family households (HH) using emergency shelter in 2017.
c. Estimates of Interventions and Resources Needed for Family Households The table below presents our estimates of the interventions and resources needed to house all of the 805 families. The data in the table represent the following:
• PSH Units: The number of Permanent Supportive Housing units included in modeling. • PSH Regular Turnover: The number of exits from PSH represented in modeling. • Moving-On PSH: The number of PSH units expected to turnover every year given current capacity and
an efficient and effective Moving On program. See Recommendations on Moving-On strategy. • High Performing TH exits: The number of exits from high performing transitional housing programs
from the modeling. • Number to House in Rapid Re-Housing (RRH): Number of unique households minus PSH regular
turnover minus Moving On PSH turnover minus high performing TH exits. • Dollars Available From TH: Funding previously allocated to low and moderately performing family TH,
reallocated to RRH.
25 The number of single adult households is very consistent with the number found in the Single Adult analysis, supporting the validity of this result.
Single Adult HH Family HH
HH Served in Emergency Shelter 44,202 1,240
Unique HH 12,931 805
Mean Stays/HH 3.4 1.5 # of 2/3+ Stayers 3,900 # of Long-Term Single Stayers 1,074 Households to Target 4,974 805

46 Seattle/King County Homeless Performance Assessment and Recommendations
IV. Analysis & Key Findings
• RRH cost/unit: Estimated average cost per unit to support RRH for a single household.• RRH units: Estimated number of RRH units that current available funding can support.• Time to House: Estimated time to house the remaining households.• New 480 HH to house per year from 2nd year: Assumed a consistent 800 family households per year
present to shelter, 25% are diverted, 20% of those remaining self-resolve (see below for descriptionof self-resolve).
Family HH Number of Unique Households 805 PSH Units 420 PSH Regular Turnover 84 Moving On PSH Turnover (25% of portfolio) 105 High Performing TH exits 115 Number To House in RRH 501 Dollars Available from TH $5,429,805 RRH cost/HH $10,000 RRH units 543 Time to House < 1 year "Surplus" units 42 Dollars Available for Single Adults $420,000 New 480 HH to house per year from 2nd year 480 Ongoing RRH Cost for New Entries from 2nd year $4,800,000
Using these assumptions, we conclude that available funding is sufficient to rapidly re-house all family households currently using emergency shelter. This suggests that in a single year, Seattle/King County could reduce the inventory of emergency shelter beds and move money elsewhere. This also suggests that some of the existing funding could shift to help house the large number of single adults using shelter.
d. Estimates of Interventions and Resources Needed for Single Adults
The table below presents our estimates of the interventions and resources needed to house the 4,974 single adult long-term and frequent shelter stayers, plus the remaining 7,957 single adult households. The data in the table is the same as the family table, above, but also includes the following:
• PSH Units: The number of Permanent Supportive Housing units included in modeling.• PSH Regular Turnover: The number of annual exits from PSH represented in modeling based on
current turnover. Although this number of exits may be realized annually, we have conservativelymodeled four years to achieve the goal.
• Moving-On PSH: The number of PSH units expected to turnover every year given current capacity andan efficient and effective Moving On program. Although this number of exits may be realizedannually, we have conservatively modeled four years to achieve the goal.
• RRH + CTI (Rapid Re-Housing plus Critical Time Intervention): We anticipate that many of these clientswill have service needs that could be met using the CTI model (described in Section IIIB of this report).
• Number of Self-Resolving Households: The proportion of people who are able to exit shelter and donot return. Derived from the Single Adult Analysis; this represents the proportion of single adults whofall into the Single Stay category and occupy the fewest shelter beds in a single year (1st and 2ndquartiles), multiplied by the total number of unique households.

Seattle/King County Homeless Performance Assessment and Recommendations 47
IV. Analysis & Key Findings
Using these assumptions, we conclude that available funding is sufficient to rapidly re-house all long-term shelter stayers, using a combination of PSH and RRH plus CTI over a period of four years and using existing resources. An additional $14 million per year would be needed for rapidly re-housing the remaining shelter stayers and any new entries over the same four year period.
E. ASSESSMENT OF LEADERSHIP AND GOVERNANCE STRUCTURE EFFECTIVENESS
As part of our analytic process, Focus Strategies also collected information and conducted an assessment of the existing leadership and governance structures for homeless efforts in Seattle/King County. The goal of this work was to assess whether the existing governance structure is set up in such a way that it can drive the recommended system changes. To conduct this analysis, we reviewed key governance documents (All Home Governance Charter; Strategic Plans) and discussed system governance with members of the client group. Our primary findings are summarized in the following section.
Single Adults: Long-Term and Frequent Stayers
Single Adults: Remaining Households
Number of Households 4,974 7,957 PSH Units 4,223 PSH Regular Turnover 555
Moving On PSH Turnover (25% of portfolio) 1,056 High Performing TH exits 158 Number To House in RRH+CTI 3,205
Dollars Available from TH $10,451,359 Dollars from Family system $420,000 Total Available $10,871,359 RRH + CTI cost/HH $15,000 RRH + CTI units 725 Time to House 4.4 years Number of Self-Resolving HH 4,910
Number of Existing HH To House in RRH 3,047
15% new entries a year for 4 years (660/year) 2,640
Total Number To House in RRH 5,687
RRH Cost/HH $10,000
Total RRH Cost $56,870,000
RRH Cost/Year for 4 years $14,220,000
Ongoing RRH Cost for New Entries from 5th year $6,600,000

48 Seattle/King County Homeless Performance Assessment and Recommendations
IV. Analysis & Key Findings
1. Governance is Not Funder-Driven
In our observation, communities that are making stronger progress on homeless system re-design are those where public funders (local government elected officials and senior staff) drive strategy and decision-making, including making and implementing funding and investment plans. The primary role of providers – the entities that receive funding from the homeless system – is to inform strategy and participate in its execution. It is not reasonable or effective to ask providers to make system-level design decisions, when doing so can be in direct conflict with the interests of their individual agencies. This issue is not simply a conflict of interest, it is also an issue of vantage point. Providers generally do not have the system level view that allows for strategic decisions to be made in the best interests of all people experiencing homelessness in the community. Generally, providers have a clear view of what it takes to operate the projects they have, and what they need in order to make changes. Rarely are providers in a position to consistently see the whole system in context and be able to make decisions from that perspective. Clear systems thinking is required to implement systems change.
In Seattle/King County, the existing governance structure, All Home, is not strongly funder-driven. Membership of the two main decision-making bodies – the Coordinating Board and the Executive Committee – consists primarily of providers. Currently, the co-chairs of the Board (who also co-chair the ExecutiveCommittee) are both providers. Funders do participate, and there is also a Funder Alignment Committee, however its role is unclear and it has limited decision-making authority. For the most part, decision-making about use of major public funding sources is conducted outside the All Home structure, within the individual departments (e.g. Human Service Department (HSD), DCHS) or through joint Notice of Funding Availability (NOFA) and funding processes that are coordinated – but not shaped – by All Home.
2. Governance Structure is Designed for Input and Collaboration, Not Action
Related to the finding above, we noted that the way the All Home structure is set up appears designed to maximize opportunities for input and dialogue, but not to make decisions and take action. In addition to the main Board and Executive Committee, there are a large number of planning work groups on a range of topics. These appear to be oriented towards discussion and have no or little decision-making authority. The work of each committee appears to happen in silos and is not connected to any specific overall action plan.
The All Home Charter is set up to require consensus decision making in most cases and has relatively loose conflict of interest provisions, so individual providers have a large ability to sway decisions. When system design work is done in this collaborative way, it rarely leads to significant changes and rather tends to reinforce maintaining the status quo.
3. Unclear Decision-Making Authority
It is also unclear what authority All Home staff have to drive decision making and whether their role is conveners/facilitators or leaders/decision-makers. The HMIS system and CEA, key elements of the homeless system infrastructure, are both managed by DCHS. Yet system level planning is the responsibility of All Home. This split between planning functions and system infrastructure creates a lack of clarity regarding who is overseeing system change efforts, and potentially a lack of direct accountability for results.

Seattle/King County Homeless Performance Assessment and Recommendations 49
V. Recommendations
V. RecommendationsA. GENERAL RECOMMENDATIONS
1. Act with Urgency and Boldness
Homelessness is on the rise in Seattle and King County. The housing market in the region is one of the most expensive in the nation, making the problem seem insurmountable. Yet homelessness in Seattle/King County can be dramatically reduced even given the constraints of the existing housing market – with urgent and bold action.
As we have documented in our report, the community has invested resources in many programs and initiatives to address homelessness. However, there is a lack of clarity about how to balance investments and the design of system initiatives to achieve the greatest possible impact. The All Home Strategic Plan affirms a goal of making homelessness rare, brief, and non-recurrent – a bold step toward reducing homelessness – and included the analysis conducted by Focus Strategies as an action step for 2016. Yet the community is investing resources in efforts that are not aligned with these objectives and are making little, if any, impact on the numbers of people experiencing homelessness. There are an estimated 4,000 people living outdoors in Seattle/King County at any given time, some of them families with children and even more who are cycling in and out of emergency shelter. To make improvements, the system must systematically identify these households and prioritize them for housing assistance. The community has created an entity to oversee its homelessness efforts that is not fully empowered to make and implement decisions, which seems to result in many planning meetings and less action than needed.
The community’s elected and political leadership has recognized the urgency of homelessness and affirmed a need for a new approach to the problem. City of Seattle Mayor Murray recently noted:
“The U.S. Interagency Council on Homelessness has looked at how Seattle spends its money. For years,they have urged us to adopt an approach that is person-centered, uses data to invest in what works, and is aligned with our federal partners. But our City has been unable for decades to gather the political courage to make this shift.” “I will propose that we shift more resources toward diverting families and individuals from ever becoming homeless. We must shift from simply putting mats on the floor in shelters to funding services that move people out of shelters and into permanent housing. I will propose that we invest in providers that succeed in doing this.” 26
Focus Strategies’ data analysis is intended to provide a path to an action-oriented, data-driven, and person-centered solution. Our modeling shows that if the community is willing to take bold action, tremendous results can be achieved. This will require a high level commitment to executing business differently. All Home, the City of Seattle, King County, and the United Way of King County collaboratively commissioned this work with the intention of determining the potential impact of systems change; the results show a five-year path to dramatically reduce, and potentially functionally end homelessness. To achieve that goal, the work of creating a system out of an array of homeless programs must be completed. All initiatives and programs have to be understood and measured in relation to what they contribute to the overall goal of reducing the number of homeless households.
26 Homeless Investment Policy Framework, Fact Sheet, City of Seattle Human Services Department (HSD), 2016.

50 Seattle/King County Homeless Performance Assessment and Recommendations
V. Recommendations
2. Create a Homeless Crisis Response System Distinct from Anti-Poverty Efforts
To truly turn the curve towards a reduction in homelessness, the community has to reorient its approach towards a homeless crisis response and away from thinking that the way to end homelessness is to end poverty. Homeless crisis response is a relatively new way of thinking about addressing homelessness that considers the problem in terms of population dynamics: identifying people who have nowhere to live (living outside or in emergency shelter) and helping them secure a safe and stable housed situation as quickly as possible. As long as these households do not re-enter homelessness (go back to shelter or to being unsheltered) the system has achieved its objectives. While the homeless crisis response System may help families and individuals connect to other services and systems to address related needs (education, income, health, behavioral health, etc.), success is not measured based on whether households make changes in these other areas.
In stakeholder interviews and discussions, providers and funders in the Seattle/King County homeless system articulated a strong belief that homelessness cannot be reduced because the housing market is too challenging. Our assessment is that the cost to build and/or provide enough deeply affordable housing (in which households pay only 30% of income toward rent) for all homeless households is prohibitive and the timeline needed does not match the urgency of the crisis. Additionally, permanent affordability requires ongoing subsidies and turnover in units is very low, so these interventions are expensive and their impact on the size of the homeless population is negligible once the initial lease up is complete. Yet, available information indicates the majority of homeless people can be housed and will not return to homelessness even if they do not secure a permanent affordable unit. In other words, inexpensive and swift interventions such as rapid re-housing will end the crisis of homelessness for the majority of households.27 These households are not likely to exit poverty, but they generally will exit homelessness and not return.
Disentangling the homelessness crisis from the housing affordability crisis in Seattle/King County is critical to the community making progress towards ending homelessness. Many tens of thousands of people in the community are precariously housed and living in poverty.28 Few of them will ever become unsheltered or enter shelter. Strategies to stabilize households burdened by high rents and prevent gentrification and displacement are important to ensuring a healthy and vibrant community. However, it is important to keep in mind that these efforts are separate and distinct from homeless crisis response.
An important question to ask when developing and sizing solutions is, what problem are we trying to solve? Solving homelessness can be done without creating a new subsidized housing unit for each homeless household. It requires housing people quickly and strategically – including housing the highest shelter utilizers first, as the previous section details. The housing solution provided may not be a deeply subsidized, permanently affordable apartment, but the person will no longer be living outside or in a shelter. The profound housing affordability crisis in Seattle/King County is a different problem requiring different solutions, including making housing affordable to those who are rent burdened and at-risk of housing instability (this would include at a minimum people living below the poverty line in the community). Although not the subject of this report, solving that problem likely requires the development of tens of thousands of new housing units and also newly subsidized units. That challenge is massive and achieving it requires a level of resources far beyond the scope of the homeless system.
27 See Appendix 6 for citations on evidence of rapid re-housing effectiveness. Additional information can be found at www.focusstrategies.net/research. 28 The US Census reports 11.3% of people in King County live below the poverty line – more than 200,000 in a community of just over 2 million.

Seattle/King County Homeless Performance Assessment and Recommendations 51
V. Recommendations
When these two efforts are conflated, neither can be effective. Anti-homelessness efforts must respond as quickly and effectively as possible to the crisis of not having housing, while anti-poverty work is a matter of improving neighborhoods and providing pathways to a higher quality of life for people with low incomes. Homeless crisis response is not about helping homeless households gain self-sufficiency. Instead, it is about ensuring that no one has to spend even one night in a car or a tent, or cycle repeatedly in and out of emergency shelter. Homeless crisis response ensures everyone has somewhere to live, even if that means a housing situation that is not immediately the most stable or desirable setting.
B. LEADERSHIP, FUNDING, AND GOVERNANCE RECOMMENDATIONS
1. Establish a Funder-Driven and Person-Centered System
The Seattle/King County community is fortunate to have a wealth of highly experienced, expert providers of housing, shelter, and services for homeless people. There are also a multitude of engaged and involved stakeholders – local government, private funders, business interests, and others. Each hold an important role in the system and are expert in the work they do. Yet, this rich environment also presents a challenge – it can be very difficult to coordinate these entities and ensure all are working towards a shared set of key objectives.
In most publicly funded systems of care (health, public health, child welfare, for example), responsibility for designing and implementing a systematic response falls to local or state government entities. As stewards of public resources, these funders are responsible for ensuring the community’s resources are invested to achieve the greatest possible results. Use of data and evidence, performance measurement, strategic planning and evaluation provide the backbone for decision-making. Yet in the current homeless system, providers and other stakeholder are being asked to fill this role – providing input and, in many cases, making decisions about how and where resources will be invested and what policies will be in place to manage the system. This impedes the implementation of a systematic response. Providers cannot realistically be asked to separate their agency’s interests from the interests of the broader system, as these interests are not always aligned. Funders – the entities responsible for the system as a whole – must be the ones to set system level objectives, identify the strategies and interventions needed to achieve them, and decide what they will invest in.
It is critical that Seattle/King County’s homeless crisis response system shift to become more funder-driven and person-centered: all decision-making needs to be based on what will yield the greatest result for people who are unsheltered or cycling in and out of emergency shelter. Policies, programmatic initiatives, and investment strategies have to be shaped by this person-centered approach. In a system centered on homeless people, all interventions are designed to target and prioritize those who are unsheltered or living in shelters. Funders invest only in interventions that can be measurably demonstrated to move homeless people into housing and providers are held accountable for results. The effectiveness of the system is measured by the number of homeless people who are housed and do not subsequently return to homelessness. A person-centered system and a funder-driven system are the same thing, in the sense that the system is organized around the objective of housing each household presenting with a homeless crisis.
2. Create an Action-Oriented Governance Structure
This report includes recommendations about governance, as significant progress on reducing homelessness in Seattle/King County is unlikely to occur in the absence of a structure that can implement the recommended approach. As noted in our findings, the existing All Home governance structure is designed to solicit input, identify problems, and discuss solutions. It does not appear to be primarily designed to facilitate action. Local leadership has appointed All Home to serve as the community’s Continuum of Care and to oversee coordination and planning for homelessness-related activities more broadly. Yet, All Home does not have the authority to make and implement decisions, does not manage any funding streams, and does not manage

52 Seattle/King County Homeless Performance Assessment and Recommendations
V. Recommendations
system infrastructure (HMIS or coordinated entry). All Home is constrained by the extent of provider participation to set effective policies for program and system performance. It can convene but cannot make critical decisions, so leading significant changes may not be possible as currently structured.
While we recognize that the All Home governance structure has only recently been re-organized and that further change will be challenging, we are not clear on how the current All Home structure will facilitate or make the shifts needed to turn the curve from rising homelessness to decreasing and eventually reaching functionally zero homelessness. Systems change requires the input and expertise of all stakeholders; typically, successful, large-scale shifts are made when public agencies identify the changes needed and hold all stakeholders accountable for the use of public dollars.
Specific changes we recommend include:
1. Re-structure the All Home Executive Committee and designate it as the entity empowered to makeand implement decisions relating to design and implementation of the homeless crisis responsesystem. To make and implement decisions, the Executive Committee must be able to design andstructure funding and investment policies. The existing All Home governance charter specifies thatthe Executive Committee be made up of 10 members – the 2 co-chairs of the Coordinating Board andthe rest selected by the Council. No other requirements about membership are articulated. Westrongly advise that the Executive Committee consist only of funders and have designated seats for allthe entities that control funds specifically designated for homeless system purposes. Recommendedseats would include: City of Seattle Department Heads or deputies (e.g. HSD, City of Seattle Office ofHousing (OH)); King County Department heads or deputies (e.g. DCHS); the Seattle and King Countyhousing authorities, other jurisdictional representatives (e.g., other ESG, CDBG, HOME entitlementjurisdictions, communities that use local general funds for homelessness), VA medical center, majorprivate funders (e.g. United Way (UW), Gates, Raikes), and a State representative. The All HomeExecutive Director and deputies should staff the Executive Committee and be responsible forimplementing its decisions.
2. Re-define the purpose of the Funder Alignment Group to be the entity responsible for carrying outthe Executive Committee’s decisions in regards to investment strategies. The membership of thisgroup could be very similar to that of the Executive Committee (perhaps the same fundersrepresented, but done so by mid-level rather than executive level staff) plus additional philanthropicand corporate funders. The committee would be responsible for overseeing the issuing ofjoint/shared request for proposals (RFPs); evaluating proposals and recommending funding decisionsto the Executive Committee (as described above), and managing other funding processes thatsupport the All Home strategic plan.
3. Data, evaluation, and system infrastructure likewise needs to be directed by the Executive Committee.Currently, both CEA and HMIS sit within both DCHS and All Home, with some of the planning takingplace in All Home committees, yet staff and resources housed within DHCS. The County has recentlyhired a Director of Evaluation and added two full-time evaluation staff for homeless services, whichwill substantially increase the department’s analytic capacity. We would recommend that these dataand evaluation functions be shifted to come under the All Home structure and their work directed bythe Executive Committee. The HMIS system needs to be structured to provide the ExecutiveCommittee with high quality analytic expertise – the ability to gather and analyze the data needed toinform decision-making (see below for more on data recommendations). Similarly, the design andimplementation of coordinated entry is a critical element of the homeless crisis response system thatensures system resources are being appropriately targeted. Governance and management of the CEAshould be under the purview of the Executive Committee and its staff pulled inside of All Home.

Seattle/King County Homeless Performance Assessment and Recommendations 53
V. Recommendations
4. To the extent there are other governance structures besides the All Home set of committees, theseneed to be pulled into the All Home structure and roles and responsibilities clarified.
5. We advise that All Home continue to convene the Coordinating Board and topic area work groups asthe community’s structure for soliciting input and helping to shape program design andimplementation. Clarify that the role of these groups is input and advice rather than decision-making.
3. Data-Informed Funding Processes
In recent years, public and private funders in Seattle/King County have made significant strides towards aligning funding efforts, including convening a funder alignment group and issuing shared RFPs. However, funding processes are still complex, and timelines and objectives are not as strongly coordinated as would be most useful. Some funding processes take place within the All Home structure and others do not. Much faster progress can be made to reduce homelessness if all funders can agree on a shared set of objectives and performance targets that are developed by reviewing current performance data and charting progress on the goals and recommendations commissioned by the funders. In addition, performance-based contracting should be common practice. The current CoC performance targets were set based on current performance with very modest, incremental targets developed with providers. In coordination with the client group overseeing this project, we developed and have provided a set of minimum and target standards that should be used to establish new targets. Given the urgency of the problem of homelessness, it is imperative the community not spend precious resources on interventions that have little impact. The climate must be one in which positive results are rewarded, and all funding requests and decisions are made with three primary criteria: (1) ability to perform; (2) financial and administrative capacity to be a good steward of funds; and (3) ability to demonstrate program design matches system objectives and principles and are grounded in evidence based and best practices. The whole system has to shift to an orientation in which it is acceptable for some providers to lose funding. Reallocating funds from low performing programs to high performing programs and evidence based models is an important stewardship function for public agencies to ensure that system objectives are prioritized over the needs or concerns of a particular program or agency.
4. Data Analysis Capacity
Currently, the All Home structure includes several individuals and committees who are working on data analysis and interpretation, but a gap between what is needed, what can be produced, and what is prioritized appears to exist. Having access to accurate and meaningful data is key to any system change initiative. Currently, data quality is very poor in some areas, some providers are not required to collect and input information into HMIS, and the ability to generate data and analysis that is useful and accurate at a system level is very low. As a general matter, data quality improvement initiatives can decrease the rate of unknown exit destinations (and prior living situations), which will help make the impact of systems changes known.
The community recently selected a new HMIS vendor (Clarity), hired a system administrator (BitFocus) and expanded data and evaluation staffing for homeless services within DCHS. These changes will likely help address some of the data quality and collection problems that exist as well as bolstering analytic capacity. We also understand there are plans to continue building data and evaluation capacity in the homeless system. As this process moves forward, we would encourage the client group to consider the following recommendations. For the data produced in HMIS to be useful, funders and planners need to know what questions to ask. The analytic staff must have the expertise to frame the questions within the existing data framework, and then to extract, analyze, and summarize the data in a way that helps funders understand answers and use that information to chart a path forward. As an example, staff must regularly generate updated analysis of project and system performance and present this information in a way that system leadership and funders can use to make investment decisions. We strongly encourage the funders to ensure

54 Seattle/King County Homeless Performance Assessment and Recommendations
V. Recommendations
the new HMIS system is adequately staffed and includes individuals with strong, relevant public speaking and communication skills, as well as data management and analysis expertise. We recommend that staff have deep experience with managing databases; facilitating data quality improvement activities; analytic strategies; developing, producing and presenting reports for audiences that vary in their level of expertise; translating data findings into useful recommendations; knowledge of homeless programs in general, but particularly in the community; and a working knowledge of performance and outcome measures. Finally, the HMIS team should be housed within All Home and support the work of the Executive Committee and Funder Alignment Committee. The lead HMIS staff person should be at a deputy level to the All Home Director. A helpful and useful role for the existing data and evaluation committee would be helping the All Home staff to set the data analysis agenda based on the system objectives established by the Executive Committee.
C. SYSTEM PERFORMANCE IMPROVEMENT RECOMMENDATIONS 1. Use Outreach and Coordinated Entry to Target and Prioritize Unsheltered People
As noted in our performance analysis, there are a significant number of households entering homeless programs in Seattle/King County who are not literally homeless. Many are housed or doubled up but assessed as being at-risk of homelessness. This means system capacity to serve people who are unsheltered is diverted away from solving homelessness. At the same time, while data quality is poor for this group, our analysis of single adult data reveals a significant number of long-term shelter stayers who may be “stuck” in temporary crisis beds and not effectively being connected to housing. To make greater progress on ending homelessness, the Coordinate Entry for All (CEA) must aggressively target and prioritize these groups for assistance.
While All Home and King County are making strong progress in the design and implementation of CEA, including a re-tooling of the existing Family Homeless Connection (FHC) and Youth Housing Connection (YHC), we recommend some re-thinking and course correction to ensure coordinated entry is fully supporting the overall goal of reducing the numbers of households who are literally homeless (unsheltered and living in shelter) and speeding their entry into housing:
• Given the large numbers of currently unsheltered households (people in encampments and vehicles),a key role of the CEA must be to identify and prioritize these households for housing, which shouldinvolve a strong outreach and engagement component. There are already a number of initiativesunderway to expand and re-tool existing outreach. As this work unfolds, we recommend that alloutreach teams be focused on: (1) identifying unsheltered single adults and families; and (2)assertively connecting them to shelter and housing. Existing health and mental health outreach teamsare not very housing-focused nor coordinated, so one option could be to supplement these teamswith CEA staff or housing specialists. We suggest creating specialized outreach teams (or retoolingexisting teams) to achieve these objectives. For example, outreach teams could be tasked withengaging and housing the 75 unsheltered households on the by-name list that have been homelessthe longest. A family team should be tasked with ending unsheltered family homelessness within afixed period of time; six months is likely appropriate given the relatively small number of unshelteredhouseholds compared with the inventory available to families. After appropriate engagement, thesefamilies can be prioritized for existing shelter and housing opportunities.
• CEA currently requires any household to be literally homeless (unsheltered or living in shelter) to beassisted. This is an excellent policy decision and ensures that the homeless system is stronglyprioritizing based on acuity of housing situation. However, at present the CEA is not managing accessinto single adult shelters or youth/young adult shelters, which means people who are not literally

Seattle/King County Homeless Performance Assessment and Recommendations 55
V. Recommendations
homeless and could be diverted are continuing to access shelter and then can be prioritized for housing. We are aware that plans are in motion to integrate shelters for single adults and youth into CEA and we strongly support doing so as rapidly as possible (along with implementing shelter diversion for all households seeking shelter (see below). Family shelters are already integrated into CEA. (See below for additional recommendations relating to family shelter access).
• The CEA is using the VI-SPDAT to prioritize access to housing (transitional, rapid re-housing andpermanent supportive housing) based on a vulnerability assessment, rather than by length of time ahousehold has been homeless. Our modeling indicates this will limit the CEA’s ability to help thecommunity reduce unsheltered homelessness and long-term shelter use. Vulnerability and length oftime homeless are not always correlated. Some households, who have only recently becomehomeless or who may not even yet be unsheltered (e.g. doubled up), might score high on avulnerability tool, while others who have been homeless for years yet do not have acute health orbehavioral health issues could score lower. To maximize the system’s ability to reduce the numbers ofliterally homeless people in King County, prioritization should be based on length of time homeless.
• A related issue is the current methodology for prioritizing access to family shelter beds. Currently,families must come through one of the RAPs and go through the CEA process to access shelter.Shelter beds are prioritized for families who are unsheltered. However, in determining which familiesto assist from among those who are unsheltered, the current system is to use the F-VISPDAT andprioritize based on vulnerability score. This tool was not designed for this purpose -- it is intended tomatch households to housing interventions; not determine whether they need emergency shelter. Itassesses a range of factors, many of which are not directly related to the household’s immediateneed for emergency sheltering. The result has been that there are unsheltered families with infantsand young children who do not score high enough to secure a shelter bed. We strongly recommendadopting a policy that all unsheltered families will be sheltered. Given the existing inventory and thepolicy changes that have been made about prioritizing unsheltered people, having no unshelteredfamilies is an achievable goal within the first year.
• The existing CEA uses a “banded” approach to prioritizing households for housing interventions.Households are assigned to one of three bands based on their vulnerability score and this determineswhat type of housing they are referred to. We understand the basis for the decision to use a“banded” approach to prioritization – and particularly the concerns about households with highneeds receiving referrals to housing units that housing providers are concerned are not sufficientlyservice-rich to successfully serve them. However, there are significant drawbacks to bandedprioritization – namely, households identified for the top band will become stuck on a waiting list, dueto the lack of permanent supportive housing; while people with lower needs will be served ahead ofthem in lower intensity interventions (e.g. rapid re-housing; other permanent housing, etc.). Toaddress this design issue, we would strongly recommend that the bands have some permeability, sothere are opportunities for people with high needs to access lower intensity interventions ifappropriate. Also, it is imperative to work with all housing programs to remove any non-funderrequired eligibility criteria and ensure higher need households are able to access availableinterventions to the maximum extent possible. Performance-based contracting should incorporate ameasure that 100% of referrals from CEA must be accepted, provided they meet eligibility criteria.For youth/young adult programs, until CEA includes those programs, the appropriate measure isentries from unsheltered living situations.
• Moving households quickly from CEA into shelter and then into permanent housing will requireimplementation of many of the strategies described in the rest of this section:

56 Seattle/King County Homeless Performance Assessment and Recommendations
V. Recommendations
Attempting shelter diversion with all households seeking shelter;
Bringing rapid re-housing to scale and ensuring people living in shelter have prioritized accessto this intervention will rapidly increase the rate of movement from CEA to permanenthousing for the majority of homeless households; and
Implementing “moving on” strategies to free up permanent supportive housing capacity andtargeting regular affordable housing units for unsheltered homeless people will help speed theflow of chronically homeless and high-need unsheltered people from CEA directly intohousing.
2. Expand Shelter Diversion/More Effective Targeting of Prevention Resources
As noted above, the number of people entering shelter and transitional housing who are doubled-up or otherwise housed is significant. As part of CEA, shelter diversion is offered to families and youth based on their VI-SPDAT score (only those with a particular score range are considered for diversion). Diversion for single adults is also planned to roll out as part of CEA, using the same approach.
To maximize the use of homeless system resources for people who are unsheltered, we recommend that shelter diversion must be attempted for all households seeking shelter (regardless of circumstances or assessment score). Communities that have adopted a “diversion for all” approach have found upwards of 60% of people seeking shelter can be diverted.29 The All Home Strategic Plan identifies homelessness prevention as a key strategy. The City of Seattle has allocated significant funds to prevention and King County is implementing new prevention programming through the Best Starts for Kids Levy. However, these funds will not have any impact on the size of the homeless population unless they are well targeted. Traditional prevention generally targets households who have their own rental unit and have received an eviction notice. Yet, there exists scant evidence that any of these households would actually enter shelter or become unsheltered without assistance. To ensure prevention dollars are actually and effectively preventing homelessness, they must be targeted to households that are seeking shelter and who are assessed as at imminent risk (one to two days) from becoming unsheltered. Many of these will be doubled up households who do not have their own lease and require some mediation, problem solving, and one-time financial assistance to remain where they are staying (typically with friends or family) or move directly to other housing. This prevents unnecessary entry into shelter and frees up capacity for those who are already unsheltered.
The number of shelter beds in the community has been expanding in recent years, as has the number of sheltered people. In some cases, shelters are overcrowded and filled to capacity. As a result, the community is understandably engaged in a conversation about whether to expand shelter capacity or set up more legalized campgrounds and safe parking lots. However, our modeling suggests that the system does not need more shelter capacity as long as emergency shelters limit admission to unsheltered persons, and CEA and shelter diversion are effectively implemented. Modeling results show that, with this change to prioritizing unsheltered households, all currently unsheltered homeless people can be sheltered with the existing inventory within one year. Further, the shelter inventory could begin to decrease on the family side after one year and
29 Your Way Home in Montgomery County, PA has a 60% diversion rate for single adults and 70% for families. http://yourwayhome.org/sites/default/files/downloads/Diversion%20Dashboard%20July%202015.pdf. Many other communities are diverting 20-30% of households.

Seattle/King County Homeless Performance Assessment and Recommendations 57
V. Recommendations
the single adult side after four years. This may seem counter-intuitive given the expanding demand for shelter. However, given how the homeless system is current configured, it is not possible for funders to accurately gauge the need for shelter because households seeking shelter are presumptively assumed to need shelter and shelter diversion for all is not in place. Many of the people currently entering shelter are experiencing an immediate housing crisis that can be resolved without shelter entry, if the system were oriented towards shelter diversion and shelter is viewed only as an option of last resort. This also requires staff trained in diversion, who are strong problem solvers and understand that their goal is to figure out safe, feasible housing alternatives for people seeking shelter.
3. Improve Effectiveness of Shelter in Exiting People to Permanent Housing
As noted in the performance analysis and the analysis of single adult shelter usage, the emergency shelter system in Seattle/King County does not perform to maximum effectiveness. Our modeling shows that significant reductions in homelessness could be achieved if shelters reduced lengths of stay and increased the rate of exit to permanent housing. One key strategy for accomplishing this will involve bringing rapid re-housing to scale and connecting it to shelter, so that those households in shelter beds have a rapid pathway to exit. (See Recommendation 4, below). Shelters also need to be required to meet performance targets and re-orient their work to focus on helping people exit to permanent housing as quickly as possible. We also found that there appears to be just under 5,000 people who are long-term shelter users (2 or more stays per year, or stays of 7 months or more). These individuals are using a substantial amount of shelter capacity and successfully housing them will create significant opportunities to improve system through-put. Making the long term shelter stayers (LTSS) initiative feasible will require ensuring there are a range of housing options available for this population, as they may not all require or be eligible for PSH. The Hennepin County Top 51 pilot, which identified the top 51 users of shelter beds in their single adult system, points to some important learnings in this regard. An interesting finding in this work was that, contrary to what was expected, many of these long-term stayers were not high utilizers of other systems and did not score highly in vulnerability assessments. Yet, they were responsible for a very large number of shelter bed nights and housing them freed up significant shelter capacity. In Hennepin, about one-third of the long-term stayers were not eligible for permanent supportive housing and only needed permanently affordable units. Seattle/King County currently has a long term shelter stayers (LTSS) initiative. While we have not explored this effort in depth, we understand the program targets long term stayers who are also assessed as highly vulnerable. We would advise re-thinking and re-tooling this program to focus on top shelter users, regardless of vulnerability or disability. We understand this may mean a change or addition in funding source(s) or creation of a new effort to achieve this objective. This overall initiative to address LTSS needs to be broadened to offer individualized housing problem solving and a wide range of housing options – some of these individuals may need permanent supportive housing, but it is likely some can be assisted with a Housing Choice Voucher (HCV) and some low intensity service connections. Some might even be housed using rapid re-housing and Critical Time Intervention (see recommendation below). Housing people who are high users is essential to systems change because these households use a disproportionate amount of the beds and other resources available; housing them creates significant capacity to serve unsheltered households.
4. Invest in More Effective Interventions: Expand Rapid Re-Housing & Eliminate Low PerformingTransitional Housing, Permanent Supportive Housing and Other Permanent Housing
As noted in our performance assessment, Seattle/King County currently invests significant resources in interventions that are not achieving strong results on the key measures that assess progress in rapidly moving homeless households into housing in a cost effective manner. To make faster progress, we recommend investing in intervention types that are high performing, while disinvesting in those that are less effective.

58 Seattle/King County Homeless Performance Assessment and Recommendations
V. Recommendations
This includes bringing rapid re-housing to scale and cutting back investment in lower performing transitional housing, permanent supportive housing, and other permanent housing (OPH).
4a. Bring Rapid Re-Housing (RRH) to Scale:
As a significant, positive step toward increasing the availability of RRH, All Home reallocated transitional housing dollars to RRH in the 2015 Continuum of Care federal application. This is particularly positive, given that we are aware that some in the local community are skeptical about RRH as an intervention type. There are concerns that the high costs of rental housing in the region make it difficult for households to sustain their rent after the short-term RRH subsidies end. Indeed, local results show RRH is not performing as well in Seattle/King County as in other communities. However, the dataset analyzed by Focus Strategies included only smaller and less effective programs and excluded SSVF and other more recent RRH implementations. Even with this limited dataset, RRH in Seattle/King County was demonstrated to be three times more cost effective than transitional housing.
Stakeholders requested a scan of innovative practices in other parts of the country to house, in particular, single adults experiencing homelessness. Based on that work (see Appendix 4) along with the performance results from local RRH programs noted previously, we recommend that Seattle/King County continue working to bring RRH to scale as an exit strategy from homelessness that is likely to work for most households experiencing homelessness. As discussed in the general recommendations, RRH is not an intervention that addresses household poverty or provides households with the kind of deep rental assistance they may need to gain long-term stability and self-sufficiency. Yet evidence shows that for many households, it is an effective strategy that successfully helps them exit homelessness and not return.
Given the high rents and low vacancy rates throughout Seattle and King County, the success of RRH will hinge upon the ability of funder and provider leadership to embrace this model and implement RRH best practices aggressively. Landlord partnerships championed by leadership; innovative and adaptable program designs; and a laser focus on the minimum assistance needed to resolve the homelessness will all be important to meet success. The re-tooled Landlord Liaison/Housing Locator Project is an excellent step in this direction. Additionally, RRH will not create new stock in the housing market; the units available in the market will be the units available to RRH clients. In other words, shared housing, rooming houses, and other housing often considered less desirable will need to be used, and used at scale. Housing options outside King County may need to be explored. While standards must be maintained (not housing people in units that are uninhabitable), those standards need to be limited to health, safety, and client choice.
Households that receive RRH assistance may continue to experience rent burdens, may move repeatedly, or may end up having to share their rental unit to make ends meet. However, they are unlikely to return to being unsheltered or to re-enter shelter. Given the urgent state of homelessness in Seattle/King County, where more than 4,000 people are living outdoors, RRH offers a proven – though imperfect – solution. The alternative is to wait until more permanently affordable housing is produced, which means indefinitely prolonging the time that people are continuing to live in encampments, vehicles, and shelters. This ultimately would mean the community is choosing to maintain the emergency state that currently exists. RRH offers a reasonable expectation that the community can turn the curve from annual increases in unsheltered homelessness to decreases and, ultimately, a homeless crisis response system.
In our modeling, we have identified about $11 million in funding that can be shifted from low- and medium performing transitional housing to create new rapid re-housing paired with CTI for long-term shelter stayers. We estimate an additional $9.4 million would be needed in the first year, but then cost avoidance and/or savings is anticipated over current expenditures. The new infusion of funds is needed to obtain sufficient RRH

Seattle/King County Homeless Performance Assessment and Recommendations 59
V. Recommendations
capacity for the rest of the homeless households in the system. Our modeling is based on assuming an increase over the current cost for RRH in the community, because these costs are low on average and are likely to rise with the rental market. Costs should be analyzed on an ongoing basis and funding prioritized for the most cost-efficient RRH programs.
The modeling section of this report offers some options for raising some of those funds; for example, reallocating low performing PSH to RRH. However, we also understand that other funding sources may be available or possible, particularly on a one-time basis. Conceptually, it is important to note that facilitating these shifts includes preserving some emergency shelter capacity in the short run while RRH is increased to scale. In future years, emergency shelter investments can be reduced if all recommendations are implemented and the macroeconomic and contextual environment remains similar through the modeled years.
Specific rapid rehousing recommendations include:
• Align all RRH programs with the recently issued programmatic standards published by the NationalAlliance to End Homelessness (NAEH), including ensuring that programs do not screen out highneed/high barriers households (those with no incomes, poor rental histories, disabilities), providerobust landlord recruitment and housing navigation assistance, and offer rental assistance using aprogressive engagement model.
• Explore pairing RRH with Critical Time Intervention along the lines of what has been piloted inMontgomery County, PA. (See Appendix 4).
• Support client choice. RRH programs should not limit clients’ housing options based on unrealisticexpectations about the percent of income they should pay for rent, the types of neighborhoods theyshould live in, or even whether they wish to remain in Seattle/King County. RRH is not an anti-povertyprogram, so households may pay a significant portion of their income for rent if it makes thedifference between being unsheltered and being housed. Households should have the option ofsharing units if that makes their rental budget stretch further. Clients should also have the option tomove to areas where housing is cheaper. In some high cost communities, RRH clients have to moveout of county to secure affordable apartments.30 While this may not be an option for all householdsand should only be supported if it aligns with the client’s wishes, some may prefer to move outside ofKing County if it means they no longer have to live in a shelter. While this may feel unsatisfying toproviders and runs contrary to community goals relating to diversity and combatting gentrificationand displacement, the alternative is leaving families and individuals with long stays in shelters or livingin tents or sleeping in cars.
4b. Reallocate Low Performing Transitional Housing and Permanent Housing
As noted in our performance assessment, Seattle/King County is investing in a number of programs that do not meet minimal expectations, in terms of serving unsheltered people and helping them exit swiftly to permanent housing. Among the different intervention types, transitional housing for single adults, PSH for families, and “other permanent housing” were particularly low performing. We would advise the community to limit investment in these interventions only to those programs that show very strong performance and shift those resources to more effective uses.
30 In San Francisco, where rents are extremely high, it is common practice for RRH programs to assist families to re-locate upwards of 60 miles from the City to other counties where rents are lower.

60 Seattle/King County Homeless Performance Assessment and Recommendations
V. Recommendations
Specific recommendations include:
• Single adult transitional housing programs that are low and moderately performing should no longer be funded. In our modeling, we have designated all low and medium performing transitional housing for re-allocation, freeing up more than $15 million. Approximately $11 million is available for new rapid re-housing paired with Critical Time Intervention (CTI) and specifically targeted to long-term shelter stayers. Options for reuse of the existing facilities include conversion to permanent supportive housing, rooming houses/shared living or “preferred AH” (affordable housing targeted to homeless people).
• Permanent supportive housing is one of the most expensive interventions in the homeless system
and should be reserved for those chronically homeless households that cannot be housed in lower intensity interventions. Given the relatively low number of chronically homeless families in Seattle/King County and the even smaller numbers that need intensive, wrap-around behavioral health services, we question the need for PSH for families. While most families can benefit from long-term deep rental subsidies (i.e. Housing Choice Vouchers), the vast majority of homeless families can be successfully housed using RRH and will not return to homelessness. PSH and “preferred AH” should be offered to families only if RRH has been attempted unsuccessfully or the families meet chronic homeless criteria and have high service needs. While we have not modeled the impact of shifting resources from PSH for families to other interventions, it is likely significant results could be achieved if some of these funds were reprogrammed for RRH. Families currently in PSH who are stable could be targeted for a Moving On initiative. As an estimate, the current investment in PSH for families is $2 million annually, which serves only a few new households each year. By comparison, $2 million in RRH would serve 200 households each year with the same level of investment.
• As noted in our analysis, much of the inventory of Other Permanent Housing (OPH) appears to not be
targeted to house currently homeless people and is otherwise underperforming. As best we can determine, it does not serve homeless people with the highest needs and has relatively high costs. For the same investment, these funds could serve more households using a rapid re-housing approach or be used in specialized circumstances – for example, when a household returns to homelessness after being in RRH program (see Recommendation 5 in this section). We would advise that the community evaluate each OPH project and only continue investing homeless system funds in those that serve unsheltered homeless people at a reasonable cost. The rest should be funded using other system dollars (e.g. affordable housing) and not be considered part of homeless crisis response.
5. More Strategic Use of Permanent Affordable Housing to Provide Pathways out of Homelessness The rental market in Seattle/King County is incredibly challenging, with low vacancy rates and extremely high rents. Continuing efforts to expand the supply of deeply affordable housing are critical if the community is to meet its goals for continued economic and racial diversity and to be a welcoming place for lower income families and individuals. However, expanded affordable housing is not a precondition for reducing homelessness. The community has to commit to making an impact on the problem with the existing housing inventory or there may never be a significant reduction. Waiting for enough housing to be produced means continuing to tolerate the current situation in which thousands of people, including some families with children, are living on the streets and in tents. Other technical assistance work currently underway in the community is exploring ways to improve the utilization of the community’s existing affordable housing inventory; in particular, Barbara Poppe & Associates (BPA) is developing a recommended investment strategy for the City of Seattle. Our report is not designed to

Seattle/King County Homeless Performance Assessment and Recommendations 61
V. Recommendations
provide comprehensive recommendations on the affordable housing inventory; but we make the following specific suggestions for strategies that will help speed the movement of homeless people into mainstream permanently affordable housing: • Targeting of Affordable Housing from a Systems Perspective. There are many households in the
community that can benefit from more affordable housing. Deep housing subsidies create a platform for household income to grow and adults and children to thrive. Many low income households will struggle with rent burdens and this has a variety of negative impacts, but few will ever enter shelter. Yet for the relatively small number of people who have fallen into unsheltered homelessness and/or have spent significant time living in emergency shelter and for whom rapid re-housing is not effective, access to permanently affordable housing may be the only way they can exit from homelessness. For this reason, we would strongly advise Seattle/King County to survey the existing affordable housing landscape and identify strategies to aggressively target available affordable housing (including Housing Authority vouchers and public housing, and non-profit owned affordable developments) to homeless people identified through CEA for whom there is no other way they will ever be housed. This will ensure that these precious affordable units are being put to their highest and best use and will help reduce the numbers of long-term homeless people in the community.
• Remove Entry Barriers. Related to the above, funders of affordable housing must insist that providers not impose barriers to serving homeless and chronically homeless people who otherwise meet eligibility criteria. Our limited survey of the available inventory suggests that there are some non-profit, subsidized affordable housing units that are more difficult to access than private market units. These units are funded with public dollars; some solutions might include revisiting existing screening policies or amending regulatory agreements. This is an area of work that would benefit from implementation of the governance recommendations discussed previously.
• Moving On Initiatives. As previously mentioned, there is an urgent need to free up capacity in existing permanent supportive housing units to serve the large numbers of unsheltered homeless people and long-term shelter stayers. We recommend a large-scale “moving on” initiative to help PSH tenants who are stable and no longer need intensive support to transition to mainstream permanent housing whenever possible. Our modeling assumes a 25% turnover of the PSH inventory, which would free up 105 units for families and 1,056 units for single adults over a period of four years. There are a variety of ways this can be accomplished, most of which will require partnership with the two Public Housing Authorities (PHAs) to maximize use of available HCV and MTW voucher authority to help tenants transition out of PSH. This would not involve new resources, but rather a different approach to targeting the units that turn over in the existing HCV and MTW programs. The most streamlined approach will be to transition tenants who have tenant-based Shelter Plus Care (S+C) or other voucher source into the HCV program, which means they can stay in place but their S+C subsidy is freed up for another client. See Appendix 12 for more details on the Moving On approach background, principles, and practices.
6. Subpopulation Recommendations
Seattle/King County has significant numbers of homeless youth/young adults and Veterans. All Home has developed a population-specific strategic plan for youth and there is an initiative to end Veteran homelessness underway in the community through the 25 Cities Challenge.
Data collected for our performance analysis and modeling did not allow us to separately analyze results for these populations. However, our recommendations for the overall system are applicable for youth and Veterans. As with other populations, the community needs a systematic response to youth and Veterans

62 Seattle/King County Homeless Performance Assessment and Recommendations
V. Recommendations
homelessness in which strong shelter diversion helps keep these households from entering the system and those with the longest histories of homelessness are prioritized for assistance, including the use of “by name” lists. We do not have data available to evaluate whether there are enough resources invested to serve these populations. However, they are included in our general estimates about what funding is needed to reach functionally zero homeless people. We recommend additional performance analysis for youth/young adult shelters and other specialized interventions that is comparable to the overall SWAP analysis.
D. INVESTMENTS OVER FIVE YEARS
The next table summarizes the results of the modeling and the recommendations we have made over a five year time line, with funding implications for each of the five years. These are the key investment shifts that we are recommending to make a significant impact on the numbers of people experiencing homelessness in Seattle/King County. These figures assume that the system design, performance improvements, and funding reallocations are made in accordance with the modeling targets described in Section IV.A. In summary, we recommend:
• Investing $1 million each year over five years for system planning – high level analytic capacity, system planning and evaluation, technical assistance to make recommended changes, and provider training;
• Activities proposed for the first year will require an additional one-time investment of $9.4 million,
after which system costs will decrease year over year; and
• Disinvesting in shelter and reinvestment in rapid re-housing and affordable housing can begin after 1 year for families and after 3 to 4 years for singles.
Refer to the table on the next page for more details.

Seattle/King County Homeless Performance Assessment and Recommendations 63
V. Recommendations
Intervention Adults Families Year 1 Annual Net Change
Year 2 Annual Net
Change
Year 3 Annual Net
Change
Year 4 Annual Net
Change
Year 5+ Annual Net
Change
Diversion Re-invest funds for eviction prevention into targeted shelter diversion for both adults and families
Data not collected as part of this report – these resources must be re-tooled as homeless system dollars.
Emergency Shelter
As long-term and frequent stayers are housed, begin to reallocate shelter funds proportional to bed days they use. Current total funding is $14,220,754 and 74% of bed days used by targeted population. Housing long-term stayers will result in an additional $2,630,840 available to reallocate annually for 4 years for a total of $10,523,358
Estimated that families will be housed after a single year. Decreasing shelter capacity by 1/3 is a conservative goal for reaching capacity. Current total funding is $5,906,392. Result is an estimated $1,949,109 available to reallocate annually
4,579,949 7,210,789 9,841,629 12,472,469 12,472,469
Transitional Housing
Reallocate $10,451,359 from low and moderately performing TH to Adult RRH+CTI.
Reallocate $5,009,805 from low and moderately performing TH to Family RRH and $420,000 from low and moderately performing TH to Adult RRH+CTI
15,881,164 15,881,164 15,881,164 15,881,164 15,881,164
Rapid Re-Housing
Use $14,220,000 in annual funds for RRH for existing adults for four years then use $6,600,00 in ongoing funds to house people new to homelessness
Reallocate $5,009,805 from low and moderately performing TH to Family RRH for the first year. Assume 25% of 800 newly entering families are diverted and 20% of remainder self-resolve. Ongoing RRH needed for 480 families is $4,800,000
(19,229,805) (11,400,000) (11,400,000) (11,400,000) (11,400,000)

64 Seattle/King County Homeless Performance Assessment and Recommendations
V. Recommendations
RRH+CTI
Reallocate $10,451,359 from low and moderately performing Adult TH and $420,000 from low and moderately performing family TH to Adult RRH+CTI to house long-term and frequent shelter stayers
(10,871,359) (10,871,359) (10,871,359) (10,871,359) 0
PSH
Given the need for resources and urgency of the crisis, consider reallocating low performing programs andperhaps the lowest performing of the moderate programs. Low Performing: $1,223,569 Moderate: $31,701,462
Consider reallocating 1 or 2 of these 3 programs. All Moderate: $2,089,279
1,223,569 1,223,569 1,223,569 1,223,569 1,223,569
OPH
AH/King County is encouraged to conduct thoughtful analysis about extent to which these programs are appropriate programs that pull their weight in reducing homelessness; likelihood that many will be appropriate for reallocation orreclassification. Current funding $2,051,569 for single adult unit and $930,701 for families.
System Planning and Data Analysis Investments (1,000,000) (1,000,000) (1,000,000) (1,000,000) (1,000,000) Total Funding Difference Over Five Years (9,416,482) 1,044,163 3,675,003 6,305,843 17,177,202
*The recommended Moving On Initiative would not require new funding or a change of how funds are used, so is not included in this table. Effectively implementing Moving On requiresthat existing affordable housing resources be targeted to those leaving PSH; and PSH units that are vacated are targeted to highest need chronically homeless individuals and LTSS.

Seattle/King County Homeless Performance Assessment and Recommendations A-1
Appendices
APPENDIX 1: GLOSSARY Term Acronym Definition
Affordable Housing AH
According to the Department of Housing and Urban Development, affordable housing is a locality’s supply of housing that is affordable, based on a number of factors including income and the area’s median rental costs. Typically, this is housing where a tenant pays no more than 30 % of their income towards housing costs, which includes utilities. Some jurisdictions may define affordable housing based on other guidelines, determined locally.
Base Year Calculator BYC
The BYC is an element of Focus Strategies SWAP suite of tools. It assembles data from a community’s Housing Inventory Count (HIC); HMIS data; and program budget data to create a “base year” of performance data from which to begin modeling. Outputs of the BYC include a project-by-project evaluation of HMIS data quality and project level performance measures.
Client Group N/A
Over the course of the project, Focus Strategies held regular discussions with representatives of the client group to gather information, discuss our preliminary findings, and explore the implications of results. The client group, as it pertains to this report, includes staff members from All Home, King County, United Way of King County, and the City of Seattle.
Continuum of Care CoC
A federal grant program for targeted homeless activities, including transitional housing, rapid re-housing and permanent supportive housing. Administered locally by a non-profit or governmental lead agency and overseen by CoC governing body or board. In Seattle/King County the CoC Lead Agency is All Home. A Continuum of Care (CoC) also refers to the overall system of shelter, housing and services available in a community to assist homeless people.
Critical Time Intervention CTI
Critical Time Intervention (CTI) is a time-limited evidence-based practice that mobilizes support for vulnerable individuals during periods of transition, facilitating community integration and continuity of care. CTI uses a phased approach lasting nine months, comprised of three 3-month phases focused on Transition, Trying-Out, and Transition of Care. CTI was traditionally used to assist persons making a transition to community living from shelter, hospital, or other institutional setting. However, in recent years, communities have been pairing or adapting the CTI model to additional forms of housing and cross-sector coordination.
Coordinated Entry System, or Coordinated Entry for All
CES/ CEA
CES is a standardized and streamlined process for entry into the homeless system and for matching households experiencing homelessness with appropriate housing on a system-level. In Seattle/King County the CES is called Coordinated Entry for All (CEA).
Diversion N/A
Diversion is a practice of targeted prevention aimed specifically at those individuals and families who are seeking shelter. It is a strategy that aims to prevent entry into emergency shelter by helping households identify immediate alternate housing

A-2 Seattle/King County Homeless Performance Assessment and Recommendations
Appendices
arrangements through problem solving, mediation and in some cases small amounts of direct financial assistance. Diversion programs aim to reduce the number of people entering homelessness, the demand for shelter beds, and the size of program wait lists.
Entry Barriers N/A Entry barriers are any restrictions or limitations in place that limit housing and/or services to homeless and chronically homeless people who otherwise meet eligibility criteria.
Homeless Emergency Assistance and Rapid Transition to Housing Act
HEARTH Act
The HEARTH Act was signed into law by President Obama in 2009 and amends and reauthorizes the McKinney-Vento Homeless Assistance Act with substantial changes, including:
• A consolidation of HUD's competitive grant programs• The creation of a Rural Housing Stability Assistance
Program• A change in HUD's definition of homelessness and chronic
homelessness• A simplified match requirement• An increase in prevention resources• An increase in emphasis on performance.
Housing Choice Voucher HCV
Formerly known as the Section 8 Program, the HCV Program is a federal housing assistance program overseen by HUD, providing tenant-based rental assistance to eligible households. The household pays 30% of their income towards rent and the program makes up the difference between the tenant portion and the unit rent. HCV programs are administered by Public Housing Authorities (PHAs). In Seattle/King County there are two PHAs: the Seattle Housing Authority (SHA) and King County Housing Authority (KCHA). SHA and KCHA both have a Moving-to-Work (MTW) Agreement with HUD which allows them to develop policies that are outside the limitations of certain HUD regulations and provides flexibility in how the HCV program is administered.
Housing Inventory Count HIC
A community’s HIC is an inventory of housing conducted annually during the last ten days in January. HUD requires CoCs to compile and submit the HIC. The HIC reports the quantity of beds and units available on the night of the count by program type, including PSH and beds dedicated to serving those who are homeless/chronically homeless.
Homeless Crisis Response System or Housing Crisis Resolution System
N/A
A homeless crisis response system responds to the needs of all people who are without housing in a given community. To be effective, the homeless crisis response system must provide an appropriate response to everyone who needs it, especially those with the greatest needs. It must not screen out from assistance anyone experiencing literal homelessness – that is, living outside, on the streets, or in shelter. This also means limited system resources must not be used to serve people more appropriately served elsewhere. In other words, the system must target and prioritize. In a homeless crisis response system, all of the parts of the system work together toward a common goal. Every actor in the system, regardless of the role they play, views each person

Seattle/King County Homeless Performance Assessment and Recommendations A-3
Appendices
who is literally homeless as someone with a housing need that can be addressed within 30 days. There are no people who are not “housing ready.” For more information, visit Focus Strategies’ website.
Homeless Management Information System
HMIS
HUD requires that all communities receiving CoC funding must establish a dedicated database system to collect and analyze data on homeless people in the community, what housing and services they access, and the results of the assistance they receive. In Seattle/King County, the HMIS is managed by DCHS as of April 1, 2016. BitFocus provides System Administration for the HMIS through contract with DCHS.
Household HH
A person or group of people who live together in a dwelling unit. In the affordable housing field, a household refers to the group of people who occupy a housing unit. In the homelessness field, a “homeless household” refers to a single person or group of people who are staying together in the same location and, if housed, would occupy a housing unit. A homeless household can consist of a single homeless adult, two or more homeless adults, or a group including at least one adult and at least one minor child (also known as a “homeless family”).
Housing First N/A
Housing First is an approach to ending homelessness that centers on providing people experiencing homelessness with housing as quickly as possible – and then providing services as needed. Housing First programs:
• Focus on helping individuals and families access andsustain permanent rental housing as quickly as possible without time limits;
• Provide services to promote housing stability andindividual well-being on a voluntary and as-needed basis;
• Do not require that clients agree to participate in servicesor become clean and sober as a condition of occupancy;
• Adopt a “low barriers” approach to screening such thatthere are minimal entry requirements (e.g. no sobriety requirements, minimum income requirements, service participation requirements, etc.).
Department of Housing and Urban Development
HUD The federal department responsible for housing and community development policy and funding.
Long-term Shelter Stayers LTS/ LTSS Long-term Shelter Stayers refer to individuals who stay extended
durations of time and/or frequency in emergency shelter.
Moving to Work Program MTW
Moving to Work (MTW) is a demonstration program for public housing authorities (PHAs) that provides them the opportunity to design and test innovative, locally-designed strategies that use Federal dollars more efficiently, help residents find employment and become self-sufficient, and increase housing choices for low-income families. Both SHA and KCHA are part of the MTW program.
Moving On Initiative N/A “Moving on” initiatives are designed to help PSH tenants who are stable and no longer need intensive support in order to transition

A-4 Seattle/King County Homeless Performance Assessment and Recommendations
Appendices
to mainstream permanent housing whenever possible. There are a variety of ways this can be accomplished, most of which will require partnership with public housing authorities (PHA) to maximize use of available rental assistance vouchers to help tenants transition out of PSH. The most streamlined approach will be to transition tenants who have tenant-based S+C or other voucher source into the HCV program.
National Alliance to End Homelessness NAEH
The National Alliance to End Homelessness is a U.S. organization that aims to address issues related to homelessness. NAEH conducts research and provides data and other information to inform public policy, elected officials, and individuals working within the social services field.
Notice of Funding Availability NOFA
A NOFA is an announcement of available funding, usually released by a federal or state agency. Annually, HUD releases the CoC NOFA, which notifies communities of the availability of targeted homelessness assistance funding.
Other Permanent Housing OPH
This term is used in Seattle/King County to refer to service-enriched affordable housing projects targeting homeless people, but with lower service intensity than in Permanent Supportive Housing (PSH).
Point in Time Count PIT HUD requires every CoC to conduct a point in time count of homeless people a minimum of once every two years. All Home coordinates the count for Seattle/King County.
Permanent Supportive Housing PSH
Subsidized rental housing without time limits and with intensive supportive services offered on-site to assist tenants to maintain housing and meet their desired goals. In PSH, services are offered on a voluntary basis. Clients are not required to participate in services as a condition of being housed, but services are offered to them through a process of engagement. PSH is designed to house those individuals with the greatest housing barriers and highest service needs – typically people who have severe and persistent mental illness or other disabilities and who have long histories of homelessness.
Public Housing Authority PHA
Public Housing Authorities are the local agencies responsible for providing federal housing assistance (HCV and public housing) to their granted jurisdiction for eligible low-income families, the elderly, and persons with disabilities.
Rapid Re-Housing RRH
A program model that assists individuals and families who are homeless move quickly into permanent housing, usually to housing in the private market. It does so by offering time-limited, targeted services and short-term rental assistance to help participants make the move from homelessness to housing.
Request for Proposal RFP An RFP is a solicitation put out by an agency or organization that is interested in obtaining a particular service or commodity from potential contractors to submit proposals for such work.
Shelter Plus Care Program S+C
Shelter Plus Care (S+C) Program, which was consolidated into the CoC program under the HEARTH Act, provides rental assistance alongside matching supportive services. S+C offers various

Seattle/King County Homeless Performance Assessment and Recommendations A-5
Appendices
permanent housing choices, in conjunction with a range of supportive services funded through other sources.
Supportive Services for Veteran Families SSVF
The SSVF program, managed by the U.S. Department of Veterans Affairs, awards grants to non-profits and other providers who offer supportive services to extremely low-income Veteran families living in or moving to permanent housing.
Systems-Wide Analytics and Projection
SWAP
SWAP is a joint project of Focus Strategies and the National Alliance to End Homelessness. SWAP is designed to enable communities to use local data to understand what their current system is accomplishing and model what happens when system and program changes are made. The SWAP tools can be used to inform system planning and system change efforts to reduce homelessness over a period of up to five years.
Transitional Housing TH
A program model, sometimes known as transitional shelter, that provides clients with a shared or private housing unit for a time limited period, usually between 6 and 24 months, during which the client receives supportive services to help with the transition to permanent housing.
United States Interagency Council on Homelessness
USICH
A federal policy body tasked with coordinating the Federal response to homelessness. USICH includes representation from 19 Federal member agencies, including HUD, HHS, and the VA. In 2010, USICH published Opening Doors, the Federal Strategic Plan to Prevent and End Homelessness. USICH is one of the major policy setting entities at the federal level.
Veterans Administration VA The federal cabinet agency tasked with addressing veterans affairs.

A-6 Seattle/King County Homeless Performance Assessment and Recommendations
Appendices
APPENDIX 2: DOCUMENT LIST Focus Strategies reviewed the following documents to inform our understand Seattle/King County’s existing homeless response system.
A. Documents Utilized for Overall Performance Analyses 1. Fiscal Year 2015 CoC Notice of Funding Availability (NOFA), published November 16, 2015 by U.S.
Department of Housing and Urban Development (HUD)2. Seattle and King County State of Emergency Documents
a. Local Proclamation of Emergency, published November 2, 2015 by King Countyb. Statement regarding State of Emergency in Seattle and King County, published by All
Homec. Mayoral Proclamation of Civil Emergency, published by the City of Seattled. Overview of Seattle’s Homelessness Crisis, published by the City of Seattlee. City of Seattle’s Proposed New Homeless Investments, published by the City of Seattlef. County Actions and Asks Fact Sheet, published by All Homeg. FAQ: State of Emergency on Homelessness, published November, 2015 by the City of
Seattle3. Graphs and statistics reports on homeless system, Point In time Count, and investments in King
County, published November 2, 2015 by All Home4. Client Care Coordination documents
a. Client Care Coordination Supportive Housing Outcomes, published October 27, 2011 byKing County Department of Community and Human Services
b. Implementation Plan, published 2012 by King County Department of Community andHuman Services
c. Client Care Coordination: Activities for Initiative to End Chronic Homelessness, publishedMay 2010
5. Toward Creating a Coordinated Entry and Assessment System for All Homeless Populations in KingCounty, published April 2012 by Building Changes
6. 2015-2016 Strategic Plan: Making Homelessness in King County Rare, Brief and One-time,published by All Home
7. Comprehensive Plan to Prevent and End Youth and Young Adult (YYA) Homelessness in KingCounty by 2020, published May 2015 by All Home (formerly the Committee to End Homelessnessin King County)
8. Homelessness Investment Analysis, published March 2015 by the City of Seattle Human ServicesDepartment
9. Seamless Model of Transitional Care Coordination, published July 2012 by the Washington StateHealth Care Authority
10. Moving Forward: A Strategic Plan for Preventing and Ending Family Homelessness in King County,published August 2010 by All Home (formerly the Committee to End Homelessness in KingCounty)
11. Homeless Investment Policy Framework, published 2016 by the City of Seattle Human ServicesDepartment

Seattle/King County Homeless Performance Assessment and Recommendations A-7
Appendices
12. Homelessness Investment Policy Framework Key Shifts and Priorities Presentation, publishedJanuary, 2016 by the City of Seattle Human Services Department
13. Family Homelessness Strategic Plan 2016-2020, published February 2015 by All Home14. Materials from Best Practices Conference Calls organized by Barbara Poppe
a. Best Practices CoC Benchmark Matrix for Seattle/King County, Las Vegas/SouthernNevada, Salt Lake City, Hennepin County, and Houston/Harris County
b. Notes from Houston/Harris County best practices callc. Notes from Salt Lake City best practices calld. Notes from Las Vegas/Southern Nevada best practices calle. Notes from Hennepin County best practices call
B. Documents Utilized for Single Adult Analyses 15. Single Adult Shelter Task Force Findings and Recommendations Highlights, published January 23,
2013 by the Committee to End Homelessness King County16. Research findings and other data regarding single adult long-term stayers collected by the Long
Term Stayer Work Group17. The 2013 and 2014 Annual Homeless Assessment Report (AHAR) to Congress, published October
2014 by HUD18. Risk Factors for Long-term Homelessness: Findings from a Longitudinal Study of First-time
Homeless Single Adults, Caton et al., published October 2005 by the American Journal of PublicHealth
19. Research articles from the University of Pennsylvania by Dennis P. Culhanea. Homelessness and Public Shelter Provision in New York City, published January 1999b. Institutional Discharges and Subsequent Shelter Use Among Unaccompanied Adults in
New York City, published January 2010c. The Impact of Shelter Use and Housing Placement on Mortality Hazard for
Unaccompanied Adults and Adults in Family Households Entering New York City Shelters:1990-2002, published August 2011
d. Community-level Characteristics Associated with Variations in Rates of HomelessnessAmong Families and Single Adults, published December 2013
20. Typologies of Homelessness: Moving Beyond a Homogenous Perspective, published January 2013by National Health Care for the Homeless Council
21. Rethinking Research on Forming Typologies of Homelessness, Hutch et al., published April 2011 bythe American Journal of Public Health

A-8 Seattle/King County Homeless Performance Assessment and Recommendations
Appendices
APPENDIX 3: INTERVIEW SUMMARY & INTERVIEWEES
A. SUMMARY OF KEY STAKEHOLDER INTERVIEWS Single Adult Homeless System To support our work on the single adult homeless system, Focus Strategies conducted a series of interviews with key stakeholders identified by All Home’s Single Adult Advisory Group. Interviews were conducted between September and December 2015. Interviewees spanned a range of different organizations and intervention types, including outreach programs, shelters, transitional housing and permanent supportive housing, as well as different subpopulations (veterans, chronically homeless people, and individuals with mental illness). The purpose of these interviews was to learn more about the existing programs for single adults and identify opportunities and challenges for system improvement. This Appendix provides an overview of the input we heard from the stakeholders.
A. Strengths/Opportunities
Commitment to Collaboration: Stakeholders generally agreed that Seattle/King County benefits from a strong commitment amongst government and non-profit leadership to collaborate in efforts towards ending homelessness. Many stakeholders have years of experience within King County’s Continuum of Care and are very familiar with its strengths and weaknesses. Several interviewees indicated that collaborative efforts between government and non-profit agencies have been viewed as positive for the community.
County and city staff: County and city staff members noted that buy-in from community leaders has significantly influenced and promoted subsequent buy-in from other parties, resulting in actionable steps taken towards ending homelessness. One staff member said that leadership’s general support for and adoption of a Housing First approach to ending homelessness has been influential. Some interviewees noted that the relationship between government agencies and faith-based service providers has been essential, particularly in providing street outreach to individuals experiencing homelessness.
Providers: Providers agreed that strong leadership has led to numerous successful efforts in the community, including an increase in the number of available access points for housing and other services. One stakeholder noted that King County maintains a “great partnership across cities and attentiveness to regional effort.”
Availability of Resources: A commitment to collaboration amongst government agencies and providers has helped in creating additional resources within the CoC. The community, including City, County and private funders, have invested significant resources to address homelessness, including MOUs and HUD set-aside programs with a variety of housing providers, as well as with mental health service providers across the Continuum of Care. A voter approved Housing Levy has helped increase resources, while local government plans to propose a ballot measure for 2016 that would double the Levy. A Regional Coalition for Housing (ARCH) general fund of approximately $800,000-$1M was created utilizing a federal block grant. Permanent Supportive Housing (PSH) programs have been successful, according to stakeholders, although some recognized gaps (e.g., there is currently no PSH in Bellevue). Rapid Re-Housing for single adults has also recently been implemented. Local funds support transitional housing (TH), day centers, and permanent housing (PH) rent subsidies.
Seattle/King County is participating in the VA’s 25 Cities Initiative aimed at ending homelessness among veterans. Agencies reportedly collaborate very closely on veterans’ issues and have developed a master list of homeless veterans in King County. A 21 unit apartment building recently opened for housing veterans; it was immediately filled and a waitlist was put in place.

Seattle/King County Homeless Performance Assessment and Recommendations A-9
Appendices
County and city staff: “We put a lot of energy into sustainability of portfolio,” one stakeholder said. There has been a great deal of local investment in long term viability of housing, which includes more than 12,000 affordable housing units, of which more than 3,000 are set aside for people who are homeless. There are 24 cluster houses, which are privately owned and operated through local churches, however people are required to be able to live independently in the homes. Specialty programs for people moving through the criminal justice system have been implemented involving Drug and Mental Health Court coordination (FISH). The Seattle Housing Authority is a Moving to Work agency, which means it has great flexibility in how it invests Housing Choice Vouchers. However, the Moving to Work (MTW) grant negotiations with HUD have been challenging.
Providers: It is important to note that while availability of resources was frequently noted by county and city staff, many service providers opposed this view, citing a lack of county-wide resources for the CoC. Providers frequently expressed concern over insufficient or unequally distributed resources for certain subpopulations (See Section B - Unevenly Distributed Resources amongst Subpopulations), as well as generally disproportionate resource allocation based on geographic location (See Section B - Geographic Differences in Resource Allocation). One housing provider said that their organization deals with an overwhelming demand for housing “without any reasonable amount of resource” to do so effectively or efficiently. Despite Seattle and King County’s large population of homeless individuals (many of whom require significant support and services), the best that many providers can do is direct homeless individuals to emergency shelters, the interviewee said.
B. Challenges
Lack of System Coordination: Although stakeholders frequently mentioned a strong commitment to and expectation for collaboration, several individuals cited a lack of service coordination and overall system coordination within the community. Several factors, including perceived lack of affordable housing, an overall difficult housing market and a lack of resources, were posed as possible complications, leading to an overall lack of coordination. As one stakeholder put it, while there is a breadth and depth of collaboration, the agencies could get better at coordination. “It is a complicated system without enough places to house people,” they said.
County and city staff: One staff member attributed the perceived lack of service coordination to a lack of regional resources and questioned whether systems change was possible given the county’s availability of housing and other resources. Another staff person said, “We can make improvements with systems change, but it’s unlikely to truly end homelessness without additional resources.”
Providers: Providers noted a lack of overall program cohesiveness and clarity. One provider described County-wide initiatives towards ending homelessness as “Band-Aid strategies” that “don’t create systemic or structural changes.” As a result, the stakeholder said, the County is doing a “poor job locally of matching people with resources that will be useful to them and having enough resources for everyone who needs it. There is extreme difficulty in gaining housing through various systems and resources.” Another provider noted that, “We need a system that connects people in need to interventions they are eligible for.” They continued on to say that whether a person receives a referral to appropriate services depends on whether their service provider or case manager “happens to know whether a particular program exists. Exiting homelessness depends entirely on your case manager.”
Lack of Data Coordination: Obtaining and sharing data across the system was also seen as a challenge amongst stakeholders. Some noted that the State of Washington is moving to a new system in 2016, therefore changing data collection requirements.

A-10 Seattle/King County Homeless Performance Assessment and Recommendations
Appendices
County and city staff: One staff member noted challenges associated with using HMIS data for analysis and coordinated entry as nearly one-third of clients “do not agree to identify themselves in the system.” One staff member described the county’s data systems as “incredibly siloed.”
Providers: As previously mentioned, some providers disclosed they do not have a coordinated system for sharing client information. “The barriers aren’t in the data itself – it’s in the lack of data integration across systems. We have some ability to share data, but it’s not always integrated,” one provider said. One provider noted that they have read-only access to limited HMIS data; another said that because HMIS is underfunded, it is difficult to transfer and receive data, ultimately making the data less effective. It was noted that smaller providers “struggle with data and capacity” and are “not at a place yet to use data quickly.” Additionally, some providers have opted for data collection tools other than HMIS, even further complicating data coordination.
Difficult Regional Housing Market Conditions: A recurrent theme throughout stakeholder interviews was the region’s steadily increasing rental prices and an overall lack of affordable housing. Interviewees said that improvements in programming tend to be halted due to the area’s current housing market conditions.
County and city staff: One government staff member expressed such sentiments regarding Seattle/King County’s housing market saying, “There’s no place [to house people], as there’s not enough affordable housing. There are not enough rents low enough for people to leave a shelter.” Another individual noted that it takes years to develop and build new housing stock, which they did not feel could be done quickly enough to meet demands. Thousands of people sit on waiting lists for housing, even with housing vouchers, another stakeholder said. One individual suggested that the County rent more property as a solution to housing more homeless individuals.
Providers: Many individuals representing service providers expressed their belief that the difficult housing market served as a barrier to making further strides towards ending homelessness. “I feel like because of how difficult the housing market is right now, I don’t think we are meeting the needs of any population.”
Barriers to Entry: Throughout the interviews, many individuals made mention of high barriers to entry for housing, emergency shelters and other services. Several stakeholders noted that shelters and landlords throughout the county require sobriety, often creating barriers to housing a maximum number of people. Several stakeholders also recognized the difficulty of housing and serving individuals with criminal records.
County and city staff: One government staff member noted problems surrounding some providers’ “strict eligibility” requirements. Individuals who have been incarcerated, particularly those on probation, are not served well, according to the staff member. For people with a criminal history, “gaining access to housing is difficult. Even if they get a HCV, they have trouble getting units to accept them. Often, the only housing option is transitional housing which does not work well because of restrictions. If a person cannot meet the clean and sober requirements, they lose their housing.” It was also noted that providers “tend not to serve people in the mental health system who have substance abuse issues.”
Providers: Requirements for individuals to be “clean and sober” in order to access some emergency shelters and other services was commonly mentioned. Providers and clients also experience difficulties with starting leases due to sobriety requirements imposed by landlords and property managers. Similarly, one health service provider expressed that a majority of the area’s transitional housing requires clean and sober living, which “is hard to manage when relapse is a part of the recovery process.” Another provider noted that despite high drug use within the homeless population, there are a lack of safe spaces and harm reduction spaces for those seeking to detox and “screening out” of people who are actively using illegal substances is

Seattle/King County Homeless Performance Assessment and Recommendations A-11
Appendices
common.
Although one provider suggested that single adults experience fewer barriers to entry compared to family households, it was commonly mentioned amongst providers that there are still significant barriers for single adults. One stakeholder noted that they have a particularly difficult time moving single adult men into housing. “If many of the barriers and gaps (to entry) were addressed, there would be greater access to housing available,” one individual said.
Unevenly Distributed Resources amongst Subpopulations: Stakeholders who were interviewed, particularly those who represented service providers, commonly reflected sentiments that resources within the homeless system were unevenly distributed amongst homeless subpopulations.
Providers: Although service providers recognized certain subpopulations that are being served well, including veterans and families, many cited that several subpopulations lack appropriate resources. One faith-based service provider said that veteran programs did the best job of meeting individuals’ needs, however “it’s as bad as I’ve ever seen it – we’re a long way off with every population.” Several noted challenges serving youth, single adults, and people who need PSH and/or have multiple barriers to housing. Additionally, providers also find that individuals with primarily health care needs are difficult to house, as they do not meet a number of prerequisites for funding. People with moderate health needs, yet who still require deep housing subsidy, were said to be one of the most difficult subpopulations to serve.
Despite acknowledgements that veterans were well-served, others noted gaps in programs for Veterans, including a lack of interim housing beds for female veterans. “Veterans who do meet criteria for skilled care, but have barriers to access those services because of a (negative) legal history or other (behavioral) co-morbidities” were said to be difficult to house. In addition, “most funders require an honorable discharge for veterans to receive services, those without this just continue to be homeless.”
Several providers said that availability of resources varies amongst age groups, including youth and individuals who are aging with “significant primary health care needs.” Individuals suffering from mental illness and chronic substance abuse also experience significant hurdles to attaining necessary resources, according to representatives from a main health care provider to homeless people. “There are huge gaps in accessing behavioral health services, which creates complications for people entering shelter and housing to succeed,” they said. “If people have untreated behavioral health needs, they are less apt to succeed in those programs.”
Geographic Differences in Resource Allocation. Several individuals who were interviewed noted significant geographical differences in what is available and is not available in various parts of King County. Resources for housing and providing services to homeless people were reported to be less available in the southern and eastern parts of King County. While there are reportedly some important partnerships with providers in place in Seattle, the east side struggles with a lack of capacity and a limited array of interventions available. One individual also noted that Bellevue has no units for permanent supportive housing.
County and city staff: Some staff members explained that several years ago, there was an increase in units pursuant to a new document recording fee. Subsequently, funds are needed to keep these projects running, making it difficult to add new projects and achieve regional balance due to existing funding commitments. One government staff person noted that due to uncertain and inconsistent funding in some areas of the county, a “program lasting for a year or more is something we all celebrate.”

A-12 Seattle/King County Homeless Performance Assessment and Recommendations
Appendices
Providers: One stakeholder noted concerns “about people being able to stay where they feel at home. We’ve done a good job of having services on East Side for those who need/want that. Place-ties are important to feelings of safety and stability.” One stakeholder noted that they hope Focus Strategies’ SWAP suite of tools will help providers better understand differences in housing models in Seattle and what exists on the East Side, “which are private market units that aren’t PSH and are clean and sober.”

Seattle/King County Homeless Performance Assessment and Recommendations A-13
Appendices
B. INTERVIEWEES FOR SINGLE ADULT STRATEGIC PLANNING Stakeholder/Leader Organization Role
Alison Eisinger Seattle King County Coalition on Homelessness (SKCCH)
Executive Director
Annamaria Gueco Sound Mental Health Supportive Housing Department Manager
Bill Hallerman Catholic Community Services (CCS) Agency Director
Bill Kirlin-Hackett Interfaith Task Force on Homelessness
Director
Chloe Gale REACH (program of Evergreen Treatment Services)
Co-director, REACH Team
Dan Wise CCS Division Director Daniel Malone Downtown Emergency Service
Center (DESC) Executive Director
David Johns Bowling Congregations for the Homeless Executive Director Emily Leslie City of Bellevue Human Services Manager
Flo Beaumon CCS Associate Director of the Archdiocesan Housing Authority's Special Ministries
Francesca Martin Compass Housing Alliance Chief Program Officer Graham Pruss We Count and Safe Park program Director/Co-founder Janine Griggs Veterans Administration, Puget
Sound Per Diem Liaison
Jesse Benet King County Mental Health and Chemical Abuse and Dependency
Services Division (MHCADSD)
Program Manager
John Gilvar HealthCare for the Homeless Program Manager Kelli Larsen Plymouth Housing Group (PHG) Director of Strategic Initiatives
Kelli Nomura Community Psychiatric Clinic (CPC) Community Psychiatric Clinic Maggie Breen Renton Ecumenical Association of
Churches (REACH) Executive Director
Margo Burnison MHCADSD Diversion and Reentry Services Contract Monitor
Maureen Kostyack City of Seattle Office of Housing Housing Program and Development Manager
Meghan Deal Veterans Administration Acting Director, Community Housing and Outreach Services
Nicole Macri DESC Housing Director Steve Roberts Congregations for the Homeless Managing Director of CFH Development Wayne Wilson Compass Housing Alliance Emergency Services Manager

A-14 Seattle/King County Homeless Performance Assessment and Recommendations
Appendices
APPENDIX 4: PROMISING MODELS
NEW AND EMERGING MODELS FOR ADDRESSING HOMELESSNESS AMONG SINGLE ADULTS The program summaries included in this review were prepared as part of the work conducted for Seattle and greater King County, WA on addressing homelessness among single adults. We sought to identify innovative strategies that use less traditional methods or resources to serve single adults. These summaries are intended to be linked to the typology of single adults in the region with the goal of identifying ways to increase the capacity to serve more single adults with a variety of needs. These programs or practices were selected based on their potential as models to fill gaps in the continuum of services for singles; they may be considered emerging and promising, but are not necessarily proven practices.
1. Targeted outreach with priority for interim or permanent housing beds: These programs and models aredesigned to reach groups of single adults that are on the street and move them quickly, either directly into housing or into dedicated shelter/interim housing tied to permanent housing placement.
Navigation Center, San Francisco, CA31 - San Francisco has a high rate of unsheltered homelessness among single adults (3,401 in 2015 PIT count). Facing challenges engaging people living in encampments, the City recently opened the new Navigation Center. The Navigation Center is designed to serve people who will not access traditional shelter and accommodates many needs and household configurations that regular single adult shelters do not. This includes allowing people to come in as couples or groups, to bring pets, and to bring a larger amount of personal belongings than traditional shelters permit. In many cases, whole encampments can come into the Center together. The Navigation Center, which can accommodate 70 persons at a time, builds on strategies pioneered in Philadelphia and San Diego. Street outreach teams go out to persons on the street or in parks on a daily basis and can transport groups or individuals immediately to the Center. Beds are reserved for direct referral from outreach.
In its first seven months of operation, the new program has achieved outstanding results. Since March of 2015, the Navigation Center has served 230 unduplicated clients. 159 have exited and 70 are currently being served. Of the 159 who have exited, 71 have gone to permanent housing within the city, and 45 have returned to homes outside of the area; a 73% exit rate to permanent housing. 20 left on their own and 17 have been asked to leave. To date the average stay for those leaving to permanent housing has been 58 days, longer than the original hope of 10 days. Rehousing has been primarily through master leasing by the City, though some clients have been helped with other supportive housing programs including Shelter Plus Care. The City has reallocated $3 million from other programs to open a second navigation center, one that they hope will be operated by an organization with mental health specialty that can bill Medicaid for services.
Connections Housing/PATH Depot, San Diego CA32 - Connections Housing and the PATH Depot combines 89 units of permanent supportive housing, 134 interim housing beds (30-90 days), a health center and a multi-service center in one building in the heart of San Diego’s downtown. Like the Navigation Center, the interim beds can only be accessed through PATH’s street outreach team which
31 Information from http://www.sfgate.com/bayarea/article/S-F-seeks-site-for-2nd-Navigation-Center-for-the-6497167.php and from weekly dashboard provided by Scott Walton, Adult Services Manager, SF Human Services Agency
32 All information from http://www.sdconnections.org/SD/index.html accessed 10/22/2015

Seattle/King County Homeless Performance Assessment and Recommendations A-15
Appendices
manages the screening and intake for interim beds, focusing on individuals who are homeless, chronically homeless, and/or deemed vulnerable or at-risk on the streets.
Besides assisting individuals experiencing homelessness in a variety of ways, Connections is also intended to address needs in the downtown neighborhood, by making sure people on the streets are housed and the neighborhood has reduced street homelessness. In one year, street homelessness within a quarter mile of Connections was reduced by 70%, and 69% of those who stayed in the interim housing were placed into permanent or longer term housing.
Square One/AC Impact – Berkeley and Alameda County, CA - Square One is an outreach and Housing First program targeted specifically to long-term street dwellers who are well-known to business and law enforcement in Alameda County, CA. Square One was originally funded for up to 15 persons by the City of Berkeley through parking meter revenue. It was expanded with a CoC grant in 2014 to operate county-wide under the name AC Impact to serve an additional 50 persons county-wide. The program operates through partnerships between the housing provider, Abode Services, and city representatives including law enforcement in each of the targeted cities (Berkeley, Oakland, Hayward, Fremont and Livermore). Participants in the program have been identified by law enforcement, emergency services, and/or local jurisdictions as individuals who are most visible and costly to the community through their high level of interaction with law enforcement and emergency services. Specific outreach to the persons identified includes an offer of housing. In the first year the program enrolled 46 people, with a cumulative length of homelessness of 541 years (average 11.7 years). 34 of those enrolled were housed at the end of the year, three had died and nine were still looking for housing or were between housing placements. The housing retention rate for those housed since the program began is 91%, with more than 60% increasing income and many becoming discharged from probation, or reducing or ending law enforcement engagement.
2. Targeting Long-Term Shelter Stayers: Like Seattle/King County, many communities across the country havefound that a relatively small number of long-term shelters stayers (LTS) consume a large portion of the available shelter resources by staying long periods of time, continuously or repeatedly in shelter. Three program/communities report making significant progress with this issue through targeted programs aimed at housing the longest stayers.
Pine Street Inn, Boston 33- This organization provides shelter to single men and women in Boston. Their analysis indicated that 5% of their shelter users with stays of more than one year utilized 53% of bed nights. Their response was to increase the number of permanent housing units that they operate and to dedicate access to these for the longest stayers in their shelter. Over time, through a combination of development and mergers, they have increased permanent housing beds from 280 to 900 and decreased shelter from 715 to 670, while virtually eliminating stays of over one year and dramatically reducing stays greater than 180 days.
Oxford Street Shelter, Portland, ME34– This large shelter in Portland, Maine accommodates 154 single adults and frequently added overflow capacity of up to 150 additional beds. Previous efforts to house as many people as possible quickly had not reduced the demand for shelter. To address this problem, in 2014 the shelter targeted nearly all of its effort to the 116 persons with stays longer than 180 days.
33 Information from emails and PPT materials provided by Poppe Associates 10/11/2015
34 Information from PPT presented at NAEH conference 7/15/15 and Oxford Street Overflow Shelter Annual Report for 2014 http://www.portlandmaine.gov/DocumentCenter/Home/View/6569

A-16 Seattle/King County Homeless Performance Assessment and Recommendations
Appendices
A multi-agency team coordinated the effort and helped keep the project on track. When the first 66 were housed, they were able to permanently close one of the overflow shelters and only intermittently operate the other. The program’s 2015 goal is to house another 70, all of the remaining long-term stayers and completely eliminate the need for overflow. They are doing this through dedicating staff time from several of their rapid rehousing programs to work individually with the LTSs. Nine agencies and just over 9 staff meet weekly working from the same list, with a goal of housing 9 per month.
Hennepin County, MN35- The “Top 51” pilot program provides intensive engagement with the highest users of county contracted single adult shelter beds, to move them into housing. Program participants were identified through administrative data and enrolled into the program. Most had been in shelter since the 1990s, and previous attempts at housing had failed. The pilot program included contracts with Catholic Charities and Salvation Army for $713,675 for the two and a half years of the pilot program, July 1, 2012 through December 31, 2014. 46 clients (63% of the 73 persons in the actual final cohort) were housed in various housing settings (single room occupancy, scattered site/private market housing, nursing home, and transitional housing). The pilot also showed dramatic reductions in hospitalization and interaction with law enforcement for some of the persons included in the cohort.
These programs have in common the use of data to establish the target list, focusing resources on those with the longest stays, and targeting limited housing resources to those identified. 3. Targeted Rapid Rehousing: Tying shelter more closely to rapid rehousing resources is a particularly useful strategy for reducing lengths of stay at shelters for single adults who do not qualify for, or for whom no PSH is available. Many communities have added rapid rehousing to their system mix but few are focusing specifically on ensuring RRH is offered regularly to single adults.
Northern Virginia Rapid Rehousing – The Northern Virginia Family Services operates shelters for both families and singles. NVFS noted that they had low permanent housing placement rates and long average lengths of stay in their shelters. To improve outcomes and reduce lengths of stay, NVFS has developed extensive rapid rehousing housing resources from a variety of sources to offer rapid rehousing to the majority of its shelter residents. Staff are trained in a variety of ways including rapid rehousing practices and philosophy, CTI, Motivational Interviewing and trauma-informed care. Average lengths of stay since 2011 have been reduced from 243 days to 45 days and housing placement rates have increased from negligible to 71%. The shelter develops a targeted, personal housing plan for every shelter resident immediately upon program entry. All staff are trained and certified as housing counselors.
Phoenix, AZ Single RRH Pilot – Until recently, Phoenix operated a nightly overflow shelter housing as many as 450 single adults per night. Closure of the overflow shelter motivated an effort to rehouse single adults. The program started with a small pilot that moved 55 single adults out of the overflow shelter in 60 days. After one year, six have returned to homelessness and 14 have been targeted to receive a longer term subsidy. This year, the program was expanded to serve at least 250 people at an average cost of $10,000 per household including rental assistance and services. The temporary overflow shelter outreaches to persons identified through data in the HMIS system as eligible and targeted. Three providers provide the housing stabilization case management and HOME Inc.
35 Information from http://www.hennepin.us/headinghomehennepin and from Powerpoint presented at Housing First Partners conference “Using Data to Drive Program Development in Housing First”

Seattle/King County Homeless Performance Assessment and Recommendations A-17
Appendices
manages the rental assistance portion. A mainstream partnership with workforce development is being added to the program, and a formal evaluation is being conducted.
4. Single Adult Diversion (Rapid Rehousing at the Front Door): Diversion is a practice of targeted preventionaimed specifically at those who are seeking shelter. Only a few communities we have found have embraced full-scale diversion for both single adults and families.
Coordinated Entry/Cleveland Mediation Center, OH36- Cleveland Mediation Center provides diversion services to persons identified by the coordinated entry system as potentially divertible based on current living situation. Their goal is to divert 25% of those seeking shelter through a structured strengths-based problem-solving conversation. The program offers mediation and light financial assistance. In 2012-13 they were able to divert 19% of single males and 27% of single females. Approximately 40% of those diverted received some type of financial assistance.
Your Way Home, Montgomery County, PA37 – Since the start of 2015, diversion has been an integral step of the coordinated entry and rapid rehousing process in Montgomery County, PA. Callers to the Your Way Home call center are given a 6 question triage screen and those with score of 5 or 6 are referred for a diversion conversation with a housing specialist from one of the three Housing Resource Centers. 85% of diversion is done over the phone with a problem solving conversation and the county only spent $3,500 in direct support for diversion activities. The program’s low level of financial assistance is rooted in its belief that the majority of callers cannot afford housing on their own. To successfully divert people from shelter, their focus must be on the only strategy for callers to avoid homelessness—helping them develop the skills necessary to being successful in their shared housing situation by being a respectful household member and cash assistance is often not needed. In the first six months, Your Way Home successfully diverted just over 60% of the 90 single adult callers who received a diversion conversation, slightly less than the 70% success rate for families. Your Way Home intends to expand diversion services and offer the option to more people in the coming year.
5. Uses of and Variations on Critical Time Intervention in Different Permanent Housing Models:Permanent Supportive Housing (PSH) is a proven intervention for chronically homeless singles and those with disabilities and other barriers to housing. PSH, however, is costly and of unlimited duration. Critical Time Intervention (CTI) is a time-limited evidence-based practice that mobilizes support for vulnerable individuals during periods of transition. It facilitates community integration and continuity of care. CTI uses a phased approach lasting nine months, with three 3-month phases focusing on Transition, Trying-Out, and Transition of Care. CTI was developed in the mid 1980’s in New York. It has typically been used to assist persons making a transition to community living from shelter, hospital, or other institutional setting. In recent years, communities have been pairing or adapting the CTI model to additional forms of housing and cross-sector coordination.
CTI with Rapid Rehousing - Montgomery County, PA38- Montgomery County, PA has developed a coordinated homeless system that focuses significant resources on providing rapid rehousing to high need families and singles through a network of housing resource centers (HRC). (The community is
36 Information from PowerPoint accessed at NAEH website www.endhomelessness.org 37 Information from presentation at NAEH conference http://www.endhomelessness.org/library/entry/3.08-diversion-best-practice-for-preventing-homelessness and data accessed from http://yourwayhome.org/ywh-data
38 Information from http://www.rhd.org/Program.aspx?pid=38 accessed 10/22/15 and from conversation with program director Elizabeth Fetter 10/14/2015

A-18 Seattle/King County Homeless Performance Assessment and Recommendations
Appendices
also actively using diversion with singles and families, discussed below.) The centralized Your Way Home call center administers the VI-SPDAT by phone and those who score in need of rapid rehousing are referred to three geographically-based Housing Resources Centers (HRCs). The HRCs work with persons in shelter or still unsheltered to regain housing rapidly, with a progressive engagement approach to case management and rental assistance. Resources for Human Development (RHD), a large non-profit based in Philadelphia with a variety of behavioral health programs in 14 states, operates a Critical Time Intervention program in Montgomery County. For many years, the CTI program has worked with mentally ill homeless people to gain housing and transition to community services, but housing resources were not coordinated. Today, the CTI program works closely with staff at the Housing Resource Centers together to jointly address the needs of qualifying individuals eligible for Medicaid who have had a diagnosis or services for mental health in the last year. Housing Stability Coaches from the Centers help clients find housing and provide light services focused primarily on housing needs and landlord relations. The CTI worker provides more intensive supports within the CTI model and helps the client transition over time to community-based services. Recently, CTI workers have started doing outreach to eligible rapid rehousing clients in shelter before they start the rehousing process, to develop strong relationships that can last through the housing transition -- this is called “Pre-CTI” as it occurs before they are housed and is additional to the 9 months after housing. The CTI program is funded by Targeted Case Management funds (TCM) from Medicaid and pays for itself. The County is expanding the program again this year.
CTI with Housing Choice Vouchers –Bridgeport Housing First Collaborative, CT39- Supportive Housing Works of Fairfield County, CT is the Collective Impact back-bone organization for Fairfield County and staffs the local Housing First Collaborative. SHW advocated for a range of resources to be made available to address chronic homelessness. The City of Bridgeport Housing Authority provided 125 Housing Choice Vouchers, but the Collaborative did not have enough resources to do long-term permanent supportive housing or ACT teams for all the chronically homeless on their list. With a SAMHSA grant, the Housing First Collaborative has paired the vouchers with CTI services. At the end of the CTI period, tenants’ care is transferred to community care, which may include follow up by a Community Care Team, designed to prevent returns to homelessness.
39 Information from conversation with Lisa Bahodosingh, Supportive Housing Works, 10/16/2015

Seattle/King County Homeless Performance Assessment and Recommendations A-19
Appendices
APPENDIX 5: PROJECTS INCLUDED IN THE SEATTLE/KING COUNTY ANALYSIS
Emergency Shelter Organization Name Project Name Beds/Units
Auburn Youth Resources Arcadia Shelter 6 beds (youth) Catholic Community Services (CCS)
ARISE (Renton) 25 beds; 2 overflow beds
Catholic Community Services (CCS)
HOME for Women (Kent) 12 overflow beds
Catholic Community Services (CCS)
HOME Program (Kent) 25 beds; 1 overflow bed
Catholic Community Services (CCS)
Reach Out (Federal Way) 40 seasonal beds
Congregations for the Homeless Congregations for the Homeless Shelter
30 beds
Congregations for the Homeless Eastside Winter Response Shelter - Men
50 seasonal beds
DAWN Confidential Shelter 7 units; 2 beds Downtown Emergency Service Center (DESC)
Crisis Respite 20 beds
Friends of Youth The Landing 20 beds (14 youth); 5 seasonal beds
Hopelink Avondale Park 8 units Hospitality House Hospitality House (Burien) 9 beds Multiservice Center (MSC) MSC Family Shelter (Kent) 15 units The Sophia Way Eastside Winter Response Shelter -
Women & Children 30 seasonal beds
The Sophia Way The Sophia Way 21 beds YWCA Seattle - King - Snohomish
YWC34.621 Auburn Emergency 7 units
YWCA Seattle - King - Snohomish
YWCA14.623 East Cherry Emergency
12 units
City of Seattle Funded Emergency Shelter Abused Deaf Women Advocacy Services (ADWAS)
A Place of Our Own - ES - C 3 beds; 6 units
Archdiocesan Housing Authority (AHA)
Noel House / St. Mark's - C 72 beds
Catholic Community Services (CCS)
Sacred Heart - C 9 units; 4 overflow beds
Compass Housing Alliance FASC / Operation NightWatch - C 80 beds; 1 overflow bed
Compass Housing Alliance First United Methodist Church - C 60 beds Compass Housing Alliance Hammond House - C 40 beds; 1 overflow
bed Compass Housing Alliance Roy Street - C 40 beds; 1 overflow
bed

A-20 Seattle/King County Homeless Performance Assessment and Recommendations
Appendices
Catholic Community Services (CCS)
St. Martin de Porres - C 212 beds; 34 seasonal beds
Downtown Emergency Service Center (DESC)
Main Shelter - C 184 beds; 14 overflow beds
Downtown Emergency Service Center (DESC)
Kerner Scott Women's Shelter - C 25 beds
Immanuel Community Services Recovery Program / Transitional Housing - C
15 beds
Mary's Place Bianca's Place - C 22 units New Beginnings Emergency Shelter - C 5 units; 3 beds Salvation Army City of Seattle Winter Response
Shelter - C 76 beds; 3 overflow beds
Salvation Army King County Admin Building - Winter Response - C
50 seasonal beds
Salvation Army Pike Street - C 20 beds; 7 overflow beds
Salvation Army William Booth (lower level) - C 91 beds; 16 overflow beds
Salvation Army Catherine Booth House - C 9 units; 3 beds Shalom Zone Nonprofit Association
ROOTS Young Adult Shelter - C 45 beds (youth)
SHARE All SHARE shelters - C 258 beds; 25 overflow beds
Solid Ground Family Shelter - C 14 units Solid Ground Broadview Shelter - C 10 units YouthCare Orion Shelter - C 15 beds (youth); 5
overflow beds YWCA Seattle - King - Snohomish
SIS Late Night Shelter - C 44 overflow beds
YWCA Seattle - King - Snohomish
YWC13.120 Angeline's Enhanced Night Shelter - C
80 beds; 5 overflow beds
YWCA Seattle - King - Snohomish
YWC14.621 Downtown Emergency - C
12 units; 14 beds
YWCA Seattle - King - Snohomish
YWC14.625 Willow Street Enhanced Emergency - C
35 units; 11 overflow beds
Transitional Housing Organization Name Project Name Beds/Units
Archdiocesan Housing Authority (AHA)
Spruce Park Apartments 4 units
Archdiocesan Housing Authority (AHA)
Traugott Terrace TH 12 beds
Auburn Youth Resources Severson House 11 beds (youth) Catholic Community Services (CCS)
Alder Crest 8 units
Catholic Community Services (CCS)
FUSION 16 units

Seattle/King County Homeless Performance Assessment and Recommendations A-21
Appendices
Catholic Community Services (CCS)
GPD Michael's Place 18 beds
Catholic Community Services (CCS)
Harrington House (Bellevue) 8 units
Catholic Community Services (CCS)
Katherine's House 6 beds
Catholic Community Services (CCS)
Rita's House (Auburn) 6 beds
Community Psychiatric Clinic (CPC)
El Rey 16 beds
Community Psychiatric Clinic (CPC)
The Willows 15 units
Community Psychiatric Clinic (CPC)
Cedar House 8 beds (youth)
Compass Housing Alliance GPD - Renton Regional Veteran's Program
10 units; 26 beds
Compass Housing Alliance GPD - Veterans Program (Shoreline) 25 beds Compass Housing Alliance Othello House 4 beds Elizabeth Gregory Home Elizabeth Gregory Home at Maple
Leaf House 7 beds
Friends of Youth New Ground Avondale Park 24 units Friends of Youth New Ground Bothell 14 units (youth) Friends of Youth New Ground Kirkland 9 beds (youth) Hopelink Avondale Park II (Redmond) 27 units Hopelink Heritage Park/ Alpine Ridge
(Bothell) 15 units
Hopelink Hopelink Place 20 units Kent Youth and Family Services Watson Manor (Kent) 7 units (youth); 2 child
only beds KITH Petter Court Transitional 4 units Low Income Housing Institute (LIHI)
Cate Apartments / GPD-Cate Apartments
11 units
Low Income Housing Institute (LIHI)
Columbia Court 13 units
Low Income Housing Institute (LIHI)
Denny Park 8 units
Low Income Housing Institute (LIHI)
GPD - Arion Court 16 beds
Low Income Housing Institute (LIHI)
Martin Court 13 units; 28 beds
Low Income Housing Institute (LIHI)
Meadowbrook View 15 units
Low Income Housing Institute (LIHI)
Tyree Scott - TH 6 units
Multiservice Center (MSC) Family Transitional Program - S. King county
6 units

A-22 Seattle/King County Homeless Performance Assessment and Recommendations
Appendices
Multiservice Center (MSC) Men's Transitional Housing (Federal Way)
11 beds
Multiservice Center (MSC) Titusville Station 15 beds Pioneer Human Services GPD - Mark Cooper House 38 beds Salvation Army GPD - Veterans Transitional
Program 30 beds
Salvation Army William Booth Center (upper floor) 48 beds Solid Ground Bethlehem House 1 unit Solid Ground Rent Assistance at SandPoint 18 beds Solid Ground SandPoint Family Program 26 units St Stephen Housing Association City Park Townhouses Transitional
Housing (Auburn 11 units
St Stephen Housing Association Nike Manor Transitional Housing 8 units The Sophia Way The Sophia Way Transitional
Housing 7 beds
Valley Cities Counseling and Consultation
Valley Cities Transitional Housing 3 units
Vietnam Veterans Leadership Program (VVLP) / Compass Housing Alliance
Bennett House 6 beds
Vietnam Veterans Leadership Program (VVLP) / Compass Housing Alliance
Burien 6 beds
YMCA YMCA Shared Homes 24 beds (youth) YouthCare Straley House 12 beds (youth) YWCA Seattle - King - Snohomish
Auburn Transitional Housing 12 units
YWCA Seattle - King - Snohomish
Central Area Transitional Housing 42 units
YWCA Seattle - King - Snohomish
Family Village - Case Managed Units 5 units
YWCA Seattle - King - Snohomish
Family Village (Redmond) 20 units
Catholic Community Services (CCS)
Aloha Inn - CS 66 beds
City of Seattle Funded Transitional Housing Compass Housing Alliance Cascade Women's Transitional - CS 32 beds
Compass Housing Alliance Pioneer Square Men's Program - CS 78 beds Compass Housing Alliance Scattered Sites (Bryant, Cedar,
Evanston, Phinney) - CS 22 beds (5 youth)
Compass Housing Alliance HomeStep / Transitions / Transitions 2 - CS
14 units
Compass Housing Alliance Cesar Chavez House - CS 5 beds Compass Housing Alliance Magnolia House - CS 5 beds Compass Housing Alliance Mary Witt / Rosa Parks House - CS 10 beds

Seattle/King County Homeless Performance Assessment and Recommendations A-23
Appendices
Compass Housing Alliance Miracle Manor - CS 6 beds El Centro de la Raza Transitional Housing Program
Ferdinand/Shelton Houses - CS 2 units
First Place School Housing Stabilization Program - CS 6 units Friends of Youth New Ground - SandPoint (Harmony
House) - CS 6 units (youth)
Muslim Housing Services Muslim Housing Services Transitional Housing - CS
15 units
Salvation Army Bridges to Housing - CS 11 units; 30 beds Solid Ground Santos Place - CS 42 beds United Indians of all Tribes United Indians Youth Home - CS 25 beds (youth) Urban League of Seattle MJ Harder House - CS 7 beds (youth) YMCA Young Adults in Transition - CS 20 beds (youth) YouthCare Home of Hope - CS 18 beds (youth) YouthCare Passages (Sand Point) - CS 8 beds (youth) YouthCare Ravenna House - CS 10 beds (youth)
Permanent Supportive Housing Organization Name Project Name Beds/Units
Archdiocesan Housing Authority (AHA)
Frederic Ozanam House (Westlake 2)
56 beds
Archdiocesan Housing Authority (AHA) / Catholic Community Services (CCS)
Sta. Teresita del Nino Jesus 25 units
Archdiocesan Housing Authority (AHA) / Catholic Community Services (CCS)
Parke Studios (at the Josephinum) 15 beds
Archdiocesan Housing Authority (AHA) / Catholic Community Services (CCS)
Westlake 53 beds
Archdiocesan Housing Authority (AHA)
Bakhita Gardens 70 beds
Archdiocesan Housing Authority (AHA)
Dorothy Day 41 beds
Asian Counseling and Referral Services (ACRS)
HOPES 15 beds
Asian Counseling and Referral Services (ACRS)
The Beacon 6 beds
Catholic Community Services (CCS)
Palo Studios 17 beds
Catholic Community Services (CCS)
The Cedars 10 beds
Catholic Community Services (King County)
Monica's Place 5 beds
Community Housing Mental Health
Leighton Apartments 15 beds

A-24 Seattle/King County Homeless Performance Assessment and Recommendations
Appendices
Congregations for the Homeless Congregations -Permanent Housing Program
69 beds
Downtown Emergency Service Center (DESC)
Aurora Supportive Housing 87 beds
Downtown Emergency Service Center (DESC)
Evans (415 10th) 75 beds
Downtown Emergency Service Center (DESC)
Kerner Scott - OPH 15 beds
Downtown Emergency Service Center (DESC)
Lyon Building 64 beds
Downtown Emergency Service Center (DESC)
Morrison Hotel 190 beds
Downtown Emergency Service Center (DESC)
Rainier Supportive Housing 50 beds
Downtown Emergency Service Center (DESC)
Scattered Site for MI Adults 60 beds
Downtown Emergency Service Center (DESC)
Union Hotel 52 beds
Downtown Emergency Service Center (DESC)
1811 Eastlake 75 beds
Downtown Emergency Service Center (DESC)
Cottage Grove Apartments 20 beds
Evergreen Treatment Services REACH Respite Case Management 40 beds Friends of Youth FOY Permanent Housing with
Supports 16 units
Hopelink Duvall Place 8 units Imagine Housing Francis Village 15 units Imagine Housing Johnson Hill / Chalet Apartments 12 units Imagine Housing Rose Crest Apartments 8 units Imagine Housing Velocity Housing Stability Program 12 units Plymouth Housing Group (PHG) Shelter Plus Care \ Shelter Plus Care
HIV 74 units; 706 beds
Low Income Housing Institute (LIHI)
Frye Hotel 48 beds
Low Income Housing Institute (LIHI)
Glen Hotel 37 beds
Low Income Housing Institute (LIHI)
Greenwood House 9 beds
Low Income Housing Institute (LIHI)
Broadway House 7 beds
Low Income Housing Institute (LIHI)
White River Gardens 8 beds
Plymouth Housing Group (PHG) Gatewood 74 beds Plymouth Housing Group (PHG) Humphrey 81 beds Plymouth Housing Group (PHG) Pacific Hotel \ Pacific Hotel HIV 74 beds Plymouth Housing Group (PHG) Plymouth on Stewart 84 beds Plymouth Housing Group (PHG) Plymouth Place 70 beds

Seattle/King County Homeless Performance Assessment and Recommendations A-25
Appendices
Plymouth Housing Group (PHG) Scargo 45 beds Plymouth Housing Group (PHG) Simons Building (3rd and Blanchard) 92 beds Plymouth Housing Group (PHG) St. Charles 61 beds Plymouth Housing Group (PHG) Williams Apartments 81 beds Solid Ground Brettler Place 51 units Solid Ground P.G. Kenney Place 15 beds Sound Mental Health Homestead Family Housing 25 units Sound Mental Health Kasota 45 beds Sound Mental Health Kenyon Housing 18 beds Sound Mental Health Pacific Court 48 beds Sound Mental Health South County Pilot 50 beds Sound Mental Health / Low Income Housing Institute
Ernestine Anderson Place 45 beds
Sound Mental Health / Low Income Housing Institute
Gossett Place 9 units; 27 beds
Sound Mental Health / Low Income Housing Institute
McDermott Place / VASH McDermott Place
75 beds
The Sophia Way Sophia's Home 29 beds Transitional Resources Avalon Place 15 beds Valley Cities Counseling and Consultation
Coming Up 22 beds
Valley Cities Counseling and Consultation
Families First 24 units
Valley Cities Counseling and Consultation
Homeless Services Enhancement Program
12 units; 8 beds
Valley Cities Counseling and Consultation
Pathways First 14 units
Valley Cities Counseling and Consultation
Valley Cities Landing 24 beds
YMCA Home At Last 8 units; 7 beds YWCA Seattle - King - Snohomish
Family Village Issaquah-Project Based
26 beds
YWCA Seattle - King - Snohomish
Opportunity Place 29 beds
YWCA Seattle - King - Snohomish
Summerfield Apartments 13 beds
YMCA YMCA Permanent Housing 9 units; 4 beds City of Seattle Funded Permanent Supportive Housing
Archdiocesan Housing Authority (AHA) / Catholic Community Services (CCS)
Wintonia - C 92 beds
Compass Housing Alliance Nyer Urness House - C 75 beds Downtown Emergency Service Center (DESC)
Canaday House - C 83 beds

A-26 Seattle/King County Homeless Performance Assessment and Recommendations
Appendices
Rapid Rehousing
Organization Name Project Name Beds/Units Catholic Community Services (CCS)
CCS RRH Pilot 15 units
City of Seattle Funded Rapid Rehousing El Centro de la Raza El Centro Rapid Rehousing - C 3 units
Wellspring Family Services Wellspring RRH Pilot - C 6 units
YWCA Seattle - King - Snohomish YWCA Rapid Rehousing - C 2 units
Solid Ground SGO RRH Programs - C 27 units

Seattle/King County Homeless Performance Assessment and Recommendations A-27
Appendices
APPENDIX 6: HOMELESS CRISIS RESPONSE SYSTEM COMPONENT
System Component
Description Purpose Measures of Success
Evidence of Effectiveness
(See end of table)
Coordinated Entry (CES)
A community-wide, standardized approach that governs access into homeless services and housing. There can be a single or multiple coordinated entry points, but in either case all people who contact the system experience a standardized process of screening, assessment and referral.
People with most severe housing crisis (unsheltered and cycling in and out of shelter) are prioritized for assistance. All households receive the least intensive intervention needed to end their homelessness.
High rate of entry into system for unsheltered people and those with high barriers.
Most communities are just beginning to implement coordinated intake, assessment and referral, so little data is available on effectiveness. Anecdotal evidence suggests CES is helping ensure higher need households receive assistance; more effective use of system results.
Shelter Diversion
While CES prioritizes people with highest needs, those with lower needs and barriers are “diverted” from entering emergency shelter and homeless programs. Diversion targets unstably housed people (doubled up with friends or family or in a motel) who are seeking access to shelter. Services include problem solving, mediation, and one-time flexible financial assistance to preserve current housing and/or move directly to alternative housing. Not the same as traditional “homelessness prevention” which targets households facing eviction.
Households who have not yet lost their housing are prevented from entering the homeless system. Shelter capacity and higher intensity interventions are available for those with most acute needs (have no- where to go). Households who are diverted from shelter can still receive higher level intervention if diversion assistance is not sufficient (e.g. can receive rapid re-housing).
Low rate of entry into system for people who are still housed/have low housing barriers.
Diverted households do not return to system front door.
This model evolved in response to evidence that traditional prevention does little to prevent homelessness. Most prevention programs serve households that might be evicted but are unlikely to become unsheltered or enter shelter. Diversion targets people at the point they are seeking shelter and serves those most likely to actually become homeless without assistance. As a relatively new model, there is limited data yet available on effectiveness.

A-28 Seattle/King County Homeless Performance Assessment and Recommendations
Appendices
Emergency Shelter
Most emergency shelters are congregate facilities, though some family shelters offer separate units for each family. Generally shelters offer stays of 30 to 90 days. In a Housing Crisis Response System, shelter services are organized around helping clients identify a housing solution as quickly as possible. Clients are assisted to connect to other systems and services as needed. There are minimal barriers to entry and participation in services is voluntary.
Brief stop on the way to housing. Shelters meet immediate need for safety, address immediate crisis needs (food, clothing), assist household to identify and execute a plan to secure housing. Households exit as soon as a feasible housing plan can be executed. There is no required curriculum or service progression to be completed prior to housing placement.
Short lengths of stay and high rates of exit to permanent housing. Low rate of return to shelter.
“High barriers” shelters with strict program rules and mandatory service requirements have poor results in serving people with behavioral health needs and high housing barriers, have low rates of exit to housing. “Lower barriers” shelter with focus on quickly moving people to housing generally have stronger results.
Transitional Housing
Time-limited housing (can be shared units or individual apartments owned/leased by provider agency), typically with stays of 6 to 24 months. Service intensive model in which clients receive case management, on-site health and behavioral health services; education; employment; life skills and other services. Service participation is mandatory and clients are expected to develop and complete a service plan in order to “graduate” to permanent housing.
Generally this model is not compatible with an effective Homeless Crisis Response System, due to high barriers to entry, long lengths of stay and emphasis on non-housing-related services.
Successful transitional housing has short lengths of stay and high rates of exit to permanent housing.
There is no evidence that long stays and intensive mandatory services yield higher rates of exit to housing or lower rates of return to homelessness than rapid re-housing (RRH). Emerging thinking is that most homeless people are best served by RRH. HUD has advised that TH may be appropriate for special populations (TAY, DV, recovering substance users) but there is no data yet available to support this.

Seattle/King County Homeless Performance Assessment and Recommendations A-29
Appendices
Rapid Re-Housing
Short- or medium- term rental subsidy (usually starting with 3 to 4 months of assistance), after which the household takes over responsibility for paying their own rent. Services include help with locating housing and time-limited case management focused on maintaining stability in housing and linking the household to community resources.
Assist people who are unsheltered or living in shelter to secure new housing situation as quickly as possible, minimize time an individual or family is homeless. Provide least amount of rental assistance needed, ensuring as many households can be served as possible.
Short time from program enrollment to housing; high rate of securing housing; low rate of return to homelessness. Households might not remain in the same unit after subsidy ends, but this is still viewed as a success if they do not return to homelessness.
Outcome studies suggest people who are rapidly re-housed are more likely to secure and maintain housing than any other studied homeless program.
RRH can work for all populations. Important to target deeply and not exclude people with significant housing barriers.
Permanent Supportive
Housing
Long-term assistance and intensive services; targeted to those households who cannot successfully be housed using an RRH approach (i.e. chronically homeless people with high needs and barriers). PSH can be single site or scattered site apartments owned or leased by housing provider; or Long-term tenant based rental assistance. PSH includes intensive on-site case management with focus on housing stability, on-site health and behavioral health services.
Most intensive and costly intervention is reserved for those who cannot successfully become housed or remain housed in any other way.
High rate of entry to units by chronically homeless/ highest need people; low rate of return to homelessness.
People with severe and persistent mental illness have improved housing stability, health/wellness, etc. in permanent supportive housing. PSH generates cost savings by reducing use of costly publicly funded emergency services (e.g. emergency rooms, detox, jails, etc.). Cost effectiveness depends on targeting those with highest needs and housing barriers.
Links to Additional Information and Evidence of Effectiveness
A. Coordinated Intake, Assessment, and Referral
1. Coordinated Assessment Toolkit.http://www.endhomelessness.org/library/entry/coordinated-assessment-toolkit.
a. One Way In: The Advantages of Introducing System-Wide Coordinated Entry for HomelessFamilies.http://www.endhomelessness.org/page/-/files/3974_file_Coordinated_Entry_5_25_2011.pdf.

A-30 Seattle/King County Homeless Performance Assessment and Recommendations
Appendices
b. Coordinated Assessment Toolkit:Planning. http://www.endhomelessness.org/library/entry/coordinated-assessment-toolkit-planning-and-assessment. (This page contains link to planning tools, papers, webinars, and otherinformation).
2. HUD Exchange: Centralized Intake for Helping People Experiencing Homelessness: Overview,Community Profiles, andResources. https://www.hudexchange.info/resources/documents/HPRP_CentralizedIntake.pdf.
3. Coordinated Entry Policy Brief. February2015. https://www.hudexchange.info/resources/documents/Coordinated-Entry-Policy-Brief.pdf.
B. Shelter Diversion
1. National Alliance to End Homelessness (NAEH): Prevention and DiversionResources. http://www.endhomelessness.org/pages/prevention-and-diversion.
2. National Alliance to End Homelessness (NAEH): Prevention and DiversionToolkit. http://www.endhomelessness.org/library/entry/prevention-and-diversion-toolkit.
3. Closing the Front Door: Creating a Successful Diversion Program for HomelessFamilies. http://www.endhomelessness.org/library/entry/closing-the-front-door-creating-a-successful-diversion-program-for-homeless. August 16, 2011.
C. Emergency Shelter
1. Housing-Focused Emergency Shelter Conference Papers from February 27,2015. http://www.endhomelessness.org/library/entry/4.2-housing-focused-emergency-shelter.
D. Transitional Housing
1. Retooling Transitional Housing – VariousResources. http://www.endhomelessness.org/pages/retooling-transitional-housing.
2. Video - Frequently Asked Questions on Retooling TransitionalHousing. http://www.endhomelessness.org/library/entry/what-if-your-programs-leadership-doesnt-support-retooling-transitional-hous.
3. Retooling Transitional Housing Webinar. October 3,2012. http://www.endhomelessness.org/library/entry/retooling-transitional-housing-webinar.
4. SNAPS Weekly Focus: What about Transitional Housing? September 18,2013. https://www.hudexchange.info/news/snaps-weekly-focus-what-about-transitional-housing/.
E. Rapid Re-Housing
1. Emerging Research on Rapid Re-Housing. July2013. http://www.endhomelessness.org/library/entry/2.1-emerging-research-on-rapid-rehousing.
2. Rapid Re-Housing: A History and Core Components. April 22,2014. http://www.endhomelessness.org/library/entry/rapid-re-housing-a-history-and-core-components.

Seattle/King County Homeless Performance Assessment and Recommendations A-31
Appendices
3. Rapid Rehousing Brief. https://www.hudexchange.info/resources/documents/Rapid-Re-Housing-Brief.pdf.
4. Webinar: Core Principles of Housing First and Rapid Re-Housing. July 22,2014. https://www.usich.gov/tools-for-action/webinar-core-principles-of-housing-first-and-rapid-re-housing
5. HUD Family Options Study. July 2015.https://www.huduser.gov/portal/family_options_study.html#short-term-outcomes
6. Findings and Implications of the Family Options Study: An Analysis by the National Alliance to EndHomelessness. July 2015. http://www.endhomelessness.org/library/entry/findings-and-implications-of-the-family-options-study
F. Permanent Supportive Housing
1. Study: Permanent Supportive Housing Reduces Homelessness. July 8,2014. http://www.endhomelessness.org/blog/entry/study-permanent-supportive-housing-decreases-homelessness#.Vx50XTArKUk.
2. Moving on from Permanent Supportive Housing: Creating Successful Exits. Powerpoint by ConnieTempel. July 23, 2013. http://www.endhomelessness.org/library/entry/5.10-moving-on-from-permanent-supportive-housing-creating-successful-exits.
3. PHA Guide to Using Sponsor-Based Vouchers to Develop Permanent SupportiveHousing. https://www.usich.gov/resources/uploads/asset_library/PHA_SponsorVouchers.pdf.
4. FAQS About Supportive Housing Research: Is Supportive Housing CostEffective? http://www.csh.org/wp-content/uploads/2011/11/Cost-Effectiveness-FAQ.pdf.

A-32 Seattle/King County Homeless Performance Assessment and Recommendations
Appendices
APPENDIX 7: HIGH, MODERATE, & LOW PERFORMANCE GRAPHS
The following graphs provide an analysis of five performance measures – utilization rate, program entries from homelessness, length of stay, rate of exit to permanent housing, and cost per exit to permanent housing – categorized by the five program types. For each program type, individual projects were ranked and split intothree groups based on their performance level (high, moderate, and low), as well as whether the projects serve adult or family households. Performance graphs for rapid re-housing programs reflect only high and low performing projects, as there was insufficient data to further categorize the program type.
A. BED AND UNIT UTILIZATION RATE BY PROGRAM TYPE BY PERFORMANCE LEVEL The tables below present the utilization rate for emergency shelter, transitional housing, permanent supportive housing and other forms of permanent housing.40 This data uses bed utilization rates for single adult programs and unit utilization rates for family programs, as a unit within a family program may have unfilled beds simply due to housing a smaller sized family than the unit was designed to accommodate. The following graphs display utilization rate of each program type, which were subsequently categorized by project performance level.
40 Note: Rapid re-housing is not included in this analysis because this program type does not have a fixed bed capacity and so the methodology applied to the other program types does not generate comparable results.
110%91%
43%
82%76%
52%
0%10%20%30%40%50%60%70%80%90%
100%
High Performing(N=6)
ModeratePerforming
(N=18)
Low Performing(N= 4)
High Performing(N=3)
ModeratePerforming
(N=4)
Low Performing(N=4)
Adult Households Family Households
Perf
ecen
t of U
tiliza
tion
Emergency Shelter Utilization Rate for Adult and Family Households by Project Performance Level
UR for Adult HHs UR for Family HHs

Seattle/King County Homeless Performance Assessment and Recommendations A-33
Appendices
91% 96%87%
181%
91%
70%
0%
20%
40%
60%
80%
100%
120%
High Performing(N=4)
ModeratePerforming
(N=20)
Low Performing(N= 14)
High Performing(N=6)
ModeratePerforming
(N=14)
Low Performing(N=11)
Adult Households Family Households
Perc
ent o
f Util
izatio
n
Transitional Housing Utilization Rate for Adults and Families by Program Performance Level
Average UR for Adult HHs Average UR for Family HHs
107%
123%
75%
98%
0%
20%
40%
60%
80%
100%
120%
High Performing(N=4)
Moderate Performing(N=36)
Low Performing(N= 3)
Moderate Performing(N=3)
Adult Households Family Households
Perc
ent o
f Util
izatio
n
Permanent Supportive Housing Utilization Rate for Adult and Family Households by Project Performance Level
Average UR for Adult HHs

A-34 Seattle/King County Homeless Performance Assessment and Recommendations
Appendices
B. ENTRIES FROM HOMELESSNESS This measure looks at the degree to which programs are serving people with the most acute housing needs, particularly those who are literally homeless, meaning they are living outdoors, in a vehicle, or in an emergency shelter.
The graph below compares the rate at which households entered the five program types from literal homelessness.
i. Emergency Shelter
214%
102% 104%
123%141%
66%
0%
20%
40%
60%
80%
100%
120%
140%
High Performing(N=4)
ModeratePerforming
(N=5)
Low Performing(N=2)
High Performing(N=2)
ModeratePerforming
(N=4)
Low Performing(N=2)
Adult Households Family Households
Perc
ent o
f Util
izatio
n
Other Permanent Housing Utilization Rate for Adult and Family Households by Project Performance Level
Average UR for Adult HHs Average UR for Family HHs
77%67%
46%
70% 67%57%
0%10%20%30%40%50%60%70%80%90%
100%
High Performing(N=6)
ModeratePerforming
(N=18)
Low Performing(N= 4)
High Performing(N=3)
ModeratePerforming
(N=4)
Low Performing(N=4)
Adult Households Family Households
Perc
ent o
f Ent
ries f
rom
Lite
ral H
omel
essn
ess
Entries from Homeless Prior Living to Emergency Shelter for Adults and Families by Project Performance Level
Average Single HH Entries from Homelessness Average Family HH Entries from Homelessness

Seattle/King County Homeless Performance Assessment and Recommendations A-35
Appendices
89%
54%45%
89%
73%
56%
0%
10%
20%
30%
40%
50%
60%
70%
80%
90%
100%
High Performing(N=4)
ModeratePerforming
(N=20)
Low Performing(N= 14)
High Performing(N=6)
ModeratePerforming
(N=14)
Low Performing(N=11)
Adult Households Family Households
Entries from Homeless Prior Living to Transitional Housing for Adult and Family Households by Project Performance Level
Adult HH Entries from Homelessness Family HH Entries from Homelessness
88% 89%
0%
10%
20%
30%
40%
50%
60%
70%
80%
90%
100%
High Performing (N= 3) Low Performing (N=2)
Perc
enta
ge o
f Ent
ries f
rom
Lite
ral H
omel
essn
ess
Entries from Homeless Prior Living to Rapid Re-Housing for Adult and Family Households by Project Performance Level
Average Rate of Entries from Homelessness

A-36 Seattle/King County Homeless Performance Assessment and Recommendations
Appendices
100%
66%
36%
82%
0%
10%
20%
30%
40%
50%
60%
70%
80%
90%
100%
High Performing(N=4)
Moderate Performing(N=36)
Low Performing(N= 3)
Moderate Performing(N=3)
Adult Households Family Households
Entries from Homeless Prior Living to Permanent Supportive Housing for Adult and Family Households by Project
Performance Level
Average Entries from Homelessness for Adult HHs
41%
61%
37%
70%
54%
34%
0%
10%
20%
30%
40%
50%
60%
70%
80%
90%
100%
High Performing(N=4)
ModeratePerforming
(N=5)
Low Performing(N=2)
High Performing(N=2)
ModeratePerforming
(N=3)
Low Performing(N=1)
Adult Households Family Households
Entries from Homeless Prior Living for Adult and Family Households in Other Permanent Housing by Project
Performance Level
Entries from Homelessness for Adult HHs Entries from Homelessness for Family HHs

Seattle/King County Homeless Performance Assessment and Recommendations A-37
Appendices
C. LENGTHS OF STAY Achieving relatively short lengths of stay in emergency shelter, transitional housing, and rapid re-housing programs is essential to ending homelessness. As part of system right-sizing, the entire system must strive for the shortest stays needed to reach this goal. The following graphs show average length of stay for adult and family households in emergency shelter, transitional housing, and rapid re-housing programs.
517
40
29
40
79
01020304050607080
High Performing(N=6)
ModeratePerforming
(N=18)
Low Performing(N= 4)
High Performing(N=3)
ModeratePerforming
(N=4)
Low Performing(N=4)
Adult Households Family Households
Num
ber o
f Day
s Sta
yed
Average Length of Stay for Adult and Family Households in Emergency Shelter by Project Performance
Average LOS per Adult HH Average LOS per Family HH
242
297
397
483
399
677
0
100
200
300
400
500
600
700
High Performing(N=4)
ModeratePerforming
(N=20)
Low Performing(N= 14)
High Performing(N=6)
ModeratePerforming
(N=14)
Low Performing(N=11)
Adult Households Family Households
Num
ber o
f Day
s Sta
yed
Average Length of Stay for Adult and Family Households in Transitional Housing by Project Performance Level
Average LOS per Adult HH Average LOS per Family HH

A-38 Seattle/King County Homeless Performance Assessment and Recommendations
Appendices
D. EXITS TO PERMANENT HOUSING While helping households exit shelter and transitional housing quickly is a key strategy to end homelessness, it is just as important to understand where people go when they exit. This measures the degree to which a project assists clients to move to a housed situation, and is a critical aspect of project performance. The following tables display the rate of exits to permanent housing for emergency shelters, transitional housing, rapid re-housing, permanent supportive housing, and other permanent housing.
.
158
212
0
50
100
150
200
High Performing (N= 3) Low Performing (N=2)
Num
ber o
f Day
s Sta
yed
Average Length of Stay for Family Households in Rapid Re-Housing by Project Performance Level
Average LOS
5%
13%22%
33% 33% 29%
0%
20%
40%
60%
80%
100%
High Performing(N=6)
ModeratePerforming
(N=18)
Low Performing(N= 4)
High Performing(N=3)
ModeratePerforming
(N=4)
Low Performing(N=4)
Adult Households Family Households
Rate of Exit to Permanent Housing for Adult and Family Households by Project Performance Level
Adult HH Exits to PH Family HH Exits to PH

Seattle/King County Homeless Performance Assessment and Recommendations A-39
Appendices
80%
65%
42%
90%
65% 65%
0%10%20%30%40%50%60%70%80%90%
100%
High Performing(N=4)
ModeratePerforming
(N=20)
Low Performing(N=14)
High Performing(N=6)
ModeratePerforming
(N=14)
Low Performing(N=11)
Adult Households Family Households
Perc
ent o
f Exi
ts to
Per
man
ent H
ousin
gRate of Exits to Permanent Housing for Adult and Family
Households in Transitional Housing by Project Performance Level
Adult HH Exits to PH Family HH Exits to PH
70%
26%
0%
10%
20%
30%
40%
50%
60%
70%
80%
90%
100%
High Performing (N= 3) Low Performing (N=2)
Perc
ent o
f Exi
ts to
PH
Rate of Exits to Permanent Housing for Family Households in Rapid Re-Housing by Project Performance Level
Average PH Exits

A-40 Seattle/King County Homeless Performance Assessment and Recommendations
Appendices
100%
37%
50%
37%
0%10%20%30%40%50%60%70%80%90%
100%
High Performing(N=4)
Moderate Performing(N=36)
Low Performing(N= 3)
Moderate Performing(N=3)
Adult Households Family Households
Perc
ent o
f Exi
ts to
Per
mna
nent
Hou
sing
Rate of Exits to Permanent Housing for Adult and Family Households from Permanent Supportive Housing by Project
Performance Level
Average Exits to PH for Adult HHs
69%
40% 38%
90%
50%
0%0%
10%
20%
30%
40%
50%
60%
70%
80%
90%
100%
High Performing(N=4)
ModeratePerforming
(N=5)
Low Performing(N=2)
High Performing(N=2)
ModeratePerforming
(N=4)
Low Performing(N=2)
Adult Households Family Households
Rate of Exits to Permanent Housing from Other Permanent Housing for Adult and Family Households by Project
Performance Level
Average Exits to PH for Adult HHs Average Exits to PH for Family HHs

Seattle/King County Homeless Performance Assessment and Recommendations A-41
Appendices
E. COST PER EXIT TO PERMANENT HOUSING To create a more efficient system, it is essential that investments are aligned with the objective of ending homelessness. Cost per permanent housing exit is a key performance measure because it assesses not only whether a program is helping clients to move to permanent housing, but also whether they do so in a cost effective manner. The graphs below shows the average cost per permanent housing exit for all program types grouped by project performance level. These figures are calculated using the total program cost, utilization of beds/units and client length of stay (cost per day is calculated and then multiplied by the number of days the individual/family was in the program).
$212 $702
$3,914
$2,493
$4,551
$10,364
$0
$2,000
$4,000
$6,000
$8,000
$10,000
High Performing(N=6)
ModeratePerforming
(N=18)
Low Performing(N= 4)
High Performing(N=3)
ModeratePerforming
(N=4)
Low Performing(N=4)
Adult Households Family Households
Cost per Household Exit to Permanent Housing for Adult and Family Households in Emergency Shelter by Project
Performance Level
Cost per Adult HH Exit to PH Cost per Family HH to PH

A-42 Seattle/King County Homeless Performance Assessment and Recommendations
Appendices
$7,607
$15,797
$31,556
$16,332 $20,820
$65,509
$0
$10,000
$20,000
$30,000
$40,000
$50,000
$60,000
$70,000
High Performing(N=4)
ModeratePerforming
(N=20)
Low Performing(N= 14)
High Performing(N=6)
ModeratePerforming
(N=14)
Low Performing(N=11)
Adult Households Family Households
Average Cost per Household Exit to Permanent Housing from Transitional Housing for Adult and Family Households by
Project Performace Level
Average Cost per Adult HH Exit to PH Average Cost per Family HH to PH
$9,898
$16,335
$0
$2,000
$4,000
$6,000
$8,000
$10,000
$12,000
$14,000
$16,000
$18,000
High Performing (N= 3) Low Performing (N=2)
Cost
per
Exi
t
Average Cost per Family Household Exit to Permanent Housing from Rapid Re-Housing by Project Performance
Level
Average Cost per Exit to PH

Seattle/King County Homeless Performance Assessment and Recommendations A-43
Appendices
$9,038 $12,174
$49,238
$21,234
$0$5,000
$10,000$15,000$20,000$25,000$30,000$35,000$40,000$45,000$50,000
High Performing(N=4)
Moderate Performing(N=36)
Low Performing(N= 3)
Moderate Performing(N=3)
Adult Households Family Households
Cost per Exit to Permanent Housing for Adult and Family Households from Permanent Supportive Housing
Average Cost per Adult HH
$7,514 $7,344
$10,462
$4,656
$7,542
$12,082
$0
$2,000
$4,000
$6,000
$8,000
$10,000
$12,000
$14,000
High Performing(N=4)
ModeratePerforming
(N=5)
Low Performing(N=2)
High Performing(N=2)
ModeratePerforming
(N=4)
Low Performing(N=2)
Adult Households Family Households
Cost per Household Exit to Permanent Housing from Other Permanent Supportive Housing by Project Performance Level
Cost per Adult HH Exit to PH Cost per Family HH Exit to PH

A-44 Seattle/King County Homeless Performance Assessment and Recommendations
Appendices
APPENDIX 8: DISPARITY ANALYSIS
A. AGE GROUP DISPARITIES
30%
23%
2% 3%
21%
3%
54%
26%
1% 2%6%
2%
61%
22%
1%3% 4%
2%
0%
10%
20%
30%
40%
50%
60%
70%
Unsheltered Emergency Shelter TransitionalHousing
Permanent Housing Friends/Family Institution
Living Situation Prior to Shelter Entry by Age Group
18-24 25-59 60+
10%
32%
15%
4%
31%
8%17%
43%
12%3%
21%
4%
15%
42%
11%4%
25%
4%
0%
10%
20%
30%
40%
50%
60%
70%
80%
90%
100%
Unsheltered Emergency Shelter TransitionalHousing
Institution PermanentHousing
Other
Exit Destination from Shelter by Age
18-24 25-59 60+

Seattle/King County Homeless Performance Assessment and Recommendations A-45
Appendices
B. GENDER DISPARITIES
55%
27%
1% 3%9%
1%
55%
27%
1% 2%7%
3%
0%
10%
20%
30%
40%
50%
60%
70%
Unsheltered Emergency Shelter TransitionalHousing
PermanentHousing
Friends/Family Institution
Living Situation Prior to Shelter Entry by Gender
Female Male
6%
43%
12%
2%
30%
6%
19%
40%
13%
4%
20%
4%
0%
10%
20%
30%
40%
50%
60%
70%
Unsheltered Emergency Shelter TransitionalHousing
Institution PermanentHousing
Other
Exit Destination from Shelter by Gender
Female Male
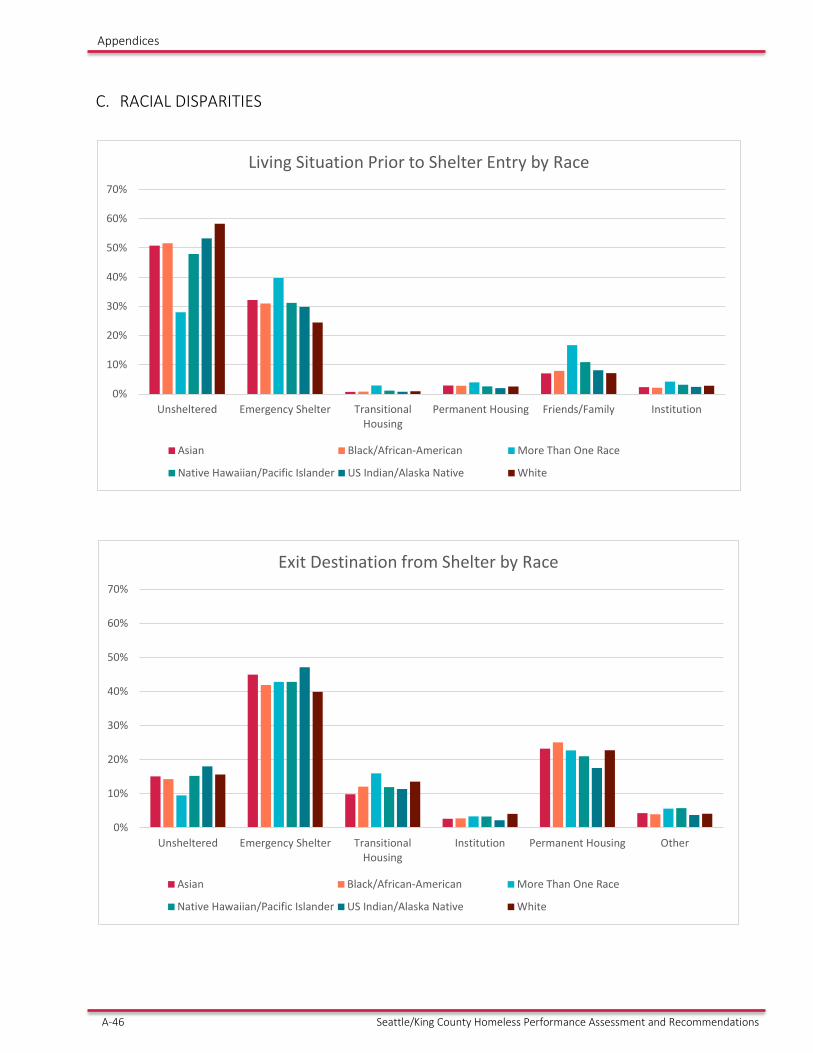
A-46 Seattle/King County Homeless Performance Assessment and Recommendations
Appendices
C. RACIAL DISPARITIES
0%
10%
20%
30%
40%
50%
60%
70%
Unsheltered Emergency Shelter TransitionalHousing
Permanent Housing Friends/Family Institution
Living Situation Prior to Shelter Entry by Race
Asian Black/African-American More Than One Race
Native Hawaiian/Pacific Islander US Indian/Alaska Native White
0%
10%
20%
30%
40%
50%
60%
70%
Unsheltered Emergency Shelter TransitionalHousing
Institution Permanent Housing Other
Exit Destination from Shelter by Race
Asian Black/African-American More Than One Race
Native Hawaiian/Pacific Islander US Indian/Alaska Native White
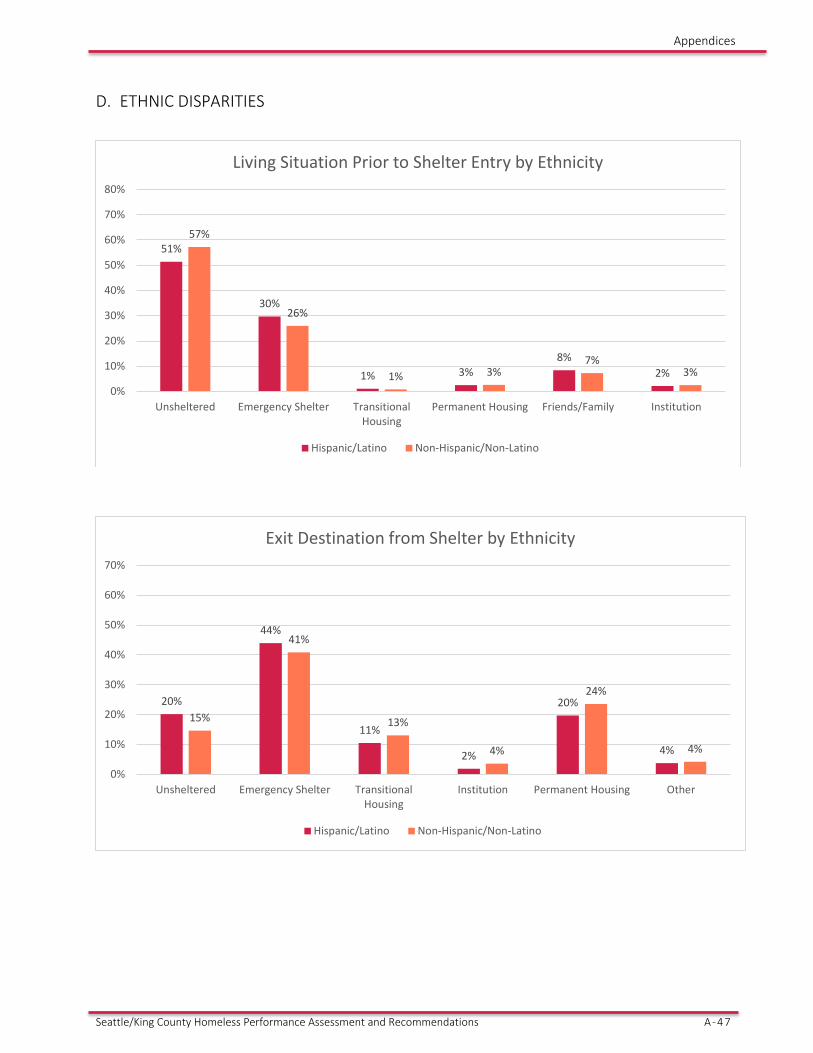
Seattle/King County Homeless Performance Assessment and Recommendations A-47
Appendices
D. ETHNIC DISPARITIES
51%
30%
1% 3%8%
2%
57%
26%
1% 3%7%
3%
0%
10%
20%
30%
40%
50%
60%
70%
80%
Unsheltered Emergency Shelter TransitionalHousing
Permanent Housing Friends/Family Institution
Living Situation Prior to Shelter Entry by Ethnicity
Hispanic/Latino Non-Hispanic/Non-Latino
20%
44%
11%
2%
20%
4%
15%
41%
13%
4%
24%
4%
0%
10%
20%
30%
40%
50%
60%
70%
Unsheltered Emergency Shelter TransitionalHousing
Institution Permanent Housing Other
Exit Destination from Shelter by Ethnicity
Hispanic/Latino Non-Hispanic/Non-Latino
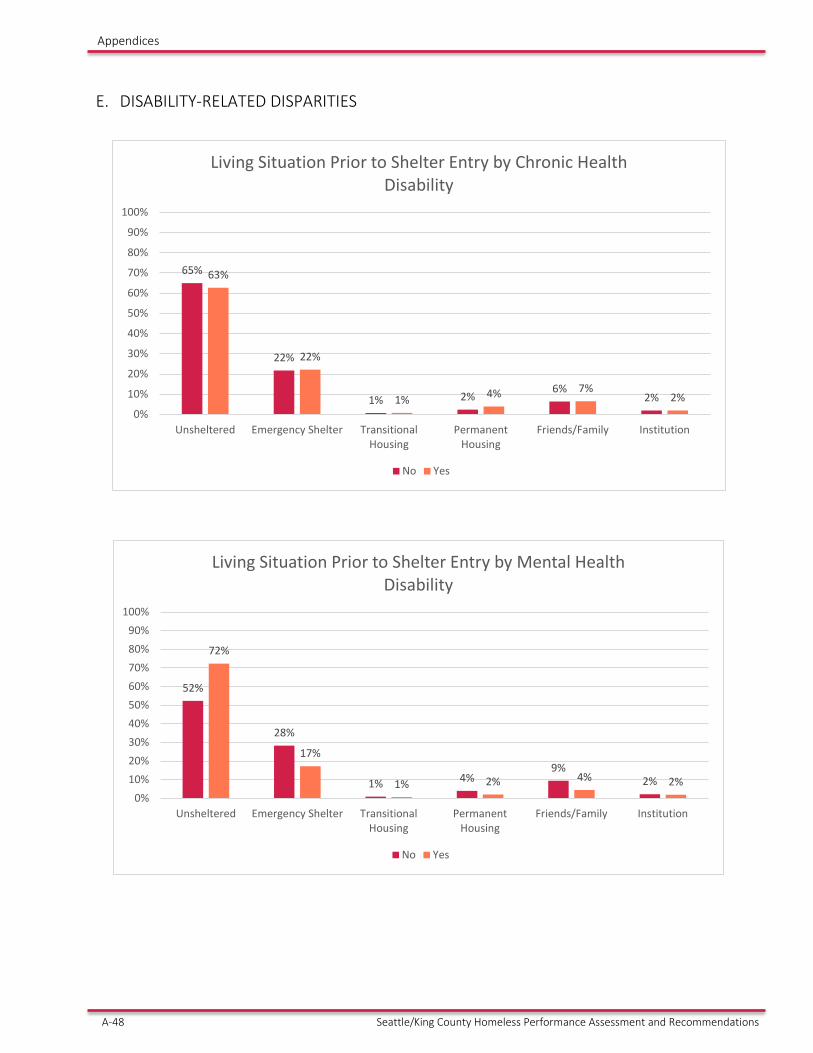
A-48 Seattle/King County Homeless Performance Assessment and Recommendations
Appendices
E. DISABILITY-RELATED DISPARITIES
65%
22%
1% 2%6%
2%
63%
22%
1% 4% 7%2%
0%
10%
20%
30%
40%
50%
60%
70%
80%
90%
100%
Unsheltered Emergency Shelter TransitionalHousing
PermanentHousing
Friends/Family Institution
Living Situation Prior to Shelter Entry by Chronic Health Disability
No Yes
52%
28%
1% 4%9%
2%
72%
17%
1% 2% 4% 2%0%
10%20%30%40%50%60%70%80%90%
100%
Unsheltered Emergency Shelter TransitionalHousing
PermanentHousing
Friends/Family Institution
Living Situation Prior to Shelter Entry by Mental Health Disability
No Yes
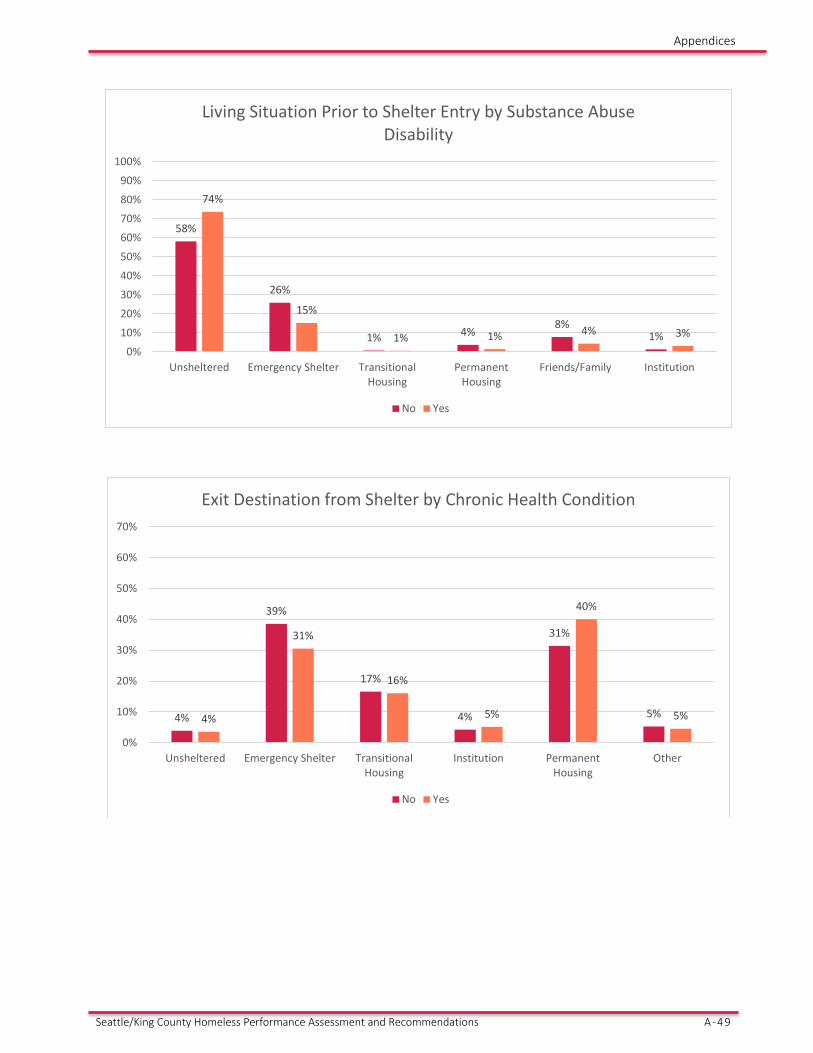
Seattle/King County Homeless Performance Assessment and Recommendations A-49
Appendices
58%
26%
1% 4%8%
1%
74%
15%
1% 1% 4% 3%0%
10%
20%
30%
40%
50%
60%
70%
80%
90%
100%
Unsheltered Emergency Shelter TransitionalHousing
PermanentHousing
Friends/Family Institution
Living Situation Prior to Shelter Entry by Substance Abuse Disability
No Yes
4%
39%
17%
4%
31%
5%4%
31%
16%
5%
40%
5%
0%
10%
20%
30%
40%
50%
60%
70%
Unsheltered Emergency Shelter TransitionalHousing
Institution PermanentHousing
Other
Exit Destination from Shelter by Chronic Health Condition
No Yes

A-50 Seattle/King County Homeless Performance Assessment and Recommendations
Appendices
4%
38%
17%
4%
32%
5%4%
32%
18%
6%
36%
5%
0%
10%
20%
30%
40%
50%
60%
70%
Unsheltered Emergency Shelter TransitionalHousing
Institution PermanentHousing
Other
Exit Destination by Mental Health Disability
No Yes
4%
38%
15%
3%
35%
5%4%
30%
21%
9%
31%
5%
0%
10%
20%
30%
40%
50%
60%
70%
Unsheltered Emergency Shelter TransitionalHousing
Institution PermanentHousing
Other
Exit Destination from Shelter by Substance Abuse Disability
No Yes

Seattle/King County Homeless Performance Assessment and Recommendations A-51
Appendices
APPENDIX 9: TYPOLOGY DATA QUALITY Focus Strategies considered whether the very long lengths of stay associated with 2015 stays might be accounted for by data quality issues. We investigated several different possibilities to attempt to determine the underlying issue:
• Frequency of No Recorded Exit in HMIS: Of the 12,102 stays, 2,756 (22.8%) did not have an exit date. Of these, 1686 (61%) had entered within the last year, 487 (18%) within 2 years, 405 (15%) within 3 years, 141 (5%) within 4 years, and 37 (1%) more than 4 years ago. Because the frequency of no recorded exit decreases over time, it is likely some are valid and some are not. It is impossible to tell which are which.
• Overutilization by Specific Shelters: We looked at whether specific programs were responsible for not recording exits in HMIS and found that over 20 shelters were represented in this group.
• Multiple Open Entries: We looked at whether people with no recorded exits in HMIS were more likely to have multiple simultaneous open entries. While we did find some of these, the majority (96%) did not.
Because we were unable to determine a specific cause of the data quality issue (and therefore unable to eliminate specific records), we made estimated adjustments in our analyses. We describe these in Appendix 10.

A-52 Seattle/King County Homeless Performance Assessment and Recommendations
Appendices
APPENDIX 10: NUMBER OF DAYS STAYED BY QUARTILE As noted above and described in Appendix 9, the distribution of days in shelter was skewed for those with a single stay as an apparent result of exits not being consistently recorded in HMIS. The table below presents the number of days as represented in the data. In order to adjust, we conservatively estimated that 50% of days in Q4 for single stayers might be a data quality artifact. The second table shows the adjusted number of days, which is the information we used to develop the estimated proportion of days of shelter used by each of the subtypes.
Total Days in Shelter for People in Each Number of Stays by Days Category
Quartiles for Number of ES Days in 2015 Total Days
Q1 Q2 Q3 Q4
Number of Stays in 2015
1 stay 29,442 57,459 113,647 253,065 453,613
2 stays 5,077 22,523 56,087 90,489 174,176
3+ stays 2,841 32,849 83,672 143,640 263,002
Total Days 37,360 112,832 253,406 487,194 890,791
Adjusted Days in Shelter for People in Each Number of Stays by Days Category
Quartiles for Number of ES Days in 2015 Total Days
Q1 Q2 Q3 Q4
Number of Stays in 2015
1 stay 29,442 57,459 113,647 126,533 327,081
2 stays 5,077 22,523 56,087 90,489 174,176
3+ stays 2,841 32,849 83,672 143,640 263,002
Total Days 37,360 112,832 253,406 360,662 764,260
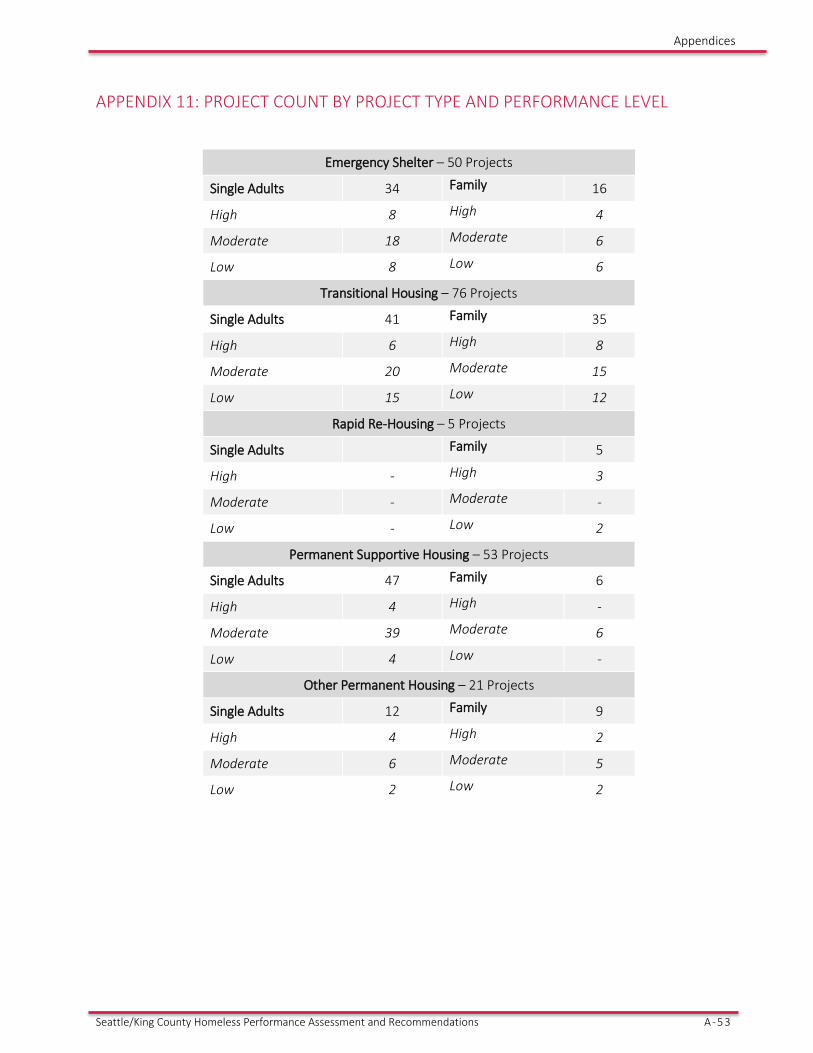
Seattle/King County Homeless Performance Assessment and Recommendations A-53
Appendices
APPENDIX 11: PROJECT COUNT BY PROJECT TYPE AND PERFORMANCE LEVEL
Emergency Shelter – 50 Projects
Single Adults 34 Family 16
High 8 High 4
Moderate 18 Moderate 6
Low 8 Low 6
Transitional Housing – 76 Projects
Single Adults 41 Family 35
High 6 High 8
Moderate 20 Moderate 15
Low 15 Low 12
Rapid Re-Housing – 5 Projects
Single Adults Family 5
High - High 3
Moderate - Moderate -
Low - Low 2
Permanent Supportive Housing – 53 Projects
Single Adults 47 Family 6
High 4 High -
Moderate 39 Moderate 6
Low 4 Low -
Other Permanent Housing – 21 Projects
Single Adults 12 Family 9
High 4 High 2
Moderate 6 Moderate 5
Low 2 Low 2
A-54 Seattle/King County Homeless Performance Assessment and Recommendations
Appendices
APPENDIX 12: UTILIZING A “MOVING ON” APPROACH TO INCREASE PSH CAPACITY IN SEATTLE/KING COUNTY In recent years, as communities have looked more carefully at homeless system performance, there has been an interest in developing strategies to make better use of existing permanent supportive housing (PSH) inventory. For many communities, a significant portion of homeless assistance funding is dedicated to the ongoing operation of PSH units which have relatively low turnover rates. This limits the capacity of the overall system to house chronically homeless people and thereby reduce unsheltered homelessness. “Moving on” is a strategy that transitions stable households from PSH into the Housing Choice Voucher program or other mainstream affordable housing, freeing up their PSH unit for a higher need household. Over time, many supportive housing tenants may no longer require the level of support PSH provides, yet most remain enrolled in the program as they continue to benefit from a rental subsidy. A partnership with the Public Housing Authority, in which these tenants can “move up” into more independent housing, allows for turnover in PSH and creates capacity to permanently house other eligible households, particularly those who are chronically homeless. Moving On programs allow successful PSH tenants to become more independent while still retaining a rent subsidy. Although Moving On has traditionally been reserved for individuals with Shelter Plus Care vouchers, Focus Strategies suggests that Seattle/King County apply this approach in a much broader context for individuals utilizing not only voucher programs but other site-based permanent supportive housing. The more PSH can be made available, the more quickly the community can see a decrease in the unsheltered population and the population of long-term shelter stayers. We recommend a large-scale “moving on” initiative to help PSH tenants who are stable and no longer need intensive support to transition to mainstream permanent housing whenever possible. There are a variety of ways this can be accomplished, most of which will require partnership between All Home, the Seattle Housing Authority, and the King County Housing Authority to help stable tenants transition out of PSH. The most streamlined approach will be to transition tenants who have tenant-based S+C or other voucher source into the HCV program, which means they can remain in permanent housing (often or even usually in the same housing unit) but their S+C subsidy is freed up for another high-needs client.
A. “MOVING ON” HISTORY AND BACKGROUND As previously noted, the Moving On approach has traditionally been used in the context of Shelter Plus Care (S+C) grants. Since the S+C program was authorized under Subtitle F of the McKinney-Vento Homeless Assistance Act in 1992, HUD has awarded S+C funds to state and local governments, as well as public housing authorities to serve homeless people with disabilities, including serious mental illness, chronic substance abuse, and/or AIDS and related diseases. Over time, many S+C households are able to stabilize and no longer need the level of service provided. However, since these households typically have extremely low incomes (usually SSI), most still significantly benefit from the continued rental subsidies. As a result, many stable households retain S+C, despite their ability to move onto more independent housing. A lack of continuous flow through the program has resulted in S+C’s inability to take on new clients, thus preventing the opportunity to provide a permanent housing opportunity for homeless people with serious disabilities who are homeless.
B. PRINCIPLES AND PRACTICES OF MOVING ON Adopting a Moving On program in Seattle/King County would create ongoing capacity in many PSH programs,

Seattle/King County Homeless Performance Assessment and Recommendations A-55
Appendices
including but not limited to S+C, to permanently house literally homeless individuals who would otherwise remain unhoused. The following sections provide information on how Moving On programs are structured, as well as examples of existing Moving On programs in outside communities.
IMPLEMENTING A MOVING ON PROGRAM In recent years, HUD has made clear its interest in Housing Authorities affirmatively collaborating with and participating in local efforts to end homelessness. For the first time, the October 2015 CoC NOFA awarded points to communities that have Moving On programs or similar efforts that effectively move PSH clients into permanent housing with less services. Previously, the NOFA included generalities about collaboration, however HUD is specifically giving a competitive advantage to CoCs that can show they are partnering with their local PHA to secure admissions preferences for homeless people in mainstream housing programs. The annual CoC funding process has become more competitive over time, and a community’s ability to demonstrate real policy commitment and results at the local level will translate to performance in the competitive process. King County’s local CoC application to receive federal dollars for providing housing to homeless people would be strengthened if a Moving On program was in place. However, challenges exist in attempting to develop Moving On programs. For instance, many housing authorities face difficulty in implementing Moving On programs while simultaneously adhering to strict regulations that govern the HCV program. Even under the more flexible Moving to Work (MTW) vouchers still have to align with the HCV regulatory framework. To aid communities looking to adopt Moving On, HUD issued a notice in 2013 that provides guidance for housing authorities regarding effective ways to utilize the Housing Choice Voucher program to house individuals and families experiencing homelessness.41 The notice specifically recommends that Housing Authorities establish a means for prioritizing individuals and families who are “moving on” from PSH Units. The 2013 HUD notice provides guidance to housing authorities on how to further federal policy shifts expressed in the United States Interagency Council on Homelessness’ (USICH) comprehensive strategy to prevent and end homelessness, Opening Doors: Federal Strategic Plan to Prevent and End Homelessness (Opening Doors). This HUD guidance included the following: 1. In order to track “our collective effort” in ending homelessness, HUD directed housing authorities to
track and report the households that were homeless at the time of admission into public housing and the HCV program.
2. In order to make sure that public housing and HCV resources are targeted to the households with the highest barriers to housing, HUD narrowed the definition of who the PHA should report as homeless at time of admission to: (a) individuals or families with a primary nighttime residence that is not designed as a place for human habitation; or (b) individuals or families in shelter, transitional housing, or in motel that is paid for by a charitable organization of a governmental agency; or (c) an individual exiting from an institution he or she resided in for 90 days or less and was in a shelter or a place not meant for human habitation immediately preceding the institutionalization; or (d) a person fleeing domestic violence with no other resources of other residences to go to.
41 U.S. Department of Housing and Urban Development Office of Public and Indian Housing, NOTICE PIH 2013-15 (HA), Guidance on housing individuals and families experiencing homelessness through the Public Housing and Housing Choice Voucher Programs.

A-56 Seattle/King County Homeless Performance Assessment and Recommendations
Appendices
3. HUD provided significant guidance on how PHAs should manage their waiting lists in order to remove barriers to homeless individuals and families accessing public and HCV housing by: a. Establishing strong outreach strategies through partnerships with local service providers; b. Strengthening processes for contacting applicants on their waiting lists; c. Establishing flexible intake and briefing schedules; and establishing nondiscriminatory preferences in
their admissions policies for persons experience homelessness, or a subset of homeless people (e.g. chronically homeless, homeless veterans, homeless people identified as most vulnerable through community-based assessment strategies).
4. Most importantly, HUD provided significant guidance on how to establish a preference for people experiencing homelessness, the most significant way PHAs can improve access to public and HCV. Doing so requires an amendment to the housing authority’s Administrative Plan, and if the change is a significant amendment, it requires public comment and consultation with the resident advisory board.
5. Housing Authorities must base their local preferences on needs and priorities rooted in data. HUD recommends that the PHA’s local needs and assessment specifically include people experiencing homelessness based on HMIS or Point-In-Time data.
6. To make administration of the preference manageable, HUD recommends several strategies: a. The PHA can limit the preference to admissions to the HCV, Project-Based Voucher, Public Housing,
or to a specific project and can even set aside a specific number of units within a development for preferential admission.
b. The PHA can limit the number of applicants who can qualify for the preference. c. The PHA can create a preference that is limited to people who are referred by a partnering homeless
agency of consortia of agencies (e.g. an organization that refers people transitioning out of shelter, transitional housing, or rapid rehousing).
d. The PHA can create a preference that is limited to people who are “moving up” from permanent supportive housing and no longer need the same level of supportive services.
e. The PHA must serve people on the existing waiting list who qualify for the preference. If the PHA does not have enough applicants in its existing waiting list, the PHA may open its waiting list only for people qualified for the preference.
f. In opening the waiting list for people who qualify for the preference, the PHA should reach out to shelters and other homeless service providers. HUD strongly encourages PHAs to participate in the community’s coordinated assessment system and to develop a means for referrals.
g. The PHA can close the waiting list once there are an adequate number of applicants on the list or may leave the waiting list open only for people qualified for the preference.
MODELS OF MOVING ON IN OUTSIDE COMMUNITIES In recent years, several communities across the nation have implemented Moving On strategies for housing a greater number of people who are most in need of services, while simultaneously moving others into less service-intensive yet deeply subsidized permanent housing. Some of these communities are listed below, in addition to some best practices and results in implementing Moving On programs. 1. Blueprint Voucher Program, Department of Behavioral Health, Homeless Services Unit, City of Philadelphia – Since 2008, the City of Philadelphia has utilized a Moving On program as part of its efforts to end chronic homelessness. In response to the dramatically increasing number of people living on the streets,

Seattle/King County Homeless Performance Assessment and Recommendations A-57
Appendices
the Deputy Mayor’s Office for Health and Opportunity, in partnership with the Philadelphia Housing Authority made available 200 tenant based rental assistance vouchers annually for homeless people in a program called the Blueprint Voucher Program42. The program targets individuals with serious and persistent behavioral health conditions and/or histories of chronic homelessness. In 2014, the City of Philadelphia hired a consulting agency TAC, Inc. to evaluate the program. The evaluation confirmed that 100% of the people who received vouchers had documented mental illness and/or substance abuse disorder. Around 85% of the participants were dually diagnosed, and 40% were chronically homeless. At the time of the evaluation, 89% of the individuals housed through the program remained stably housed. In addition to its impressive housing outcomes, the Blueprint Voucher program also facilitated flow through their homeless service system. The program instituted a “backfill” policy that required the spot created by the person who received a voucher to be filled by an individual living on the street. The program demonstrates the positive impact that a successful partnership between City officials and a local housing authority can have on addressing the housing needs of extremely vulnerable homeless individuals. Through the City of Philadelphia’s strong leadership and clear targeting of resources, approximately 1,000 of the most vulnerable homeless population received access to permanent supportive housing, 89% of whom have remained housed. 2. Alameda County, California – The Alameda County Housing & Community Development Department (ACHCD) operates a large Shelter Plus Care program with nearly 500 S+C certificates. ACHCD manages many aspects of the program including outreach, determining applicant eligibility, and coordinating services with a consortia of homeless agencies. ACHCD subcontracts with both the Alameda County Housing Authority (ACHA) and the Oakland Housing Authority (OHA) to administer housing assistance payments, conduct Housing Quality Standard inspections, as well as certify the income of participants and calculate the tenant’s portion of rent. Units are scattered throughout the county, while OHA services the units specifically located in Oakland. In 2015, ACHCD alongside the OHA, a Moving to Work Housing Authority, created a Moving On program, in which OHA agreed to designate at least 75 HCVs for current S+C tenants residing in Oakland. To be qualified, the household must be deemed “prepared” for independent housing, as deemed by a case manager through an “Affidavit of Preparedness” to affirm the household’s stability. The affidavit attests that the tenant has been compliant with his or her lease, has stable income with no interruption, has no rent or utility arrears with both paid on time, has a history of good relations with the property owner/ manager and neighbors, and agrees to remain at their current address with a new 12-month lease approved by the HCV program. The tenants are able to “move on” from the S+C subsidy to the HCV program without having to physically move. 3. Jericho Project, New York City, New York – The Jericho Project, a large provider of homeless services in New York City, serves over 1,600 people per year and operates more than 500 units of supportive housing. Jericho owns seven congregate supportive housing residences and manages a scattered-site program with more than 115 units rented on the open market throughout New York City. Moving On is a core approach for Jericho Project’s services and the program actively assists their tenants to move from supportive housing while maintaining a promise that tenancy is without limits. Each year, around 10% of their tenants move on to independent housing using Housing Choice Vouchers provided by the New York City Housing Authority. Their On with Life (OWL) program maintains a dedicated case manager and a part-time housing specialist who work by Moving On principles. Readiness for OWL
42 The program is an element of the City of Philadelphia Mayor’s Plan to End Homelessness.

A-58 Seattle/King County Homeless Performance Assessment and Recommendations
Appendices
services is determined by the tenant having been a resident for at least 12 months, maintaining a willingness to participate, having the income necessary to make moving on realistic, and adhering to lease terms, including the lack of rent arrears and no nuisance behavior. Once the tenant departs from Jericho, OWL staff provide linkages to mainstream services and remain in touch for six months of aftercare. One month after the transition, the OWL case manager makes a home visit to ensure the client has settled into their apartment and they are paying their rent and budgeting their money, as well as help address any issues with the landlord and assess whether other services are needed.

Seattle/King County Homeless Performance Assessment and Recommendations A-59
Appendices
APPENDIX 13: MODELING ASSUMPTIONS TO DECREASE UNSHELTERED HOMELESSNESS Assumptions Used to Model Decreases in Unsheltered Homelessness The modeling indicates that Seattle/King County has the ES capacity to shelter all unsheltered single adult and family households by the end of 2017 by combining three initiatives:
• Reaching recommended system and program performance targets (see Performance Targets Table below);
• Implementing a well-functioning coordinated entry and diversion system (see Performance Targets Table below, specifically for Entries from Homelessness); also reflected by assumptions below of 25% of families and single adults experiencing homelessness being diverted from the homeless system); and
• Eliminating low and moderately performing TH projects.
Performance Targets
Emergency Shelter
Transitional Housing Rapid Rehousing Permanent
Supportive Housing Utilization Rate 90% 96% NA 100% Length of Stay 27 days 285 days 150 days See Note* Exit Rate to PH 40%(S)/65%(F) 80% 80% See Note* Entries From Homelessness
75% unsheltered
75% unsheltered/ES
10% unsheltered, 85% ES (total 95%) 75% unsheltered/ES
*PSH performance requires a more nuanced approach on these dimensions which takes into account turnover rate.
Modeling Assumptions to Decrease Emergency Shelter Population
• Eliminating low and moderately performing transitional housing frees up $15,881,164 (approximately $10+ million for single adults and $5+ millions for families).
• Assumptions for Families:
• Initially house 805 family households (all family households) predicted to be using emergency shelter in 2017;
• 480 new homeless families to house per year from 2nd year (assumed a consistent 800 family households per year present to shelter, 25% diverted, 20% of those remaining self-resolve); and
• 25% rate of turnover from PSH portfolio after implementation of a Moving-On Program.

A-60 Seattle/King County Homeless Performance Assessment and Recommendations
Appendices
Table: Assumptions for Family Households
Family HHs Number of Unique Households 805 PSH Units 420 PSH Regular Turnover (from BYC) 84 Moving On PSH Turnover (25% of portfolio) 105 High Performing TH exits (from BYC) 115 Number To House in RRH (805 - 84 - 105 - 115 = 501) 501 Dollars Available from TH $ 5,429,805 RRH cost/HH $ 10,000 RRH units 543 Time to House < 1 year "Surplus" units 42 Dollars Available for Single Adults $420,000 New 480 HH to house per year from 2nd year 480 Ongoing RRH Cost for New Entries from 2nd year $4,800,000
• Assumptions for Single Adults:
o Initially house 4,974 single adult households (those who use the greatest number of shelter days) predicted to be using emergency shelter in 2017;
o 660 new homeless single adults to house per year (assume 7,750 single adult households per year present to shelter, 25% diverted, 25% self-resolve, 15% of those remaining are new to homelessness);
o 13% rate of regular turnover (over four years) from PSH portfolio; and
o 25% rate of turnover (over four years) from PSH portfolio after implementation of a Moving-On Program.
(See table on the following page).

Seattle/King County Homeless Performance Assessment and Recommendations A-61
Appendices
Table: Assumptions for Single Adult Households Single Adults: Long-
Term and Frequent Stayers
Single Adults: Remaining
Households
Number of Households 4,974 7,957 PSH Units 4,223 PSH Regular Turnover (from BYC) 555 Moving On PSH Turnover (25% of portfolio) 1,056 High Performing TH exits (from BYC) 158 Number To House in RRH+CTI (4,974 - 555 - 1,056 - 158 = 3,205) 3,205
Dollars Available from TH $ 10,451,359 Dollars from Family system $420,000 Total Available $10,871,359 RRH + CTI cost/HH $15,000 RRH + CTI units 725 Time to House 4.4 years Number of Self-Resolving HH (% Based on Single Adults Analysis – those using the fewest shelter days – 1st and 2nd quartile)
4,910
Number of Existing HH To House in RRH (7,957 - 4,910 = 3,047) 3,047
15% new entries a year for 4 years (660/year) 2,640 Total Number To House in RRH 5,687 RRH Cost/HH $10,000 Total RRH Cost $56,870,000 RRH Cost/Year for 4 years $14,220,000 Ongoing RRH Cost for New Entries from 5th year $6,600,000

A-62 Seattle/King County Homeless Performance Assessment and Recommendations
Appendices
APPENDIX 14: PROGRAMMATIC CHANGES FOR 2015 AND 2016 INCORPORATED IN THE MODEL
Added/Removed Single Adult/Family Beds/Units Comments
Emergency Shelter Added Single Adult 266 Beds Added Single Adult 480 Beds Seasonal/Overflow Removed Family 40 Units Transitional Housing Added Family 21 Units
Removed Single Adult 30 Beds Rapid Rehousing Added Single Adult 231 Beds 96 Veteran, 45 TAY Added Family 474 Units 49 Veteran PSH/OPH Added Single Adult 1249 Beds Added Family 271 Units