Embed Size (px)
Citation preview

Seasonal Growth and Senescence of a Zostera marinaSeagrass Meadow AltersWave-Dominated Flow and SedimentSuspension Within a Coastal Bay
Jennifer C. R. Hansen & Matthew A. Reidenbach
Received: 16 June 2012 /Revised: 26 February 2013 /Accepted: 22 March 2013 /Published online: 19 April 2013# Coastal and Estuarine Research Federation 2013
Abstract Tidally driven flows, waves, and suspended sed-iment concentrations were monitored seasonally within aZostera marina seagrass (eelgrass) meadow located in ashallow (1–2 m depth) coastal bay. Eelgrass meadows werefound to reduce velocities approximately 60 % in the sum-mer and 40 % in the winter compared to an adjacentunvegetated site. Additionally, the seagrass meadow servedto dampen wave heights for all seasons except during winterwhen seagrass meadow development was at a minimum.Although wave heights were attenuated across the meadow,orbital motions caused by waves were able to effectivelypenetrate through the canopy, inducing wave-enhanced bot-tom shear stress (tb). Within the seagrass meadow, tb wasgreater than the critical stress threshold (=0.04 Pa) necessaryto induce sediment suspension 80–85 % of the samplingperiod in the winter and spring, but only 55 % of the time inthe summer. At the unvegetated site, tb was above thecritical threshold greater than 90 % of the time across allseasons. During low seagrass coverage in the winter, near-bed turbulence levels were enhanced, likely caused bystem–wake interaction with the sparse canopy. Reductionin tb within the seagrass meadow during the summer corre-lated to a 60 % reduction in suspended sediment concentra-tions but in winter, suspended sediment was enhancedcompared to the unvegetated site. With minimal seagrasscoverage, tb and wave statistics were similar to unvegetatedregions; however, during high seagrass coverage, sedimentstabilization increased light availability for photosynthesisand created a positive feedback for seagrass growth.
Keywords Eelgrass . Seagrass .Waves . Turbulence .
Sediment
Introduction
Seagrass meadows induce hydrodynamic drag on the flowthat reduces water velocities and attenuates wave energy(Ackerman and Okubo 1993; Bryan et al. 2007; Carr et al.2010; Gambi et al. 1990; Granata et al. 2001; Koch and Gust1999; Peterson et al. 2004). These plants also serve toshelter the seafloor from hydrodynamic shear stresses(Bouma et al. 2009; Sand-Jensen 2008; Vogel 1981), whichhas been found to reduce the resuspension of sediments(Carr et al. 2010; Gacia and Duarte 2001; Granata et al.2001; Ward et al. 1984). This has led to the view thatseagrass meadows serve as depositional environments forsediment (Gacia et al. 1999; Gruber and Kemp 2010).Seagrasses require incident light radiation for growth(Duarte 1991); therefore, the stabilizing effect they haveon sediments, and the corresponding increase in light pen-etration to the seafloor, creates a positive feedback for theirgrowth (Carr et al. 2010). Since the relative amount of openspace within a meadow influences the magnitude of bedshear reaching the seafloor, seagrass density can controlthe degree of sediment resuspension (de Boer 2007).Though meadows are often net depositional, spatial andtemporal variability within seagrass meadows can createlocalized enhancement of sediment suspension and trans-port. Recent findings support a more dynamic seagrass-sediment interaction, where sediment scouring occurs onthe edge of meadows (Chen et al. 2007), and low densitiesof seagrass can actually enhance sediment suspension(Lawson et al. 2012). This switch from an erosional to
J. C. R. Hansen (*) :M. A. ReidenbachDepartment of Environmental Sciences, University of Virginia,Charlottesville, VA 22904, USAe-mail: [email protected]
Estuaries and Coasts (2013) 36:1099–1114DOI 10.1007/s12237-013-9620-5

depositional environment may depend on the developmentof skimming flow over the meadow, where a shift can occurfrom horizontal flow diversion around individual seagrassblades in low-density seagrass systems (i.e., blades persquare meter of seafloor), causing scouring around individ-ual shoots (Nepf 1999), to vertical diversion above themeadow, reducing water velocities and turbulence adjacentto the bed within a high-density seagrass canopy (Lawson etal. 2012).
In addition to seagrass density, the magnitude of fluidshear stresses impacting the seafloor in shallow-water envi-ronments can be controlled by whether flows are dominatedby tidal currents or orbital wave motion. The interactionbetween waves and currents is nonlinear and leads tochanges in the hydrodynamics and shear stresses imposedon the seafloor from those expected under either conditionindependently (Jing and Ridd 1996). Luhar et al. (2010)found that seagrasses caused only minor reductions of in-canopy oscillatory motions produced by waves, in contrastto unidirectional flows that can be significantly dampedwithin a meadow. Typically, when waves are present, a thin,oscillatory wave boundary layer develops that is morestrongly sheared than one formed under steady currentsalone (Grant and Madsen 1979). This wave boundary layerinduces greater drag on the mean flow and increased bottomshear stresses. For waves that are typically generated infetch-limited shallow coastal bays, wave orbital motionsdecrease with depth and the magnitude of wave energy thatreaches the seafloor depends on the wave period, waveheight, and water depth (de Boer 2007; Chen et al. 2007;Fagherazzi and Wiberg 2009). Although wave energy atten-uation increases with increasing shoot density (Chen et al.2007), the degree of flow reduction by the canopy can alsobe a function of distance from the edge, and the depth atwhich the seagrass resides below the surface (Fonseca andFisher 1986; Verduin and Backhaus 2000).Within a Thalassiatestudinum seagrass meadow, the density of the canopy wasimportant in controlling mixing across the canopy–water in-terface (Koch and Gust 1999), and with relative increases ofwave- versus tidally-driven currents, near-bed velocities andshear stresses increased. With waves, orbital motions causethe canopy to oscillate, which limits the development ofskimming flows, thereby enhancing the interaction of watermasses across the canopy–water interface and increasing bedshear stresses (Koch and Gust 1999).
In temperate climates, Zostera marina meadows typicallygerminate in the fall, between mid-October to November inthe coastal bays of Virginia, USA (Moore et al. 1993; Orthet al. 2012), and flowering shoots mature in late spring toearly summer (May–June). The meadow reaches maximumblade density and coverage midsummer, begins senescencein late summer, and has sparse coverage over the winter(Orth et al. 2012). The sloughing of leaves in the senescent
seagrass meadow effectively thins the meadow density andshortens the canopy height. Such changes to seagrass bladedensity and height have been shown to influence fluidvelocities within meadows (Fonseca and Koehl 2006; Nepfet al. 2007), where canopy friction exhibits a strong positiverelationship to the percent of the water column that isoccupied by the seagrass (Fonseca and Fisher 1986). InGacia and Duarte (2001), resuspension of sediment wasgreatest with minimum canopy development, while deposi-tion occurred under maximum above-ground canopy bio-mass conditions. Studies also show that mixing rates andturbulent kinetic energy are highly dependent upon seagrassdensity and areal cover of the canopy (Granata et al. 2001;Hansen and Reidenbach 2012). These findings suggest thatthroughout the year, the hydrodynamic regime and physicalforces will vary greatly, altering the rates and dynamics ofsediment erosion and deposition.
Though flow dynamics in seagrass meadows have beeninvestigated in a number of studies; to date, most researchhas focused on observations conducted during the summerunder full-growth conditions, while few studies have con-sidered how structural and morphological changes that oc-cur in seagrasses throughout the seasons of the year impactflow and sediment suspension. In order to determine theeffects of seasonal growth and senescence of a seagrassmeadow on hydrodynamics and sediment suspension, a Z.marina meadow in South Bay, Virginia, was monitored insummer, fall, winter, and spring conditions from June 2010to June 2011 and compared to flow and sediment dynamicsoccurring at an adjacent, primarily unvegetated region. Thegoals of this study were to quantify the (1) seasonal vari-ability of Z. marinamorphology within a coastal bay, (2) flowand turbulence structure within and above the seagrass mead-ow due to the combined influence of waves and tidally drivenflows, and (3) response of suspended sediment concentrationsto variations in the magnitude of bed shear stresses.
Methods
Study Area
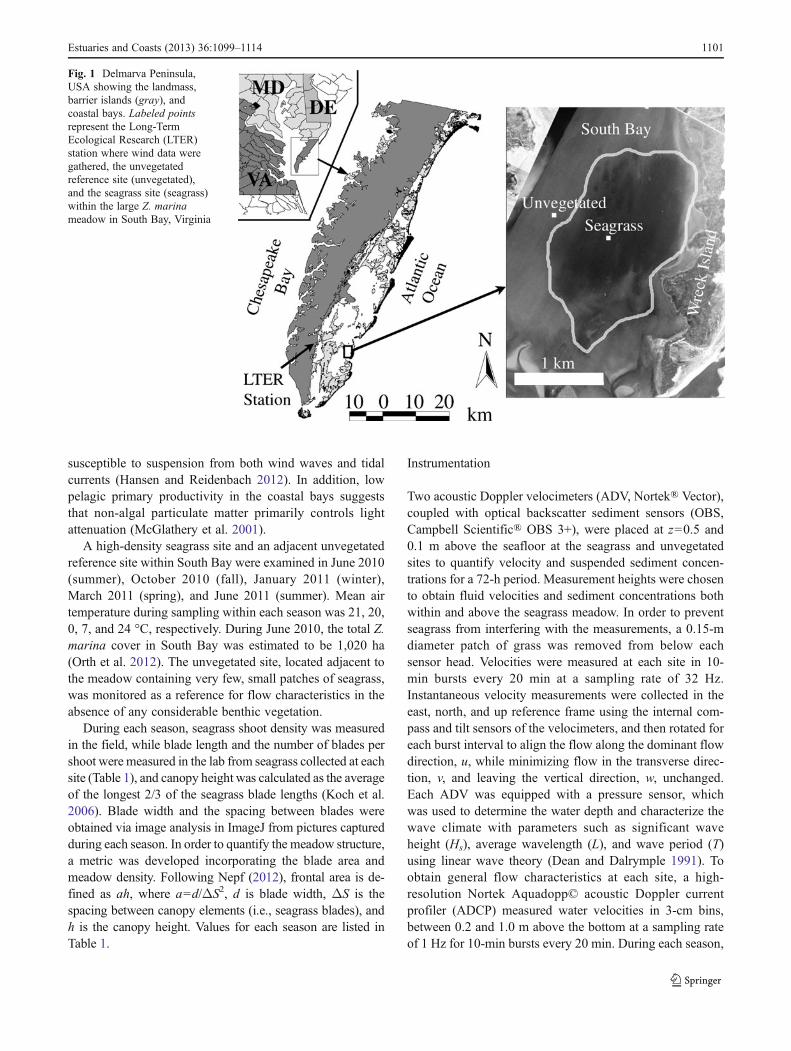
Field studies were performed within a Z. marina seagrass(eelgrass) meadow in South Bay, Virginia, USA (Fig. 1); acoastal bay within the Virginia Coast Reserve (VCR) whereongoing seagrass restoration efforts are being performed(Orth and McGlathery 2012). The VCR is characterized bycontiguous marsh, shallow coastal bay, and barrier islandsystems and is a National Science Foundation Long-TermEcological Research site. South Bay lacks any significantriverine discharge, and therefore turbidity is primarilycontrolled by local resuspension. The shallow depth ofSouth Bay, typically <2 m, makes the bed sediments
1100 Estuaries and Coasts (2013) 36:1099–1114
susceptible to suspension from both wind waves and tidalcurrents (Hansen and Reidenbach 2012). In addition, lowpelagic primary productivity in the coastal bays suggeststhat non-algal particulate matter primarily controls lightattenuation (McGlathery et al. 2001).
A high-density seagrass site and an adjacent unvegetatedreference site within South Bay were examined in June 2010(summer), October 2010 (fall), January 2011 (winter),March 2011 (spring), and June 2011 (summer). Mean airtemperature during sampling within each season was 21, 20,0, 7, and 24 °C, respectively. During June 2010, the total Z.marina cover in South Bay was estimated to be 1,020 ha(Orth et al. 2012). The unvegetated site, located adjacent tothe meadow containing very few, small patches of seagrass,was monitored as a reference for flow characteristics in theabsence of any considerable benthic vegetation.
During each season, seagrass shoot density was measuredin the field, while blade length and the number of blades pershoot were measured in the lab from seagrass collected at eachsite (Table 1), and canopy height was calculated as the averageof the longest 2/3 of the seagrass blade lengths (Koch et al.2006). Blade width and the spacing between blades wereobtained via image analysis in ImageJ from pictures capturedduring each season. In order to quantify the meadow structure,a metric was developed incorporating the blade area andmeadow density. Following Nepf (2012), frontal area is de-fined as ah, where a=d/ΔS2, d is blade width, ΔS is thespacing between canopy elements (i.e., seagrass blades), andh is the canopy height. Values for each season are listed inTable 1.
Instrumentation
Two acoustic Doppler velocimeters (ADV, Nortek® Vector),coupled with optical backscatter sediment sensors (OBS,Campbell Scientific® OBS 3+), were placed at z=0.5 and0.1 m above the seafloor at the seagrass and unvegetatedsites to quantify velocity and suspended sediment concen-trations for a 72-h period. Measurement heights were chosento obtain fluid velocities and sediment concentrations bothwithin and above the seagrass meadow. In order to preventseagrass from interfering with the measurements, a 0.15-mdiameter patch of grass was removed from below eachsensor head. Velocities were measured at each site in 10-min bursts every 20 min at a sampling rate of 32 Hz.Instantaneous velocity measurements were collected in theeast, north, and up reference frame using the internal com-pass and tilt sensors of the velocimeters, and then rotated foreach burst interval to align the flow along the dominant flowdirection, u, while minimizing flow in the transverse direc-tion, v, and leaving the vertical direction, w, unchanged.Each ADV was equipped with a pressure sensor, whichwas used to determine the water depth and characterize thewave climate with parameters such as significant waveheight (Hs), average wavelength (L), and wave period (T)using linear wave theory (Dean and Dalrymple 1991). Toobtain general flow characteristics at each site, a high-resolution Nortek Aquadopp© acoustic Doppler currentprofiler (ADCP) measured water velocities in 3-cm bins,between 0.2 and 1.0 m above the bottom at a sampling rateof 1 Hz for 10-min bursts every 20 min. During each season,
Fig. 1 Delmarva Peninsula,USA showing the landmass,barrier islands (gray), andcoastal bays. Labeled pointsrepresent the Long-TermEcological Research (LTER)station where wind data weregathered, the unvegetatedreference site (unvegetated),and the seagrass site (seagrass)within the large Z. marinameadow in South Bay, Virginia
Estuaries and Coasts (2013) 36:1099–1114 1101

two ADVs along with two OBSs were placed within theseagrass meadow for 72 h, then moved to an adjacentunvegetated seafloor for 72 h. During instrument deploy-ments within the seagrass meadow, an additional ADCP andOBS sediment sensor were simultaneously deployed at theunvegetated site to collect water velocities, water depth, andsuspended sediment concentrations. Wind data wereobtained from a meteorological station in Oyster, VA,USA located approximately 4 km from South Bay.
Calibrations to relate backscatter intensity obtained fromthe OBS to suspended sediment concentrations wereperformed using sediment collected from the seagrass mead-ow and unvegetated site (technique described in Hansen andReidenbach 2012). Sediment grain size distributions werecharacterized using a laser diffraction particle size analyzer(Beckman Coulter LS I3 320). D84, the grain size diameterfor which 84 % of the sample grain diameters are smaller, atthe unvegetated site was 157±7 μm; while at the seagrasssite, sediments were finer at 130±17 μm.
Wave–Turbulence Decomposition
In flows with both currents and waves, the covariance invelocity associated with waves is often larger than thatassociated with turbulence, and a wave–turbulence decom-position must be performed. When waves and currents arepresent, the instantaneous horizontal and vertical velocitiescan be written as:
u ¼ u0 þ euþ uw ¼ w0 þ ewþ w
ð1Þ
where u and w are the horizontal and vertical components ofthe mean velocity, eu and ew are the wave-induced orbitalvelocities, and u′ and w′ are the turbulent velocities. Mostmethods of wave–turbulence decomposition rely on two ormore spatially separated velocity sensors to decouple wavemotion from that of turbulence (Trowbridge 1998), or usesimultaneous free surface displacement and velocity mea-surements to estimate wave motion at depth (Benilov and
Filyushkin 1970). Although these methods work well overrelatively smooth beds, neither technique can be appliedwhere bed topography significantly alters oscillatory flowstructure outside the relatively thin wave boundary layer. Amethod of wave–turbulence decomposition that can beemployed within seagrass systems uses a spectral decompo-sition, known as the Phase method (Bricker and Monismith2007), where the phase lag between the u and w componentsof the surface waves from one velocity sensor are used tointerpolate the magnitude of turbulence under the wavepeak. In this method, the turbulent Reynolds stress can bequantified as the difference between the total stress and thewave stress (Hansen and Reidenbach 2012):
u0w0 ¼ uw� euew ð2ÞBoth the total stress and wave stress can be computed
from the Fourier transforms of the individual velocity com-ponents, u and w. For example, the wave stress becomes:
euew ¼Xj¼N 2=
j¼�N 2=
eU*jeWj ð3Þ
where Uj=U(fj) is the Fourier transform of u(t) at the fre-quency fj and * denotes the complex conjugate of Uj, whichis multiplied by Wj, the Fourier transform of w(t) at thefrequency fj. Equation 3 assumes that waves and turbulence
do not interact, and the magnitude of eUj is the difference
between the raw Uj and the turbulenceU0j that is interpolated
below the wave peak via a least squares fit straight line, as
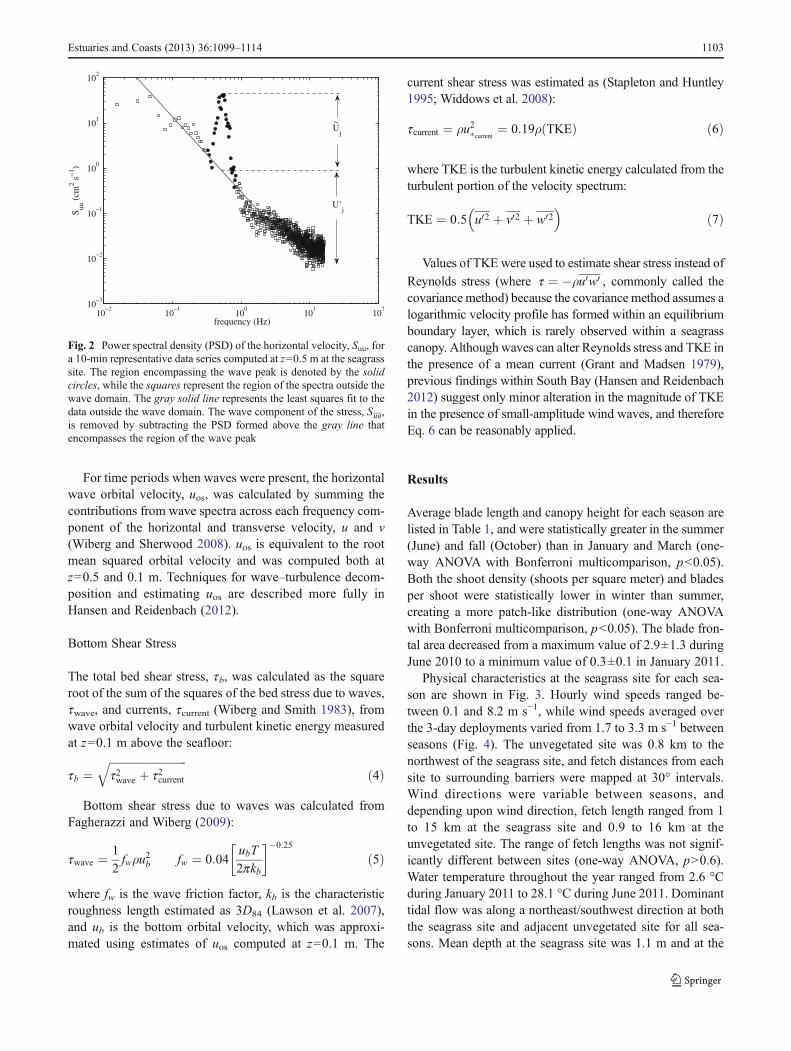
shown in Fig. 2. The same method was used to solve for eWj.Since waves dominate the spectra under the wave peak, thismethod also assumes that the phase difference between uand w is dominated by the wave flow. Estimates for uwwerecomputed in a similar manner as Eq. 3 by using the full
spectrum Uj and Wj. Estimates of u0w0 from the Phasemethod were compared to the Benilov and Filyushkin(1970) method outside regions impacted by the seagrass
canopy and agree to within ±10 % u0w0.
Table 1 Z. marina seagrass morphometrics for South Bay, Virginia
Bladelength (cm)
n Canopyheight (cm)
n Density(shoots m–2)
n Bladewidth (cm)
n Blades/shoot n Frontal area
June 2010 21±8 158 25±5 105 560±70 9 0.3±0.1 19 4.8±1.3 33 2.9±1.3
October 2010 19±7 59 23±5 39 350±50 6 0.2±0.1 25 3.0±0.9 20 0.7±0.3
January 2011 13±7 52 16 ±5 34 310±60 4 0.2±0.1 20 2.6±1.0 20 0.3±0.1
March 2011 12±5 91 15±3 60 350±90 6 0.2±0.1 20 4.0±1.4 20 0.5±0.3
June 2011 23±11 93 29±8 62 440±140 10 0.2±0.1 82 4.2±1.2 22 1.3±0.9
n number of samples for each average
Values represent the mean and standard deviations. Canopy height represents the average of the longest 2/3 of the seagrass blades sampled andfrontal area is calculated as ah, where a=d/ΔS2 , d is blade width, ΔS is the spacing between canopy elements, and h is the canopy height
1102 Estuaries and Coasts (2013) 36:1099–1114
For time periods when waves were present, the horizontalwave orbital velocity, uos, was calculated by summing thecontributions from wave spectra across each frequency com-ponent of the horizontal and transverse velocity, u and v(Wiberg and Sherwood 2008). uos is equivalent to the rootmean squared orbital velocity and was computed both atz=0.5 and 0.1 m. Techniques for wave–turbulence decom-position and estimating uos are described more fully inHansen and Reidenbach (2012).
Bottom Shear Stress
The total bed shear stress, tb, was calculated as the squareroot of the sum of the squares of the bed stress due to waves,twave, and currents, tcurrent (Wiberg and Smith 1983), fromwave orbital velocity and turbulent kinetic energy measuredat z=0.1 m above the seafloor:
tb ¼ffiffiffiffiffiffiffiffiffiffiffiffiffiffiffiffiffiffiffiffiffiffiffiffiffiffiffiffit2wave þ t2current
qð4Þ
Bottom shear stress due to waves was calculated fromFagherazzi and Wiberg (2009):
twave ¼ 1
2fwρu
2b fw ¼ 0:04
ubT
2pkb
� ��0:25
ð5Þ
where fw is the wave friction factor, kb is the characteristicroughness length estimated as 3D84 (Lawson et al. 2007),and ub is the bottom orbital velocity, which was approxi-mated using estimates of uos computed at z=0.1 m. The
current shear stress was estimated as (Stapleton and Huntley1995; Widdows et al. 2008):
tcurrent ¼ ρu2�current ¼ 0:19ρ TKEð Þ ð6Þ
where TKE is the turbulent kinetic energy calculated from theturbulent portion of the velocity spectrum:
TKE ¼ 0:5 u02 þ v02 þ w02� �
ð7Þ
Values of TKE were used to estimate shear stress instead of
Reynolds stress (where t ¼ �ρu0w0 , commonly called thecovariance method) because the covariance method assumes alogarithmic velocity profile has formed within an equilibriumboundary layer, which is rarely observed within a seagrasscanopy. Although waves can alter Reynolds stress and TKE inthe presence of a mean current (Grant and Madsen 1979),previous findings within South Bay (Hansen and Reidenbach2012) suggest only minor alteration in the magnitude of TKEin the presence of small-amplitude wind waves, and thereforeEq. 6 can be reasonably applied.
Results
Average blade length and canopy height for each season arelisted in Table 1, and were statistically greater in the summer(June) and fall (October) than in January and March (one-way ANOVA with Bonferroni multicomparison, p<0.05).Both the shoot density (shoots per square meter) and bladesper shoot were statistically lower in winter than summer,creating a more patch-like distribution (one-way ANOVAwith Bonferroni multicomparison, p<0.05). The blade fron-tal area decreased from a maximum value of 2.9±1.3 duringJune 2010 to a minimum value of 0.3±0.1 in January 2011.
Physical characteristics at the seagrass site for each sea-son are shown in Fig. 3. Hourly wind speeds ranged be-tween 0.1 and 8.2 m s−1, while wind speeds averaged overthe 3-day deployments varied from 1.7 to 3.3 m s−1 betweenseasons (Fig. 4). The unvegetated site was 0.8 km to thenorthwest of the seagrass site, and fetch distances from eachsite to surrounding barriers were mapped at 30° intervals.Wind directions were variable between seasons, anddepending upon wind direction, fetch length ranged from 1to 15 km at the seagrass site and 0.9 to 16 km at theunvegetated site. The range of fetch lengths was not signif-icantly different between sites (one-way ANOVA, p>0.6).Water temperature throughout the year ranged from 2.6 °Cduring January 2011 to 28.1 °C during June 2011. Dominanttidal flow was along a northeast/southwest direction at boththe seagrass site and adjacent unvegetated site for all sea-sons. Mean depth at the seagrass site was 1.1 m and at the
10−2
10−1
100
101
102
10−3
10−2
10−1
100
101
102
frequency (Hz)
S uu (
cm2
s−1 )
Uj
~
U’j
Fig. 2 Power spectral density (PSD) of the horizontal velocity, Suu, fora 10-min representative data series computed at z=0.5 m at the seagrasssite. The region encompassing the wave peak is denoted by the solidcircles, while the squares represent the region of the spectra outside thewave domain. The gray solid line represents the least squares fit to thedata outside the wave domain. The wave component of the stress, S~u~u,is removed by subtracting the PSD formed above the gray line thatencompasses the region of the wave peak
Estuaries and Coasts (2013) 36:1099–1114 1103

unvegetated site was 1.4 m, while tidal amplitude ranged from0.5 to 0.8 m (Table 2). Significant wave heights at theunvegetated site ranged on average from 0.13±0.05 to 0.21±0.07 m throughout the year. At the seagrass site, significantwave heights ranged from 0.10±0.03 m during June to 0.18±0.09 m during January.
Seasonal variations in mean velocities above (z=0.5 m)and within (z=0.1 m) the seagrass canopy and adjacent
unvegetated reference site (z=0.5 m) are shown in Fig. 5a.Mean velocities at the unvegetated site did not vary signifi-cantly at z=0.5 m between seasons (one-way ANOVA,p=0.18). Within the seagrass meadow, velocities were signif-icantly smaller during the summer (June 2010, 2011) than atany other time of year (one-way ANOVA with Bonferronimulticomparison, p<0.05). In addition, there was a significantdifference between the velocities measured at the seagrass andunvegetated sites during every season (one-way ANOVAwithBonferroni multicomparison, p<0.05), with the greatest reduc-tion in flow between the two sites occurring during the summer(55–60 % at z=0.5 m) and least reduction during winter (40 %at z=0.5 m). Figure 5b shows that as frontal area increases,so does the percent velocity reduction within the canopy(at z=0.1 m) compared to above (at z=0.5 m). Average veloc-ity reduction across all seasons between z=0.1 and 0.5 m at theunvegetated site was 44 %. At the unvegetated site, a logarith-mic flow profile developed throughout the entire bottomboundary layer. However, at the seagrass site, greater attenua-tion of velocity occurred adjacent to the seafloor due to flowinteraction with the meadow, creating an inflection point in thevelocity profile at the top of the seagrass canopy (Fig. 6),which was strongest during summer.
Waves and Orbital Motion
Waves in South Bay were locally developed wind waveswith average wave periods (T) ranging from 1.4 to 1.9 s.
0
10
20
// // // //
U(c
m s
−1 )
159 160 161 279 280 281 6 7 8 82 83 84 161 162 1630
50
100
// // // //
SSC
(mg
l−1 )
time (day of year, 2010−2011)
0
0.25
0.5
// // // //
Hs
(m)
−5
0
5
// // // //
win
d(m
s−
1 )
0
20
// // // //
T (o C)
0123
// // // //de
pth
(m)
Oct 2010
e
Jan 2011Jun 2010 Mar 2011
c
d
b
Jun 2011
a
f
Fig. 3 a Wind speed, arrowsdenote the direction towardwhich the wind is blowing, withnorthward up and eastward tothe right; b water temperature; cwater depth at the seagrass site;d root mean square horizontalwater velocities averaged over10-min burst intervals atz=0.5 m above the seafloor atthe seagrass site e significantwave height (Hs) over theseagrass meadow, and f near-bed suspended sedimentconcentrations (SSC) within theseagrass meadow at z=0.1 m.Breaks in data represent periodswhen the instrument was out ofthe water, or in e when waveswere not present
Fig. 4 Average wind speed (±1 SD) and direction at both theunvegetated and seagrass sites for each season. Compass plots arehistograms of wind direction with concentric rings each representing20 vector samples and chords at 30° intervals
1104 Estuaries and Coasts (2013) 36:1099–1114

Significant wave heights (Hs) ranged from 0.10 to 0.21 mduring sampling at both sites, but were smaller over theseagrass meadow than the unvegetated seafloor for all sea-sons except winter, even though wind speeds were
statistically similar within each season (Fig. 7, one-wayANOVA, p>0.08). In addition, the reduction of Hs and Tin the seagrass meadow scaled with increased seagrass can-opy area, where the largest difference in Hs and T betweenthe seagrass meadow and unvegetated site occurred duringthe summer. Wave development depends not only on fric-tional interaction with benthic vegetation, but also on windspeed and water column depth. Significant wave height andperiod plotted against wind speed (Fig. 8a,b) show thatwaves were larger and had longer periods over theunvegetated seafloor than over the seagrass meadow forany given wind speed except for weak wind conditions(≤2 m s−1) where there was no statistical difference in Hs
(one-way ANOVA, p>0.05). Additionally, both significantwave height and wave period were lowest for the fullydeveloped meadow in the summer for all wind speeds.Wave height and period also increased with increasing waterdepth, but for any given water depth, waves were larger andhad longer periods at the unvegetated site than compared tothe seagrass site for all seasons of the year (Fig. 8c,d) except
Table 2 Temporal averages of suspended sediment concentration (SSC), ±1 SE, water depth, and tidal amplitudes (±1 SD) during seasonaldeployments at both an unvegetated reference site and over the seagrass meadow
SeagrassSSC (mg l−1)
SeagrassSSC (mg l−1)
UnvegetatedSSC (mg l−1)
SeagrassDepth (m)
Seagrass TidalAmplitude (m)
UnvegetatedDepth (m)
Unvegetated TidalAmplitude (m)
z=0.5 m z=0.1 m z=0.1 m
June 2010 33±3 26±2 57±3 0.99±0.43 0.57±0.11 1.49±0.55 0.73±0.12
October 2010 16±1 19±1 15±2 1.04±0.59 0.83±0.08 1.44±0.49 0.62±0.11
January 2011 21±2 33±3 17±1 1.07±0.42 0.59±0.04 1.38±0.57 0.81±0.05
March 2011 23±2 27±2 25±2 1.15±0.49 0.65±0.09 1.27±0.41 0.52±0.03
June 2011 21±2 17±2 50±1 1.04±0.49 0.67±0.09 1.50±0.51 0.68±0.06
Jun 2010 Oct 2010 Jan 2011 Mar 2011 Jun 20110
2
4
6
8
10
12
14
16
18
20
velo
city
(cm
s−
1 )
unvegetated z=0.5m
seagrass z=0.5m
seagrass z=0.1m
a
Jun 2010 Oct 2010 Jan 2011 Mar 2011 Jun 201140
50
60
70
80
90
100
% v
eloc
ity r
educ
tion
acro
ss c
anop
y
0
0.5
1
1.5
2
2.5
3
3.5
4
4.5
fron
tal a
rea
% velocity reduction
frontal areab
Fig. 5 a Average velocities (±1 SE) at z=0.5 m above the seafloor atthe unvegetated reference site, at z=0.5 and 0.1 m at the seagrass site,measured simultaneously. b Percent velocity reduction (±1 SE) withinthe seagrass canopy (at z=0.1 m) compared to above the canopy (at z=0.5 m). Secondary y-axis represents the seagrass canopy frontal areaper unit area of seafloor (±1 SD)
0 2 4 6 8 10 12 14 16 18 200.2
0.3
0.4
0.5
0.6
0.7
velocity (cm s−1)
dept
h (m
)
unvegetated
seagrass
Fig. 6 Vertical profiles of horizontal velocity averaged over a singleebbing tide at the unvegetated and seagrass sites during simultaneousdeployments in June 2011. Horizontal line represents the canopy height
Estuaries and Coasts (2013) 36:1099–1114 1105

for January. In general, wave dynamics within the seagrasscanopy matched the unvegetated site most closely duringJanuary, when seagrass cover was minimal.
Horizontal orbital velocities (uos) above and within themeadow were computed using spectra of the horizontal wavemotions. As expected, during all seasons orbital motions weregreater at z=0.5 m than at z=0.1 m due to natural attenuation ofshort-period waves with depth (Fig. 9). Orbital motions werehighest within the seagrass meadow in January and Marchwhen larger waves were able to develop due to the low percentcover of the seagrass. In January, the absence of seagrass coveralso allowed longer period waves to develop (shown inFig. 7a). In summer (June 2010 and June 2011), wave periodsand orbital velocities were decreased, suggesting that the sig-nificant seagrass structure attenuated wave development overthe meadow.
To determine the extent to which reduction of wave orbitalvelocities within the seagrass canopy was due to natural
attenuation with depth or interaction with the seagrass blades,orbital velocities (uos) computed through velocity spectrawere compared with estimates of wave orbital velocities(uom) using pressure sensor measurements from the ADV.From linear wave theory for small amplitude, monochromaticwaves, the horizontal component of orbital velocity, uom, wascomputed as (Dean and Dalrymple 1991):
uom ¼ pHs cosh kzð ÞT sinh khð Þ ð8Þ
where Hs is the significant wave height, k is the wave numbersuch that k=2π/Lwhere L is the wavelength, T is wave period,z is the location above the seafloor, and h is the water columndepth. The wavelength, L, was calculated according to linear
wave theory for intermediate waves as: L ¼ L1
ffiffiffiffiffiffiffiffiffiffiffiffiffiffiffiffiffiffiffiffitanh 2ph
L1
� �r,
where L1 ¼ g2p T
2.Linear wave theory assumes the bed is frictionless and
therefore, estimating wave orbital velocity decay with depthusing linear wave theory (Eq. 8) and comparing it to com-puted orbital velocities using local velocity measurementswithin the canopy (uos) should indicate the relative damp-ening of wave orbital velocity due to frictional interactionwith the seagrass canopy. At the seagrass site, the orbitalmotion predicted by linear wave theory at z=0.1 m withinthe seagrass canopy was not significantly greater than thatquantified through velocity spectra during any season of theyear (one-way ANOVA, p>0.05), suggesting that theseagrass did not have a significant impact on the attenuationof wave orbital motion with depth (Fig. 9). This suggeststhat although seagrass attenuates the amplitude of waves asthey propagate across the meadow, orbital motions are notattenuated due to direct interaction with the seagrass bladeswithin the canopy.
The power spectral density (PSD) of horizontal velocities,Suu, was examined to quantify the relationship between mead-ow structure, wave period, and turbulence intensity (Fig. 10).The velocity time series from each season was first filtered toselect for wave-influenced periods, where the wave portion ofthe PSD accounted for greater than 10 % of the total energy.The frequency spectrum was then averaged over theremaining time series to obtain the average frequency distri-bution in each season. Figure 10a shows spectra comparingthe unvegetated and seagrass sites in June 2011 while Fig. 10bshows spectra for January 2011. Although velocity measure-ments were not measured simultaneously within the seagrassand unvegetated sites, winds were comparable within eachseason, and therefore, wave statistics can be generally com-pared. The reduced magnitudes of Suu within the seagrassmeadow were indicative of lower turbulent energy com-pared to the unvegetated site, with greater reductions inSuu occurring in the summer. Peaks in the spectra that
Jun 2010 Oct 2010 Jan 2011 Mar 2011 Jun 20110
0.5
1
1.5
2
2.5
T (
s)unvegetated
seagrass
**
**
*
a
Jun 2010 Oct 2010 Jan 2011 Mar 2011 Jun 20110
0.05
0.1
0.15
0.2
0.25
Hs (
m)
unvegetated
seagrass
*
*
**
b
Fig. 7 a Significant wave period, T, and b significant wave height, Hs,for each season calculated from linear wave theory (±1 SE). Asterisksabove graphs indicate values are statistically different between theunvegetated and seagrass sites within the season
1106 Estuaries and Coasts (2013) 36:1099–1114

occur between f=0.2 and 1 Hz were due to orbital wavemotion and indicated that wave energy was reducedwithin the meadow during June compared to theunvegetated site (one-way ANOVA, p<0.05), but wasnot significantly reduced during January (one-wayANOVA, p=0.98). In addition, wave motion at lowfrequencies was reduced within the seagrass meadow inJune (0.3< f<0.6 Hz) compared to the unvegetated site,but was not substantially altered during January; allsuggesting that under high seagrass meadow develop-ment, both wave heights and wave periods were reduced.
Turbulence and Momentum Transport
After removal of orbital motions due to waves, Reynoldsstresses were calculated from the turbulence portion of the
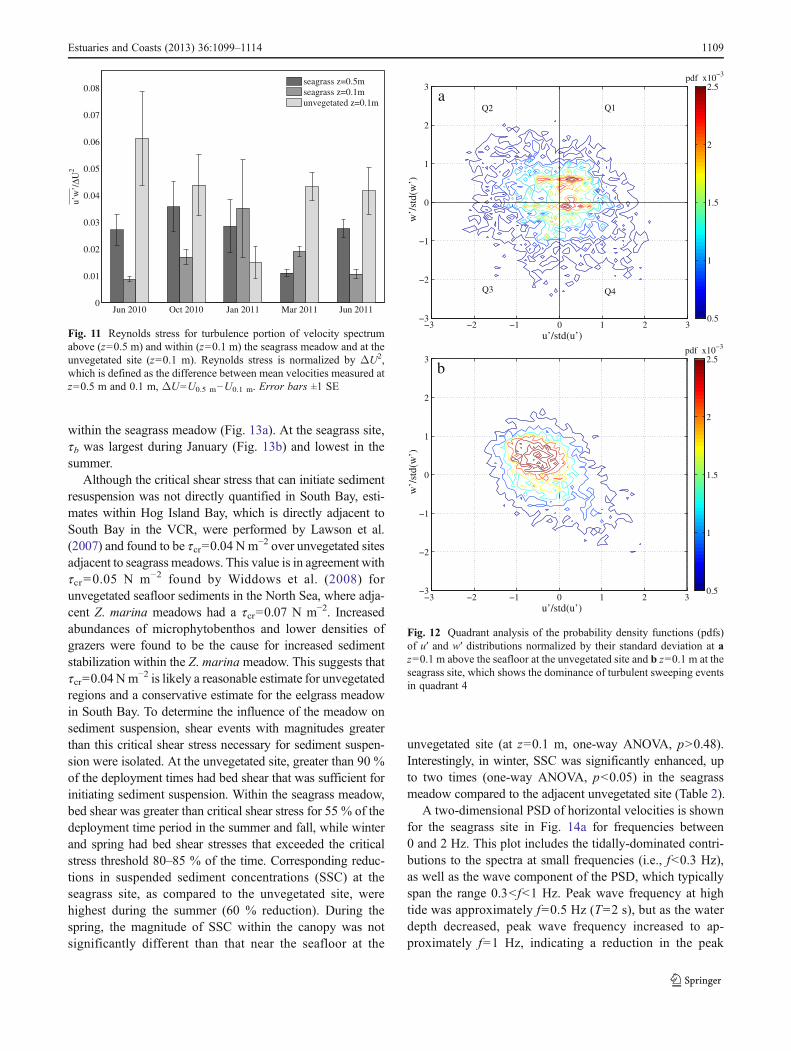
velocity spectrum at z=0.5 and 0.1 m within the seagrassmeadow (Fig. 11). Reynolds stress was then normalized byΔU2, which is defined as the difference between velocitiesmeasured at z=0.5 and 0.1 m (ΔU=U0.5 m−U0.1 m). Thegreatest reduction of within-canopy Reynolds stress oc-curred in June, when the canopy frontal area was greatest.In October, during initial senescence of the meadow, turbu-lence levels increased within the canopy, and in January andMarch, when the meadow frontal area was minimal, en-hanced turbulence within the canopy was measured relativeto above (at z=0.5 m). Compared to the unvegetated site, themost dramatic reductions of within-canopy Reynolds stressoccurred in summer, with enhanced Reynolds stresses inwinter. The absolute magnitude of Reynolds stress followedthese same normalized trends throughout the seasons at boththe unvegetated and seagrass sites.
0 1 2 3 4 5 6
1.4
1.6
1.8
2
2.2
2.4
wind speed (m s−1)
T (
s)a
0 1 2 3 4 5 60.05
0.1
0.15
0.2
0.25
wind speed (m s−1)
Hs (
m)
unvegetated
Jun 10
Oct 10
Jan 11
Mar 11
Jun 11
b
0.5 1 1.5 2 2.51.2
1.4
1.6
1.8
2
2.2
2.4
depth (m)
T (
s)
c
0.5 1 1.5 2 2.50.05
0.1
0.15
0.2
0.25
depth (m)
Hs (
m)
d
Fig. 8 a Average wave period, T, and b significant wave height, Hs,plotted as a function of wind speed (±1 SE). c Average wave period, T,and d significant wave height, Hs, plotted as a function of water depth(±1 SE). Data collected at the seagrass site during each season were
averaged using a running mean with a 0.8 m s−1 averaging window forwind speed and 0.2 m for water depth. Solid black line represents best-fit line for all seasons at the unvegetated site
Estuaries and Coasts (2013) 36:1099–1114 1107

To determine how turbulent fluctuations contribute to thetransport of momentum throughout the bottom boundary layer,quadrant analysis was performed. Velocity fluctuations, u′ andw′, were normalized by their respective standard deviationsand divided into four quadrants based on the sign of theirinstantaneous values (Lu and Willmarth 1973). The two dom-inant quadrants responsible for momentum transfer are quad-rant 2 (Q2), where turbulent ejections of low momentum fluidare transported vertically upward (u′<0,w′>0), and quadrant 4(Q4), where sweeping events transport high momentum fluiddownward towards the seafloor (u′>0, w′<0). These ejectionsand sweeps lead to periodic mixing across the seagrass cano-py–water interface. Contours of the turbulent probability dis-tribution function are shown in Fig. 12 for turbulent motions atz=0.1 m at the unvegetated and seagrass sites in June 2011during periods with no wave action (i.e., energy within thewave portion of the PSD accounted for less than 10 % of thetotal energy). At the unvegetated site, the distribution of mo-mentumwas balanced between Q2 and Q4with Q1 (16%), Q2(33 %), Q3 (16 %), and Q4 (35 %). In comparison, at theseagrass site, the distribution was Q1 (11 %), Q2 (26 %), Q3(10 %), and Q4 (53 %). These sweeping events transport highmomentum fluid down into the meadow from the overlyingwater. The combined Q2 and Q4 contributions accounted for79 % of the total Reynolds stress in the seagrass canopy,compared to 68 % at the unvegetated site. This indicates thatthough Reynolds stress was smaller within the seagrass cano-py, turbulent motions were more efficient in the vertical trans-port of momentum compared to the unvegetated site. Theincreasing shift toward motion in Q2 and Q4 also correlatedwith increasing canopy frontal area. In January and March,
combined Q2 and Q4 shifts are 74 and 73 %, respectively, atz=0.1 m. With increased seagrass canopy development in thesummer, contributions to Q2 and Q4 increased to 87 and 79 %during June 2010 and 2011.
Bottom Shear Stress and Suspended Sediment Dynamics
The total stress imparted to the seafloor was quantified usinga combined bottom shear stress, tb (Eq. 4), calculated as thesquare root of the sum of the squares of the shear stress dueto waves, twave (Eq. 5), and due to currents, tcurrent (Eq. 6;Wiberg and Smith 1983). Over the unvegetated seafloor,shear stress was consistently greater than that produced
Jun 2010 Oct 2010 Jan 2011 Mar 2011 Jun 20110
1
2
3
4
5
6
7
8
9
10
velo
city
(cm
s−
1 ) u
os z=0.5m
uos
z=0.1m
uom
z=0.1m
Fig. 9 Horizontal orbital velocities, uos, above (z=0.5 m) and within(z=0.1 m) seagrass meadows from spectral analysis, as well asexpected orbital velocities, uom, calculated via linear wave theory.Linear wave theory predictions were never significantly greater thanhorizontal orbital velocities measured from spectral analysis (one-wayANOVA, p<0.05). Error bars ±1 SE
10−2
10−1
100
101
102
10−2
10−1
100
101
102
S uu (
cm2
s−1 )
frequency (Hz)
unvegetated z=0.5m
unvegetated z=0.1m
seagrass z=0.5m
seagrass z=0.1m
a
10−2
10−1
100
101
102
10−2
10−1
100
101
102
frequency (Hz)
S uu (
cm2
s−1 )
unvegetated z=0.5m
unvegetated z=0.1m
seagrass z=0.5m
seagrass z=0.1m
b
Fig. 10 Power spectral density (PSD), Suu, for periods with waveactivity for a June 2011 and b January 2011. Spectra were formed byaveraging individual spectra, of length n=2048 velocity records, overtime periods when the wave portion of the PSD accounted for greaterthan 10 % of the total energy of the flow. Peaks in the PSD betweenfrequencies (f) of 0.2≤ f≤1 Hz represent water motion due to waves.Flattening of the spectra at high frequencies (f>5–10 Hz) represents thenoise floor of the instrument
1108 Estuaries and Coasts (2013) 36:1099–1114
within the seagrass meadow (Fig. 13a). At the seagrass site,tb was largest during January (Fig. 13b) and lowest in thesummer.
Although the critical shear stress that can initiate sedimentresuspension was not directly quantified in South Bay, esti-mates within Hog Island Bay, which is directly adjacent toSouth Bay in the VCR, were performed by Lawson et al.(2007) and found to be tcr=0.04 Nm−2 over unvegetated sitesadjacent to seagrass meadows. This value is in agreement withtcr=0.05 N m−2 found by Widdows et al. (2008) forunvegetated seafloor sediments in the North Sea, where adja-cent Z. marina meadows had a tcr=0.07 N m−2. Increasedabundances of microphytobenthos and lower densities ofgrazers were found to be the cause for increased sedimentstabilization within the Z. marinameadow. This suggests thattcr=0.04 Nm−2 is likely a reasonable estimate for unvegetatedregions and a conservative estimate for the eelgrass meadowin South Bay. To determine the influence of the meadow onsediment suspension, shear events with magnitudes greaterthan this critical shear stress necessary for sediment suspen-sion were isolated. At the unvegetated site, greater than 90 %of the deployment times had bed shear that was sufficient forinitiating sediment suspension. Within the seagrass meadow,bed shear was greater than critical shear stress for 55 % of thedeployment time period in the summer and fall, while winterand spring had bed shear stresses that exceeded the criticalstress threshold 80–85 % of the time. Corresponding reduc-tions in suspended sediment concentrations (SSC) at theseagrass site, as compared to the unvegetated site, werehighest during the summer (60 % reduction). During thespring, the magnitude of SSC within the canopy was notsignificantly different than that near the seafloor at the
unvegetated site (at z=0.1 m, one-way ANOVA, p>0.48).Interestingly, in winter, SSC was significantly enhanced, upto two times (one-way ANOVA, p<0.05) in the seagrassmeadow compared to the adjacent unvegetated site (Table 2).
A two-dimensional PSD of horizontal velocities is shownfor the seagrass site in Fig. 14a for frequencies between0 and 2 Hz. This plot includes the tidally-dominated contri-butions to the spectra at small frequencies (i.e., f<0.3 Hz),as well as the wave component of the PSD, which typicallyspan the range 0.3< f<1 Hz. Peak wave frequency at hightide was approximately f=0.5 Hz (T=2 s), but as the waterdepth decreased, peak wave frequency increased to ap-proximately f=1 Hz, indicating a reduction in the peak
Jun 2010 Oct 2010 Jan 2011 Mar 2011 Jun 20110
0.01
0.02
0.03
0.04
0.05
0.06
0.07
0.08
u’w
’/ΔU
2
seagrass z=0.5mseagrass z=0.1munvegetated z=0.1m
Fig. 11 Reynolds stress for turbulence portion of velocity spectrumabove (z=0.5 m) and within (z=0.1 m) the seagrass meadow and at theunvegetated site (z=0.1 m). Reynolds stress is normalized by ΔU2,which is defined as the difference between mean velocities measured atz=0.5 m and 0.1 m, ΔU=U0.5 m−U0.1 m. Error bars ±1 SE
u’/std(u’)
w’/
std(
w’)
−3 −2 −1 0 1 2 3−3
−2
−1
0
1
2
3
0.5
1
1.5
2
2.5a
Q2 Q1
Q4Q3
pdf x10−3
u’/std(u’)
w’/
std(
w’)
−3 −2 −1 0 1 2 3−3
−2
−1
0
1
2
3
0.5
1
1.5
2
2.5pdf x10−3
b
Fig. 12 Quadrant analysis of the probability density functions (pdfs)of u′ and w′ distributions normalized by their standard deviation at az=0.1 m above the seafloor at the unvegetated site and b z=0.1 m at theseagrass site, which shows the dominance of turbulent sweeping eventsin quadrant 4
Estuaries and Coasts (2013) 36:1099–1114 1109
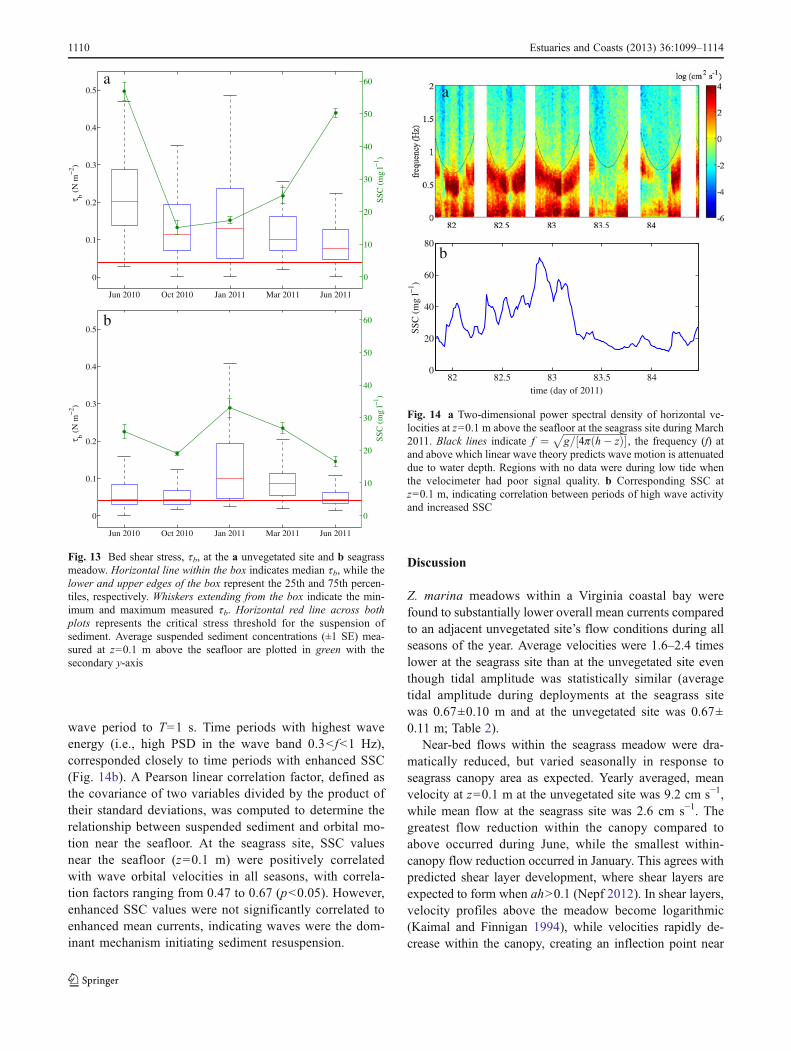
wave period to T=1 s. Time periods with highest waveenergy (i.e., high PSD in the wave band 0.3< f<1 Hz),corresponded closely to time periods with enhanced SSC(Fig. 14b). A Pearson linear correlation factor, defined asthe covariance of two variables divided by the product oftheir standard deviations, was computed to determine therelationship between suspended sediment and orbital mo-tion near the seafloor. At the seagrass site, SSC valuesnear the seafloor (z=0.1 m) were positively correlatedwith wave orbital velocities in all seasons, with correla-tion factors ranging from 0.47 to 0.67 (p<0.05). However,enhanced SSC values were not significantly correlated toenhanced mean currents, indicating waves were the dom-inant mechanism initiating sediment resuspension.
Discussion
Z. marina meadows within a Virginia coastal bay werefound to substantially lower overall mean currents comparedto an adjacent unvegetated site’s flow conditions during allseasons of the year. Average velocities were 1.6–2.4 timeslower at the seagrass site than at the unvegetated site eventhough tidal amplitude was statistically similar (averagetidal amplitude during deployments at the seagrass sitewas 0.67±0.10 m and at the unvegetated site was 0.67±0.11 m; Table 2).
Near-bed flows within the seagrass meadow were dra-matically reduced, but varied seasonally in response toseagrass canopy area as expected. Yearly averaged, meanvelocity at z=0.1 m at the unvegetated site was 9.2 cm s−1,while mean flow at the seagrass site was 2.6 cm s−1. Thegreatest flow reduction within the canopy compared toabove occurred during June, while the smallest within-canopy flow reduction occurred in January. This agrees withpredicted shear layer development, where shear layers areexpected to form when ah>0.1 (Nepf 2012). In shear layers,velocity profiles above the meadow become logarithmic(Kaimal and Finnigan 1994), while velocities rapidly de-crease within the canopy, creating an inflection point near
Jun 2010 Oct 2010 Jan 2011 Mar 2011 Jun 2011
0
0.1
0.2
0.3
0.4
0.5
τ b (N
m−
2 )
0
10
20
30
40
50
60
SSC
(m
g l−
1 )
a
Jun 2010 Oct 2010 Jan 2011 Mar 2011 Jun 2011
0
0.1
0.2
0.3
0.4
0.5
τ b (N
m−
2 )
0
10
20
30
40
50
60
SSC
(m
g l−
1 )
b
Fig. 13 Bed shear stress, tb, at the a unvegetated site and b seagrassmeadow. Horizontal line within the box indicates median tb, while thelower and upper edges of the box represent the 25th and 75th percen-tiles, respectively. Whiskers extending from the box indicate the min-imum and maximum measured tb. Horizontal red line across bothplots represents the critical stress threshold for the suspension ofsediment. Average suspended sediment concentrations (±1 SE) mea-sured at z=0.1 m above the seafloor are plotted in green with thesecondary y-axis
82 82.5 83 83.5 840
20
40
60
80
time (day of 2011)
SSC
(m
g l−
1 )
b
a
Fig. 14 a Two-dimensional power spectral density of horizontal ve-locities at z=0.1 m above the seafloor at the seagrass site during March2011. Black lines indicate f ¼ ffiffiffiffiffiffiffiffiffiffiffiffiffiffiffiffiffiffiffiffiffiffiffiffiffiffiffi
g 4p h� zð Þ½ �=p
, the frequency (f) atand above which linear wave theory predicts wave motion is attenuateddue to water depth. Regions with no data were during low tide whenthe velocimeter had poor signal quality. b Corresponding SSC atz=0.1 m, indicating correlation between periods of high wave activityand increased SSC
1110 Estuaries and Coasts (2013) 36:1099–1114

the canopy–water interface. Due to seasonal changes inseagrass cover, altering both the canopy height and canopyfrontal area, the precise location of an inflection point couldnot always be determined. However, ah>0.1 occurs duringall seasons of the year, while ah>1 in the summer. Forsparse canopies, a coherent canopy shear layer is notformed, rather, characteristics of both shear layer andrough-wall boundary layers are present, with reduced shearlayer development occurring as flow velocity increases(Lacy and Wyllie-Echeverria 2011). When ah>1, the cano-pies become essentially cutoff from overlying flow (Luharet al. 2008), dramatically reducing within-canopy velocities.
Tidally- and wave-dominated flows were separated usingthe magnitude of power density within the wave band of thefrequency spectra. In the fully developed canopy in the sum-mer, normalized Reynolds stress within the canopy was re-duced by 75–85 % compared to measurements at the sameelevation of z=0.1 m at the unvegetated site. The highestturbulence levels within the seagrass meadow were found atthe lowest seagrass canopy frontal area, and Reynolds stresswas greater within the canopy than above in the winter andspring. Turbulence enhancement can be caused both by re-duced stem density that can increase stem-generated waketurbulence (Nepf et al. 1997; Widdows et al. 2008), or by areduction in meadow height, causing an intensification ofturbulence closer to the seafloor from the fluid shear layerformed at the top of the canopy (Abdelrhman 2003; Gambi etal. 1990). Additionally, in sparse canopies, significant turbu-lence can be generated by flow interaction with the seafloor(Lacy and Wyllie-Echeverria 2011). Both blade length anddensity contribute to changes in frontal area. Luhar et al.(2008) found that when frontal area is substantially greaterthan ∼0.1, the canopy acts as a dense canopy. In dense cano-pies, within-canopy turbulence and flow are significantlyreduced and roughness length-scales decrease with increasingfrontal area due to the mutual sheltering of individual canopyelements (Luhar et al. 2008). When the frontal area reachesapproximately ≥1, flow is almost entirely displaced above thecanopy, substantially limiting turbulence that can contribute tosediment resuspension (Luhar et al. 2008). Luhar et al. (2008)also noted that by reducing the momentum penetration, adense canopy shelters itself from high flow, which is criticalduring extreme events such as floods, and the reduction inbottom stress associated with dense canopies can stabilize thebed and improve water clarity. Our results indicate that undersummer conditions, the Virginia seagrass meadow was actingas a dense canopy (frontal area of 1.3–2.9), which both re-duced bottom stress and stabilized sediments compared to theunvegetated seafloor. Although there is a transition region forcanopies with frontal areas between 0.1 and 0.5, Luhar et al.(2008) found when frontal area is less than ∼0.1, the canopyacts as a sparse canopy. In sparse canopies, the flow penetratesthroughout the entire canopy and turbulence intensities
increase with frontal area, as stem–wake flow interactionsare enhanced (Raupach et al. 1996). Our results in winter(frontal area of 0.3±0.1, within the transitional region) agreewith conditions found for a sparse canopy, which include flowpenetration through the canopy and increased turbulence in-tensities contributing to enhanced bottom shear stress andsediment suspension compared to the unvegetated site.
Quadrant analysis indicated that during all seasons, tur-bulent motion within the meadow was dominated by sweep-ing events of momentum, suggesting turbulence wasgenerated at the shear layer at the top of the canopy andmomentum transport occurred into the canopy. Although themagnitude of turbulence within the canopy was reducedwith increased seagrass coverage, the efficiency of momen-tum transport increased, as evident from the greater relativecontributions from both ejection and sweep motions ofturbulent eddies transporting momentum into the canopy.Strong sweep motions into the canopy were also observedby Ghisalberti and Nepf (2006), who found that sweepswere followed by weak ejection events (u′<0, w′>0) thatoccurred at frequencies twice that of the dominant frequencyof the coherent vortex formed at the top of the canopy.
Wave Interaction with the Seagrass Canopy
Wave periods and significant wave heights were computedfrom pressure records obtained from the ADVs at a sam-pling rate of 32 Hz. Wave periods at all sites ranged between1 and 4 s, representing wind generated gravity waves. Overthe year, there was a 35 % reduction in Hs at the seagrass sitecompared to the unvegetated site. Most of this reductionoccurred during the summer, with no statistical difference inHs during the winter. As evident from PSD graphs (Fig. 10),waves were not monochromatic and typically spanned arange of frequencies between f=0.3 to 1 Hz. When compar-ing attenuation of wave energy within this wave portion ofthe PSD, the largest reductions in wave motion within theseagrass bed compared to the unvegetated site occurred atlow frequencies during the summer. Bradley and Houser(2009) found that waves at T∼2.6 s were relatively unaf-fected by seagrass, but higher frequency waves (T∼1.5 s)caused seagrass blade movement that tended to be out ofphase with wave motion, increasing frictional drag andwave energy attenuation. Waves in our study tended to beof shorter period, and most of the attenuation in waveenergy occurred between wave periods of T=1.4–2.0 s.Although blade movement was not quantified in our study,this attenuation is within the same frequency range as thatfound by Bradley and Houser (2009).
The ratio of wave orbital excursion length (A) to bladespacing (ΔS) can also be used to indicate the significance ofwave orbital motion reduction within the canopy (Lowe etal. 2005). As per Lowe et al. (2005), A=uos/ω, where uos is
Estuaries and Coasts (2013) 36:1099–1114 1111

the wave orbital velocity and ω=2π/T, is the radian wavefrequency estimated directly above the canopy at z=0.5 m.For A/ΔS>1, the attenuation of orbital motion within thecanopy is significant. Our measurements show that A/ΔSranged between 0.5 during summer and 0.75 during winter.This indicates that orbital motions are not significantly altereddue to direct interaction with the seagrass blades, and althoughtidally driven flows may be damped, oscillatory motion wasable to effectively penetrate the seagrass canopy. This findingis similar to laboratory measurements of flow structure withinand above a model Z. marina meadow (Luhar et al. 2010),which found that although unidirectional flows were reducedwithin the meadow, in-canopy orbital velocities were notsignificantly altered. This suggests that throughout the year,storm events, which tend to increase Hs and T (Chen et al.2005), may be effective at generating oscillatory flowsthrough the seagrass canopy. However, since attenuation inwave amplitudes across the seagrass meadow is least effectiveduring time periods of low canopy area, this may ultimatelylead to seasonal increases in sediment resuspension duringwinter, as sediment suspension within the meadow was sen-sitive to wave oscillatory motion. Overall, at minimum frontalarea in winter, average velocities were reduced, but the mead-ow behaved similarly to an unvegetated seafloor in regard tosignificant wave height, orbital velocities, and bottom shearstress. This agrees with findings from Bradley and Houser(2009) that attenuation of wave energy across a seagrassmeadow is the result of the high density of seagrass bladesand the aerial extent of the canopy, not the drag induced byflow interaction with individual blades.
Sediment Suspension
Overall, seasonal changes in the meadow frontal area stronglyinfluenced wave development, bed shear stress, and subse-quent sediment suspension in the seagrass meadow. Duringthe summer, SSC at the unvegetated site was roughly doublethat within the seagrass canopy, while similar SSC were foundin March and October within and outside the seagrass mead-ow. Many studies have also found that with increasingseagrass density, sediment resuspension is limited and sedi-ment deposition occurs (Granata et al. 2001;Ward et al. 1984).Likely, this is caused by a transition from dense canopy coverduring summer, where the canopy is essentially cutoff fromthe overflow, to a more sparse canopy cover, where the flow,vertical momentum, and mass transport is more vigorous(Luhar et al. 2008). In addition, under low canopy develop-ment in winter, although the magnitude of bottom shear wassimilar within the seagrass meadow and the adjacentunvegetated site, sediment suspension was enhanced withinthe meadow. This agrees with previous studies that haveshown at low densities, seagrass enhanced sediment suspen-sion through scouring (Bouma et al. 2009). Finer sediment
grain sizes were also found within the meadow, likely causedby enhanced deposition in summer. Since finer-grained parti-cles typically resuspend at lower critical shear stresses thanlarger particles, this may have contributed to greater winter-time resuspension compared to unvegetated sites under simi-lar bed shear stress conditions.
Although seasonal changes occur, Gacia and Duarte(2001) concluded that seagrass meadows often reduceresuspension rather than enhance deposition, as depositiononly occurred during the summer and was only slightlyincreased. In yearly studies within a seagrass canopy under-going restoration along the Virginia coast, turbidity levelsduring June–July, when the meadow was at peak biomass,showed significant reductions over a 10-year period withincreased seagrass blade density and overall canopy size(Orth et al. 2012). Z. marina meadows also depend on seedproduction and germination in order to expand cover (Orthet al. 2006). Increased orbital motion, turbulence, and flowthrough the canopy can serve to distribute seeds in thespring (Orth et al. 2012), and the transport of seeds andother resources may be particularly important within themeadow’s transition periods of senescence in the fall andgrowth in the spring/summer. During summer, flow reduc-tion and sediment stabilization can serve to decrease turbid-ity and enhance the available light for photosynthesis (Carret al. 2010, 2012), creating a positive feedback for seagrassgrowth.
Acknowledgments We thank A. Schwarzschild, C. Buck, B. Rodgers,and D. Boyd for field assistance, and J. Bricker for helpful discussionsregarding wave–turbulence decomposition. This research was funded bythe National Science Foundation (NSF-DEB 0621014, BSR-8702333-06, DEB-9211772, DEB-94118974, and DEB-0080381) to the VirginiaCoast Reserve Long-Term Ecological Research program and by NSF-OCE 1151314. J.C.R. Hansen was supported through an NSF graduateresearch fellowship (DGE-0809128).
References
Abdelrhman, M.A. 2003. Effect of eelgrass Zostera marina canopieson flow and transport. Marine Ecology Progress Series 248: 67–83.
Ackerman, J.D., and A. Okubo. 1993. Reduced mixing in a marinemacrophyte canopy. Functional Ecology 7: 305–309.
Benilov, A.Y., and B.N. Filyushkin. 1970. Application of methods oflinear filtration to an analysis of fluctuations in the surface layer ofthe sea. Izvestya, Atmospheric and Oceanic Physics 6: 810–819.
Bouma, T.J., M. Friedrichs, P. Klaassen, B.K. van Wesenbeek, F.G.Brun, S. Temmerman, M.M. van Katwijk, G. Graf, and P.M.J.Herman. 2009. Effects of shoot stiffness, shoot size and currentvelocity on scouring sediment from around seedlings and propa-gules. Marine Ecology Progress Series 388: 293–297.
Bradley, K., and C. Houser. 2009. Relative velocity of seagrass blades:implications for wave attenuation in low-energy environments.Journal of Geophysical Research 114: F01004. doi:10.1029/2007JF000951.
1112 Estuaries and Coasts (2013) 36:1099–1114

Bricker, J.D., and S.G. Monismith. 2007. Spectral wave-turbulencedecomposition. Journal of Atmospheric and Oceanic Technology24: 1479–1487.
Bryan, K.R., H.W. Tay, C.A. Pilditch, C.J. Lundquist, and H.L. Hunt.2007. The effects of seagrass (Zostera muelleri) on boundary-layer hydrodynamics in Whangapoua Estuary, New Zealand.Journal of Coastal Research SI50: 668–672.
Carr, J., P. D’Odorico, K. McGlathery, and P. Wiberg. 2010. Stabilityand bistability of seagrass ecosystems in shallow coastal lagoons:role of feedbacks with sediment resuspension and light attenua-tion. Journal of Geophysical Research 115: G03011. doi:10.1029/2009JG001103.
Carr, J.A., P. D’Odorico, K.J. McGlathery, and P.L. Wiberg. 2012.Modeling the effects of climate change on eelgrass stability andresilience: future scenarios and leading indicators of collapse.Marine Ecology Progress Series 448: 289–301.
Chen, Q., H. Zhao, K. Ju, and S.L. Douglass. 2005. Prediction of windwaves in a shallow estuary. Journal of Waterway, Port, Coastal,and Ocean Engineering 131: 137–148.
Chen, S., L.P. Sanford, E.W. Koch, F. Shi, and E.W. North. 2007. Anearshore model to investigate the effects of seagrass bed geom-etry on wave attenuation and suspended sediment transport. Es-tuaries and Coasts 30(2): 296–310.
de Boer, W.F. 2007. Seagrass–sediment interactions, positive feedbacksand critical thresholds for occurrence: a review. Hydrobiologia 591:5–24.
Dean, R.G., and R.A. Dalrymple. 1991. Water wave mechanics forengineers and scientists. Singapore: World Scientific.
Duarte, C.M. 1991. Seagrass depth limits. Aquatic Botany 40: 363–377.Fagherazzi, S., and P.L. Wiberg. 2009. Importance of wind conditions,
fetch and water levels on wave-generated shear stresses in shallowintertidal basins. Journal of Geophysical Research 114: F03022.doi:10.1029/2008JF001139.
Fonseca, M.S., and J.S. Fisher. 1986. A comparison of canopy frictionand sediment movement between four species of seagrass withreference to their ecology and restoration. Marine Ecology Prog-ress Series 29: 15–22.
Fonseca, M.S., and M.A.R. Koehl. 2006. Flow in seagrass canopies:the influence of patch width. Estuarine, Coastal and Shelf Science67: 1–9.
Gacia, E., and C.M. Duarte. 2001. Sediment retention by a Mediterra-nean Posidonia oceanica meadow: the balance between deposi-tion and resuspension. Estuarine, Coastal and Shelf Science 52:505–514.
Gacia, E., T.C. Granata, and C.M. Duarte. 1999. An approach to mea-surement of particle flux and sediment retention within seagrass(Posidonia oceanica) meadows. Aquatic Botany 65: 255–268.
Gambi, M.C., A.R.M. Nowell, and P.A. Jumars. 1990. Flume obser-vations on flow dynamics in Zostera marina (eelgrass) beds.Marine Ecology Progress Series 61: 159–169.
Ghisalberti, M., and H. Nepf. 2006. The structure of the shear layer inflows over rigid and flexible canopies. Environmental Fluid Me-chanics 6: 277–301.
Granata, T.C., T. Serra, J. Colomer, X. Casamitjana, C.M. Duarte, andE. Gacia. 2001. Flow and particle distributions in a nearshoreseagrass meadow before and after a storm. Marine Ecology Prog-ress Series 218: 95–106.
Grant, W.D., and O.S. Madsen. 1979. Combined wave and currentinteraction with a rough bottom. Journal of Geophysical Research84: 1797–1808.
Gruber, R.K., and W.M. Kemp. 2010. Feedback effects in a coastalcanopy-forming submersed plant bed. Limnology and Oceanog-raphy 55(6): 2285–2298.
Hansen, J.C.R., and M.A. Reidenbach. 2012. Wave and tidally drivenflows in eelgrass beds and their effect on sediment suspension.Marine Ecology Progress Series 448: 271–287.
Jing, L., and P.V. Ridd. 1996. Wave-current bottom shear stresses andsediment resuspension in Cleveland Bay, Australia. Coastal En-gineering 29: 169–186.
Kaimal, J., and J. Finnigan. 1994. Atmospheric boundary layer flows:their structure and measurement. New York: Oxford UniversityPress.
Koch, E.W., and G. Gust. 1999. Water flow in tide- and wave-dominated beds of the seagrass Thalassia testudinum. MarineEcology Progress Series 184: 63–72.
Koch, E.W., J.D. Ackerman, J. Verduin, and M. van Keulen. 2006.Fluid dynamics in seagrass ecology—from molecules to ecosys-tems. In Seagrasses: biology, ecology and conservation, ed.A.W.D. Larkum, R.J. Orth, and C. Duarte, 193–225. Amsterdam:Springer.
Lacy, J.R., and S. Wyllie-Echeverria. 2011. The influence of currentspeed and vegetation density on flow structure in two macrotidaleelgrass canopies. Limnology and Oceanography: Fluids andEnvironments 1: 38–55.
Lawson, S.E., P.L. Wiberg, K.J. McGlathery, and D.C. Fugate. 2007.Wind-driven sediment suspension controls light availability in ashallow coastal lagoon. Estuaries and Coasts 30(1): 102–112.
Lawson, S.E., K.J. McGlathery, and P.L. Wiberg. 2012. Enhancementof sediment suspension and nutrient flux by benthic macrophytesat low biomass. Marine Ecology Progress Series 448: 259–270.
Lowe, R.J., J.R. Koseff, and S.G. Monismith. 2005. Oscillatory flowthrough submerged canopies: 1. Velocity structure. Journal ofGeophysical Research 110: C10016. doi:10.1029/2004JC002788.
Lu, S.S., and W.W. Willmarth. 1973. Measurements of the structure ofthe Reynolds stress in a turbulent boundary layer. Journal of FluidMechanics 60: 481–571.
Luhar, M., J. Rominger, and H. Nepf. 2008. Interaction between flow,transport and vegetation spatial structure. Environmental FluidMechanics 8: 423–439.
Luhar, M., S. Coutu, E. Infantes, S. Fox, and H. Nepf. 2010. Wave-induced velocities inside a model seagrass bed. Journal of Geo-physical Research 115: C12005. doi:10.1029/2010JC006345.
McGlathery, K., I.C. Anderson, and A.C. Tyler. 2001. Magnitude andvariability of benthic and pelagic metabolism in a temperatecoastal lagoon. Marine Ecology Progress Series 216: 1–15.
Moore, K.A., R.J. Orth, and J.F. Nowak. 1993. Environmental regula-tion of seed germination in Zostera marina L. (eelgrass) in Ches-apeake Bay: effects of light, oxygen and sediment burial. AquaticBotany 45: 79–91.
Nepf, H.M. 1999. Drag, turbulence, and diffusion in flow throughemergent vegetation. Water Resources Research 35(2): 479–489.
Nepf, H.M. 2012. Flow and transport in regions with aquatic vegeta-tion. Annual Review of Fluid Mechanics 44: 123–142.
Nepf, H.M., J.A. Sullivan, and R.A. Zavistoski. 1997. A model fordiffusion within emergent vegetation. Limnology and Oceanog-raphy 42(8): 1735–1745.
Nepf, H., M. Ghisalberti, B. White, and E. Murphy. 2007. Retentiontime and dispersion associated with submerged aquatic cano-pies. Water Resources Research 43: W04422. doi:10.1029/2006WR005362.
Orth, R.J., and K.J. McGlathery. 2012. Eelgrass recovery in the coastalbays of the Virginia Coast Reserve, USA. Marine Ecology Prog-ress Series 448: 173–176.
Orth, R.J., M.L. Luckenbach, S.R. Marion, K.A. Moore, and D.J.Wilcox. 2006. Seagrass recovery in the Delmarva Coastal Bays,USA. Aquatic Botany 84: 26–36.
Orth, R.J., K.A. Moore, S.R. Marion, D. Wilcox, and D. Parrish. 2012.Seed addition facilitates Zostera marina L. (eelgrass) recovery ina coastal bay system (USA).Marine Ecology Progress Series 448:177–195.
Peterson, C.H., R.A. Luettich Jr., M. Fiorenza, and G.A. Skilleter.2004. Attenuation of water flow inside seagrass canopies of
Estuaries and Coasts (2013) 36:1099–1114 1113
differing structure. Marine Ecology Progress Series 268: 81–92.
Raupach, M.R., J.J. Finnigan, and Y. Brunet. 1996. Coherent eddiesand turbulence in vegetation canopies: the mixing-layer analogy.Boundary-Layer Meteorology 78: 351–382.
Sand-Jensen, K. 2008. Drag forces on common plant species in tem-perate streams: consequences of morphology, velocity and bio-mass. Hydrobiologia 610(1): 307–319.
Stapleton, K.R., and D.A. Huntley. 1995. Seabed stress determinationsusing the inertial dissipationmethod and the turbulent kinetic energymethod. Earth Surface Processes and Landforms 20: 807–815.
Trowbridge, J.H. 1998. On a technique for measurement of turbulentshear stress in the presence of surface waves. Journal of Atmo-spheric and Oceanic Technology 15: 290–298.
Verduin, J.J., and J.O. Backhaus. 2000. Dynamics of plant–flow interac-tions for the seagrass Amphibolis antarctica: field observations and
model simulations. Estuarine, Coastal and Shelf Science 50: 185–204.
Vogel, S. 1981. Life in moving fluids. Boston: Grant.Ward, L.G., W.M. Kemp, and W.R. Boynton. 1984. The influence of
waves and seagrass communities on suspended particulates in anestuarine embayment. Marine Geology 59: 85–103.
Wiberg, P.L., and C.R. Sherwood. 2008. Calculating wave-generatedbottom orbital velocities from surface-wave parameters. Comput-er and Geosciences 34: 1243–1262.
Wiberg, P.L., and J.D. Smith. 1983. A comparison of field data andtheoretical models for wave current interactions at the bed on thecontinental shelf. Continental Shelf Research 2: 147–162.
Widdows, J., N.D. Pope, M.D. Brinsley, H. Asmus, and R.M. Asmus.2008. Effects of seagrass beds (Zostera noltii and Z. marina) onnear-bed hydrodynamics and sediment resuspension. MarineEcology Progress Series 358: 125–136.
1114 Estuaries and Coasts (2013) 36:1099–1114