Embed Size (px)
Citation preview

Genetic diversity of Labyrinthula spp. in seagrass Zostera marina beds
in the North Atlantic Ocean and the Baltic Sea
Submitted by
Matsapume Detcharoen
In partial fulfillment of the requirements
for the Degree of Master of Science in Biology
Ludwig-Maximilians-Universität München
Faculty of Biology
August 2015
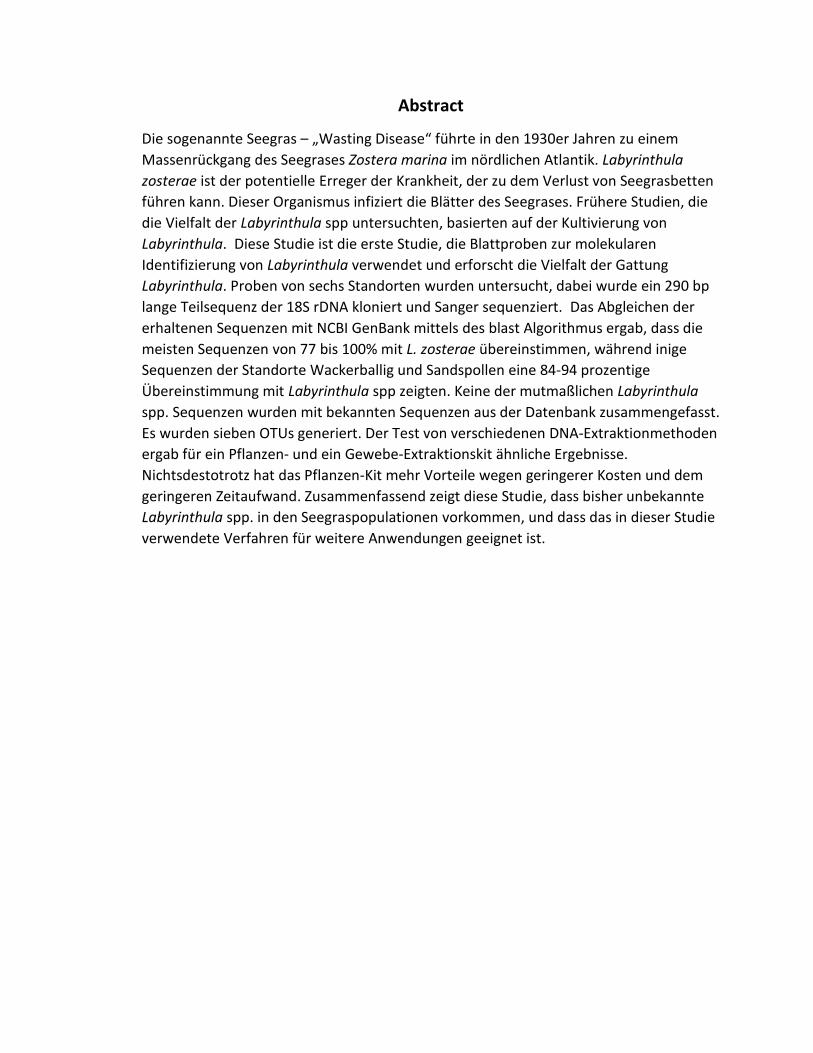
Abstract
Die sogenannte Seegras – „Wasting Disease“ führte in den 1930er Jahren zu einem
Massenrückgang des Seegrases Zostera marina im nördlichen Atlantik. Labyrinthula
zosterae ist der potentielle Erreger der Krankheit, der zu dem Verlust von Seegrasbetten
führen kann. Dieser Organismus infiziert die Blätter des Seegrases. Frühere Studien, die
die Vielfalt der Labyrinthula spp untersuchten, basierten auf der Kultivierung von
Labyrinthula. Diese Studie ist die erste Studie, die Blattproben zur molekularen
Identifizierung von Labyrinthula verwendet und erforscht die Vielfalt der Gattung
Labyrinthula. Proben von sechs Standorten wurden untersucht, dabei wurde ein 290 bp
lange Teilsequenz der 18S rDNA kloniert und Sanger sequenziert. Das Abgleichen der
erhaltenen Sequenzen mit NCBI GenBank mittels des blast Algorithmus ergab, dass die
meisten Sequenzen von 77 bis 100% mit L. zosterae übereinstimmen, während inige
Sequenzen der Standorte Wackerballig und Sandspollen eine 84-94 prozentige
Übereinstimmung mit Labyrinthula spp zeigten. Keine der mutmaßlichen Labyrinthula
spp. Sequenzen wurden mit bekannten Sequenzen aus der Datenbank zusammengefasst.
Es wurden sieben OTUs generiert. Der Test von verschiedenen DNA-Extraktionmethoden
ergab für ein Pflanzen- und ein Gewebe-Extraktionskit ähnliche Ergebnisse.
Nichtsdestotrotz hat das Pflanzen-Kit mehr Vorteile wegen geringerer Kosten und dem
geringeren Zeitaufwand. Zusammenfassend zeigt diese Studie, dass bisher unbekannte
Labyrinthula spp. in den Seegraspopulationen vorkommen, und dass das in dieser Studie
verwendete Verfahren für weitere Anwendungen geeignet ist.

Abstract
Seagrass wasting disease in the 1930s resulted in mass decline of seagrass Zostera
marina in the Northern Atlantic Ocean. Labyrinthula zosterae is the potential pathogen
of this disease that can lead to seagrass bed loss. This organism infects eelgrass’ leaf.
Previous studies to identify the diversity of Labyrinthula spp. were based on culture
method. This present study is the first study to use leaf samples for Labyrinthula
molecular identification and explores diversity of the genus Labyrinthula. I investigated
samples from six locations by cloning and Sanger sequencing of a 290 bp partial
sequence of the 18S rDNA. Blast search against GenBank revealed that most sequences
are 77-100% similar to L. zosterae, while some sequences from Wackerballig and
Sandspollen were 84-94% matched Labyrinthula spp. None of that putative Labyrinthula
spp. was grouped with known sequences from the database. There were seven OTUs
generated. DNA extraction gave similar results for both tested extraction kits, a plant and
a tissue kits. Nonetheless, the plant kit has more advantage due to its lower cost and
time effort. In conclusion, this study shows undiscovered Labyrinthula spp. in the
investigated eelgrass populations, second it shows that the method used in this study is
suitable for further applications.

Table of Contents
Abstract
Chapter 1: Introduction
1.1 Seagrass 1
1.2 Wasting disease 2
1.3 Marine microorganisms 4
1.4 Labyrinthula 4
1.5 DNA extraction kit comparisons 6
1.6 DNA isolation of Labyrinthula 6
1.7 Aims 7
Chapter 2: Methods
2.1 Diversity of Labyrinthula across the North Atlantic and the Baltic Sea 8
2.2 Extraction kit comparison 13
Chapter 3: Results
3.1 Diversity of Labyrinthula across the North Atlantic and the Baltic Sea 16
3.2 Extraction kit comparison 24
Chapter 4: Discussion 25
Chapter 5: References 30
Acknowledgements 41

1
Chapter 1: Introduction
1.1 Seagrass
Seagrasses are monocotyledonous marine angiosperms (Procaccini et al., 2007). They
play important roles in marine ecosystems such as nursery grounds for many animals,
protecting shelters from sediments between mangrove and coral reefs and food sources
for dugongs, manatees, turtles and herbivorous fish (Björk et al. 2008; Unsworth et al.
2008). The most important function of the seagrass bed is the large amount of carbon
that is fixed by photosynthesis and becomes available via the detrital food chain and an
important carbon sink (Duarte et al., 2010; Fourqurean et al., 2012)
There are 14 genera of seagrasses belonging to four families, Cymodoceaceae,
Hydrocharitaceae, Posidoniaceae and Zosteraceae; all are in subclass Alismatidae and
consist of less than 0.1% of all flowering plants found in the world (Waycott et al. 2002;
Lucas et al. 2012).
Zostera (commonly known as eelgrass) is very widespread and so occurs in temperate
and as well as in the tropical climates (Hemminga and Duarte, 2000). It belongs to family
Zosteraceae. The genus is characterized by the species that are monoecious with
creeping rhizome and are usually perennial. There are nine species within this genus
(Larkum et al., 2007). Zostera is considered a colonizer as well as a climax species - that
is, the single species represents the entire range of system development (Den Hartog,
1971). Zostera marina L. occurs predominantly in a monoculture throughout most of its
distribution, although it sometimes co-occurs with a variety of species.
Z. marina is widely distributed in the coastal and estuarine areas of the northern
Atlantic, Mediterranean, and Eastern Pacific (Jacobs, 1979; Short and Short, 2003). Z.
marina’s blade is about 80 centimeters long, with 3 to 12 millimeters wide (Larkum et al.,
2007). It forms dense beds and found in sheltered bays and lagoons from the lower
shore to about 7.6 m depth in the West Baltic, generally on sand and sandy mud (Dale et
al., 2007; Schubert et al., 2015).
Current studies reveal the declining size and abundance of seagrass meadows around
the world (Waycott et al., 2009). Environmental changes including physical disturbance,
aquacultures, nutrients runoff, climate change, human activities as well as disease
accelerate the decline (Orth et al., 2006; Rasmussen, 1977; Short et al., 2011).

2
Figure 1.1 Diagram of Z. marina (Dale et al., 2007).
1.2 Wasting disease
The mass declination event of nearly all eelgrass Z. marina populations in the Northern
Atlantic in the 1930s is wasting disease. The wasting disease was firstly reported in
populations of eelgrass Z. marina in the North American Atlantic in 1931, and later in the
Atlantic European populations in 1932. The disease in Northern America and Northern
Europe between 1930 and 1940 resulted in significant eelgrass beds lost, coastal erosion
and loss of fisheries habitat. However, since the eelgrass is a fast-growing species with
rapid colonization capacity most of the eelgrass meadows were reestablished within 10
years, mainly after 1960 (Blois et al., 1961; Larkum et al., 2007). There are some
locations that the eelgrass has never recovered after the disease, for example, at the
Dutch Wadden Sea (van Katwijk et al., 2000) and the French coasts (Godet et al., 2008).
Not only Z. marina, Labyrinthula spp. also associated in mass declination of Z. capricorni
in New Zealand in 1960 (Armiger, 1964) and putative cause of mass mortality of seagrass
Thalassia testudinum in the Florida Bay in 1987 (Blakesley et al., 2001; Durako and Kuss,
1994; Robblee et al., 1991).

3
It was at first thought to be caused by the slime mold L. macrocystis Cienkowski,
pollution, climatic factors especially extreme precipitations, or even high summer
temperature (Den Hartog, 1987). Eventually, Muehlstein, Porter, & Short (1991) isolated
Labyrinthula spp. from infected leaves of Z. marina. Among various culture of
Labyrinthula, only one strain causes the symptom of wasting disease. They identified
that strain as Labyrinthula zosterae Porter & Muehlstein as a causing agent of this
disease, based on host specificity, cytology, growth pattern, cell size, color in mass, and
aggregation structure. Supported by infection test by Muehlstein (1992). He found that
direct contact between infected leaf and healthy leaf was the necessary mechanism of
the symptoms.
The symptoms of the disease are very characteristic. Small brown spots develop on the
leaves; these spots spread and become darker, and finally cover large parts of the leaves,
which eventually are detached. The whole process takes a few weeks. The rhizomes also
show discoloration. The infected plants often survive for up to a year, but repeated
defoliation exhausts the plants and eventually, lead to death (Den Hartog, 1987;
Rasmussen, 1977).
L. zosterae is mostly found at the margin of necrosis from both surface of the leaf. At the
beginning of infection, Labyrinthula cells were mainly located in mesophyll cells taken
from marginal areas of necrosis of small necrotic spots (Armiger, 1964). The cells are
able to invade neighboring cells by making hole in the plant cell wall and moving through
it. The cells are found in the vascular tissue. In later phases of infection, characterized by
leaf tissue that was completely brown, Labyrinthula cells are more common in epidermal
cells than in earlier stages and are occasionally found in lacunae (Muehlstein, 1992).
Figure 1.2 Infected Z. marina leaves (Ralph and Short, 2002).

4
1.3 Marine microorganisms
There are about 100 million species predicted but fewer than 2 million species are
described to now (May, 1988). The species catalog is quite complete for large body size
organisms. Nonetheless, we are missing the vast majority of diversity as since the
estimated 99% of small organisms such as bacteria and single cell eukaryotes cannot
cultivated (Woese, 1996). Microorganisms in marine ecosystems play fundamental
ecological roles such as primary producers, consumers and decomposers in aquatic food
webs (Caron et al., 2012). However, diversity of marine organism is still unclear. The
early method to access the diversity like cultivation-dependent method gave low
diversity and abundance (Galand et al., 2009). Pace (1997) estimated the marine species
is about hundred times higher than the estimates based on the cultivation. The emerging
field of DNA sequence-based method in the last fifteen years has revealed the diversity
of all types of microorganisms (Galand et al., 2009; Pedrós-Alió, 2006). Sogin et al. (2006)
revealed bacterial communities in the deep sea in the North Atlantic are about one to
two times more complex than previously reported. There are thousands of low
abundance populations containing most of the diversity, which is called “rare
biosphere”.
1.4 Labyrinthula
Labyrinthulomycetes is a group of protists that mainly lives in marine environment. This
class consists of two groups: Labyrinthulids and Thraustochytrids. Porter and Kochert,
(1978) firstly used ribosomal DNA molecular weights to reclassify the phylogenetic
relationship of this group. Cavalier-Smith, Allsopp, & Chao (1994) reclassified phylum
Heterokonta putting Labyrinthulomycids and Thraustochytrids in subphylum
Labyrinthista, families Labyrinthulidae and Thraustochytridae, respectively by using
evidence of 18S small subunit ribosomal RNA gene. They also found that Labyrinthulids,
along with Thraustochytrids are closely related and from a deeply divergent branch of
the phylum Heterokonta.
Recently, Tsui et al. (2009) studied phylogeny of Labyrinthulomycetes using sequences of
the actin, beta-tubulin, and elongation factor 1-alpha gene fragments and ribosomal
small subunit (SSU) genes. This was the first time using multiloci nuclear sequences to
reconstruct phylogenetic tree of this group. They found that Labyrinthulomycetes and
the bicoecean are sister groups. Labyrinthulomycetes is monophyletic consists of two
clades, one with Labyrinthula spp. and Aplanochytrium spp., and another clade has
Thraustochytriidae and Oblongichytrium minitum. Thus, Labyrinthulomycetes is sister to
the other nonpigmented stramenopiles (the Oomycetes, Developayella, and
Hyphochytrium) (Leander and Porter, 2001).

5
Genus Labyrinthula was firstly described by Cienkowski (1867) as marine slime molds.
Labyrinthula are characterized by spindle-shaped or spherical, non-amoeboid cells, live
in colony, biflagellate zoospores, and multilamellate cell walls composed of Golgi body-
derived scales. One feature thing is the members of this genus can produce ectoplasmic
network from one or more points on the cell. These networks are produced by a special
organ called sagenogenetosome or bothrosome (Perkins, 1972a; Porter, 1972). The
network helps cell in locomotion, digestion, increasing surface area and protection
(Perkins, 1972b).
The number of species in this genus is uncertain. There are eight or nine recognized
species. The characteristics used in species delineation include cell size, color in mass
and reproductive or resting stages (Muehlstein et al., 1991). L. zosterae has a spindle-like
cell, 15.5-19.5 µm long and 3.5- 5 µm wide. It forms a dense, bushy colony with an
evenly expanding margin, hyaline to pale yellow in soft agar, vacuole 0.4 µm in diameter
and ectoplasmic network branching and anastomosing (Muehlstein et al., 1991; Young,
1943).
Almost all members of this genus live in marine environment except some species. L.
terrestris is known to be a pathogen causing rapid blight disease of terrestrial plants,
mostly turfgrasses such as Agrotis capillaris and Poa annua (Bigelow et al., 2005;
Entwistle et al., 2006; Olsen, 2007). Labyrinthula cienkowski Zopf, isolated from
Vaucheria sessilis, a freshwater alga (Zopf 1892). Aschner (1958) cultured Labyrinthula
macrocystis Cienk. from soil around roots of a diseased Carica papaya in Israel.
The use of rDNA sequences to explore microbial diversity has become popular in the last
decades (Nakamura et al., 2015; Yuasa et al., 2006) because sequences of these genes
provide taxonomic characters for species that have few distinctive morphological
features, or that require involved microscopy or laboratory culture and testing
(Countway et al., 2005). The rDNA, particularly 18S rDNA for eukaryotes overcome other
genes due to its ubiquity, size, and low evolutionary rate, the small subunit ribosomal
RNA is an important tool in molecular evolution (Van de Peer and De Wachter, 1997).
Bockelmann et al. (2012) firstly used 18s ribosomal DNA for phylogenetic analysis of
Labyrinthula spp. They cultured Labyrinthula from leaves showing symptoms of wasting
disease. With direct sequencing of PCR products they found L. zosterae in most
populations of eelgrass analyzed with two putatively new species in Northern European
Waters with different salinity, however, higher diversity is expected for the culture-
independent study (Pace, 1997). In addition, Bockelmann et al. (2013) studied
prevalence and abundance of L. zosterae in 19 Z. marina populations in the Baltic Sea
and North Sea by quantitative PCR using internal-transcribe-spacer 1 (ITS1). They found
that L. zosterae occurs mainly in summer especially between June to September, none
during winter and early spring; the abundance ranges between 0 and 271 cells per mg Z.
marina dry weight.

6
1.5 DNA extraction kit comparisons
High quality of DNA is required for molecular systematics. Genomic DNA extraction is
different depends on organisms and tissues (Aljanabi, 1997). Isolation of DNA in plant is
more complicated than in animal tissue due to its rigid cell wall surrounding the cell
(Manen et al., 2005) along with polysaccharides and secondary metabolites (Pandey et
al., 1996).
Standard extraction methods is often a limiting factor in genetic study in plant fields (Xin
and Chen, 2012) while silica-based commercially available methods give stable DNA
extracts, highly sensitive and are generally faster than the standard methods (Demeke
and Jenkins, 2010). The detection of microbial nucleic acid for the diagnosis of infection
is dependent on the successful separation of nucleic acid from material (Maropola et al.,
2015; Queipo-Ortuño et al., 2008). Many of the extraction kits use spin column
technology because this approach is usually easily integrated into laboratories with
standard equipment, which contains four major steps; lysis, binding, washing and
elution. Nucleic acid is released using chaotropic buffer to denature proteins. The
separation of nucleic acid from other components is achieved by temporary nonspecific
adsorption to a silica membrane within a column. High salt concentration washes and
removes proteins and other impurities. The subsequent applications of a low salt
concentration buffer elutes the purified nucleic acid in a form suitable for enzymatic
processes (Queipo-Ortuño et al., 2008). In recent years, many extraction methods have
released to give higher yield of nucleic acids (Akkurt, 2012; Boudon-Padieu et al., 2015;
Maropola et al., 2015; Xin and Chen, 2012). The polymerase chain reaction (PCR) has
been used with increasing frequency for detecting and identifying plant pathogens. A
prerequisite of PCR amplification is the preparation of good quality DNA with a
consistent yield from infected hosts. Although PCR is sensitive, research has shown that
amplification of target microbial DNA from within another organism can be inhibited by
the presence of host DNA (Cating et al., 2012).
1.6 DNA isolation of Labyrinthula
Bergmann et al. (2011) used Invisorb spin tissue mini kit (Stratec Biomedical, Berlin,
Germany) with addition of UltraPure Salmon Sperm DNA solution (Invitrogen, Life
Technologies, USA) for DNA extraction of L. zosterae cultures isolated from infected Z.
marina. This method was later used by Bockelmann et al.(2013) with extra purification
step using One-Step PCR inhibitor removal kit (Zymo Research, USA) fresh Z. marina
leaves DNA isolation.
Presently there are various kind of DNA extraction methods. Each method produces
different yield of DNA even from the same material and may have significant effects in

7
the downstream processes (Akkurt, 2012; Fredricks et al., 2005; Queipo-Ortuño et al.,
2008). Plant DNA extraction kit is widely used to isolate pathogens from plant specimens
(Boudon-Padieu et al., 2015; Li et al., 2013).
1.7 Aims
Firstly, this study aimed to use 18S small subunit ribosomal DNA to detect eelgrass
pathogens, especially Labyrinthula spp. in eelgrass populations in the North Atlantic and
Baltic Sea using PCR amplification, cloning and Sanger sequencing to reveal their
diversity using phylogenetic analysis, species richness estimators, and rarefaction curves.
The second aim was to compare DNA extraction efficiency of commercially available
plant and tissue extraction kits to detect Labyrinthula in Z. marina leaf samples.
8
Chapter 2: Methods
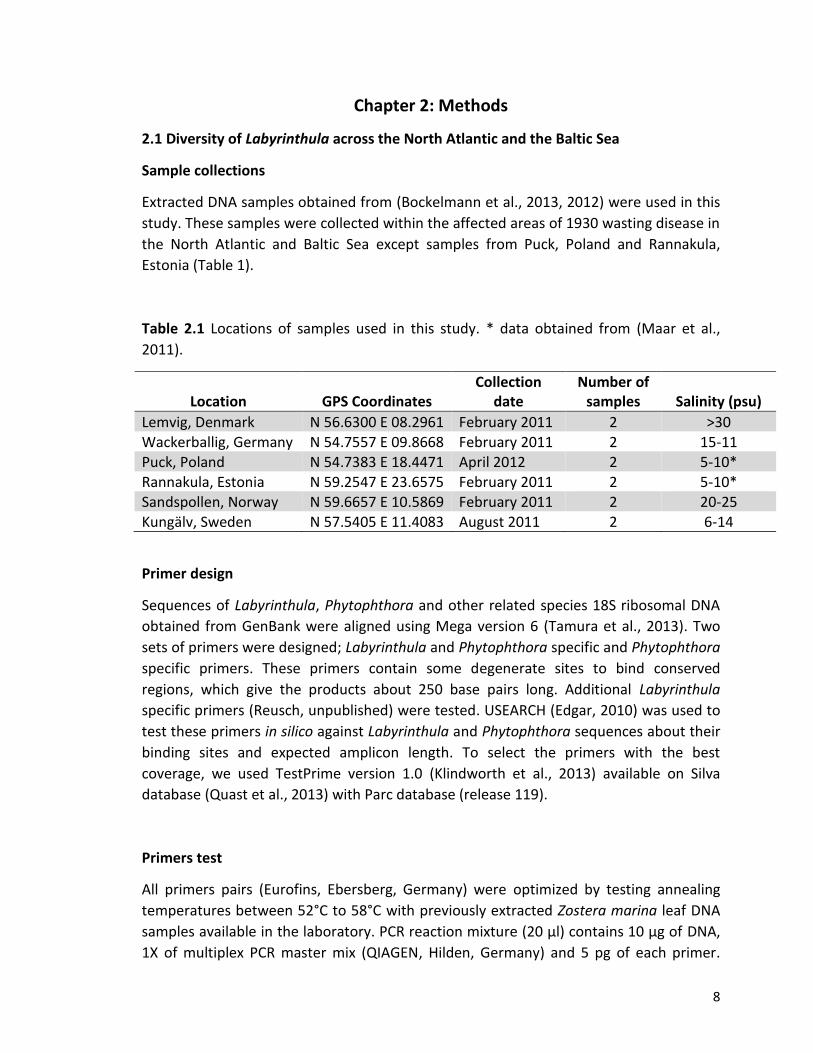
2.1 Diversity of Labyrinthula across the North Atlantic and the Baltic Sea
Sample collections
Extracted DNA samples obtained from (Bockelmann et al., 2013, 2012) were used in this
study. These samples were collected within the affected areas of 1930 wasting disease in
the North Atlantic and Baltic Sea except samples from Puck, Poland and Rannakula,
Estonia (Table 1).
Table 2.1 Locations of samples used in this study. * data obtained from (Maar et al.,
2011).
Location GPS Coordinates Collection
date Number of
samples Salinity (psu)
Lemvig, Denmark N 56.6300 E 08.2961 February 2011 2 >30 Wackerballig, Germany N 54.7557 E 09.8668 February 2011 2 15-11 Puck, Poland N 54.7383 E 18.4471 April 2012 2 5-10* Rannakula, Estonia N 59.2547 E 23.6575 February 2011 2 5-10* Sandspollen, Norway N 59.6657 E 10.5869 February 2011 2 20-25 Kungälv, Sweden N 57.5405 E 11.4083 August 2011 2 6-14
Primer design
Sequences of Labyrinthula, Phytophthora and other related species 18S ribosomal DNA
obtained from GenBank were aligned using Mega version 6 (Tamura et al., 2013). Two
sets of primers were designed; Labyrinthula and Phytophthora specific and Phytophthora
specific primers. These primers contain some degenerate sites to bind conserved
regions, which give the products about 250 base pairs long. Additional Labyrinthula
specific primers (Reusch, unpublished) were tested. USEARCH (Edgar, 2010) was used to
test these primers in silico against Labyrinthula and Phytophthora sequences about their
binding sites and expected amplicon length. To select the primers with the best
coverage, we used TestPrime version 1.0 (Klindworth et al., 2013) available on Silva
database (Quast et al., 2013) with Parc database (release 119).
Primers test
All primers pairs (Eurofins, Ebersberg, Germany) were optimized by testing annealing
temperatures between 52°C to 58°C with previously extracted Zostera marina leaf DNA
samples available in the laboratory. PCR reaction mixture (20 µl) contains 10 µg of DNA,
1X of multiplex PCR master mix (QIAGEN, Hilden, Germany) and 5 pg of each primer.

9
Amplification was conducted in Veriti 96-well Thermal Cycler (Life Technologies, USA)
with the following steps: denaturation at 95°C for 5 minutes, followed by 35 cycles of
95°C 35 seconds, 52-58°C for 40 seconds and 72°C for 1 minute, and final extension at
72°C for 15 minutes. Quantity and quality of PCR products were tested with 2% agarose
gel electrophoresis. The PCR products were cut from the gel and were purify with
Nucleospin Gel and PCR Clean-Up (Macherey-Nagel, Düren, Germany). Exonuclease I and
alkaline phosphatase FastAP (Invitrogen, Life Technologies, USA) were used to remove
excess primers, nucleotides and phosphate at 3’ and 5’ end of the positive PCR products
prior to cloning.
Cloning of PCR products
Purified PCR products were cloned into pCRII-TOPO vector (Invitrogen, Life Technologies,
USA) (Figure 1) using 3:1 PCR product to vector ratio and ligation at 4°C for 16-18 hours.
Recombinant vector was transformed into TOP10 chemically competent Escherichia coli
cells (Invitrogen, Life Technologies, USA), and plated onto LB plates containing 50 mg
ampicillin and 50 mg Xgal (5-bromo-4-chloro-3-indolyl-β-D-galactopyranoside).
Transformants containing recombinant plasmid were randomly selected by blue/white
screening and suspend in 25µl water.
Colony PCR
Colony PCR reaction mixture (10 µl) contains 10 µg of DNA, 1.5 units of DreamTaq DNA
polymerase (Life Technologies, USA), 1X of DreamTaq Buffer, dNTPs and 5 pg of each
M13 primers. Cycling conditions were initial denaturation at 95°C for 1 minute followed
by 35 cycles of 95°C 30 seconds, 50°C for 15 seconds and 72°C for 1 minute, and final
extension at 72°C for 7 minutes. PCR amplification products were size fractionated by 2%
agarose gel electrophoresis. Amplicons of the right size were cleaned by Exonuclease I
and alkaline phosphatase FastAP (Invitrogen, Life Technologies, USA).
Sequencing
Cycle sequencing was performed in 10-µl reaction containing 0.25µl BigDye v3.1, 1X
BigDye buffer and 2.5 pmol of primer. Cycling conditions were 96°C for 1 minute, 25
cycles of 96°C for 1 minute, 50°C for 5 seconds and 60°C for 4 minutes. The products
were cleaned to remove excess fluorescent dye with BigDye XTerminator Purification Kit
(Applied Biosystems, USA) and were sequenced in both directions using automated DNA
sequencer (Applied Biosystems, USA).

10
Figure 2.1 pCRII-Topo cloning vector map (Invitrogen, Life Technologies,
https://tools.lifetechnologies.com/content/sfs/vectors/pcriitopo_map.pdf).
Sequence editing and alignment
Raw sequences were manually edited using Geneious (Biomatters). Sequences with clear
chromatogram and longer than 200 bp were used for the analysis. Sequences of the
cloning vector were removed prior to assemble. Forward and reverse sequences were de
nevo assembled. The sequences were blasted against nucleotide database on GenBank –
fungal and other non-Labyrinthula sequences were excluded. Multiple alignment was
done by Clustal W implemented on Mega 6 (Tamura et al., 2013) with additional 18s
rDNA sequences of Labyrinthula spp. and Aplanochytrium spp. from GenBank (Table 2).

11
Table 2.2 Additional Labyrinthula and Aplanochytrium sequences obtained from
GenBank for phylogenetic analysis.
Species Accession number
Aplanochytrium spp. EU851174.1
EU851172.1
Aplanochytrium stocchinoi AJ519935.1
Labyrinthula spp. FR875359.2
FR875362.2
FR875356.2
FR875355.2
Labyrinthula zosterae FR875352.2
FR875335.2
JN121408.1
JN121407.1
JN121406.1
JN121405.1
JN121404.1
FR875309.1
FR875307.1
FR875306.1
AF265335.1
Phylogenetic analysis
The alignment file containing additional sequences was used. All sites were included. The
best fit evolutionary model of the data set was done by jModelTest 2.1.7 (Darriba et al.,
2012). Likelihood setting were: 203 substitution schemes (which calculates 1,624
models), include models with unequal base frequencies (+F), models with rate variation
among sites and number of categories (+G), models with a proportion invariable sites
(+I). Maximum likelihood optimized was set as a base tree, and using the best of Nearest
Neighbor Interchange (NNI) and Subtree Pruning and Regrafting (SPR) for tree search.
Best models calculated with the Akaike Information Criterion (AIC) and Bayesian
Information Criterion (BIC) were taken into consideration. RAxML version 8.1.2
(Stamatakis, 2014) was used to generate maximum likelihood phylogenetic tree
reconstruction with 100 bootstraps. Phylogenetic tree was then edited with FigTree
version 1.4.2 (Rambaut, 2014).

12
OTU calling
Sequences from the six clone libraries were pooled and grouped into operational
taxonomic units (OTUs) using UPARSE (Edgar, 2013) at a sequence similarity cutoff of
97%, that means, sequences that are less than 3% difference were grouped together into
one OTU. Consensus sequences of each OUT were aligned. Evolutionary model of this
data set was calculated by jModeltest. Phylogenetic tree were generated by PhyML
(Guindon et al., 2005) with HKY model and following parameters; transition/transversion
ratio 1.3778, gamma shape 0.595.
Species diversity and species prediction
Operational taxonomic units generated from UPARSE were used as an input file for
Species Prediction And Diversity Estimation (SPADE) program (Chao and Shen, 2010) to
calculate richness (Chao-1, bias-corrected Chao-1, ACE and ACE-1) and species prediction
with these parameters; multinomial model, 1,000 prediction size, and cut-off value = 5).
Sample-size-based rarefraction and extrapolation sampling curves, sample completeness
curve, and coverage-based rarefraction sampling curve were plotted using iNEXT
software (Hsieh et al., 2013) with endpoint setting 224 and 40 knots.

13
2.2 Extraction kit comparison
Plant samples
Z. marina leaf samples stored in silica gel from two locations were used (Table 3).
Samples from Waquoit Bay was affected by the wasting disease in the 1930s (Muehlstein
et al., 1988). Two commercially available kits were compared: Invisorb Spin Plant Mini Kit
and Invisorb Spin Tissue Mini Kit (Stratec Biomedical, Berlin, Germany). Three samples
from each location were divided into two parts - one for each extraction kit and were
homogenized by TissueLyser II (QIAGEN, Hilden, Germany) with frequency 1/30s for 8
minutes.
Table 2.3 Samples used for the DNA extraction kit comparison.
Location GPS Coordinates Collection date Number of samples
Chioggia, Italy N 45.2233 E 12.3130 May 2010 3 Waquoit Bay, USA N 41.5578 E -70.5168 May 2010 3
Extraction methods
The extractions were performed following manufacturers' instructions. For Invisorb Spin
Tissue Mini Kit, 10 µg of UltraPure Salmon sperm solution (Invitrogen, Life Technologies,
USA) was added to each sample to improve the binding efficiency of the DNA to the silica
membrane column, and additional purification step with OneStep™ PCR Inhibitor
Removal Kit (Zymo Research, USA) to remove inhibitors in the downstream process.
Total DNA was eluted with elution buffer in 50 µl for both extractions. DNA
concentration was measured by NanoDrop ND-1000 spectrophotometer.
PCR amplification
Extracted DNA was amplified with 10 mM of each Labyrinthula specific primer (Table),
DreamTaq PCR Master Mix (Life Technologies) that contains DreamTaq DNA Polymerase,
1X DreamTaq buffer, 2 mM MgCl2, and dNTPs in total of 10-µl reaction. PCR conditions
included 3 minutes’ initial denaturation at 95°C, followed by 25-30 cycles of 30 seconds
at 95°C, 30 seconds at 58°C, and 30 seconds at 72°C, and final elongation for 15 minutes
at 72°C. PCR products were checked by electrophoresis with 2% agarose gel. Bands of
expected size were cut off, purify with Nucleospin Gel and PCR Clean-up (Macherey-
Nagel, Düren, Germany), and were measured for the concentration of the products with
NanoDrop ND-1000 spectrophotometer.

14
Cloning
Cloning was performed as described above.
Restriction analysis
Plasmid preparation was performed relying on the principle of alkaline lyses using Zyppy
Plasmid Miniprep Kit (Zymo Research, USA). Plasmid was digested by FastDigest EcoRI
(Life Technologies, USA) for 15 minutes at 37°C and was fractionated by 1% agarose gel
electrophoresis.
Colony PCR
Colony PCR reaction mixture (10 µl) contains 10 µg of DNA, 1X of DreamTaq PCR Master
Mix and 5 pg of each M13 primers. Cycling conditions were initial denaturation at 95°C
for 1 minute followed by 35 cycles of 95°C 30 seconds, 50°C for 15 seconds and 72°C for
1 minute, and final extension at 72°C for 7 minutes. PCR amplification products were size
fractionated by 2% agarose gel electrophoresis. We selected eight corrected inserts to be
cleaned by Exonuclease I and alkaline phosphatase FastAP (Invitrogen, Life Technologies,
USA). Cycle sequencing was performed in 10-µl reaction containing 0.25µl BigDye v3.1,
BigDye buffer and 2.5 pmol of primer. Cycling conditions were 96°C for 1 minute, 25
cycles of 96°C for 1 minute, 50°C for 5 seconds and 60°C for 4 minutes. The products
were cleaned with EDTA/ethanol prior sequencing and were sequenced in forward
directions with automated DNA sequencer (Applied Biosystems, USA).
Bioinformatic analysis
Vector sequences were trimmed and the sequences were edited with SeqMan Pro
(DNAStar, Madison, USA). To remove the fungal and other non Labyrinthula sequences
were excluded, those sequences were blasted against GenBank database. Clustral W
implemented in Mega version 6 (Tamura et al., 2013) aligned the remaining sequences.
The sequences were defined into two groups by the extraction methods. DNAsp (Librado
and Rozas, 2009) was used to calculate number of haplotype. Haplotype network for
each data set was created and edited in Network (Polzin and Daneshmand, 2003). We
used UPARSE (Edgar, 2013) to group these sequences into operational taxonomic units
(OTUs).

15
Calculation of the extraction costs
The cost per extraction was calculated by dividing the cost by the number of extractions
that could be performed with the kit.

16
Chapter 3: Results
3.1 Diversity of Labyrinthula across the North Atlantic and the Baltic Sea
Primer testing
I designed two new primer pairs to detect Labyrinthula spp. and Phytophthora spp. 18S
rDNA sequences; Tom/Jerry to amplify Labyrinthula spp. and Phytophthora spp. and
Mickey/Minnie amplifying only Phytophthora spp. These degenerated primer pairs have
an expected product size around 250 base pairs. In silico test of their binding sites with
USEARCH showed that these primer pairs were perfectly bind to the target region. With
Silva 18S rDNA database, Tom and Jerry bind to Labyrinthula spp. and Phytophthora spp.
with 85.1 and 95.6% respectively. For those Labyrinthula and Phytophthora specific
primers, their coverages were 95.7% and 96.4% respectively (Table 3.1).
Table 3.1 Primers used in this study. *obtained from (Reusch, unpublished)
Primers Sequences (5'-3') Tm (°C)
Coverage (%) Amplicon size (bp) Labyrinthula Phytophthora
Tom GCGTATATTAAMGTTGTTGCAGTT 57 85.1 95.6 250
Jerry ATTATTCCATGCTARTGTATKCA
Fold* GCAGTTAAAAAGCTCGTAGTTGAA 58 95.7 - 290
Rold* AGAATTTCACCTCTGACATRCTC
Mickey CTTAACGAGGATCAATTGGAG
- 96.4
250 Minnie AACGCCTGCTTTAAACACTCT
However, when the primer pair Tom/Jerry was tested, I found that these primers also
amplified Zostera marina 18S rDNA instead of only Labyrinthula and Phytophthora, so
we decided not to use them. For further studies, we used primer pair obtained from
(Reusch, unpublished). These primers worked well, however, they are limited the genus
of Labyrinthula. The average sequence length produced by these primers was about 290
base pairs. Unfortunately, there was no Phytophthora spp. DNA that could be used as
positive control available, so we could not test primers Mickey/Minnie.
Phylogenetic analysis
Blasting the obtain sequences from Wackerballig revealed L. zosterae FR875335.2 with
77-100% identity, and Labyrinthula spp. AB220158.1, FR875356.2 and EU431330.1 with
85-94%, 84%, and 93% identity respectively. The sequences from Sandspollen matched
to L. zosterae FR875335.2 with 94-100% identity, and Labyrinthula spp. EU431330.1 with

17
94%. Samples from other four locations have only sequences that match to L. zosterae
FR875335.2.
Maximum likelihood phylogenetic tree of all sequences from six locations are shown in
figure 3.1. Additional sequences of Labyrinthula zosterae, Labyrinthula spp. and
Aplynochytrium spp. were included. The Labyrinthula were grouped into two clades; L.
zosterae (red) and Labyrinthula spp. (blue), with Aplynochytrium spp. appeared as the
outgroup. However, Labyrinthula spp. clade is ambiguous. The Labyrinthula spp. found in
this study divided into three clades.

18

19
Figure 3.1 Maximum likelihood phylogenetic tree with 100 bootstraps of all samples
from six locations. Aplynochytrium spp. were used as the outgroup. Operational
taxonomic units (OTUs)
Seven operational taxonomic units (OTUs) were generated from all the sequences.
OTU1, OTU2 and OTU7are best match to L. zosterae. OTU1 contains the 93 sequences
with 99 to 100% similarity within this group. OTU3 to OTU6 cluster close to Labyrinthula
spp. and are closely related (Table 3.2). OTU1 appeared as a sister group of Labyrinthula
spp. clade, while OTU2 and OTU7 are not fully resolved (Figure 3.2). The phylogenetic
tree looks similar to the tree in figure 2 except for position of OTU3 and OTU4, and OTU2
and OTU7. Regarding of the locations, samples from Wackerballig contain highest
number of OTUs, followed by samples from Sandspollen (Figure 3.3).
Table 3.2 OTU table.
Name Best blast hit Percent hit Number of sequence
OTU 1 L. zosterae FR875355.2 99 93
OTU 2 L. zosterae FR875355.2 99 1
OTU 3 Labyrinthula sp. AB220158.1 92 2
OTU 4 Labyrinthula sp. FR875356.2 84 1
OTU 5 Labyrinthula sp. EU431330 94 10
OTU 6 Labyrinthula sp. AB220158.1 84 4
OTU 7 L. zosterae FR875335.2 94 1

20
Figure 3.2 Maximum likelihood unrooted phylogenetic tree with 100 bootstraps of seven
OTUs.

21
Figure 3.3 Portion of OTUs of sequences from all locations. Six OTUs are found in
Wackerballig, 3 OTUs from Sandspollen and one OTU from Lemvig, Kungälv, Puck and
Rannakula. = OTU1, = OTU2, = OTU3, = OTU4, = OTU5, = OTU6 and =
OTU7.
Species prediction and richness
New species prediction for 1,000 samples ranged from 1.4±0.5 to 4.5±5.5. Species
richness ranged between 8.5±2.6 to 13.4±9.9 (Table 3.3). Estimated sample coverage for
our current dataset is 97.3% (Figure 3.4A, B). Rarefraction curves (Figure 3.4C) revealed
species richness estimates for a rarefied and extrapolated samples.

22
Table 3.3 Prediction of the number of new species in a further survey and estimation of
species richness of samples from these six locations.
Estimator/Model Estimate S.E. 95% Confidence interval
Species prediction
Boneh et al. (1998) 1.4 0.5 (0.4, 2.5)
Solow & Polasky (1999) 4.5 6.7 (0.0, 17.5)
Shen et al. (2003) 4.5 5.5 (0.0, 15.4)
Species richness
Chao1 (Chao, 1984) 11.5 7.2 (7.5, 47.9)
Chao1-bc 8.5 2.6 (7.1, 22.1)
ACE (Chao & Lee, 1992) 11.6 6.1 (7.6, 40.2)
ACE-1 (Chao & Lee, 1992) 13.4 9.9 (7.7, 63.2)

23
Figure 3.4 Coverage-based rarefaction and extrapolation sampling curve (A), sample
completeness curve (B) and sample-size-based rarefaction and extrapolation sampling
curve (C).
A B
C

24
3.2 DNA extraction kit comparison
Two DNA extraction kit we used for comparison have same principle ‒ incubation of
homogenized sample with proteinase K, followed by silica membrane binds DNA, and
contaminants pass through spin column. The lysis temperatures differ between kits:
65°C for 30 minutes for the Invisorb Spin Plant Mini Kit and 52°C up to overnight for the
Invisorb Spin Tissue Mini Kit. These kits share same chemicals used in most steps, however,
the Invisorb Spin Plant Mini Kit has an extra washing step prior elution of DNA. We used
OneStep PCR Inhibitor Removal Kit to eliminate contaminants such as polyphenolic compounds
from the Invisorb Spin Tissue Mini Kit extracts. Summary of these kits is shown in Table 3.5.
When performing PCR, we found that samples extracted with the Invisorb Spin Tissue Mini Kit
showed nonspecific amplification and smears.
There are no differences in sequences between these kits – most of them differ in one or two
nucleotides. This also confirmed by one OTU generated from pooled sequences.
Table 3.5 Summary of DNA extraction kits. * Without lysis time.
Kit Vendor Price per
reaction (€) Time
(minutes)
Invisorb Spin Plant Mini Kit Stratec 2.70 43
Invisorb Spin Tissue Mini Kit Stratec 2.50 14*
OneStep PCR Inhibitor Removal Kit Zymo Research 2.32 5

25
Chapter 4: Discussion
This is the first report of Labyrinthula diversity in eelgrass leaf sample from six locations
in the North Atlantic and the Baltic Sea. With DNA extracted directly from the samples,
we found higher diversity of Labyrinthula than previous studies that relied on culture-
based method. Labyrinthula was found in every location. Samples collected from
Wackerballig and Sandspollen exhibit higher diversity than others.
Difficulty culturing Labyrinthula spp. has been shown by numerous studies. Recently,
Chitrampalam et al. (2015) showed that only 30% of isolates were successfully maintain
in their study and those Labyrinthula spp. with small cell size are likely to disappear
during culturing. This problem with culturing has also been reported by Bockelmann et
al. (2012) and Garcias-Bonet et al. (2011) concluded that this difficulty is common in this
group. This present study bypassed the culturing method, thus, all available cells
presented in the samples were used.
Designate Labyrinthula zosterae partial 18S sequences in this study are mostly 100%
identical to those 18S full-length deposited in the GenBank. Sequences which have
highest blast hit to L. zosterae but their identities are less than 99% may be because of
the major problems in the sequencing, for example, PCR amplification bias, sequencing
errors, and chimeric sequences (Schloss et al., 2011).
In addition to those sequences which best match to L. zosterae, the remaining
sequences from Wackerballig and Sandspollen are best matched to Labyrinthula spp.
deposited on GenBank, however, their identities are quite low (84-94%). In addition, the
phylogenetic tree revealed that none of these Labyrinthula sequences found in this
study were placed within known sequences. This might suggest that sequences found in
this study are novel sequences and might correspond to new Labyrinthula spp.
There are three OTUs found in Sandspollen: OTU1, OTU5 and OTU7. Labyrinthula spp.
found in this location was different from previous study. Culturing method by
Bockelmann et al. (2012) found putatively two species (L. zosterae and Labyrinthula sp.
A) at this site, however, the OTU5 sequences found in this study are only 84% similar to
sequences of Labyrinthula species A. It can imply that this study found another
Labyrithula sp. that cannot be cultured or some samples had not used in other previous
studies. In addition, sampling period might cause effect of our study. Our study used
samples which came from various places and time. Abundance of L. zosterae is highest
during the summer but low in the winter and early spring (Bockelmann et al., 2013).
Hence, there may be a huge variation between samples. OTU5 also present in
Wackerballig. The consensus sequence of this OTU is 84-85% identity to Labyrinthula
species A and B (FR875355.2 and FR875362.2 respectively). This OTU, however, is 94%
match to Labyrinthula sp. EU431330.1 which mutualistic live with amoeba Thecamoeba
hilla isolated from fish Psetta maxima (Dyková et al., 2008).

26
OTU2 and OTU7 are 99% and 94% identity to known L. zosterae (FR875355.2) sequences
respectively (Table 3.2). These OTUs have only one sequence each. We could merge
these OTUs to OTU1 because they are similar to each other and also supported by
phylogenetic tree (Figure 3.2). UPARE uses consensus sequences of all amplicons cluster
to an individual OTU. These consensus sequences are the average of two or more
sequences (Hildebrand et al., 2014). It generally classifies sequences, which are less than
3% difference together. OTU designation in this present study used de novo clustering
method. In some cases, de novo and reference-based clustering methods may show
difference results. For well-known taxa, He et al. (2015) showed that de novo clustering
are unstable to some extent, but reference-based clustering generates more stable
OTUs, and vice versa for novel taxa. Furthermore, de novo clustering method gives
higher richness than reference-based (Hildebrand et al., 2014). Blaxter et al., (2005)
discussed that the common way to identify the best match in a reference database such
as BLAST is not good enough to identified barcoded samples and especially in not well-
studied organisms because its algorithm takes the highest scoring match with some
quality score cutoff.
In contrast to Bockelmann et al. (2012), this study found higher diversity of samples in
Wackerballig. There are six OTUs in this location: OTU1-OTU6 while the cultured-
dependent study found only L. zosterae (OTU1 in this study). Novel Labyrinthula
sequences OTU2, 3, 4 and 6 are exclusively found in this location. This suggests that
most of Labyrinthula spp. is uncultivable. Supported by the study of Bockelmann et al.
(2012) reported that the success of culturing samples from Sandspollen was lower than
other locations and the cultures disappeared after short period. They suggested that
Labyrinthula might exhibit higher diversity in the field. This study showed the potential
of molecular taxonomy compared to traditional taxonomies. Although, we revealed
some novel OTUs, the connection of OTUs with species may fail if two or more species
have genes that are more than 97% similar, causing the OTU contains many species
(Edgar, 2010).
Labyrinthula zosterae was found in every location in this study. It was found also in Puck,
Poland and Rannakula, Estonia where the salinity ranged between 5 to 10 psu. This
finding is in contrast to Bockelmann et al. (2012) that found no L. zosterae in sites of very
low salinity (Svartholm, Finland, 5 psu). Although the L. zosterae was found in these two
locations, no wasting disease has been reported (Krause-Jensen et al., 2004; Möller and
Martin, 2007). This phenomenon may explained that the pathogenic activities of
Labyrinthula is reduced in the water with salinities lower than 20-25 ppt, especially if it’s
lower than 10 psu (Muehlstein et al., 1988; Ralph and Short, 2002). McKone and Tanner
(2009) also showed that the lesion areas affected by L. zosterae are reduced in the
seagrass at salinity lower than 15 psu. Effect of salinity on Labyrinthula diversity was
reported by L. K. Muehlstein et al. (1988). With culturing method, they found two
Labyrinthula spp. from eelgrass: the species P and S, which are pathogenic and non-
pathogenic respectively. The Labyrinthula species P found in every location, which has

27
the salinity higher than 10 psu, while the species S, can be found from 5 psu on. Anyhow,
this present study could not detect any species besides L. zosterae from the sites where
the salinity is about 5 psu. In addition, the pathogenicity of L. zosterae is not only
controlled by salinity, high temperature or low light availability which make seagrass
under stress condition can also cause the disease (Brakel et al., 2014; Vergeer et al.,
1995).
Compare to previously study of Bockelmann et al. (2012), this present report reveal
higher diversity of Labyrinthula. Even though, two up to five new species of Labyrinthula
could be found for the next thousand samples as suggested by species estimators. With
this, one popular species estimator was made by Solow and Polasky (1999). This
estimation of species richness works well if the further sampling size is similar to the
previous sampling because it assumes that all unobserved species in the initial sample
have equal relative abundances but it gives negative bias when apply to a larger
sampling size (Shen et al., 2003).
Species richness calculated from our current dataset revealed similar values. In
combination between species prediction and species richness, Chao1 and ACE indices
give the best estimations. Chao1 is mainly based on species that has only one individual
(singleton). The greater the singleton, the higher the estimate (Colwell and Coddington,
1994). The corrected estimate of Chao1 is close to the number of OTUs found in this
current study. Confidence interval of 95% of new species is predicted to fall within range
7.1-63.2 by these estimates. Both Chao1 and ACE may underestimate the true diversity if
the sample size is low (Colwell and Coddington, 1994; Hughes et al., 2001).
With novel sequences and OTUs, supported by phylogenetic trees, our study revealed
higher diversity of Labyrinthula spp. than other previously studies. However, according
to the accumulation curve (Figure 3.4), about 97% of total diversity was already found in
our sampling size. Furthermore, it implies that the diversity is still dependent of the
sample size. Thus, more samples are needed to reveal higher diversity.
Due to specific characteristics such as its ubiquity, size, and low evolutionary rate, the
small subunit ribosomal RNA (SSU rRNA) has widely used in molecular evolution (Van de
Peer and De Wachter, 1997). Besides rRNA genes, numerous lines of evidence now
suggest that variation in the faster-evolving ITS regions provide a better marker for
speciation in many groups (Stoeck et al., 2010), while Bachy et al. (2013) found both 18S
rDNA and ITS were efficient in detecting some groups of protists species and gave similar
phylogenetic structures of the protist community at the species level.
The primers newly designed for this study based on the conserved regions of both
Labyrinthula spp. and Phytophthora spp. and contain one and two degenerate sites for
forward and reverse primer, however, non-specific and low sensitivity of amplification
happened. Losing of primers’ specificity can happen when the primers contain high

28
degeneracy, predominantly if amplify sequence of closely related species (Linhart and
Shamir, 2002).
DNA extraction comparisons
The second aim of this study was to compare extraction of DNA extracted directly from
dried Z. marina leaf. Using Invisorb Spin Tissue Mini Kit alone without purification step
resulted in brownish solution and inhibits PCR. Remaining polyphenolic compounds and
polysaccharides mainly causes this brown color. Their oxidized form covalently binds to
DNA giving brown color making PCR not amplifiable (Dhanya et al., 2007). Generally,
molecular enzymes, such as, DNA ligase and DNA polymerases are inhibited by
polysaccharides and other secondary metabolites (Maropola et al., 2015).
PCR amplification of DNA extracted from Invisorb Spin Tissue Mini Kit resulted in
smeared products. Thus, reduction of cycle by ten and shorter annealing time are
required for the PCR amplification. This smear might due to excess DNA used which
caused non-specific amplification or due to incorrect competitive binding (mispriming)
(Cousins et al., 1992; Mamedov et al., 2008). However, we did not try the extraction
method without addition of salmon sperm DNA to check whether this smear happened
due to additional foreign DNA. Besides this, the results of the two DNA extraction kits
were similar, however, the Invisorb Spin Plant Mini Kit outcompete another kit in these
following ways: shorter lysis time, no extra purification steps and cost per extraction is
cheaper than another kit.
According to manufacturer’s protocol, the Invisorb Spin Tissue Mini kit calls for the use
of tissue sample, rodent tail, biopsy material, insects, paraffin embedded tissues or
eukaryotic cell swab. It is widely used for animal tissue DNA extraction (Broll et al., 2007;
Goebbels et al., 2010), moreover, it also used to isolate microbial DNA from culture
plates (Lau et al., 2005) but never found in other plant studies.
Furthermore, DNA isolation from dried specimens usually requires some modifications
to frequently used protocols (Rogers, 1994). This is due to small amount of sample
available. (Maropola et al., 2015) compared classical DNA extraction methods with
commercial kits on sorghum. They found that the classical protocols (CTAB and SDS)
revealed high DNA yields from sorghum tissues but were less reproducible than the
commercial kits. The commercial kits had higher quality of DNA, but with lower
endophytic bacterial diversities compared to classical protocols. Although, classical
protocols such as CTAB method may give a better result, it would be difficult to extract
DNA from a number of samples. Besides conventional PCR, the high-fidelity PCR was
reported up to six times more efficient than conventional PCR in detecting pathogens
from freshly inoculated plants, demonstrating its increased sensitivity in early detection
of fungal and bacterial pathogens that are difficult to identify in disease development
(Cating et al., 2012). I recommend comparing between conventional and high fidelity
PCR to detect Labyrinthula in eelgrass samples for future study.

29
Conclusion
This study reported successful in using partial sequence of 18S rDNA to explore diversity
of Labyrinthula spp. in eelgrass leaves samples collected across the Baltic and Northern
Atlantic Ocean. This current study provides the first insight of Labyrinthula molecular
diversity from the leaf samples. For better understanding the diversity, more samples
should be used. Medinger et al. (2010) showed that Next generation amplicon
sequencing based on rDNA was superior in detecting rare protist species. This advantage
is due to the large amount of sequence reads provide a unique opportunity to resolve
the gap between morphological and molecular studies. However, it is necessary to take
into account three potential sources of error which may artificially inflate the apparent
levels of diversity detected: the combined effects of nucleotide mis-incorporation and
read errors during PCR and sequencing, PCR chimaera formation, and intragenomic
polymorphism among multiple copies of the rRNA within a single nucleus (Stoeck et al.,
2010).

30
Chapter 5: References
Akkurt, M., 2012. Comparison between modified DNA extraction protocols and commercial isolation kits in grapevine (Vitis vinifera L.). Genet. Mol. Res. 11, 2343–2351.
Aljanabi, S., 1997. Universal and rapid salt-extraction of high quality genomic DNA for PCR- based techniques. Nucleic Acids Res. 25, 4692–4693. doi:10.1093/nar/25.22.4692
Armiger, L.C., 1964. An occurrence of Labyrinthula in New Zealand Zostera. New Zeal. J. Bot. 2, 3–9. doi:10.1080/0028825X.1964.10428713
Bergmann, N., Fricke, B., Schmidt, M.C., Tams, V., Beining, K., Schwitte, H., Boettcher, A.A., Martin, D.L., Bockelmann, A.-C., Reusch, T.B.H., Rauch, G., 2011. A quantitative real-time polymerase chain reaction assay for the seagrass pathogen Labyrinthula zosterae. Mol. Ecol. Resour. 11, 1076–81. doi:10.1111/j.1755-0998.2011.03051.x
Bigelow, D.M., Olsen, M.W., Gilbertson, R.L., 2005. Labyrinthula terrestris sp. nov., a new pathogen of turf grass. Mycologia 97, 185–190. doi:10.3852/mycologia.97.1.185
Blakesley, B., Hall, P., Berns, D., 2001. Survey of the Distribution of the Marine Slime Mold Labyrinthula Sp. in the Seagrass Thalassia Testudinun in the Tampa Bay Area, Fall 1999-Fall 200: Final Report. Florida Fish and Wildlife Commission.
Blaxter, M., Mann, J., Chapman, T., Thomas, F., Whitton, C., Floyd, R., Abebe, E., 2005. Defining operational taxonomic units using DNA barcode data. Philos. Trans. R. Soc. Lond. B. Biol. Sci. 360, 1935–43. doi:10.1098/rstb.2005.1725
Blois, J.C., Francaz, J.M., Gaudichon, M., Gaudichon, S., Le Bris, L., 1961. Observations sur les herbiers à Zostères de la région de Roscoff. Cah. Biol. Mar. 2, 223–262.
Bockelmann, A.-C., Beining, K., Reusch, T.B.H., 2012. Widespread occurrence of endophytic Labyrinthula spp. in northern European eelgrass Zostera marina beds. Mar. Ecol. Prog. Ser. 445, 109–116.
Bockelmann, A.-C., Tams, V., Ploog, J., Schubert, P.R., Reusch, T.B.H., 2013. Quantitative PCR reveals strong spatial and temporal variation of the wasting disease pathogen, Labyrinthula zosterae in northern European eelgrass (Zostera marina) beds. PLoS One 8, e62169. doi:10.1371/journal.pone.0062169
Boudon-Padieu, E., Béjat, A., Clair, D., Larrue, J., Borgo, M., Bertotto, L., Angelini, E., 2015. Grapevine yellows: Comparison of different procedures for DNA extraction and amplification with PCR for routine diagnosis of phytoplasmas in grapevine. VITIS - J. Grapevine Res.

31
Brakel, J., Werner, F.J., Tams, V., Reusch, T.B.H., Bockelmann, A.-C., 2014. Current European Labyrinthula zosterae are not virulent and modulate seagrass (Zostera marina) defense gene expression. PLoS One 9, e92448. doi:10.1371/journal.pone.0092448
Broll, H., Butschke, A., Zagon, J., 2007. Rapid identification of plant and animal species in foods. Rapid Methods Food Feed Qual. Determ. 10, 49.
Caron, D.A., Countway, P.D., Jones, A.C., Kim, D.Y., Schnetzer, A., 2012. Marine protistan diversity. Ann. Rev. Mar. Sci. 4, 467–93. doi:10.1146/annurev-marine-120709-142802
Cating, R.A., Hoy, M.A., Palmateer, A.J., 2012. A Comparison of Standard and High-Fidelity PCR: Evaluating Quantification and Detection of Pathogen DNA in the Presence of Orchid Host Tissue. Plant Dis. 96, 480–485. doi:10.1094/PDIS-08-11-0705
Cavalier-Smith, T., Allsopp, M.T.E.P., Chao, E.E., 1994. Thraustochytrids are Chromists, not Fungi: 18s rRNA Signatures of Heterokonta. Philos. Trans. R. Soc. B Biol. Sci. 346, 387–397. doi:10.1098/rstb.1994.0156
Chao, A., Shen, T.J., 2010. Program SPADE (species prediction and diversity estimation). Progr. User’s Guid. Publ. http//chao. stat. nthu. edu. tw.
Chitrampalam, P., Goldberg, N., Olsen, M.W., 2015. Labyrinthula species associated with turfgrasses in Arizona and New Mexico. Eur. J. Plant Pathol. doi:10.1007/s10658-015-0701-0
Cienkowski, L., 1867. Über den Bau und die Entwicklung der Labyrinthuleen. Schultzes Arch. Mikroskop. Anat. 3, 274–310.
Colwell, R.K., Coddington, J.A., 1994. Estimating terrestrial biodiversity through extrapolation. Philos. Trans. R. Soc. B Biol. Sci. 345, 101–118.
Countway, P.D., Gast, R.J., Savai, P., Caron, D.A., 2005. Protistan diversity estimates based on 18S rDNA from seawater incubations in the Western North Atlantic. J. Eukaryot. Microbiol. 52, 95–106. doi:10.1111/j.1550-7408.2005.05202006.x
Cousins, D. V, Wilton, S.D., Francis, B.R., Gow, B.L., 1992. Use of polymerase chain reaction for rapid diagnosis of tuberculosis. J. Clin. Microbiol. 30, 255–258.
Dale, A.L., McAllen, R., Whelan, P., 2007. Management considerations for subtidal Zostera marina beds in Ireland.

32
Darriba, D., Taboada, G.L., Doallo, R., Posada, D., 2012. jModelTest 2: more models, new heuristics and parallel computing. Nat. Methods 9, 772. doi:10.1038/nmeth.2109
Demeke, T., Jenkins, G.R., 2010. Influence of DNA extraction methods, PCR inhibitors and quantification methods on real-time PCR assay of biotechnology-derived traits. Anal. Bioanal. Chem. 396, 1977–90. doi:10.1007/s00216-009-3150-9
Den Hartog, C., 1971. The dynamic aspect in the ecology of seagrass communities. Thalass. jugoslavica 7, 101–1127.
Den Hartog, C., 1987. “Wasting disease” and other dynamic phenomena in Zostera beds. Aquat. Bot. 27, 3–14. doi:10.1016/0304-3770(87)90082-9
Dhanya, K., Kizhakkayil, J., Syamkumar, S., Sasikumar, B., 2007. Isolation and Amplification of Genomic DNA from Recalcitrant Dried Berries of Black Pepper (Piper nigrum L.)—A Medicinal Spice. Mol. Biotechnol. 37, 165–168. doi:10.1007/s12033-007-0044-y
Duarte, C.M., Marbà, N., Gacia, E., Fourqurean, J.W., Beggins, J., Barrón, C., Apostolaki, E.T., 2010. Seagrass community metabolism: Assessing the carbon sink capacity of seagrass meadows. Global Biogeochem. Cycles 24, n/a–n/a. doi:10.1029/2010GB003793
Durako, M.J., Kuss, K.M., 1994. Effects of Labyrinthula Infection on the Photosynthetic Capacity of Thalassia Testudinum. Bull. Mar. Sci. 54, 727–732.
Dyková, I., Fiala, I., Dvoráková, H., Pecková, H., 2008. Living together: the marine amoeba Thecamoeba hilla Schaeffer, 1926 and its endosymbiont Labyrinthula sp. Eur. J. Protistol. 44, 308–16. doi:10.1016/j.ejop.2008.04.001
Edgar, R.C., 2010. Search and clustering orders of magnitude faster than BLAST. Bioinformatics 26, 2460–1. doi:10.1093/bioinformatics/btq461
Edgar, R.C., 2013. UPARSE: highly accurate OTU sequences from microbial amplicon reads. Nat. Methods 10, 996–8. doi:10.1038/nmeth.2604
Entwistle, C.A., Olsen, M.W., Bigelow, D.M., 2006. First report of a Labyrinthula spp. causing rapid blight of Agrostis capillaris and Poa annua on amenity turfgrass in the UK. Plant Pathol. 55, 306–306. doi:10.1111/j.1365-3059.2005.01271.x
Fourqurean, J.W., Duarte, C.M., Kennedy, H., Marbà, N., Holmer, M., Mateo, M.A., Apostolaki, E.T., Kendrick, G.A., Krause-Jensen, D., McGlathery, K.J., Serrano, O., 2012. Seagrass ecosystems as a globally significant carbon stock. Nat. Geosci. 5, 505–509. doi:10.1038/ngeo1477
33
Fredricks, D.N., Smith, C., Meier, A., 2005. Comparison of six DNA extraction methods for recovery of fungal DNA as assessed by quantitative PCR. J. Clin. Microbiol. 43, 5122–8. doi:10.1128/JCM.43.10.5122-5128.2005
Galand, P.E., Casamayor, E.O., Kirchman, D.L., Lovejoy, C., 2009. Ecology of the rare microbial biosphere of the Arctic Ocean. Proc. Natl. Acad. Sci. U. S. A. 106, 22427–32. doi:10.1073/pnas.0908284106
Garcias-Bonet, N., Sherman, T.D., Duarte, C.M., Marbà, N., 2011. Distribution and Pathogenicity of the Protist Labyrinthula sp. in western Mediterranean Seagrass Meadows. Estuaries and Coasts 34, 1161–1168. doi:10.1007/s12237-011-9416-4
Godet, L., Fournier, J., van Katwijk, M.M., Olivier, F., Le Mao, P., Retière, C., 2008. Before and after wasting disease in common eelgrass Zostera marina along the French Atlantic coasts: a general overview and first accurate mapping. Dis. Aquat. Organ. 79, 249–55. doi:10.3354/dao01897
Goebbels, S., Oltrogge, J.H., Kemper, R., Heilmann, I., Bormuth, I., Wolfer, S., Wichert, S.P., Möbius, W., Liu, X., Lappe-Siefke, C., 2010. Elevated phosphatidylinositol 3, 4, 5-trisphosphate in glia triggers cell-autonomous membrane wrapping and myelination. J. Neurosci. 30, 8953–8964.
Guindon, S., Lethiec, F., Duroux, P., Gascuel, O., 2005. PHYML Online--a web server for fast maximum likelihood-based phylogenetic inference. Nucleic Acids Res. 33, W557–9. doi:10.1093/nar/gki352
He, Y., Caporaso, J.G., Jiang, X.-T., Sheng, H.-F., Huse, S.M., Rideout, J.R., Edgar, R.C., Kopylova, E., Walters, W.A., Knight, R., 2015. Stability of operational taxonomic units: an important but neglected property for analyzing microbial diversity. Microbiome 3, 20.
Hemminga, M.A., Duarte, C.M., 2000. Seagrass ecology. Cambridge University Press.
Hildebrand, F., Tadeo, R., Voigt, A.Y., Bork, P., Raes, J., 2014. LotuS: an efficient and user-friendly OTU processing pipeline. Microbiome 2, 30.
Hsieh, T.C., Ma, K.H., Chao, A., 2013. iNEXT online: interpolation and extrapolation (Version 1.0)[Software].
Hughes, J.B., Hellmann, J.J., Ricketts, T.H., Bohannan, B.J., 2001. Counting the uncountable: statistical approaches to estimating microbial diversity. Appl. Environ. Microbiol. 67, 4399–406.

34
Jacobs, R.P.W.M., 1979. Distribution and aspects of the production and biomass of eelgrass, Zostera marina L., at Roscoff, France. Aquat. Bot. 7, 151–172. doi:10.1016/0304-3770(79)90019-6
Klindworth, A., Pruesse, E., Schweer, T., Peplies, J., Quast, C., Horn, M., Glöckner, F.O., 2013. Evaluation of general 16S ribosomal RNA gene PCR primers for classical and next-generation sequencing-based diversity studies. Nucleic Acids Res. 41, e1. doi:10.1093/nar/gks808
Krause-Jensen, D., Diaz Almela, E., Cunha, A.H., Greve, T.M., 2004. Have seagrass distribution and abundance changed. Eur. seagrasses an Introd. to Monit. Manag. 1.
Larkum, A., Orth, R.J., Duarte, C. (Eds.), 2007. Seagrasses: Biology, Ecology and Conservation. Springer Science & Business Media.
Lau, K.W.K., Ng, C.Y.M., Ren, J., Lau, S.C.L., Qian, P.-Y., Wong, P.-K., Lau, T.C., Wu, M., 2005. Owenweeksia hongkongensis gen. nov., sp. nov., a novel marine bacterium of the phylum “Bacteroidetes”. Int. J. Syst. Evol. Microbiol. 55, 1051–7. doi:10.1099/ijs.0.63155-0
Leander, C.A., Porter, D., 2001. The Labyrinthulomycota Is Comprised of Three Distinct Lineages. Mycologia 93, 459–464. doi:10.2307/3761732
Li, Y., Cooke, D.E.L., Jacobsen, E., van der Lee, T., 2013. Efficient multiplex simple sequence repeat genotyping of the oomycete plant pathogen Phytophthora infestans. J. Microbiol. Methods 92, 316–22. doi:10.1016/j.mimet.2012.11.021
Librado, P., Rozas, J., 2009. DnaSP v5: a software for comprehensive analysis of DNA polymorphism data. Bioinformatics 25, 1451–2. doi:10.1093/bioinformatics/btp187
Linhart, C., Shamir, R., 2002. The degenerate primer design problem. Bioinformatics 18, S172–S181. doi:10.1093/bioinformatics/18.suppl_1.S172
Lucas, C., Thangaradjou, T., Papenbrock, J., 2012. Development of a DNA Barcoding System for Seagrasses: Successful but Not Simple. PLoS One 7, e29987. doi:10.1371/journal.pone.0029987
Maar, M., Møller, E.F., Larsen, J., Madsen, K.S., Wan, Z., She, J., Jonasson, L., Neumann, T., 2011. Ecosystem modelling across a salinity gradient from the North Sea to the Baltic Sea. Ecol. Modell. 222, 1696–1711. doi:10.1016/j.ecolmodel.2011.03.006
Mamedov, T.G., Pienaar, E., Whitney, S.E., TerMaat, J.R., Carvill, G., Goliath, R., Subramanian, A., Viljoen, H.J., 2008. A fundamental study of the PCR amplification of GC-rich DNA templates. Comput. Biol. Chem. 32, 452–7. doi:10.1016/j.compbiolchem.2008.07.021

35
Manen, J.-F., Sinitsyna, O., Aeschbach, L., Markov, A. V, Sinitsyn, A., 2005. A fully automatable enzymatic method for DNA extraction from plant tissues. BMC Plant Biol. 5, 23. doi:10.1186/1471-2229-5-23
Maropola, M.K.A., Ramond, J.-B., Trindade, M., 2015. Impact of metagenomic DNA extraction procedures on the identifiable endophytic bacterial diversity in Sorghum bicolor (L. Moench). J. Microbiol. Methods 112, 104–17. doi:10.1016/j.mimet.2015.03.012
May, R.M., 1988. How many species are there on earth?. Science(Washington) 241, 1441–1449.
McKone, K.L., Tanner, C.E., 2009. Role of salinity in the susceptibility of eelgrass Zostera marina to the wasting disease pathogen Labyrinthula zosterae. Mar. Ecol. Prog. Ser. 377, 123–130.
Medinger, R., Nolte, V., Pandey, R.V., Jost, S., Ottenwälder, B., Schlötterer, C., Boenigk, J., 2010. Diversity in a hidden world: potential and limitation of next-generation sequencing for surveys of molecular diversity of eukaryotic microorganisms. Mol. Ecol. 19 Suppl 1, 32–40. doi:10.1111/j.1365-294X.2009.04478.x
Möller, T., Martin, G., 2007. Distribution of the eelgrass Zostera marina L. in the coastal waters of Estonia, NE Baltic Sea. Proc. Est. Acad. Sci. 56, 270–277.
Muehlstein, L.K., 1992. The host – pathogen interaction in the wasting disease of eelgrass, Zostera marina. Can. J. Bot. 70, 2081–2088. doi:10.1139/b92-258
Muehlstein, L.K., Porter, D., Short, F.T., 1988. Labyrinthula sp., a marine slime mold producing the symptoms of wasting disease in eelgrass, Zostera marina. Mar. Biol. 99, 465–472. doi:10.1007/BF00392553
Muehlstein, L.K., Porter, D., Short, F.T., 1991. Labyrinthula zosterae sp. nov., the Causative Agent of Wasting Disease of Eelgrass, Zostera marina.
Nakamura, Y., Imai, I., Yamaguchi, A., Tuji, A., Not, F., Suzuki, N., 2015. Molecular Phylogeny of the Widely Distributed Marine Protists, Phaeodaria (Rhizaria, Cercozoa). Protist 166, 363–373. doi:10.1016/j.protis.2015.05.004
Olsen, M.W., 2007. Labyrinthula terrestris: a new pathogen of cool-season turfgrasses. Mol. Plant Pathol. 8, 817–20. doi:10.1111/j.1364-3703.2007.00425.x
Orth, R.J., Carruthers, T.J.B., Dennison, W.C., Duarte, C.M., Fourqurean, J.W., Heck, K.L., Hughes, A.R., Kendrick, G.A., Kenworthy, W.J., Olyarnik, S., Short, F.T., Waycott, Mi., Williams, S.L., 2006. A Global Crisis for Seagrass Ecosystems. Bioscience 56, 987–996. doi:10.1641/0006-3568(2006)56[987:AGCFSE]2.0.CO;2

36
Pace, N.R., 1997. A Molecular View of Microbial Diversity and the Biosphere. Science (80-. ). 276, 734–740. doi:10.1126/science.276.5313.734
Pandey, R.N., Adams, R.P., Flournoy, L.E., 1996. Inhibition of random amplified polymorphic DNAs (RAPDs) by plant polysaccharides. Plant Mol. Biol. Report. 14, 17–22. doi:10.1007/BF02671898
Pedrós-Alió, C., 2006. Marine microbial diversity: can it be determined? Trends Microbiol. 14, 257–63. doi:10.1016/j.tim.2006.04.007
Perkins, F.O., 1972a. The ultrastructure of holdfasts, ?rhizoids?, and ?slime tracks? in thraustochytriaceous fungi and Labyrinthula spp. Arch. f�r Mikrobiol. 84, 95–118. doi:10.1007/BF00412431
Perkins, F.O., 1972b. Observations of thraustochytriaceous (Phycomycetes) and labyrinthulid (Rhizopodea) ectoplasmic nets on natural and artificial substrates—an electron microscope study. Can. J. Bot. 51, 485–491.
Polzin, T., Daneshmand, S.V., 2003. On Steiner trees and minimum spanning trees in hypergraphs. Oper. Res. Lett. 31, 12–20. doi:10.1016/S0167-6377(02)00185-2
Porter, D., 1972. Cell division in the marine slime mold,Labyrinthula sp., and the role of the bothrosome in extracellular membrane production. Protoplasma 74, 427–448. doi:10.1007/BF01281960
Porter, D., Kochert, G., 1978. Ribosomal RNA molecular weights and the phylogeny of Labyrinthula. Exp. Mycol. 2, 346–351. doi:10.1016/S0147-5975(78)80005-X
Procaccini, G., Olsen, J.L., Reusch, T.B.H., 2007. Contribution of genetics and genomics to seagrass biology and conservation. J. Exp. Mar. Bio. Ecol. 350, 234–259. doi:10.1016/j.jembe.2007.05.035
Quast, C., Pruesse, E., Yilmaz, P., Gerken, J., Schweer, T., Yarza, P., Peplies, J., Glöckner, F.O., 2013. The SILVA ribosomal RNA gene database project: improved data processing and web-based tools. Nucleic Acids Res. 41, D590–6. doi:10.1093/nar/gks1219
Queipo-Ortuño, M.I., Tena, F., Colmenero, J.D., Morata, P., 2008. Comparison of seven commercial DNA extraction kits for the recovery of Brucella DNA from spiked human serum samples using real-time PCR. Eur. J. Clin. Microbiol. Infect. Dis. 27, 109–14. doi:10.1007/s10096-007-0409-y
Ralph, P.J., Short, F.T., 2002. Impact of the wasting disease pathogen, Labyrinthula zosterae, on the photobiology of eelgrass Zostera marina. Mar. Ecol. Prog. Ser. 226, e271.

37
Rambaut, A., 2014. FigTree: tree figure drawing tool, version 1.4. 0.
Rasmussen, E., 1977. The wasting disease of eelgrass (Zostera marina) and its effects on environmental factors and fauna. Seagrass Ecosyst. Sci. Perspect. 1–15.
Reusch, T.B.H., n.d. Labyrinthula primers.
Robblee, M.B., Barber, T.R., Carlson Jr, P.R., Durako, M.J., Fourqurean, J.W., Muehlstein, L.K., Porter, D., Yarbro, L.A., Zieman, R.T., Zieman, J.C., 1991. Mass mortality of the tropical seagrass Thalassia testudinum in Florida Bay(USA). Mar. Ecol. Prog. Ser. Oldend. 71, 297–299.
Rogers, S.O., 1994. Phylogenetic and taxonomic information from herbarium and mummified DNA. Conserv. Plant Genes II Util. Anc. Mod. DNA 47–67.
Schubert, P.R., Hukriede, W., Karez, R., Reusch, T.B.H., 2015. Mapping and modeling eelgrass Zostera marina distribution in the western Baltic Sea. Mar. Ecol. Prog. Ser. 522, 79–95.
Shen, T.-J., Chao, A., Lin, C.-F., 2003. PREDICTING THE NUMBER OF NEW SPECIES IN FURTHER TAXONOMIC SAMPLING. Ecology 84, 798–804. doi:10.1890/0012-9658(2003)084[0798:PTNONS]2.0.CO;2
Short, F.T., Polidoro, B., Livingstone, S.R., Carpenter, K.E., Bandeira, S., Bujang, J.S., Calumpong, H.P., Carruthers, T.J.B., Coles, R.G., Dennison, W.C., Erftemeijer, P.L.A., Fortes, M.D., Freeman, A.S., Jagtap, T.G., Kamal, A.H.M., Kendrick, G.A., Judson Kenworthy, W., La Nafie, Y.A., Nasution, I.M., Orth, R.J., Prathep, A., Sanciangco, J.C., Tussenbroek, B. van, Vergara, S.G., Waycott, M., Zieman, J.C., 2011. Extinction risk assessment of the world’s seagrass species. Biol. Conserv. 144, 1961–1971. doi:10.1016/j.biocon.2011.04.010
Short, F.T., Short, C.A., 2003. The seagrasses of the western North Atlantic. World Atlas Seagrasses. Univ. Calif. Press. Berkeley, Calif. 207–215.
Sogin, M.L., Morrison, H.G., Huber, J.A., Mark Welch, D., Huse, S.M., Neal, P.R., Arrieta, J.M., Herndl, G.J., 2006. Microbial diversity in the deep sea and the underexplored “rare biosphere”. Proc. Natl. Acad. Sci. U. S. A. 103, 12115–20. doi:10.1073/pnas.0605127103
Solow, A.R., Polasky, S., 1999. A QUICK ESTIMATOR FOR TAXONOMIC SURVEYS. Ecology 80, 2799–2803. doi:10.1890/0012-9658(1999)080[2799:AQEFTS]2.0.CO;2
Stamatakis, A., 2014. RAxML version 8: a tool for phylogenetic analysis and post-analysis of large phylogenies. Bioinformatics 30, 1312–3. doi:10.1093/bioinformatics/btu033

38
Stoeck, T., Bass, D., Nebel, M., Christen, R., Jones, M.D.M., Breiner, H.-W., Richards, T.A., 2010. Multiple marker parallel tag environmental DNA sequencing reveals a highly complex eukaryotic community in marine anoxic water. Mol. Ecol. 19 Suppl 1, 21–31. doi:10.1111/j.1365-294X.2009.04480.x
Tamura, K., Stecher, G., Peterson, D., Filipski, A., Kumar, S., 2013. MEGA6: Molecular Evolutionary Genetics Analysis version 6.0. Mol. Biol. Evol. 30, 2725–9. doi:10.1093/molbev/mst197
Tsui, C.K.M., Marshall, W., Yokoyama, R., Honda, D., Lippmeier, J.C., Craven, K.D., Peterson, P.D., Berbee, M.L., 2009. Labyrinthulomycetes phylogeny and its implications for the evolutionary loss of chloroplasts and gain of ectoplasmic gliding. Mol. Phylogenet. Evol. 50, 129–40. doi:10.1016/j.ympev.2008.09.027
Unsworth, R.K.F., Len, P.S. De, Garrard, S.L., Jompa, J., Smith, D.J., Bell, J.J., 2008. High connectivity of Indo-Pacific seagrass fish assemblages with mangrove and coral reef habitats. Mar. Ecol. Prog. Ser. 353, 213–224. doi:10.3354/meps07199
Van de Peer, Y., De Wachter, R., 1997. Evolutionary Relationships Among the Eukaryotic Crown Taxa Taking into Account Site-to-Site Rate Variation in 18S rRNA. J. Mol. Evol. 45, 619–630. doi:10.1007/PL00006266
Van Katwijk, M.M., Hermus, D.C.R., de Jong, D.J., Asmus, R.M., de Jonge, V.N., 2000. Habitat suitability of the Wadden Sea for restoration of Zostera marina beds. Helgol. Mar. Res. 54, 117–128. doi:10.1007/s101520050010
Vergeer, L.H.T., Aarts, T.L., de Groot, J.D., 1995. The “wasting disease” and the effect of abiotic factors (light intensity, temperature, salinity) and infection with Labyrinthula zosterae on the phenolic content of Zostera marina shoots. Aquat. Bot. 52, 35–44. doi:10.1016/0304-3770(95)00480-N
Waycott, M., Duarte, C.M., Carruthers, T.J.B., Orth, R.J., Dennison, W.C., Olyarnik, S., Calladine, A., Fourqurean, J.W., Heck, K.L., Hughes, A.R., Kendrick, G.A., Kenworthy, W.J., Short, F.T., Williams, S.L., 2009. Accelerating loss of seagrasses across the globe threatens coastal ecosystems. Proc. Natl. Acad. Sci. 106, 12377–12381. doi:10.1073/pnas.0905620106
Waycott, M., Freshwater, D.W., York, R.A., Calladine, A., Kenworthy, W.J., 2002. Evolutionary trends in the seagrass genus Halophila (Thouars): Insights from molecular phylogeny. Bull. Mar. Sci. 71, 1299–1308.
Woese, C.R., 1996. Phylogenetic trees: Whither microbiology? Curr. Biol. 6, 1060–1063. doi:10.1016/S0960-9822(02)70664-7

39
Xin, Z., Chen, J., 2012. A high throughput DNA extraction method with high yield and quality. Plant Methods 8, 26. doi:10.1186/1746-4811-8-26
Young, E.L., 1943. Studies on Labyrinthula. The Etiologic Agent of the Wasting Disease of Eel-Grass. Am. J. Bot. 30, 586–593. doi:10.2307/2437469
Yuasa, T., Takahashi, O., Dolven, J.K., Mayama, S., Matsuoka, A., Honda, D., Bjørklund, K.R., 2006. Phylogenetic position of the small solitary phaeodarians (Radiolaria) based on 18S rDNA sequences by single cell PCR analysis. Mar. Micropaleontol. 59, 104–114. doi:10.1016/j.marmicro.2006.01.003

40
Acknowledgements
I would like to thank Professor Thorsten Reusch and Janina Brakel at Helmholz Center for
Ocean Research Kiel (GEOMAR) and Professor Herwig Stibor at Ludwig-Maximilians-
Universität München for grateful advice during my work. Also thanks to Anna-Christina
Bockelmann for providing me seagrass leaf samples; Diana Gill and Katrin Beining for
giving technical and scientific advice. I finally thank the Development and Promotion of
Science and Technology Talents Project (DPST) for the good opportunity for my Master
study.

41
Erklärung zur Bachelorarbeit/Masterarbeit
Hiermit versichere ich, dass die vorliegende Arbeit von mir selbstständig verfasst wurde
und dass keine anderen als die angegebenen Quellen und Hilfsmittel benutzt wurden.
Diese Erklärung erstreckt sich auch auf in der Arbeit enthaltene Graphiken,
Zeichnungen, Kartenskizzen und bildliche Darstellungen.
Bachelor's/Master’s thesis statement of originality
I hereby confirm that I have written the accompanying thesis by myself, without
contributions from any sources other than those cited in the text and acknowledgements.
This applies also to all graphics, drawings, maps and images included in the thesis.
……………………………………………… …………………………………………..
Ort und Datum Unterschrift
Place and date Signature

42
Dieses Formblatt ist ausgefüllt und vom Betreuer unterschrieben
als letzte Seite in das beim Prüfungsausschuss abzugebende
Exemplar der Masterarbeit einzubinden.
This form must be filled out and signed by your supervisor. It is to
be included in the final version of the Masters Thesis as the last
page in the copy for the Examination Board.
Name (last, first): Detcharoen, Matsapume
Title of Thesis: Genetic diversity of Labyrinthula spp. in seagrass Zostera marina
beds in the North Atlantic Ocean and the Baltic Sea
Group in which the work was performed: Aquatic Ecology
Examiner/Supervisor: Prof. Dr. Herwig Stibor
Signature (supervisor): ____________________________________________
Starting date: 9 February 2015
Submission date: 10 August 2015
______________________________________________
Signature, Chair of the Examination Board or authorized representative
In case of interruption:
This Masters Thesis was completed
from…………….. until ……………….
from …………….. until ……………….
Signature (supervisor): ______________________________________


![ISD8102 / ISD8104 - Atlantik Elektronik · The ISD8102/ ISD8104 are a general purpose analog audio amplifier, ... Atlantik Elektronik GmbH ... PARAMETER SYMBOL MIN TYP [1]](https://img.pdfslide.us/doc/110x75/5ca4dd7788c99388188b79ca/isd8102-isd8104-atlantik-the-isd8102-isd8104-are-a-general-purpose-analog.jpg)