Embed Size (px)
Citation preview

Seasonal dynamics of bacterial biomass and production in a coastal
arctic ecosystem: Franklin Bay, western Canadian Arctic
Marie-Eve Garneau,1,2 Sebastien Roy,1 Connie Lovejoy,3 Yves Gratton,4
and Warwick F. Vincent1
Received 12 April 2007; revised 21 April 2008; accepted 16 May 2008; published 22 July 2008.
[1] The Canadian Arctic Shelf Exchange Study (CASES) included the overwinteringdeployment of a research platform in Franklin Bay (70�N, 126�W) and provided a uniqueseasonal record of bacterial dynamics in a coastal region of the Arctic Ocean. Ourobjectives were (1) to relate seasonal bacterial abundance (BA) and production (BP) tophysico-chemical characteristics and (2) to quantify the annual bacterial carbon flux. BAwasestimated by epifluorescence microscopy and BP was estimated from 3H-leucine and3H-thymidine assays. Mean BA values for the water column ranged from 1.0(December) to 6.8 � 105 cells mL�1 (July). Integral BP varied from 1 (February) to80 mg C m�2 d�1 (July). During winter-spring, BP was uncorrelated with chlorophyll a(Chl a), but these variables were significantly correlated during summer-autumn(rs = 0.68, p < 0.001,N = 38), suggesting that BPwas subject to bottom-up control by carbonsupply. Integrated BP data showed three distinct periods: fall-winter, late winter–latespring, and summer. A baseline level of BB and BP was maintained throughout latewinter–late spring despite the persistent cold and darkness, with irregular fluctuationsthat may be related to hydrodynamic events. During this period, BP rates werecorrelated with colored dissolved organic matter (CDOM) but not Chl a (rs BP.CDOMjChl a= 0.20, p < 0.05, N = 176). Annual BP was estimated as 6 g Cm�2 a�1, implying a total BPof 4.8 � 1010 g C a�1 for the Franklin Bay region. These results show that bacterialprocesses continue throughout all seasons and make a large contribution to thetotal biological carbon flux in this coastal arctic ecosystem.
Citation: Garneau, M.-E., S. Roy, C. Lovejoy, Y. Gratton, and W. F. Vincent (2008), Seasonal dynamics of bacterial biomass and
production in a coastal arctic ecosystem: Franklin Bay, western Canadian Arctic, J. Geophys. Res., 113, C07S91,
doi:10.1029/2007JC004281.
1. Introduction
[2] Prokaryotic heterotrophs play a key role in marineglobal carbon fluxes by way of their production andconsumption of dissolved organic matter, respiratory CO2
production and nutrient recycling activities [Arrigo, 2005;Kirchman, 2000]. In oligotrophic parts of the ocean they caneven be the dominant component of total planktonic bio-mass [Biddanda et al., 2001; Cole, 1999; Cotner andBiddanda, 2002]. Yet despite the abundance and pivotalfunction of bacteria in marine ecosystems, few open-waterstudies have addressed their seasonal variations in biomassand production [Carlson et al., 1996; Hoch and Kirchman,
1993]. Increasing attention has been given to seasonalchanges in bacterial community structure in the sea [Banoand Hollibaugh, 2002; Murray et al., 1998; Pinhassi andHagstrom, 2000; Schauer et al., 2003], and evidence hasbegun to emerge of repeated patterns over time [Fuhrman etal., 2006]. In general, however, bacterial studies are typi-cally restricted to a single oceanic cruise to a region,generally focusing on the spring bloom and subsequentsummer period when primary and bacterial production ratesare usually maximal. This seasonal bias is particularlystriking for cold arctic ecosystems owing to the logisticdifficulties of sampling such remote and inaccessible envi-ronments, especially during the ice-covered period overmuch of the year. However, bacterial heterotrophy maypersist throughout all seasons, and several studies indicatethat bacteria can be a major component of total communitybiomass and productivity even in cold polar waters [Rivkinet al., 1996; Vincent and Hobbie, 2000].[3] The Arctic is characterized by strong seasonality, and
prokaryotes that grow in its coastal shelf environment mustcontend with pronounced fluctuations in photosyntheticproduction, ice cover, riverine discharge and temperature.Seasonal studies of bacterial abundance and production in
JOURNAL OF GEOPHYSICAL RESEARCH, VOL. 113, C07S91, doi:10.1029/2007JC004281, 2008ClickHere
for
FullArticle
1Departement de Biologie and Centre d’Etudes Nordiques, UniversiteLaval, Quebec, Quebec, Canada.
2Now at Department of Biological Sciences, University of SouthernCalifornia, Los Angeles, California, USA.
3Departement de Biologie and Quebec-Ocean, Universite Laval,Quebec, Quebec, Canada.
4Centre Eau, Terre et Environnement, Institut National de la RechercheScientifique, Quebec, Quebec, Canada.
Copyright 2008 by the American Geophysical Union.0148-0227/08/2007JC004281$09.00
C07S91 1 of 15

polar marine waters are limited to a few areas, notably theRoss Sea, Antarctica, which focused mainly on the daylightperiod [Ducklow, 2003] and the upper water column of theCentral Arctic Ocean during the SHEBA/JOIS study [Sherrand Sherr, 2003; Sherr et al., 2003]. Overall, however, thecomposition, physiology and function of prokaryotic heter-otrophs in the marine Arctic are poorly understood, both interms of spatial variations as well as temporal dynamics[Amon, 2004; Loeng et al., 2005].[4] Our central aim in the present study was to determine
the seasonal dynamics of biomass stocks and productivity ofthe prokaryotes (Archaea and Bacteria, subsequently re-ferred to here as bacteria, since they are the dominantprokaryotes) in an arctic shelf environment over an annualcycle, and to relate these to variations in the physico-chemical environment. We hypothesized that bacterial bio-mass and productivity would be closely coupled to theprimary production cycle, which in turn is dependent onincident solar irradiance and ice cover. A secondary aim wasto quantify the annual bacterial carbon fluxes in terms ofproduction and respiration. We undertook this study withinthe program Canadian Arctic Shelf Exchange Study(CASES) in which our research platform was frozen intothe ice at a station in Franklin Bay, at the edge of AmundsenGulf, Beaufort Sea.
2. Methods
2.1. Study Site and Sampling
[5] The study was carried out from 4 November 2003 to6 August 2004 in Franklin Bay, western Canadian Arctic,onboard the icebreaker CCGS Amundsen. Microbial varia-bles were collected from the surface to bottom of the watercolumn, on 33 occasions covering almost a complete year.From 5 December 2003 to 1 June 2004, the ship was frozeninto first-year pack ice at station 200 (70�020N, 126�180W).Deepwater sampling and profiling throughout this periodwas performed through the ship’s internal moon pool.Conductivity, temperature and depth were measured usinga Seabird 911+ CTD which was also equipped with achlorophyll fluorescence probe, transmissometer, pH, oxy-gen and PAR (photosynthetically active radiation; 400–700 nm) probes. The CTD system was mounted on aSeabird Carousel rosette equipped with 24 12-L PVCNiskin type bottles. Throughout the winter period, watersamples were taken from six fixed depths: 20, 50, 100, and150 m, and near the bottom at approximately 220 m.Surface samples were taken from a site located 450 m upcurrent from the ship to any avoid contamination. A 5-LGo-Flo bottle was deployed on a wire through an ice hole at3 m (to avoid frazil ice) and at 10 m from the top of the ice.Salinity and temperature were measured with a SBE-19CTD profiler. The maximum ice thickness during the studywas 1.8 m.[6] During the open water sampling (4 November to
4 December 2003 and 2 June to 6 August 2004), all thesamples were collected using the rosette deployed from theship’s A frame. At this time samples were taken at 4 photicdepths (100%, 10%, 1%, 0.1% of surface PAR) and nearbottom. The photic depths were determined using a Secchidisk as an approximate guide to the diffuse light attenuation
coefficient (Kd). The 0.1% depth measured on 16 July, 6August and 4 November ranged from 33 to 65 m.
2.2. Environmental Variables
[7] Incident PAR was measured at 10-min intervals overthe entire sampling period with a GUV-510 surface radiom-eter (Biospherical Instruments, Inc.) mounted at the top of theship’s wheelhouse. The data, provided by T. Papakyriakou(University of Manitoba) and S. Brugel (Universite duQuebec a Rimouski), were first integrated over 24 h for eachday. Running means computed for 7-day intervals wereplotted against time, expressed in Julian days, with day zeroset at 1 January 2004.[8] CDOM (colored dissolved organic matter) absorption,
used as a potential index of terrigenous inputs from the river[see Retamal et al., 2007], was measured in acid-cleaned10-cm quartz cells using a Varian Cary Bio 300 scanningspectrophotometer. Samples were scanned at 1 nm intervalsbetween 200 and 850 nm against MilliQ pure water. Thespectrum was corrected for the absorption offset using themean value for wavelengths greater than 800 nm.[9] The absorption coefficient at 320 nm was calculated
as
a320 ¼ 2:303� A 320ð Þ=L; ð1Þ
where A(320) is the optical density for wavelength 320 nmand L is the cell path length in meters.
2.3. Biological Variables
[10] Phytoplankton biomass was estimated from chloro-phyll a (Chl a) analysis of the total community. Sampleswere filtered onto 25 mm diameter Whatman GF/F glassfiber filters and stored frozen (�80�C) until pigment ex-traction in ethanol [Nusch, 1980]. Concentrations weredetermined by fluorometry before and after acidification[Strickland and Parsons, 1972] using a Cary Eclipsespectrofluorometer standardized with Anacystis Chl a. Chla data were compared to estimates from the CTD fluorom-eter and showed a significant relationship (r = 0.75, p <0.001, N = 198).[11] Bacterial abundance was estimated from formalin
fixed samples (2% final conc.) filtered within 24 h through0.2 mm black polycarbonate membranes and stained with40,6-diamidino-2-phenylindole (DAPI). A minimum of400 DAPI stained cells were counted on each slide byepifluorescence microscopy using an Olympus BX51 mi-croscope on board the ship. Bacterial biomass was estimatedusing the bacterial cellular biomass of 10 fg C cell�1 assuggested for oligotrophic marine systems [Bell, 1993] (seebelow).[12] Bacterial production (BP) was estimated using the
centrifugation method of Smith and Azam [1992] frommeasurement of the incorporation rates of two tritiatedsubstrates. Incorporation rates of the amino acid [4,5-3H]-leucine (Leu; specific activity: 159 Ci mmol�1) provided anestimate of protein production while incorporation rates ofthe nucleoside [methyl-3H]-thymidine (TdR; specific activ-ity: 88 Ci mmol�1) provided an estimate of DNA synthesis.The final concentration of radiolabeled substrate in eachsample was 10–15 nM. Triplicate samples were incubated
C07S91 GARNEAU ET AL.: BACTERIAL DYNAMICS IN THE ARCTIC OCEAN
2 of 15
C07S91

in the dark at temperature in close agreement to in situconditions (from �1.4 to 4�C) for 4 h.[13] Bacterial production rates were estimated from leu-
cine incorporation using a conservative carbon conversionfactor of 1.5 kg C mol�1 of 3H-leucine incorporation, asused in the Ross Sea [Ducklow, 2003]. Our leucine-basedbacterial production rates provided the primary estimate ofbacterial production. Leucine incorporation measurementswere not performed on four sampling dates (11, 16, 23 and28 January) and bacterial production was estimated from3H-thymidine incorporation measurements. This was possi-ble because there was a close, linear relationship betweenthe 3H-leucine and 3H-thymidine incorporation rates (r =0.89, p < 0.001, N = 92). To convert thymidine incorpora-tion into bacterial production, we used (1) a commonempirical carbon conversion factor for marine waters of2.0 � 1018 cells mol�1 of 3H-thymidine incorporated and(2) the bacterial cellular biomass of 10 fg C cell�1. Thelatter is based on what is recommended for oligotrophicmarine systems, based on 97 experimental studies in theopen ocean [Bell, 1993]. This value is consistent with the11.5 fg C cell�1 used in the Greenland Sea [Borsheim,2000] and is within the range of 7–15 fg C cell�1 estimatedfor oceanic regions [Ducklow, 2000]. The Beaufort Searegion, specifically the Mackenzie Shelf, is an oligotrophicsystem [Carmack et al., 2004], and thus the conservativevalue of 10 fg C cell�1 used in the present study wasdeemed appropriate.[14] The incubation time for 3H-leucine and 3H-thymidine
was determined from experiments using surface samples on30 October 2003 and using surface and the near-bottomdepth samples on 26 June 2004. Samples inoculated with3H-leucine or 3H-thymidine (10 nM final conc.) wereincubated for 120, 240, 360 to 480 min. Regressionsbetween the DPM incorporated against time were linearfor up to 480 min for 3H-leucine uptake at surface inOctober and in June (r = 94, p < 0.05, N = 4), but at thenear-bottom depth, incorporation decreased after 360 min.Regressions were linear for up to 480 min for 3H-thymidineuptake at surface in June (r = 85, p < 0.05, N = 4), and forup to 360 min at surface in October (r = 65, p < 0.05, N = 3)and at depth in June (r = 90, p < 0.05, N = 3). Our uptakemeasurements from 4-h incubations were thus made onthe linear section of the uptake curves. Saturation curveexperiments were conducted in parallel to determine theappropriate radioisotope concentrations. The 3H-leucine and3H-thymidine were added to samples at final concentrationsof 15, 20, 25, 30, 40, 60 and 80 nM and incubated 4 h at thesimulated in situ temperature. The use of a substrateconcentration between 10 and 20 nM was confirmed to beappropriate for both radioisotopes, and is within the rangerecommended for oligotrophic environments [Simon andAzam, 1989].
2.4. Statistics
[15] Statistical analyses were performed over the entireannual data set and also for each season separately: autumn(21 September to 20 December), winter (21 December to20 March), spring (21 March to 20 June) and summer(21 June to 20 September). Associations between pairs ofvariables were tested with the Pearson correlation (r coef-ficient), or Spearman rank correlation (rs coefficient) when
large deviations from normality were found [Zar, 1999].Partial correlations were run to examine the interactionsbetween three variables order to remove spurious correla-tions, and significance tests were made with Student’s t testwith df = n � 3 [Myers and Well, 2003]. Kruskal-Wallisanalysis was used to test differences of the median valuesbetween sampling seasons since the data failed the normal-ity and homogeneity of variance tests.
3. Results
3.1. Upper Water Column Characteristics
[16] PAR ranged from continuous darkness during thepolar night to continuous sunlight in summer (Figure 1a).There were large variations in cloud cover in summerresulting in substantial day-to-day fluctuations in dailyPAR, from a minimum of 25 mol photons m�2 on 8 Julyto 55 mol photons m�2 on 14 June. The seawater temper-ature at 10 m depth was relatively constant at around�1.7�C over much of the year, rising to 3.3�C in summer(Figure 1b). The summer warming was accompanied by afreshening of the surface layer, to a minimum of 28.5 on 6August (Figure 1b), likely caused by freshwater riverinflows and ice melt. There was a significant inverserelationship between temperature and salinity (rs = �0.91,p < 0.0001, N = 33). Salinities increased during iceformation in fall, followed by large fluctuations in salinity(of amplitude 5 units) in mid to late December 2004,implying upwelling and horizontal advection of watermasses at that time.[17] The a320 measurements showed low to moderate
CDOM concentrations with minor fluctuations most of theyear (Figure 1c). A maximum of 1.43 m�1 was recorded inautumn on 19 November and a minimum of 0.40 insummer. Chl a concentrations in the surface mixed layerwere consistently low throughout the year, varying from0.01 mg m�3 on 4 January to 0.36 mg m�3 on 16 May(Figure 1c), with an annual mean of 0.12 mg m�3. Chl aconcentrations were significantly higher in spring (medianof 0.22 mg m�3; Kruskal-Wallis, p < 0.05) compared towinter and autumn concentrations (0.04 and 0.05 mg m�3,respectively). The summer median (0.12 mg m�3) was notstatistically different from the other seasons, in part reflect-ing the small number of estimates and the large variabilitybetween summer sampling dates. Chl a concentrationswere significantly correlated with the daily integrated PAR(rs Chl a.PARjT�C = 0.80, p < 0.001, N = 29), but not withtemperature when the effect of incident light was controlled(rs Chl a.T�CjPAR = �0.23, p = 0.2, N = 29).[18] Bacterial abundance in the upper 10 m of the water
column varied over 2 orders of magnitude during thesampling period, from 8.73 � 104 cells mL�1 on 16December to 1.07 � 106 cells mL�1 on 16 July (Figure 1dand Table 1). There were irregular variations through timepossibly reflecting sampling error and different watermasses, as well as fluctuations in growth and loss processes.However, there was a clear increase during the summermonths. Bacterial production rates were similarly variable,ranging from 6.6 mg C m�3 d�1 on 4 April to 163 mg C m�3
d�1 on 9 May. In winter, a peak of 53 mg C m�3 d�1 wasrecorded on 22 December, coincident with an increase insalinity (Figures 1b and 1d) that was suggestive of an
C07S91 GARNEAU ET AL.: BACTERIAL DYNAMICS IN THE ARCTIC OCEAN
3 of 15
C07S91
upwelling event. There was no correlation between bacterialproduction and abundance (rs = 0.18, p = 0.5, N = 19) andno significant difference was observed between seasons inmean values of both bacterial abundance and production inthe upper 10 m. This is likely an effect of the small numberof estimates for the upper water column.
3.2. Vertical Structure of the Water Column andBiological Variables
[19] The Franklin Bay water column was strongly strat-ified throughout the year of sampling (Figures 2 and 3) andhad profiles that are typical of much of the Arctic Ocean[Dittmar and Kattner, 2003]. A shallow (<30 m) PolarMixed Layer (PML) of cold (<�1.5�C), relatively fresh(<30) water overlay higher-salinity, Pacific-derived water.The transition to the latter was characterized by a sharptemperature maximum in the halocline at 30–40 m depth,with the Halocline Arctic Layer (HAL) grading into theDeep Atlantic Layer (DAW) of saline (34.5) and warmer(>0�C) water at 200 m. The profiles during two samplingperiods showed a deviation from this pattern. In December2003, there was a hydrodynamic event that pushed DAWhigher up the water column, and resulted in temporarilywarmer, much more saline water at the surface (Figure 2c).In summer, the water column was stratified even within thePML depth range, with high surface water temperatures(>2�C) and minimum salinities (Figures 2m and 2n).[20] Chl a concentrations were usually greatest in the near
surface waters, decreased sharply below 20 m and main-tained low values from the pycnocline to the bottom of thewater column (Figure 3). In July and August, a deep Chl amaximum developed at around 50 m (Figures 3m and 3n).There was a significant inverse relationship (rs Chl a.NO3jSal =�0.39, p < 0.001, N = 168) between Chl a and nitrateconcentrations (the latter from J.-E. Tremblay et al., unpub-lished data, 2004) consistent with nutrient drawdown by thephytoplankton. Chl a concentrations were significantlyhigher (Kruskal-Wallis, p < 0.05) in summer (median of0.19 mg m�3) than in spring (0.02 mg m�3), winter (0.03mg m�3) and autumn (0.04 mg m�3).[21] CDOM concentrations, as estimated by a320, had
maximum values at the surface, and typically declined bya factor of two down the water column (Figure 4). Thehighest value of 2.24 m�1 was recorded in the warm,freshwater-influenced surface layer in July, with valuesdeclining to �0.6 m�1 deeper in the water column(Figure 4m). However, the mean water column concentra-tions of CDOM (Table 2) did not significantly differ amongseasons (Kruskal-Wallis, p = 0.06). During part of thewinter (10 December–22 January) when concurrent meas-urements were made of DOC [Roy, 2006] and CDOM, therewas a highly significant linear relationship between the twovariables (r = 0.80, p < 0.0001, N = 35).[22] The vertical distribution of bacteria was similar to
that for Chl a, with values that were often highest at thesurface and much lower throughout most of the rest of thewater column (Figure 4). However, on several occasions inwinter, maximum abundance values were found at 100 m ordeeper (Figures 4d and 4e). Overall, there was a strongpositive correlation between bacterial and Chl a concen-trations (Table 3). As observed in the first 10 m, bacterialabundance in the water column varied over 2 orders ofmagnitude during the sampling year. The lowest bacterialabundance was 1.5 � 104 cells mL�1 measured on 20February at the bottom depth, and the highest bacterialabundance was 1.7 � 106 cells mL�1, on 16 July at 22 m.On average, bacteria were significantly (Kruskal-Wallis, p <0.05) more abundant in summer (median of 1.1 � 106 cells
Figure 1. Seasonal variation in environmental variables inthe surface waters (10 m) of Franklin Bay from 4 November2003 to 6 August 2004. (a) Seven-day running means ofdaily integrated incident irradiance expressed as PAR (notelog scale); (b) temperature and salinity; (c) chlorophyll a(Chl a) and CDOM absorption coefficient at 320 nm (a320);and (d) bacterial abundance and leucine-based bacterialproduction.
C07S91 GARNEAU ET AL.: BACTERIAL DYNAMICS IN THE ARCTIC OCEAN
4 of 15
C07S91

mL�1) than in spring (2.0 � 105 cells mL�1), winter (2.8 �105 cells mL�1) and autumn (1.3 � 105 cells mL�1).[23] Bacterial production rates, like Chl a and bacterial
abundance, were generally highest at the surface and oftendeclined exponentially with depth (Figure 4). However,bacterial productivity was relatively high below 100 m onseveral occasions during winter and spring, with peakactivity around 100–150 m in December–January (Figures 4c,4d, and 4e) and at the bottom depth on three other occasionsin March (Figure 4i). For the overall data set, there was asignificant correlation between bacterial production ratesand Chl a concentration (Table 3). Partial correlationsshowed that the latter correlation was independentof CDOM concentration effect (rs BP.Chl ajCDOM = 0.44,p < 0.001, N = 214) over the year. There was also asignificant relationship between bacterial abundance andbacterial production rates, but no significant relationshipwith temperature (Table 3) nor with CDOM when Chl aconcentration effect was removed (rs BP.CDOMjChla = �0.04,p = 0.5, N = 214). Maximum bacterial productivity wasmeasured in the upper 10 m from early spring until the6 August (Figures 4j–4m). The highest bacterial productionrate of the year was 1121 mg C m�3 d�1, from the surfacewaters on 16 July (Figure 4m), and the lowest rate of0.61 mg C m�3 d�1 was measured on 9 February at 50 m(Figure 4f).
3.3. Integrated Microbial Stocks and BacterialProduction
[24] Integrated Chl a values for the entire water columnvaried from 1.8 mg m�2 on 3 January to 36.6 mg m�2 on6 August, with an annual mean of 7.7 mg m�2 (Table 2).The integrated Chl a was higher in summer than in the other
seasons, with a mean value that was 4–7 times higher thanduring autumn, winter or spring (Table 2). However, resultswere not significant, again likely reflecting the small num-ber of estimates and the large variability between summersampling dates.[25] Mean bacterial concentrations for the water column
varied greatly throughout the sampling year, from a mini-mum mean value of 1.0 � 105 cells mL�1 in late autumn on16 December to a maximum mean value of 6.8 � 105 cellsmL�1 in summer, with an annual average of 2.6 � 105 cellsmL�1 (Table 2). There was no significant difference be-tween depth-integrated seasonal means (Table 2). There wasa significant correlation between integrated values of bac-terial numbers and Chl a in the water column (rs = 0.44, p <0.05, N = 24), but no significant correlation was foundbetween bacteria abundance and bacterial production rates(rs = �0.02, p = 0.9, N = 22).[26] Integrated bacterial production varied by almost 2
orders of magnitude over the year, with an annual meanvalue of 7.6 mg C m�2 d�1 (Tables 1 and 2). The lowest ratewas 1.3 mg C m�2 d�1 in late winter (26 February) and themaximum rate was 80 mg C m�2 d�1 in summer (16 July).Seasonal integrated bacterial production rates (Table 2) insummer and autumn were both significantly greater thanwinter rates (Kruskal-Walis, p < 0.05). On average, 50%(range 29–66%) of total bacterial production for the watercolumn was between 100 m and the bottom. The highestproportion of total bacterial activity in this lower 100 m wasin winter (mean of 54%), followed by autumn (49%) andfinally spring (46%).[27] There was a striking correspondence between the
seasonal changes in integral bacterial production and inte-gral Chl a (Figure 5; for the log transformed data, rs = 0.50,
Table 1. Bacterial Abundance and Production Rates in Polar and Atlantic Seasa
Study Area Sampling PeriodBA Depth,
mBA,
105 cells mL�1BP Depth,
mBP,
mg C m�2 d�1CF,
kg C mol�1 References
Arctic OceanCentral Arctic Ocean June–Sept Zeu: �40 1.9–3.2–6.7 50 1–4–15 3.1 Sherr and Sherr [2003]
Nov/Feb–May �40 1.3–1.8–2.9 50 0.9 3.1 and Sherr et al. [2003]late July to late Aug <30 3–15b Zeu: 40–100
c 32–73–100 2.3 Rich et al. [1997]Chukchi Sea mid-Aug to mid-Sept �10 2.1–21 50 152–227–301 nd Steward et al. [1996]Greenland Sea end July �50 0.97–11–28 50 12–157–634d 23d Borsheim [2000]Franklin Bay Nov–Aug �10 0.87–3.2–11 200 1–8–80 1.5 This study
�200 1.0–2.6–6.8Kara Sea Aug–Sept 1–2 2.3–3.5–4.7 25 12–43–79 2.3 Meon and Amon [2004]
Southern OceanBransfield Strait Dec–Jan �100 4.2 100 25 0.81 Pedros-Alio et al. [2002]
Jan–Feb 3.0 8Eastern Atlantic sector Dec–Jan 2–10 <1–15 150 40–76–100 Nd Graneli et al. [2004]Gerlache Strait Dec–Jan �100 2.6–4.6 100 42–48 0.81 Pedros-Alio et al. [2002]
Jan–Feb 4.9–5.8 10–23Ross Sea Oct–April Zeu 1e–30 150 39–54–72 1.5 Ducklow [2003]
OthersNorth Atlantic Ocean mid-May �50 2–20 50 293 nd Ducklow et al. [1993]Sargasso Sea (BATS) Composite annual
cycle (1991–1994)�100 3–7 Zeu: 140 m 11–22–36 0.2–1.3 Carlson et al. [1996]
aBacterial abundance (BA) values are averages from the surface to the BA depth, and bacterial production rate (BP) values are leucine-based estimatesthat have been integrated over the upper water column, from the surface to the BP depth. Minimum, mean (in bold) and maximum values are shown. CF:carbon conversion factor; nd: not determined; Zeu: euphotic zone.
bValue estimated from Figure 2b of Rich et al. [1997].cValues estimated from Figures 3 and 4 of Rich et al. [1997].dThymidine-based bacterial production; conversion factors used were 2.65 � 1018 cells mol�1 and 2 � 104 g C cell�1.eValue estimated from Figure 1a of Ducklow [2003].
C07S91 GARNEAU ET AL.: BACTERIAL DYNAMICS IN THE ARCTIC OCEAN
5 of 15
C07S91

p = 0.005, N = 30). This bacterial production curve showsthree periods: a variable period during fall and winter (fall–winter); a long period of relatively constant activity duringlate winter and spring (late winter–late spring); and a majorrise in activity to peak values in summer at the same time aspeak phytoplankton stocks.
3.4. Seasonal Controls on Bacterial Production
[28] The bacterial production rates in the water columnwere highest in summer (median of 274 mg C m�3 d�1) andsignificantly greater than in winter (16 mg C m�3 d�1) andspring (15 mg C m �3 d�1; Kruskal-Wallis, p < 0.05), butnot autumn. Bacterial production in autumn (45 mg C m�3
d�1) was significantly higher than estimated in winter andspring (Kruskal-Wallis, p < 0.05). Thus we regrouped thewinter and spring data sets (Figures 6a and 6b) and thesummer and autumn data sets (Figures 6c and 6d) to testrelationships with environmental variables. First-order par-tial correlations revealed that CDOM and Chl a concen-trations (rs CDOM.Chl ajBP = 0.64, p < 0.0001, N = 176) werecorrelated, but that bacterial production rates were correlat-ed only with CDOM (rs BP.CDOMjChla = 0.20, p < 0.05, N =
176) in winter-spring. There was no correlation betweenbacterial production rates and temperature for this period.[29] In summer and autumn there was a significant
positive correlation between average bacterial productionrates in the water column and temperature (r = 0.74, p <0.001, N = 37). A simple linear model II regressioncalculated by the ordinary least square method (OLS)[Legendre and Legendre, 1998] gave the equation
BP ¼ 0:12� Temperatureð Þ þ 0:24; ð2Þ
where BP is in mg C m�3 d�1 and temperature in �C.However, this relationship was slightly below the 5%significance level (r = 0.73; p = 0.08, N = 37).[30] There was also a significant positive correlation
between bacterial production and Chl a concentrations(rs = 0.68, p < 0.001, N = 38; Figure 6c). First-order partialcorrelations revealed that both temperature and Chl aconcentration significantly affected bacterial production (rsBP.Chl ajT�C = 0.63, p < 0.0001 and rs BP.T�CjChl a = 0.51, p <0.005, N = 37). Multiple linear regression analysis withstandardized coefficients (dimensionless values) showed
Figure 2. Selected profiles of temperature (line) and salinity (dashed line) at station 200 in FranklinBay, from 4 November 2003 to 6 August 2004.
C07S91 GARNEAU ET AL.: BACTERIAL DYNAMICS IN THE ARCTIC OCEAN
6 of 15
C07S91

that bacterial production in the summer-autumn period waswell described (r = 0.80, p < 0.001, N = 37) by the equation
BP ¼ 0:39� Chl að Þ þ 0:52� Temperatureð Þ þ 0:11: ð3Þ
For each coefficient, the variance inflation factor (a measureof multicolinearity) was 1.4 indicating that there was noredundant information among the independent variables.The summer-autumn data set also showed a significantlinear relationship between bacterial production rates andbacterial cell abundance (r = 0.81, p < 0.0001, N = 26;Figure 6d). The slope of regression equation was 0.80, witha probability that the slope is not zero of p < 0.0001.
3.5. Bacterial Production Estimates From LeucineVersus Thymidine Assays
[31] Bacteria incorporate 3H-leucine into proteins and 3H-thymidine into DNA, and the ratio between the two incor-poration rates expressed in mol h�1 (Leu:TdR) is an
indicator of the metabolic status of prokaryotes [Shiahand Ducklow, 1997]. Overall, there was a close, linearrelationship between the 3H-leucine and 3H-thymidine in-corporation rates (r = 0.89, p < 0.001, N = 95). Leu:TdRranged from 0.6 and 158, with an average of 20 for alldepths combined (Table 2). There was a seasonal trend, withLeu:TdR that were significantly lower in summer (6)relative to autumn (27) and winter (17) (Kruskal-Wallis,p < 0.05), but not significantly different from spring (14).There was an inverse relationship between Leu:TdR andChl a concentrations (rs = �0.33, p < 0.0001, N = 89) andwith bacterial abundance (rs = �0.37, p < 0.001, N = 72).
4. Discussion
4.1. Comparisons With Other Sites
[32] The overwintering deployment of our research plat-form allowed the multiseasonal sampling of bacterial andenvironmental variables, and provided a unique record for
Figure 3. Selected profiles of seawater density (small dots) and chlorophyll a concentration (filledsymbols) illustrating the seasonal variation in the water column at station 200 in Franklin Bay, from 4November 2003 to 6 August 2004. Note changes in scales for chlorophyll a over time.
C07S91 GARNEAU ET AL.: BACTERIAL DYNAMICS IN THE ARCTIC OCEAN
7 of 15
C07S91

the coastal Arctic Ocean. Our estimates of bacterial abun-dance fall within the ranges reported from other time seriesstudies in polar and Atlantic seas (Table 1). However, mostof these studies are for spring and/or summer, and theydiffer in depth of averaging and integration, which compli-cates comparisons. The most comparable Arctic data set to
our own is the yearlong series from the offshore ArcticOcean [Sherr and Sherr, 2003; Sherr et al., 2003], and thisshows bacterial fluctuations within a similar range to thatreported here. The maximum concentrations were low,however, by comparison with maxima at several other polarsites including the Chukchi Sea, Greenland Sea and Ross
Figure 4. Selected profiles of CDOM absorption at 320 nm (a320; crosses), bacterial abundance (opensymbols) and bacterial production (BP; filled symbols) illustrating the seasonal variation in the watercolumn at station 200 in Franklin Bay, from 4 November 2003 to 6 August 2004. On 22 January,bacterial production was estimated from thymidine incorporation rates instead of leucine incorporation.Note changes in scales for bacterial production and abundance over time.
C07S91 GARNEAU ET AL.: BACTERIAL DYNAMICS IN THE ARCTIC OCEAN
8 of 15
C07S91
Sea. The low bacterial concentrations in Franklin Bay areconsistent with the highly stratified nature of this environ-ment throughout the year (Figures 2 and 3), and its resultantlow nutrient availability [Carmack et al., 2004] and lowphytoplankton stocks.[33] Bacterial production rates in Franklin Bay were also
low by comparison with sites elsewhere (Table 1). Themaximum rates of bacterial production were similar to peakactivities recorded in the Kara Sea and Southern Ocean, butless than 30% of maximum activities in the Chukchi Seaand Greenland Sea where Chl a concentrations were alsomuch higher. The maximum production rates were compa-rable with the central Arctic Ocean, despite much lowermaximum Chl a values in the Beaufort Sea (generally<0.5 mg m�3, but up to 4.3 mg m�3 in the Arctic Ocean[Sherr et al., 2003]), implying a subsidy by allochthonouscarbon sources in the coastal ocean.[34] The magnitude of seasonal variation in bacterial
abundance was at or below that at many sites elsewhere(Table 1). Surface water concentrations of bacteria variedseasonally by about a factor of 10 in Franklin Bay, 10 in theNorth Atlantic Ocean and by more than 30 in the Ross Sea.Much lower variation was recorded in the central ArcticOcean (factor of 2 from November to May) suggesting morevariable conditions at our coastal arctic site. There is alsolower seasonal variation in bacterial abundance and pro-duction in the subtropical Sargasso Sea (factor of 3 variationin the upper water column; Table 1), where environmentalconditions are more stable relative to the strongly seasonalpolar environment. Polar ecosystems experience a widespan of environmental conditions over a year, notably inincident light regime [Smith and Sakshaug, 1990], that inturn affect the ice and snow cover, water temperature, mixedlayer depth and nutrient supply. Additionally, Franklin Bayreceives terrestrial inputs of riverine freshwater, nutrientsand organic carbon. The latter, highly variable externalforcing may explain why despite relatively low seasonalvariations in bacterial abundance (factor 10), our annual
survey revealed a large variability in bacterial production(factor 80) in Franklin Bay, which largely exceeded siteselsewhere in the polar regions including the central ArcticOcean (factor 15) as well as the North Atlantic (factor 3)(Table 1).
4.2. Seasonal Controls
[35] The integrated bacterial production data showedthree distinct periods: fall-winter; late winter–late springand summer (Figure 5). Contrary to our expectation, bacte-rial biomass and activity did not continue to decline duringfall-winter. Instead, a baseline level of bacterial concentra-tions and productivity was maintained throughout the latewinter–late spring period despite the persistent cold anddarkness, with irregular fluctuations that may be related tohydrodynamic events. The pronounced change in watercolumn properties on 22 December followed a period ofice formation and apparent thermohaline convection [Forestet al., 2007], and was accompanied by major shifts intemperature and salinity (Figure 2c), Chl a (Figure 3c),
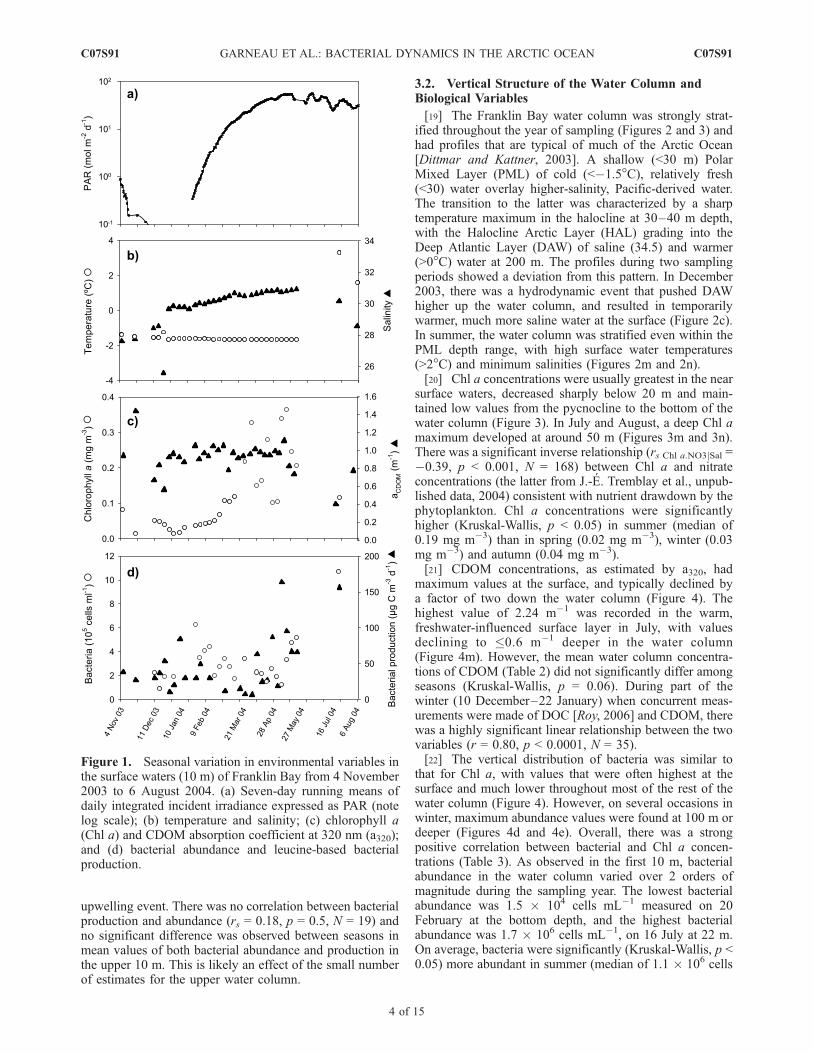
Table 2. Seasonal Means of Variables Measured in Franklin Baya
Season PAR, mol m�2 CDOM, m�1 Chl a, mg m�2 BA, 105 cells mL�1 BP, mg C m�2 d�1 Leu:TdR, mol:mol
Autumn 1.3 0.82 7.9 1.2 8.8 27SD 1.4 0.29 6.8 1.1 4.3 18N 42 4 4 2 4 20
Winter 4.9 0.66 5.3 3.1 4.0 17SD 5.5 0.12 1.9 1.4 3.3 27N 54 15 15 11 13 34
Spring 41.3 0.62 6.1 2.0 3.5 14SD 10.8 0.10 1.7 0.48 1.2 14N 82 12 12 10 11 (21)
Summer 33.0 0.52 34.7 6.8 50.7 6SD 6.8 0.14 2.7 – 41.6 8N 53 2 2 1 2 14
Annual mean 27.5 0.66 7.7 2.6 7.6 20SD 18.3 0.15 7.5 1.4 14.4 21N 231 33 33 24 30 90
aPAR (photosynthetically active radiation) values are the medians of running means; CDOM (colored dissolved organic matter) absorbance at 320 nmand bacterial abundance (BA) are mean values over the water column; chlorophyll a concentration (Chl a) and bacterial production rates (BP) are integratedvalues for the water column; and the Leu:TdR ratios (see text) are median values from all values at all depths for a given season. N, number of samples; SD,standard deviation.
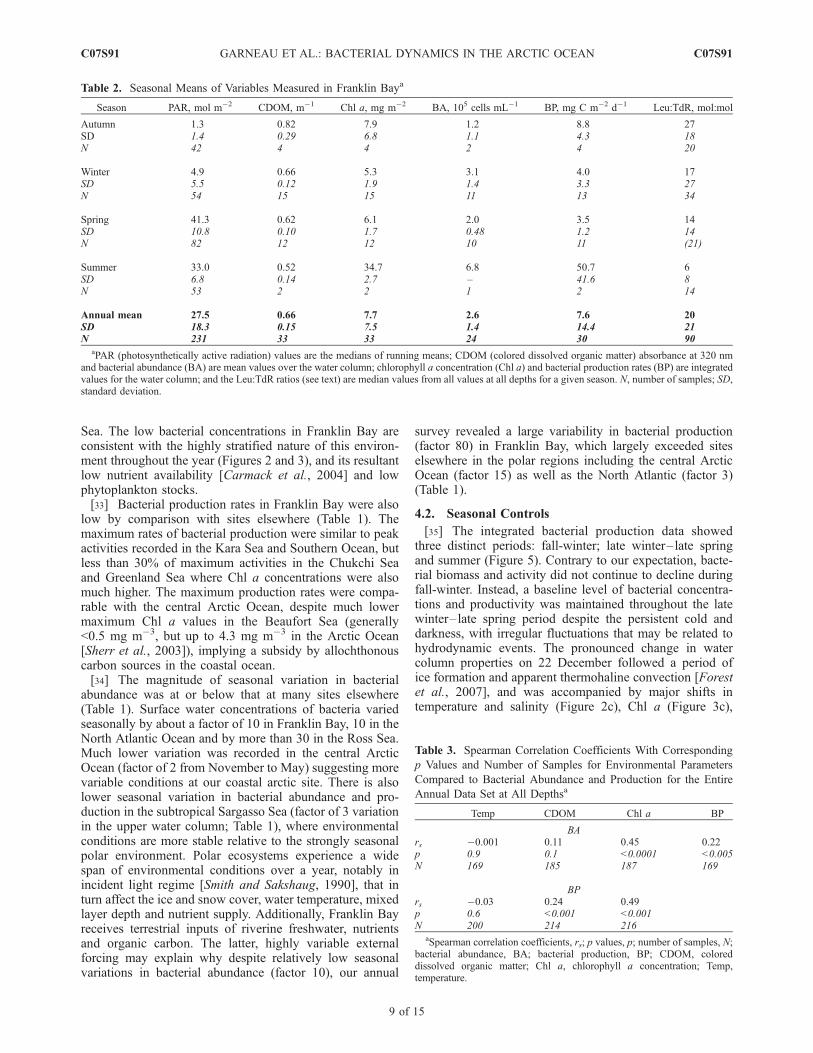
Table 3. Spearman Correlation Coefficients With Corresponding
p Values and Number of Samples for Environmental Parameters
Compared to Bacterial Abundance and Production for the Entire
Annual Data Set at All Depthsa
Temp CDOM Chl a BP
BArs �0.001 0.11 0.45 0.22p 0.9 0.1 <0.0001 <0.005N 169 185 187 169
BPrs �0.03 0.24 0.49p 0.6 <0.001 <0.001N 200 214 216
aSpearman correlation coefficients, rs; p values, p; number of samples, N;bacterial abundance, BA; bacterial production, BP; CDOM, coloreddissolved organic matter; Chl a, chlorophyll a concentration; Temp,temperature.
C07S91 GARNEAU ET AL.: BACTERIAL DYNAMICS IN THE ARCTIC OCEAN
9 of 15
C07S91

nitrate (J.-E. Tremblay et al., unpublished data, 2004) andan enhancement of bacterial production (Figures 4c and 5).A similar event occurred in March, and was again accom-panied by a shift in bacterial production. Thus winter is nota quiescent period of stable conditions beneath the ice, butinstead can have episodes of advection and mixing thatimport nutrients, organic material and maybe bacterial cells,thereby affecting the distribution and activity of microbialcommunities.[36] Light availability (Figure 1a) and photosynthesis
(S. Brugel et al., unpublished data, 2004) were undetectableto extremely low during the winter months and the bacterialcommunity likely depends on prior inputs of organic carboninto the system, including the slow breakdown of largermolecular weight DOC into more biolabile constituents. Inthe Greenland Sea, sustained bacterial production has sim-ilarly been attributed to the consumption of accumulatedorganic material during the preceding productive months[Borsheim, 2000]. In the coastal Arctic Ocean, advectionand upwelling of resuspended sediments as well as nutrientsmay also be a factor contributing to the observed rises inproduction. Bioassays conducted during winter showed thatbacterial abundances were strongly stimulated by the addi-tion of low molecular weight DOC substrates, and addi-tionally by inorganic nitrogen [Roy, 2006], indicating thatbacterial production would be highly responsive to suchinputs.[37] Throughout more than 100 days from late winter to
late spring, bacterial production was remarkably constant(Figure 5), suggesting a low but continuous supply oforganic substrates. As in winter, the production rates werelikely to be strongly limited by organic carbon supplyduring this time of year. Detailed pigment records have
shown the continuous net growth of phytoplankton beneaththe sea ice during this time, with low standing stocks anddominance by picoprasinophytes [Lovejoy et al., 2007]. Thebacterial communities at this time were likely to be fueledby this low input of autochthonous carbon, as well as slowdegradation of less labile, allochthonous DOC. It is likelythat bacteria in winter-spring rely strongly on DOC previ-ously derived from river inputs, as indicated by the signif-icant correlation between bacterial production and CDOM.[38] During the open water conditions, bacterial biomass
and activity increased substantially (Figures 1 and 5),commensurate with the increase in surface water temper-atures, phytoplankton abundance and organic carbon andnutrient input from rivers. Could top-down control bygrazing and viral parasitism be a more important determi-nant of bacterial abundance and production at this time ofyear? One approach toward addressing this question is ananalysis of the log BP versus log BB (bacterial biomass)relationship, which for the summer-autumn data set gave ahighly significant positive regression (Figure 6d). Billen etal. [1990] showed how this simple graphical representationmay provide information about bacterial controls given thatbacterial production is equal to the product of the specificgrowth rate and the bacterial biomass. Growth rate isaffected by food availability (bottom-up control) whereasbiomass is governed by predatory and viral pressure (top-down control). The slope for summer-autumn in FranklinBay was 0.80, well above the threshold of 0.60 andimplying strong bottom-up control [Ducklow, 1992]. Theclose statistical dependence of bacterial production on Chl aand temperature for this period of the year (equation (3))also implies bottom-up control via the chemical and phys-
Figure 5. Seasonal variations in integrated chlorophyll a concentration (open symbols) and bacterialproduction (filled symbols) on log scales in the water column of Franklin Bay, from 4 November 2003 to6 August 2004.
C07S91 GARNEAU ET AL.: BACTERIAL DYNAMICS IN THE ARCTIC OCEAN
10 of 15
C07S91

ical environment, rather than top-down control by biologicalprocesses such as grazing or viral attack.[39] Further information about the environmental control
of bacterial production and biomass is given by theLeu:TdR molar ratio as a measure of protein synthesisversus cell division. Low ratios suggest favorable environ-mental conditions for population growth, while high ratiosimply that the bacteria are in a state of biomass accumula-tion to maximize survival [Chin-Leo and Kirchman, 1990;Shiah and Ducklow, 1997]. This ratio is known to beaffected by substrate supply [Chin-Leo and Kirchman,1990], temperature [Longnecker et al., 2006; Shiah andDucklow, 1997; Tibbles, 1996], taxonomic composition[Cottrell and Kirchman, 2003] and metabolic activity ofbacterial assemblage [Longnecker et al., 2006]. Our datashow a significant correlation between Leu and TdR indi-cating continuous bacterial protein production coupled tocell division throughout the year. On average, however, thevalues are high, implying strong resource limitation at mosttimes (Table 2). The significantly lower ratio in summerimplies improved conditions for cell division at that time,and is consistent with the significant inverse correlation ofthe Leu:TdR ratio with Chl a and with bacterial biomass.
4.3. Coastal Shelf Effects
[40] One of the distinguishing features of the shelfenvironment in this region of the coastal Arctic Ocean isthe presence of high concentrations of Archaea [Garneau etal., 2006; Wells et al., 2006] of diverse lineages [Galand etal., 2008]. Their abundance is correlated with suspendedparticulate material and they contribute to 6.0–15.5% oftotal prokaryotes on the Mackenzie Shelf [Garneau et al.,2006; Wells et al., 2006]. More detailed analyses elsewherein the western Arctic Ocean have shown that Crenarcheotacontribute to 10% of prokaryotes in the surface waters,rising to 40% in deeper samples [Kirchman et al., 2007].Archaea are able to take up amino acids, including leucine,at ambient concentrations [Ouverney and Fuhrman, 2000]and their contribution to total ‘bacterial production’ waslikely to have been adequately assayed and included withinour measurements.[41] Several other features of the coastal environment
may affect bacterial production in this region. The highCDOM values in the surface waters in summer (Figure 1c)are consistent with large allochthonous inputs of organiccarbon to this system [Retamal et al., 2007]. The presenceof freshwater picocyanobacteria across the shelf [Waleron et
Figure 6. Relationships between (a, c) bacterial abundance and chlorophyll a concentration and (b, d)bacterial biomass and bacterial production for winter and spring (Figures 6a and 6b) and summer andautumn (Figures 6c and 6d). Values are presented on a log scale.
C07S91 GARNEAU ET AL.: BACTERIAL DYNAMICS IN THE ARCTIC OCEAN
11 of 15
C07S91

al., 2007] is also indicative of this effect. A variety ofsources may provide dissolved and particulate carbon sub-strates to the bacterial community in Franklin Bay includingcoastal erosion, the melting of landfast ice [Rachold et al.,2004; Wassmann et al., 2004] and the resuspension ofbottom particles into a benthic nepheloid layer [Forest etal., 2007; O’Brien et al., 2006]. The significant dependenceof bacterial production on Chl a and temperature (in part theresult of heat and buoyancy fluxes associated with the riverinputs) but not CDOM suggest that the effects of allochth-onous carbon input are secondary relative to autochthonoussources and the effects of warming during the summerperiod. However, the low percent variance in bacterialproduction attributable to Chl a (20%) is consistent withthese other variables playing a role in the bacterial produc-tivity of this coastal environment. In the North Atlantic,slowly degradable DOC may contribute more to bacterio-plankton metabolism relative to labile DOC produced byphytoplankton [Ducklow et al., 1993]. In the Sargasso Sea,reliance on refractory DOC was considered as a factorexplaining the weak bacterial response to a phytoplanktonbloom [Carlson et al., 1996]. In Franklin Bay uncouplingbetween Chl a and bacterial production was seen in winter-spring, when bacteria may rely more on terrigenous carbon,as indicated by CDOM, than on Chl a, possibly because theallochthonous carbon source was sufficiently available tosustain the community demand. The winter-spring bacterialassemblage might be distinctive in including numerousefficient users of CDOM, such as Cytophaga-Flavobacte-rium cluster representatives [Kirchman, 2002]. CARD-FISH analysis in autumn has shown the widespreaddistribution of this group over the Mackenzie Shelf[Garneau et al., 2006].
4.4. Carbon Fluxes
[42] The results obtained in the present study allow afirst-order estimate of bacterial carbon fluxes for thisregion of the coastal Arctic Ocean. For this calculation,integrated daily water column values of bacterial produc-tion were averaged for each 3-month season, multiplied by90 days and then summed, giving an annual estimate of6.0 g C m�2 a�1.[43] Bacterial growth efficiency (BGE), the ratio of
biomass produced to substrate assimilated, can used toestimate of the total bacterial carbon demand. BGE iscomputed as [del Giorgio et al., 1997]
BGE ¼ BP= BPþ BRð Þ; ð4Þ
where BP is bacterial production and BR is the bacterialrespiration. Rearrangement of the equation provides anestimate of bacterial respiration,
BR ¼ BP=BGEð Þ � BP: ð5Þ
BGE values are known to be a function of nutrient statusand bacterial production rates. Average values range from0.15 in low productivity, open ocean systems (370 mg Cm�3 d�1) to 0.27 in productive coastal environments(2410 mg C m�3 d�1) [del Giorgio and Cole, 2000].For the following analysis, we therefore used a BGE of 0.15
for winter, spring and autumn periods and a value of 0.27for summer.[44] The application of bacterial growth efficiencies to
our annual bacterial production of 6.0 g C m�2 a�1 gives anestimate of the total bacterial carbon demand of 26.7 g Cm�2 a�1. This value is greater than other carbon fluxcomponents, including annual primary production by phy-toplankton (12–16 g C m�2 a�1 for April to September1987 [Carmack et al., 2004]) and primary production by seaice algae (0.64 g C m�2 a�1 for the 49-day period ofmaximum of ice algal bloom development (A. Riedel et al.,Winter-spring dynamics in sea-ice carbon cycling on theMackenzie shelf, Canadian Arctic, submitted to Journal ofMarine Systems, 2008)). This again implies the importanceof allochthonous inputs to this coastal region and suggeststhat this ecosystem is net heterotrophic, as for many coastalmarine [Smith and Hollibaugh, 1993] and oligotrophic [delGiorgio et al., 1997] ecosystems elsewhere. However, thedifference between autotrophic and heterotrophic C fluxesin Franklin Bay is not large and the system could readilyfluctuate across the equilibrium of CO2 production and lossover seasonal or shorter timescales (see for example CO2
measurements for the nearby Mackenzie Shelf fromVallieres et al. [2008]). In part, the heterotrophic nature ofFranklin Bay is dictated by the low primary production, inturn a consequence of its highly stratified, low-nutrientregime.[45] The CO2 production rate by bacteria as estimated
above greatly exceeds the rates of photomineralization ofdissolved organic carbon of 0.31 g C m�2 a�1 [Belanger etal., 2006]. Assuming an area of 87,000 km2 for theAmundsen Gulf region, the DIC production rate for photo-mineralization would be 0.014 Tg a�1 per year [Belanger etal., 2006] while the total bacterial CO2 production for thisarea would be 1.8 Tg a�1. The latter is of a similar order toterrestrial DOC fluxes by the Mackenzie River to theCanadian Shelf of the Beaufort Sea of 1.3 Tg a�1 [Telanget al., 1991]. The same calculation for Franklin Bay(8003 km2) gives an estimate of bacterial CO2 productionof 0.17 Tg C a�1, equivalent to 13% of the Mackenzie Riverinputs of terrestrial DOC to the Beaufort Sea Shelf [Telanget al., 1991]. Such comparisons should be made withcaution in the absence of any assessment of spatial vari-ability across this region of the shelf, however they implythat neither photochemical nor bacterial processes canaccount for most of the annual loss of DOC from thiscoastal environment. It is therefore likely that much of thisallochthonous carbon is exported by advection, includingvia density currents to the deep ocean as described byDittmar [2004].[46] Given the large year-to-year variations in summer ice
cover [Belanger et al., 2006] affecting primary production,and irregular hydrodynamic events in this region of thecoastal Arctic Ocean, there are likely to be large interannualvariations in bacterial production rates. A 2 order-of-magnitude change in bacterial abundance (0.1–10 �105 cells mL�1) between consecutive summers has beenreported for the Mackenzie River estuary, and attributed todifferences in onshore winds and advection [Parsons et al.,1988, 1989]. A large difference in bacterial production wasalso recorded between these two summers (5 and 20 mg C
C07S91 GARNEAU ET AL.: BACTERIAL DYNAMICS IN THE ARCTIC OCEAN
12 of 15
C07S91

m�3 d�1, respectively [Parsons et al., 1988, 1989]) consis-tent with large variations in environmental forcing.[47] Our annual bacterial production estimate of 6.0 g C
m�2 a�1 will require close comparison with other estimatesof carbon fluxes during the CASES study period. Forexample, early estimates of phytoplankton production overthis period provide values of 40, 0.05, 26 and 114 mg Cm�2 d�1 for fall, winter, spring and summer, respectively(S. Brugel et al., unpublished data, 2004, in the CASESdatabase; accessible via www.polardata.ca). Multiplyingthese seasonal means by 90 and then summing them, wouldgive an annual primary production estimate of 16.2 g C m�2
a�1. Thus, the annual bacterial production would be equiv-alent to 37% of this estimate of phytoplankton production,which is a large percentage compared with marine systemsin general where BP:PP is usually about 10–20% [Ducklow,2000]. This analysis requires corroboration, but such a highvalue for Franklin Bay would be consistent with a largesubsidy to bacterial production from riverine carbon inputs.
5. Conclusions
[48] Our observations in Franklin Bay showed that bac-terial activity continued throughout the year, albeit at slowrates, which reflect the low primary production and inor-ganic nutrient supplies in this highly stratified environment.As seen in other oligotrophic systems [Ducklow, 1999;Sanders et al., 1992], bacterial production in this region isprobably controlled by bottom-up processes rather than bygrazers. Although strongly resource limited, bacterial car-bon fluxes appear to be large relative to other processes, andare likely supplemented by allochthonous inputs, specifi-cally less labile organic carbon from rivers, coastal erosion,landfast ice and bottom sediments. The relationship betweenbacterial production and Chl a in summer-autumn but not inwinter-spring implies that bacterial production is coupled toautochthonous production for only part of the year, and issupported for many months by slow breakdown of lesslabile substrates. Future analysis and biophysical models ofthe carbon flows for the coastal Arctic Ocean will need topay close attention to the balance between autochthonousand allochthonous sources.[49] The fastest rates of global warming are currently
observed in the Arctic [Christy et al., 2001; Huntington etal., 2005], and there has been an accelerated reduction inarctic sea-ice extent and thickness during spring and sum-mer [Cavalieri et al., 2003; Christy et al., 2001]. Thelengthening of the open-water period as seen in the BeaufortSea off the Mackenzie River Shelf [Smith, 1998], is likely tostimulate primary production via increased light availability,which in turn would enhance bacterial production. Sucheffects may be amplified by increased wind-induced mixingand upwelling during late season storms, which wouldlikely entrain additional organic carbon and nutrients intothe surface waters [Loeng et al., 2005; Walsh et al., 2005].Climate forcing will also augment terrestrial nutrient andorganic carbon loads [Frey and Smith, 2005; Wrona et al.,2005] through increasing riverine discharge [Peterson et al.,2002]. Such changes are likely to stimulate bacterial pro-duction and respiration, which in turn will modify netcarbon fluxes in this coastal arctic system.
[50] Acknowledgments. This study was part of the CASES programfunded by the Natural Sciences and Engineering Research Council ofCanada and led by L. Fortier. Financial support was also provided by theFonds Quebecois de Recherche sur la Nature et les Technologies and byIndian and Northern Affairs Canada. We thank officers and crew of theCCGS Amundsen; C. Martineau, R. Terrado, and M. Rautio for fieldworkand analysis; and H. Ducklow, S. Bruguel, S. Demers, and J.-E. Tremblayfor the use of unpublished data.
ReferencesAmon, R. M. W. (2004), The role of dissolved organic matter for theorganic carbon cycle in the Arctic Ocean, in The Organic Carbon Cyclein the Arctic Ocean, edited by R. Stein and R. W. Macdonald, pp. 83–99,Springer, Berlin.
Arrigo, K. R. (2005), Marine microorganisms and global nutrient cycles,Nature, 437, 349–355, doi:10.1038/nature04159.
Bano, N., and J. T. Hollibaugh (2002), Phylogenetic composition of bacter-ioplankton assemblages from the Arctic Ocean, Appl. Environ. Micro-biol., 68, 505–518, doi:10.1128/AEM.68.2.505-518.2002.
Belanger, S., H. Xie, N. Krotkov, P. Larouche, W. F. Vincent, and M. Babin(2006), Photomineralization of terrigenous dissolved organic matter inArctic coastal waters from 1979 to 2003: Interannual variability andimplications of climate change, Global Biogeochem. Cycles, 20,GB4005, doi:10.1029/2006GB002708.
Bell, R. T. (1993), Estimating production of heterotrophic bacterioplanktonvia incorporation of tritiated thymidine, in Handbook of Methods inAquatic Microbial Ecology, edited by P. F. Kemp et al., pp. 495–503,Lewis, Boca Raton, Fla.
Biddanda, B., M. Ogdahl, and J. Cotner (2001), Dominance of bacterialmetabolism in oligotrophic relative to eutrophic waters, Limnol. Ocea-nogr., 46, 730–739.
Billen, G., P. Servais, and S. Becquevort (1990), Dynamics of bacterio-plankton in oligotrophic and eutrophic aquatic environments: Bottom-upor top-down control?, Hydrobiologia, 207, 37 – 42, doi:10.1007/BF00041438.
Borsheim, K. Y. (2000), Bacterial production rates and concentrations oforganic carbon at the end of the growing season in the Greenland Sea,Aquat. Microb. Ecol., 21, 115–123, doi:10.3354/ame021115.
Carlson, C. A., H. W. Ducklow, and T. D. Sleeter (1996), Stocks anddynamics of bacterioplankton in the northwestern Sargasso Sea, DeepSea Res., Part II, 43, 491–515, doi:10.1016/0967-0645(95)00101-8.
Carmack, E. C., R. W. Macdonald, and S. Jasper (2004), Phytoplanktonproductivity on the Canadian Shelf of the Beaufort Sea, Mar. Ecol. Prog.Ser., 277, 37–50, doi:10.3354/meps277037.
Cavalieri, D. J., C. L. Parkinson, and K. Y. Vinnikov (2003), 30-yearsatellite record reveals contrasting Arctic and Antarctic decadal sea icevariability, Geophys. Res. Lett. , 30(18), 1970, doi:10.1029/2003GL018031.
Chin-Leo, G., and D. L. Kirchman (1990), Unbalanced growth in naturalassemblages of marine bacterioplankton, Mar. Ecol. Prog. Ser., 63, 1–8,doi:10.3354/meps063001.
Christy, J. R., R. A. Clarke, G. V. Gruza, J. Jouzel, M. E. Mann,J. Oerlemans, M. J. Salinger, and S.-W. Wang (2001), Observed climatevariability and change, in Climate Change 2001: The Scientific Basis.Contribution of Working Group I to the Third Assessment Report of theIntergovernmental Panel on Climate Change, edited by J. T. Houghton etal., pp. 99–181, Cambridge Univ. Press, New York.
Cole, J. J. (1999), Aquatic microbiology for ecosystem scientists: New andrecycled paradigms in ecological microbiology, Ecosystems, 2, 215–225,doi:10.1007/s100219900069.
Cotner, J. B., and B. A. Biddanda (2002), Small players, large role: Micro-bial influence on biogeochemical processes in pelagic aquatic ecosys-tems, Ecosystems, 5, 105–121, doi:10.1007/s10021-001-0059-3.
Cottrell, M. T., and D. L. Kirchman (2003), Contribution of major bacterialgroups to bacterial biomass production (thymidine and leucine incorpora-tion) in the Delaware estuary, Limnol. Oceanogr., 48, 168–178.
del Giorgio, P., and J. J. Cole (2000), Bacterial energetics and growthefficiency, in Microbial Ecology of the Oceans, edited by D. L.Kirchman, pp. 289–325, Wiley-Liss, New York.
del Giorgio, P. A., J. J. Cole, and A. Cimbleris (1997), Respiration rates inbacteria exceed phytoplankton production in unproductive aquatic sys-tems, Nature, 385, 148–151, doi:10.1038/385148a0.
Dittmar, T. (2004), Evidence for terrigenous dissolved organic nitrogen inthe Arctic deep-sea, Limnol. Oceanogr., 49, 148–156.
Dittmar, T., and G. Kattner (2003), The biogeochemistry of the river andshelf ecosystem of the Arctic Ocean: A review, Mar. Chem., 83, 103–120, doi:10.1016/S0304-4203(03)00105-1.
Ducklow, H. W. (1992), Factors regulating bottom-up control of bacterialbiomass in open ocean plankton communities, Ergeb. Limnol., 37, 207–217.
C07S91 GARNEAU ET AL.: BACTERIAL DYNAMICS IN THE ARCTIC OCEAN
13 of 15
C07S91

Ducklow, H. W. (1999), The bacterial component of the oceanic euphoticzone, FEMS Microbiol. Ecol., 30, 1 – 10, doi:10.1111/j.1574-6941.1999.tb00630.x.
Ducklow, H. W. (2000), Bacterial production and biomass in the oceans, inMicrobial Ecology of the Oceans, edited by D. L. Kirchman, pp. 85–120,Wiley-Liss, New York.
Ducklow, H. W. (2003), Seasonal production and bacterial utilization ofDOC in the Ross Sea, Antarctica, in Biogeochemistry of the Ross Sea,Antarct. Res. Ser., vol. 78, edited by G. R. DiTullio and R. B. Dunbar,pp. 143–157, AGU, Washington, D. C.
Ducklow, H. W., D. L. Kirchman, H. L. Quinby, C. A. Carlson, and H. G.Dam (1993), Stocks and dynamics of bacterioplankton carbon during thespring bloom in the eastern North Atlantic Ocean, Deep Sea Res., Part II,40, 245–263, doi:10.1016/0967-0645(93)90016-G.
Forest, A., M. Sampei, H. Hattori, R. Makabe, H. Sasaki, M. Fukuchi,P. Wassmann, and L. Fortier (2007), Particulate organic carbon fluxeson the slope of the Mackenzie Shelf (Beaufort Sea): Physical and biolo-gical forcing of shelf-basin exchanges, J. Mar. Syst., 68, 39 – 54,doi:10.1016/j.jmarsys.2006.10.008.
Frey, K. E., and L. C. Smith (2005), Amplified carbon release from vastwest Siberian peatlands by 2100, Geophys. Res. Lett., 32, L09401,doi:10.1029/2004GL022025.
Fuhrman, J. A., I. Hewson, M. S. Schwalbach, J. A. Steele, M. V. Brown,and S. Naeem (2006), Annually reoccurring bacterial communities arepredictable from ocean conditions, Proc. Natl. Acad. Sci. U. S. A., 103,13,104–13,109, doi:10.1073/pnas.0602399103.
Galand, P. E., C. Lovejoy, J. Pouliot, and W. F. Vincent (2008), Archaealdiversity in the particle-rich environment of an arctic shelf ecosystem,J. Mar. Syst., doi:10.1016/j.jmarsys.2007.12.001.
Garneau, M.-E., W. F. Vincent, L. Alonso-Saez, Y. Gratton, and C. Lovejoy(2006), Prokaryotic community structure and heterotrophic production ina river-influenced coastal arctic ecosystem, Aquat. Microb. Ecol., 42,27–40, doi:10.3354/ame042027.
Graneli, W., P. Carlsson, and S. Bertilsson (2004), Bacterial abundance,production and organic carbon limitation in the Southern Ocean (39–62�S, 4–14�E) during the austral summer 1997/1998, Deep Sea Res.,Part II, 51, 2569–2582, doi:10.1016/j.dsr2.2001.01.003.
Hoch, M., and D. Kirchman (1993), Seasonal and inter-annual variability inbacterial production and biomass in a temperate estuary, Mar. Ecol. Prog.Ser., 98, 283–295, doi:10.3354/meps098283.
Huntington, H., G. Weller, E. Bush, V. Callaghan, V. M. Kattsov, andM. Nutall (2005), An introduction to the Arctic Climate Impact Assess-ment, in Arctic Climate Impact Assessment, edited by C. Symon, L. Arris,and B. Heal, pp. 2–19, Cambridge Univ. Press, New York.
Kirchman, D. L. (2000), Microbial Ecology of the Oceans, 530 pp., Wiley-Liss, New York.
Kirchman, D. L. (2002), The ecology of Cytophaga–Flavobacteria in aqua-tic environments, FEMS Microbiol. Ecol., 39, 91–100.
Kirchman, D. L., H. Elifantz, A. I. Dittel, R. R. Malmstrom, and M. T.Cottrell (2007), Standing stocks and activity of Archaea and Bacteria inthe western Arctic Ocean, Limnol. Oceanogr., 52, 495–507.
Legendre, P., and L. Legendre (1998), Numerical Ecology, 853 pp., Else-vier, Amsterdam.
Loeng, H., K. Brander, E. Carmark, S. Denisenko, K. Drinkwater, B. Hanse,K. Kovacs, P. Livingston, F. McLaughlin, and E. Sakshaug (2005), Mar-ine systems, in Arctic Climate Impact Assessment, edited by C. Symon,L. Arris, and B. Heal, pp. 453–538, Cambridge Univ. Press, New York.
Longnecker, K., B. F. Sherr, and E. B. Sherr (2006), Variation in cell-specific rates of leucine and thymidine incorporation by marine bacteriawith high and with low nucleic acid content off the Oregon coast, Aquat.Microb. Ecol., 43, 113–125, doi:10.3354/ame043113.
Lovejoy, C., W. F. Vincent, S. Bonilla, S. Roy, M.-J. Martineau, R. Terrado,M. Potvin, R. Massana, and C. Pedros-Alio (2007), Distribution, phylo-geny, and growth of cold-adapted picoprasinophytes in Arctic Seas,J. Phycol., 43, 78–89, doi:10.1111/j.1529-8817.2006.00310.x.
Meon, B., and R. M. W. Amon (2004), Heterotrophic bacterial activity andfluxes of dissolved free amino acids and glucose in the Arctic rivers Ob,Yenisei and the adjacent Kara Sea, Aquat. Microb. Ecol., 37, 121–135,doi:10.3354/ame037121.
Murray, A. E., C. M. Preston, R. Massana, L. T. Taylor, A. Blakis, K. Wu,and E. F. DeLong (1998), Seasonal and spatial variability of bacterial andarchaeal assemblages in the coastal waters near Anvers Island, Antarctica,Appl. Environ. Microbiol., 64, 2585–2595.
Myers, J. L., and A. D. Well (2003), Research Design and StatisticalAnalysis, 2nd ed., 760 pp., Lawrence Erlbaum Assoc., London.
Nusch, E. A. (1980), Comparison of different methods for chlorophyll andphaeopigment determination, Ergeb. Limnol., 14, 14–36.
O’Brien, M. C., R. W. Macdonald, H. Melling, and K. Iseki (2006), Particlefluxes and geochemistry on the Canadian Beaufort Shelf: Implications for
sediment transport and deposition, Cont. Shelf Res., 26, 41 – 81,doi:10.1016/j.csr.2005.09.007.
Ouverney, C. C., and J. A. Fuhrman (2000), Marine planktonic Archaeatake up amino acids, Appl. Environ. Microbiol., 66, 4829 – 4833,doi:10.1128/AEM.66.11.4829-4833.2000.
Parsons, T. R., D. G. Webb, H. Dovey, R. Haigh, M. Lawrence, and G. E.Hopky (1988), Production studies in the Mackenzie River-Beaufort Seaestuary, Polar Biol., 8, 235–239, doi:10.1007/BF00443455.
Parsons, T. R., D. G. Webb, B. E. Rokeby, M. Lawrence, G. E. Hopky, andD. B. Chiperzak (1989), Autotrophic and heterotrophic production in theMackenzie river/Beaufort Sea estuary, Polar Biol., 9, 261 – 266,doi:10.1007/BF00263774.
Pedros-Alio, C., D. Vaque, N. Guixa-Boixereu, and J. M. Gasol (2002),Prokaryotic plankton biomass and heterotrophic production in westernAntarctic waters during the 1995–1996 Austral summer, Deep Sea Res.,Part II, 49, 805–825, doi:10.1016/S0967-0645(01)00125-4.
Peterson, B. J., R. M. Holmes, J. W. McClelland, C. J. Vorosmarty, R. B.Lammers, A. I. Shiklomanov, I. A. Shiklomanov, and S. Rahmstorf(2002), Increasing river discharge to the Arctic Ocean, Science, 298,2171–2173, doi:10.1126/science.1077445.
Pinhassi, J., and A. Hagstrom (2000), Seasonal succession in marine bac-terioplankton, Aquat. Microb. Ecol., 21, 245 – 256, doi:10.3354/ame021245.
Rachold, V., V. Eicken, V. V. Gordeev, M. N. Grigoriev, H.-W. Hubberten,A. P. Lisitzin, V. P. Shevchenko, and L. Schirrmeister (2004), Modernterrigenous organic carbon input to the Arctic Ocean, in The OrganicCarbon Cycle in the Arctic Ocean, edited by R. Stein and R. W.MacDonald, pp. 33–55, Springer, Berlin.
Retamal, L., W. F. Vincent, C. Osburn, and C. Martineau (2007), Compar-ison of the optical properties of dissolved organic matter in two river-influenced coastal regions of the Canadian Arctic, Estuarine CoastalShelf Sci., 72, 261–272, doi:10.1016/j.ecss.2006.10.022.
Rich, J., M. Gosselin, E. Sherr, B. Sherr, and D. L. Kirchman (1997), Highbacterial production, uptake and concentrations of dissolved organic mat-ter in the Central Arctic Ocean, Deep Sea Res., Part II, 44, 1645–1663,doi:10.1016/S0967-0645(97)00058-1.
Rivkin, R. B., M. R. Anderson, and C. Lajzerowicz (1996), Microbialprocesses in cold oceans: I. Relationship between temperature and bac-terial growth rate, Aquat. Microb. Ecol., 10, 243–254, doi:10.3354/ame010243.
Roy, S. (2006), Ecologie hivernale du reseau alimentaire microbien dans leHaut Arctique Canadien, Baie de Franklin, Master’s thesis, 166 pp., Univ.Laval, Quebec, Que., Canada.
Sanders, R. W., D. A. Caron, and U. G. Berninger (1992), Relationshipsbetween bacteria and heterotrophic nanoplankton in marine and freshwaters: An inter-ecosystem comparison, Mar. Ecol. Prog. Ser., 86, 1–14, doi:10.3354/meps086001.
Schauer, M., V. Balague, C. Pedros-Alio, and R. Massana (2003), Seasonalchanges in the taxonomic composition of bacterioplankton in a coastaloligotrophic system, Aquat. Microb. Ecol., 31, 163–174, doi:10.3354/ame031163.
Sherr, B. F., and E. B. Sherr (2003), Community respiration/production andbacterial activity in the upper water column of the central Arctic Ocean,Deep Sea Res., Part I, 50, 529–542, doi:10.1016/S0967-0637(03)00030-X.
Sherr, E. B., B. F. Sherr, P. A. Wheeler, and K. Thompson (2003), Temporaland spatial variation in stocks of autotrophic and heterotrophic microbesin the upper water column of the central Arctic Ocean, Deep Sea Res.,Part I, 50, 557–571, doi:10.1016/S0967-0637(03)00031-1.
Shiah, F.-K., and H. Ducklow (1997), Bacterioplankton growth responsesto temperature and chlorophyll variations in estuaries measured by thy-midine:leucine incorporation ratio, Aquat. Microb. Ecol., 13, 151–159,doi:10.3354/ame013151.
Simon, M., and F. Azam (1989), Protein content and protein synthesis ratesof planktonic marine bacteria, Mar. Ecol. Prog. Ser., 51, 201–213,doi:10.3354/meps051201.
Smith, D. M. (1998), Recent increase in the length of the melt season ofperennial Arctic sea ice, Geophys. Res. Lett., 25, 655–658, doi:10.1029/98GL00251.
Smith, D. C., and F. Azam (1992), A simple, economical method formeasuring bacterial protein synthesis rates in seawater using 3H-leucine,Mar. Microb. Food Webs, 6, 107–114.
Smith, S. V., and J. T. Hollibaugh (1993), Coastal metabolism and theoceanic organic carbon balance, Rev. Geophys. , 31, 75 – 89,doi:10.1029/92RG02584.
Smith, W., and E. Sakshaug (1990), Polar phytoplankton, in Polar Ocea-nography, Part B, Chemistry, Biology and Geology, edited by W. Smith,pp. 477–525, Academic Press, San Diego, Calif.
Steward, G. F., D. C. Smith, and F. Azam (1996), Abundance and produc-tion of bacteria and viruses in the Bering and Chukchi Seas, Mar. Ecol.Prog. Ser., 131, 287–300, doi:10.3354/meps131287.
C07S91 GARNEAU ET AL.: BACTERIAL DYNAMICS IN THE ARCTIC OCEAN
14 of 15
C07S91

Strickland, J. D. H., and T. R. Parsons (1972), A practical handbook ofseawater analysis, Bull. Fish. Res. Board Can., 167, 311 pp.
Telang, S. A., R. Pocklington, A. S. Naidu, E. A. Romankevich, I. I.Gitelson, and M. I. Gladyshev (1991), Carbon and mineral transport inmajor North American, Russian Arctic, and Siberian rivers: The St Lawr-ence, the Mackenzie, the Yukon, the Arctic Alaskan rivers, the ArcticBasin rivers in the Soviet Union, and the Yenisei, in Biogeochemistry ofMajor World Rivers, edited by E. T. Degens, S. Kempe, and J. E. Richey,pp. 75–104, John Wiley, Hoboken, N. J.
Tibbles, B. J. (1996), Effects of temperature on the incorporation of leucineand thymidine by bacterioplankton and bacterial isolates, Aquat. Microb.Ecol., 11, 239–250, doi:10.3354/ame011239.
Vallieres, C., L. Retamal, C. Osburn, and W. F. Vincent (2008), Bacterialproduction and microbial food web structure in a large arctic river and thecoastal Arctic Ocean, J. Mar. Syst., doi:10.1016/j.jmarsys.2007.12.002, inpress.
Vincent, W. F., and J. E. Hobbie (2000), Ecology of Arctic lakes and rivers,in The Arctic: Environment, People, Policy, edited by M. Nuttall and T. V.Callaghan, pp. 197–231, Harwood Acad., London.
Waleron, M., K. Waleron, W. F. Vincent, and A. Wilmotte (2007), Al-lochthonous inputs of riverine picocyanobacteria to coastal waters inthe Arctic Ocean, FEMS Microbiol. Ecol., 59, 356–365, doi:10.1111/j.1574-6941.2006.00236.x.
Walsh, J. E., et al. (2005), Cryosphere and hydrology, in Arctic ClimateImpact Assessment, edited by C. Symon, L. Arris, and B. Heal, pp. 183–242, Cambridge Univ. Press, New York.
Wassmann, P., et al. (2004), Particulate organic carbon flux to the ArcticOcean sea floor, in The Organic Carbon Cycle in the Arctic Ocean, editedby R. Stein and R. W. Macdonald, pp. 101–138, Springer, Berlin.
Wells, L., M. Cordray, S. Bowerman, L. A. Miller, W. F. Vincent, and J. D.Deming (2006), Archaea in particle-rich waters of the Beaufort Shelf andFranklin Bay, Canadian Arctic: Clues to an allochthonous origin?, Lim-nol. Oceanogr., 51, 47–59.
Wrona, F. J., et al. (2005), Freshwater ecosystems and fisheries, in ArcticClimate Impact Assessment, edited by C. Symon, L. Arris, and B. Heal,pp. 353–452, Cambridge Univ. Press, New York.
Zar, J. H. (1999), Biostatistical Analysis, 4th ed., 663 pp., Prentice-Hall,Upper Saddle River, N. J.
�����������������������M.-E. Garneau, Department of Biological Sciences, University of
Southern California, 3616 Trousdale Parkway, AHF301, Los Angeles,CA 90089-0371, USA. ([email protected])Y. Gratton, Centre Eau, Terre et Environnement, Institut National de la
Recherche Scientifique, 490 de la Couronne, Quebec, QC G1K 9A9,Canada.C. Lovejoy, Departement de Biologie and Quebec-Ocean, Universite
Laval, Quebec, QC G1V 0A6, Canada.S. Roy and W. F. Vincent, Departement de Biologie and Centre d’Etudes
Nordiques, Universite Laval, Quebec, QC G1V 0A6, Canada.
C07S91 GARNEAU ET AL.: BACTERIAL DYNAMICS IN THE ARCTIC OCEAN
15 of 15
C07S91