Embed Size (px)
Citation preview

1
ICAR 2008Niagara USA
Gavin Scott16th June 2008
New Zealand – Seasonal Milking and its
challenges in the Laboratory
ICAR 2008Niagara USA
Gavin Scott16th June 2008
Special Thanks
Craig Bell – LIC Testlink Manager
Steve Holdroyd – Fonterra
Paul Jamieson - SAITL

2
ICAR 2008Niagara USA
Gavin Scott16th June 2008
Where is New Zealand?
Total area = 268,680 square Km
Similar in size to the state of Colorado
4 Million People
SAITL Dairy Lab
ICAR 2008Niagara USA
Gavin Scott16th June 2008
New Zealand Dairy Industry – long history
1800’s Dairying in NZ began
1927Amalgamated Dairies established in London to market New Zealand butter and cheese
1930Many towns have dairy factories in New Zealand
1963New Zealand Dairy Board established
1970-1990Dairy factories merged
2000Milk supply by two major companies New Zealand Dairy Group & Kiwi Cooperative Dairies
2001 NZ Dairy Board disbanded.Fonterra formed
1882 SS Dunedin sailed to London with first refrigerated shipment of butter in the world
1909 FirstHerd testing in NZ

3
ICAR 2008Niagara USA
Gavin Scott16th June 2008
New Zealand Dairy Industry
Number of Dairy Companies Operating 1920–2001
0
50
100
150
200
250
300
1920 1930 1940 1950 1960 1970 1980 1990 2000
YEAR
ICAR 2008Niagara USA
Gavin Scott16th June 2008
Current NZ Dairy companies - 2008
Tatua, 1.0%
Synlait, 0.4%
Open country Cheese, 1.7%
NZ Dairy's, 0.4%
Westland, 3.2%
Dairy Trust, 0.4%
Fonterra, 92.9%
4
ICAR 2008Niagara USA
Gavin Scott16th June 2008
Dairy farming in New Zealand
Approx 4 million dairy cows11,500 suppliersAverage herd size approx 350Average kg milksolids per cow approx 33020 Billion litres of milk processed each year
ICAR 2008Niagara USA
Gavin Scott16th June 2008
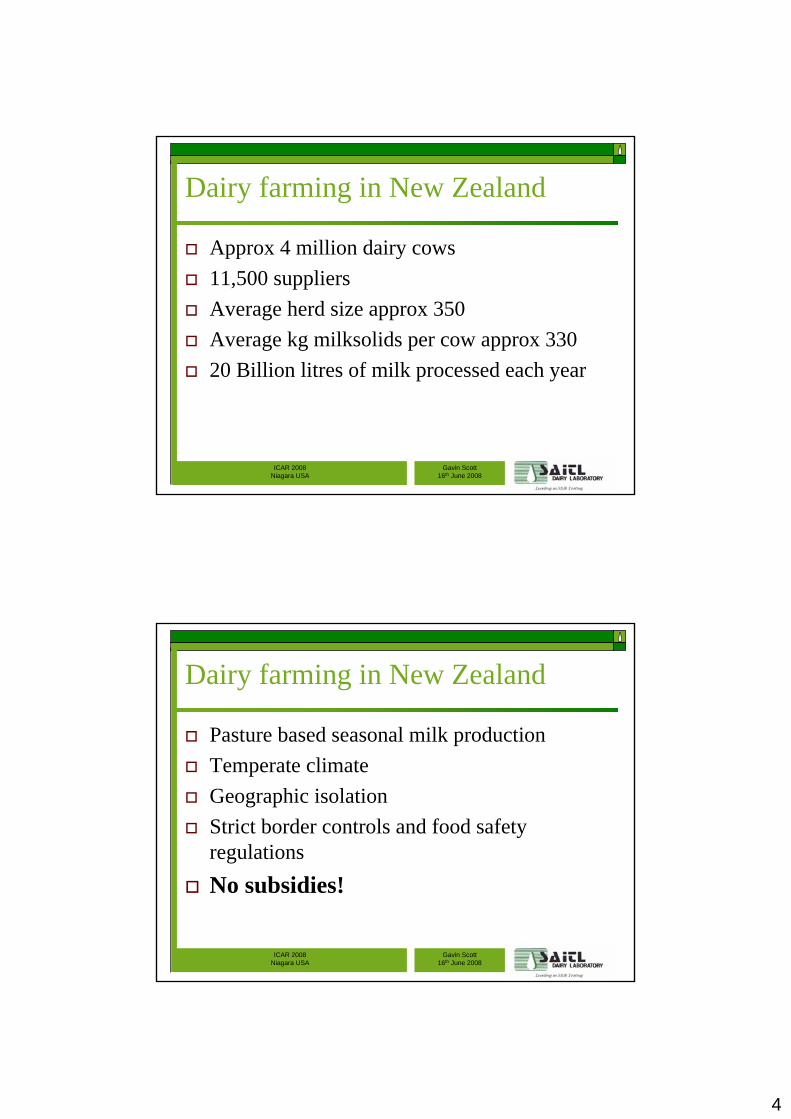
Dairy farming in New Zealand
Pasture based seasonal milk productionTemperate climateGeographic isolationStrict border controls and food safety regulationsNo subsidies!

5
ICAR 2008Niagara USA
Gavin Scott16th June 2008
Seasonal milk flow
Milk flow
ICAR 2008Niagara USA
Gavin Scott16th June 2008
Dairy exports a vital part of NZ economy
Horticulture 6%
Aluminium 4%
Wool/Leather 6%
Fishing 5% Other 32%Dairy 21%
Forestry 12% Meat 14%
Dairy 21%

6
ICAR 2008Niagara USA
Gavin Scott16th June 2008
New Zealand Milk Production
Consumed Domestically
Exported
5%
95%Total New Zealand production is equivalent to 2% of world milk production
Source: Rabobank Global Focus, August 2003
ICAR 2008Niagara USA
Gavin Scott16th June 2008
World Dairy Trade
Fonterra
World
Fonterra provides 40% of all internationally tradable dairy products
40%
60%
Source: Rabobank Global Focus, August 2003

7
ICAR 2008Niagara USA
Gavin Scott16th June 2008
Fonterra’s product mix
Cream Products
Cheese
Powder
ProteinsOther
ICAR 2008Niagara USA
Gavin Scott16th June 2008
World Dairy Access and Tariffs
Access All Products / Low Tariffs (0-30%) Product Specific Access / Medium Tariffs (30-70%)
Product Specific Access / Medium-High Tariffs (70-220%) Only Butter / Cheese / Protein Quota Access / High Tariffs (>220%)

8
ICAR 2008Niagara USA
Gavin Scott16th June 2008
New Zealand Milk Testing Labs
LIC – Testlink DHI herd testing (> 95% NZ market)
SAITL Dairy laboratoryFarmer payment (> 96 % NZ Farmers)DHI under contract to small NZ player (<5% NZ Market)
ICAR 2008Niagara USA
Gavin Scott16th June 2008
LIC – Testlink Labs
LIC is a dairy farmer owned, farm improvement company providing a diverse range of products and services. Test link has two labs
9 CombiFosses in North Island (Hamilton).5 CombiFosses in South Island (Christchurch).
Processes over 9 million samples per year.Runs two shifts – 8 lab staff per shift (40% permanent rest casual)

9
ICAR 2008Niagara USA
Gavin Scott16th June 2008
LIC Laboratory
Test instruments automated with ILAS robots to reduce staff requirements
Pre automation – 3 shifts 15 staff = 45 staff
Now 2 shifts 8 staff = 16 staff
ICAR 2008Niagara USA
Gavin Scott16th June 2008
LIC Test numbersLIC - test numbers 2007/8
0
10000
20000
30000
40000
50000
60000
70000
80000
90000
1/06/0
7
1/07/0
7
31/07
/07
30/08
/07
29/09
/07
29/10
/07
28/11
/07
28/12
/07
27/01
/08
26/02
/08
27/03
/08
26/04
/08
26/05
/08

10
ICAR 2008Niagara USA
Gavin Scott16th June 2008
LIC herd testing
SAITL Dairy Lab
LIC Testlink North
LIC Testlink South
ICAR 2008Niagara USA
Gavin Scott16th June 2008
SAITL Dairy Laboratory
SAITL = South Auckland Independent Testing LaboratoryNon Profit Organisation (Industrial Provident Society).
Provides Farmer Payment services to member Dairy companiesEstablished 1984Current Member companies
FonterraTatua

11
ICAR 2008Niagara USA
Gavin Scott16th June 2008
SAITL Dairy Laboratory
34 Permanent StaffTest samples 365 days per yearApprox 11,000 Farmers tested – including South Island suppliers.5.5 million samples received each year.96% of all Dairy Farmers in New ZealandProvide commercial testing to other Dairy organisations eg. Dairy Goat Co-op, Open Country Cheese, Synlait, NZ Dairies, Dairy Trust, and Ambreed
ICAR 2008Niagara USA
Gavin Scott16th June 2008
Completed transition from screw capped vial to flipcap vial in November 2006Completed transition from Barcode to RFID in April this year.New vial/ RFID enables automation:
Automated opening/ closing of vials on Foss instruments.Enabled RFID reading at pipette on Foss instrumentsAutomated inhibitory testing.
SAITL Dairy Laboratory Developments

12
ICAR 2008Niagara USA
Gavin Scott16th June 2008
Inhibitory Robot
ICAR 2008Niagara USA
Gavin Scott16th June 2008
SAITL Dairy Laboratory - Next steps
2009/10 Automate Plate counting (Coliforms + Thermodurics).
Currently working with a Japanese company who have an automatic plater that meets our requirements.
2009/10 Automate test selection process.Have initial concept drawings from a local automation house.

13
ICAR 2008Niagara USA
Gavin Scott16th June 2008
Payment testing
Fonterra 4 head automatic sampler. Other company’s range from manual dip systems to semi automated systems.
Vials colour coded – clear for quality testing, Green for composition testing. Tanker composite sample is pink.
ICAR 2008Niagara USA
Gavin Scott16th June 2008
S a mpl e s r e c e i v e d 2 0 0 6 / 7
0
2000
4000
6000
8000
10000
12000
Tatua
Fonter r a Upper NI
Fonter r a Lower NI
Fonter r a SI
Total
June May
SAITL Member company testing
Seasonal
Two samples – one for composition analysis and one for milk quality analysis. So at peak getting approx 22,000 samples from our member companies

14
ICAR 2008Niagara USA
Gavin Scott16th June 2008
SAITL - Milk Quality Section
Thermoduric plating
Milk Quality tests done on Regime basis – each
company slightly different
Antibiotic testing Total Bacteria Estimate
Coliform plating
Foreign Matter Testing
Senses testing
IgG testing
DDE Testing
Twice Month Twice MonthOnce Every 4 days
Once every 10 days
Once a Month
Once a Month
Start of season
As requested
Aflatoxin testingAs requested
ICAR 2008Niagara USA
Gavin Scott16th June 2008
Milk quality testingNo of Tests Performed per Day in Quality Section (Milk)
0
500
1000
1500
2000
2500
3000
3500
4000
4500
5000
5500
6000
6500
7000
7500
8000
8500
9000
9500
1 16 31 46 61 76 91 106 121 136 151 166 181 196 211 226 241
256
271
286
301
316
331
346
361
2005/20062006/20072007/2008
June
Drought 2007/8
May

15
ICAR 2008Niagara USA
Gavin Scott16th June 2008
Screening for Inhibitory Substances
Samples placed into 8x12 matrixPlated onto Copan milk test by robotic system
ICAR 2008Niagara USA
Gavin Scott16th June 2008
Copan Testing Plate
Negative Control
0.003IU Control
0.006IU Control

16
ICAR 2008Niagara USA
Gavin Scott16th June 2008
Confirmation Testing
Plated on both Delvo and Copan.Must be positive on both before we issue a positive gradeAlso plated with penase to confirm Beta-Lactam.If not Beta-Lactam then carry out other confirmatory tests.Also tested on Bacillus Stearothermophilus Disk Assay (BSDA) plate for est. concentration.
ICAR 2008Niagara USA
Gavin Scott16th June 2008
BSDA Plate
Before Incubation
After Incubation

17
ICAR 2008Niagara USA
Gavin Scott16th June 2008
What do the Inhib Grades Mean
Grades issued based on estimation of concentration0.003 – 0.006 IU/ml = 12 demerits 60%
0.006 – 0.01 IU/ml = 50 demerits 250%
0.01 – 0.03 IU/ml = 50 demerits 250%
>0.03 IU/ml = 100 demerits 500%
Plus consequential loss.
Less than 0.05% of samples tested are confirmed as positive. Most of these are still below MRL (0.006
IU/ml).
ICAR 2008Niagara USA
Gavin Scott16th June 2008
Challenges - Antibiotic testing
End of season and start of season higher risk.due to higher incidence of mastitis at end of season, anduse of dry cow therapy over the off season.
Dairy companies manage their risk at these times by increasing testing at the start and end of season – eg. daily testing of all samples for antibiotics.

18
ICAR 2008Niagara USA
Gavin Scott16th June 2008
Challenges - Antibiotic testing
This extra testing at start/end of season has historically meant hiring extra labour resource to help do the plating.Last season the inhibitory test was automated thus eliminating the need for this extra labourresource.
ICAR 2008Niagara USA
Gavin Scott16th June 2008
Total Bacterial Estimate - Bactoscan
3x Foss BactoscanProcess 150 samples an hourReplaces reference test that takes 72 hours.Calibration samples taken daily for SPC.
19
ICAR 2008Niagara USA
Gavin Scott16th June 2008
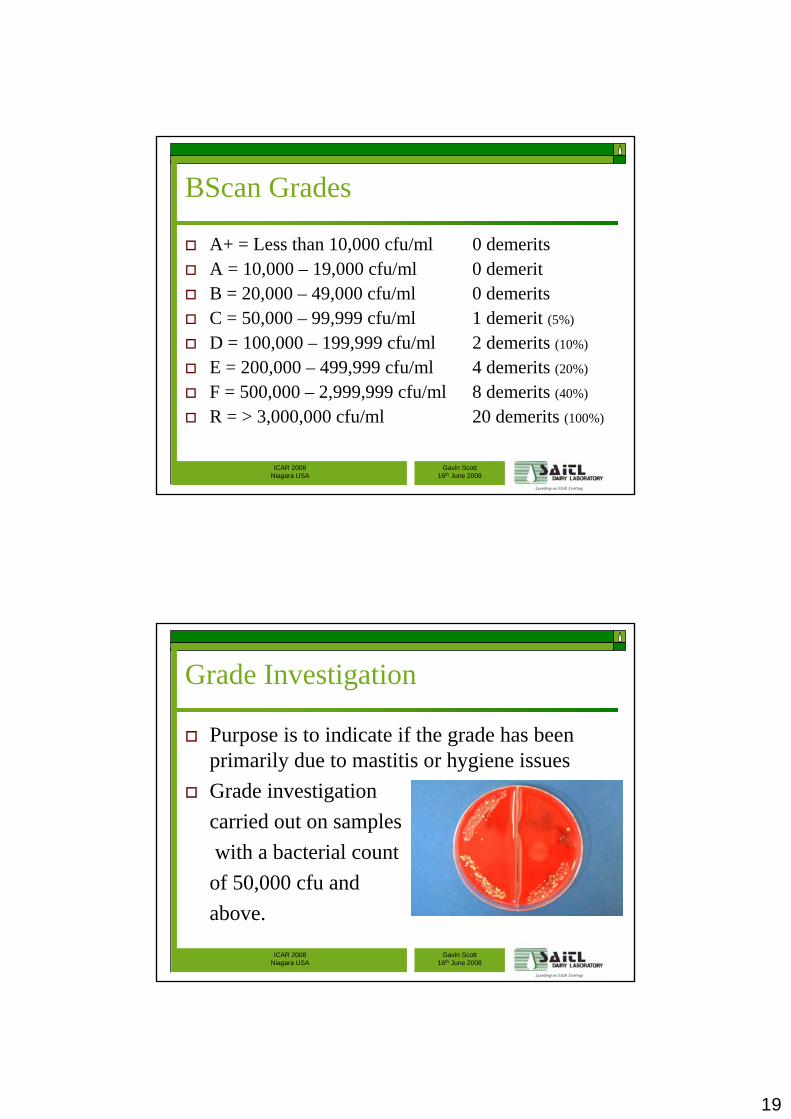
BScan Grades
A+ = Less than 10,000 cfu/ml 0 demeritsA = 10,000 – 19,000 cfu/ml 0 demeritB = 20,000 – 49,000 cfu/ml 0 demeritsC = 50,000 – 99,999 cfu/ml 1 demerit (5%)
D = 100,000 – 199,999 cfu/ml 2 demerits (10%)
E = 200,000 – 499,999 cfu/ml 4 demerits (20%)
F = 500,000 – 2,999,999 cfu/ml 8 demerits (40%)
R = > 3,000,000 cfu/ml 20 demerits (100%)
ICAR 2008Niagara USA
Gavin Scott16th June 2008
Grade Investigation
Purpose is to indicate if the grade has been primarily due to mastitis or hygiene issuesGrade investigation carried out on sampleswith a bacterial count
of 50,000 cfu and above.

20
ICAR 2008Niagara USA
Gavin Scott16th June 2008
Thermoduric Testing
Thermoduric organism is any organism that will survive pasteurization 72°C for 15 sec or 62.8°C for 30 minsSample added to petri dishand agar added.Incubated for72 hours at 30°C
ICAR 2008Niagara USA
Gavin Scott16th June 2008
Thermoduric Grades
Less than 1,500 0 Demerits1,500 – 4,999 1 demerit (5%)
5,000 – 59,999 4 demerits (20%)
>60,000 20 demerits (100%)
Spreader – a single organism has taken overNormally an indicator of
A build up of milk stone within the plant. Perished rubber ware.Or may be due to environmental sources.

21
ICAR 2008Niagara USA
Gavin Scott16th June 2008
Spreader
Spreader – a single organism has taken over
ICAR 2008Niagara USA
Gavin Scott16th June 2008
Thermoduric Grades
Spore Forming OrganismsIndicated if above 50% of total count on plate.Identified by morphology.Can be an indication of poor quality silage.Normally a Bacillus species.

22
ICAR 2008Niagara USA
Gavin Scott16th June 2008
Spore Forming Organisms
ICAR 2008Niagara USA
Gavin Scott16th June 2008
Coliform Testing
Samples tested for presence of total ColiformsUse selective mediaie VRBAIncubated at 30°Cfor 24 hours

23
ICAR 2008Niagara USA
Gavin Scott16th June 2008
Coliform Testing
ICAR 2008Niagara USA
Gavin Scott16th June 2008
Coliform Grades
Less than 499 cfu/ml 0 Demerits500 – 999 cfu/ml 1 Demerit (5%)
1000 – 1,999 cfu/ml 2 demerit (10%)
>2000 cfu/ml 4 demerit (20%)
Normally an indicator of faecal contamination or poor hygiene (eg. no hot wash or chemical clean).Characteristic slimy bio-film build up in the Dairy plant with a distinctive odour.

24
ICAR 2008Niagara USA
Gavin Scott16th June 2008
Organoleptic Testing
Visually Inspect Milk (physical defects egblood)Smell the Milk and identify off taints.Final Grade result of consensus between 2 or more testers on senses panel.
ICAR 2008Niagara USA
Gavin Scott16th June 2008
Organoleptic Grades
Grades cover a range of sensory defects. Including:
Cowy, Fishy, Feedy, Skatol, SourIn all cases they smell like they are describedCan also pick up Kiwifruit, Turnips and other feed taints.

25
ICAR 2008Niagara USA
Gavin Scott16th June 2008
Foreign matter
Milk Sample passed through a filter (Lintenepad). Residue analysed.Normally find partly digested plant matter, sand, grit, animal hairsNormally indicates that the filter sock is ruptured or full, or that the vat is open.
ICAR 2008Niagara USA
Gavin Scott16th June 2008
Grading rates (Fonterra)
% Finest (on per test basis)
97.5
95.8
8
92.7
2
97.2
7 99.9
3
97.6
8
95.6
9
91.1
2
96.1
6
99.9
3
86
88
90
92
94
96
98
100
102
Bactoscan Coliform Thermoduric Somatic CellCount
InhibitorySubstance
Test type
060707/08
<50,000 <500 <1,500 <400,000 <0.003

26
ICAR 2008Niagara USA
Gavin Scott16th June 2008
Component test numbersNo of Tests Performed per Day for Composition (Milk)
0
1000
2000
3000
4000
5000
6000
7000
8000
9000
10000
11000
12000
13000
1-Jun
15-Ju
n
29-Ju
n13
-Jul
27-Ju
l
10-A
ug
24-A
ug7-S
ep
21-S
ep5-O
ct
19-O
ct2-N
ov
16-N
ov
30-N
ov
14-D
ec
28-D
ec
11-Ja
n
25-Ja
n8-F
eb
22-Feb
7-Mar
21-M
ar4-A
pr
18-A
pr
2-May
16-M
ay
30-M
ay
2005/20062006/20072007/2008
Drought 2007/8
June May
ICAR 2008Niagara USA
Gavin Scott16th June 2008
SAITL Composition testing
5 CombiFoss instruments – payment2 x FT6000 + 3 x MSC4000 (1 x FT600+ on way)
2 CombiFoss (MSC 4000) instruments - DHITest Fat, Protein, Lactose, Total Solids, Somatic Cells, Freezing Point on all composition samples received.NZ Dairy companies tend to payout on “Milk Solids” (ie Fat + Protein).

27
ICAR 2008Niagara USA
Gavin Scott16th June 2008
SAITL Composition testing
ICAR 2008Niagara USA
Gavin Scott16th June 2008
Challenges - Resources
Need to have enough test equipment and labour to meet requirements at peak.
Very inefficient use of resources!!For example the lab needs 5 CombiFoss instruments at peak to do 12,000 testsHowever in the off season when we are doing 800 tests only need 1 instrument for a couple of hours.

28
ICAR 2008Niagara USA
Gavin Scott16th June 2008
Challenges – Milk composition
The composition of the milk changes throughout the season.
Calibration issues – milk matrix changes through season and also season to season.Lactation issues – eg start of season potential Colostrum contamination.Unexpected matrix issues due to environmental effects – eg Drought, flooding etc.
ICAR 2008Niagara USA
Gavin Scott16th June 2008
Milk Composition - Fat
Average of Fat TestsUpper North Island Suppliers
4
4.5
5
5.5
6
6.5
01 Ju
n
15 Ju
n
29 Ju
n13
Jul
27 Ju
l
10 A
ug
24 A
ug
07 S
ep
21 S
ep
05 O
ct
19 O
ct
02 N
ov
16 N
ov
30 N
ov
14 D
ec
28 D
ec
11 Ja
n
25 Ja
n
08 Feb
22 Feb
07 M
ar
21 M
ar
04 A
pr
18 A
pr
02 M
ay
16 M
ay
30 M
ay
2004/2005
2005/2006
2006/2007
2007/2008

29
ICAR 2008Niagara USA
Gavin Scott16th June 2008
Milk Composition – Crude Protein
Average of Protein TestsUpper North Island Suppliers
3
3.5
4
4.5
01 Ju
n
15 Ju
n
29 Ju
n13
Jul
27 Ju
l
10 A
ug
24 A
ug
07 S
ep
21 S
ep
05 O
ct
19 O
ct
02 N
ov
16 N
ov
30 N
ov
14 D
ec
28 D
ec
11 Ja
n
25 Ja
n
08 F
eb
22 F
eb
07 M
ar
21 M
ar
04 A
pr
18 A
pr
02 M
ay
16 M
ay
30 M
ay
2004/2005
2005/2006
2006/2007
2007/2008
ICAR 2008Niagara USA
Gavin Scott16th June 2008
Milk Composition - Lactose
Average of Lactose TestsUpper North Island
4
4.5
5
5.5
01 Ju
n
15 Ju
n
29 Ju
n13
Jul
27 Ju
l
10 A
ug
24 A
ug
07 S
ep
21 S
ep
05 O
ct
19 O
ct
02 N
ov
16 N
ov
30 N
ov
14 D
ec
28 D
ec
11 Ja
n
25 Ja
n
08 Fe
b
22 Fe
b
07 M
ar
21 M
ar
04 A
pr
18 A
pr
02 M
ay
16 M
ay
30 M
ay
2004/2005
2005/2006
2006/2007
2007/2008

30
ICAR 2008Niagara USA
Gavin Scott16th June 2008
Milk Composition
Average of Total Solids TestsUpper North Island
12.0
12.5
13.0
13.5
14.0
14.5
15.0
15.5
16.0
01 Ju
n
15 Ju
n
29 Ju
n13
Jul
27 Ju
l
10 A
ug
24 A
ug
07 S
ep
21 S
ep
05 O
ct
19 O
ct
02 N
ov
16 N
ov
30 N
ov
14 D
ec
28 D
ec
11 Ja
n
25 Ja
n
08 Feb
22 Feb
07 M
ar
21 M
ar
04 Apr
18 Apr
02 M
ay
16 M
ay
30 M
ay
2004/2005
2005/2006
2006/2007
2007/2008
ICAR 2008Niagara USA
Gavin Scott16th June 2008
Milk Composition – Somatic Cells
Average of Somatic Cell CountsUpper North Island
100,000
200,000
300,000
400,000
01 Ju
n
15 Ju
n
29 Ju
n13
Jul
27 Ju
l
10 A
ug
24 A
ug
07 S
ep
21 S
ep
05 O
ct
19 O
ct
02 N
ov
16 N
ov
30 N
ov
14 D
ec
28 D
ec
11 Ja
n
25 Ja
n
08 Feb
22 Feb
07 M
ar
21 M
ar
04 A
pr
18 A
pr
02 M
ay
16 M
ay
30 M
ay
2004/2005
2005/2006
2006/2007
2007/2008

31
ICAR 2008Niagara USA
Gavin Scott16th June 2008
Questions?
ICAR 2008Niagara USA
Gavin Scott16th June 2008
A word from our sponsors