Embed Size (px)
Citation preview
OPEN
ORIGINAL ARTICLE
Seasonal dynamics of active SAR11 ecotypesin the oligotrophic Northwest Mediterranean Sea
Ian Salter1,2,3, Pierre E Galand2,4, Sonja K Fagervold2,4,5, Philippe Lebaron2,5,Ingrid Obernosterer2,3, Matthew J Oliver6, Marcelino T Suzuki2,5 and Cyrielle Tricoire2
1Alfred-Wegener-Institute for Polar and Marine Research, Bremerhaven, Germany; 2Sorbonne Universites,UPMC Univ Paris 06, Observatoire Oceanologique, Banyuls-Sur-Mer, France; 3CNRS, UMR 7621, LOMIC,Observatoire Oceanologique, Banyuls-Sur-Mer, France; 4CNRS, UMR 8222, LECOB, ObservatoireOceanologique, Banyuls-Sur-Mer, France; 5CNRS, USR 3579, LBBM, Observatoire Oceanologique,Banyuls-Sur-Mer, France and 6School of Marine Science and Policy, University of Delaware, Lewes, DE, USA
A seven-year oceanographic time series in NW Mediterranean surface waters was combined withpyrosequencing of ribosomal RNA (16S rRNA) and ribosomal RNA gene copies (16S rDNA) to examinethe environmental controls on SAR11 ecotype dynamics and potential activity. SAR11 diversityexhibited pronounced seasonal cycles remarkably similar to total bacterial diversity. The timing ofdiversity maxima was similar across narrow and broad phylogenetic clades and strongly associatedwith deep winter mixing. Diversity minima were associated with periods of stratification that were lowin nutrients and phytoplankton biomass and characterised by intense phosphate limitation (turnovertimeo5 h). We propose a conceptual framework in which physical mixing of the water columnperiodically resets SAR11 communities to a high diversity state and the seasonal evolution ofphosphate limitation competitively excludes deeper-dwelling ecotypes to promote low diversity statesdominated (480%) by SAR11 Ia. A partial least squares (PLS) regression model was developed thatcould reliably predict sequence abundances of SAR11 ecotypes (Q2¼ 0.70) from measuredenvironmental variables, of which mixed layer depth was quantitatively the most important.Comparison of clade-level SAR11 rRNA:rDNA signals with leucine incorporation enabled us topartially validate the use of these ratios as an in-situ activity measure. However, temporal trends in theactivity of SAR11 ecotypes and their relationship to environmental variables were unclear. The strongand predictable temporal patterns observed in SAR11 sequence abundance was not linked tometabolic activity of different ecotypes at the phylogenetic and temporal resolution of our study.The ISME Journal (2015) 9, 347–360; doi:10.1038/ismej.2014.129; published online 19 September 2014
Introduction
An important goal in microbial oceanography is tolink the extensive diversity of marine bacteria(Venter et al., 2004; Sogin et al., 2006) to environ-mental conditions (Morris et al., 2005; Fuhrmanet al., 2006; Gilbert et al., 2012), ecosystem function(Fuhrman, 2009; Galdos et al., 2011) and climatesensitivity (Eiler et al., 2009; Giovannoni andVergin, 2012). Combined time-series of microbialcommunity diversity and oceanographic parametershave emerged as a useful approach to understandhow prokaryotic communities are distributed acrossecological niches (Carlson et al., 2009; Hugoni et al.,2013). Temporal dynamics of marine bacteria over
short timescales are reasonably well studied andstrong seasonal transitions in community structureare evident across different environments (Alonso-Saez et al., 2007; Campbell et al., 2009; Lami et al.,2009). However, there are few extended microbialtime-series (44 years), which are necessary toestablish predictable and statistically robust pat-terns in microbial community dynamics.
The long-term microbial studies conducted todate have revealed annually recurring patterns ofsurface bacterial communities. In Californian coastalwaters these patterns can be reliably predicted fromseasonality in environmental parameters (Fuhrmanet al., 2006; Chow et al., 2013). In the Sargasso Seabacterial dynamics exhibit a strong seasonal compo-nent that appears to be driven by convective over-turning (Morris et al., 2005; Carlson et al., 2009;Treusch et al., 2009). Repeatable seasonality inbacterial diversity is also evident from the WesternEnglish Channel (Gilbert et al., 2012) and appears tobe a general feature common of mid- to high-latitudeenvironments (Ladau et al., 2013). Although seasonal
Correspondence: I Salter, Alfred-Wegener-Institute, HelmholtzCentre for Polar and Marine Research, Am Handelshafen 12,D-27570 Bremerhaven, Germany.E-mail: [email protected] 28 March 2014; revised 29 May 2014; accepted 5 June2014; published online 19 September 2014
The ISME Journal (2015) 9, 347–360& 2015 International Society for Microbial Ecology All rights reserved 1751-7362/15
www.nature.com/ismej
cycles of bacterial diversity are an emerging para-digm in microbial oceanography, the factors con-trolling these cycles and their significance forecosystem function are poorly understood. Further-more, it is unknown whether seasonality in themetabolic activity of different bacterioplanktonclades follow similar cycles.
Estimating the metabolic activity of phylogeneti-cally defined bacteria from mixed communities ischallenging. Ribosomal RNA (rRNA) is commonlyused to characterise active microbial populations(Troussellier et al., 2002; Gentile et al., 2006) andthe frequently observed discrepancies in profiles ofrRNA and ribosomal RNA genes (rDNA; Moessenderet al., 2001; Lami et al., 2009) have been interpretedto represent different metabolic states (Treuschet al., 2009; Brettar et al., 2011). The basis of thisapproach is the observation that cell ribosomecontent increases with growth rate (DeLong et al.,1989; Fegatella et al., 1998; Kerkhoff and Kemp,1999). More recent application of this principle hasused rRNA/rDNA ratios as an in-situ proxy forgrowth/activity rates (Campbell et al., 2011;Campbell and Kirchman, 2013; Hunt et al., 2013).
Owing to the association of particular metabolicactivities to certain clades, changes in the activity ofspecific, and in particular dominant, bacterialcommunities have the potential to affect oceancarbon and nutrient cycling. In this context theSAR11 clade of the Alphaproteobacteria is ofparticular interest because it is a dominant compo-nent of marine bacteria (Morris et al., 2002).Ubiquitously distributed throughout the ocean(Giovannoni and Rappe, 2000) SAR11 typicallyaccounts for 15–35% of all prokaryotic plankton(Malmstrom et al., 2005, 2007; Lefort and Gasol,2013). Furthermore, SAR11 are known to take up avariety of monomeric substrates including aminoacids, glucose, ATP and dimethylsulfoniopropio-nate (Malmstrom et al., 2004; Alonso-Saez andGasol, 2007; Laghdass et al., 2012), and appears tobe an important organism for a variety of biogeo-chemical functions. In oligotrophic environmentssuch as the NW Mediterranean Sea, SAR11 candominate bacterial production. Contributionstowards total leucine assimilation may reach 60–70% in nutrient-limited summer months (Laghdasset al., 2010, 2012). The apparent importance ofSAR11 to ecosystem function in oligotrophic envir-onments may stem from adaptations to low substrateconditions: a streamlined genome (Giovannoni et al.,2005a; Grote et al., 2012) and the use of light-harvesting proteorhodopsins (Giovannoni et al.,2005b) may convey significant ecological advantages.
Despite these important generalisations concern-ing the abundance and activity of SAR11 as a clade,it is a diverse group (Field et al., 1997; Garcia-Martinez and Rodriguez-Valera, 2000; Suzuki et al.,2001; Brown and Fuhrman, 2005) comprisedof multiple sub-clades (Morris et al., 2005;Rusch et al., 2007; Brown et al., 2012). 16S rRNA
gene sequencing and molecular fingerprintingapproaches have shown SAR11 sub-clades to bepartitioned by season, depth and biome (Field et al.,1997; Garcia-Martinez and Rodriguez-Valera, 2000;Stingl et al., 2007; Carlson et al., 2009; Beman et al.,2011; Brown et al., 2012). This ecological nicheseparation of SAR11 sub-groups Ia, Ib and II, led totheir classification as ecotype-like clades, withpotential for fine-scale phylogenetic structurewithin these groups (Vergin et al., 2013a). The cleartemporal and spatial patterns observed amongSAR11 communities are thought to result from thevariable response of specific ecotypes to differentenvironmental conditions (Beman et al., 2011;Carlson et al., 2009; Brown et al., 2012). However,there are no direct attempts to link seasonal trendsin SAR11 ecotype abundance and activity over anextended microbial time-series. To understand therole of these clades in microbial community assem-bly and ecosystem function (Koeppel et al., 2008) itis necessary to differentiate patterns of abundanceand activity in SAR11 ecotypes.
In the present study we sequenced rRNA genes(named rDNA hereafter) and rRNA of surfacebacterial communities from a 7-year time-series atmonthly resolution in the NW Mediterranean. Short-term (o2 years) studies in coastal waters of the NWMediterranean have shown important seasonal tran-sitions among bacterial communities and generalsignificance of the entire SAR11 clade (Schauer et al.,2003; Alonso-Saez et al., 2007; Lami et al., 2009).The aim of the current study was to characterise theseasonal dynamics of SAR11 diversity and ecotyperelative abundance and activity at an offshore site.Our main objectives were to determine (i) if totalbacterial diversity and that within the SAR11 cladevaries seasonally (ii) if dominant ecotypes showspecific seasonal patterns in relative abundance and(iii) whether certain biogeochemical parameters con-strain ecotype abundance and activity.
Materials and methods
SamplingSurface seawater (3–5 m) was collected at the Micro-bial Observatory of the Laboratoire Arago located at471270136 N, 031320360 E in the North-West Mediter-ranean. Samples were collected approximately everymonth from July 2004 to April 2011. Occasionallysamples were not collected due to poor weatherconditions. Full sampling details are given inSupplementary Information and exact sampling datesare summarised in Supplementary Table 1. Depthprofiles of conductivity, temperature and pressurewere obtained with a Sea Bird SBE 19 profiler.
Chemical and physical data
Nutrients. Concentrations of nitrate, nitrite, phos-phate and silicate were measured with a Skalar
SAR11 ecotype dynamics in NW MediterraneanI Salter et al
348
The ISME Journal
auto-analyser following a previously described pro-tocol (Treguer and Le Corre, 1975).
Ammonium. Dissolved ammonium was measuredby spectrophotometry at 630 nm following conver-sion to indophenol via a monochloroamine inter-mediate (Solorzano, 1969).
Chlorophyll. One litre of seawater was collected ona GF/F filter at low pressure (o0.2 bar). Measure-ments were conducted according to previouslypublished protocols (Yentsch and Menzel, 1963;Strickland and Parsons, 1997). Extended protocoldetails can be found in Supplementary Information.
Mixed layer depth (MLD). Raw seabird data wereprocessed to bin temperature and salinity data at0.25 m intervals. MLD is based on a 0.1 1C and/or0.02-sigma difference from a reference threshold(typically an average of the upper 3 m).
Microbial abundancesUnfiltered seawater samples were fixed at a finalconcentration of 1% glutaraldehyde, incubated for15 min at ambient temperature in the dark, frozen inliquid nitrogen and stored at � 80 1C. Cytometryanalyses were performed on a Becton DickinsonFacsCalibur. Full details of preparation andanalysis of cytometry samples can be found inSupplementary Information.
Microbial rate measurements
Bacterial heterotrophic production. The incorpora-tion of 3H-leucince was measured using thecentrifugation method (Smith and Azam, 1992;Kirchman, 1993). Extended protocol details can befound in Supplementary Information.
SAR11 bacterial production. To determine bacter-ial production by SAR11 cells, fluorescence in-situhybridisation was coupled with microautoradio-graphy (MICRO-CARD-FISH). Identical to measure-ments for bulk bacteria, tritiated leucine was used asa precursor for SAR11 bacterial production (forexample, Laghdass et al., 2012). Extended protocoldetails can be found in Supplementary Information.
Phosphate turnover. These measurements wereperformed during 2012 at a location in the NWMediterranean in close proximity (421310N, 031110E)to station Microbial Observatory of the LaboratoireArago (471270N, 031320E). The turnover of phosphateby microbial populations was determined using aconcentration series bioassay (Wright and Hobbie,
1966; Zubkov et al., 2007). Extended protocol detailscan be found in Supplementary Information.
Nucleic acid extraction, reverse transcription-PCR andpyrosequencingThe extraction of nucleic acids (DNA and RNA) wasperformed according to a previously publishedmethod (West et al., 2008). A combination ofmechanic (freeze-thaw) and enzymatic cell lysistechniques were applied directly to Sterivex car-tridges, followed by extraction using an AllPrepDNA/RNA kit (Qiagen, Venlo, Netherlands). TheRNA samples were tested for the presence ofcontaminating genomic DNA by PCR and thenreverse-transcribed with random primers using theSuperScript III Reverse Transcriptase kit (Invitrogen,Carlsbad, CA, USA). We are unable to account forpotential biases associated with reverse transcrip-tion efficiency and RNA secondary structure withinthe present data set. The amplification of the V1–V3region of the 16S rRNA gene was performed withuniversal bacterial primers 28F (50-TTTGATCNTGGCTCAG-30) and 519R (50-GTNTTACNGCGGCKGCTG-30), followed in pyrosequencing in a commerciallaboratory (Research and Testing Laboratory,Lubbock, TX, USA) using a Roche 454 GS-FLXsystem (Roche, Basel, Switzerland) with titaniumchemistry. All sequences have been submitted tothe sequence read archive under the Bioprojectaccession number: PRJNA235253.
Sequence data analysesSequences were analysed as previously described(Blanquer et al., 2013). Briefly, the reads were firstfiltered by removing low quality reads and subse-quently trimmed to remove those with X3% of baseswith Phred values o27 (0.2% per-base error prob-ability). This is recommended to ensure that whenclustering at 97% the influence of erroneous reads isminimised (Huse et al., 2010; Kunin et al., 2010).Sequences were then clustered at a 97% thresholdusing Uclust algorithm (Edgar, 2010) and eachoperational taxonomic unit (OTU) classified bycomparison to the Greengenes database (DeSantiset al., 2006). Sequence analyses were conducted withPyrotagger (Kunin and Hugenholtz, 2010).
A phylogenetic tree was constructed withthe sequence representatives of the abundantSAR11 OTUs (o0.2%). Sequences included inthe tree were deposited in GenBank underaccession numbers KJ094527–KJ094552. Representativesequences for each OTU together were aligned usingMUSCLE (Edgar, 2004) and phylogenetic analyseswere completed with the programme PHYLIP(Felsenstein, 2008). DNADIST was used to calculategenetic distances using a Kimura-2 model. Thedistance tree was estimated with the phylogeneticalgorithm FITCH in the PHYLIP programme.
SAR11 ecotype dynamics in NW MediterraneanI Salter et al
349
The ISME Journal
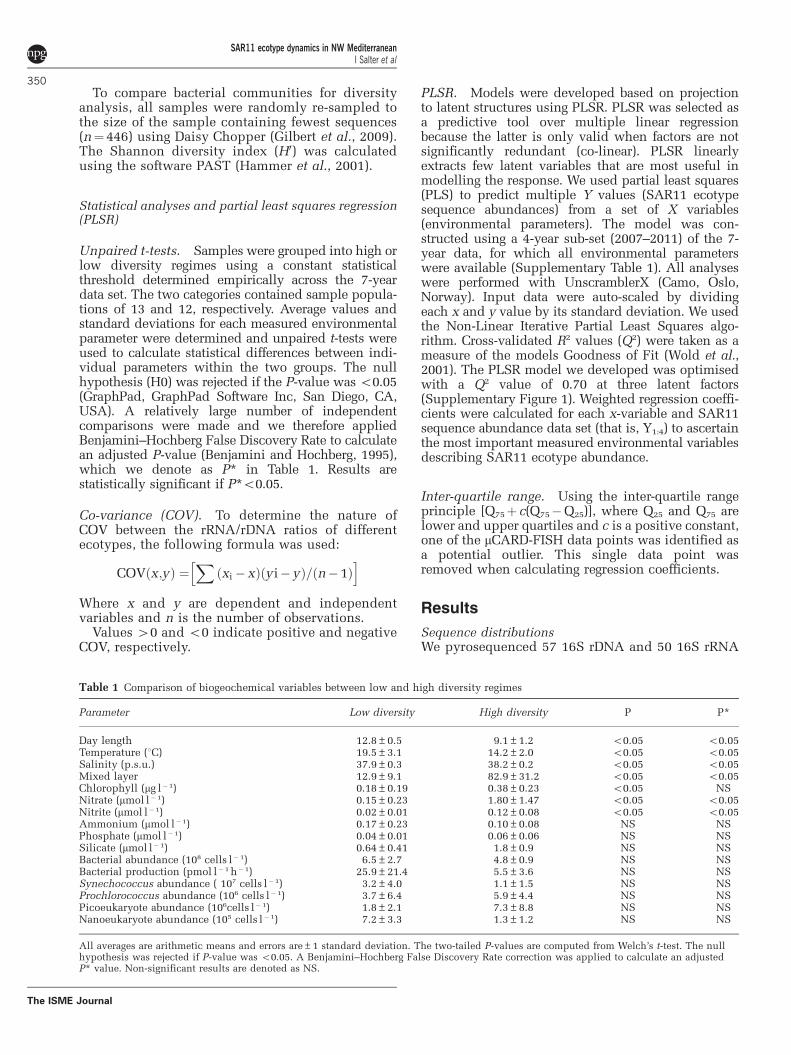
To compare bacterial communities for diversityanalysis, all samples were randomly re-sampled tothe size of the sample containing fewest sequences(n¼ 446) using Daisy Chopper (Gilbert et al., 2009).The Shannon diversity index (H0) was calculatedusing the software PAST (Hammer et al., 2001).
Statistical analyses and partial least squares regression(PLSR)
Unpaired t-tests. Samples were grouped into high orlow diversity regimes using a constant statisticalthreshold determined empirically across the 7-yeardata set. The two categories contained sample popula-tions of 13 and 12, respectively. Average values andstandard deviations for each measured environmentalparameter were determined and unpaired t-tests wereused to calculate statistical differences between indi-vidual parameters within the two groups. The nullhypothesis (H0) was rejected if the P-value was o0.05(GraphPad, GraphPad Software Inc, San Diego, CA,USA). A relatively large number of independentcomparisons were made and we therefore appliedBenjamini–Hochberg False Discovery Rate to calculatean adjusted P-value (Benjamini and Hochberg, 1995),which we denote as P* in Table 1. Results arestatistically significant if P*o0.05.
Co-variance (COV). To determine the nature ofCOV between the rRNA/rDNA ratios of differentecotypes, the following formula was used:
COVðx;yÞ ¼Xðxi� xÞðyi� yÞ=ðn� 1Þ
h i
Where x and y are dependent and independentvariables and n is the number of observations.
Values 40 and o0 indicate positive and negativeCOV, respectively.
PLSR. Models were developed based on projectionto latent structures using PLSR. PLSR was selected asa predictive tool over multiple linear regressionbecause the latter is only valid when factors are notsignificantly redundant (co-linear). PLSR linearlyextracts few latent variables that are most useful inmodelling the response. We used partial least squares(PLS) to predict multiple Y values (SAR11 ecotypesequence abundances) from a set of X variables(environmental parameters). The model was con-structed using a 4-year sub-set (2007–2011) of the 7-year data, for which all environmental parameterswere available (Supplementary Table 1). All analyseswere performed with UnscramblerX (Camo, Oslo,Norway). Input data were auto-scaled by dividingeach x and y value by its standard deviation. We usedthe Non-Linear Iterative Partial Least Squares algo-rithm. Cross-validated R2 values (Q2) were taken as ameasure of the models Goodness of Fit (Wold et al.,2001). The PLSR model we developed was optimisedwith a Q2 value of 0.70 at three latent factors(Supplementary Figure 1). Weighted regression coeffi-cients were calculated for each x-variable and SAR11sequence abundance data set (that is, Y1:4) to ascertainthe most important measured environmental variablesdescribing SAR11 ecotype abundance.
Inter-quartile range. Using the inter-quartile rangeprinciple [Q75þ c(Q75�Q25)], where Q25 and Q75 arelower and upper quartiles and c is a positive constant,one of the mCARD-FISH data points was identified asa potential outlier. This single data point wasremoved when calculating regression coefficients.
Results
Sequence distributionsWe pyrosequenced 57 16S rDNA and 50 16S rRNA
Table 1 Comparison of biogeochemical variables between low and high diversity regimes
Parameter Low diversity High diversity P P*
Day length 12.8±0.5 9.1±1.2 o0.05 o0.05Temperature (1C) 19.5±3.1 14.2±2.0 o0.05 o0.05Salinity (p.s.u.) 37.9±0.3 38.2±0.2 o0.05 o0.05Mixed layer 12.9±9.1 82.9±31.2 o0.05 o0.05Chlorophyll (mg l�1) 0.18±0.19 0.38±0.23 o0.05 NSNitrate (mmol l�1) 0.15±0.23 1.80±1.47 o0.05 o0.05Nitrite (mmol l�1) 0.02±0.01 0.12±0.08 o0.05 o0.05Ammonium (mmol l�1) 0.17±0.23 0.10±0.08 NS NSPhosphate (mmol l� 1) 0.04±0.01 0.06±0.06 NS NSSilicate (mmol l�1) 0.64±0.41 1.8±0.9 NS NSBacterial abundance (108 cells l� 1) 6.5±2.7 4.8±0.9 NS NSBacterial production (pmol l� 1 h�1) 25.9±21.4 5.5±3.6 NS NSSynechococcus abundance ( 107 cells l�1) 3.2±4.0 1.1±1.5 NS NSProchlorococcus abundance (106 cells l� 1) 3.7±6.4 5.9±4.4 NS NSPicoeukaryote abundance (106cells l�1) 1.8±2.1 7.3±8.8 NS NSNanoeukaryote abundance (105 cells l�1) 7.2±3.3 1.3±1.2 NS NS
All averages are arithmetic means and errors are±1 standard deviation. The two-tailed P-values are computed from Welch’s t-test. The nullhypothesis was rejected if P-value was o0.05. A Benjamini–Hochberg False Discovery Rate correction was applied to calculate an adjustedP* value. Non-significant results are denoted as NS.
SAR11 ecotype dynamics in NW MediterraneanI Salter et al
350
The ISME Journal
samples collected as part of an offshore monthlytime-series in the North-West Mediterranean. A total66 705 16S rDNA and 57 524 rRNA sequences wereobtained after performing quality filtering. Sequencesof rRNA and rDNA from all sampling dates werepooled and clustered to yield a total of 2222 OTUs.The mean number of sequences obtained per samplewas 1170±470 for rDNA and 1150±411 for rRNA.Descriptive statistics summarising the centraltendencies and dispersion are provided inSupplementary Table 2. The vast majority ofsequences were assigned to either members of theSAR11 clade or classified as members of theCyanobacteria phylum. Classification of Cyano-bacteria into lower taxonomic ranks was not possibleusing the sequenced region. The contribution ofSAR11 to total sequences had medians of 78 and45% in the rDNA and rRNA fractions compared with13 and 46% for Cyanobacteria.
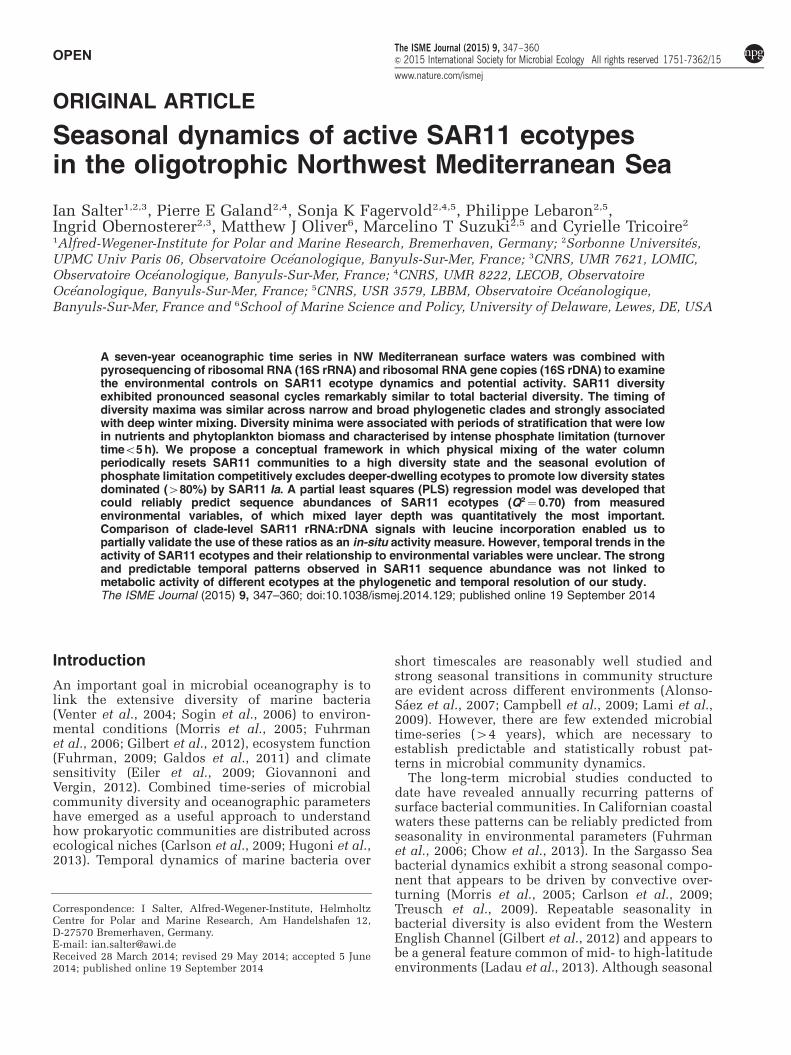
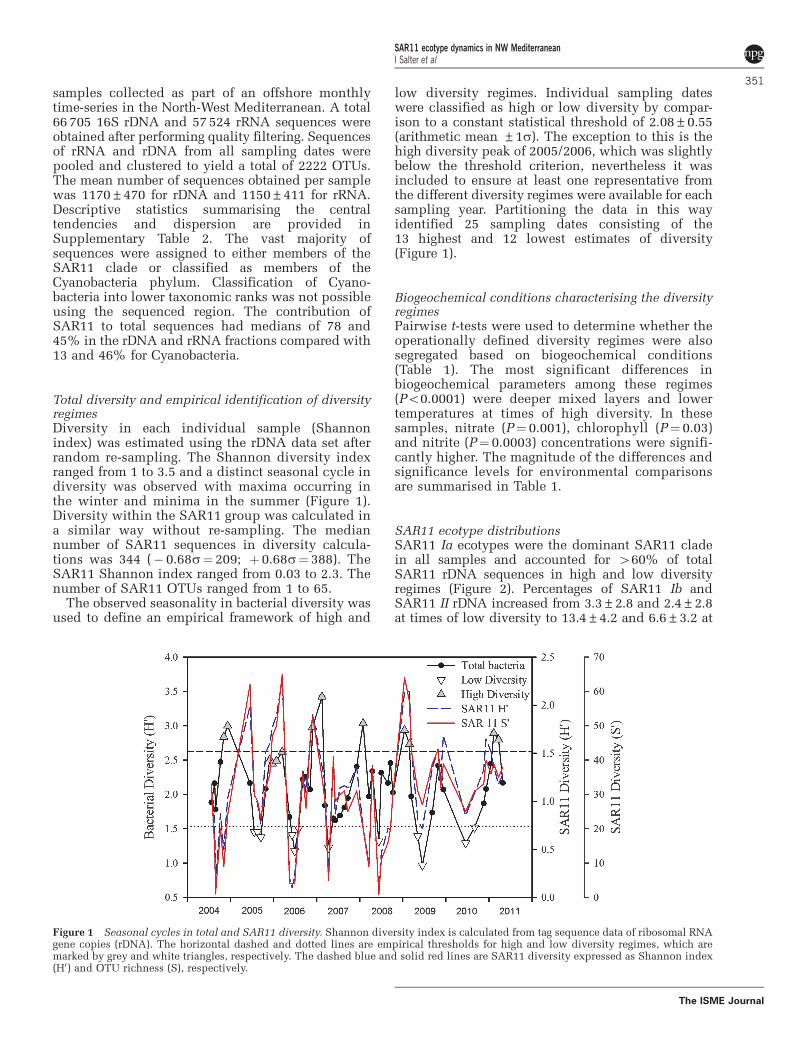
Total diversity and empirical identification of diversityregimesDiversity in each individual sample (Shannonindex) was estimated using the rDNA data set afterrandom re-sampling. The Shannon diversity indexranged from 1 to 3.5 and a distinct seasonal cycle indiversity was observed with maxima occurring inthe winter and minima in the summer (Figure 1).Diversity within the SAR11 group was calculated ina similar way without re-sampling. The mediannumber of SAR11 sequences in diversity calcula-tions was 344 (� 0.68s¼ 209; þ 0.68s¼ 388). TheSAR11 Shannon index ranged from 0.03 to 2.3. Thenumber of SAR11 OTUs ranged from 1 to 65.
The observed seasonality in bacterial diversity wasused to define an empirical framework of high and
low diversity regimes. Individual sampling dateswere classified as high or low diversity by compar-ison to a constant statistical threshold of 2.08±0.55(arithmetic mean ±1s). The exception to this is thehigh diversity peak of 2005/2006, which was slightlybelow the threshold criterion, nevertheless it wasincluded to ensure at least one representative fromthe different diversity regimes were available for eachsampling year. Partitioning the data in this wayidentified 25 sampling dates consisting of the13 highest and 12 lowest estimates of diversity(Figure 1).
Biogeochemical conditions characterising the diversityregimesPairwise t-tests were used to determine whether theoperationally defined diversity regimes were alsosegregated based on biogeochemical conditions(Table 1). The most significant differences inbiogeochemical parameters among these regimes(Po0.0001) were deeper mixed layers and lowertemperatures at times of high diversity. In thesesamples, nitrate (P¼ 0.001), chlorophyll (P¼ 0.03)and nitrite (P¼ 0.0003) concentrations were signifi-cantly higher. The magnitude of the differences andsignificance levels for environmental comparisonsare summarised in Table 1.
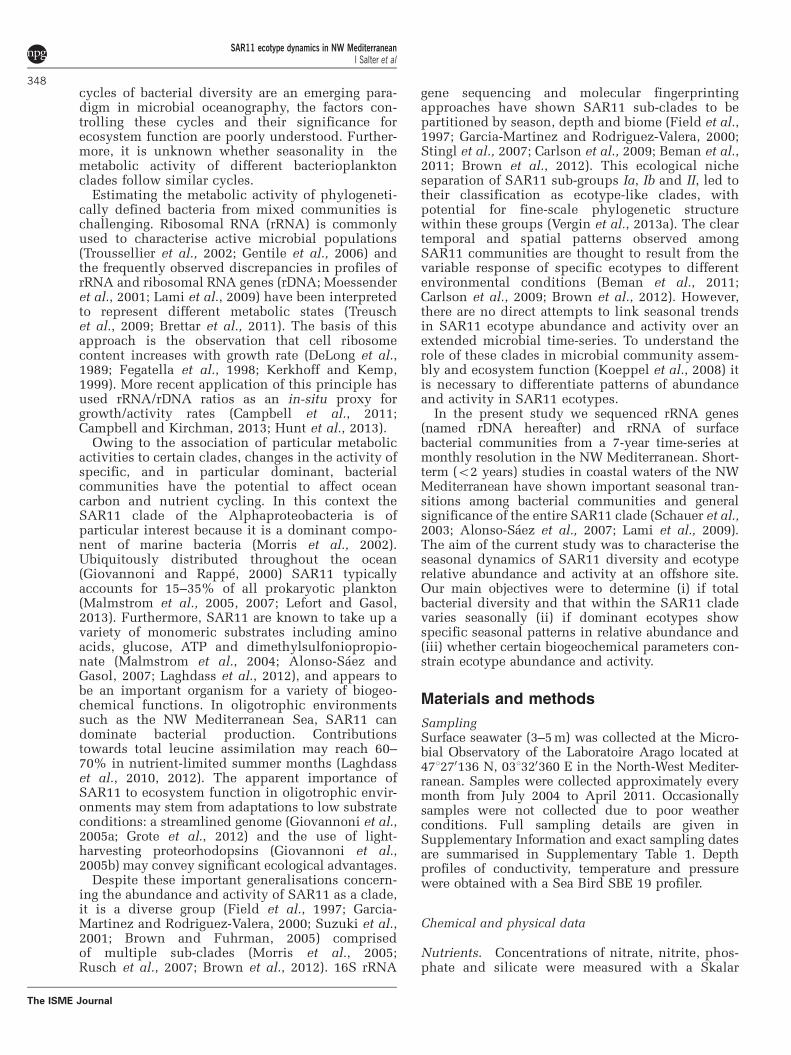
SAR11 ecotype distributionsSAR11 Ia ecotypes were the dominant SAR11 cladein all samples and accounted for 460% of totalSAR11 rDNA sequences in high and low diversityregimes (Figure 2). Percentages of SAR11 Ib andSAR11 II rDNA increased from 3.3±2.8 and 2.4±2.8at times of low diversity to 13.4±4.2 and 6.6±3.2 at
Figure 1 Seasonal cycles in total and SAR11 diversity. Shannon diversity index is calculated from tag sequence data of ribosomal RNAgene copies (rDNA). The horizontal dashed and dotted lines are empirical thresholds for high and low diversity regimes, which aremarked by grey and white triangles, respectively. The dashed blue and solid red lines are SAR11 diversity expressed as Shannon index(H0) and OTU richness (S), respectively.
SAR11 ecotype dynamics in NW MediterraneanI Salter et al
351
The ISME Journal
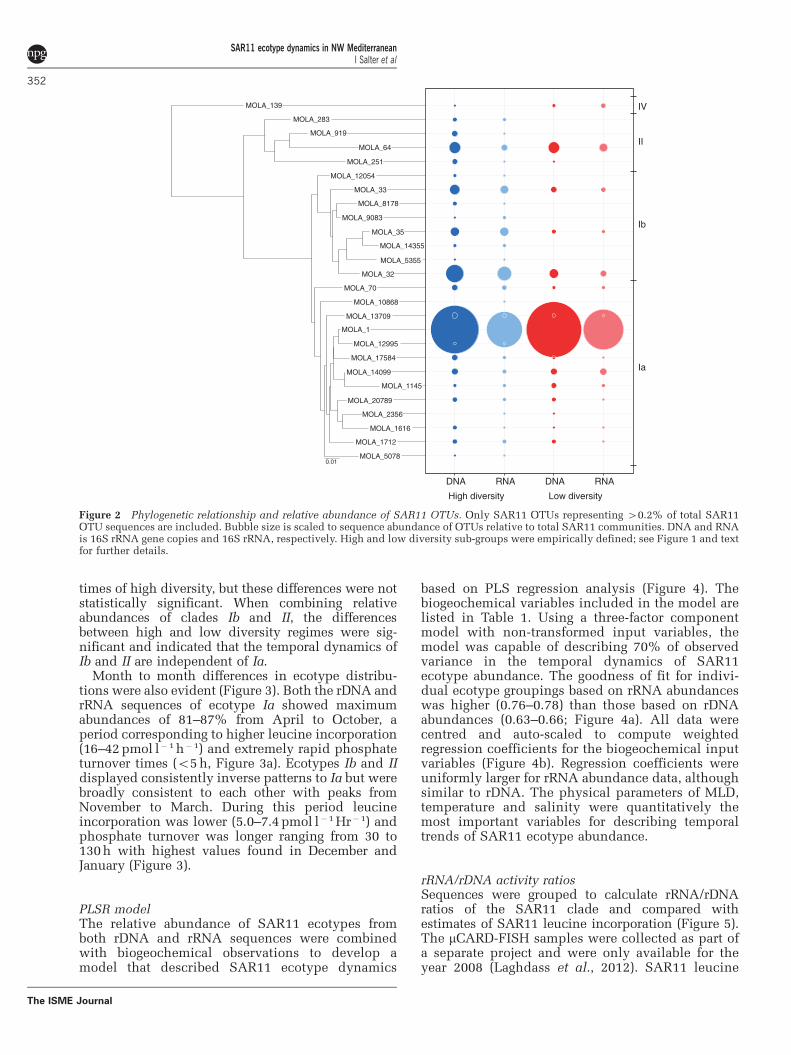
times of high diversity, but these differences were notstatistically significant. When combining relativeabundances of clades Ib and II, the differencesbetween high and low diversity regimes were sig-nificant and indicated that the temporal dynamics ofIb and II are independent of Ia.
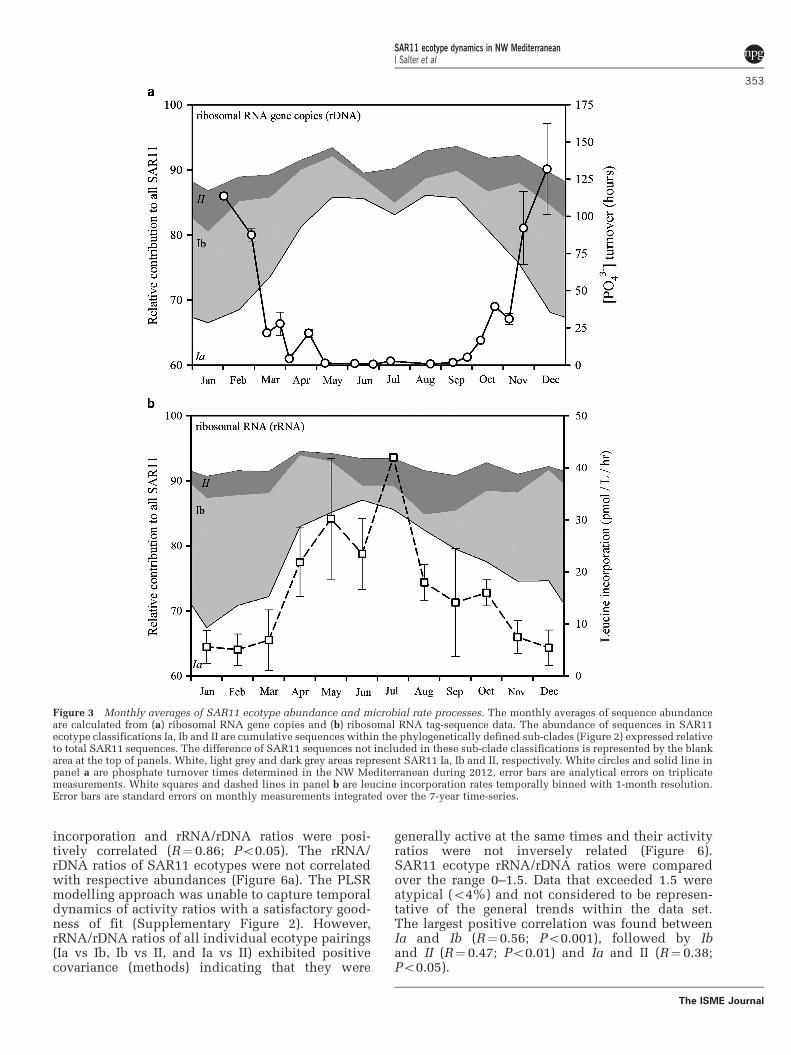
Month to month differences in ecotype distribu-tions were also evident (Figure 3). Both the rDNA andrRNA sequences of ecotype Ia showed maximumabundances of 81–87% from April to October, aperiod corresponding to higher leucine incorporation(16–42 pmol l� 1 h�1) and extremely rapid phosphateturnover times (o5 h, Figure 3a). Ecotypes Ib and IIdisplayed consistently inverse patterns to Ia but werebroadly consistent to each other with peaks fromNovember to March. During this period leucineincorporation was lower (5.0–7.4 pmol l�1 Hr�1) andphosphate turnover was longer ranging from 30 to130 h with highest values found in December andJanuary (Figure 3).
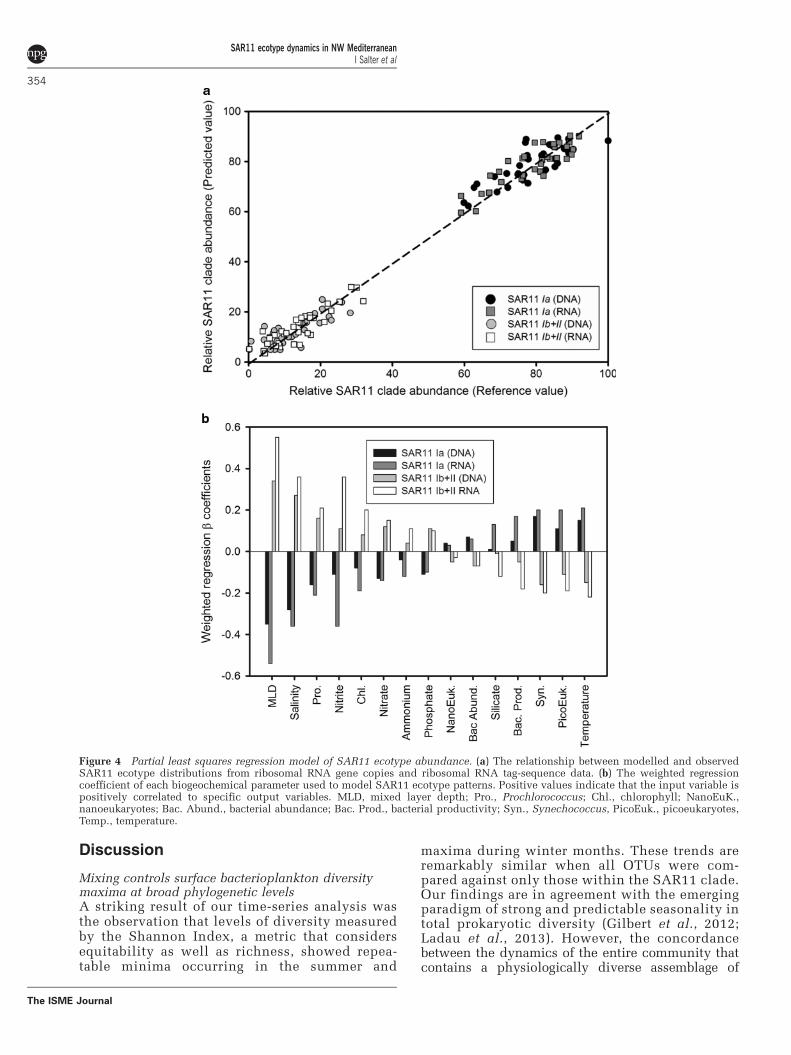
PLSR modelThe relative abundance of SAR11 ecotypes fromboth rDNA and rRNA sequences were combinedwith biogeochemical observations to develop amodel that described SAR11 ecotype dynamics
based on PLS regression analysis (Figure 4). Thebiogeochemical variables included in the model arelisted in Table 1. Using a three-factor componentmodel with non-transformed input variables, themodel was capable of describing 70% of observedvariance in the temporal dynamics of SAR11ecotype abundance. The goodness of fit for indivi-dual ecotype groupings based on rRNA abundanceswas higher (0.76–0.78) than those based on rDNAabundances (0.63–0.66; Figure 4a). All data werecentred and auto-scaled to compute weightedregression coefficients for the biogeochemical inputvariables (Figure 4b). Regression coefficients wereuniformly larger for rRNA abundance data, althoughsimilar to rDNA. The physical parameters of MLD,temperature and salinity were quantitatively themost important variables for describing temporaltrends of SAR11 ecotype abundance.
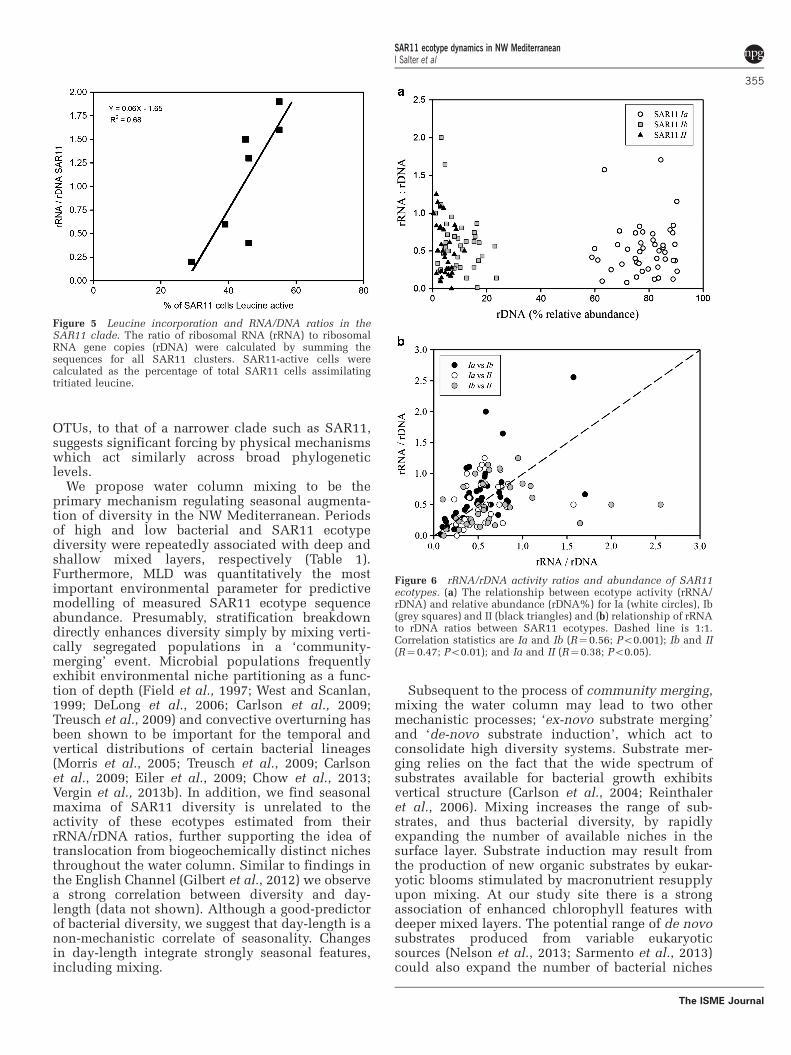
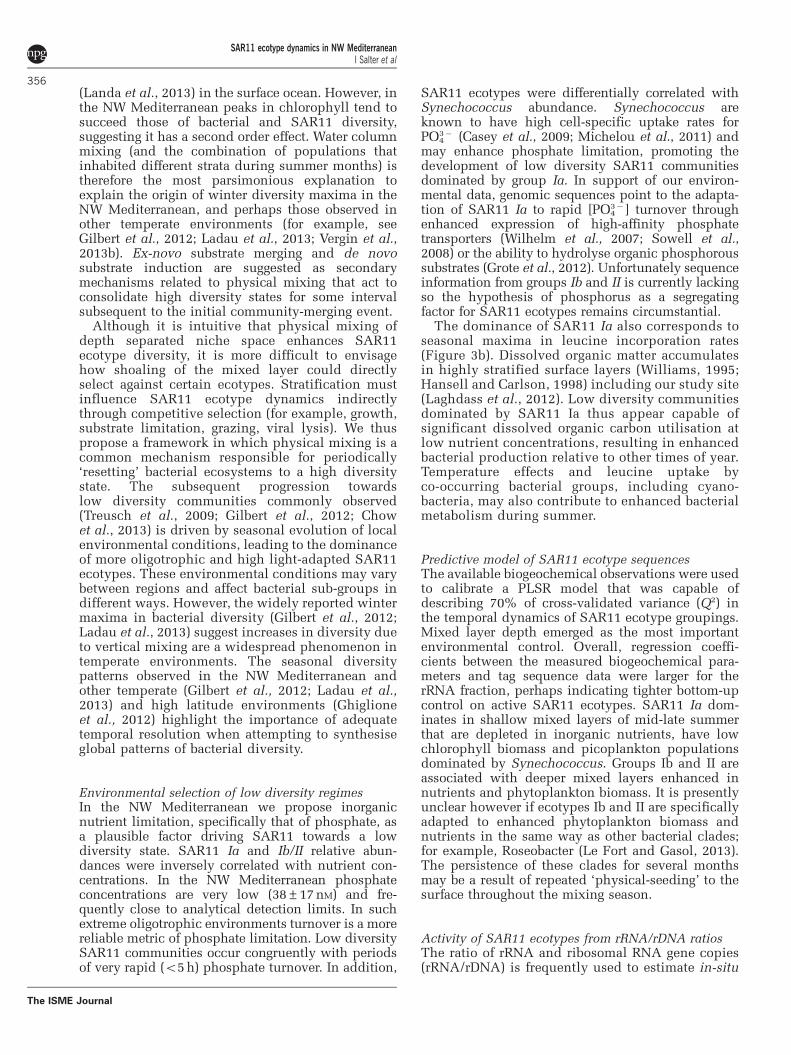
rRNA/rDNA activity ratiosSequences were grouped to calculate rRNA/rDNAratios of the SAR11 clade and compared withestimates of SAR11 leucine incorporation (Figure 5).The mCARD-FISH samples were collected as part ofa separate project and were only available for theyear 2008 (Laghdass et al., 2012). SAR11 leucine
MOLA_5078
MOLA_1712
MOLA_1616
MOLA_2356
MOLA_20789
MOLA_1145
MOLA_14099
MOLA_17584
MOLA_12995
MOLA_1
MOLA_13709
MOLA_10868
MOLA_70
MOLA_32
MOLA_5355
MOLA_14355
MOLA_35
MOLA_9083
MOLA_8178
MOLA_33
MOLA_12054
MOLA_251
MOLA_64
MOLA_919
MOLA_283
MOLA_139
DNA RNA
0.01
Ia
Ib
II
IV
High diversity Low diversity
DNA RNA
Figure 2 Phylogenetic relationship and relative abundance of SAR11 OTUs. Only SAR11 OTUs representing 40.2% of total SAR11OTU sequences are included. Bubble size is scaled to sequence abundance of OTUs relative to total SAR11 communities. DNA and RNAis 16S rRNA gene copies and 16S rRNA, respectively. High and low diversity sub-groups were empirically defined; see Figure 1 and textfor further details.
SAR11 ecotype dynamics in NW MediterraneanI Salter et al
352
The ISME Journal
incorporation and rRNA/rDNA ratios were posi-tively correlated (R¼ 0.86; Po0.05). The rRNA/rDNA ratios of SAR11 ecotypes were not correlatedwith respective abundances (Figure 6a). The PLSRmodelling approach was unable to capture temporaldynamics of activity ratios with a satisfactory good-ness of fit (Supplementary Figure 2). However,rRNA/rDNA ratios of all individual ecotype pairings(Ia vs Ib, Ib vs II, and Ia vs II) exhibited positivecovariance (methods) indicating that they were
generally active at the same times and their activityratios were not inversely related (Figure 6).SAR11 ecotype rRNA/rDNA ratios were comparedover the range 0–1.5. Data that exceeded 1.5 wereatypical (o4%) and not considered to be represen-tative of the general trends within the data set.The largest positive correlation was found betweenIa and Ib (R¼ 0.56; Po0.001), followed by Iband II (R¼ 0.47; Po0.01) and Ia and II (R¼ 0.38;Po0.05).
Figure 3 Monthly averages of SAR11 ecotype abundance and microbial rate processes. The monthly averages of sequence abundanceare calculated from (a) ribosomal RNA gene copies and (b) ribosomal RNA tag-sequence data. The abundance of sequences in SAR11ecotype classifications Ia, Ib and II are cumulative sequences within the phylogenetically defined sub-clades (Figure 2) expressed relativeto total SAR11 sequences. The difference of SAR11 sequences not included in these sub-clade classifications is represented by the blankarea at the top of panels. White, light grey and dark grey areas represent SAR11 Ia, Ib and II, respectively. White circles and solid line inpanel a are phosphate turnover times determined in the NW Mediterranean during 2012, error bars are analytical errors on triplicatemeasurements. White squares and dashed lines in panel b are leucine incorporation rates temporally binned with 1-month resolution.Error bars are standard errors on monthly measurements integrated over the 7-year time-series.
SAR11 ecotype dynamics in NW MediterraneanI Salter et al
353
The ISME Journal
Discussion
Mixing controls surface bacterioplankton diversitymaxima at broad phylogenetic levelsA striking result of our time-series analysis wasthe observation that levels of diversity measuredby the Shannon Index, a metric that considersequitability as well as richness, showed repea-table minima occurring in the summer and
maxima during winter months. These trends areremarkably similar when all OTUs were com-pared against only those within the SAR11 clade.Our findings are in agreement with the emergingparadigm of strong and predictable seasonality intotal prokaryotic diversity (Gilbert et al., 2012;Ladau et al., 2013). However, the concordancebetween the dynamics of the entire community thatcontains a physiologically diverse assemblage of
Figure 4 Partial least squares regression model of SAR11 ecotype abundance. (a) The relationship between modelled and observedSAR11 ecotype distributions from ribosomal RNA gene copies and ribosomal RNA tag-sequence data. (b) The weighted regressioncoefficient of each biogeochemical parameter used to model SAR11 ecotype patterns. Positive values indicate that the input variable ispositively correlated to specific output variables. MLD, mixed layer depth; Pro., Prochlorococcus; Chl., chlorophyll; NanoEuK.,nanoeukaryotes; Bac. Abund., bacterial abundance; Bac. Prod., bacterial productivity; Syn., Synechococcus, PicoEuk., picoeukaryotes,Temp., temperature.
SAR11 ecotype dynamics in NW MediterraneanI Salter et al
354
The ISME Journal
OTUs, to that of a narrower clade such as SAR11,suggests significant forcing by physical mechanismswhich act similarly across broad phylogeneticlevels.
We propose water column mixing to be theprimary mechanism regulating seasonal augmenta-tion of diversity in the NW Mediterranean. Periodsof high and low bacterial and SAR11 ecotypediversity were repeatedly associated with deep andshallow mixed layers, respectively (Table 1).Furthermore, MLD was quantitatively the mostimportant environmental parameter for predictivemodelling of measured SAR11 ecotype sequenceabundance. Presumably, stratification breakdowndirectly enhances diversity simply by mixing verti-cally segregated populations in a ‘community-merging’ event. Microbial populations frequentlyexhibit environmental niche partitioning as a func-tion of depth (Field et al., 1997; West and Scanlan,1999; DeLong et al., 2006; Carlson et al., 2009;Treusch et al., 2009) and convective overturning hasbeen shown to be important for the temporal andvertical distributions of certain bacterial lineages(Morris et al., 2005; Treusch et al., 2009; Carlsonet al., 2009; Eiler et al., 2009; Chow et al., 2013;Vergin et al., 2013b). In addition, we find seasonalmaxima of SAR11 diversity is unrelated to theactivity of these ecotypes estimated from theirrRNA/rDNA ratios, further supporting the idea oftranslocation from biogeochemically distinct nichesthroughout the water column. Similar to findings inthe English Channel (Gilbert et al., 2012) we observea strong correlation between diversity and day-length (data not shown). Although a good-predictorof bacterial diversity, we suggest that day-length is anon-mechanistic correlate of seasonality. Changesin day-length integrate strongly seasonal features,including mixing.
Subsequent to the process of community merging,mixing the water column may lead to two othermechanistic processes; ‘ex-novo substrate merging’and ‘de-novo substrate induction’, which act toconsolidate high diversity systems. Substrate mer-ging relies on the fact that the wide spectrum ofsubstrates available for bacterial growth exhibitsvertical structure (Carlson et al., 2004; Reinthaleret al., 2006). Mixing increases the range of sub-strates, and thus bacterial diversity, by rapidlyexpanding the number of available niches in thesurface layer. Substrate induction may result fromthe production of new organic substrates by eukar-yotic blooms stimulated by macronutrient resupplyupon mixing. At our study site there is a strongassociation of enhanced chlorophyll features withdeeper mixed layers. The potential range of de novosubstrates produced from variable eukaryoticsources (Nelson et al., 2013; Sarmento et al., 2013)could also expand the number of bacterial niches
Figure 5 Leucine incorporation and RNA/DNA ratios in theSAR11 clade. The ratio of ribosomal RNA (rRNA) to ribosomalRNA gene copies (rDNA) were calculated by summing thesequences for all SAR11 clusters. SAR11-active cells werecalculated as the percentage of total SAR11 cells assimilatingtritiated leucine.
Figure 6 rRNA/rDNA activity ratios and abundance of SAR11ecotypes. (a) The relationship between ecotype activity (rRNA/rDNA) and relative abundance (rDNA%) for Ia (white circles), Ib(grey squares) and II (black triangles) and (b) relationship of rRNAto rDNA ratios between SAR11 ecotypes. Dashed line is 1:1.Correlation statistics are Ia and Ib (R¼ 0.56; Po0.001); Ib and II(R¼ 0.47; Po0.01); and Ia and II (R¼ 0.38; Po0.05).
SAR11 ecotype dynamics in NW MediterraneanI Salter et al
355
The ISME Journal
(Landa et al., 2013) in the surface ocean. However, inthe NW Mediterranean peaks in chlorophyll tend tosucceed those of bacterial and SAR11 diversity,suggesting it has a second order effect. Water columnmixing (and the combination of populations thatinhabited different strata during summer months) istherefore the most parsimonious explanation toexplain the origin of winter diversity maxima in theNW Mediterranean, and perhaps those observed inother temperate environments (for example, seeGilbert et al., 2012; Ladau et al., 2013; Vergin et al.,2013b). Ex-novo substrate merging and de novosubstrate induction are suggested as secondarymechanisms related to physical mixing that act toconsolidate high diversity states for some intervalsubsequent to the initial community-merging event.
Although it is intuitive that physical mixing ofdepth separated niche space enhances SAR11ecotype diversity, it is more difficult to envisagehow shoaling of the mixed layer could directlyselect against certain ecotypes. Stratification mustinfluence SAR11 ecotype dynamics indirectlythrough competitive selection (for example, growth,substrate limitation, grazing, viral lysis). We thuspropose a framework in which physical mixing is acommon mechanism responsible for periodically‘resetting’ bacterial ecosystems to a high diversitystate. The subsequent progression towardslow diversity communities commonly observed(Treusch et al., 2009; Gilbert et al., 2012; Chowet al., 2013) is driven by seasonal evolution of localenvironmental conditions, leading to the dominanceof more oligotrophic and high light-adapted SAR11ecotypes. These environmental conditions may varybetween regions and affect bacterial sub-groups indifferent ways. However, the widely reported wintermaxima in bacterial diversity (Gilbert et al., 2012;Ladau et al., 2013) suggest increases in diversity dueto vertical mixing are a widespread phenomenon intemperate environments. The seasonal diversitypatterns observed in the NW Mediterranean andother temperate (Gilbert et al., 2012; Ladau et al.,2013) and high latitude environments (Ghiglioneet al., 2012) highlight the importance of adequatetemporal resolution when attempting to synthesiseglobal patterns of bacterial diversity.
Environmental selection of low diversity regimesIn the NW Mediterranean we propose inorganicnutrient limitation, specifically that of phosphate, asa plausible factor driving SAR11 towards a lowdiversity state. SAR11 Ia and Ib/II relative abun-dances were inversely correlated with nutrient con-centrations. In the NW Mediterranean phosphateconcentrations are very low (38±17 nM) and fre-quently close to analytical detection limits. In suchextreme oligotrophic environments turnover is a morereliable metric of phosphate limitation. Low diversitySAR11 communities occur congruently with periodsof very rapid (o5 h) phosphate turnover. In addition,
SAR11 ecotypes were differentially correlated withSynechococcus abundance. Synechococcus areknown to have high cell-specific uptake rates forPO4
3� (Casey et al., 2009; Michelou et al., 2011) andmay enhance phosphate limitation, promoting thedevelopment of low diversity SAR11 communitiesdominated by group Ia. In support of our environ-mental data, genomic sequences point to the adapta-tion of SAR11 Ia to rapid [PO4
3� ] turnover throughenhanced expression of high-affinity phosphatetransporters (Wilhelm et al., 2007; Sowell et al.,2008) or the ability to hydrolyse organic phosphoroussubstrates (Grote et al., 2012). Unfortunately sequenceinformation from groups Ib and II is currently lackingso the hypothesis of phosphorus as a segregatingfactor for SAR11 ecotypes remains circumstantial.
The dominance of SAR11 Ia also corresponds toseasonal maxima in leucine incorporation rates(Figure 3b). Dissolved organic matter accumulatesin highly stratified surface layers (Williams, 1995;Hansell and Carlson, 1998) including our study site(Laghdass et al., 2012). Low diversity communitiesdominated by SAR11 Ia thus appear capable ofsignificant dissolved organic carbon utilisation atlow nutrient concentrations, resulting in enhancedbacterial production relative to other times of year.Temperature effects and leucine uptake byco-occurring bacterial groups, including cyano-bacteria, may also contribute to enhanced bacterialmetabolism during summer.
Predictive model of SAR11 ecotype sequencesThe available biogeochemical observations were usedto calibrate a PLSR model that was capable ofdescribing 70% of cross-validated variance (Q2) inthe temporal dynamics of SAR11 ecotype groupings.Mixed layer depth emerged as the most importantenvironmental control. Overall, regression coeffi-cients between the measured biogeochemical para-meters and tag sequence data were larger for therRNA fraction, perhaps indicating tighter bottom-upcontrol on active SAR11 ecotypes. SAR11 Ia dom-inates in shallow mixed layers of mid-late summerthat are depleted in inorganic nutrients, have lowchlorophyll biomass and picoplankton populationsdominated by Synechococcus. Groups Ib and II areassociated with deeper mixed layers enhanced innutrients and phytoplankton biomass. It is presentlyunclear however if ecotypes Ib and II are specificallyadapted to enhanced phytoplankton biomass andnutrients in the same way as other bacterial clades;for example, Roseobacter (Le Fort and Gasol, 2013).The persistence of these clades for several monthsmay be a result of repeated ‘physical-seeding’ to thesurface throughout the mixing season.
Activity of SAR11 ecotypes from rRNA/rDNA ratiosThe ratio of rRNA and ribosomal RNA gene copies(rRNA/rDNA) is frequently used to estimate in-situ
SAR11 ecotype dynamics in NW MediterraneanI Salter et al
356
The ISME Journal
activity, or even growth rates, of specific bacterialOTUs (Campbell et al., 2011; Campbell andKirchman, 2013; Hunt et al., 2013). However, arecent report has questioned the reliability of rRNAas an indicator of metabolic state (Blazewics et al.,2013). To validate the utility of rRNA/rDNA indescribing in-situ variation of SAR11 ecotypeactivity we compared tag sequence data to directmeasurements of leucine incorporation (Laghdasset al., 2012), which is a commonly used measure ofheterotrophic production by bacteria (Kirchmanet al., 1985). The fraction of SAR11 incorporatingleucine was positively correlated with SAR11rRNA/rDNA ratio. Although limited in number,our data set covers the full range of rRNA/rDNAratios (Campbell et al., 2009, 2011) and leucineincorporation rates (for example, Malmstrom et al.,2007) typically reported for SAR11. To the best ofour knowledge we have made the first attempt tocorrelate rRNA/rDNA as an in-situ activity metricagainst a direct measure of bacterial metabolism atan identical, albeit broad, phylogenetic resolution. Itis difficult to speculate if the relationship observedfor SAR11 would hold for other bacterial lineagesor at increasing phylogenetic resolution. From thelimited observations we make a first-order assump-tion that rRNA/rDNA and leucine incorporationexhibit similar covariance at ecotype level andtherefore apply this ratio to investigate patterns inSAR11 ecotype activity.
The rRNA/rDNA ratios of SAR11 ecotypes did notdisplay any coherent seasonal patterns or relation-ships with the measured biogeochemical variables(Supplementary Figure 2; Table 1). Furthermore,ecotype abundance and activity were uncorrelated(Figure 6a). It might be expected that correlationsbetween ecotype activity and abundance are char-acterised by an undefined time lag. However, apply-ing a one-month time lag [þ 1 sampling event](for example, Fuhrman et al., 2006) to our data setfailed to improve activity-abundance correlations.Decoupling of activity and abundance has beenobserved elsewhere (Campbell and Kirchman,2013). The temporal resolution afforded by a monthlytime-series may be too coarse to capture the transientnature of abundance–activity relationships in SAR11ecotypes.
Alternatively, it is possible that despite differ-ences in 16S RNA gene phylogeny (Vergin et al.,2013a) and gene content (Grote et al., 2012), SAR11ecotypes share enough metabolic potential andoverlapping niche space to maintain simultaneouslyactive populations. In support of this SAR11ecotype activities are statistically indistinguishablefrom each other in low and high diversity settings,regardless of the strong biogeochemical gradientsthat exist. Positive covariance in SAR11 ecotypeactivities across the 7-year data set (Figure 6b) alsosuggest that activity of different ecotypes mayrespond similarly to changes in environmentalconditions. However, the clear seasonal partitioning
of SAR11 ecotype abundances are not systematicallyrelated to specific ecotype activity, as presentlydetermined from rRNA/rDNA ratios. Although weprovide preliminary evidence that potential meta-bolic activity (rRNA abundance) is linked to realisedprotein synthesis (leucine incorporation) in SAR11,the use of rRNA/rDNA ratios as a reliable activitymeasure remains ambiguous (Blazewics et al., 2013).
Through our analysis we demonstrate how physi-cal oceanographic processes and biogeochemicalforcing factors combine to explain the well-documen-ted seasonal cycles in bacterial diversity. Temporalinstability in environmental conditions is the mainfactor driving patterns of bacterial diversity in theNW Mediterranean. We suggest that adequate spatialand temporal global coverage would reveal bacterialdiversity peaks in winter at temperate to highlatitudes, rather than seasonally stable low latitudeenvironments. Although our analysis specificallyfocuses on SAR11 dynamics we expect the samemechanisms to be relevant for other bacterial clades.In the NW Mediterranean phosphate limitationappears to govern seasonal transitions to low-diver-sity SAR11 communities. Phosphate may be ofsimilar importance in other oligotrophic environ-ments that are characterised by seasonal dominanceof SAR11 ecotype Ia. PLSR modelling demonstratedstrong and predictable temporal patterns in SAR11ecotype abundance that were not reflected in seasonaldynamics of metabolic activity. Future studies target-ing the fine-scale phylogenetic structure of SAR11communities, at increased temporal resolution, mayhelp to further define the complex patterns observedbetween SAR11 ecotype abundance and activity.
Conflict of Interest
The authors declare no conflict of interest.
Acknowledgements
We thank Eric Maria and Louise Oriol for assisting with thecollection and analysis of samples for the physical andchemical parameters over the time-series. The workwas jointly supported by a LEFE-CYBER grant awarded toIan Salter and LOMIC micro-project grant awarded toIan Salter. We acknowledge Platform BIO2MAR for theprovision of molecular biology equipment.
References
Alonso-Saez LV, Balague E, Sa O, Sanchez JM, Gonzalez J,Pinhassi R et al. (2007). Seasonality in bacterial diversityin NW Mediterranean coastal waters: assessmentthrough clone libraries, fingerprinting and fluorescencein situ hybridization. FEMS Microbiol Ecol 60: 98–112.
Alonso-Saez LV, Gasol JP. (2007). Seasonal variationsin the contributions of different bacterial groups tothe uptake of low-molecular-weight compounds in
SAR11 ecotype dynamics in NW MediterraneanI Salter et al
357
The ISME Journal
Northwestern Mediterranean Coastal Waters. ApplEnviron Microbiol 73: 3528–3535.
Beman JM, Steele JA, Furhman JA. (2011). Co-occurrencepatterns for abundant marine archaeal and bacteriallineages in the deep chlorophyll maximum of coastalCalifornia. ISME J 5: 1077–1085.
Benjamini Y, Hochberg Y. (1995). Controlling the falsediscovery Rate: A practical and powerful approach tomultiple testing. J R Stat Soc B 57: 289–300.
Blanquer A, Uriz MJ, Galand PE. (2013). Removingenvironmental sources of variation to gain insight onsymbionts vs. transient microbes in high and lowmicrobial abundance sponges. Environ Microbiol 15:3008–3019.
Blazewics SJ, Barnard RL, Daly RA, Firestone MK. (2013).Evaluating rRNA as an indicator of microbial activityin environmental communities: limitations and uses.ISME J 7: 2061–2068.
Brettar I, Christen R, HoFle MG. (2011). Analysis ofbacterial core communities in the central Baltic bycomparative RNA–DNA-based fingerprinting provideslinks to structure–function relationships. ISME J 6:195–212.
Brown MV, Fuhrman JA. (2005). Marine bacterial micro-diversity as revealed by internal transcribed spaceranalysis. Aquat Microb Ecol 41: 15–23.
Brown MV, Lauro FM, DeMaere MZ, Muir L, Wilkins D,Thomas T et al. (2012). Global Biogeography of SAR11marine bacteria. Mol Syst Biol 8: 595.
Campbell BJ, Kirchman DL. (2013). Bacterial diversity,community structure and potential growth ratesalong an estuarine salinity gradient. ISME J 7:210–220.
Campbell BJ, Yu L, Heidelberg JF, Kirchman DL. (2011).Activity of abundant and rare bacteria in a coastalocean. Proc Natl Acad Sci USA 108: 12776–12781.
Campbell BJ, Yu L, Straza TRA, Kirchman DL. (2009).Temporal changes in bacterial rRNA and rRNA genesin Delaware (USA) coastal waters. Aquat Microb Ecol57: 123–135.
Carlson CA, Giovannoni SJ, Hansell DA, Goldberg SJ,Parsons R, Vergin K. (2004). Interactions amongdissolved organic carbon, microbial processes, andcommunity structure in the mesopelagic zone of thenorthwestern Sargasso Sea. Limnol Oceanogr 49:1073–1083.
Carlson CA, Morris R, Parsons R, Treusch AH, Giovannoni SJ,Vergin K. (2009). Seasonal dynamics of SAR11populations in the euphotic and mesopelagic zonesof the northwestern Sargasso Sea. ISME J 3: 283–295.
Casey JR, Lomas MW, Michelou VK, Dyhrman ST,Orchard ED, Ammerman JW et al. (2009). Phytoplanktontaxon-specific orthophosphate (Pi) and ATP utilizationin the western subtropical North Atlantic. Aquat MicrobEcol 58: 31–44.
Chow CET, Sachdeva R, Cram JA, Steele JA, Needham DM,Patel A et al. (2013). Temporal variability andcoherence of euphotic zone bacterial communitiesover a decade in the Southern California Bight. ISME J7: 2259–2273.
DeLong EF, Preston CM, Mincer T, Rich V, Hallam SJ,Frigaard NU et al. (2006). Community genomicsamong stratified microbial assemblages in the ocean’sinterior. Science 311: 496–503.
DeLong EF, Wickham GS, Pace NR. (1989). Phylogeneticstains: ribosomal RNA-based probes for the identifi-cation of single cells. Science 243: 1360–1363.
DeSantis TZ, Hugenholtz P, Larsen N, Rojas M, Brodie EL,Keller K et al. (2006). Greengenes, a chimera-checked16S rRNA gene database and workbench compatiblewith ARB. Appl Environ Microbiol 72: 5069–5072.
Edgar RC. (2004). MUSCLE: multiple sequence alignmentwith high accuracy and high throughput. NucleicAcids Res 32: 1792–1797.
Edgar RC. (2010). Search and clustering orders ofmagnitude faster than BLAST. Bioinformatics 26:2460–2461.
Eiler A, Hayakawa DH, Church MJ, Karl DM, Rappe MS.(2009). Dynamics of the SAR11 bacterioplanktonlineage in relation to environmental conditions inthe oligotrophic North Pacific subtropical gyre.Environ Microbiol 11: 2291–2300.
Fegatella F, Lim J, Kjelleberg S, Cavicchioli R. (1998).Implications of rRNA operon copy number andribosome content in the marine oligotrophicultramicrobacterium Sphingomonas sp. strainRB2256. Appl Environ Microbiol 64: 4433–4438.
Felsenstein J. (2008). PHYLIP (Phylogeny InferencePackage) version 3.68. Distributed by the author.Department of Genome Sciences. University ofWashington: Seattle.
Field KG, Gordon D, Wright T, Rappe M, Urback E, Vergin Ket al. (1997). Diversity and depth-specific distributionof SAR11 cluster rRNA genes from marine planktonicbacteria. Appl Environ Micro 63: 63–70.
Fuhrman JA, Hewson I, Schwalbach MS, Steele JA,Brown MV, Naeem S. (2006). Annually reoccurringbacterial communities are predictable from oceanconditions. Proc Natl Acad Sci USA 103: 13104–13109.
Fuhrman JA. (2009). Microbial community structure andits functional implications. Nature 459: 193–199.
Galdos E, Rusch A, Ilardo M. (2011). Ribosomal tagpyrosequencing of DNA and RNA from benthic coralreef microbiota: community spatial structure, raremembers and nitrogen-cycling guilds. EnvironMicrobiol 13: 1138–11522.
Garcia-Martinez J, Rodriguez-Valera F. (2000). Microdiversityof uncultured marine prokaryotes: the SAR11 clusterand the marine archaea of group I. Mol Ecol 9:935–948.
Gentile G, Giuliano L, D’Auria G, Smedile F, Azzaro M,De Domenico M et al. (2006). Study of bacterialcommunities in Antarctic coastal waters by a combinationof 16S rRNA and 16S rDNA sequencing. EnvironMicrobiol 8: 2150–2161.
Ghiglione JF, Galand PE, Pommier T, Pedros-Alio C, Maas EW,Bakker K et al. (2012). Pole to pole biogeography ofsurface and deep marine bacterial communities.Proc Natl Acad Sci USA 109: 17633–17638.
Gilbert JA, Field D, Swift P, Newbold L, Oliver A, Smyth Tet al. (2009). The seasonal structure of microbialcommunities in the Western English Channel. EnvironMicrobiol 11: 3132–3139.
Gilbert JA, Steele JA, Caporaso JG, Steinbruck L, Reeder J,Temperton B et al. (2012). Defining seasonal marinemicrobial community dynamics. ISME J 6: 298–308.
Giovannoni SJ, Bibbs L, Cho JC, Stapels MD, Desiderio R,Vergin KL et al. (2005b). Proteorhodopsin in theubiquitous marine bacterium SAR11. Nature 438:82–85.
Giovannoni SJ, Rappe MS. (2000). Evolution, diversityand molecular ecology of marine prokaryotes. In:Kirchman DL (ed) Microbial Ecology of the Oceans.Wiley and Sons: New York, NY, pp 47–84.
SAR11 ecotype dynamics in NW MediterraneanI Salter et al
358
The ISME Journal
Giovannoni SJ, Tripp HJ, Givan S, Podar M, Vergin KL,Baptista D et al. (2005a). Genome streamlining in acosmopolitan oceanic bacterium. Science 309: 1242–1245.
Giovannoni SJ, Vergin KL. (2012). Seasonality in oceanmicrobial communities. Science 335: 671–676.
Grote J, Thrash JC, Huggett MJ, Landry ZC, Carini P,Giovammoni SJ et al. (2012). Streamlining andcore genome conservation among highly divergentmembers of the SAR11 Clade. Mbio 3: pii e00252–12.
Hammer Ø, Harper DAT, Ryan PD. (2001). PAST: paleon-tological statistics software package for education anddata analysis. Palaeo Electronica 4.
Hansell DA, Carlson CA. (1998). Net community produc-tion of dissolved organic carbon. Global BiogeochemCycles 12: 443–453.
Hugoni M, Taib N, Debroas D, Domaizon I, Dufournel IJ,Bronner G et al. (2013). Structure of the rare archaealbiosphere and seasonal dynamics of active ecotypes insurface coastal waters. Proc Natl Acad Sci USA 110:6004–6009.
Hunt DE, Lin Y, Church MJ, Karl DM, Tringe SG, Izzo LK et al.(2013). Relationship between abundance and specificactivity of bacterioplankton in open ocean surfacewaters. Appl Environ Microbiol 79: 177–184.
Huse SM, Welch DM, Morrison HG, Sogin ML. (2010).Ironing out the wrinkles in the rare biosphere throughimproved OTU clustering. Environ Microbiol 12:1889–1898.
Kerkhof L, Kemp P. (1999). Small ribosomal RNA contentin marine Proteobacteria during non-steady-stategrowth. FEMS Microbiol Ecol 30: 253–260.
Kirchman D, K’nees E, Hodson R. (1985). Leucineincorporation and its potential as a measure of proteinsynthesis by bacteria in natural aquatic systems. ApplEnviron Microbiol 49: 599–607.
Kirchman D. (1993). Leucine incorporation as a measureof biomass production by heterotrophic bacteria. In:Kemp PF, Sherr BF, Sherr EB, Cole JJ (eds) Handbookof Methods in Aquatic Microbial Ecology. Lewis: BocaRaton, pp 509–512.
Koeppel A, Perry EB, Sikorski J, Krizanc D, Warner A,Ward D et al. (2008). Identifying the fundamental unitsof bacterial diversity: a paradigm shift to incorporateecology into bacterial systematics. Proc Natl Acad SciUSA 105: 2504–2509.
Kunin V, Engelbrektson A, Ochman H, Hugenholtz P.(2010). Wrinkles in the rare biosphere: pyrosequen-cing errors can lead to artificial inflation of diversityestimates. Environ Microbiol 12: 118–123.
Kunin V, Hugenholtz B. (2010). PyroTagger: a fast,accurate pipeline for analysis of rRNA ampliconpyrosequence data. Open J 1: 1–8.
Ladau J, Sharpton TJ, Finucane MM, Jospin G, Kembel SW,O’Dwyer J et al. (2013). Global marine bacterial diversitypeaks at high latitudes in winter. ISME J 7: 1669–1677.
Laghdass M, Catala P, Caparros J, Oriol L, Lebaron P,Obernosterer I. (2012). High contribution of SAR11 tomicrobial activity in the North West MediterraneanSea. Microb Ecol 63: 324–333.
Laghdass M, West NJ, Batailler N, Caparros J, Catala P,Lantoine F et al. (2010). Impact of lower salinitywaters on bacterial heterotrophic production andcommunity structure in the offshore NW Mediterra-nean Sea. Environ Microbiol Reports 2: 761–769.
Lami R, Ghiglione JF, Desdevises Y, West NJ, Lebaron P.(2009). Annual patterns of presence and activity ofmarine bacteria monitored by 16S rDNA–16S rRNA
fingerprints in the coastal NW Mediterranean Sea.Aquat Microb Ecol 54: 199–210.
Landa M, Cottrell M, Kirchman D, Blain S, Obernosterer I.(2013). Changes in bacterial diversity in response todissolved organic matter supply in a continuousculture experiment. Aquat Microb Ecol 69: 157–168.
Lefort T, Gasol JM. (2013). Global-scale distributions ofmarine surface bacterioplankton groups alonggradients of salinity, temperature, and chlorophyll: ameta-analysis of fluorescence in situ hybridizationstudies. Aquat Microb Ecol 70: 111–130.
Malmstrom RR, Cottrell MT, Elifantz H, Kirchman DL.(2005). Biomass production and assimilation ofdissolved organic matter by SAR11 bacteria in thenorthwest Atlantic Ocean. Appl Environ Microbiol 71:2979–2986.
Malmstrom RR, Kiene RP, Cottrell MT, Kirchman DL. (2004).Contribution of SAR11 bacteria to dissolved dimethyl-sulfoniopropionte and amino acid uptake in the NorthAtlantic Ocean. Appl Environ Microbiol 70: 4129–4135.
Malmstrom RR, Straza TRA, Cottrell MT, Kirchman DL.(2007). Diversity, abundance and biomass productionof bacterial groups in the western Arctic Ocean. AquatMicrob Ecol 47: 45–55.
Michelou VK, Lomas MW, Kirchman DL. (2011).Phosphate and adenosine-50triphosphate uptake bycyanobacteria and heterotrophic bacteria in theSargasso Sea. Limnol Oceanogr 56: 323–332.
Moeseneder MM, Winter C, Herndl GJ. (2001). Horizontaland vertical complexity of attached and free-livingbacteria of the eastern Mediterranean Sea, determinedby 16S rDNA and 16S rRNA fingerprints. LimnolOceanogr 46: 95–107.
Morris RM, Rappe MS, Connon SA, Vergin KL, Siebold WA,Carlson CA et al. (2002). SAR11 clade dominates oceansurface bacterioplankton communities. Nature 420:806–810.
Morris RM, Vergin KL, Cho JC, Rappe MS, Carlson CA,Giovannoni SJ. (2005). Temporal and spatial responseof bacterioplankton lineages to annual convectiveoverturn at the Bermuda Atlantic Time-series Studysite. Limnol Oceanogr 50: 1687–1696.
Nelson CE, Goldberg SJ, Wegley LW, Haas AF, Smith JE,Rohwer F et al. (2013). Coral and macroalgal exudatesvary in neutral sugar composition and differentiallyenrich reef bacterioplankton lineages. ISME J 7: 962–979.
Reinthaler T, van Aken H, Veth C, Arıstegui J, Robinson C,Williams PJ le B et al. (2006). Prokaryotic respirationand production in the meso- and bathypelagic realm ofthe eastern and western North Atlantic basin. LimnolOceanogr 51: 1262–1273.
Rusch D, Halpern AL, Sutton G, Heidelberg KB, Williamson S,Yooseph S et al. (2007). The Sorcerer II Global Oceansampling expedition: Northwest Atlantic through EasternTropical Pacific. PLoS Biol 5: 398–431.
Sarmento H, Romero-Castillo C, Lindh H, Pinhassi J,Sala MM, Gasol JM et al. (2013). Phytoplanktonspecies-specific release of dissolved free amino acidsand their selective consumption by bacteria. LimnolOceanogr 58: 1123–1135.
Schauer M, Balague V, Pedros-Alio C, Massana R. (2003).Seasonal changes in the taxonomic composition ofbacterioplankton in a coastal oligotrophic system.Aquat Microb Ecol 31: 163–174.
Smith DC, Azam F. (1992). A simple, economical method formeasuring bacterial protein synthesis rates in seawaterusing 3H-leucine. Mar Microb Food Webs 6: 107–114.
SAR11 ecotype dynamics in NW MediterraneanI Salter et al
359
The ISME Journal
Sogin ML, Morrison HG, Huber JA, Welch DM, Huse SM,Neal PR et al. (2006). Microbial diversity in the deepsea and the underexplored ‘rare biosphere’. Proc NatlAcad Sci USA 103: 12115–12120.
Solorzano L. (1969). Determination of ammonia in naturalwaters by the phenol-hypochlorite method. LimnolOceanogr 14: 799–801.
Sowell S, Wilhelm L, Norbeck A, Lipton M, Nicora C,Barofsky D et al. (2008). Transport functions dominatethe SAR11 metaproteome at low-nutrient extremes inthe Sargasso Sea. ISME J 3: 93–105.
Stingl U, Tripp HJ, Giovannoni SJ. (2007). Improvementsof high throughput culturing yielded novel SAR11strains and other abundant marine bacteria from theOregon coast and the Bermuda Atlantic Time Seriesstudy site. ISME J 1: 361–371.
Strickland JD, Parsons TR. (1997). A Practical Handbookof Seawater Analysis, 2nd edn. Bulletin of theFisheries Research Board of Canada.
Suzuki MT, Beja O, Taylor LT, DeLong EF. (2001).Phylogenetic analysis of ribosomal RNA operons fromuncultivated coastal marine bacterioplankton. EnvironMicrobiol 3: 323–331.
Treguer P, Le Corre P. (1975). Manuel d’analyse des SelsNutritifs Dans L’eau de mer Utilisation de l’AutoAnalyzer2 Technicon, 2nd edn. ’Univ Bretagne occidentale, Brest.
Treusch AH, Vergin KL, Finlay LA, Donatz MG, BurtonRM, Carlson C et al. (2009). Seasonality and verticalstructure of microbial communities in an ocean gyre.ISME J 3: 1148–1163.
Troussellier M, Schafer H, Batailler N, Bernard L, CourtiesC, Lebaron P et al. (2002). Bacterial activity andgenetic richness along an estuarine gradient (RhoneRiver plume, France). Aquat Microb Ecol 28: 13–24.
Venter JC, Remington K, Heidelberg JF, Halpern AL, Rusch D,Eisen JA et al. (2004). Environmental genome shotgunsequencing of the Sargasso Sea. Science 304: 66–74.
Vergin KL, Beszteri B, Monier A, Thrash JC, Temperton B,Treusch AH. (2013a). High-resolution SAR11 ecotypedynamics at the Bermuda Atlantic Time-Series StudySite by phylogenetic placement of pyrosequences.ISME J 7: 1322–1332.
Vergin KL, Done B, Carlson CA, Giovannoni SJ. (2013b).Spatiotemporal distributions of rare bacterioplanktonpopulations indicated adaptive strategies in theoligotrophic ocean. Aquat Microb Ecol 71: 1–13.
West NJ, Obernosterer I, Zemb O, Lebaron P. (2008). Majordifferences of bacterial diversity and activity insideand outside of a natural iron-fertilized phytoplanktonbloom in the Southern Ocean. Environ Microbio 10:738–756.
West NJ, Scanlan DJ. (1999). Niche-partitioning ofProchlorococcus populations in a stratified watercolumn in the Eastern North Atlantic Ocean. ApplEnviron Microbiol 65: 2585–2591.
Wilhelm L, Tripp H, Givan S, Smith D, Giovannoni S.(2007). Natural variation in SAR 11 marine bacterio-plankton genomes inferred from metagenomic data.Biol Direct 2: 27.
Williams PJ. (1995). Evidence for the seasonal accumula-tion of carbon-rich dissolved organic material, its scalein comparison with changes in particulate materialand the consequential effect on net C/N assimilationratios. Mar Chem 51: 17–29.
Wold S, Sjostrom M, Eriksson L. (2001). PLS regression: abasic tool of chemometrics. Chemom Intell LaboratorySyst 58: 109–130.
Wright RT, Hobbie JE. (1966). Use of glucose and acetateby bacteria and algae in aqautic ecosystems. Ecology47: 447–464.
Yentsch CS, Menzel DW. (1963). Method for thedetermination of phytoplankton chlorophylland phaeophytin by fluorescence. Deep-Sea Res 10:221–231.
Zubkov MV, Mary I, Woodward EMS, Warwick PE,Fuchs BM, Scanlan DJ et al. (2007). Microbial controlof phosphate in the nutrient-depleted North Atlanticsubtropical gyre. Environ Microbiol 9: 2079–2089.
This work is licensed under a CreativeCommons Attribution-NonCommercial-
NoDerivs 3.0 Unported License. The images or otherthird party material in this article are included in thearticle’s Creative Commons license, unless indicatedotherwise in the credit line; if the material is notincluded under the Creative Commons license, userswill need to obtain permission from the license holderto reproduce the material. To view a copyof this license, visit http://creativecommons.org/licenses/by-nc-nd/3.0/
Supplementary Information accompanies this paper on The ISME Journal website (http://www.nature.com/ismej)
SAR11 ecotype dynamics in NW MediterraneanI Salter et al
360
The ISME Journal


![Comparative Analysis of Arabidopsis Ecotypes Reveals a · Comparative Analysis of Arabidopsis Ecotypes Reveals a Role for Brassinosteroids in Root Hydrotropism1[OPEN] Rui Miao,a,2](https://img.pdfslide.us/doc/110x75/5fd77669ed73d6608c569009/comparative-analysis-of-arabidopsis-ecotypes-reveals-a-comparative-analysis-of-arabidopsis.jpg)