Embed Size (px)
Citation preview

3. Observation
3.1. General characteristics of coconut ecotypes
A detailed description of the morphological and physiological
characteristics of the eco-types and WCT selected for the study, under the
field condition is given in this section under different sub-headings.
Ecotypes selected under the study are listed in the chapter 'Materials and
Methods' (Section 2.1).
In general, ecotypes exhibited wide variability in all the characteristics.
A comparative statement of the morphological characteristics of the
ecotypes is given in table 3.1. Morphological data of individual palms under
each ecotypes and WCT are given in Annexure III to X I . - , , ., ..4
3.2. Morphological Characteristics (Pl. 3.la., 3.2a., 3.3a., 3.4a., 3.5a., 3.6aa,3.7a., 3.8a., 3.9a. and3.10a.)
3.2.1. Height
The ecotypes selected under the present study except Komadan and
CGD have not so far been subjected to similar type of study and are sparsely
distributed. It was found difficult to locate palms of same age group and
hence available palms in different locations were selected for the study. The
age of the palms selected for the study ranged from 10 to 50 and with this - ., ., - . ,
\ . - I
wide range in age, comparison of the height of the palms has got limitations.., -. . . I.
-. , .
However, data was recorded and tabulated. The height of the palms varied

from 12 rn to 29 m among the tall ecotypes and the variation is attributed to 4
the variation in age. CGD was only with lrn height. The height of WCT
varied from lorn to 15.2m. Among the ecotypes the height was more in
Elite Tall and Komadan (23.5m and 29m respectively) (Table 3.1 .)
Table.3.1. Morphological Characteristics of coconut ecotypes selected under the study
18
19
20
21
22
23
24
25
No. of nuts
Bunches with button
Bunches with nuts
Color of fruits
Shape of nut
Length of fruit (cm)
Breadth of fruit (cm) .
No- of unopened inflorescence
28.0
9.0
4.2
p 2 0 - d d
18.6 4
12.6
3.0
24.2
8.9
3.6
a E FP! 0" -
8 , 3
22.9
15.6
3.3
27.4
8.0
3.7
= f 2 J
2 196
15.4
2.6
3 2 - 9 4 2 2 . 0 g o 5
4 7 1
C
2 (3
-0 C 3
2 I a n 2
1 2 n 8
3.1
/'25.5
4.8</
4.4L/ t a3 p! 0,
- $ 8 5
19.6
12.8
2.8
9 . 9 v
3.8 C
Z C3
-
20.9
14.7
2.9
/ g o J
6.3 , 2b2J C Q)
B 'D c
21.8 i
1 7 . 4 1
33.0'
23.3
8.3
3.2 C
" z 3
2 /20.1 r
13.8
2.6
14.5
8.2
3.5 c
I e ! C3
- m B
21.1
14.6
3.0
18.1
8.0
3.2 C
C3
z a
g 21.3
17.4
2.4

The annual increment in stem height was significantly different
among the ecotypes, which again is attributed to the difference in age.
Among the ecotypes the annual increment in stem height was more in King
Coconut (62cm) followed by Kuttiyadi Tall (60cm) the lowest being
observed in Elite Tall (36cm). CGD recorded an annual stem height of
48cm. Among the WCT the height varied from 0.60 cm to 0.80 cm (Table
3.2).
The height of the palms and the annual increment in stem height
varied among the ecotypes, among the WCT and between the ecotypes and
WCT.
3.2.2. Leaf Characters
a. Leaf scars
The number of leaf scars on the stem showing the leaf shed did
not show any variation among the ecotypes, but was uniform (14). This was
varied among the WCT (1 1 to 15) and between the ecotypes and WCT (1 1
to 14). Number of leaf scars in CGD and the corresponding WCT was 15
which is attributed to more number of leaf production and leaf fall due to
the excess management care received by the cultivar in a government farm
(Table 3.2).

Ecotypes did not exhibit any difference in this parameter. But
difference was observed among WCT and between ecotype and WCT.
Table 3.2. General characteristics of coconut ecotypes - mean of three years (1999-2001)
b) Number of leaves
Number of leaves in the crown varied between 25 (Komadan) to 32
Rachis length
(m)
1.38 .
1.28
1.15
1.38
I .28 1.12
I .5
1.46
I .41
7.29 1.33
9.41
(Elite Tall) among the ecotypes. Among the WCT it varied from 27 to 32. In d
CGD total number of leaves during the study period was only 20. In the rate
Leaf scar (N 0)
14
13
14
13
14 15
15
14
11
12 73.50
9.40
Total leaves in the crown (No.)
31
32
28
32
32 20
27
28
30
25 28.50
73.46
Ecotype
Kuttiyadi Tall (KT)
WCT I
King Coconut (KC)
WCT 2
Elite Tall (ET) CGD
WCT 3
Jappanan (JPN)
WCT 4
Komadan (KO) Mean
CV%
of leaf production there was no variation among the ecotypes (13) as in the
Leaf length
(m)
5.35
5.09
4.3
4.02
4.75 4.19
5.42
5.29
5.34
4.75 4.85
10.90
Stem ht. increment
( m )
0.6
0.65
0.62
0.65
0.36 0.48
0.8
0.42
0.6
0.37 0.56
25.65
case of number of leaf scar. Among the WCT too, there was not much
variation in the rate of leaf production and it was almost on par with that of
the ecotypes (Table 3.2).

Number of leaves on the crown varied among the ecotypes, among
the WCT and not much between ecotypes and WCT. In the rate of leaf
production no significant variation was observed among the ecotypes and
among the WCT. Between the ecotypes and WCT slight variation was
observed.
c) Leaf length
Length of the leaf bearing portion varied between 3.071-11 to 3.97111
among the ecotypes. The lowest leaf length was observed in King coconut
and the maximum in Kuttiyadi Tall. Among the WCT there was not much
variation and the range was between 3.82 m to 4.01m. Between the ecotype
and WCT variation was significant. CGD exhibited the lowest leaf bearing
portion (3.07 m) (Table 3.2).
Length of the leaf bearing portion varied significantly between the
ecotypes and WCT.
d) Rachis Length
Length of the rachis varied greatly among the ecotypes and ranged
between 1.15 m (King Coconut) to 1.46 m (Jappanan). The CGD recorded
the lowest rachis length (1.12 rn). In WCT too rachis length varied from
1.28 m to 1.50 m. Maximum rachis length was recorded in WCT
(Table 3.2).

Rachis length showed significant difference among the ecotypes,
among the WCT and between ecotypes and WCT.
Leaflets leaf1
Among the ecotypes number of leaflets leaf' varied between 210 and
228 with the lowest in Komadan and highest in King Coconut. Among the
WCT the number of leaflets leaf1 ranged between 201 to 25 1. In CGD the
number of leaflets recorded was 203 (Table 3.3).
Analysis of the data revealed significant difference in this parameter
among the ecotypes, among the WCT as well as between the ecotypes and
WCT.
Table 3.3. General characteristics of coconut ecotypes - mean of three years and ten palms each
Ecotypes
Kuttiyadi
WCT 1
King
WCT 2
Elite
CGD
WCT 3
Jappanan
WCT 4
Komadan
Mean
CV%
Leaf length
(m)
5.35
5.09
4.30
4.02
4.75
4.19
5.42
5.28
5.34
4.75
4.85 70.88
Total no. of leaflets
218
201
228
232
205
203
251
214
240
210
220.20
7.69
No. of leaves on the canopy
31 .OO
31.40
27.30 - -
31.70
31.60
20.10
26.60
27.80
30. I 0
27.50
28.51
72.49
Leaf area of single leaf (m2)
(LA)
7.30
5.20
7.50 -
7.57
4.68
5.04
7.94
6.34
6.24
6.71 6.45
I 7.96
Canclp area Y (m )
226.43
163.26
204.65
240.06
148.00
101 -31
21 1.15
176.20
187.96
184.42 184.34
21.96

f) Leaf area leaf'
Leaf area leaf1 showed greater variation among the ecotypes and
ranged between 4.68m2 (Elite Tall) to 7.50m2 (King Coconut). Among the
WCT it ranged between 5.20m2 to 7.94m2. CGD exhibited the lowest leaf
area (5 .04m2).
Similarly total canopy area was also comparatively low in CGD
(52.29m2) than the ecotypes and WCT. It ranged between 148m2 to
226.43m2 in the ecotypes. The highest canopy area was recorded in
Kuttiyadi Tall followed by King Coconut and the lowest in Elite Tall. In
WCT canopy area ranged between 163 .26m2 to 240.06rn2 (Table 3.3).
Statistical analysis of the data indicated significant differences in the
LA leaf' as well as the total canopy area among the ecotypes, among the
WCT and between the ecotypes and WCT. LA leaf-' as well as total canopy
area was found to be significantly more in ecotypes and WCT than in CGD.
Among the different characters studied variability was maximum in
the total number of leaves followed by stem height increment.
When the t-value was computed significant variation was observed in
most of the characters among the ecotypes and corresponding WCT. The
summary anova of the morphological characteristics of the ecotypes and
WCT is given in Table 3.4 to 3.8.

Table 3.4. Summary Anova of the morphological characteristics of Kuttiyadi Tall and WCT 1
S. L . Significant level; ' Significant at 0.05 level; " Significant at 0.0 1 level; N. S. - Not significant
S. L.
NS
NS
NS
**
*
NS
NS
NS
NS
NS
**
**
NS
NS
**
**
NS
NS
NS
NS
**
**
NS
1
2
3
4
5
6
7
8
9
10
1 1
12
1 3
14
15
16
17
18
19
20
23
24
25
Particulars
Height of trunk (m)
Girth of trunk (cm)
No.of leaves
Length of petiole (cm)
Length of leaf bearing portion (cm)
No.of leaflets
Breadth of leaflet (cm)
Lengthofleaflet(cm)
No.of leafscars in 1 metre
Length of internode (cm)
Length of inflorescence (cm)
Length of spikelet of button bearing portion
Length of stalk (cm)
Total Length of spikelet
No. of spikelets / inflorescence.
Avr.no.of female flower
No. of bunches
No.of nuts
Bunches with button
Bunches with nuts
Lengthoffruit(cm)
Breadth of fi-uit (cm)
No.of un opened inflorescence.
Ku
Mean
12.00
75.30
31 .OO
138.10
397.80
114.00
5.00
111.80
13.50
7.00
102.40
54.30
48.20
44.20
40.90
38.80
13.20
28.00
9.00
4.20
18.60
12.60
3.00
ttiyad i
CV(%)
12.42
7.08
7.60
2.06
2.48
8.87
0.00
8.62
15.32
15.06
3.86
5.95
2.90
3.50
4.67
11.64
5.98
23.75
7.41
15.08
4.53
4.10
15.71
t-value
0.57
0.62
0.34
3.47
2.23
0.31
2.12
0.02
0.10
0.84
3.04
4.67
0.95
1.29
3.63
11.56
1.46
1.32
0.23
1.68
9.03
6.20
1.04
WCT
Mean
12.50
76.70
31.40
127.40
382.00
115.50
5.10
111.70
13.60
6.60
94.40
46.00
47.00
46.80
36.70
19.70
12.50
24.20
8.90
3.60
22.90
15.60
3.30
I
CV(%)
19.69
6.27
9.40
8.58
5.73
9.75
4.13
14.71
17.74
16.29
8.27
10.25
9.03
16.02
8.90
14.57
10.83
25.53
14.46
26.84
5.62
10.55
24.95

Table 3.5. Summary Anova of the morphological characteristics of King Coconut and WCT 2
S. L. Significant level; * Significant at 0.05 level; * Significant at 0.0 1 level; N. S. - Not significant
S.L.
**
**
"
**
**
NS
"
'*
t-value
8.72
2.87
6.10
3.80
14.44
10.12
1.03
3.76
5.01
1
2
3
4
5
6
7
8
9
1 1
12
13
14
15
16
1 7
18
19
20
23
24
25
Particulars
Height of trunk (m)
Girth of trunk (cm)
No.of leaves
Length of petiole (cm)
Length of leaf bearing portion (cm)
No.of leaflets
Breadth of leaflet (cm)
Length of leaflet (cm)
No-of leafscars in 1 metre
King
Mean
6.43
71.43
27.29
115.00
307.71
102.29
4.86
107.00
20.00
Length of inflorescence (cm)
Length of spikelet of button bearing portion
Length of stal k (cm)
Total Length of spikelet
No. of spikelets / inflorescence.
Avr.no.of female flower
No. of bunches
No.of nuts
Bunches with button
Bunches with nuts
Length of h i t (cm)
Breadth of fruit (cm)
No.of un opened inflorescence.
WCT
Mean
15.20
82.60
31.70
139.40
401.80
132.20
4.95
118.20
13.20
Coconut
CV(%)
44.78
20.38
8.39
22.42
5.72
3.56
5.02
7.61
24.66
2
CV(%)
10.65
3-43
2.99
2.12
2.87
7.24
3.19
4.37
8.60
84.86
41.86
43.71
42.A4
36.29
20.57
11.57
27.43
8.00
3.71
19.57
1 5.43
2,57
4.88
6.23
4.71
5.72
7.91
20.79
24.88
65.32
21.65
37.16
9.72
8.25
30.60
102.70
52.40
46.80
43.60
40.90 -
40.20
13.70
32.90
9.50
4.10
18.20
12.80
3.10
3.41
4.86
6.27
4.48
4.07 -
6.18
3.53
22.54
7.44
13.85
6.24
6.16
23.80
10.45
9.14
2.76
1.49
4.55 - - -
12.98
2.83
0.97
2.75
0.89
2.02
5.70
1.55
**
"
NS
**
*'
*
NS
*
NS
NS
**
NS

Table 3.6. Summary Anova of the morphological characteristics of Elite Tall and WCT 3
S. L. Significant level; ' Significant at 0.05 level; ** Significant at 0.0 1 level; N. S. - Not signfiant
1
2
3
4
5
6
7
8
9
10
1 1
1 2
13
14
15
1 6
17
18
19
20
23
24
25
Particulars
Height of trunk (m)
Girthoftrunk(cm)
No.of leaves
Length of petiole (cm)
Length of leaf bearing portion (cm)
No.of leaflets
Breadth of leaflet (cm)
Length of leaflet (cm)
No.of leafscars in 1 metre
Length of internode (cm)
Length of inflorescence (cm)
Length of spikelet of button bearing portion
Lengthofstalk(cm)
Total Length of spikelet
No. of spikelets / inflorescence.
Average no.of female flower
No.ofbunches
No.of nuts
Bunches with button
Bunches with nuts
Length of fruit (cm)
Breadth of fruit (cm)
No.of un opened inflorescence.
Elite Mean
23.50
85.00
31.60
116.60
346.50
111.00
5.00
106.40
10.50
8.60
90.40
47.40
42.70
42.70
40.20
24.30
13.70
22.00
9.90
3.80
20.90
14.70
2.90
Tall CV(%)
2.07
5.03
2.41
11.21
22.70
3.80
0.00
8.87
2.59
1.58
3.78
2.41
2.26
2.45
5.03
6.90
2.31
10.80
1.85
I .03
1.29
2.00
0.57
WCT Mean
I .35
87.60
26.60
149.90
391.10
118.70
4.85
121.50
12.50
7.40
126.10
80.90
44.60
53.90
26.10
16.00
8.50
9.00
6.30
2.20
21.80
17.50
3.00
t -value
202.02
1.10
14.18
5.01
0.77
2.74 -
29.16
4.33
20.26
24.93
8.11
12.41
2.04
24.49
18.58
13.75
58.24
19.06
61.38
126.42 1 11.15
32.39
12.27
3
CV(%)
0.32
7.15
3.06 1 11.13
45.83
7.02
0.47
5.06
1.35
1.07 ( 12.91
13.51 I
7.17
1.85
5.26
6.39 1 0.97
7.48
1.25
0.79 1 0.42
0.53
0.67
S.L.
**
NS
**
**
NS
*
*'
**
**
**
*'
**
NS
'*
"
**
**
**
**
**
"
**
*'

Table 3.7. Summary Anova of the morphological characteristics of Chowghat Green Dwarf and WCT 3
S.L. Significant level; Significant af 0.05 level; " Significant at 0.01 level; NS - Not significant
S.L.
**
**
**
**
NS
**
**
**
**
**
"
**
"
**
NS
"
**
**
**
**
**
**
**
t -value
281.64
19.21
26.29
6.07
1.60
3.49
85.62
5.69
51.13
215.23
12.06
14.78
12.55
59.55
0.00
10.51
9.91
25.35
39.09
92.96
28.95
84.22
23.72
1
2
3
4
5
6
7
8
9
10
1 1
12
13
14
I5
16
17
28
19
20
23
24
25
WCT Mean
1.35
87.60
26.60
149.90
391 .I 0
118.70
4.85
121.50
12.50
7.40
126.10
80.90
44.60
53.90
26.10
16.00
8.50
9.00
6.30
2.20
21.80
17.50
3.00
Particulars
Height of trunk (m)
Girth of trunk (cm)
No.of leaves
Length of petiole (cm)
Length of leaf bearing portion (cm)
No.of leaflets
Breadth of leaflet (cm)
Lengthofleaflet(crn)
No.of leafscars in 1 metre
Lengthofinternode(cm)
Length Of inflorescence (cm)
Length of spikelet of button bearing portion
Length of stalk (cm)
Total Length of spikelet
No. of spikelets 1 inflorescence.
Avr.no.of female flower
No.ofbunches
No.of nuts
Bunches with button
Bunches with nuts
Length of fruit (cm)
Breadth of fruit (cm)
No.of un opened inflorescence.
4
CV(%)
0.32
7.15
3.06
11.13
45.83
7.02 --
0.47
5.06
1.35
1.07
12.91
13.51
7.17
1.85
5.26
6.39 -
0.97
7.48
1.25
0.79
0.42
0.53
0.67
CGD Mean
I .OO
56.70
20.10
112.30
307. I 0
104.10
4. I 0
107.10
30.20
2.95
73.40
39.50
33.80
27.80
26.10
22.50
8.90
25.50
4.80
4.40
19.60
12.80
2.80
CV(%)
0.13
1.64
1.45
9.80
18.23
9.97
0.39
4.82
4.57
0.44
4.45
4.03
1.93
3.46
2.28
7.75
1.10
8.77
1.93
2.01
1.26
1.23
0.63

Table 3.8. Summary Anova of the morphological characteristics of Jappanan and WCT 4
S. L. Significant level; ' Significant at 0.05 level; ** Significant at 0.01 level; NS - Not significant
SL.
NS
NS
NS
NS
NS
**
**
"
NS
NS
NS
NS
NS
NS
"
NS
NS
NS
NS
NS
NS
**
t-value
1 . 9
0.84
1.87
1.44
1.73
3.38
3.36
2.97
0.60
0.66
2.34
1.49
0.84
0.61
0.55
3.28
0.25
1.44
0.19
0.65
1.60
I
3.46
1
2
3
4
5
6
7
8
9
10
1 1
12
13
14
15
1 6
17
18
19
20
23
24
25
WCT Mean
10.00
91.00
30.10
140.90
393.40
109.50
5.05
107.40
10.20
8.80
107.40
56.40
48.50
47.60
40.80
36.60
11.80
14.50
8.20
3.50
21.10
14.60
3.00
Particulars
Height of trunk (m)
Girth of trunk (cm)
No.of leaves
Length of petiole (cm)
Length of leaf bearing portion (cm)
No.of leaflets
Breadth of Ieaflet (cm)
Length of leaflet (cm)
No.of leafscars in 1 metre
Length of internode (cm)
Length Of inflorescence (cm)
Lengthofspikeletofbuttonbearing portion
Length of stalk (cm)
Total Length of spikelet
No. of spikelets / inflorescence.
Avr.no.of female flower
No. of bunches
No.ofnuts
Bunches with button
Bunches with nuts
Length of fruit (cm)
Breadth of h i t (cm)
No.of un opened inflorescence.
4 CV(%)
24.04
5.15
9.46
6.85
2.40
3.14
3.13
1.77
4.13
4.79
4.26
7.44
4.37
4.34
3.43
10.64
11.16
43.16
13.85
24.28
7.56
12.17
0.00
Jappanan Mean
13.60
94.10
27.80
145.50
383.50
116.10
5.35
116.00
10.40
9.00
101.80
53.80
47.40
48.50
39.90
26.30
11.60
23.30
8.30
3.20
20. I 0
13.80
2.60
CV(%)
44.14
12.55
9.56
3.16
4.22
4.55
4.51
9.54
10.34
10.48
6.03
6.72
7.91
9.39
14.68
38.61
19.99
90.57
15.08
38.41
5.96
8.91
19.86

Table 3,9. Summary Anova of the morphological characteristics of Komadan and WCT 4
S. L. Significant level; Significant at 0.05 levef " Significant at 0.01 level; NS - Not significant
S.L.
**
NS
NS
NS
**
"
NS
*
**
'*
**
**
'*
*'
**
*'
NS
NS
NS
NS
NS
**
"
1
2
3
4
5
6
7
8
9
10
1 1
12
13
14
15
16
17
18
19
20
23
24
25
Particulars
Height of trunk (m)
Girth of trunk (cm)
No.of leaves
Length of petiole (cm)
Length of leaf bearing portion (cm)
No.of leaflets
Breadth of leaflet (cm)
Length of leaflet (cm)
No.of leafscars in 1 metre
Length of internode (cm)
Length of inflorescence (cm)
Length of spikelet of button bearing portion
Lengthofstalk(cm)
Total Length of spikelet
No. of spikelets 1 inflorescence.
Avr.no.of female flower
No.ofbunches
No.of nuts
Bunches with button
Bunches with nuts
Lengthofhi t (crn)
Breadth of fruit (cm)
No.of un opened inflorescence.
Komadan Mean
29.00
91.80
27.50
128.80
345.90
103.10
4.90
101 .SO
12.00
7.50
89.90
46.10
42.70
40.50
31.30
12.80
11.10
18.10
8.00
3.20
21.30
17.10
2.40
CV(%)
26.06
5.57
12,27
17.04
7.68
3.15
4.30
7.05
19.25
18.05
6.60
6.42
6.63
3.90
8.53
21.73
16.69
46.84
16.67
19.76
6.28
5.12
35.14
t-value
8.53
0.36
1.87
1.71
5.90
4.28
1.82
2.92
2.95
3.27
7.45
6.44
5.24
8.71
10.45
15.95
0.99
1.09
0.36
0.91
0.30
4.22
3.18
WCT Mean
10.00
91.00
30.10
140.90
393.40
109.50
5.05
107.40
10.20
8.80
107.40
56.40
48.50
47.60
40.80
36.60
11.80
14.50
8.20
3.50
21.10
14.60
3.00
4 CV(%)
24.04
5.15
9.46
6.85
2.40
3.14
3.13
1.77
4.13
4.79
4.26
7.44
4.37
4.34
3.43
10.64 -
11.16
43.16
13.85
24.28
7.56
12.17
0.00

3.3. Physiological characteristics
3.3.1. Dry matter production
a) Stem
Annual stem dry matter varied greatly among the ecotypes and ranged
between 3.26kg and 5.69kg. Among the ecotypes the maximum stem dry
weight observed was in King Coconut followed by Kuttiyadi Tall (5.5 lkg)
and the lowest recorded in Elite Tall. WCT showed a high SDM than the
ecotypes and was more or less similar in different WCTs. The stem dry
matter production was low in CGD (4.38kg) and was found to be higher
than the stem dry weight of Elite Tall and Komadan (Table 3.10).
Analysis of the data revealed significant difference in this parameter
between the ecotypes and WCT. Among all, the West Coast Tall recorded
higher stem dry matter production than the tall ecotypes and CGD.

Table 3.10. Stem Dry Matter Production
b) Leaf
As in the case of stem DM, the leaf DM produced year'1 also was
found to be higher in the tall ecotypes than the WCT and CGD. It ranged
between 19.90kg (Elite Tall) and 38.23kg (King Coconut) among the tall
ecotypes. CGD recorded a DM production of 21.42kg. Among the WCT it
ranged between 20.23kg to 40.86kg (Table 3.1 1).
Annual Stem dry weight
(kg) (ASDW)
5.51
5.98
5.69
5.98
3.26
4.38
5.98
5.04
4.57
3.35
4.97
21.09
The variation in leaf DM production between the ecotypes and WCT
were found to be highly significant. The leaf dry matter production of CGD
was significantly lower than the tall ecotypes and WCT.
Height of 3 leafscars segment
(m)
12.86
15.00
13.29
15.00
7.71
9.60
13.00
11.79
13.64
9.25
12.1 1
20.53
No. of 3 leafscar
segments
4.67
4.33
4.67
4.33
4.67
5-00
5.00
4.67
3.67
4.00
4.50
9.40
No. of leafscars
14
13
14
13
14
15
15
14
A I
12
13.50
9.40
Ecoty pes
Kuttiyadi
WCT
King
WCT
Elite
CGD
WCT
Jappanan
WCT
Komadan
Mean
CV%
Growth in One year
(cm)
60
65
62
65
36
48
65
55
50
37
54.30
20.62

Table 3.11. Leaf Area (LA) and Leaf Dry Matter Production (LDM)
3.3.2. Yield and yield components
(P1.3.1 b & c , 3 .2b l &b2, 3 . 3 b & c , 3 . 4 b & c , 3 . 5 b & c , 3 . 6 b l & b2,3.7bl & b2,3.8b & c, 3.9b &c and 3.10bl & b2)
Total leaf dry matter (kg)
(TLDM)
35.60
20.23
38.23
36.26
19.90
21.42
40.86
29.94
28.51
28.80
29.9 7
25.63
a) Yield
Leaf dry matter of single leaf
(LDM)
2.74
1.69
2.94
3.02
1.53
1.65
3.41
2.30
2.59
2.40
2.43
26.33
Total nut production palm-1 did not show much variation
No. of leaves produced
yeai'
13.00
12.00
13.00
12.00
13.00
13.00
12.00
13.00
I I .OO
12.00
12.40
5.64
among the ecotypes except in the case of Komadan. Nut production was
Total no. of
leaflets
218
201
228
232
205
203
251
214
240
210
220
8
Ecoty pes
Ku ttiyad i
WCT 1
King
WCT 2
Elite
CGD
WCT 3
Jappanan
WCT 4
Komadan
Mean
CV%
higher in tall ecotypes than WCT and CGD. But CGD and WCT showed
similarity in nut production (Table 3.12).
Weight of 6 dry leaflets
(gm)
90
54
90
90
42
50
90
72
60
81
72
26

Nut production year'' showed not much significant difference among
the ecotypes. Nut production was significantly more in ecotypes than in
WCT and CGD.
Table 3.12. Yield and yield components palm" y e a 8 mean of ten palms for three years
b) Yield components
Number of bunches produced showed significant variation
among the ecotypes and it ranged between 1 1.5 and 13.2. Bunch production
was low in CGD (8.2) and high in ecotypes and WCT. All the ecotypes
exhibited higher production of bunches. WCT recorded similar trend in
production of bunches.
Fruit ,,t %
23.43
36.55
50.42
18.48
30.04
39.51
57.74
43.04
18.52
63.92
38
41.72
flowers female
512.16
246.25
237.99
541.15
332.91
202.50
138.55
278.78
431.88
140.80
306
47.35
Ecotype
Kuttiyadi Tall (KT)
WCT 1
King Coconut (KC)
WCT 2
Elite Tall (ET)
Chowghat Green Dwarf (CGD)
WCT 3
Jappanan (JPN)
WCT 4
Komadan (KO) Mean
CV%
Total nut production
120
90
120 100
I00
80
80
120
80
90 98
77
Number
bunches
13.20
12.50
1 1 -57 13.70
13.70
9.00
8.50
10.60
I I .80
11.00 12
7 5.78
Female flower bunch" ('0)
38.80
19.70
20.57 39.50
24.30
22.50
16.30
26.30
36.60
12.80 26
36.87

Number of spikelets bunch-' also did not show significant variation
among the ecotypes which varied from 31.3 to 40.9. Number of spikelets
was more in Kuttiyadi and Elite Tall and low in CGD (26.1).
Number of female flower production palm-1 showed significant
variation among the ecotypes and ranged between 140.8 (Komadan) to
5 12.16 (Kuttiyadi Tall). WCT too exhibited high female flower production.
In general higher female flower production was observed in the ecotypes.
CGD showed female flower production of 202.5. Significant difference
existed in this parameter among the ecotypes as well as among the WCT.
Female flower production was found to be significantly more in the
ecotypes except in Komadan.
Percentage of fruit setting also differed among the ecotypes. It ranged
between 23.43 (Kuttiyadi Tall) to 63.92 (Komadan) in the ecotypes. As in
the case of female flower production the percentage of h i t set was found to
be higher in the ecotypes under study (Table 3.12).
Number of bunches, number of female flowers and percentage of h i t
set was higher in the ecotypes than in WCT and CGD.

3.4. Dry matter production among the ecotypes
a) Vegetative Dry Matter (VDM)
Annual vegetative dry matter (VDM) which is the sum of the leaf dry
matter and stem dry matter varied among the ecotypes, among the WCT and
between the ecotypes and WCT. It ranged between 17.1 1 kg and 43.92kg
between the ecotypes, the lowest and highest being observed in Elite Tall
and King Coconut respectively. In WCT, VDM production was
comparatively lower than the ecotypes except in King Coconut where, the
percentage difference was negligible. The percentage difference in VDM
between the ecotype and WCT was more in Jappanan followed by Kuttiyadi
Tall. The VDM was lowest in CGD (1 1.88). However the difference was
not significant in WCT (Table 3.13 & Fig 3.1).
VDM production was found to be significantly different among the
ecotypes as well as between the ecotypes and the WCT. VDM production
was significantly higher in the ecotypes when compared to the
corresponding WCT.

Table 3.13. Vegetative Dry Matter Production O M ) palm" yeail
Ecotypes Leaf dry matter (LDM) (kg)
1 King Coconut
Kuttiyadi Tall
WCT 1
Stem dry matter (sow (kg)
1 CGD
Vegetative Dry Matter (VDM) (kg)
-
35.60
20.23
WCT 2
Elite Tall
I WCT 3 1 40.86 1 5.98 1 46.84 I
5.51
5.98
36.26
19.90
1 Kornadan
41.11
26.21
I Jappanan
1 Mean I 29.9 7 I 4.97 I 34.95 I
5.98
3.26
29.94
b) Reproductory Dry Matter (RDM)
42.23
23.15
Reproductory dry matter (RDM) showed variations among the
ecotypes and it ranged fiom 65.94kg (Komadan) to 124.43 kg (Jappanan).
Kuttiyadi Tall recorded an RDM of 84.72kg, King Coconut 71.16kg and
Komadan 65.94kg. RDM production by CGD was 33.99 kg. The variation
in RDM production in WCT was not highly significant; which varied from
53.87kg to 62.34kg (Table 3.14 & Fig 3.2).
Analysis of the data revealed that RDM production was significantly
varied among the ecotypes and between the ecotypes and WCT as observed

in the case of VDM. The CGD recorded the lowest RDM production
compared to all ecotypes and WCTs. All ecotypes recorded highest RDM
than the WCTs.
Table 3.14. Reproductory Dry Matter (RDM) Production palm'1
C. Nut components
Nut components like husk, shell and copra and oil content were
estimated for all ecotypes and WCT, since RDM depends mainly on nut
production. Nut components showed significant differences among the
ecotypes and between the ecotypes and WCT (Table 3.15).
No. of inflore- scence
13
12.5
12
13
14
9
9
13
12
Dry Wt. of spathe
(9)
410
400
400
410
370
380
410
430
400
RDM
84.72
58.21
71.16
62.34
68.50
33.99
53.87
124.43
54.88
370 11 65.94
Copra weight
(g)
149
156
173
150
160
87
150
216
164
Dry Shell weight (g)
119
123
127
119
128
68
119
175
143
Kuttiyadi Tall
WCT I
King Coconut
WCT 2
Elite Tall
CGD
WCT 3
Jappanan
WCT 4
Mean
CV%
Dry Husk weight (g)
321
233
198
227
278
181
293
543
247
No. of
nuts
120
90
120
100
100
80
80
120
80
285
36
Dry Wt. of bunch
(9)
670
570
550
570
480
410
580
520
480
126
21
158
20
98
17
530
74
398
5
72
14
67.80
35.23

Table 3.15. Fruit Analysis Data of Ecotypes and WCT in Kerala
Husk
Varieties
Kuttiyadi Tall
WCT 1
Husk weight showed significant variation among the eaotypes which
ranged from 454 g (King Coconut) to 1002g (Jappanan) among the tall
ecotypes. Husk weight in Kuttiyadi Tall was 628 g, Komadan 601 g and
Elite Tall 500 g. CGD recorded the lowest husk weight (18lg).The husk
weight in WCT varied from 476 g to 663 g (Table 3.15).
Analysis of the data showed significant variation in husk weight
among the ecotypes and between the ecotypes and WCT. The difference in
husk weight in WCT was not significant.
- w
1176
1139
King coconut
WCT 2
Elite Tall
CGD
WCT 3
Jappanan
WCT 4
Komadan
Mean
548
540
524
464
508
301
547
732
658
591
541
21
978
940
1008
636
1098
1734
1321
1192
1122
CV% 25
628
599
454
476
500
335
551
1002
663
601
581 ---- 30
119
123
127
119
128
68
143
175
143
135
128
103
113
118
249
96
62
114
205
160
109
733
27 30
326
304 ----------
279
96
284
171
290
352
355
347
280
20
149
I56
173
150
160
87
160
216
164
171
159
2.84
67.91
70.40
72.07
67.24
67.65
67.10
65.12
66.91
67.50
68.00
67.99 ----- 27.98 8.14
59.49
56.30
53.24 1 20.69
55.91
56.81
53.02
48.09
53.95
58.71
51.62
27.19
28.89
33.02
32.33
31.50
28.90
29.25
29.51
24.92
28.93
29.44

Shell
As in the case of husk, dry weight of shell showed difference among
the ecotypes and between ecotypes and WCT. Shell weight was maximum
in Jappanan (1 75g) followed by Komadan (135g), Elite Tall (128g), King
Coconut (127g) and Kuttiyadi (1 19g). CGD recorded the lowest shell
weight of 68g. WCT showed only minimum variation in shell weight with
the maximum and minimum being 1 19 and 143 respectively (Table 3.14 &
3.15).
In the study shell weight showed difference among the ecotypes but
not between the ecotypes and WCT except in the case of Jappanan. CGD
showed the lowest shell weight.
Copra
Copra weight nut-' showed greater variation among the ecotypes and
between ecotypes and WCT. Among the tall ecotypes copra weight was
higher in Jappanan (216g) and lower in Kuttiyadi (149g). CGD recorded
very low copra content (87g). Between the ecotypes and WCT maximum
variation was observed in Jappanan and the lowest was in Kuttiyadi and
Komadan. Among the WCT too, variation in copra weight was observed
which ranged from 164g to 150g (Table 3.14 & 3.1 5). The nut
characteristics of ail ecotypes are depicted in figure 3.3 to 3.9.

Analysis of the data showed significant variation in the copra content
among the genotypes, among the WCT and between ecotypes and WCT.
Table 3.16. Correlation coefficients among nut characters
Total weight With
KO
Weight of husked nut with
WCT4
0.6357
0.9749
0.3323
0.01 13
Weight of copra with
CGD WCT3
0.4980
0.9761
0.7858
0.831 1
KT
0.5791
0.2666
0.5075
0.5255
When the correlation coefficient among different nut characters was
studied, the total weight of nut was highly correlated to the weight of husk
in all the ecotypes and WCT. The weight of de-husked nut showed high
correlation to that of nut water and in the case of copra high correlation was
WCT3 KC WCT 1
0.4039
0.7623
0.5153
0.6840
0.8237
0.7343
0.7342
0.7755
to that of shell (Table 3.16).
JPN
0.5708
0.9432
0.6274
0.5678
0.4687
0.9661
0.5375
0,4729
0.8805
0.9530
0.4019
0.3643
Wt of water
Wtof husk
Wt of shell
Wt of copra
-0.1206
0.6650
WCT2
0.7612
0.3603
0.7285
0,8432
Wt of water
~ t o f h u s k
wt of shell
Wt of copra
ET
0.5864
0.9613
0.7806
0.7986
0.61 72
0.9260
0.4313
0.2435
0.7612
0.3603
0.7285
0.8432
0.2764
0.7504
0.1 732
0.7833
~t of husk
wt of shell
0.71 57
0.9216
0.3487
0.3366
0.9397
-0.0604
0.7122
0.7109
0.7699
0.5652
0.8876
0.8396
0.8424
0.1289
0.4058
0.4827
0.4687
0.9661
0.5375
0.4729
0.6708
0.7803
0.0681
0.6330
0.7230
0.6734
0.5761
0.4984
0.8923
-0.1027
0.8330
0.8356
0.9036
0.1487
0.1740
0.0618
0.0502
0.9737
0.8615
0.4718
0.7965
0.6803
0.9473
0.6838
0.5241
0.5982
0.2764
0.7504
-0.0392
0.9447
0.1693
0.8768
0.4070
0.7837
0.7866
0.9353

Table 3.1 7. Nut cornponen t analysis (d.wt.nutm') of ecotypes
Dry Weight ~ u f '
Based on the dry weight of nut components like husk, shell and copra,
total weight nut-' was calculated. Maximum nut dry weight was recorded in
Jappanan (9348) followed by Komadan (630g) and Kuttiyadi Tall (589g).
Elite Tall and King Coconut recorded 5668 and 4988 respectively. WCT did
not show much variation and ranged between 4968 and 562g. CGD showed
the lowest nut dry weight (3368) (Table 3.17 & Fig 3.10).
Total weight (gm)
589
512
498
496
566
336
562
934
554
630
568
27
Kuttiyadi Tall
WCT ?
King Coconut
WCT 2
Elite Tall
CGD
WCT 3
Jappanan
WCT 4
Komadan
Mean
CV%
Dry weight nut-' showed marked variation among the ecotypes and
between the ecotypes and WCT but not much variation in the WCT.
Husk weight (gm)
321
233
198
227
278
181
293
543
247
324
285
36
Shell weight (gm)
119
123
127
119
128
68
119
175
143
135
126
27
Copra weight (gm)
149
1 56
A 73
150
160
87
150
216
164
171
758
20

c. Total Dry Matter (TDM) Production palm-1 year"1
Total Dry Matter Production (sum of VDM and RDM) exhibited
similar trend as in RDM showing great variation among the ecotypes,
among the WCT and between the ecotypes and WCT. Total Dry Matter
production was higher in Jappanan (1 59.4 1 kg) and lower in Elite Tall (91.65
kg). Kuttiyadi Tall gave 125.83 kg, King Coconut 1 15.08kg and Komadan
98.09kg. CGD showed lowest TDM (59.79kg) among the ecotypes. In the
WCT, it varied between 84.41kg to 104.57kg (Table 3.18 & Fig 3.11).
When the total dry matter production palm-1 was estimated the
same result was obtained, the quantity of dry matter being 27.90 tonne in
Jappanan followed by 22.02 tonne in Kuttiyadi Tall, 20.14 tonne in King
Coconut and 17.17 tonne in Komadan and 16.04kg tonne in
Elite Tall. CGD produced 10.46 tonne dry matter The dry matter
production by WCT did not vary much and the range was 14.7 tonne
to 18.30 tonne
Between the ecotype and WCT the variation was maximum in
Jappanan, followed by Kuttiayadi, and the lowest in King Coconut.

Table 3.18. Total Dry Matter Production (TDM) palm-' yearB1
Analysis of the data revealed significant differences in TDM
production among the ecotypes and between the ecotypes and WCT. Total
DM production was significantly higher in Jappanan. All the ecotypes
showed higher Dry Matter Production than WCT.
d. Total Nut Production
Total nut production palm-1 showed variation among the
ecotypes and between the ecotypes and WCT. The nut production in Tall
ecotypes ranged between 90 (Komadan) to 120 (Kuttiyadi, King Coconut
and Jappanan). In CGD nut production was only 80 nuts. There was not
much difference in yield in WCT. It ranged between 80 to 90 (Table 3.19).
Ecotypes
Kuttiyadi
WCT I
King
WCT 2
Elite
CGD
WCT 3
Jappanan
Re~roductor~ matter (RDM)
(kg)
Vegetative Matter (VDM)
(kg)
41.11
26.21
43.92
42.23
23.15
25.80
46.84
34.98
Komadan
Mean
CV%
Total Dry Matter (TDM) (kg)
TDM ham1 yeail
(tons)
32.15
34.95
23.81
22.02
14.77
20.14
18.30 16.04
10.46
17.62
27.90
84.72
58.21
71.16
62.34
68.50
33.99
53.87
124.43
125.83
84.41
11 5.08
104.57
91.65
59.79
100.71
159.41
65.94
67.80
35.23
98.09 702.75
26.05
17.17
f 7.98
26.05

Analysis of the data revealed significant difference in total nut yield
among the ecotypes and between the ecotype and WCT. Among WCT no
wide variation was noticed.
e. Total Copra Production
Copra production varied greatly among the ecotypes and between the
ecotypes and WCT. Among the ecotypes it varied between 25.92kg to
1 5.3 9kg. The highest copra content recorded among the tall ecotypes was in
Jappanan followed by King Coconut and Kuttiyadi Tall and the lowest in
Komadan. CGD recorded the lowest copra content (6.96kg). All Tall
ecotypes excelled the WCT in copra production (Table 3.19).
WCT did not show much variation in copra content. Between the
ecotypes and WCT the highest variation was observed in Jappanan.
Analysis of the data revealed significant variation in this parameter
among the ecotypes and between the ecotypes and WCT. Significantly
higher copra production was observed in Jappanan than other ecotypes and
lower copra production was found in CGD. Among the WCT there was not
much variation. All ecotypes showed comparatively higher copra output
than the WCT.

Table 3.19. Total Copra Production
f. Total Nut Dry Weight palm-' year-'
When total nut dry weight was estimated significant
variation was observed among the ecotypes and between the ecotypes and
WCT. It varied between 112.08 kg (Jappanan) followed by 70.68 kg
(Kuttiyadi Tall). King Coconut recorded a total nut dry weight of 59.76 kg,
Elite Tall 56.6 kg and Komadan 56.7 kg. CGD registered the lowest weight
of 26.88 kg. Among the WCT, not much variation was observed in this
Copra weight 1 palm 1 year (kg)
17.88
14.04
20.76
15.00
16.00
6.96
12.00
25.92
13.12 --
15.39
75.77
33
parameter. The highest weight noticed in WCT was 49.6 kg and the lowest
44.32 kg (Table 3.20).
No. of nuts
120
90
120
100
100
80
80
120
80
Ecotypes
Kuttiyadi Tall
WCT I
King Coconut
WCT 2
Elite Tall
CGD
WCT 3
Jappanan
WCT 4
Copra weight (g)
149
156
173
150
160
87
A 50
216
164
Komadan
Mean
CV%
171
f58
20
90
98
17

Table 3.20. Total Nut Dry Weight
Significant difference exhibited in total nut dry weight among the
ecotypes and between the ecotypes and WCT. Among the WCT no
significant difference was observed.
3.5. Partitioning of nut dry weight towards its components
TNDW (kg)
70.68
46.08
59.76
49.60
56.60
26.88
44.96
112.08
44.32
56.70
56.77
40
The nut dry matter was partitioned towards its husk weight, shell
weight and copra weight (Table 3.20). The percentage of husk weight was
maximum in the ecotype Jappanan (58.14) followed by Kuttiyadi Tall
(54.50) and Komadan (5 1.43), the lowest being in King Coconut (39.76).
The percentage of husk weight in WCT did not show much variation except
the cultivar located in DSP Farrn, Neriamangalam. Husk weight estimated
in CGD was 53.87 percent.
of nuts
120
90
120
100
100
80
80
120
80
90
98
17
weight (g)
149
156
173
150
160
87
150
216
1 64
171
158
20
Ecotypes
Kuttiyadi Tall
WCT 1
King Coconut
WCT 2
Elite Tall
CGG
WCT 3
Jappanan
WCT 4
Komadan
Mean
CV%
Husk weight (g)
321
233
198
227
278
181
293
543
247
324
285
36
Shell weight (g)
119
123
127
119
128
68
119
175
143
135
126
21

The percentage of shell weight was maximum in King Coconut
(25.50) followed by Elite Tall (22.6 1) and Komadan (2 1.43). CGD recorded
the lowest shell weight (20.24). The WCT did not show significant variation
in the shell weight and it ranged between 2 1.17 to 25.8 1.
The partitioning of copra percentage showed variation among the
ecotypes as well as between the ecotypes and WCT. The percentage of
copra ranged between 34.74 (King Coconut) and 23.13 (Jappanan). The
percentage of copra recorded in Elite Tall was 28.27 and that in Kornadan
was 27.14 and in Kuttiyadi 25.30. Among the WCT, the percentage of copra
content was highest in that located in Kuttiyadi followed by Chazhur. The
CGD recorded 25.89 percentage copra content (Table 3.2 1). Though in
relative terms, percentage of copra is low in Jappanan, in real terms the
highest copra weight was observed in this ecotype.
The percentage of husk, shell and copra showed significant variation
among the ecotypes and between the ecotypes and WCT.

Table 3.21. Partitioning of Nut Dry Matter towards its components --
3.6. Harvest Index (HI)
Harvest index was calculated taking into account the total nut weight
to the total plant dry matter as well as total copra production to total dry
matter. Harvest index showed variation among the ecotypes, and between
the ecotypes and WCT. Harvest Index varied between 0.52 (King Coconut)
to 0.73 (Jappanan) when it was estimated to total nut weight. The HI in the
case of other ecotypes was in the order of 0.66 in the case of elite tall, 0.60
in Komadan and 0.56 in the case of Kuttiyadi Tall. CGD recorded HI of
0.59. When the Harvest Index to total copra production was computed it
ranged between 0.14 (Kuttiyadi Tall) to 0.19 (Elite Tall). King Coconut
% of copra
25.30
30.47
34.74
30.24
28.27
25.89
26.69
23.13
29.60
27.14 - -
28.75
12
Ecotypes
Kutt~yadi Tall
WCT I
King Coconut
WCT 2
Elite Tall
CGD
WCT 3
Jappanan
WCT 4
Komadan
Mean
CV%
% of shell
20.20
24.02
25.50
23.99
22.61
20.24
21.17
18.74
25.81
21.43
22.37
71
Copra weight
149
156
173
150
160
87
150
216
164
171 -
758
20
Shell weight
119
123
127
119
128
68
119
175
143
135
726
21
Husk weight
321
233
198
227
278
181
293
543
247
324
285
36
% of husk
54.50
45.51
39.76
45.77
49.12
53.87
52.14
58.14
44.58
51.43 -
49.48
7 7

registered harvest index of 0.1 8, Jappman 0.17 and Komadan 0.16. Among
the WCT no significant variation was observed in this parameter. WCT
showed Harvest Index ranging from 0.47 to 0.65 when the total nut weight
was taken into account and it ranged between 0.14 to 0.19 when total copra
weight was taken. CGD recorded a Harvest Index of 0.15 (Table 3.22 to
3.24 & Fig 3.12).
HI in respect of ecotypes was higher than the WCT. Among the
ecotypes HI varied between 0.14 to 0.19.
Table 3.22. Harvest Index (HI) Based on the Nut Weight
Ecotypes
Kuttiyadi Tall
WCT I
King Coconut
WCT 2
Elite Tall
CGD
WCT 3
Jappanan
WCT 4
Komadan
Mean
CV%
Total Dry Matter (kg)
(TDM)
125.83
82.72
115.08
104.57
85.61
45.87
68.71
154.16
70.4 1
94.70
94.77
33.1 7
Total Nut weight I palm 1 year (kg)
70.68
46.08
59.76
49.60
56.60
26.88
44.96
112.08
44.32
56.70
56.77
39.89
Harvest index
0.56
0.56
0.52
0.47
0.66
0.59
0.65
0.73
0.63
0.60
0.60
f2.41
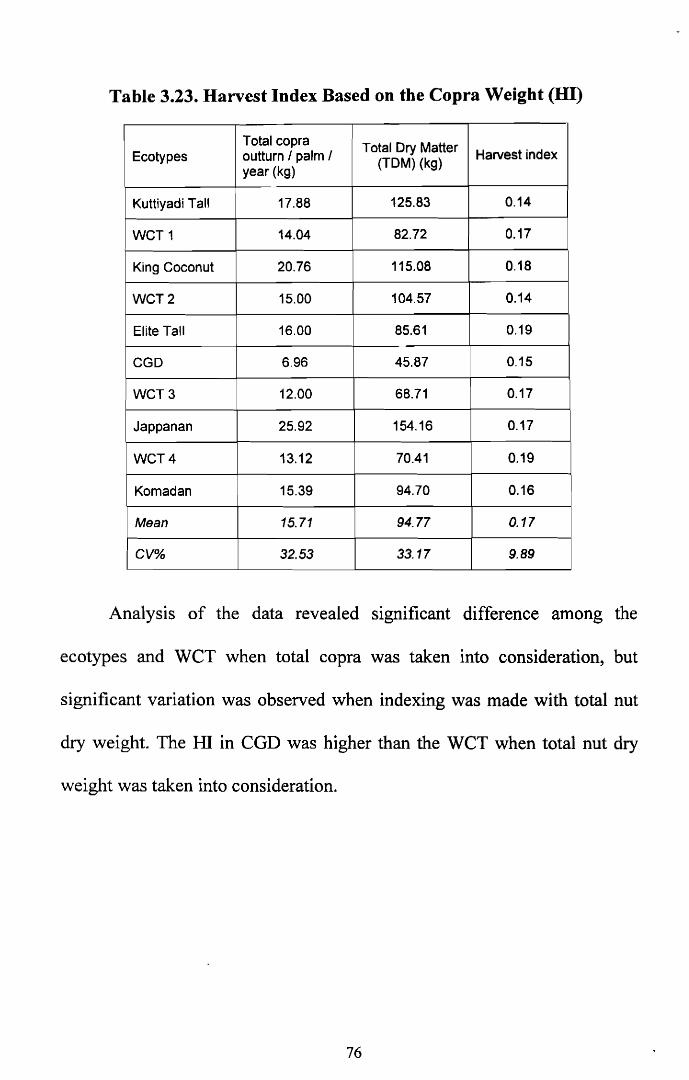
Table 3.23. Harvest Index Based on the Copra Weight (HI)
Analysis of the data revealed significant difference among the
ecotypes and WCT when total copra was taken into consideration, but
significant variation was observed when indexing was made with total nut
dry weight. The HI in CGD was higher than the WCT when total nut dry
weight was taken into consideration.
Harvest index
0.14
0.17
0.18
0.14
0.19
0.15
0.17
0.17
0.19
0.16
0.17
9.89
Total Matter (TDM) (kg)
A25.83
82.72
115.08
104.57
85.61
45.87
68.71
154.16
70.41
94.70
94.77
33. I 7
Ecoty pes
Kuttiyadi Tall
WCT 1
King Coconut
WCT 2
Elite Tall
CGD
WCT 3
Jappanan
WCT 4
Komadan
Mean
CV%
Total copra outturn I palm I Year (kg)
17.88
14.04
20.76
15.00
16.00
6.96
12.00
25.92
13.12
15.39
75.71
32.53

Table 3.24. Dry matter production palm-1 and HI in the coconut Ecotypes
3.7. Oil Content
Oil percentage in copra was calculated for ecotypes and WCT.
Significant difference was observed in the oil content among the ecotypes
and between the ecotypes and WCT. Among the ecotypes King Coconut
exhibited the highest oil percentage 72.071 followed by CGD (67.996) and
Kut-tiyadi Tall (67.9 1 3). All ecotypes showed significant difference in the
oil content with the corresponding WCT. In WCT, the oil content ranged
between 70.40 and 68.716 (Table 3.25 & Fig 3.13).
Ecoty pe
Kuttiyadi
WCT 1
King
WCT 2
Elite
CGD
WCT 3
Jappanan
WCT 4
Komadan
Mean
CV%
Total nut dry weight
(kg)
70.68
46.08
59.76
49.60
56.60
26.88
44.96
112.08
44.32
56.70
56.77
39.89
I
VDM (kg)
41.1 I
24.51
43.92
42.23
17.1 I
11.88
14.84
29.73
15.53
28.76
26.96
45.25
HI nut
production
120
90
4 20
I00
100
80
80
120
80
90
98
17
Copra/ TDM
0.14
0.17
0.18
0.14
0.19
0.15
0.17
0.17
0.19
0.16
0.17
9.89
RDM (kg)
84.72
58.21
71.16
62.34
68.50
33.99
53.87
124.43
54.88
65.94
67.80
35.23
Total copra
produdion (kg)
17.88
14.04
20.76
15.00
16.00
6.96
12.00
25.92
13.12
15.39
15.71
32.53
NU^ ~t I TDM
0.56
0.56
0.52
0.47
0.66
0.59
0.65
0.73
0.63
0.60
0.60
72.41
Total DM (kg)
125.83
82.72
115.08
104.57
85.61
45.87
68.71
154.16
70.41
94.70
94.77
33.17

Table 3.25. Oil content of the copra of the identified ecotype samples
The total oil output palm-' and ha-' was estimated based on the total
copra output year'1 and the palm density (Table 3.25 & 3.26). The
highest oil output was 17.39 kg palm-' year-' and 3.04 tonne ha-' year'1
respectively in Jappanan and the lowest was 10.30 kg palm-' year-' and 1.80
tonne ham' yearm1 in Komadan. The Jappanan was followed by King Coconut
(14.96kg palm-1 year" and 2.62 tonnes ha-' and Kuttiyadi Tall
(1 2.14kg palm-1 year-' and 2.12 tonne ha" yearw1) In WCT, the highest oil
output was recorded from Chazhoor, Thrissur (10.09 kg palm-' year" and
1.77 tonnes ham' followed by Thiruvampady (9.88 kg palm-' year-'
and 1.73 tonnes ha-' yearm1). The oil output recorded from CGD was the
lowest (4.73 kg and 0.83 tonnes hdl
CV(%)
3.23
2.20
1.39
4.02
Mean
67.91
70.40
72.07
67.24
Name of ecotype
Kuttiyadi tall
WCT I
King Coconut
WCT 2
Period of observation
68.00
67.51 ~~~~~~~- 64.07
67.45
64.03
66.07
67.42
3.62
69.42 2.82 68.04
66.79
69.87
June 2001
64.62
70.53
73.69
64.17
70.63
67.25
66.78
66. I 0 ------ 67.4 1
69.2 7
3. j8
Jappanan
March 2001
70.38
72.15
71.70
70.86
April 2000
68.89
71 -42
71.81
68.03
68.26
72.47
67.96
67.22
68.91
68.22
4.86
67.01
August 2000
68.67
68.14
71 .OO
64.96
66.32
64.5 1
November 2000
67.00
69.76
72.1 5
68.20 ---
68.00
68.72
67.10
65.12
66.91
68. f f
2.84
Komadan
Mean
CV%
2.34
4.64
0.94
2.29
2.15 67.08
68.31
3.50
65.09
67.34
3.24

There was no variation in the oil percent between the seasons
(Table 3.25)
Table 3.26. Total Oil Output
3.8. Biochemical Characteristics
Acid Value and Free Fatty Acid of Coconut Oil
Total Oil output ha" (ton)
2.12
I .73
2.62
1.77
I .89
0.83
I .44
3.04
I .50
1.80
7.87
33
Name of ecotype
Kuttiyadi Tall
WCT 1
King Coconut
WCT 2
Elite Tall
CGD
WCT 3
Jappanan
WCT 4
Komadan
Mean
CV%
Except for the ecotypes Kuttiyadi, Jappanan and CGD, acid value of
coconut oil of all other ecotypes and WCT was around 0.4 to 0.5. Acid
value was more than one in the case of Kuttiyadi in most of the analysis.
Similarly for Jappanan and CGD this phenomenon was observed which is
attributed to the inferior quality of copra due to storage and moisture content
Oil output lpalm 1 year (kg)
12.14
9.88
14.96
10.09
I 0.82
4.73
8.25
17.39
8.54
10.30
10.77
33
(Table 3.27).

L
Table 3.27. Acid Value of the copra of the identified ecotypes
3.9. Leaf Polyphenol
There was no significant variation in the phenol content among the
ecotypes or between the ecotypes and WCT. Among the ecotypes leaf
polyphenol content was high in CGD (9.01) followed by Jappanan (8.74)
Average
1,101
0.441
0.324
0.452
0.432
0.843
0.569 0.905
0.624
0.499 0.62
40.39
Name of ecotype
Kuttiyadi tall
WCT I
King Coconut WCT 2
Elite tall CGD WCT 3
Jappanan
WCT 4
Komadan Mean CV%
(Table 3.28).
Table 3.28. Polyphenol content
Period of observation
Variety
Kuttiyadi Tall
WCT 1
King Coconut
WCT 2
CGD
WCT 3
Jappanan
WCT 4
Komadan
Mean
CV%
March 2001
1.275
0.612
0.540
0.419
0.243
0.257
1.362
0.988
1.635 0.475
0.78
63.76
November 2000
1.600 0.483
0.432 0.640
0.313
0.51 1
0.31 3
1.120
0.301
0.609 0.63
65.97
April 2000
0.950
0.434
0.21 9
0.435
1.236
1.688
0.500 0.783
0.873
0.190 0.73
64.92
June 2001
0.479
0.218
0.110
0.181 0.1 19
0.849
0.214
0.439
0.095
0.461 0.32
75.67
August 2000
1.200
0.456
0.320
0.587
0.249
0.909
0,455
1.193
0.21 4
0.759 0.63
57.89
mg gm / wt
8.48
8.37
8.61
8.16
9.01
8.38
8.74
7.95
8.22
8.44
3.80
Abs
0.65
0.64
0.66
0.63
0.69
0.64
0.67
0.61
0.63
0.65
3.80
Con
60.37
65.82
63.65
63.24
66.31
65.91
64.83
62.58
62.68
63.93
3.06

Among the WCT polyphenol was more in WCT located in the DSP
farm of the Board at Neriamangalarn (8.38) followed by those situated in
Kuttiyadi (8.37). The variation observed was not highly significant in both
the ecotypes and WCT.
3.10. Tender Nut Water Analysis
Nut water fiom the tender coconuts aged 7 to 8 months was analyzed
for the total sugar, reducing sugar, amino acid, potassium and sodium
concentration. For all characters except for total sugar significant variation
among the ecotypes and WCT was observed (Table 3.29 & 3.30).
Table 3.29. Analysis of tender coconut water
cultivar
Kuttiyadi Tall
Kuttiyadi WCT(C)
Total Sugar
(~/ looml)
3.61 2.86 2.4 4.5
3.59
Reducing sugar
(g/lOOrnl)
2.46 2.18 3.21 2.65 3.21
3.5 3.17 3.56 3.22 5.93
King Coconut
Chazhoor WCT(c)
Amino Adds
rngl1OO ml)
1.323 1.059 1.473 1 .a09 0.928
2.99 3.5 3.9 3.5 3.91
3.13 3.59 3.86 3.29 3.99
2.9 2.83 3.17 2.78 4.84
4.9
3.56 5.03 4.58 4.3
Potassium conc in
( ppm) 3026
21 80.5 2091 2358 3058
0.748 1.402 0.812 1.512 1-93
(ppm) 487.08 549.08 348.96 142.08 345.58
1.957 1.913 I .392 1.875 1.503
4.8 3.34
4,32 4.06 4.37
2536 2803 2091 191 3 2358
2759 3026 3115 2581 2858
662.69 687.08 203.69 106.27 396.67
0.799 0.69 1
0.95 0.51 3 0.731
147.84 144
336.53 566.79 355.39
2091 2002 2403 2536 2269
1 68.27 188.64
, 266.88 371.64 269.95

CGD
Jappanan
3.24 3.53 3.76
3.54 3.59
Eruva WCT(C)
4.61 4.43 4.78 4.47 4.13
3.19 3.68 3.22
3.69 3.79
Komadan
Elite Tatl
4.33 4.12 4.54 4.03 3.15
3.12 4.37 3.34 5.94 3.39
4.4 4.83 4.57 4.22 4.29
0.73 0.822 0.71 1
0.622 0.722
3.5 3.56 4.5
3.59 3.61
1.258 1.105 1.278 0.817 1.047
1.083 1.503 1.283 0.989 1.246
3248 3248 2848 271 4
2981
2.9 3.18 2.68 3.22 2.45
2536 3426 3693 2492 3042
65.76 65.36
123.99 106.27 84.67
2848 2848 3248 3293 3020
88.56 83.04
256.83 106.08 169.93
44.28 46.94
178.56 179.04 111.66
0.799 0.876 1.209 I ,362 1.08
3560
3604 3582 3693 3426
38.88 43.2
41.04 256.83 83.04

Table 3.30. Tender Nut Water Analysis - SUMMARY ANOVA (MSS)
NS -Not significant. * Significant at p=0.05. ** Significant atp=0.01
The volume of total water was measured. Maximum water content
was in Jappanan (347.5ml) followed by Komadan (260ml) and King
Coconut (248.75ml). Elite Tall recorded nut water content of 175 ml and
Kuttiyadi 152 ml. WCT also showed much variation in nut water content in
tender nut. It ranged from 155ml to 3001111. CGD possessed a water content
of 168.75ml (Table 3.3 1).
Sodium ( P P ~ )
94360.927"
16677.790
374.6
31 0.1
41 1.3
253.1
64.2
33.5
140.9
89.2
112.1
92.6
129.1
188.2
68.6
165.7
Amino Acid (mg1100ml)
0.530"
0.052
1.32
1.73
1 . I 2
0.74
0.69
0.83
1.10
0.72
1.22
1.07
0.23
1.05
21.67
0.29
Reducing
(q , IlOOml SUga; 1.876*
0.380
2.74
3.30
3.57
4.18
4.02
3.80
4.03
4.48
4.46
2.89
0.62
3.75
16.45
0.79
Potassium (PPW
81 2322.027"
89669.810
2542.7
2867.8
2340.2
2260.2
2442.6
2825.4
3037.8
3007.8
3051.4
3573.0
299.5
2794.9
10.7
384.1
Total Sugar (,&,.,,)
0.758
0.51 3
3.39
3.88
3.56
4.47
4.47
3.63
3.53
3.51
4.03
3.75
0.72
3.82
18.73
NS
Varieties
Residual
Table of Means
Kuttiyadi. Tall
WCT A
King Coconut
WCT 2
Chowghat Green Dwarf
WCT 3
Jappanan
WCT 4
Komadan
Elite T
SEIplot
Gen. M
CV(%)
CD (0.05)
DF
9
36

Table 3.31. Quantity of Tender coconut water nut-'
3.1 1. Percentage of Disease Incidence @I)
The percentage of disease incidence was recorded through
physical observations made once in every three months of the project years.
The diseases mainly observed were root wilt, leaf rot and bud rot and the
pests were rhinoceros beetle, red palm weevil, eriophyid mite etc.
Table 3.32. Percentage of Disease Incidence
Holdings
I
I I
I I I
IV
V
VI
Total No. Of pa'ms
650
240
70
250
32
10
Name of ecotype
Kuttiyad i
WCT
King Coconut
WCT
Elite
CGD
WCT
Jappanan
WCT
Komadan
No. of palms
observed
350
300
8
232
70
200
50
12
20
I 0
% of Dl
1.4
13.3
0.0
13.8
17.1
5.0
10.0
0.0
30.0
0.0 -
No. of disease I pest affected palms
Root (wilt)
- - -
16
- - -
-
4
-
Other diseases l pests
5
40
16
12
I 0
5
2
5
40
0
32
12
I 0
5
0 '
6
0 -

The observation revealed that none of the ecotypes, even those
located in disease prevalent southern districts, was affected by root wilt
disease. Only in WCT located in Thrissur and Kayamgulam disease
incidence of 13.8% and 30% respectively was noticed (Table 3.32 & Fig
3.14).
The ecotypes in general were tolerant and resistant to pests and
diseases. The ecotypes namely, King Coconut, Jappanan and Komadan were
totally free fkom any disease incidence, while Kuttiyadi, Elite Tall and CGD
recorded 1.4 per cent, 17.1 per cent and 5 per cent disease infestation
respectively other than root wilt. All WCT showed disease and pest
infestation, the maximum being in Evoor, Alleppey district followed by
C hazhoor, Trichur district and lowest in DSP Farm, Neriamangalam,
Ernakulam district.

Fig.3.1. Vegetative Dry Matter (kg) production y e a 8
Reproductory Dry Matter (RDM) Prouction palm-I year-1
- . = r Z (9 S 'Y L I E g 8 3 5 8 : 2
1 a Y
Fig. 3.2. Reproductory dry matter (RDM) production palm-1

Fruit welght Husk welgM Shdl w+lgh(t Kemd Wght Copn WgM
Fig. 3.3. Nut characteristics - Kuttiyadi Tall vs. WCT
- ---- * - - - - - - - - - - - - - - - - . ' 8
800 -- King coconut .
700 -- WCT (C)
2 600 -- E 0,
500 -- E
400 --
Fruit weight Husk weight Shell weight Kernel weight C a m weight
Fig. 3.4. Nut characteristics - King Coconut vs. WCT

.. Fnrlt Husk wdgM Shell weight K d weS@M Copra weight
Fig. 3.5. Nut characteristics - Elite Tall vs. WCT
Frult welght Husk weight Shell weight Kernel welght Copra weight
Fig. 3.6. Nut characteristics - CGD vs. WCT

0
Frult welght Husk weight Shell weight Kernel weight Copra welght
Fig. 3.7. Nut characteristics - Jappanan vs. WCT
W WCT (C)
I -
863
-
- - 171 164
r 0 Fruit weight Husk weight Shell weight Kernel weight Copra weight
Fig. 3.8. Nut characteristics - Komadan vs. WCT

1800 - _I_
DFrult weight
1600 DHwkwslgM QShefl weigM
nuttied T d Khg cboonut Elite Tall CDG Jeppanan Komadan
Fig. 3.9. Fruit analysis data of ecotypes in Kerala
Kuttladi WCT 1 King WCT 2 EllteTall i WCT 3 Jappanan WCT4 Komadan Tall Coconut
Fig. 3.10. Total nut dry weight (kg)

Y 3 d
Fig. 3.1 1. Total dry matter (TDM) production palm-1
Fig. 3.12. Harvest index in respect of nut dry weight and oil output

Oil Content in Copra of the Ecotypes
Fig. 3.13. Oil content of ecotypes
c. (u *) rn
Fig. 3.14. Percentage of disease incidence

Plate 3.1.
Kuttbadi Tall
a - Crown
b - Whole nut
c - Kernel

Plate 3.1. Kuttiyadi Tall

Plate 3.2.
West Coast Tall I (Thiruvampadv)
a - Crown
b l -Whole nut
b2 - Kernel


Plate 3.3.
King Coconut
a - Crown
b - Whole nut
c - Kernel

Plate 3.3. King Coconut

Plate 3.4.
West Coast Tall 2
a - Crown
b -Whole nut
c - Kernel

Plate 3.4. West Coast Tall 2 (Chazhoor)

Plate 3.5.
Elite Tall
a - Crown
b - Whole nut
c - Kernel

Plate 3.5. Elite Tall

Plate 3.6.
Chowghat Green Dwarf
a - Crown
bl - Whole nut
b2 - Kernel

~ -~~
Plate 3.6. Chowghat Green Dwarf

Plate 3.7.
West Coast Tall 3 (Neriarnanpalam)
a - Crown
b l - Whole nut
b2 - Kernel

Plate 3.7. West Coast Tall 3 (Neriamaagalam)

Plate 3.8.
Jaman an
a - Crown
b - Whole nut
c - Kernel

Plate 3.8. Jappanan

Plate 3.9.
West Coast Tall 4 (Evoo p.)
a - Crown
b - Whole nut
c - Kernel

Plate 3.9. West Coast Tall 4 (Evoor)

Plate 3.10.
Komadan
a - Crown
b - Whole nut
c - Kernel
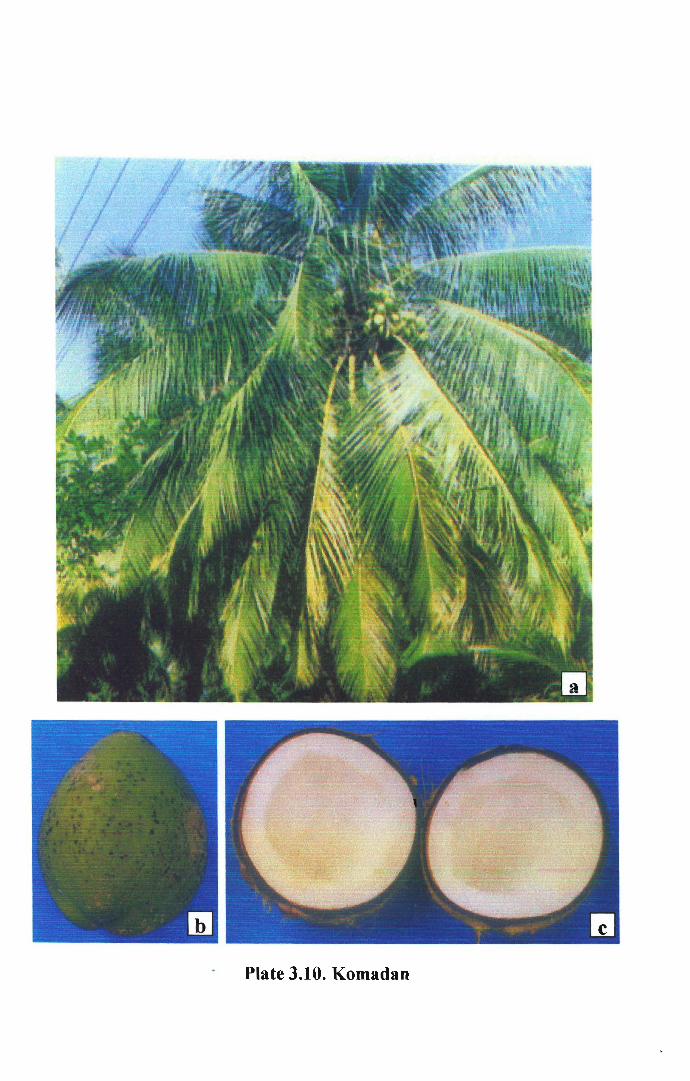
- Plate 3.10. Kornadan


![Regional Report on Ozone Observation Ozone Observation [ RA-II: Asia ] Regional Report on Ozone Observation Ozone Observation [ RA-II: Asia ] Hidehiko](https://img.pdfslide.us/doc/110x75/56649f115503460f94c23df0/regional-report-on-ozone-observation-ozone-observation-ra-ii-asia-regional.jpg)