Embed Size (px)
Citation preview
SEAL: Storage-efficient Causality Analysis on Enterprise Logs withQuery-friendly Compression
Peng FeiUniversity of California, Irvine
Zhou LiUniversity of California, Irvine
Zhiying WangUniversity of California, Irvine
Xiao YuNEC Laboratories America, Inc.
Ding LiPeking University
Kangkook JeeUniversity of Texas at Dallas
AbstractCausality analysis automates attack forensic and facilitates
behavioral detection by associating causally related but tem-porally distant system events. Despite its proven usefulness,the analysis suffers from the innate big data challenge to storeand process a colossal amount of system events that are con-stantly collected from hundreds of thousands of end-hosts in arealistic network. In addition, the effectiveness of the analysisto discover security breaches relies on the assumption thatcomprehensive historical events over a long span are stored.Hence, it is imminent to address the scalability issue in or-der to make causality analysis practical and applicable to theenterprise-level environment.
In this work, we present SEAL, a novel data compression ap-proach for causality analysis. Based on information-theoreticobservations on system event data, our approach achieveslossless compression and supports near real-time retrieval ofhistoric events. In the compression step, the causality graphinduced by the system logs is investigated, and abundant edgereduction potentials are explored. In the query step, for maxi-mal speed, decompression is opportunistically executed. Ex-periments on two real-world datasets show that SEAL offers2.63x and 12.94x data size reduction, respectively. Besides,89% of the queries are faster on the compressed dataset thanthe uncompressed one, and SEAL returns exactly the samequery results as the uncompressed data.
1 Introduction
System logs constitute a critical foundation for enterprise se-curity. The latest computer systems have become more andmore complex and interconnected, and attacker techniqueshave advanced to take advantage and nullify the conventionalsecurity solutions which are based on static artifacts. As aresult, the security defense has turned more to pervasive sys-tem event collection in building effective security measures.Research has extensively explored security solutions usingsystem logs. Causality analysis in the log setting (or attack
provenance), as defined in [83], is one such direction thatreconstructs information flow by associating interdependentsystem events and operations. For any suspicious events, theanalysis automatically traces back to the initial penetration(root-cause diagnosis), or measures the amount of the impactby enumerating the system resources affected by the attacker(attack ramification). Encouragingly, the security solutionsbased on pervasive system monitoring and causality analysisno longer remain as a research prototype. Many proposedideas have actualized as commercial solutions [8, 14, 22].
However, due to their data-dependent nature, the effective-ness of the above security solutions is heavily constrainedby the system’s data storage and processing capability. Onone hand, keeping large volumes of comprehensive historicalsystem events is essential, as the security breach targeting anenterprise tends to stay at the network over a long span: anindustry report by TrustWave [78] shows, on average, an intru-sion prolongs over 188 days before the detection. On the otherhand, the size of a typical enterprise network and the amountof system logs each host generates could put high pressureon the security solutions. For instance, our industrial partnerreported that on average 50 GB amount of logs are producedfrom a group of 100 hosts daily, and they can only sustainat most three months of data despite the inexpensive storagecost. There is a compelling need for a solution that can scalestorage and processing capacity to meet the enterprise-levelrequirement.Lossless compression versus lossy reduction. Compres-sion techniques [79] come in handy for improving the stor-age efficiency of causality analysis. Existing approaches[37, 45, 77, 83] tend to carry out lossy reduction, which re-moves logs matching pre-defined patterns, leading to unavoid-able information loss. Although they showed that the validityof causality analysis is preserved on samples of investiga-tion tasks, there is no guarantee that every task will derivethe right outcome. In Section 2.3, we show examples aboutwhen they would introduce false positives/negatives. In ad-dition, the accuracy of other applications such as behavioraldetection [30,53] and machine-learning based anomaly detec-
tion [10, 19, 47, 62, 63, 84] would be tampered, when they usethe same log data. Alternatively, lossless compression [79]allows any information to be restored and thus causality anal-ysis is preserved. Though the standard tools like Gzip [18] areexpected to achieve a high compression rate, they are not ap-plicable to our problem, because high computation overheadof decompression will be incurred when running causalityanalysis.
In this work, we challenge the common belief that losslesscompression is inefficient for causality analysis, by devel-oping SEAL (Storage-Efficient Analysis on enterprise Logs)under information-theoretic principles. Compared to the pre-vious approaches, logs under a wider range of patterns canbe compressed in a lossless fashion without the need for care-fully examining conditions such as traceability equivalenceor dependence preservation, while the validity and efficiencyof any investigation task of causality analysis are preserved.Contributions. The main contributions of this paper are asfollows.•We develop a framework of query-friendly compression
(QFC) specialized for causality analysis. In this framework,the dependency graph is induced from the logs, and losslesscompression is applied to the structure (vertices and edges)and then to the edge properties, or attributes (e.g., timestamp).QFC ensures every query is answered accurately, while thequery efficiency is guaranteed as the majority of operationsrequired by queries are done directly on the compressed data.•We design compression and querying algorithms accord-
ing to the definition of QFC. For graph structures, we definemerge patterns to be subgraphs whose edges are combinedinto one new edge. For edge properties, delta coding [59]and Golomb codes [28] are applied to exploit temporal local-ity, meaning that consecutively collected logs have similartimestamps. To return answers to a causality query, the pro-posed method obviates decompression unless the relationshipbetween the timestamps of a compressed edge and the timerange of the query cannot be determined.• A compression ratio estimation algorithm is provided
to facilitate the decision of using the compressed or uncom-pressed format for a given dataset. We show that the com-pression ratio can be determined by the average degree ofthe dependency graph. Our algorithm estimates the averagedegree by performing random walk on the dependency graphwith added self-loops, and randomly restarting another walkduring the process. If the estimated compression ratio of agiven dataset is smaller than a specified threshold, compres-sion can be skipped.• The above algorithms are implemented in SEAL, which
consists of the compression system that is applied to onlinesystem logs and the querying system that serves causalityanalytics. Due to the large amount of merge patterns in thedependency graphs, SEAL can compress online log data into asignificantly smaller volume. In addition, the query-friendlydesign reduces the required decompression operations. We
evaluate SEAL on system logs from 95 hosts provided byour industrial partner. The experiment results demonstrate anaverage of 9.81x event reduction, 2.63x storage size reduction.Besides, 89% of the queries are faster on the compresseddataset than the uncompressed one. We also evaluate SEAL onDARPA TC dataset [16] and achieved 12.94x size reduction.Causality analysis to investigate attacked entities is shown toreturn accurate results with our compression method.
2 Background
We first describe the concepts of system logs and causalityanalysis. Then, we review the existing works based on lossyreduction and compare SEAL with them.
2.1 System Logs
To transparently monitor the end-host activities in a confinednetwork, end-point detection and response (EDR) has becomea mainstream security solution [35]. A typical EDR systemdeploys data collection sensors to collect the major system ac-tivities such as file, process and network related events, as wellas events with high security relevancy (e.g., login attempts,privilege escalation). Sensors then stream the collected sys-tem events to a centralized data back-end. Data collection atend-host hinges on different operating systems’ (OS) kernel-level supports for system call level monitoring [11, 55, 69].
In this study, we obtained a dataset from the real-world cor-porate environment. Data sources are the system logs gener-ated by kernel audit [69] of Linux hosts and Event Monitoringfor Windows (ETW) [55] of Windows hosts respectively. Thesystem events belong to three different categories: (i) processaccesses (reads or write) files (P2F), (ii) process connects to oraccepts network sockets (P2N), and (iii) process creates otherprocesses, or exits it executions. These system events cap-tured from each end-host are transferred to the back-end andrepresented in a graph data structure [42] where nodes repre-sent system resources (i.e., process, file, and network socket)and edges represent interactions among nodes. Our systemlabels edges with attributes specific to system operations. Forinstance, amounts of data transferred for file and networkoperations, command-line arguments for process creations.The dataset comprises of various workloads that range fromsimple administrative tasks to heavy-weight development anddata analysis tasks and also includes end-user desktops andlaptops as well as infra-structural servers.
Among the three categories of system events (file, network,and process) in the dataset, file operations account for themajority, taking over 90% portions, therefore become theprimary target for SEAL compression. In particular, the fileoperation like create, open, read, write or delete is logged ineach file event, alongside its owner process, host ID, file path,and timestamp. All file events have been properly anonymized
(no user identifiable information exists in any field of thetable) to address privacy concerns.
Despite its improved visibility, data collection for in-hostsystem activity results in a prohibitive amount of processingand storage pressures, compared to other network-level mon-itoring appliances [63]. For instance, our data collection de-ployment on average reported approximately 50 GB amountof logs for a group of 100 hosts daily. Given that a typicalenterprise easily exceeds hundreds of thousands of hosts forits network, it is imminent to address the scalability issues inorder to make causality analysis practical and applicable to arealistic network.
2.2 Causality Analysis in the Log SettingAfter the end-point logs are gathered and reported to the dataprocessing back-end, different applications are run atop to pro-duce insights to security operators, such as machine-learningbased threat detection [10], database queries [23–25] andcausality analysis (or data provenance) [83]. Although ourapproach mainly focuses on the causality analysis, which re-quires high fidelity on its input data, it also benefits otheranalyses as our approach reduces data storage and computa-tional costs.
To its core, causality analysis automates the data analysisand forensic tasks by correlating data dependency amongsystem events. Using the restored causality, security opera-tors accelerate root cause analysis of security incident andattack ramification. The causality analysis is considered to bea de facto standard tool for investigating long-running, multi-stage attacks, such as Advanced Persistent Threat (APT) cam-paigns [58]. For any suspicious events reported by users orthird-part detection tools, the operator can issue a query toinvestigate causally related activities. The causality analysisthen consults to its data back-end to restore the dependencieswithin the specified scope. The accuracy of causality analysisrelies on the completeness of data collection, and the analysisresponse time and usability depend on the data access time.In Section 3.1, we demonstrate a causality analysis where ourcompression approach addresses the scalability issues withoutdeteriorating accuracy and usability.
2.3 Comparison with Lossy ReductionTo reduce the storage overhead in supporting causality anal-ysis, prior works advocated lossy reduction [37, 45, 77, 83],which removes logs of certain patterns before they are storedby the back-end server. Here we show the reduction rules ofthe prior works and compare their scope to SEAL.
LogGC [45] removes temporary files from the collecteddata that are deemed not affecting causality analysis. Node-Merge [77] merges the read-only events (Read events in ourdata) during the process initialization. The approach proposedby Xu et al. [83] removes repeated edges between two objects
Dangling Node
...
Before Reduction Previous Methods SEAL
Initial Stage
T
A B
C...
A
C
B
LogGC
Xu et al, Hossain et al
NodeMerge
NULL
New Node Merged Event
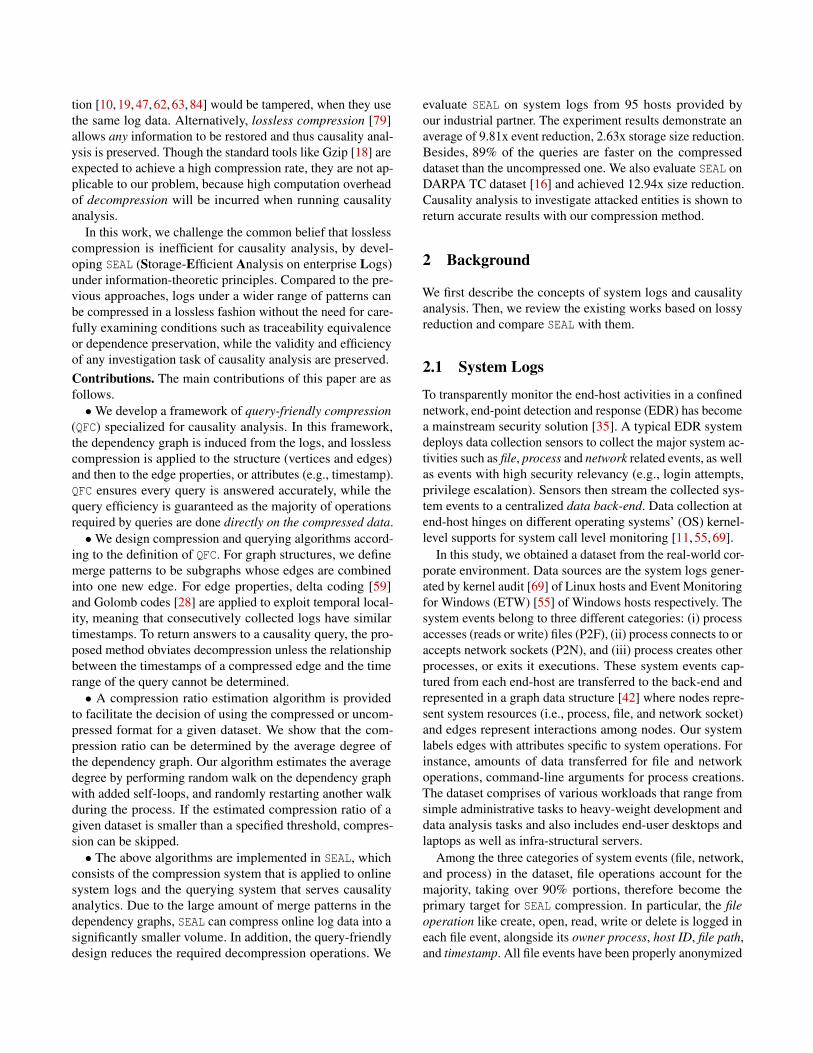
Figure 1: Comparison of our method SEAL to LogGC [45],NodeMerge [77], methods by Xu et al. [83] and Hossainet al. [37]. In NodeMerge (the second graph in the middlecolumn), the node T represents a new node. In SEAL (the rightcolumn), the blue solid circles represent new nodes.
on the same host (e.g., multiple read events between a file anda process) when a condition termed trackability equivalenceis satisfied. Hossain et al. [37] relaxes the condition of [83]such that more repeated events (e.g., repeated events crosshosts) can be pruned, which tends to be more conservative tomaintain graph trackability.SEAL is more general compared to any of the existing works.
Our lossless compression schema is agnostic to file types andis therefore complementary to LogGC. SEAL also processesWrite and Execute events, compared to NodeMerge, andtherefore covers the whole life-cycle of a process. Comparedto Xu et al. and Hossain et al., SEAL is more aggressive, e.g.,merging not only the edges repeated between a pair of nodes.Figure 1 also illustrates the differences. In Section 5, wecompare the overall reduction rate, with Hossain et al., whichis the most recent work.
In terms of data fidelity, none of the prior works can guar-antee false negative/positive would not occur during attackinvestigation. For LogGC, if the removed temporary filesare related to network sockets, data exfiltration done by theattacker might be missed. For NodeMerge, the authors de-scribed a potential evasion method: the attacker can keepthe malware waiting for a long time before the actual at-tack, so that the malware might be considered as a read-onlyfile as determined by their threshold and break the causalitydependencies (see [77] Section 10.4). PCAR of Xu et al. in-troduces false connectivity in two (out of ten) investigationtasks (see [83] Section 4.3). Similarly, false negatives could
A B
Event File Node
Process Node
D
10 C
20
30
40
Delete Edge
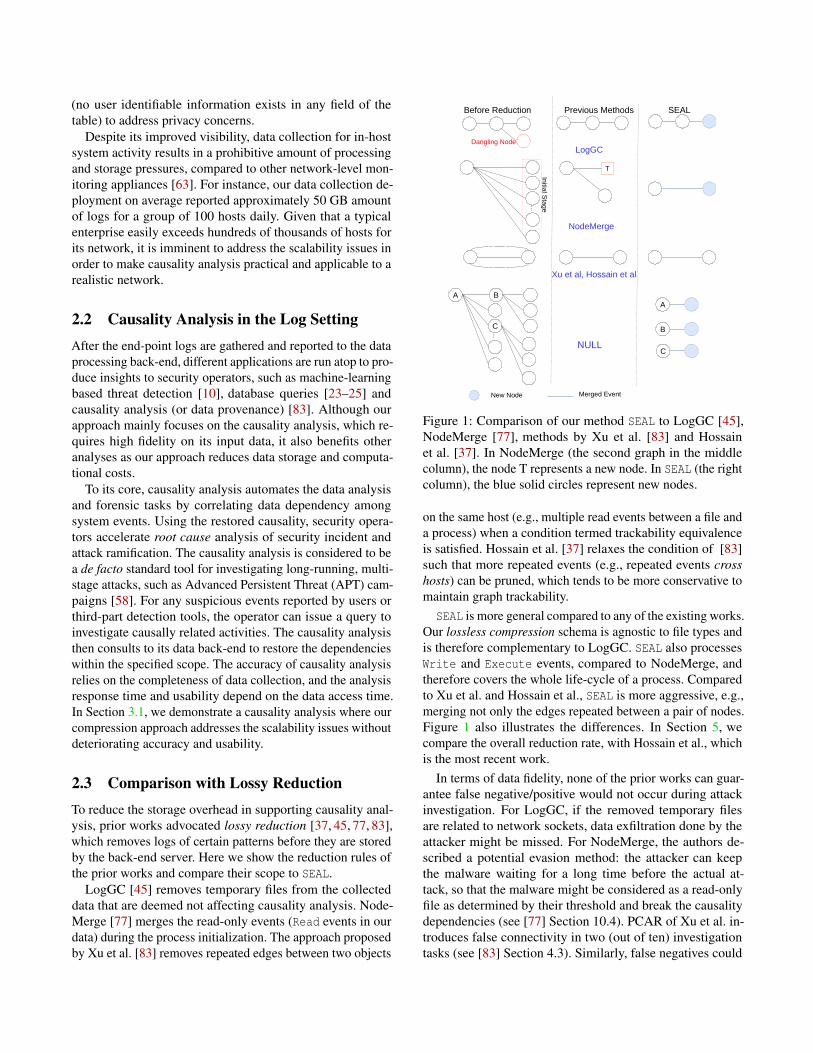
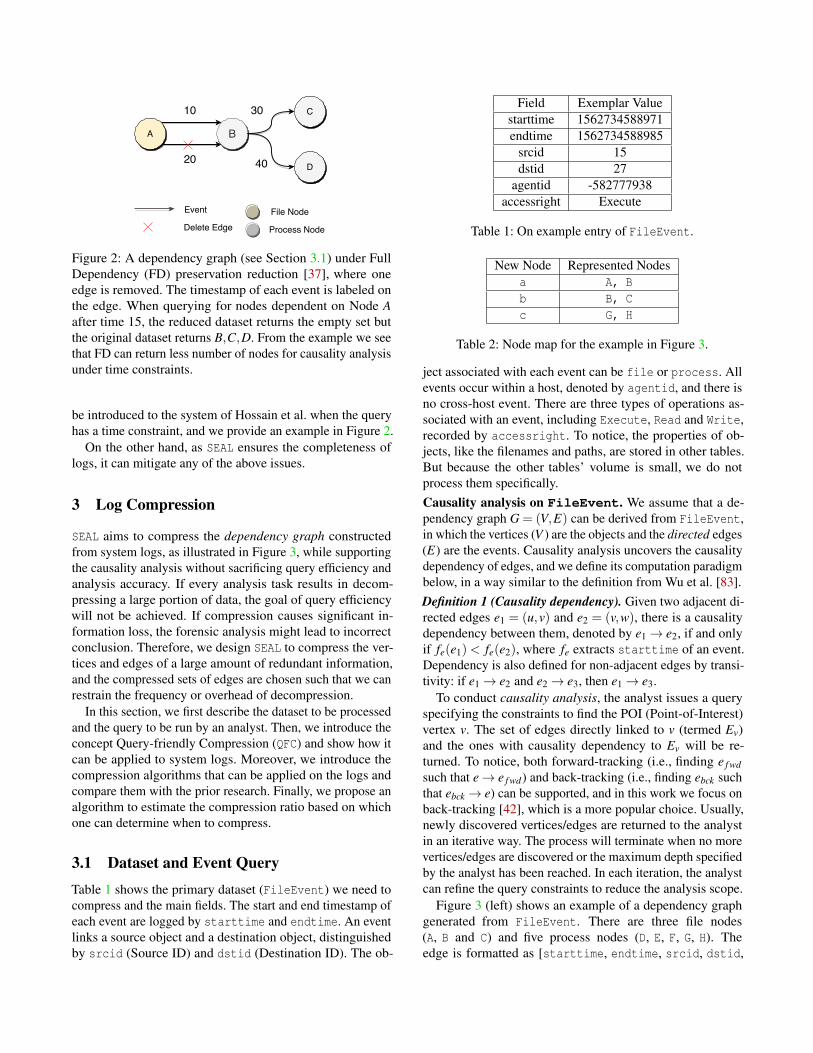
Figure 2: A dependency graph (see Section 3.1) under FullDependency (FD) preservation reduction [37], where oneedge is removed. The timestamp of each event is labeled onthe edge. When querying for nodes dependent on Node Aafter time 15, the reduced dataset returns the empty set butthe original dataset returns B,C,D. From the example we seethat FD can return less number of nodes for causality analysisunder time constraints.
be introduced to the system of Hossain et al. when the queryhas a time constraint, and we provide an example in Figure 2.
On the other hand, as SEAL ensures the completeness oflogs, it can mitigate any of the above issues.
3 Log Compression
SEAL aims to compress the dependency graph constructedfrom system logs, as illustrated in Figure 3, while supportingthe causality analysis without sacrificing query efficiency andanalysis accuracy. If every analysis task results in decom-pressing a large portion of data, the goal of query efficiencywill not be achieved. If compression causes significant in-formation loss, the forensic analysis might lead to incorrectconclusion. Therefore, we design SEAL to compress the ver-tices and edges of a large amount of redundant information,and the compressed sets of edges are chosen such that we canrestrain the frequency or overhead of decompression.
In this section, we first describe the dataset to be processedand the query to be run by an analyst. Then, we introduce theconcept Query-friendly Compression (QFC) and show how itcan be applied to system logs. Moreover, we introduce thecompression algorithms that can be applied on the logs andcompare them with the prior research. Finally, we propose analgorithm to estimate the compression ratio based on whichone can determine when to compress.
3.1 Dataset and Event QueryTable 1 shows the primary dataset (FileEvent) we need tocompress and the main fields. The start and end timestamp ofeach event are logged by starttime and endtime. An eventlinks a source object and a destination object, distinguishedby srcid (Source ID) and dstid (Destination ID). The ob-
Field Exemplar Valuestarttime 1562734588971endtime 1562734588985
srcid 15dstid 27
agentid -582777938accessright Execute
Table 1: On example entry of FileEvent.
New Node Represented Nodesa A, Bb B, Cc G, H
Table 2: Node map for the example in Figure 3.
ject associated with each event can be file or process. Allevents occur within a host, denoted by agentid, and there isno cross-host event. There are three types of operations as-sociated with an event, including Execute, Read and Write,recorded by accessright. To notice, the properties of ob-jects, like the filenames and paths, are stored in other tables.But because the other tables’ volume is small, we do notprocess them specifically.Causality analysis on FileEvent. We assume that a de-pendency graph G = (V,E) can be derived from FileEvent,in which the vertices (V ) are the objects and the directed edges(E) are the events. Causality analysis uncovers the causalitydependency of edges, and we define its computation paradigmbelow, in a way similar to the definition from Wu et al. [83].Definition 1 (Causality dependency). Given two adjacent di-rected edges e1 = (u,v) and e2 = (v,w), there is a causalitydependency between them, denoted by e1→ e2, if and onlyif fe(e1)< fe(e2), where fe extracts starttime of an event.Dependency is also defined for non-adjacent edges by transi-tivity: if e1→ e2 and e2→ e3, then e1→ e3.
To conduct causality analysis, the analyst issues a queryspecifying the constraints to find the POI (Point-of-Interest)vertex v. The set of edges directly linked to v (termed Ev)and the ones with causality dependency to Ev will be re-turned. To notice, both forward-tracking (i.e., finding e f wdsuch that e→ e f wd) and back-tracking (i.e., finding ebck suchthat ebck→ e) can be supported, and in this work we focus onback-tracking [42], which is a more popular choice. Usually,newly discovered vertices/edges are returned to the analystin an iterative way. The process will terminate when no morevertices/edges are discovered or the maximum depth specifiedby the analyst has been reached. In each iteration, the analystcan refine the query constraints to reduce the analysis scope.
Figure 3 (left) shows an example of a dependency graphgenerated from FileEvent. There are three file nodes(A, B and C) and five process nodes (D, E, F, G, H). Theedge is formatted as [starttime, endtime, srcid, dstid,
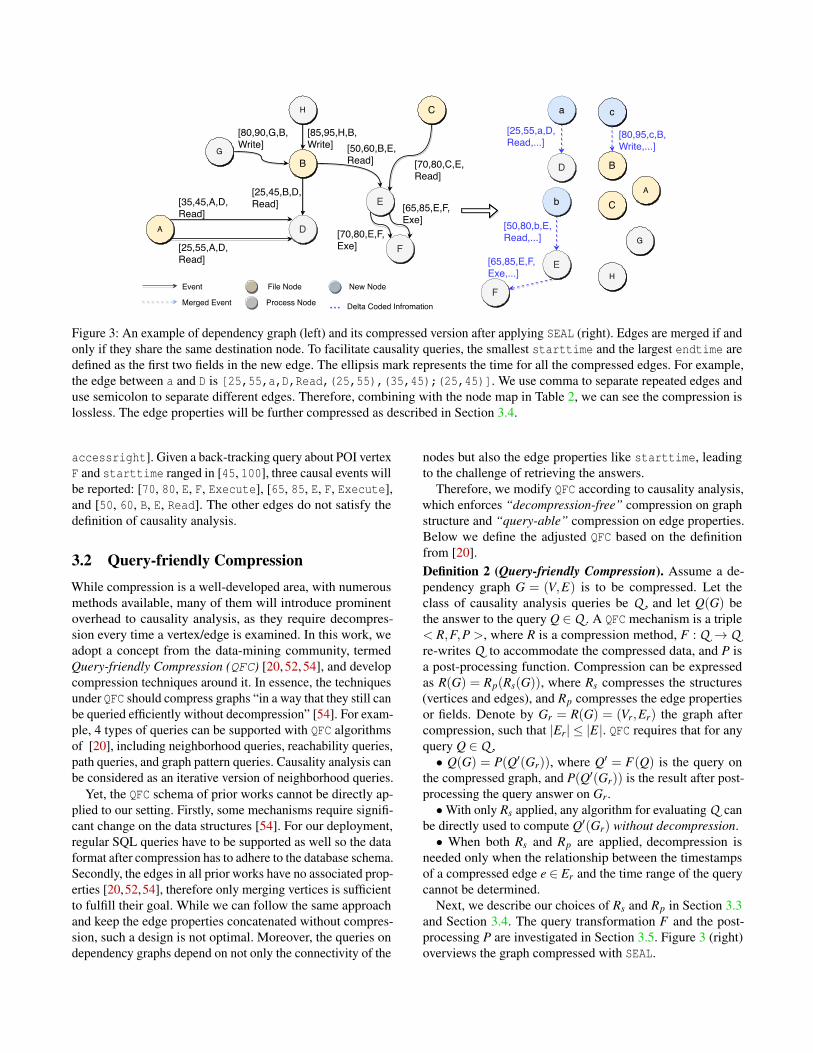
A
C
B
D
E
F
a
[70,80,E,F,Exe]
[50,60,B,E,Read]
[35,45,A,D,Read]
[25,45,B,D,Read]
D
b
E
FEvent
Merged Event
File Node
Process Node
New Node
[65,85,E,F,Exe,...]
[50,80,b,E,Read,...]
[25,55,a,D,Read,...]
G
B
... Delta Coded Infromation
c
[25,55,A,D,Read]
[65,85,E,F,Exe]
[70,80,C,E,Read]
[80,90,G,B,Write]
[80,95,c,B,Write,...]
H
[85,95,H,B,Write]
CA
G
H
Figure 3: An example of dependency graph (left) and its compressed version after applying SEAL (right). Edges are merged if andonly if they share the same destination node. To facilitate causality queries, the smallest starttime and the largest endtime aredefined as the first two fields in the new edge. The ellipsis mark represents the time for all the compressed edges. For example,the edge between a and D is [25,55,a,D,Read,(25,55),(35,45);(25,45)]. We use comma to separate repeated edges anduse semicolon to separate different edges. Therefore, combining with the node map in Table 2, we can see the compression islossless. The edge properties will be further compressed as described in Section 3.4.
accessright]. Given a back-tracking query about POI vertexF and starttime ranged in [45, 100], three causal events willbe reported: [70, 80, E, F, Execute], [65, 85, E, F, Execute],and [50, 60, B, E, Read]. The other edges do not satisfy thedefinition of causality analysis.
3.2 Query-friendly CompressionWhile compression is a well-developed area, with numerousmethods available, many of them will introduce prominentoverhead to causality analysis, as they require decompres-sion every time a vertex/edge is examined. In this work, weadopt a concept from the data-mining community, termedQuery-friendly Compression (QFC) [20, 52, 54], and developcompression techniques around it. In essence, the techniquesunder QFC should compress graphs “in a way that they still canbe queried efficiently without decompression” [54]. For exam-ple, 4 types of queries can be supported with QFC algorithmsof [20], including neighborhood queries, reachability queries,path queries, and graph pattern queries. Causality analysis canbe considered as an iterative version of neighborhood queries.
Yet, the QFC schema of prior works cannot be directly ap-plied to our setting. Firstly, some mechanisms require signifi-cant change on the data structures [54]. For our deployment,regular SQL queries have to be supported as well so the dataformat after compression has to adhere to the database schema.Secondly, the edges in all prior works have no associated prop-erties [20,52,54], therefore only merging vertices is sufficientto fulfill their goal. While we can follow the same approachand keep the edge properties concatenated without compres-sion, such a design is not optimal. Moreover, the queries ondependency graphs depend on not only the connectivity of the
nodes but also the edge properties like starttime, leadingto the challenge of retrieving the answers.
Therefore, we modify QFC according to causality analysis,which enforces “decompression-free” compression on graphstructure and “query-able” compression on edge properties.Below we define the adjusted QFC based on the definitionfrom [20].Definition 2 (Query-friendly Compression). Assume a de-pendency graph G = (V,E) is to be compressed. Let theclass of causality analysis queries be Q , and let Q(G) bethe answer to the query Q ∈ Q . A QFC mechanism is a triple< R,F,P >, where R is a compression method, F : Q → Qre-writes Q to accommodate the compressed data, and P isa post-processing function. Compression can be expressedas R(G) = Rp(Rs(G)), where Rs compresses the structures(vertices and edges), and Rp compresses the edge propertiesor fields. Denote by Gr = R(G) = (Vr,Er) the graph aftercompression, such that |Er| ≤ |E|. QFC requires that for anyquery Q ∈ Q ,• Q(G) = P(Q′(Gr)), where Q′ = F(Q) is the query on
the compressed graph, and P(Q′(Gr)) is the result after post-processing the query answer on Gr.•With only Rs applied, any algorithm for evaluating Q can
be directly used to compute Q′(Gr) without decompression.• When both Rs and Rp are applied, decompression is
needed only when the relationship between the timestampsof a compressed edge e ∈ Er and the time range of the querycannot be determined.
Next, we describe our choices of Rs and Rp in Section 3.3and Section 3.4. The query transformation F and the post-processing P are investigated in Section 3.5. Figure 3 (right)overviews the graph compressed with SEAL.
3.3 Compression on Graph Structure
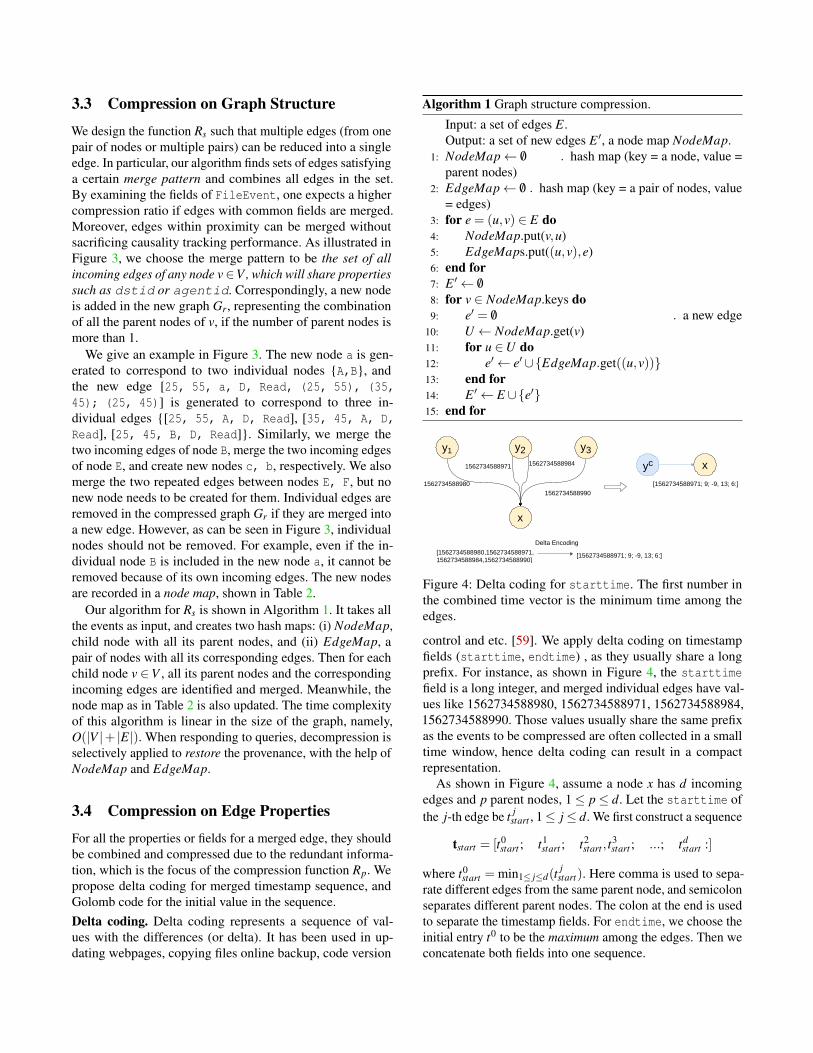
We design the function Rs such that multiple edges (from onepair of nodes or multiple pairs) can be reduced into a singleedge. In particular, our algorithm finds sets of edges satisfyinga certain merge pattern and combines all edges in the set.By examining the fields of FileEvent, one expects a highercompression ratio if edges with common fields are merged.Moreover, edges within proximity can be merged withoutsacrificing causality tracking performance. As illustrated inFigure 3, we choose the merge pattern to be the set of allincoming edges of any node v∈V , which will share propertiessuch as dstid or agentid. Correspondingly, a new nodeis added in the new graph Gr, representing the combinationof all the parent nodes of v, if the number of parent nodes ismore than 1.
We give an example in Figure 3. The new node a is gen-erated to correspond to two individual nodes A,B, andthe new edge [25, 55, a, D, Read, (25, 55), (35,45); (25, 45)] is generated to correspond to three in-dividual edges [25, 55, A, D, Read], [35, 45, A, D,Read], [25, 45, B, D, Read]. Similarly, we merge thetwo incoming edges of node B, merge the two incoming edgesof node E, and create new nodes c, b, respectively. We alsomerge the two repeated edges between nodes E, F, but nonew node needs to be created for them. Individual edges areremoved in the compressed graph Gr if they are merged intoa new edge. However, as can be seen in Figure 3, individualnodes should not be removed. For example, even if the in-dividual node B is included in the new node a, it cannot beremoved because of its own incoming edges. The new nodesare recorded in a node map, shown in Table 2.
Our algorithm for Rs is shown in Algorithm 1. It takes allthe events as input, and creates two hash maps: (i) NodeMap,child node with all its parent nodes, and (ii) EdgeMap, apair of nodes with all its corresponding edges. Then for eachchild node v ∈V , all its parent nodes and the correspondingincoming edges are identified and merged. Meanwhile, thenode map as in Table 2 is also updated. The time complexityof this algorithm is linear in the size of the graph, namely,O(|V |+ |E|). When responding to queries, decompression isselectively applied to restore the provenance, with the help ofNodeMap and EdgeMap.
3.4 Compression on Edge Properties
For all the properties or fields for a merged edge, they shouldbe combined and compressed due to the redundant informa-tion, which is the focus of the compression function Rp. Wepropose delta coding for merged timestamp sequence, andGolomb code for the initial value in the sequence.Delta coding. Delta coding represents a sequence of val-ues with the differences (or delta). It has been used in up-dating webpages, copying files online backup, code version
Algorithm 1 Graph structure compression.
Input: a set of edges E.Output: a set of new edges E ′, a node map NodeMap.
1: NodeMap← /0 . hash map (key = a node, value =parent nodes)
2: EdgeMap← /0 . hash map (key = a pair of nodes, value= edges)
3: for e = (u,v) ∈ E do4: NodeMap.put(v,u)5: EdgeMaps.put((u,v),e)6: end for7: E ′← /0
8: for v ∈ NodeMap.keys do9: e′ = /0 . a new edge
10: U ← NodeMap.get(v)11: for u ∈U do12: e′← e′∪EdgeMap.get((u,v))13: end for14: E ′← E ∪e′15: end for
y1 y2 y3
x
yc x1562734588980
1562734588971 1562734588984
1562734588990
[1562734588980,1562734588971,1562734588984,1562734588990]
[1562734588971; 9; -9, 13; 6:]
Delta Encoding
[1562734588971; 9; -9, 13; 6:]
Figure 4: Delta coding for starttime. The first number inthe combined time vector is the minimum time among theedges.
control and etc. [59]. We apply delta coding on timestampfields (starttime, endtime) , as they usually share a longprefix. For instance, as shown in Figure 4, the starttimefield is a long integer, and merged individual edges have val-ues like 1562734588980, 1562734588971, 1562734588984,1562734588990. Those values usually share the same prefixas the events to be compressed are often collected in a smalltime window, hence delta coding can result in a compactrepresentation.
As shown in Figure 4, assume a node x has d incomingedges and p parent nodes, 1≤ p≤ d. Let the starttime ofthe j-th edge be t j
start , 1≤ j≤ d. We first construct a sequence
tstart = [t0start ; t1
start ; t2start , t
3start ; ...; td
start :]
where t0start = min1≤ j≤d(t
jstart). Here comma is used to sepa-
rate different edges from the same parent node, and semicolonseparates different parent nodes. The colon at the end is usedto separate the timestamp fields. For endtime, we choose theinitial entry t0 to be the maximum among the edges. Then weconcatenate both fields into one sequence.
Then, we compute the delta for every consecutive pair oftimestamps: for 1≤ j≤ d, ∆
jstart = t j
start− t j−1start . The resulting
coded timestamp of the merged edge is:
[t0start ; ∆
1start ; ∆
2start ,∆
3start ; ∆
4start ; ..., ∆
dstart :]
and delta coding is also applied to the other timestamp fields.The time complexity of delta coding is O(d) where d is thenumber of edges.
To conform to the uncompressed FileEvent format, thet0start and t0
end are stored in the starttime and endtime fieldof the new edge ec respectively, and the generated delta-codedstarttime and endtime are stored in a new delta field.Golomb coding. Delta coding can compress all the elementsof the combined time sequence except t0 which is still a longinteger. Moreover, if an individual edge is not merged, itstimestamps are also long integers. We choose to employGolomb coding [28] to compress long integers to relativelysmall integers. Alternatively, a more aggressive approach isto use delta coding to compress t0 of different merged events,but the database index will be updated [13] and the query costwill be high. One favorable property of Golomb coding is thatthe relative order of the numbers is not changed, which fitswell with the requirements of QFC. That is, if t > t ′, then wehave the Golomb coded variable Gol(t)> Gol(t ′).
Golomb code uses a parameter M to divide an input datumN into two parts (quotient q and reminder r) by
q = bN−1Mc, r = N−qM−1. (1)
Under the standard Golomb coding schema, the quotientq is then coded under unary coding, and the reminder r iscoded under truncated binary encoding to guarantee that thevalue after coding (called codeword) is a prefix code. In ourcase, however, the truncated binary encoding is not neces-sary because the codewords are separated by different en-tries automatically. As such we use a simpler mechanism,binary coding, for r. The coded data is then calculated byconcatenating p and r. For instance, given a long integer1562734588980 (64 bits) and a M = 1562700000000, the bi-nary form of p and r after coding will be 10 (2 bits) and10000011111100100100110100 (26 bits). In this example,32 bits are sufficient to store the Golomb codeword.
3.5 Query and DecompressionAs defined by QFC, decompression is only necessary whenthe relation between the time range specified in the query andin the edge cannot be determined. If there are no intersectionsof these two ranges, decompression can be skipped. In ourback-tracking queries, the above property holds for two rea-sons. First, due to the order preservation property of Golombcoding, it is unnecessary to decode all Golomb codes in thedatabase to answer a query with a timestamp constraint. The
specified timestamp can be simply encoded by Golomb code,and used as the new constraint issued to the database. Sec-ond, the minimum starttime t0
start is recorded in a mergededge. Hence, if we back-track for events whose starttimeis smaller than some given tquery, then all individual edges ofan combined edge with t0
start > tquery will be rejected. There-fore, the database does not need to decompress and can safelyreject this combined edge.
Here we use the example shown in Figure 3 to demon-strate how the query and decompression work. Assume aquery tries to initiate back-tracking on E to find the priorcausal events whose starttime is less than tquery = 65. First,tquery will be Golomb coded into Gol(65). And the databaseneeds to find events such that Gol(t0
start)< Gol(65) and thedestination node is E. For the merged event [50, 80, b, E,Read], its t0
start = 50 value is stored as Gol(50). By orderpreservation of Golomb code, Gol(50)< Gol(65). Thus thismerged event will be identified. Second, we decompress thismerged event for further inspection. We extract starttimeGol(t0
start) = Gol(50) and Golomb decoding is applied to ob-tain t0
start = 50. Then we recover the timestamp sequence tstart
by calculating t jstart = t j−1
start +∆jstart , j ≥ 1. In this example,
t1start = 50, t2
start = 70. Comparing the individual timestampsnow is feasible. It will be found that only the first individualedge is a valid answer. The final step is to find the individualnodes corresponding to the valid edges from the node mapin Table 2. After that, the result [50, 60, B, E, Read] isreturned.
It can be seen that if tquery = 30, all incoming edges of Ecan be rejected without Golomb or delta-code decompression(tquery still needs to be Golomb encoded before issuing thequery).
3.6 Compression Ratio EstimationApplying compression to the log data may be desirable onlyif the compression ratio is higher than a threshold. As a result,it is important to obtain the compression ratio or its estimatebefore compression. While a full scan of the causality graphgives a precise compression ratio, the overhead is significant.As a result, we develop an algorithm to estimate the compres-sion ratio. To that end, we show that this estimation is reducedto obtaining davg, the average degree of the undirected versionof the causality graph (Appendix A). A degree estimator isdeveloped with a sample size only depending on the requiredaccuracy rather than on the number of nodes or the numberof edges. As described in Section 4, we implement SEAL foronline compression, this algorithm is applied to chunks ofdata sequentially.Compression ratio estimation. Let Gundirected denote theundirected graph which is identical to the dependency graphexcept that edge directions are removed. Let davg be its aver-age node degree. From Appendix A, we find that the compres-sion ratio is an explicit function of davg. The compression ratio
estimation reduces to estimating the average degree. To min-imize the data access and query time during estimation, wepresent an average degree estimation algorithm that samplesnodes in an undirected graph H based on random walk (seeAlgorithm 2). The algorithm can be applied to H = Gundirectedand outputs davg. In the following, we use the notation dH forthe average degree of H, and d the estimated average degree.For any vertex v of H, denote by dv its degree.
One way to estimate the average degree is to uniformlysample nodes in H and get their degrees, and obtain the av-erage of the sampled degrees [21]. The estimator from thesample set S is:
d =∑v∈S dv
|S|=
∑v∈S dv
∑v∈S 1. (2)
This method can be improved when we also obtain a randomneighbor of each sampled nodes [27]. The required number ofsamples (sample complexity) is O(
√n) to obtain a constant-
factor estimation, where n is the number of nodes. Anotherway is to sample nodes according to the node degree, and usecollisions in the samples to obtain the estimate [41], wherethe required sample complexity is Ω(
√n). Our algorithm is
inspired by the ’Smooth’ algorithm of [17], where a node vis sampled proportional to its degree plus a constant, dv + c,where the constant c=αdH is a coarse estimate of the averagedegree with a multiplicative gap α. The coarse estimation ccan be obtained from history or a very small subgraph in ourproblem. The resultant sample complexity is no more thanmax(α, 1
α) 6
ε2 log 4δ, and the average degree estimate d satisfies
Pr((1−4ε)dH ≤ d ≤ (1+4ε)dHBig)≥ 1−δ, (3)
for all 0 < ε≤ 0.5,0 < δ < 1,α > 0.In large graphs, it is hard to sample nodes in the entire
graph according to some distribution as we do not know thenumber of nodes and the node degrees. To overcome suchdifficulty, the Smooth algorithm can be modified such that thesampled nodes are obtained by random walk [17]. However,it makes some assumptions that do not readily fit the depen-dency graph problem: (i) The graph needs to be irreducibleand aperiodic. However, the dependency graph naturally con-tains disconnected components. (ii) The sample complexityneeds to be high enough to pass the mixing time and approachthe steady-state distribution, which varies depending on thestructure of the graph.
To overcome these issues, two techniques are used in Al-gorithm 2. First, random walk with escaping [7] jumps to arandom new node with probability p jump and stays on the ran-dom walk path with probability 1− p jump (see Line 4). There-fore, we can reach different components of the graph. Second,thinning [41] takes one sample every θ samples as in Line7. We obtain θ groups of thinned samples. If the samples areindexed by 0,1,2, . . . , then in our algorithm the j-th group, de-noted by S j, contains samples indexed by j, j+θ, j+2θ, . . . ,
for 0≤ j≤ θ−1. Each group produces its own estimate (Line13), and the final estimate is the average of these groups (Line14). Since the sample distribution is not uniform, we can-not directly use the estimator of Equation (2). The sampleddegrees need to be re-weighted using the Hansen-Hurwitztechnique [32] to correct the bias towards the high degreenodes, corresponding to the term dv + c in the numerator andthe denominator of Line 13. Note that due to the difficulty tosample a node from the entire graph, the sample distributionis not specified in Lines 2 and 9.
Algorithm 2 Average degree estimation.
Input: undirected graph H, sample size r, coarse aver-age degree estimator c, thinning parameter θ, jumpingprobability p jump
Output: average degree estimator d1: S j← /0, j = 0,1, . . . ,θ−12: Randomly sample a node vpre of H3: for i = 0 to r−1 do4: rnd ∼ Bernoulli(p jump)5: if rnd = 0 then6: Uniformly sample a neighbor v of vpre assuming
vpre also has c added self loops7: Si mod θ← Si mod θ∪v8: else9: Randomly sample a node v of H
10: end if11: vpre← v12: end for13: d j =
∑v∈S j dv/(dv+c)
∑v∈S j 1/(dv+c) , j = 0,1, . . . ,θ−1
14: d = 1θ
∑θ−1j=0 d j
4 Architecture
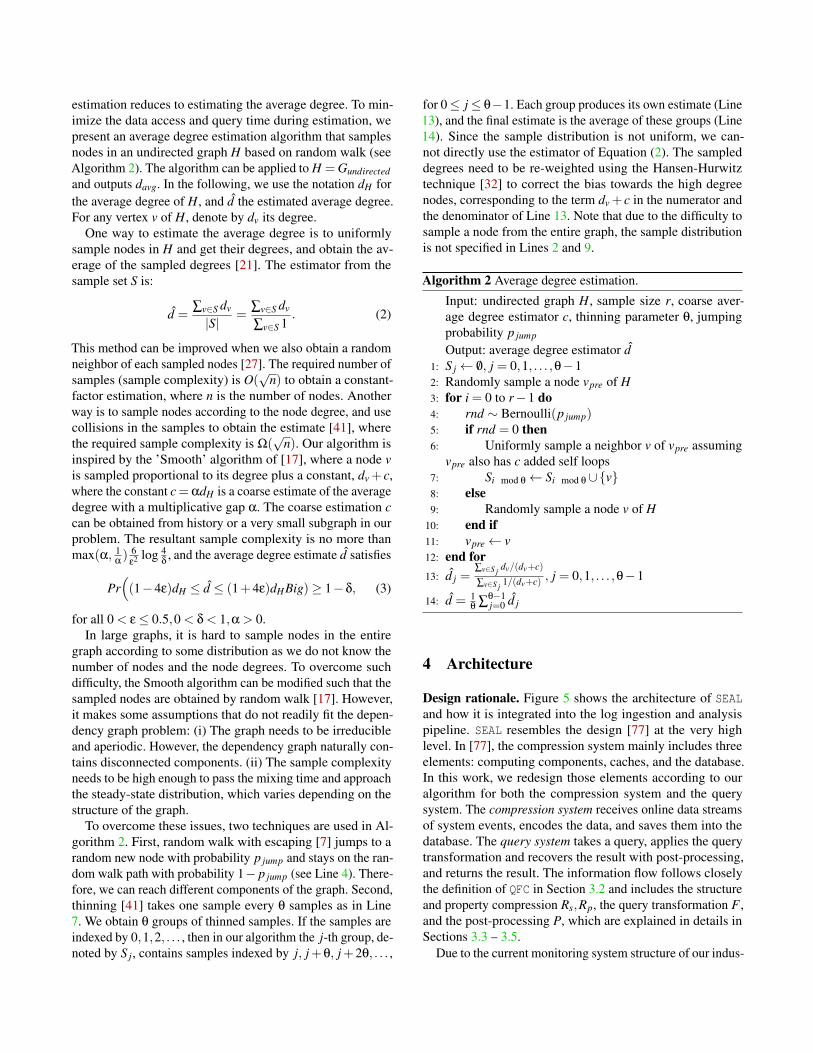
Design rationale. Figure 5 shows the architecture of SEALand how it is integrated into the log ingestion and analysispipeline. SEAL resembles the design [77] at the very highlevel. In [77], the compression system mainly includes threeelements: computing components, caches, and the database.In this work, we redesign those elements according to ouralgorithm for both the compression system and the querysystem. The compression system receives online data streamsof system events, encodes the data, and saves them into thedatabase. The query system takes a query, applies the querytransformation and recovers the result with post-processing,and returns the result. The information flow follows closelythe definition of QFC in Section 3.2 and includes the structureand property compression Rs,Rp, the query transformation F ,and the post-processing P, which are explained in details inSections 3.3 – 3.5.
Due to the current monitoring system structure of our indus-
trial collaborator, SEAL is solely deployed at the server-side bythe data aggregator. Note that, alternatively, one can chooseto compress the data at the host end before sending them tothe data aggregator. Since there are no cross-host events inFileEvent, the compression ratio will be identical for bothchoices.Online compression. While offline compression can achievean optimized compression ratio with full visibility to the data,it will add a long waiting time before a query can be processed.Given that causality analysis could be requested any time ofthe day, offline compression is not a viable option. As such,we choose to apply online compression.
The online compression system is built by the followingmain components: (i) The optional compression ratio esti-mator. If the estimated ratio as described in Section 3.6 ismore than the given threshold, data is passed through the fol-lowing components. Otherwise, data is directly stored in thedatabase. (ii) Caching. It organizes and puts the most recentdata steam into a cache. When the cache is filled, the datawill be compressed. The cache size is configurable, calledchunk size. (iii) Graph structure compression. It merges andencodes all the edges that satisfy the edge merge pattern as inSection 3.3. It also generates the node mapping between theindividual nodes and the new nodes, shown in Table 2. (iv)Edge property compression. It encodes each event timestampentry using delta coding and Golomb codes as in Section 3.4.
Next, we remark on some design choices. The configurablechunk size provides a tradeoff between the memory cost andthe compression ratio. The larger the chunk size, the moreedges can be combined. We found in our experiments as inSection 5 that 134 MB per host is a large enough chunk sizeoffering sufficiently high compression capability.Query. The query system comprises three main components.(i) Query transformation. Given a query Q, SEAL transformsit into another query Q′ that the compressed database can pro-cess. In particular, it needs to transform the queried timestampand the srcid constraints, if there are any. The timestamp con-straint is encoded into a Golomb codeword, which is used asthe new constraint as in Section 3.5. If a srcid is given, thenthis individual node is mapped to all the corresponding newnodes using the node map. (ii) Querying. The transformedquery Q′ is issued to the database and the answer is obtained.(iii) Post-processing. The combined edges are decompressedfrom delta codes, the timestamp constraint is checked, themerged node is mapped to individual nodes, and the validindividual edges are returned as described in Section 3.5.
Note that, in the query transformation component, if dstidis a query constraint, then no node mapping is required sinceonly source nodes are merged during compression. In ourwork, we focus on back-tracking, where srcid is not a queryconstraint, hence the query transformation is simplified. More-over, the node mapping progress is fast due to the small num-ber of objects compared to the events.
For each given destination ID, at most one combined edge
Data Estimator Caching StructureCompression
PropertyCompression Database
Query Transformation Querying Post-Processor
Results
DatabaseNode Map
Node Map
Figure 5: The SEAL architecture of online compression andquerying.
will be returned as an answer in each chunk (containing 105
to 106 events depending on the chunk size). This observationcombined with the fact that the dependency graph is muchsmaller after compression effectively controls the query over-head in our experiments.
To quickly access the node map as in Table 2, it is cachedusing a hash map. Given that the number of nodes is muchsmaller than the number of edges, the memory size of thishash map is a small fraction of the database size.
5 Evaluation
5.1 Experiment Setup
Our evaluation about compression is primarily on a datasetof system logs collected from 95 hosts by our industrial part-ner, which we call DSind . This dataset contains 53,172,439events and takes 20GB in uncompressed form. For queryingevaluations, we select a subset of DSind covering 8 hosts, with46,308 events and a total size of 8 GB. As DSind does not haveground-truth labels of attacks, we use another data source un-der the DARPA Transparent Computing program [16]. Thelogs are collected on machines with OS instrumented, and ared team carried out simulated APT attacks. Multiple datasetsare contained, and each one corresponds to a simulated at-tack. We use CARDETs dataset, which simulates an attackon Ngnix server, with a total of 1,183M events (27% write,25.8% read and 47.2% execute), and we term this datasetDSdtc. Since our system focuses on event merging, we onlycompress the edges and a subset of the attributes, with 233GBdata size.
We implemented SEAL using JAVA version 11.0.3. Weuse JDBC (the Java Database Connectivity) to connect toPostgreSQL Database version Ubuntu 11.3-1.pgdg18.04+1.For DSind , we run our system on Ubuntu 14.04.2, with 64 GBmemory and Intel(R) Xeon(R) CPU E5-2640 v3 @ 2.60GHZ.To run the queries, one machine with AMD Ryzen 7 2700X
Eight-Core Processor and 16GB memory is used. For DSdtc,we run the system on Ubuntu 16.04, with 32 GB memory andIntel(R) Core(TM) i7-8700 CPU @ 3.20GHz.
Section 2.3 compares the designs between SEAL and othersystems, and demonstrates when other systems introduce er-rors to attack investigation. In this section, we quantify thedifference, and select the method of Full Dependency (FD)preservation [37] as the comparison target, which strikes agood balance between reduction rate and preservation of anal-ysis results. Under FD, A node u is reachable to v if eitherthere is an edge e = (u,v) or there is a causality dependencyeu→ ev, where eu is an outgoing edge of u, and ev is an in-coming edge of v. We implement a relaxed FD constraint,where repeated edges (between any pair nodes) are mergedsuch that the reachability for any pair of nodes in the graphis maintained. The corresponding compression ratio is betterthan FD since it is a relaxation. We compare the relaxed FDwith our method SEAL.
Our evaluation focuses on the following aspects. InSection 5.2, we study the data compression ratio and thenumber of reduced events for different hosts and differ-ent accessright operations (read, write, and execute). Wedemonstrate the impact of the assigned chunk size (forcaching events) on the reduction factor. We compare ourmethod to relaxed FD on compression rate. In Section 5.3, wecompare the processing time of running back-tracking querieson the compressed and uncompressed databases. For the com-pressed case, the time for the database to return the potentialmerged events and the time for SEAL to post-process them areinvestigated. We show the accuracy advantages of losslesscompression under queries with time constraints. Finally inAppendix B, we evaluate the accuracy of the average degreeestimator and compare it with direct uniform sampling.
5.2 Compression Evaluation
Compression ratio. We measure the compression ratio asthe original data system over the compressed data systemusing the above two chunk sizes. For DSind , when the chunksize (number of cached events) is 106, the compressed data isreduced to 7.6 GB from 20 GB, resulting in a compressionratio of 2.63x. For DSt pc, the chunk size equals one file sizeand contains around 5×10⁶ events. The compressed size is18 GB reduced from 233GB, resulting in a compression ratioof 12.94x.Reduction factor for different operations and hosts. Tofurther understand the compression results, we investigatethe reduction factor, defined as the number of original eventsdivided by the number of compressed events. We focus onDSind , and some examples of the hosts and the average reduc-tion factors from 95 hosts are illustrated in Table 3. In thetable, we list results for the chunk size of 106 as well as 105.
It can be observed that the types of events (read, write, andexecute) differ by the hosts. We observed that in DSind , read
0%
20%
40%
60%
80%
100%
1 10 100 1000
cumulative percentage
reduction factor
Total
Read
Write
Execute
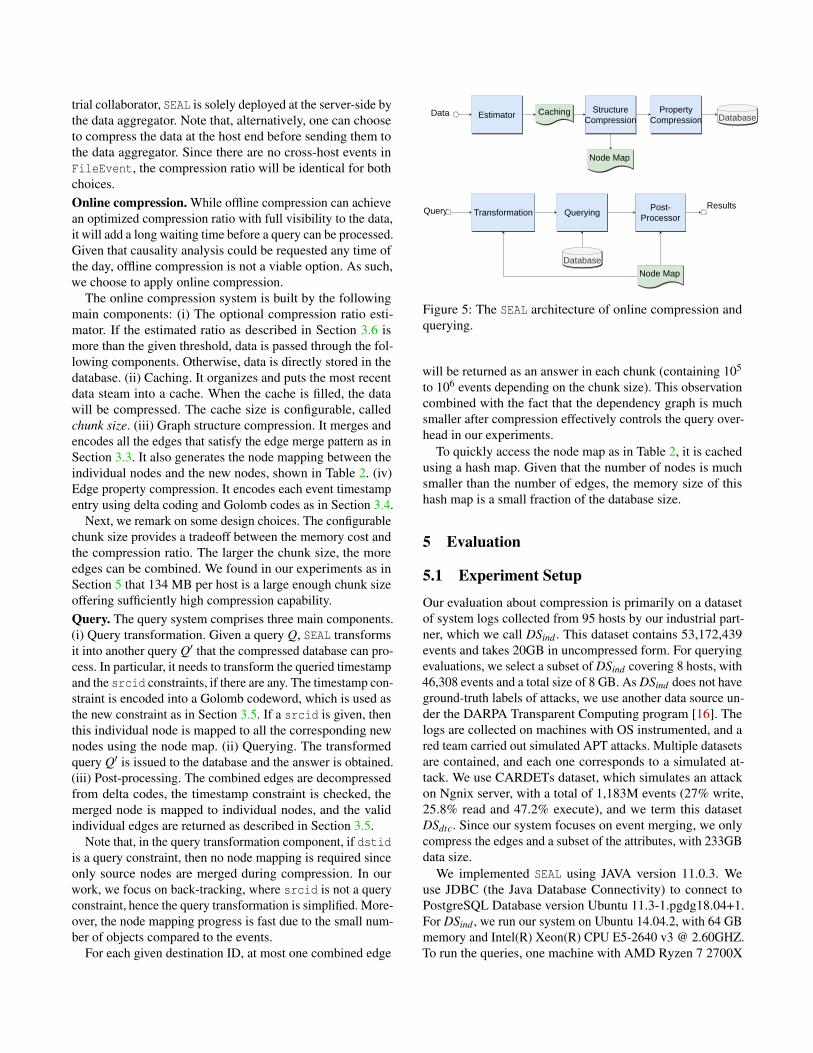
Figure 6: The cumulative distribution of the reduction factorsfor the 95 hosts in DSind . The reduction factor is calculatedfor all three types of operations, read, write, and execute, andthe overall events in each host.
is the most popular operation among most of the hosts, where72 hosts have more than 50% read events. Write is much lessprevalent in general, where 67 hosts have between 10% to30% write events. Finally, execution varies by the host, and69 hosts have between 10% to 60% executions.
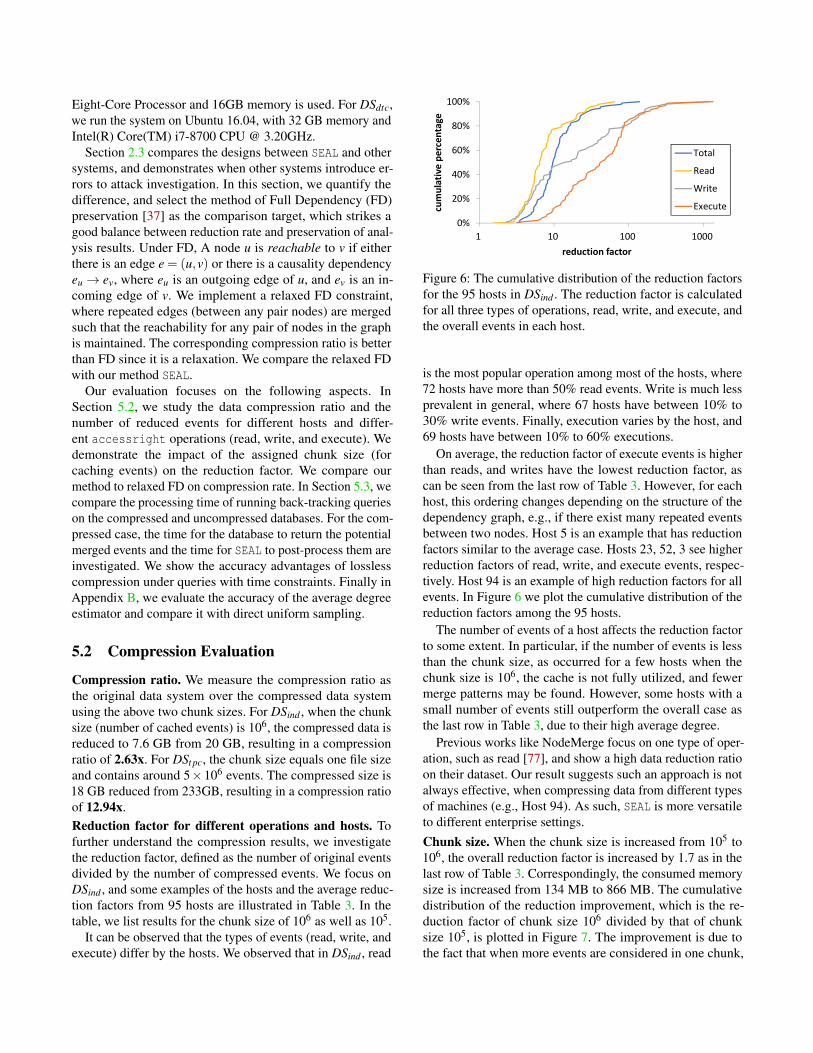
On average, the reduction factor of execute events is higherthan reads, and writes have the lowest reduction factor, ascan be seen from the last row of Table 3. However, for eachhost, this ordering changes depending on the structure of thedependency graph, e.g., if there exist many repeated eventsbetween two nodes. Host 5 is an example that has reductionfactors similar to the average case. Hosts 23, 52, 3 see higherreduction factors of read, write, and execute events, respec-tively. Host 94 is an example of high reduction factors for allevents. In Figure 6 we plot the cumulative distribution of thereduction factors among the 95 hosts.
The number of events of a host affects the reduction factorto some extent. In particular, if the number of events is lessthan the chunk size, as occurred for a few hosts when thechunk size is 106, the cache is not fully utilized, and fewermerge patterns may be found. However, some hosts with asmall number of events still outperform the overall case asthe last row in Table 3, due to their high average degree.
Previous works like NodeMerge focus on one type of oper-ation, such as read [77], and show a high data reduction ratioon their dataset. Our result suggests such an approach is notalways effective, when compressing data from different typesof machines (e.g., Host 94). As such, SEAL is more versatileto different enterprise settings.Chunk size. When the chunk size is increased from 105 to106, the overall reduction factor is increased by 1.7 as in thelast row of Table 3. Correspondingly, the consumed memorysize is increased from 134 MB to 866 MB. The cumulativedistribution of the reduction improvement, which is the re-duction factor of chunk size 106 divided by that of chunksize 105, is plotted in Figure 7. The improvement is due tothe fact that when more events are considered in one chunk,
Host ID Event Count / Reduction Read % / Reduction Write /Reduction Execute / Reduction5 278913 / 9.25x / 5.85x 61% / 6.6x / 4.1x 11% / 9.2x / 8.4x 28% / 65.3x / 33.0x
23 880162 / 25.45x / 19.14x 91% / 37.7x / 26.9x 8% / 5.3x / 4.5x 1% / 35.8x / 13.2x52 523671 / 41.45x / 17.36x 70% / 39.1x / 14.8x 22% / 54.9x / 47.5x 8% / 36.6x / 14.7x3 312392 / 15.37x / 13.31x 36% / 12.6x / 10.8x 29% / 8.8x / 8.4x 34%/ 125.8x / 52.3x
94 517978 / 78.82x / 26.9x 20% / 19.8x / 6.1x 8% / 200.6x / 96.3x 72% / 346.0x / 209.1xAll 53172439 / 9.81x / 5.71x 65% / 10.3x / 5.5x 19% / 5.3x / 3.7x 15% / 76.3x / 38.7x
Table 3: Example hosts and the reduction factors. The reduction factors are measured for two chunk sizes: 106 and 105. The lastrow shows the overall result for the 95 hosts.
0%
20%
40%
60%
80%
100%
1.0 2.0 3.0 4.0 5.0
cumulative percentage
improvement
Total
Read
Write
Execute
Figure 7: The cumulative distribution of the improvementover the 95 hosts when the chunk size is increased from 105
to 106. The improvement for Read, write, execute, and overallevents in each host is calculated.
more edges exist in the dependency graph, but the number ofnodes does not increase as fast. A larger average degree andhence a larger reduction factor is achieved. It can be seen thatthe execute events change the most with a larger chunk size,while the write events change the least with the chunk size.This also is consistent with the fact that executions have morerepeated edges between processes while write events operateon different files over time.
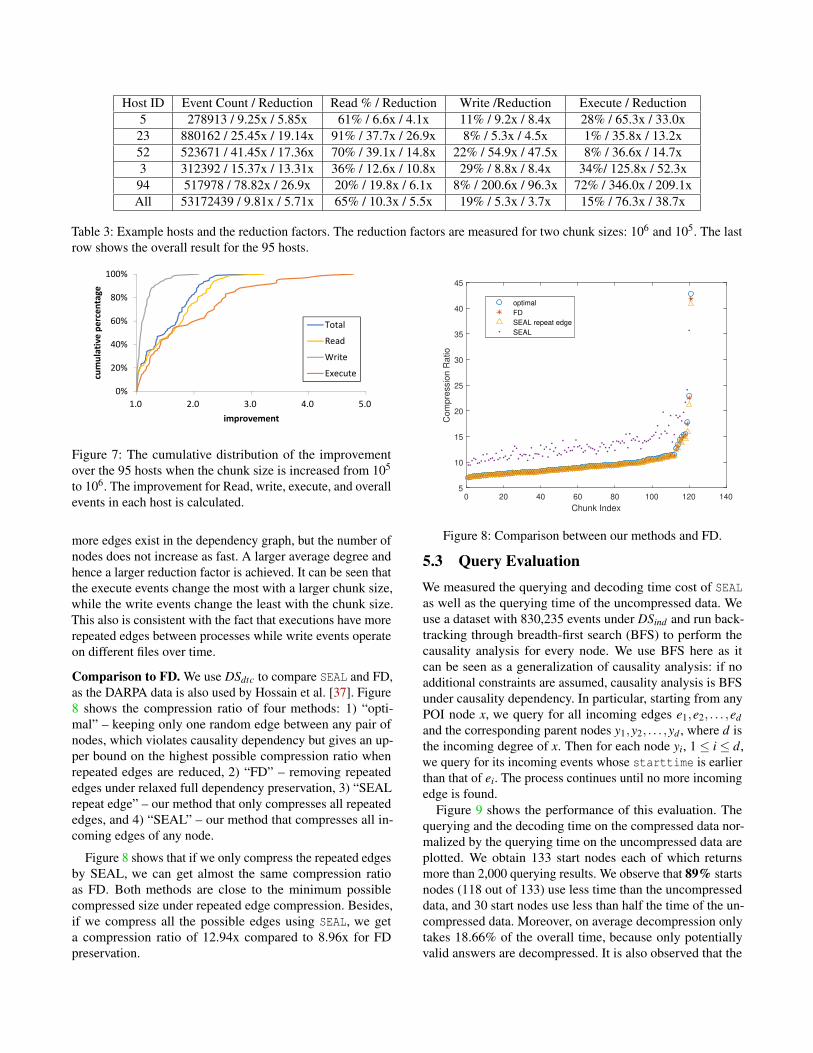
Comparison to FD. We use DSdtc to compare SEAL and FD,as the DARPA data is also used by Hossain et al. [37]. Figure8 shows the compression ratio of four methods: 1) “opti-mal” – keeping only one random edge between any pair ofnodes, which violates causality dependency but gives an up-per bound on the highest possible compression ratio whenrepeated edges are reduced, 2) “FD” – removing repeatededges under relaxed full dependency preservation, 3) “SEALrepeat edge” – our method that only compresses all repeatededges, and 4) “SEAL” – our method that compresses all in-coming edges of any node.
Figure 8 shows that if we only compress the repeated edgesby SEAL, we can get almost the same compression ratioas FD. Both methods are close to the minimum possiblecompressed size under repeated edge compression. Besides,if we compress all the possible edges using SEAL, we geta compression ratio of 12.94x compared to 8.96x for FDpreservation.
0 20 40 60 80 100 120 140
Chunk Index
5
10
15
20
25
30
35
40
45
Com
pre
ssio
n R
atio
optimal
FD
SEAL repeat edge
SEAL
Figure 8: Comparison between our methods and FD.
5.3 Query EvaluationWe measured the querying and decoding time cost of SEALas well as the querying time of the uncompressed data. Weuse a dataset with 830,235 events under DSind and run back-tracking through breadth-first search (BFS) to perform thecausality analysis for every node. We use BFS here as itcan be seen as a generalization of causality analysis: if noadditional constraints are assumed, causality analysis is BFSunder causality dependency. In particular, starting from anyPOI node x, we query for all incoming edges e1,e2, . . . ,edand the corresponding parent nodes y1,y2, . . . ,yd , where d isthe incoming degree of x. Then for each node yi, 1 ≤ i ≤ d,we query for its incoming events whose starttime is earlierthan that of ei. The process continues until no more incomingedge is found.
Figure 9 shows the performance of this evaluation. Thequerying and the decoding time on the compressed data nor-malized by the querying time on the uncompressed data areplotted. We obtain 133 start nodes each of which returnsmore than 2,000 querying results. We observe that 89% startsnodes (118 out of 133) use less time than the uncompresseddata, and 30 start nodes use less than half the time of the un-compressed data. Moreover, on average decompression onlytakes 18.66% of the overall time, because only potentiallyvalid answers are decompressed. It is also observed that the
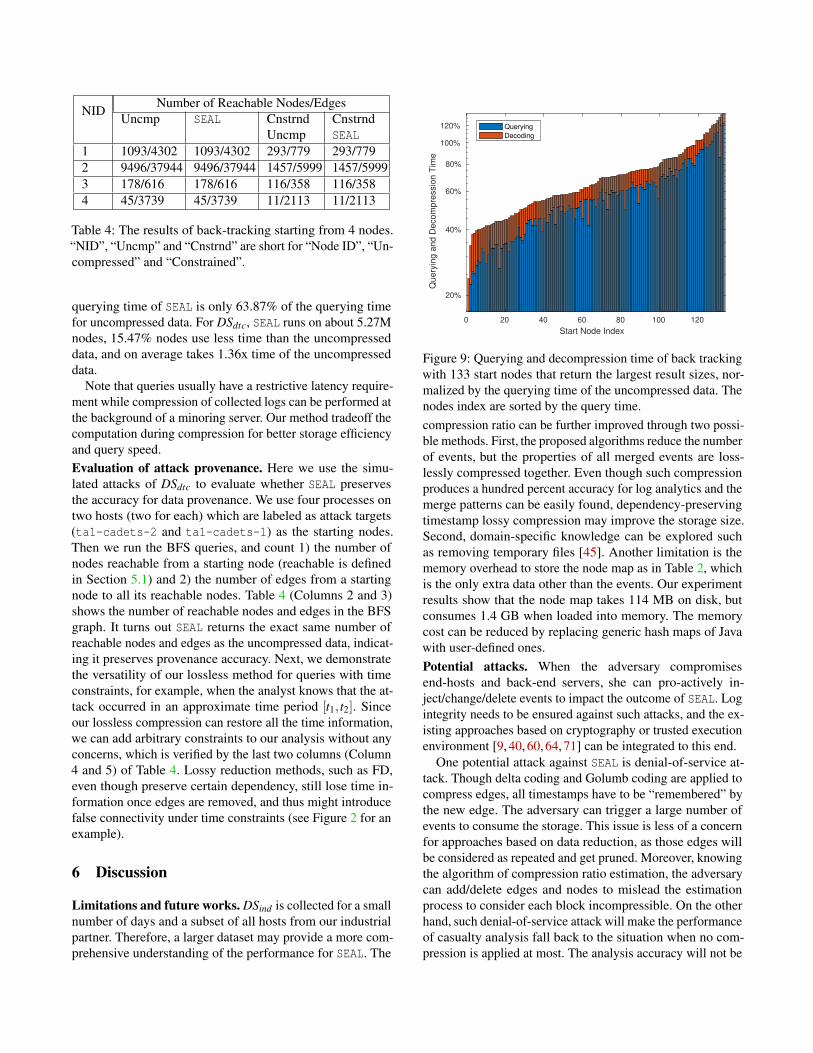
NID Number of Reachable Nodes/EdgesUncmp SEAL Cnstrnd
UncmpCnstrndSEAL
1 1093/4302 1093/4302 293/779 293/7792 9496/37944 9496/37944 1457/5999 1457/59993 178/616 178/616 116/358 116/3584 45/3739 45/3739 11/2113 11/2113
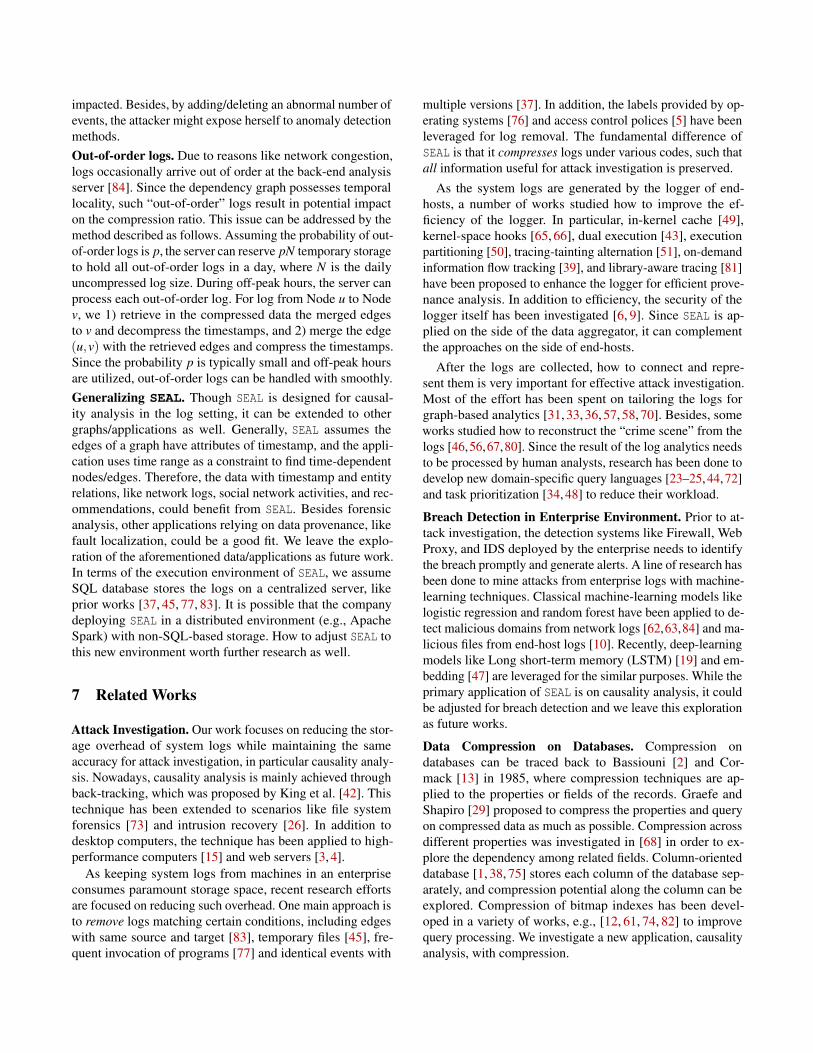
Table 4: The results of back-tracking starting from 4 nodes.“NID”, “Uncmp” and “Cnstrnd” are short for “Node ID”, “Un-compressed” and “Constrained”.
querying time of SEAL is only 63.87% of the querying timefor uncompressed data. For DSdtc, SEAL runs on about 5.27Mnodes, 15.47% nodes use less time than the uncompresseddata, and on average takes 1.36x time of the uncompresseddata.
Note that queries usually have a restrictive latency require-ment while compression of collected logs can be performed atthe background of a minoring server. Our method tradeoff thecomputation during compression for better storage efficiencyand query speed.Evaluation of attack provenance. Here we use the simu-lated attacks of DSdtc to evaluate whether SEAL preservesthe accuracy for data provenance. We use four processes ontwo hosts (two for each) which are labeled as attack targets(ta1-cadets-2 and ta1-cadets-1) as the starting nodes.Then we run the BFS queries, and count 1) the number ofnodes reachable from a starting node (reachable is definedin Section 5.1) and 2) the number of edges from a startingnode to all its reachable nodes. Table 4 (Columns 2 and 3)shows the number of reachable nodes and edges in the BFSgraph. It turns out SEAL returns the exact same number ofreachable nodes and edges as the uncompressed data, indicat-ing it preserves provenance accuracy. Next, we demonstratethe versatility of our lossless method for queries with timeconstraints, for example, when the analyst knows that the at-tack occurred in an approximate time period [t1, t2]. Sinceour lossless compression can restore all the time information,we can add arbitrary constraints to our analysis without anyconcerns, which is verified by the last two columns (Column4 and 5) of Table 4. Lossy reduction methods, such as FD,even though preserve certain dependency, still lose time in-formation once edges are removed, and thus might introducefalse connectivity under time constraints (see Figure 2 for anexample).
6 Discussion
Limitations and future works. DSind is collected for a smallnumber of days and a subset of all hosts from our industrialpartner. Therefore, a larger dataset may provide a more com-prehensive understanding of the performance for SEAL. The
0 20 40 60 80 100 120
Start Node Index
20%
40%
60%
80%
100%
120%
Qu
ery
ing
an
d D
eco
mp
ressio
n T
ime
Querying
Decoding
Figure 9: Querying and decompression time of back trackingwith 133 start nodes that return the largest result sizes, nor-malized by the querying time of the uncompressed data. Thenodes index are sorted by the query time.compression ratio can be further improved through two possi-ble methods. First, the proposed algorithms reduce the numberof events, but the properties of all merged events are loss-lessly compressed together. Even though such compressionproduces a hundred percent accuracy for log analytics and themerge patterns can be easily found, dependency-preservingtimestamp lossy compression may improve the storage size.Second, domain-specific knowledge can be explored suchas removing temporary files [45]. Another limitation is thememory overhead to store the node map as in Table 2, whichis the only extra data other than the events. Our experimentresults show that the node map takes 114 MB on disk, butconsumes 1.4 GB when loaded into memory. The memorycost can be reduced by replacing generic hash maps of Javawith user-defined ones.Potential attacks. When the adversary compromisesend-hosts and back-end servers, she can pro-actively in-ject/change/delete events to impact the outcome of SEAL. Logintegrity needs to be ensured against such attacks, and the ex-isting approaches based on cryptography or trusted executionenvironment [9, 40, 60, 64, 71] can be integrated to this end.
One potential attack against SEAL is denial-of-service at-tack. Though delta coding and Golumb coding are applied tocompress edges, all timestamps have to be “remembered” bythe new edge. The adversary can trigger a large number ofevents to consume the storage. This issue is less of a concernfor approaches based on data reduction, as those edges willbe considered as repeated and get pruned. Moreover, knowingthe algorithm of compression ratio estimation, the adversarycan add/delete edges and nodes to mislead the estimationprocess to consider each block incompressible. On the otherhand, such denial-of-service attack will make the performanceof casualty analysis fall back to the situation when no com-pression is applied at most. The analysis accuracy will not be
impacted. Besides, by adding/deleting an abnormal number ofevents, the attacker might expose herself to anomaly detectionmethods.Out-of-order logs. Due to reasons like network congestion,logs occasionally arrive out of order at the back-end analysisserver [84]. Since the dependency graph possesses temporallocality, such “out-of-order” logs result in potential impacton the compression ratio. This issue can be addressed by themethod described as follows. Assuming the probability of out-of-order logs is p, the server can reserve pN temporary storageto hold all out-of-order logs in a day, where N is the dailyuncompressed log size. During off-peak hours, the server canprocess each out-of-order log. For log from Node u to Nodev, we 1) retrieve in the compressed data the merged edgesto v and decompress the timestamps, and 2) merge the edge(u,v) with the retrieved edges and compress the timestamps.Since the probability p is typically small and off-peak hoursare utilized, out-of-order logs can be handled with smoothly.Generalizing SEAL. Though SEAL is designed for causal-ity analysis in the log setting, it can be extended to othergraphs/applications as well. Generally, SEAL assumes theedges of a graph have attributes of timestamp, and the appli-cation uses time range as a constraint to find time-dependentnodes/edges. Therefore, the data with timestamp and entityrelations, like network logs, social network activities, and rec-ommendations, could benefit from SEAL. Besides forensicanalysis, other applications relying on data provenance, likefault localization, could be a good fit. We leave the explo-ration of the aforementioned data/applications as future work.In terms of the execution environment of SEAL, we assumeSQL database stores the logs on a centralized server, likeprior works [37, 45, 77, 83]. It is possible that the companydeploying SEAL in a distributed environment (e.g., ApacheSpark) with non-SQL-based storage. How to adjust SEAL tothis new environment worth further research as well.
7 Related Works
Attack Investigation. Our work focuses on reducing the stor-age overhead of system logs while maintaining the sameaccuracy for attack investigation, in particular causality analy-sis. Nowadays, causality analysis is mainly achieved throughback-tracking, which was proposed by King et al. [42]. Thistechnique has been extended to scenarios like file systemforensics [73] and intrusion recovery [26]. In addition todesktop computers, the technique has been applied to high-performance computers [15] and web servers [3, 4].
As keeping system logs from machines in an enterpriseconsumes paramount storage space, recent research effortsare focused on reducing such overhead. One main approach isto remove logs matching certain conditions, including edgeswith same source and target [83], temporary files [45], fre-quent invocation of programs [77] and identical events with
multiple versions [37]. In addition, the labels provided by op-erating systems [76] and access control polices [5] have beenleveraged for log removal. The fundamental difference ofSEAL is that it compresses logs under various codes, such thatall information useful for attack investigation is preserved.
As the system logs are generated by the logger of end-hosts, a number of works studied how to improve the ef-ficiency of the logger. In particular, in-kernel cache [49],kernel-space hooks [65, 66], dual execution [43], executionpartitioning [50], tracing-tainting alternation [51], on-demandinformation flow tracking [39], and library-aware tracing [81]have been proposed to enhance the logger for efficient prove-nance analysis. In addition to efficiency, the security of thelogger itself has been investigated [6, 9]. Since SEAL is ap-plied on the side of the data aggregator, it can complementthe approaches on the side of end-hosts.
After the logs are collected, how to connect and repre-sent them is very important for effective attack investigation.Most of the effort has been spent on tailoring the logs forgraph-based analytics [31, 33, 36, 57, 58, 70]. Besides, someworks studied how to reconstruct the “crime scene” from thelogs [46,56,67,80]. Since the result of the log analytics needsto be processed by human analysts, research has been done todevelop new domain-specific query languages [23–25,44,72]and task prioritization [34, 48] to reduce their workload.
Breach Detection in Enterprise Environment. Prior to at-tack investigation, the detection systems like Firewall, WebProxy, and IDS deployed by the enterprise needs to identifythe breach promptly and generate alerts. A line of research hasbeen done to mine attacks from enterprise logs with machine-learning techniques. Classical machine-learning models likelogistic regression and random forest have been applied to de-tect malicious domains from network logs [62,63,84] and ma-licious files from end-host logs [10]. Recently, deep-learningmodels like Long short-term memory (LSTM) [19] and em-bedding [47] are leveraged for the similar purposes. While theprimary application of SEAL is on causality analysis, it couldbe adjusted for breach detection and we leave this explorationas future works.
Data Compression on Databases. Compression ondatabases can be traced back to Bassiouni [2] and Cor-mack [13] in 1985, where compression techniques are ap-plied to the properties or fields of the records. Graefe andShapiro [29] proposed to compress the properties and queryon compressed data as much as possible. Compression acrossdifferent properties was investigated in [68] in order to ex-plore the dependency among related fields. Column-orienteddatabase [1, 38, 75] stores each column of the database sep-arately, and compression potential along the column can beexplored. Compression of bitmap indexes has been devel-oped in a variety of works, e.g., [12, 61, 74, 82] to improvequery processing. We investigate a new application, causalityanalysis, with compression.
8 Conclusion
Causality analysis reconstructs information flow across dif-ferent files, processes, and hosts to enable effective attackinvestigation and forensic analysis. However, it also requiresa large amount of storage, which impedes its wide adoption byenterprises. Our work shows the concern about storage over-head can be eased by query-friendly compression. Comparingto prior works based on data reduction, our system SEAL of-fers similar or better storage (e.g., 9.81x event reduction and2.63x database size reduction on DSind) and query efficiency(average query speed is 64% of the uncompressed form) withguarantee of no false positive and negative in casualty queries.We make the first attempt to integrating the techniques inthe coding area (like Delta coding and Golumb coding) witha security application. We hope in the future more securityapplications can be benefited with techniques from the codingcommunity and we will continue such investigation.
Acknowledgments
We thank our shepherd Birhanu Eshete and the anonymousreviewers for their helpful comments that improved the paper.
References
[1] Daniel J Abadi, Peter A Boncz, and Stavros Harizopoulos.Column-oriented database systems. Proceedings of the VLDBEndowment, 2(2):1664–1665, 2009.
[2] Mostafa A. Bassiouni. Data compression in scientific and sta-tistical databases. IEEE Transactions on Software Engineering,(10):1047–1058, 1985.
[3] Adam Bates, Kevin Butler, Alin Dobra, Brad Reaves, PatrickCable, Thomas Moyer, and Nabil Schear. Retrofitting appli-cations with provenance-based security monitoring. arXivpreprint arXiv:1609.00266, 2016.
[4] Adam Bates, Wajih Ul Hassan, Kevin Butler, Alin Dobra,Bradley Reaves, Patrick Cable, Thomas Moyer, and Nabil Sc-hear. Transparent web service auditing via network provenancefunctions. In Proceedings of the 26th International Conferenceon World Wide Web, pages 887–895, 2017.
[5] Adam Bates, Dave Tian, Grant Hernandez, Thomas Moyer,Kevin RB Butler, and Trent Jaeger. Taming the costs of trust-worthy provenance through policy reduction. ACM Transac-tions on Internet Technology (TOIT), 17(4):1–21, 2017.
[6] Adam Bates, Dave Jing Tian, Kevin RB Butler, and ThomasMoyer. Trustworthy whole-system provenance for the linuxkernel. In 24th USENIX Security Symposium (USENIXSecurity 15), pages 319–334, 2015.
[7] Monica Bianchini, Marco Gori, and Franco Scarselli. Insidepagerank. ACM Transactions on Internet Technology (TOIT),5(1):92–128, 2005.
[8] VMware Carbon Black. Threat hunting and incident responsefor hybrid deployments. https://www.carbonblack.com/products/edr/, 2020.
[9] Kevin D Bowers, Catherine Hart, Ari Juels, and Nikos Trian-dopoulos. Pillarbox: Combating next-generation malware withfast forward-secure logging. In International Workshop on Re-cent Advances in Intrusion Detection, pages 46–67. Springer,2014.
[10] Ahmet Salih Buyukkayhan, Alina Oprea, Zhou Li, and WilliamRobertson. Lens on the endpoint: Hunting for malicious soft-ware through endpoint data analysis. In International Sympo-sium on Research in Attacks, Intrusions, and Defenses, pages73–97. Springer, 2017.
[11] Bryan Cantrill, Michael W Shapiro, and Adam H Leven-thal. Dynamic Instrumentation of Production Systems. InUSENIX Annual Technical Conference (ATC), Boston, MA,2004.
[12] Zhen Chen, Yuhao Wen, Junwei Cao, Wenxun Zheng, JiahuiChang, Yinjun Wu, Ge Ma, Mourad Hakmaoui, and GuodongPeng. A survey of bitmap index compression algorithms forbig data. Tsinghua Science and Technology, 20(1):100–115,2015.
[13] Gordon V Cormack. Data compression on a database system.Communications of the ACM, 28(12):1336–1342, 1985.
[14] Cybereason. EDR | cybereason defense plat-form. https://www.cybereason.com/platform/endpoint-detection-response-edr. Accessed: 2020-2-15.
[15] Dong Dai, Yong Chen, Philip Carns, John Jenkins, and RobertRoss. Lightweight provenance service for high-performancecomputing. In 2017 26th International Conference on ParallelArchitectures and Compilation Techniques (PACT), pages 117–129. IEEE, 2017.
[16] DARPA/I2O. DARPA Transparent Computing. https://github.com/darpa-i2o/Transparent-Computing, 2020.
[17] Anirban Dasgupta, Ravi Kumar, and Tamas Sarlos. On es-timating the average degree. In Proceedings of the 23rd in-ternational conference on World wide web, pages 795–806,2014.
[18] Peter Deutsch et al. Gzip file format specification version 4.3.Technical report, RFC 1952, May, 1996.
[19] Min Du, Feifei Li, Guineng Zheng, and Vivek Srikumar.Deeplog: Anomaly detection and diagnosis from system logsthrough deep learning. In Proceedings of the 2017 ACMSIGSAC Conference on Computer and Communications Secu-rity, pages 1285–1298, 2017.
[20] Wenfei Fan, Jianzhong Li, Xin Wang, and Yinghui Wu. Querypreserving graph compression. In Proceedings of the 2012ACM SIGMOD International Conference on Management ofData, pages 157–168, 2012.
[21] Uriel Feige. On sums of independent random variables withunbounded variance and estimating the average degree in agraph. SIAM Journal on Computing, 35(4):964–984, 2006.
[22] FireEye. Endpoint security software and solu-tions. https://www.fireeye.com/solutions/hx-endpoint-security-products.html, 2020.
[23] Peng Gao, Xusheng Xiao, Ding Li, Zhichun Li, KangkookJee, Zhenyu Wu, Chung Hwan Kim, Sanjeev R Kulkarni, andPrateek Mittal. SAQL: A stream-based query system for real-time abnormal system behavior detection. In 27th USENIXSecurity Symposium (USENIX Security 18), pages 639–656,2018.
[24] Peng Gao, Xusheng Xiao, Zhichun Li, Kangkook Jee,Fengyuan Xu, Sanjeev R Kulkarni, and Prateek Mittal. A querysystem for efficiently investigating complex attack behaviorsfor enterprise security. Proceedings of the VLDB Endowment,12(12):1802–1805, 2019.
[25] Peng Gao, Xusheng Xiao, Zhichun Li, Fengyuan Xu, Sanjeev RKulkarni, and Prateek Mittal. AIQL: Enabling efficientattack investigation from system monitoring data. In 2018USENIX Annual Technical Conference (USENIXATC18), pages 113–126, 2018.
[26] Ashvin Goel, Kenneth Po, Kamran Farhadi, Zheng Li, and EyalDe Lara. The taser intrusion recovery system. In Proceed-ings of the twentieth ACM symposium on Operating systemsprinciples, pages 163–176, 2005.
[27] Oded Goldreich and Dana Ron. Approximating average param-eters of graphs. Random Structures & Algorithms, 32(4):473–493, 2008.
[28] Solomon W Golomb, Basil Gordon, and Lloyd R Welch.Comma-free codes. Canadian Journal of Mathematics, 10:202–209, 1958.
[29] Goetz Graefe and Leonard D Shapiro. Data compressionand database performance. University of Colorado, Boulder,Department of Computer Science, 1990.
[30] Xueyuan Han, Thomas Pasquier, Adam Bates, James Mickens,and Margo Seltzer. UNICORN: Runtime Provenance-BasedDetector for Advanced Persistent Threats. In NDSS, San Diego,CA.
[31] Xueyuan Han, Thomas Pasquier, Adam Bates, James Mick-ens, and Margo Seltzer. Unicorn: Runtime provenance-based detector for advanced persistent threats. arXiv preprintarXiv:2001.01525, 2020.
[32] Morris H Hansen and William N Hurwitz. On the theory ofsampling from finite populations. The Annals of MathematicalStatistics, 14(4):333–362, 1943.
[33] Wajih Ul Hassan, Lemay Aguse, Nuraini Aguse, Adam Bates,and Thomas Moyer. Towards scalable cluster auditing throughgrammatical inference over provenance graphs. In Networkand Distributed Systems Security Symposium, 2018.
[34] Wajih Ul Hassan, Shengjian Guo, Ding Li, Zhengzhang Chen,Kangkook Jee, Zhichun Li, and Adam Bates. Nodoze: Com-batting threat alert fatigue with automated provenance triage.In NDSS, 2019.
[35] Kelly Jackson Higgins. The rebirth of endpoint secu-rity. https://www.darkreading.com/%20endpoint/the-rebirth-of-endpoint-security/d/d-id/1322775,2015.
[36] Md Nahid Hossain, Sadegh M Milajerdi, Junao Wang,Birhanu Eshete, Rigel Gjomemo, R Sekar, Scott Stoller, andVN Venkatakrishnan. SLEUTH: Real-time attack scenario
reconstruction from COTS audit data. In 26th USENIXSecurity Symposium (USENIX Security 17), pages 487–504,2017.
[37] Md Nahid Hossain, Junao Wang, Ofir Weisse, R Sekar, DanielGenkin, Boyuan He, Scott D Stoller, Gan Fang, Frank Piessens,Evan Downing, et al. Dependence-preserving data compactionfor scalable forensic analysis. In 27th USENIX SecuritySymposium (USENIX Security 18), pages 1723–1740, 2018.
[38] S Idreos, F Groffen, N Nes, S Manegold, S Mullender, andM Kersten. Monetdb: Two decades of research in column-oriented database. IEEE Data Engineering Bulletin, 2012.
[39] Yang Ji, Sangho Lee, Evan Downing, Weiren Wang, MattiaFazzini, Taesoo Kim, Alessandro Orso, and Wenke Lee. Rain:Refinable attack investigation with on-demand inter-processinformation flow tracking. In Proceedings of the 2017 ACMSIGSAC Conference on Computer and Communications Secu-rity, pages 377–390, 2017.
[40] Vishal Karande, Erick Bauman, Zhiqiang Lin, and Latifur Khan.Sgx-log: Securing system logs with sgx. In Proceedings of the2017 ACM on Asia Conference on Computer and Communica-tions Security, pages 19–30, 2017.
[41] Liran Katzir, Edo Liberty, and Oren Somekh. Estimating sizesof social networks via biased sampling. In Proceedings ofthe 20th international conference on World wide web, pages597–606, 2011.
[42] Samuel T King and Peter M Chen. Backtracking intrusions. InProceedings of the nineteenth ACM symposium on Operatingsystems principles, pages 223–236, 2003.
[43] Yonghwi Kwon, Dohyeong Kim, William Nick Sumner,Kyungtae Kim, Brendan Saltaformaggio, Xiangyu Zhang, andDongyan Xu. Ldx: Causality inference by lightweight dualexecution. In Proceedings of the Twenty-First InternationalConference on Architectural Support for Programming Lan-guages and Operating Systems, pages 503–515, 2016.
[44] Yonghwi Kwon, Fei Wang, Weihang Wang, Kyu Hyung Lee,Wen-Chuan Lee, Shiqing Ma, Xiangyu Zhang, Dongyan Xu,Somesh Jha, Gabriela F Ciocarlie, et al. Mci: Modeling-basedcausality inference in audit logging for attack investigation. InNDSS, 2018.
[45] Kyu Hyung Lee, Xiangyu Zhang, and Dongyan Xu. Loggc:garbage collecting audit log. In Proceedings of the 2013 ACMSIGSAC conference on Computer & communications security,pages 1005–1016. ACM, 2013.
[46] Bo Li, Phani Vadrevu, Kyu Hyung Lee, Roberto Perdisci,Jienan Liu, Babak Rahbarinia, Kang Li, and Manos Anton-akakis. Jsgraph: Enabling reconstruction of web attacks viaefficient tracking of live in-browser javascript executions. InNDSS, 2018.
[47] Fucheng Liu, Yu Wen, Dongxue Zhang, Xihe Jiang, XinyuXing, and Dan Meng. Log2vec: A heterogeneous graph em-bedding based approach for detecting cyber threats within en-terprise. In Proceedings of the 2019 ACM SIGSAC Conferenceon Computer and Communications Security, pages 1777–1794,2019.
[48] Yushan Liu, Mu Zhang, Ding Li, Kangkook Jee, Zhichun Li,Zhenyu Wu, Junghwan Rhee, and Prateek Mittal. Towardsa timely causality analysis for enterprise security. In NDSS,2018.
[49] Shiqing Ma, Juan Zhai, Yonghwi Kwon, Kyu Hyung Lee, Xi-angyu Zhang, Gabriela Ciocarlie, Ashish Gehani, Vinod Yeg-neswaran, Dongyan Xu, and Somesh Jha. Kernel-supportedcost-effective audit logging for causality tracking. In 2018USENIX Annual Technical Conference (USENIXATC18), pages 241–254, 2018.
[50] Shiqing Ma, Juan Zhai, Fei Wang, Kyu Hyung Lee, XiangyuZhang, and Dongyan Xu. MPI: Multiple perspective attackinvestigation with semantic aware execution partitioning. In26th USENIX Security Symposium (USENIX Security 17),pages 1111–1128, 2017.
[51] Shiqing Ma, Xiangyu Zhang, and Dongyan Xu. Protracer:Towards practical provenance tracing by alternating betweenlogging and tainting. In NDSS, 2016.
[52] Antonio Maccioni and Daniel J Abadi. Scalable pattern match-ing over compressed graphs via dedensification. In Proceed-ings of the 22nd ACM SIGKDD International Conference onKnowledge Discovery and Data Mining, pages 1755–1764,2016.
[53] Emaad Manzoor, Sadegh M Milajerdi, and Leman Akoglu.Fast Memory-efficient Anomaly Detection in Streaming Het-erogeneous Graphs. In SIGKDD, pages 1035–1044, New York,New York, USA, 2016. ACM Press.
[54] Hossein Maserrat and Jian Pei. Neighbor query friendly com-pression of social networks. In Proceedings of the 16th ACMSIGKDD international conference on Knowledge discoveryand data mining, pages 533–542, 2010.
[55] Microsoft. Event tracing for windows (etw). https://docs.microsoft.com/en-us/windows-hardware/drivers/devtest/event-tracing-for-windows--etw-,2017.
[56] Sadegh M Milajerdi, Birhanu Eshete, Rigel Gjomemo, andVenkat N Venkatakrishnan. Propatrol: Attack investigationvia extracted high-level tasks. In International Conference onInformation Systems Security, pages 107–126. Springer, 2018.
[57] Sadegh M Milajerdi, Birhanu Eshete, Rigel Gjomemo, andVN Venkatakrishnan. Poirot: Aligning attack behavior withkernel audit records for cyber threat hunting. In Proceedingsof the 2019 ACM SIGSAC Conference on Computer and Com-munications Security, pages 1795–1812, 2019.
[58] Sadegh M Milajerdi, Rigel Gjomemo, Birhanu Eshete, R Sekar,and VN Venkatakrishnan. Holmes: real-time apt detectionthrough correlation of suspicious information flows. In 2019IEEE Symposium on Security and Privacy (SP), pages 1137–1152. IEEE, 2019.
[59] Jeffrey Mogul, Balachander Krishnamurthy, Fred Douglis,Anja Feldmann, Yaron Goland, Arthur van Hoff, and D Heller-stein. Delta encoding in http. IETF, Gennaio, 65, 2002.
[60] Hung Nguyen, Radoslav Ivanov, Linh TX Phan, Oleg Sokol-sky, James Weimer, and Insup Lee. Logsafe: secure and scal-able data logger for iot devices. In 2018 IEEE/ACM Third
International Conference on Internet-of-Things Design andImplementation (IoTDI), pages 141–152. IEEE, 2018.
[61] Patrick E O’Neil. Model 204 architecture and performance.In International Workshop on High Performance TransactionSystems, pages 39–59. Springer, 1987.
[62] Alina Oprea, Zhou Li, Robin Norris, and Kevin Bowers. Made:Security analytics for enterprise threat detection. In Proceed-ings of the 34th Annual Computer Security Applications Con-ference, pages 124–136, 2018.
[63] Alina Oprea, Zhou Li, Ting-Fang Yen, Sang H Chin, andSumayah Alrwais. Detection of early-stage enterprise infec-tion by mining large-scale log data. In 2015 45th AnnualIEEE/IFIP International Conference on Dependable Systemsand Networks, pages 45–56. IEEE, 2015.
[64] Riccardo Paccagnella, Pubali Datta, Wajih Ul Hassan, AdamBates, Christopher W Fletcher, Andrew Miller, and Dave Tian.Custos: Practical tamper-evident auditing of operating systemsusing trusted execution. In Proc. of the Symposium on Networkand Distributed System Security (NDSS), 2020.
[65] Thomas Pasquier, Xueyuan Han, Mark Goldstein, ThomasMoyer, David Eyers, Margo Seltzer, and Jean Bacon. Practicalwhole-system provenance capture. In Proceedings of the 2017Symposium on Cloud Computing, pages 405–418, 2017.
[66] Thomas Pasquier, Xueyuan Han, Thomas Moyer, Adam Bates,Olivier Hermant, David Eyers, Jean Bacon, and Margo Seltzer.Runtime analysis of whole-system provenance. In Proceed-ings of the 2018 ACM SIGSAC Conference on Computer andCommunications Security, pages 1601–1616, 2018.
[67] Kexin Pei, Zhongshu Gu, Brendan Saltaformaggio, ShiqingMa, Fei Wang, Zhiwei Zhang, Luo Si, Xiangyu Zhang, andDongyan Xu. Hercule: Attack story reconstruction via commu-nity discovery on correlated log graph. In Proceedings of the32Nd Annual Conference on Computer Security Applications,pages 583–595, 2016.
[68] Vijayshankar Raman and Garret Swart. How to wring a tabledry: Entropy compression of relations and querying of com-pressed relations. In Proceedings of the 32nd internationalconference on Very large data bases, pages 858–869, 2006.
[69] Redhat. Chapter 7. system auditing. https://access.redhat.com/documentation/en-us/red_hat_enterprise_linux/6/html/security_guide/chap-system_auditing, 2019.
[70] Omid Setayeshfar, Christian Adkins, Matthew Jones,Kyu Hyung Lee, and Prashant Doshi. Graalf: Supportinggraphical analysis of audit logs for forensics. arXiv preprintarXiv:1909.00902, 2019.
[71] Carlton Shepherd, Raja Naeem Akram, and KonstantinosMarkantonakis. Emlog: tamper-resistant system logging forconstrained devices with tees. In IFIP International Con-ference on Information Security Theory and Practice, pages75–92. Springer, 2017.
[72] Xiaokui Shu, Frederico Araujo, Douglas L Schales, Marc PhStoecklin, Jiyong Jang, Heqing Huang, and Josyula R Rao.Threat intelligence computing. In Proceedings of the 2018ACM SIGSAC Conference on Computer and CommunicationsSecurity, pages 1883–1898, 2018.
[73] Sriranjani Sitaraman and Subbarayan Venkatesan. Forensicanalysis of file system intrusions using improved backtrack-ing. In Third IEEE international workshop on informationassurance (IWIA’05), pages 154–163. IEEE, 2005.
[74] Michał Stabno and Robert Wrembel. Rlh: Bitmap compres-sion technique based on run-length and huffman encoding.Information Systems, 34(4-5):400–414, 2009.
[75] Mike Stonebraker, Daniel J Abadi, Adam Batkin, XuedongChen, Mitch Cherniack, Miguel Ferreira, Edmond Lau, Amer-son Lin, Sam Madden, Elizabeth O’Neil, et al. C-store: acolumn-oriented dbms. In Making Databases Work: the Prag-matic Wisdom of Michael Stonebraker, pages 491–518. 2018.
[76] Yujuan Tan, Hong Jiang, Dan Feng, Lei Tian, and ZhichaoYan. Cabdedupe: A causality-based deduplication perfor-mance booster for cloud backup services. In 2011 IEEE inter-national parallel & distributed processing symposium, pages1266–1277. IEEE, 2011.
[77] Yutao Tang, Ding Li, Zhichun Li, Mu Zhang, Kangkook Jee,Xusheng Xiao, Zhenyu Wu, Junghwan Rhee, Fengyuan Xu, andQun Li. Nodemerge: template based efficient data reductionfor big-data causality analysis. In Proceedings of the 2018ACM SIGSAC Conference on Computer and CommunicationsSecurity, pages 1324–1337. ACM, 2018.
[78] Trustwave. Trustwave global security report, 2015.
[79] J Uthayakumar, T Vengattaraman, and P Dhavachelvan. Asurvey on data compression techniques: From the perspectiveof data quality, coding schemes, data type and applications.Journal of King Saud University-Computer and InformationSciences, 2018.
[80] Phani Vadrevu, Jienan Liu, Bo Li, Babak Rahbarinia,Kyu Hyung Lee, and Roberto Perdisci. Enabling reconstruc-tion of attacks on users via efficient browsing snapshots. InNDSS, 2017.
[81] Fei Wang, Yonghwi Kwon, Shiqing Ma, Xiangyu Zhang, andDongyan Xu. Lprov: Practical library-aware provenance trac-ing. In Proceedings of the 34th Annual Computer SecurityApplications Conference, pages 605–617, 2018.
[82] Kesheng Wu, Ekow J Otoo, and Arie Shoshani. Optimizingbitmap indices with efficient compression. ACM Transactionson Database Systems (TODS), 31(1):1–38, 2006.
[83] Zhang Xu, Zhenyu Wu, Zhichun Li, Kangkook Jee, JunghwanRhee, Xusheng Xiao, Fengyuan Xu, Haining Wang, and GuofeiJiang. High fidelity data reduction for big data security de-pendency analyses. In Proceedings of the 2016 ACM SIGSACConference on Computer and Communications Security, pages504–516. ACM, 2016.
[84] Ting-Fang Yen, Alina Oprea, Kaan Onarlioglu, Todd Leetham,William Robertson, Ari Juels, and Engin Kirda. Beehive: Large-scale log analysis for detecting suspicious activity in enterprisenetworks. In Proceedings of the 29th Annual Computer Secu-rity Applications Conference, pages 199–208, 2013.
A Compression Ratio as a function of AverageDegrees
In this section, we derive explicit expressions for the compres-sion ratio. We show that the compressed graph size is alwayssmaller than the original size, though new vertices might beintroduced.
In a dependency graph G = (V,E), the number of vertices(nodes) is denoted by n = |V |, and the number of edges isdenoted by m = |E|. Recall that the edges are directed andmultiple edges (repeated edges) may exist from one node toanother. For node v ∈ V , let its number of parent nodes bepv, and its number of incoming edges be mv. We have m =
∑v∈V mv. Moreover, denote by p = ∑v∈V pv the total numberof parent nodes for all nodes in V . Therefore, p representsthe number of edges of G after removing repeated ones. LetGundirected denote the undirected graph which is identical toG except that edge directions are removed. Let Gsimple denotethe simple graph obtained by removing the edge directionsand the repeated edges from G. The average degree of thegraph Gundirected is denoted by davg. Then,
davg =2mn
=2∑v∈V mv
n. (4)
The average degree of Gsimple is denoted by pavg, which is
pavg =2pn
=2∑v∈V pv
n. (5)
Denote by Sevent , Snode the event and node sizes beforecompression, and by S′event , S′node the sizes after compression.They can be calculated by
Sevent = ∑v∈V
mvCevent , (6)
S′event = ∑v∈V :mv>1
(Cevent +2mvC∆
)+ ∑
v∈V :mv=1Cevent , (7)
Snode = nCnode, (8)S′node = nCnode + size_map. (9)
Here Cevent = 105 (measured in bytes) is the size of all at-tributes of an event in the uncompressed format. In ourdatabase, Cevent includes the sizes of starttime , endtime,agentid, etc. C∆ is the delta-encoded data and separator sizefor each time entry, and the factor 2 reflects that two time at-tributes are recorded for every event. For most of the cases wehave observed, C∆ ≤ 4 bytes. Cnode is the size of one node en-try in the uncompressed format, including the size of nodeid,nodename, etc. Finally, size_map is the node map shown intable 2, and can be expressed as
size_map = ∑v∈V
CID(pv +1). (10)
Here CID = 4 is the constant size required for each nodeid.The above size parameters depend on the particular database
attributes, and to allow for an arbitrary database design, weuse the general expressions instead of the particular sizes. Inour experiments, Snode and S′node take a negligible fraction ofthe total storage. As a result, we ignore the node sizes in thefollowing calculations. However, an exact calculation can becarried out if the node size is comparable to the event size.
The difference between the original size and the com-pressed size is:
Sevent −S′event (11)
= ∑v∈V :mv>1
(mv(Cevent −2C∆)−Cevent
). (12)
It is obvious that the compressed size is always smaller thanthe original size if Cevent > 2C∆, which is true in our deploy-ment. The compression ratio can be expressed as
ratio =Sevent
S′event(13)
≥ ∑v∈V mvCevent
∑v∈V
(Cevent +2mvC∆
) (14)
=mCevent
nCevent +2mC∆
(15)
=davgCevent
2Cevent +2davgC∆
(16)
Equation (14) holds because we remove the condition mv > 1in the denominator, and thus we obtain a lower bound on theratio. In Equation (16) we multiply the numerator and thedenominator by 2
n and used Equation (4). If the node size isalso included, the ratio will also depend on pavg defined inEquation (5).Remark. 1) Let us call the dependency graph “incompress-ible” if its compression ratio is lower than a given threshold.It is often unacceptable to compress graphs that are incom-pressible. Therefore, our estimated compression ratio is alower bound of the exact ratio (e.g., the inequality of Equa-tion (14)). 2) The discussion in Section 3.6 assumes that thenode map size is negligible. If it is not, we also need to esti-mate pavg. Note that pavg corresponds to the average degreeof the simple graph Gsimple, one can simply apply Algorithm2 to H = Gsimple.
B Average Degree Estimator Evaluation
We measure the performance of the compression ratio (oraverage degree) estimator on our dataset following Algorithm2. We run the algorithm on 8 chunks, each containing 106
events. For each chunk, 20 independent trials are conducted.The parameters are chosen to be θ = 10, p jump = 0.1, suchthat the estimation error is minimized for the chunks in theexperiment. We measure the mean squared error (MSE) be-tween the estimated average degree d and the true averagedegree davg, averaged over all trials and all chunks in the ex-periment. The results are shown in Figure 10. The MSE valuehas an obvious drop as the sample size percentage grows upto 5% and quickly converges when the samples cover half ofthe whole trunk. We then set 5% as the sample size.
Figure 10 also shows that our method has better accuracycompared to the naive estimator, which estimates davg bydirectly calculating the average degrees of uniformly samplednodes.
0% 10% 20% 30% 40% 50%
Sample Percentage
10 1
10 2
10 3
10 4
MS
EProposed Estimator
Naive Estimator
Figure 10: The y axis is the mean square error distance be-tween the estimated average degree from the sampled dataand the true average degree, averaged over all trials and allchunks in the experiment. The x axis is the percentage of thesample.


![Race Causality[1]](https://img.pdfslide.us/doc/110x75/55cf905c550346703ba52ea8/race-causality1.jpg)