Embed Size (px)
Citation preview

25
OPTIMIZATION OF RHEOLOGICAL AND FILTRATION PROPERTIES OF NIGERIA CLAY USING
FACTORIAL DESIGN
TOYESE, Oyegoke
Drilling Fluids Research and Engineering Laboratory,
MI – Swaco Nigeria Limited, Port Harcourt, Rivers State, Nigeria.
Email of corresponding author: [email protected]
Phone: +2348098679625
ABSTRACT
Nigeria is blessed with about 700 million tonnes of bentonitic clay which in its natural state does not meet the API
standard for drilling fluid application. Hence, this research undertake a process optimization and model
development for improving rheological properties of this clay using 2 by 2 full factorial experimental design
techniques. The accuracy of the models developed for the beneficiation of the clay were confirmed by the adjusted
R-squared values of 0.94, 0.924 and 0.995 for yield point, plastic viscosity and filtrate volume respectively,
alongside with the comparison of the experimental and model prediction results. The best conditions for treating
the clay was been deduced from the best beneficiated clay sample which was characterized for yield point, plastic
viscosity and filtrate volume respectively and was found to meet the API conditions for its drilling mud
applications. Thus, the model developed was confirmed to be safe and suitable for examining treatment variations.
Investigating effective way of examining interaction effects of the treatments and predetermines the treatment of
local clay properties for various compositions.
Keywords: Bentonite; Beneficiation; Model; Drilling; Factorial Design.
INTRODUCTION
Background of Study
Petroleum is one of the major sources of energy in which a lot of machines like automobiles, generators depend on
and its importance cannot be over empathized. Petroleum is a naturally occurring complex oily mixture formed as a
result of the decomposition of the plant and animal remains under high pressure and temperature which took place
millions of years ago and are buried underground in tiny pockets in rocks. In order to access the oil reserves, we
need to drill oil wells into the rocks to pump out the oil. Some wells are more than two miles deep and can stretch
more than eight miles sideways [8].
Drilling mud is basically composed of water, bentonitic clay and other chemicals such as barite, calcium carbonate
and exhibits the properties such as apparent viscosity, plastic viscosity and yield point which plays important role
in designing efficient and optimized drilling operation. These properties serve the functions of cleaning the rock
fragments from beneath the bit and carry them to the surface as well as cooling and lubricating the rotating drill-
string and bit. Out of the constituents used for the formulation of drilling mud, bentonite has always been sourced
from outside of this country ever since 1960 which had drastically led to the neglect of the local bentonite which is
unhealthy for the economy of our country. This have also made the purchasing cost for drilling materials to be high
[14], [2], [15]. Hence, this research devices an alternative and easier means of treating our local bentonitic clay so
as to serve as substitute for the foreign grade bentonite.
Factorial Design Approach and Terminologies
Factorial design planning is simply applied to determine and represent the cause and effect relationship between
true mean responses and input control variables influencing the responses. Three kinds of design of experiments
[16] are possible between output and input variables.
a. Screening designs are used in beginning of process where more than five factors are involved, to recognize
the most critical factors.
b. Characterization deigns narrow the numbers of factors to only a few and permit for some quantitative
understanding of the interactions among factors.
International Journal of Innovative Scientific & Engineering
Technologies Research 1(1):25-36 , July-Sept. 2013
© SEAHI PUBLICATIONS, 2013 www.seahipaj.org ISSN: 2360-896X
26
c. Optimization designs focus on only one or two factors, but in much more depth to gain a precise
understanding of relationships between factors
A full factorial design combines the levels for each factor with all the levels of every factor. It covers all
combinations and provides best data. However it consumes more time and resources. While a fractional Factorial
design, uses too many of resources, or if a slightly non orthogonal array is accepted a fractional design is used. To
analyze the data from a design of experiment, evaluating the statistical significance by computing one way
ANOVA, or for more than one factor N-way ANOVA is essential. The practical significance can be evaluated
through sum of squares, line or column charts, and normal probability chart [16].
Review of Literature on Clay Beneficiation
Previous Approach
Previous researches have shown that Nigerian has a probable reserve of about 700 million tonnes of bentonite clay
in North-Eastern Nigeria. Though the clay in its natural state has properties below the standard required for drilling
fluid application [16], [17], [1] but in recent times, more researches has been conducted to device means of
beneficiating the clays through the use of additives for a better performance. Some of the research works are one
which beneficiated Nasarawa and Abia clay using starch. Another formulated and characterized a bentonite
extended drilling mud from Nasarawa clay using biopolymer (Rel-Pac) additives and lots more [2, 7, 9]. All this
previous research on beneficiation has been adopting the one factor at a time (OFAT) experiment which gave a
satisfactory result when only one factor is changed but cannot be used to study the effect of two-factors at a time.
New Approach
In present work, Polypac and PacR were been used to improve the viscosity of the clay together with the addition
of soda ash which helps to reduce the concentration of calcium ion and increase the sodium ion concentration
present in the clay simultaneously.
This research also assesses the effectiveness of additives role in improving the rheological and filtration properties
of the local clay by increasing the viscosity and reducing the filtrate.
Hence, factorial design techniques were been applied so as to provide great flexibility for exploring or enhancing
the treatment of local clay for the formulation of water based mud in diverse ways [14], [9], [2], [15] with adoption
of American Petroleum Institute (API) Specifications in testing and defining their properties.
MATERIALS AND METHODS
Locally sourced clay from Sangere in Yola, Adamawa State and Polypac, Soda Ash and PacR, sourced from Mi-
Swaco Drilling Fluids, Port Harcourt, Rivers State in Nigeria were used.
Evaluation of the Local Clay for Mud Formulation
To test for the suitability of the prepared local clay from Sangare in Yola for mud formulation the following
analysis were been carried-out;
Rheological Analysis
A suspension of the bentonite was prepared and 22.5 g of clay was been added to 350 ml of de-ionized water while
stirring on the mixer. After been stirred for 5 minutes, the container was removed from the mixer and scraped on
the sides with spatula to dislodge any bentonite adhering to the walls of the container having been sure that all
bentonite clinged to the spatula was incorporated into suspension. The container was replaced on the mixer and the
stirring continued. The container was removed from the mixer and scraped on the sides with spatula to dislodge
any bentonite adhering to the walls of the container after another 5 minutes and after 10 minutes till a total stirring
time of 20 minutes is completed. The bentonite suspension was then aged up to 16 h in sealed or covered container
at room temperature. The storage temperature and duration was been recorded. After aging, the bentonite
suspension was shaken well and then poured into the mixer container then stirred for 5 minutes on the mixer. The
suspension was then poured into the viscometer cup provided with the viscometer. The dial reading of 600 rpm and
300 rpm rotor speed settings of the viscometer was recorded when at constant value for each of rpm at a room
temperature of 25 oC.
𝑷𝑽 = Ф𝟔𝟎𝟎 – Ф𝟑𝟎𝟎 (1)
𝒀𝑷 = Ф𝟔𝟎𝟎 – 𝑷𝑽 (2)
Filtration Analysis
The prepared and tested suspension in 3.3.3 was recombined and stirred in a container for 1 minute on the mixer
while the temperature was adjusted to 25 o C. The suspension was then been poured into the cell and before adding
Toyese, O..... Int. J. Inno. Scientific & Eng. Tech. Res. 1 (1):25-36, 2013

27
the suspension it was ensured that part of filter cell was dried and that the gaskets are not distorted or worn, the
filter paper and the O-ring groove was in place at the base cap of filtrate tube. The mud was poured to within about
13 mm from the base cap of the filter cell and the assembly was completed and a measuring cylinder was placed
under the drain tube. One timer was set for 7.5 min and the second was set to 30 min. Both timers were started after
adjusting the pressure to 100 psi (690 kPa) and the pressure was supplied by compressed carbon dioxide or
nitrogen gas. The fluid loss was measured in milliliters. The cell was disassembled and the mud was discarded
while extreme care was taken to save filter paper with a minimum disturbance of the cake.
Determination of Sand Content
The glass tube was fed to the “mud” line while sample and water is added to the sample in the tube until it attains
the next scribed mark. Then, thumb is placed over the mouth of tube and shaken vigorously to ensure homogenous
mixing. After that the mixture is poured onto the clean screen while more water is added to tube, shaken and
poured onto the screen while the liquid that passes through the screen is been discarded. This was repeated until
when the wash water is clean. The sand retained on screen is washed in order to free any adhering mud and finally
the funnel is placed on top of screen assembly with the assembly slowly been inverted and the tip of funnel was
inserted into glass tube while the sand is washed back into tube with a fine spray of water or a wash bottle. After
the sand was allowed to settle, the volume percent of sand from graduations on the glass measuring tube was read
and recorded in %.
Determination of Hydrogen ion Concentration
An indicator stick was placed in the mud and was allowed to remain in it until the color has stabilized, usually less
than a minute. Rinse the stick off with de-ionized water but do not wipe. The colors of the stick were compared
with the color standard provided and the pH of the mud was estimated and the pH of the mud was reported to the
nearest 0.5 pH units.
Particle Size Analysis
10 g of dried bentonite was weighed and added to approximately 350 ml of water containing 0.2 g of sodium
phosphate. The mixture was stirred on the mixer for 5min. The sample was then transferred into the 75 micron
sieve. A water bottle was used to remove all material from the container to the sieve. Then, the material on the
sieve with water controlled to 12 psi or 69 kPa from a spray nozzle was been washed for 2 min. While washing, the
tip of the spray nozzle was held approximately in the plane of the top of sieve and moves the spray of water
repeatedly over the sample. The residue from the sieve was washed into an evaporating dish and excess clear water
was being decanted and dried in an oven to a constant mass. The mass of residue was been recorded.
𝐏 > 𝟕𝟓 µ𝒎 = 𝐌
𝐌 𝐱 𝟏𝟎𝟎 (3)
Determination of Moisture Content
An empty dish was weighed then a dish with 10 g of bentonite was weighed and their various weight readings as
M0 and M1 respectively. The sample was been then kept in the oven for at least 3 hr and reweighed after drying.
Its weight reading was recorded as M2.
% 𝐌 = (𝐌𝟐 – 𝐌𝟎)
(𝐌𝟏 – 𝐌𝟎) 𝐱 𝟏𝟎𝟎 (4)
Determination of Calcium content (Ca++
)
5 - 10 ml of distilled water and 1 ml of the water or filtrate to be tested was added to titration vessel. Then, 1 ml or
20 drops of strong buffer solution (NH4OH base) and 4 – 6 drops of calmagite were been added to the filtrate and
mixed with the use of a stirring rod. A wine red color was developed to confirm the presence of calcium and/or
magnesium.
Using a pipette, Standard Versenate Solution (EDTA) was been titrated against the mixture, while stirring the
mixture continuously, until the sample first turns to blue with no undertint of red remaining. The number of ml of
Standard Versenate solution used was recorded and the calcium ion and calcium carbonate content is calculated as:
(𝒎 ) = 𝒎 𝑽
𝒎 𝒎 𝟒𝟎𝟎 (5)
Local Clay Treatment
To upgrade the local clay properties so as to meet the API Specification, the following were been carried-out;
Toyese, O..... Int. J. Inno. Scientific & Eng. Tech. Res. 1 (1):25-36, 2013
28
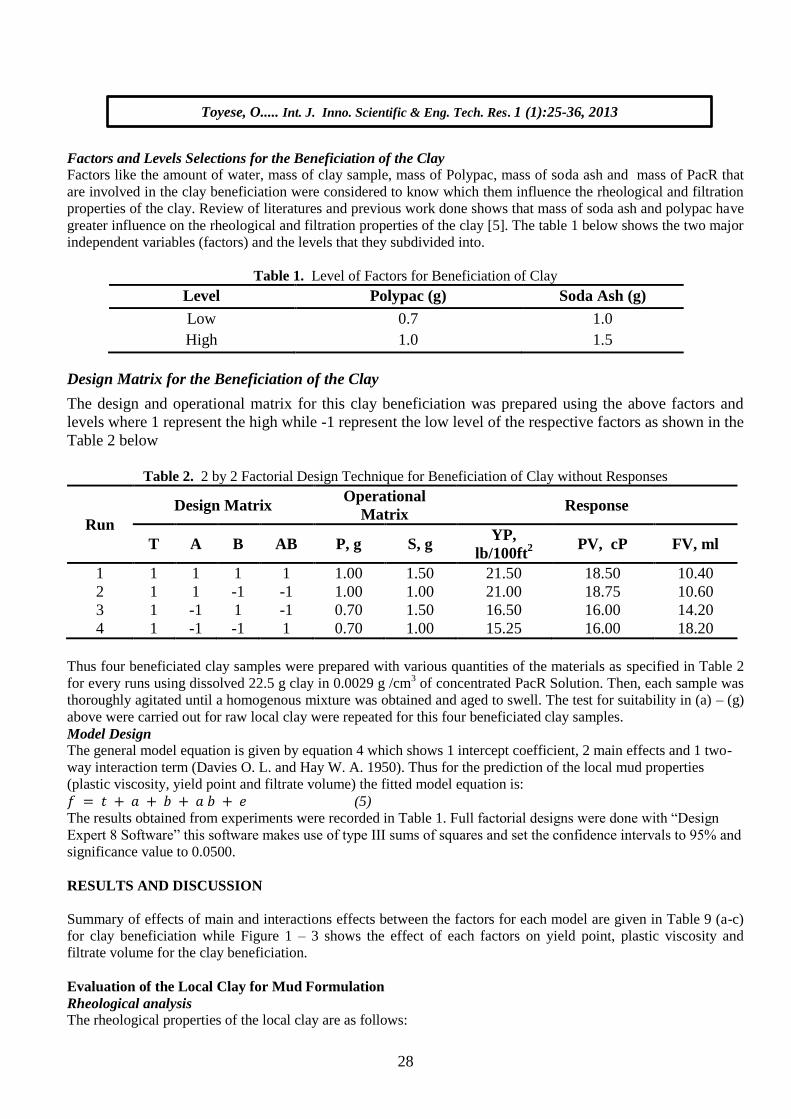
Factors and Levels Selections for the Beneficiation of the Clay
Factors like the amount of water, mass of clay sample, mass of Polypac, mass of soda ash and mass of PacR that
are involved in the clay beneficiation were considered to know which them influence the rheological and filtration
properties of the clay. Review of literatures and previous work done shows that mass of soda ash and polypac have
greater influence on the rheological and filtration properties of the clay [5]. The table 1 below shows the two major
independent variables (factors) and the levels that they subdivided into.
Table 1. Level of Factors for Beneficiation of Clay
Level Polypac (g) Soda Ash (g)
Low 0.7 1.0
High 1.0 1.5
Design Matrix for the Beneficiation of the Clay
The design and operational matrix for this clay beneficiation was prepared using the above factors and
levels where 1 represent the high while -1 represent the low level of the respective factors as shown in the
Table 2 below
Table 2. 2 by 2 Factorial Design Technique for Beneficiation of Clay without Responses
Run
Design Matrix Operational
Matrix Response
T A B AB P, g S, g YP,
lb/100ft2
PV, cP FV, ml
1 1 1 1 1 1.00 1.50 21.50 18.50 10.40
2 1 1 -1 -1 1.00 1.00 21.00 18.75 10.60
3 1 -1 1 -1 0.70 1.50 16.50 16.00 14.20
4 1 -1 -1 1 0.70 1.00 15.25 16.00 18.20
Thus four beneficiated clay samples were prepared with various quantities of the materials as specified in Table 2
for every runs using dissolved 22.5 g clay in 0.0029 g /cm3 of concentrated PacR Solution. Then, each sample was
thoroughly agitated until a homogenous mixture was obtained and aged to swell. The test for suitability in (a) – (g)
above were carried out for raw local clay were repeated for this four beneficiated clay samples.
Model Design
The general model equation is given by equation 4 which shows 1 intercept coefficient, 2 main effects and 1 two-
way interaction term (Davies O. L. and Hay W. A. 1950). Thus for the prediction of the local mud properties
(plastic viscosity, yield point and filtrate volume) the fitted model equation is:
𝑓 = 𝑡 𝑎 𝑏 𝑎 𝑏 𝑒 (5)
The results obtained from experiments were recorded in Table 1. Full factorial designs were done with “Design
Expert 8 Software” this software makes use of type III sums of squares and set the confidence intervals to 95% and
significance value to 0.0500.
RESULTS AND DISCUSSION
Summary of effects of main and interactions effects between the factors for each model are given in Table 9 (a-c)
for clay beneficiation while Figure 1 – 3 shows the effect of each factors on yield point, plastic viscosity and
filtrate volume for the clay beneficiation.
Evaluation of the Local Clay for Mud Formulation
Rheological analysis
The rheological properties of the local clay are as follows:
Toyese, O..... Int. J. Inno. Scientific & Eng. Tech. Res. 1 (1):25-36, 2013
29
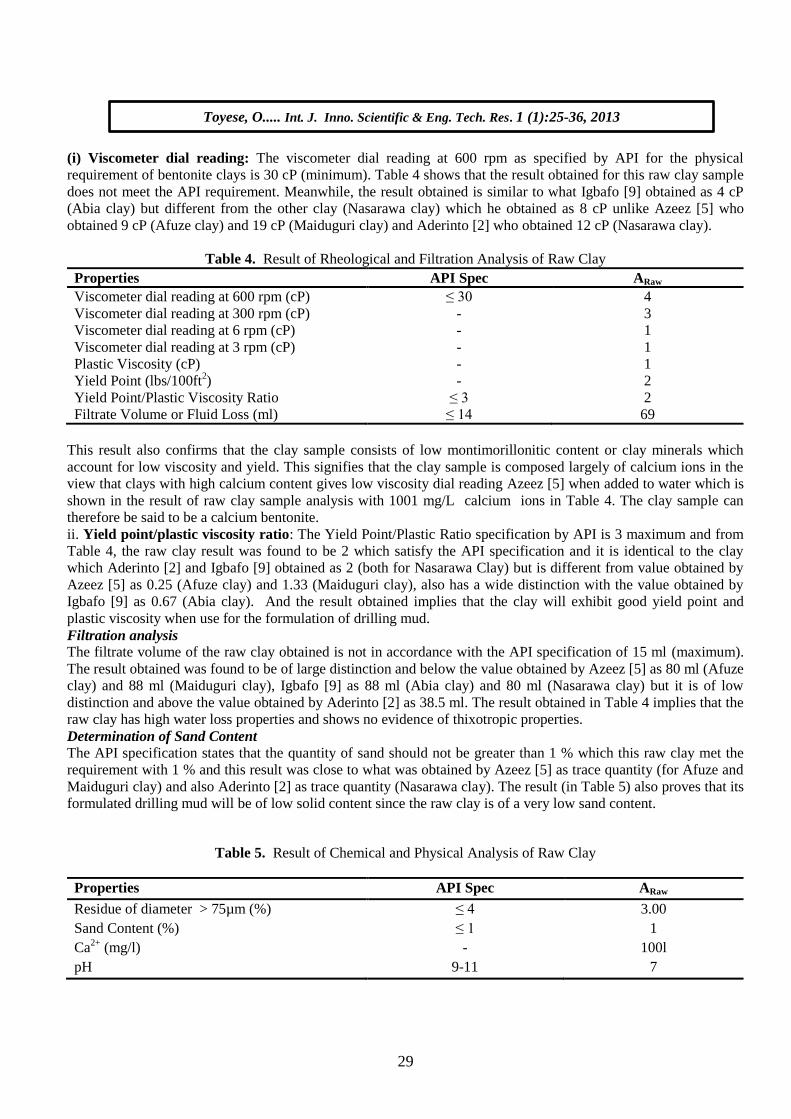
(i) Viscometer dial reading: The viscometer dial reading at 600 rpm as specified by API for the physical
requirement of bentonite clays is 30 cP (minimum). Table 4 shows that the result obtained for this raw clay sample
does not meet the API requirement. Meanwhile, the result obtained is similar to what Igbafo [9] obtained as 4 cP
(Abia clay) but different from the other clay (Nasarawa clay) which he obtained as 8 cP unlike Azeez [5] who
obtained 9 cP (Afuze clay) and 19 cP (Maiduguri clay) and Aderinto [2] who obtained 12 cP (Nasarawa clay).
Table 4. Result of Rheological and Filtration Analysis of Raw Clay
Properties API Spec ARaw
Viscometer dial reading at 600 rpm (cP) ≤ 30 4
Viscometer dial reading at 300 rpm (cP) - 3
Viscometer dial reading at 6 rpm (cP) - 1
Viscometer dial reading at 3 rpm (cP) - 1
Plastic Viscosity (cP) - 1
Yield Point (lbs/100ft2) - 2
Yield Point/Plastic Viscosity Ratio ≤ 3 2
Filtrate Volume or Fluid Loss (ml) ≤ 14 69
This result also confirms that the clay sample consists of low montimorillonitic content or clay minerals which
account for low viscosity and yield. This signifies that the clay sample is composed largely of calcium ions in the
view that clays with high calcium content gives low viscosity dial reading Azeez [5] when added to water which is
shown in the result of raw clay sample analysis with 1001 mg/L calcium ions in Table 4. The clay sample can
therefore be said to be a calcium bentonite.
ii. Yield point/plastic viscosity ratio: The Yield Point/Plastic Ratio specification by API is 3 maximum and from
Table 4, the raw clay result was found to be 2 which satisfy the API specification and it is identical to the clay
which Aderinto [2] and Igbafo [9] obtained as 2 (both for Nasarawa Clay) but is different from value obtained by
Azeez [5] as 0.25 (Afuze clay) and 1.33 (Maiduguri clay), also has a wide distinction with the value obtained by
Igbafo [9] as 0.67 (Abia clay). And the result obtained implies that the clay will exhibit good yield point and
plastic viscosity when use for the formulation of drilling mud.
Filtration analysis
The filtrate volume of the raw clay obtained is not in accordance with the API specification of 15 ml (maximum).
The result obtained was found to be of large distinction and below the value obtained by Azeez [5] as 80 ml (Afuze
clay) and 88 ml (Maiduguri clay), Igbafo [9] as 88 ml (Abia clay) and 80 ml (Nasarawa clay) but it is of low
distinction and above the value obtained by Aderinto [2] as 38.5 ml. The result obtained in Table 4 implies that the
raw clay has high water loss properties and shows no evidence of thixotropic properties.
Determination of Sand Content
The API specification states that the quantity of sand should not be greater than 1 % which this raw clay met the
requirement with 1 % and this result was close to what was obtained by Azeez [5] as trace quantity (for Afuze and
Maiduguri clay) and also Aderinto [2] as trace quantity (Nasarawa clay). The result (in Table 5) also proves that its
formulated drilling mud will be of low solid content since the raw clay is of a very low sand content.
Table 5. Result of Chemical and Physical Analysis of Raw Clay
Properties API Spec ARaw
Residue of diameter > 75µm (%) ≤ 4 3.00
Sand Content (%) ≤ 1 1
Ca2+
(mg/l) - 100l
pH 9-11 7
Toyese, O..... Int. J. Inno. Scientific & Eng. Tech. Res. 1 (1):25-36, 2013
30
Hydrogen ion Concentration
The raw clay pH was obtained to be 7.0 which in agreement with what Igbafo [9] obtained as 7.0 (Abia clay) and
7.5 (Nasarawa clay); Aderinto [2] obtained as 7.5 (Nasarawa clay), but 14 % different from what was obtained by
Azeez [5] as 8.0 (for Afuza and Maiduguri clay). Meanwhile, the obtained result in Table 4 was not in accordance
with the API specification requirement of 9 – 11 and also shows that the clay is neutral (that is, 50 % basic and 50
% acidic).
Particle Size Analysis
The amount of residue with size greater 75 µm obtained in the raw clay was in agreement with the API
specification of 4 % (maximum) for drilling mud formulation. The obtained result in Table 5 was found to be of
large variation and low value when compared with what was obtained by Azeez [5] as 6.9 % (Afuze clay) and 7.5
% (Maiduguri clay). This result shows that its formulated drilling mud will be of low solid content.
Moisture Content
The amount of the water present obtained in the raw clay agrees quite well with what Azeez [5] as 3.95 %
(Maiduguri clay) and slightly close to the other value he obtained as 3.23 % (Afuze clay). The obtained result in
Table 5 was found to be in agreement with the API specification requirement of 10 % (maximum).
Calcium ion Concentration
Table 5 shows that the calcium concentration of the clay is high. This confirms that the clay is a calcium bentonite
which normally exhibit poor filtration control and low viscosity.
Effect of Beneficiation on the Clay Properties
Rheological analysis
The effects of beneficiation on the rheological properties are as follows:
i. Viscometer dial reading: The result ( Table 6) of clay beneficiation shows that sample A1 to A4 all meet up with
the minimum requirement which was achieved with the addition of polypac and soda ash to a 1g/350 ml of pacR
concentrated water which builds the lower-end rheology (6 rpm and 3 rpm) as shown in Table 6 when related to the
result obtained for raw clay in Table 4.
The obtained results for sample A3 (48.50 cP) and A4 (47.25 cP) were in slight agreement with the value obtained
by Azeez [5] as 38 cP (Afuze clay) and 37 cP (Maiduguri clay); Igbafo [9] as 37 cP (Abia clay) and 38 cP
(Nasarawa clay) and Aderinto [2] as 23.4 cP (Nasarawa clay) while the other results obtained for A1 and A2 was of
a large distinction from Azeez [5], Igbafo [9] and Aderinto [2].
The obtained results in Table 8 also show that the raw clay sample calcium content reduces for all clay samples
during beneficiation process. It also confirms that the addition of additives (polypac, soda ash and pacR) resulted
to an increase in the viscometer dial reading which by implication increases the sodium ion (Na+) and thereby
increasing the viscosity [5], [6].
Table 6: Result of Rheological and Filtration Analysis of Beneficiated Clay Samples
Properties API Spec A1 A2 A3 A4
Viscometer dial reading at 600 rpm (cP) ≤ 30 58.5 58.5 48.5 47.25
Viscometer dial reading at 300 rpm (cP) - 40 39.75 32.5 31.25
Viscometer dial reading at 6 rpm (cP) - 4 3.75 3 2.75
Viscometer dial reading at 3 rpm (cP) - 2.75 2.5 2 2
Plastic Viscosity (cP) - 18.5 18.75 16 16
Yield Point (lbs/100ft2) - 21.5 21 16.5 15.25
Yield Point/Plastic Viscosity Ratio ≤ 3 1.16 1.12 1.03 0.95
Filtrate Volume or Fluid Loss (ml) ≤ 14 10.4 10.6 14.2 18.2
ii. Yield point/plastic viscosity ratio: The Yield Point/Plastic Ratio specification by API is 3 maximum. The
results of samples A1, A2, A3 and A4 in Table 6 during beneficiation were found to be in accordance with the API
standard. The obtained results was in quite agreement with what Aderinto [2] obtained as 1.13 but has a large
distinction with what Azeez [5] obtained as 2.22 (Afuze clay) and 2.10 (Maiduguri clay) and Igbafo [9] obtained as
1.7 (Abia clay) and 1.9 (Nasarawa clay). The YP/PV ratio was found to increase with increase in mass of additive
(polypac) been added.
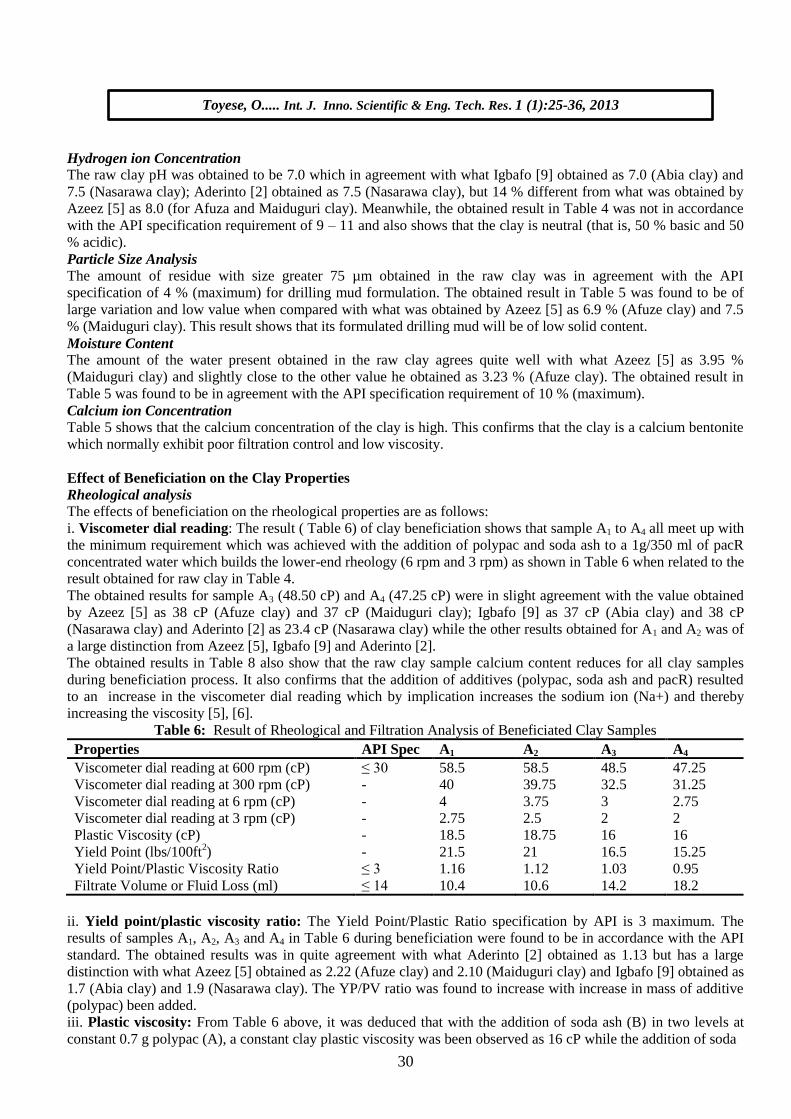
iii. Plastic viscosity: From Table 6 above, it was deduced that with the addition of soda ash (B) in two levels at
constant 0.7 g polypac (A), a constant clay plastic viscosity was been observed as 16 cP while the addition of soda
Toyese, O..... Int. J. Inno. Scientific & Eng. Tech. Res. 1 (1):25-36, 2013
31
ash (B) in two levels at constant 1.0 g polypac (A) shows 1 % decrease in plastic viscosity of the clay from 18.75
to 18.50 cP. Unlike the average 14 % increment which was observed in the plastic viscosity when there was 30 %
increment in polypac (A) from 0.7 g to 1.0 g at constant 1.0 g as illustrated in Figure 1. It can be concluded that
polypac (A) made a larger contributions for the increment of a clay plastic viscosity as proved in Table 2.
Figure 1. Effect of polypac (A) and soda ash (B) on plastic viscosity of local clay
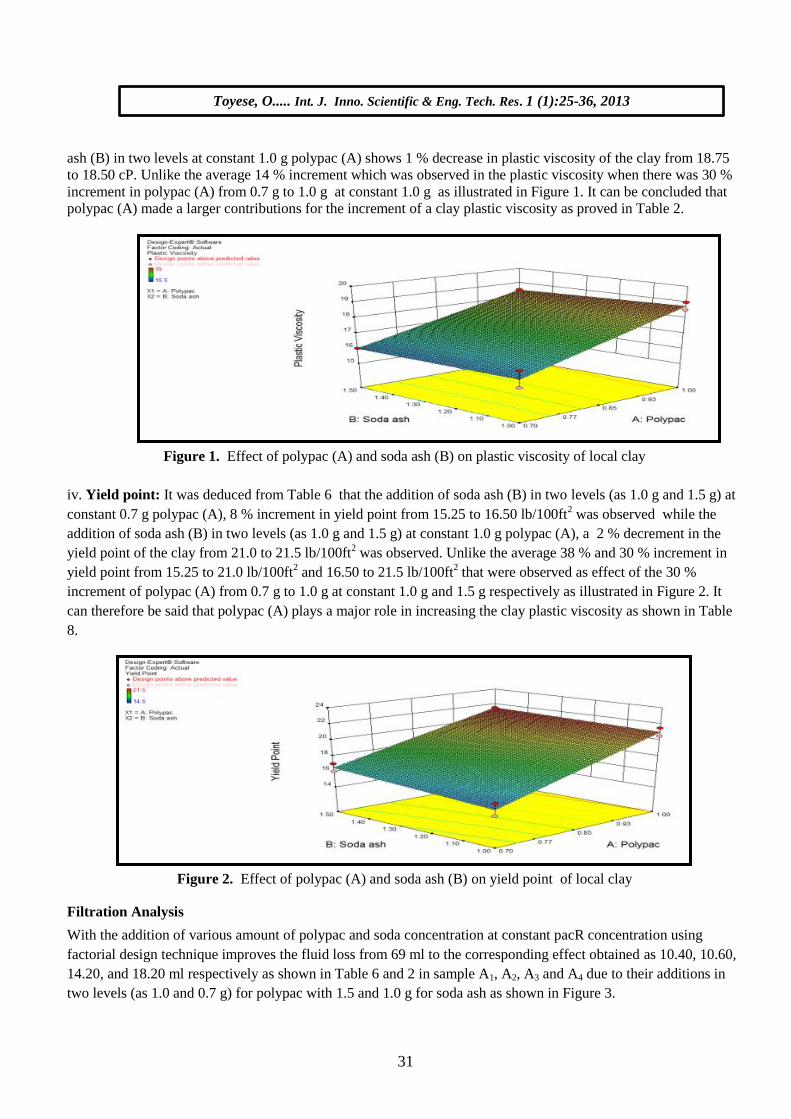
iv. Yield point: It was deduced from Table 6 that the addition of soda ash (B) in two levels (as 1.0 g and 1.5 g) at
constant 0.7 g polypac (A), 8 % increment in yield point from 15.25 to 16.50 lb/100ft2 was observed while the
addition of soda ash (B) in two levels (as 1.0 g and 1.5 g) at constant 1.0 g polypac (A), a 2 % decrement in the
yield point of the clay from 21.0 to 21.5 lb/100ft2 was observed. Unlike the average 38 % and 30 % increment in
yield point from 15.25 to 21.0 lb/100ft2 and 16.50 to 21.5 lb/100ft
2 that were observed as effect of the 30 %
increment of polypac (A) from 0.7 g to 1.0 g at constant 1.0 g and 1.5 g respectively as illustrated in Figure 2. It
can therefore be said that polypac (A) plays a major role in increasing the clay plastic viscosity as shown in Table
8.
Figure 2. Effect of polypac (A) and soda ash (B) on yield point of local clay
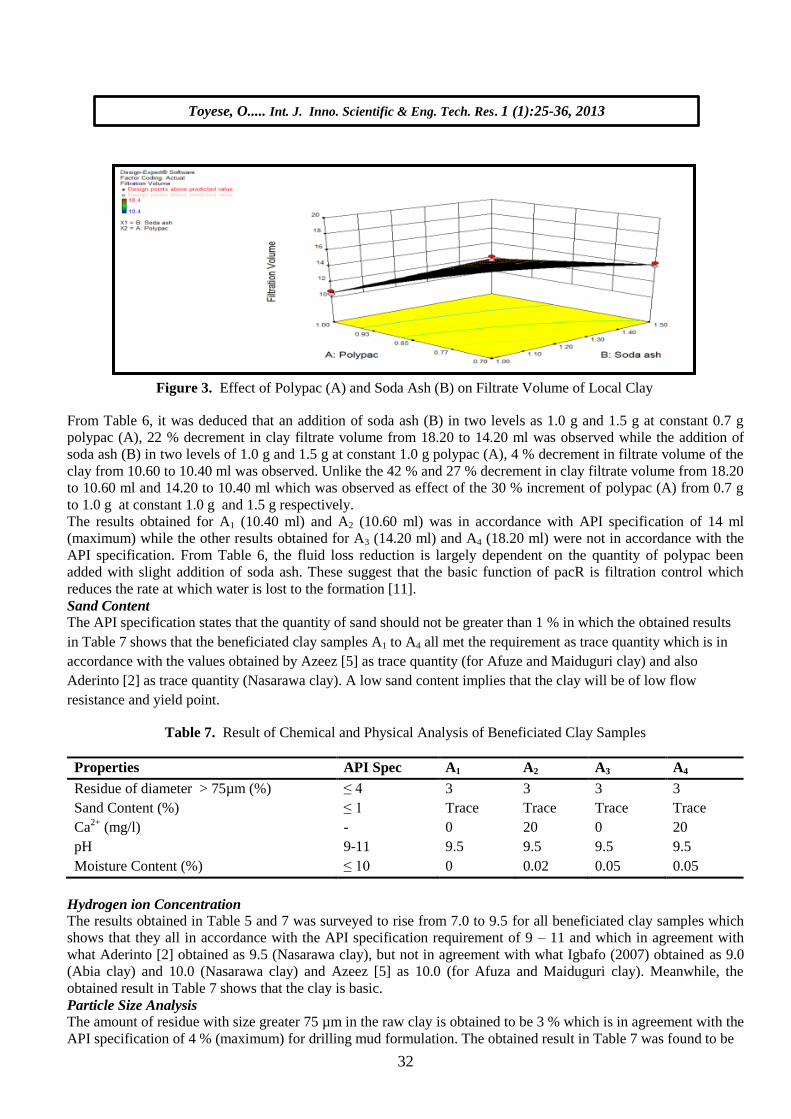
Filtration Analysis
With the addition of various amount of polypac and soda concentration at constant pacR concentration using
factorial design technique improves the fluid loss from 69 ml to the corresponding effect obtained as 10.40, 10.60,
14.20, and 18.20 ml respectively as shown in Table 6 and 2 in sample A1, A2, A3 and A4 due to their additions in
two levels (as 1.0 and 0.7 g) for polypac with 1.5 and 1.0 g for soda ash as shown in Figure 3.
Toyese, O..... Int. J. Inno. Scientific & Eng. Tech. Res. 1 (1):25-36, 2013
32
Figure 3. Effect of Polypac (A) and Soda Ash (B) on Filtrate Volume of Local Clay
From Table 6, it was deduced that an addition of soda ash (B) in two levels as 1.0 g and 1.5 g at constant 0.7 g
polypac (A), 22 % decrement in clay filtrate volume from 18.20 to 14.20 ml was observed while the addition of
soda ash (B) in two levels of 1.0 g and 1.5 g at constant 1.0 g polypac (A), 4 % decrement in filtrate volume of the
clay from 10.60 to 10.40 ml was observed. Unlike the 42 % and 27 % decrement in clay filtrate volume from 18.20
to 10.60 ml and 14.20 to 10.40 ml which was observed as effect of the 30 % increment of polypac (A) from 0.7 g
to 1.0 g at constant 1.0 g and 1.5 g respectively.
The results obtained for A1 (10.40 ml) and A2 (10.60 ml) was in accordance with API specification of 14 ml
(maximum) while the other results obtained for A3 (14.20 ml) and A4 (18.20 ml) were not in accordance with the
API specification. From Table 6, the fluid loss reduction is largely dependent on the quantity of polypac been
added with slight addition of soda ash. These suggest that the basic function of pacR is filtration control which
reduces the rate at which water is lost to the formation [11].
Sand Content
The API specification states that the quantity of sand should not be greater than 1 % in which the obtained results
in Table 7 shows that the beneficiated clay samples A1 to A4 all met the requirement as trace quantity which is in
accordance with the values obtained by Azeez [5] as trace quantity (for Afuze and Maiduguri clay) and also
Aderinto [2] as trace quantity (Nasarawa clay). A low sand content implies that the clay will be of low flow
resistance and yield point.
Table 7. Result of Chemical and Physical Analysis of Beneficiated Clay Samples
Properties API Spec A1 A2 A3 A4
Residue of diameter > 75µm (%) ≤ 4 3 3 3 3
Sand Content (%) ≤ 1 Trace Trace Trace Trace
Ca2+
(mg/l) - 0 20 0 20
pH 9-11 9.5 9.5 9.5 9.5
Moisture Content (%) ≤ 10 0 0.02 0.05 0.05
Hydrogen ion Concentration
The results obtained in Table 5 and 7 was surveyed to rise from 7.0 to 9.5 for all beneficiated clay samples which
shows that they all in accordance with the API specification requirement of 9 – 11 and which in agreement with
what Aderinto [2] obtained as 9.5 (Nasarawa clay), but not in agreement with what Igbafo (2007) obtained as 9.0
(Abia clay) and 10.0 (Nasarawa clay) and Azeez [5] as 10.0 (for Afuza and Maiduguri clay). Meanwhile, the
obtained result in Table 7 shows that the clay is basic.
Particle Size Analysis
The amount of residue with size greater 75 µm in the raw clay is obtained to be 3 % which is in agreement with the
API specification of 4 % (maximum) for drilling mud formulation. The obtained result in Table 7 was found to be
Toyese, O..... Int. J. Inno. Scientific & Eng. Tech. Res. 1 (1):25-36, 2013

33
of large variation and low value when compared with what was obtained by Azeez [5] as 6.9 % (Afuze clay) and
7.5 % (Maiduguri clay). This result shows that its formulated drilling mud will be of low solid content.
Moisture Content
The amount of the water present in the raw clay was obtained to be 3.90 % which agrees quite well with what
Azeez [5] as 3.95 % (Maiduguri clay) and slightly close to the other value he obtained as 3.23 % (Afuze clay). The
obtained result in Table 7 was found to be in agreement with the API specification requirement of 10 %
(maximum).
Calcium ion Concentration
Table 7 shows a low calcium concentration for different beneficiated clay samples. This confirms that the calcium
ion present in the raw clay samples have largely been exchanged for sodium ion which also account for
improvement in the filtration control and viscosity of the clay.
Statistical Analysis of the Designed Models
Shown in Table 9(a-c) are the summaries of values of the main and interaction effects between the factors of yield
point, plastic viscosity and filtrate volume during the clay beneficiation.
Table 8. Summary of Effect and Contributions of the Factors and Their Interactions
Factors
Plastic Viscosity Yield Point Filtrate Volume
Effect Contribution
(%) Effect Contribution (%) Effect Contribution (%)
A +2.62 95.25 +5.38 93.62 -5.70 79.97
B -0.13 0.22 +0.67 2.48 -2.10 10.85
AB -0.12 0.22 -0.37 0.46 1.90 8.89
a. Plastic viscosity: The mass of polypac (factor A) made a positive effects or contributions of (+2.62) 95.25 % to
the plastic viscosity of the clay unlike soda ash (factor B) and interaction (AB) that made a negative contributions
of (-0.13) 0.22 % and (-0.12) 0.22 % respectively as confirmed in the Table 8. With the level of significance
obtained for different factors, it can therefore be said that the plastic viscosity of the clay is basically dependent on
the amount of polypac (factor A) added which implies that for any significant change to take place in plastic
viscosity of the local clay, the amount of polypac (factor A) added has to be changed or considered.
Table 9. (a) Analysis of Variance for Plastic Viscosity Model for Local Clay Beneficiation
Source Sum of Square Df Mean Square F-calculated P-Value
Model 13.84 3 4.61 29.53 0.0034
A-Polypac 13.78 1 13.78 88.20 0.0007
B-Soda ash 0.031 1 0.031 0.20 0.6779
AB 0.031 1 0.031 0.20 0.6779
Error 0.63 4 0.16
Total 14.47 7 R2 Adj = 0.924
From the analysis of variance in Table 9(a), it was shown that the linear regression model of plastic viscosity with
p-value of 0.0034 is significant in view of the fact that its p-value was less than 0.0500 and that it has (0.9966)
99.66 % chances of the model having significant relationship between the response and predictor variance and
error of 0.34 %. The analysis of variance in Table 9(a) also show that model term A (Polypac) with p-value of
0.0007 is a significant model term in view of the fact that its p-value was less than 0.0500 while B (Soda ash) with
p-value of 0.6779 and AB (Interaction of Polypac and Soda ash) with p-value of 0.6779 model terms are not
significant which implies that no interaction took place. So, the developed linear regression model is therefore been
reduced from PV = 17.3125 + 1.3125A - 0.0625B - 0.0625AB to PV* = 17.3125 + 1.3125A which improves its
Toyese, O..... Int. J. Inno. Scientific & Eng. Tech. Res. 1 (1):25-36, 2013

34
significance by neglecting the insignificant model terms B (Soda ash) and AB (Interaction of Polypac and Soda
ash).
b. Yield point: Table 8 showed that the yield point of the clay is largely dependent on the amount of polypac
(factor A) and slight dependent on soda ash (factor B) which necessitate that for any significant change to take
place in yield of the local clay, the mass of polypac (factor A) has to be considered for either to be increased or
decreased since it build a large positive effects or contributions of (+5.38) 93.62 % on the yield point of the clay
contrasting soda ash (factor B) and interaction (AB) that build a low contributions of (+0.87) 2.48 % and (-0.37)
0.46 %.
Table 9. (b) Analysis of Variance for Yield Point Model for Local Clay Beneficiation
Source Sum of Square Df Mean Square F-calculated P-value
Model 59.59 3 19.86 37.39 0.0022
A-Polypac 57.78 1 57.78 108.76 0.0005
B-Soda ash 1.53 1 1.53 2.88 0.1648
AB 0.28 1 0.28 0.53 0.5072
Error 2.12 4 0.53
Total 61.72 7 R2 Adj = 0.94
The validity of the model from analysis of variance expressed in Table 9(b) confirms that the model with p-value
of 0.0022 is significant in view of the fact that its p-value is less than 0.0500 and (0.9978) 99.78 % chances of the
model having significant relationship between the response and predictor variance with error of 0.22 %. With the
view that for any linear regression model term to be significant its p-value has to be less than 0.0500, the factor A
(Polypac) with p-value of 0.0005 was confirmed to be significant while B (Soda ash) with p-value of 0.1648 and
AB (Interaction of polypac and soda ash) with p-value of 0.5072 was confirmed not to be significant and with due
consideration to their level of significance, the model is therefore been reduced from YP =18.5625 + 2.6875A +
0.4375B – 0.1875AB to YP* = 18.5625 + 2.6875A which improves its significance by neglecting the insignificant
model terms B (Soda ash) and AB (Interaction of polypac and soda ash).
c. Filtrate volume: It was shown in Table 8 that the filtrate volume of the clay is largely dependent on the amount
of polypac (factor A) with a large negative effects or contributions of (-5.70) 79.97 % and slight dependent on soda
ash (factor B) with a small negative effect or contribution of (-2.10) 10.85 % to the filtrate volume of the clay
which confirms that for any significant changes to be effected in filtrate volume of the local clay, the mass
concentration of polypac (factor A) and soda ash (factor B) has to be considered whether to be increased or
decreased because of the significance of their contributions. The analysis of variance also verifies that the
interaction of polypac and soda ash (AB) is significant with (+1.90) 8.89 % positive effect or contribution to the
filtrate volume of the local clay.
Table 9. (c) Analysis of Variance for Filtrate Volume Model for Local Clay Beneficiation
Source Sum of Square Df Mean Square F-calculated P-Value
Model 81.02 3 27.01 450.11 < 0.0001
A-Polypac 64.98 1 64.98 1083.00 < 0.0001
B-Soda ash 8.82 1 8.82 147.00 0.0003
AB 7.22 1 7.22 120.33 0.0004
Error 0.24 4 0.060
Total 81.26 7 R2 Adj = 0.995
The result of the analysis of variance in Table 9(c) confirms that FV linear regression model with p-value of
<0.0001 is highly significant in the view of the fact that the model p-value is less than 0.0500. The chances of the
model having significant relationship between the response and predictor variance was obtained to be (0.9999)
99.99 %. Considering the p-values for the model terms derived from analysis of variance, the linear regression
model term A (polypac) , B (soda ash) and AB (interaction of polypac and soda ash) with p-value of <0.0001,
0.0003 and 0.0004 respectively, were all confirmed to be significant with the view of the fact that they all have
Toyese, O..... Int. J. Inno. Scientific & Eng. Tech. Res. 1 (1):25-36, 2013

35
their p-values less than 0.0500. Hence, the developed model, FV* = 13.35 - 2.85A - 1.05B + 0.95AB will required
no removal of any model terms.
Hence, the clay properties improvement is highly dependent on the amount of polypac been added to it. The
adjusted R-squared values yield point, plastic viscosity and filtrate volume models are 0.94, 0.924 and 0.995
respectively which implies that the model accounts for 94 %, 92.4 % and 99.5 % of variation in the experimental
data respectively and have been explained by the factors in the model predictions which provided satisfactory
results. Therefore, the developed model provides a means of determining the rheological properties (Yield Point,
Plastic Viscosity and Filtrate Volume) with high degree of accuracy for the formulation of Water-Based Drilling
Mud from Sangare clay.
CONCLUSION
This research confirms the fact that the Yola clay is a low grade which contains high calcium ion with a high
filtrate volume and low viscosity which did not meet the API Standard Specifications. With the use of additives
and employment of factorial design techniques, the beneficiated clay was found to meet all the API Standard
Specifications with good filtrate volume and viscosity including a large drop in the calcium ion concentration at the
end of the beneficiation process which justifies that the polypac are highly effectiveness.
Moreover, the analysis of variance confirms the fact that the mass concentration of polypac plays the major or
largest role in the improvement of the fluid-loss control and viscosity including the yield point of the clay. It was
also deduced that the factorial design aids the development of linear regression models that can predict yield point
(YP), plastic viscosity (PV) and filtrate volume (FV) for the beneficiation of local clay from different mass
concentration of polypac(A), and soda ash(B).
Result of ANOVA confirms that the models developed are safe and suitable for evaluating the best required
treatment for a clay sample and optimizing the whole process of beneficiation. The developed model has proved to
be a means of saving time, cost and rigorous procedures in the laboratory in the process of obtaining best clay flow
properties.
ACKNOWLEDGMENT
The author wish to acknowledge Engr. M. Umar and Engr. A. Ibrahim for his guidance and supervision and wish
to express my gratitude to Mi-Swaco Nigeria Limited, Port-Harcourt for allowing me to use their Laboratory.
List of Nomenclatures
Ax = Clay Sample X
T = Intercept
A = Polypac (P)
B = Soda Ash (S)
P>75µm= Residue mass fraction (%) of diameter ≥75micron
MR = mass of residue, g
MS = mass of sample, g
M0 = Weight of dish
M1 = Weight of dish + sample before drying
M2 = Weight of dish + sample after drying
%M = Moisture Content
Ф600 = 600 rpm reading
Ф300 = 300 rpm reading
PV = Plastic viscosity in centipoises
YP = Yield Point in lb/100 ft2
AP = Apparent viscosity in centipoises
cP = Centipoises
lb = Pounds
ft = Feet
Toyese, O..... Int. J. Inno. Scientific & Eng. Tech. Res. 1 (1):25-36, 2013
36
REFERENCES
[1] Adam T. B., (1986). “Applied Drilling Engineering”, SPE Textbook series, Volume 2, pp. 61.
[2] Aderinto J., (2009). “Development and Characterization of Bentonite”, Unpublished B.Eng Thesis,
Department of Chemical Engineering, Federal University of Technology, Minna, Nigeria, pp. 43.
[3] Amoco, (1994). “Drilling Fluid Manual and Cross Reference Chat”, Amoco Company, Houston, Texas, USA
pp. 3(1-4), 6(1-3).
[4] Aribisala A.O., (1993) “Raw Material Revolution and Impacting Industrialization in Nigeria”, Modnet Ltd.,
Lagos, Nigeria, pp. 21-22.
[5] Azeez O.S., (2004) “Production of Drilling Mud from Afuze and Maduguri Clays”, 5th Annual Engineering
Conference Proceedings, Federal University of Technology, Minna, Nigeria, pp. 86-93.
[6] Darley H.C. H. and Gray G.G., (1988). “Composition and Properties of Drilling and Completion Fluids”.
Fifth Edition. Gulf Publishing Co., Houston, TX, pp. 643.
[7] Davies O.L. and Hay W.A., (1950) “The Construction and Uses of Fractional Factorial Designs in Industrial
Research Biometrics”, Vol. 6, No. 3, pp. 233-249.
[8] Doscher T.M., (2008). “Petroleum” - Microsoft Encarta Encyclopedia, Redmond, WA: Microsoft Corporation
2009, pp. 1-2.
[9] Igbaofo L. I. A., (2007). “Beneficiation of Bentonite”, Unpublished B.Eng Thesis. Department of Chemical
Engineering, Federal University of Technology, Minna, Nigeria, pp. 19, 27-29.
[10] Mi-Swaco, (1990). “API Recommended Practice Procedure”, Volume 1, Drilling Fluid Laboratory, SPEC
13A, 13th Edition, Mi-Swaco Company, Houston, Texas, USA, pp. 34-36, 1990.
[11] Mi-Swaco, (1998). “Drilling Fluid Manual and Cross Reference Chart”, Mi-Swaco Company, Houston,
Texas, USA.
[12] Neff J.M., (1987). “Biological Effects of Drilling Fluids, Drill Cuttings and Produced Waters - Long-term
Effects of Offshore Oil and Gas Development”. Elsevier Applied Science Publishers, London pp. 23 – 46.
[13] Neff J.M, Rabalais N.N., and Boesch D.F., (1987). “Offshore Oil and Gas Development Activities Potentially
causing Long-term Environmental Effects”. Long-term Effects of Offshore Oil and Gas Development.
Elsevier Applied Science Publishers, London, pp. 33 – 43.
[14] Owolabi O. O., Orji A. B. and Ajienka J. A., (1991). “Effect of Temperature and Salt on the Rheological
Properties of Locally Produced Drilling Muds,” Proceedings of the Nigerian SPE, pp. 11 – 23.
[15] Toyese O., (2011). “Optimization for the Production of Water-based Drilling Mud from Local Clay”,
Unpublished B.Eng Thesis, Department of Chemical Engineering, Federal University of Technology, Minna,
Nigeria, pp. 2, 9 – 11.
[16] Pankaj C., Astha K., Akshay A., and Pradeep K., (2011) “Application of Full Factorial Design for
Optimization of Feed Rate of Stationary Hook Hopper”, International Journal of Modeling and Optimization,
Vol. 1, No. 3, pp. 205 – 209.
[17] Raw Material Resources Development Council (RMRDC), (1990). “A synthesis of Repts. Techno-economic
Survey of Ten Industrial Sectors in Nigeria”, Macmillian Nigeria Publication Ltd, Lagos, Nigeria, pp. 59.
[18] Raw Material Resources Development Council (RMRDC), (1991). “Raw Material Sourcing for
Manufacturing Industry in Nigeria”, Macmillan Nigeria Publication Ltd, Abuja, Nigeria, 3rd
Edition, pp. 230.
[19] William G. C. and Gertrude M. C., (1992). “Experimental Designs”, 2nd
Edition, John Wiley & Sons Inc.,
New York, pp. 54 – 70.
Toyese, O..... Int. J. Inno. Scientific & Eng. Tech. Res. 1 (1):25-36, 2013