Embed Size (px)
Citation preview
SEA LEVEL RISE INUNDATION IMPACTS FOR COASTAL SOUTHERN ESSEX COUNTY, MA
Joanna Orfanos, Phillip Shafovaloff, Simon Tolstopyatenko,
ABSTRACT The New England Hurricane of 1938 was the first major hurricane to
strike New England since 1869. This hundred year storm killed 99 people in the state of Massachusetts alone isolating whole towns which had to rely on air dropped food and medicine. Due to the six to nine foot storm surges Massachusetts saw unprecedented destruction. As a coastal community, we must prepare for the worst case scenario, the perfect storm. Unfortunately, as global ice caps melt and the sea level rises, we must plan for the implications of a higher hurricane storm surge. This study focuses on the impacts of a storm of the same magnitude assuming that, according to the high-end global warming predictions, the sea level rises approximately one meter and that Essex County sustains a direct hit . We focus on Southern Essex County, specifically the Lynn, Nahant, Saugus, and Swampscott coastal communities. Our overall goal is to heighten Essex County residents and city planner awareness of inherent potential dangers living in a coastal community through GIS analysis so that we might better prepare for the worst case scenario. Town infrastructure including hazardous waste sites, schools, land use, and transportation potentially may be at risk for flooding. Hazardous Waste Sites: As flood waters recede, hazardous waste left behind can further disrupt recovery efforts. Knowing what hazardous material sites will be inundated and prone to leeching can be valuable information to response and recovery workers. Furthermore, city planners can use this information for future HAZ MAT site placement and possible relocation in response to sea level rise. Schools: As we saw during Hurricane Katrina, many of the school evacuation sites were not above storm surge levels thereby leaving evacuees vulnerable. We chose to evaluate what schools might be in danger with the new sea level rise predictions. Commercial and Residential Land: Knowing what commercial and residential areas are in danger could greatly assist city planners for evacuation, tax assessment, and zoning purposes. Transportation: During the 1938 Hurricane, many transportation routes were cut off by storm surges. Our community not only has a major railway running along the coast, but also has the peninsula community of Nahant.
METHODOLOGY
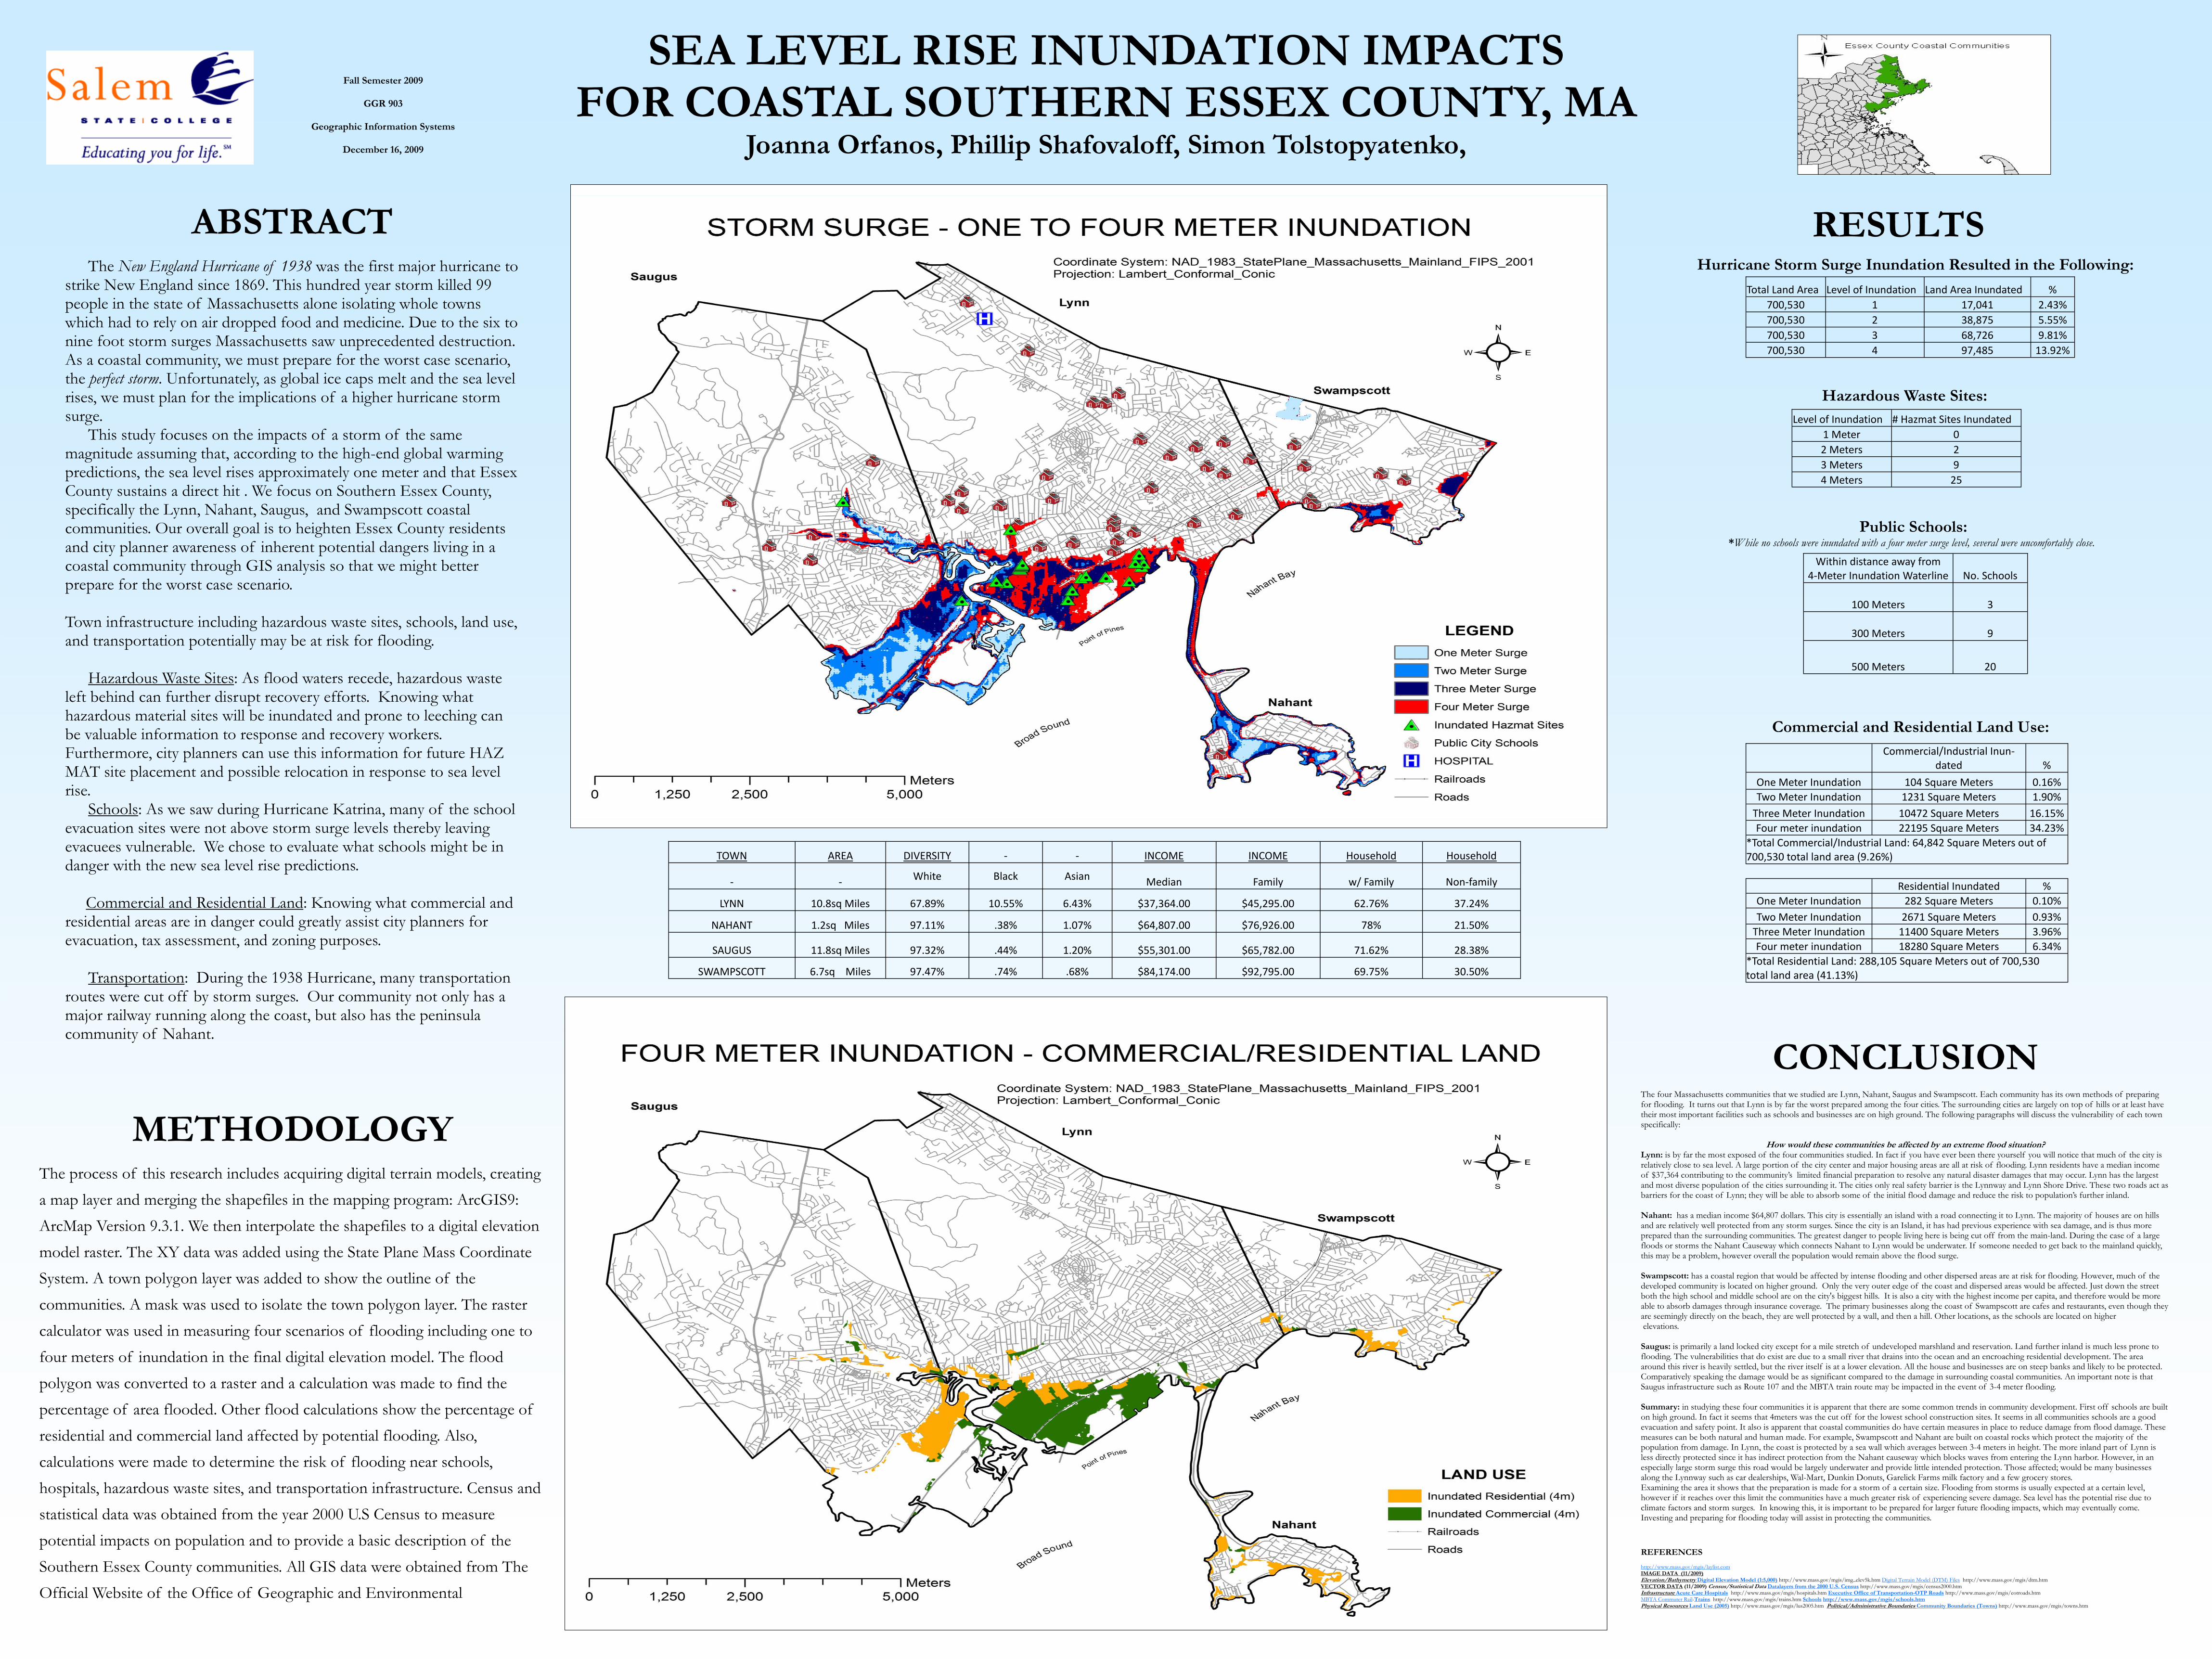
The process of this research includes acquiring digital terrain models, creating a map layer and merging the shapefiles in the mapping program: ArcGIS9: ArcMap Version 9.3.1. We then interpolate the shapefiles to a digital elevation model raster. The XY data was added using the State Plane Mass Coordinate System. A town polygon layer was added to show the outline of the communities. A mask was used to isolate the town polygon layer. The raster calculator was used in measuring four scenarios of flooding including one to four meters of inundation in the final digital elevation model. The flood polygon was converted to a raster and a calculation was made to find the percentage of area flooded. Other flood calculations show the percentage of residential and commercial land affected by potential flooding. Also, calculations were made to determine the risk of flooding near schools, hospitals, hazardous waste sites, and transportation infrastructure. Census and statistical data was obtained from the year 2000 U.S Census to measure potential impacts on population and to provide a basic description of the Southern Essex County communities. All GIS data were obtained from The Official Website of the Office of Geographic and Environmental
RESULTS
Hurricane Storm Surge Inundation Resulted in the Following: Hazardous Waste Sites: Public Schools: *While no schools were inundated with a four meter surge level, several were uncomfortably close. Commercial and Residential Land Use:
CONCLUSION
The four Massachusetts communities that we studied are Lynn, Nahant, Saugus and Swampscott. Each community has its own methods of preparing for flooding. It turns out that Lynn is by far the worst prepared among the four cities. The surrounding cities are largely on top of hills or at least have their most important facilities such as schools and businesses are on high ground. The following paragraphs will discuss the vulnerability of each town specifically:
How would these communities be affected by an extreme flood situation?
Lynn: is by far the most exposed of the four communities studied. In fact if you have ever been there yourself you will notice that much of the city is relatively close to sea level. A large portion of the city center and major housing areas are all at risk of flooding. Lynn residents have a median income of $37,364 contributing to the community’s limited financial preparation to resolve any natural disaster damages that may occur. Lynn has the largest and most diverse population of the cities surrounding it. The cities only real safety barrier is the Lynnway and Lynn Shore Drive. These two roads act as barriers for the coast of Lynn; they will be able to absorb some of the initial flood damage and reduce the risk to population’s further inland. Nahant: has a median income $64,807 dollars. This city is essentially an island with a road connecting it to Lynn. The majority of houses are on hills and are relatively well protected from any storm surges. Since the city is an Island, it has had previous experience with sea damage, and is thus more prepared than the surrounding communities. The greatest danger to people living here is being cut off from the main-land. During the case of a large floods or storms the Nahant Causeway which connects Nahant to Lynn would be underwater. If someone needed to get back to the mainland quickly, this may be a problem, however overall the population would remain above the flood surge. Swampscott: has a coastal region that would be affected by intense flooding and other dispersed areas are at risk for flooding. However, much of the developed community is located on higher ground. Only the very outer edge of the coast and dispersed areas would be affected. Just down the street both the high school and middle school are on the city's biggest hills. It is also a city with the highest income per capita, and therefore would be more able to absorb damages through insurance coverage. The primary businesses along the coast of Swampscott are cafes and restaurants, even though they are seemingly directly on the beach, they are well protected by a wall, and then a hill. Other locations, as the schools are located on higher elevations. Saugus: is primarily a land locked city except for a mile stretch of undeveloped marshland and reservation. Land further inland is much less prone to flooding. The vulnerabilities that do exist are due to a small river that drains into the ocean and an encroaching residential development. The area around this river is heavily settled, but the river itself is at a lower elevation. All the house and businesses are on steep banks and likely to be protected. Comparatively speaking the damage would be as significant compared to the damage in surrounding coastal communities. An important note is that Saugus infrastructure such as Route 107 and the MBTA train route may be impacted in the event of 3-4 meter flooding. Summary: in studying these four communities it is apparent that there are some common trends in community development. First off schools are built on high ground. In fact it seems that 4meters was the cut off for the lowest school construction sites. It seems in all communities schools are a good evacuation and safety point. It also is apparent that coastal communities do have certain measures in place to reduce damage from flood damage. These measures can be both natural and human made. For example, Swampscott and Nahant are built on coastal rocks which protect the majority of the population from damage. In Lynn, the coast is protected by a sea wall which averages between 3-4 meters in height. The more inland part of Lynn is less directly protected since it has indirect protection from the Nahant causeway which blocks waves from entering the Lynn harbor. However, in an especially large storm surge this road would be largely underwater and provide little intended protection. Those affected; would be many businesses along the Lynnway such as car dealerships, Wal-Mart, Dunkin Donuts, Garelick Farms milk factory and a few grocery stores. Examining the area it shows that the preparation is made for a storm of a certain size. Flooding from storms is usually expected at a certain level, however if it reaches over this limit the communities have a much greater risk of experiencing severe damage. Sea level has the potential rise due to climate factors and storm surges. In knowing this, it is important to be prepared for larger future flooding impacts, which may eventually come. Investing and preparing for flooding today will assist in protecting the communities.
REFERENCES http://www.mass.gov/mgis/laylist.com IMAGE DATA (11/2009) Elevation/Bathymetry Digital Elevation Model (1:5,000) http://www.mass.gov/mgis/img_elev5k.htm Digital Terrain Model (DTM) Files http://www.mass.gov/mgis/dtm.htm VECTOR DATA (11/2009) Census/Statistical Data Datalayers from the 2000 U.S. Census http://www.mass.gov/mgis/census2000.htm Infrastructure Acute Care Hospitals http://www.mass.gov/mgis/hospitals.htm Executive Office of Transportation-OTP Roads http://www.mass.gov/mgis/eotroads.htm MBTA Commuter Rail-Trains http://www.mass.gov/mgis/trains.htm Schools http://www.mass.gov/mgis/schools.htm Physical Resources Land Use (2005) http://www.mass.gov/mgis/lus2005.htm Political/Administrative Boundaries Community Boundaries (Towns) http://www.mass.gov/mgis/towns.htm
Fall Semester 2009
GGR 903
Geographic Information Systems
December 16, 2009
Total Land Area Level of Inundation Land Area Inundated % 700,530 1 17,041 2.43% 700,530 2 38,875 5.55% 700,530 3 68,726 9.81% 700,530 4 97,485 13.92%
Level of Inundation # Hazmat Sites Inundated 1 Meter 0 2 Meters 2 3 Meters 9 4 Meters 25
Within distance away from 4‐Meter Inundation Waterline No. Schools
100 Meters 3
300 Meters 9
500 Meters 20
TOWN AREA DIVERSITY ‐ ‐ INCOME INCOME Household Household
‐ ‐ White Black Asian Median Family w/ Family Non‐family
LYNN 10.8sq Miles 67.89% 10.55% 6.43% $37,364.00 $45,295.00 62.76% 37.24%
NAHANT 1.2sq Miles 97.11% .38% 1.07% $64,807.00 $76,926.00 78% 21.50%
SAUGUS 11.8sq Miles 97.32% .44% 1.20% $55,301.00 $65,782.00 71.62% 28.38%
SWAMPSCOTT 6.7sq Miles 97.47% .74% .68% $84,174.00 $92,795.00 69.75% 30.50%
Commercial/Industrial Inun‐
dated %
One Meter Inundation 104 Square Meters 0.16% Two Meter Inundation 1231 Square Meters 1.90% Three Meter Inundation 10472 Square Meters 16.15% Four meter inundation 22195 Square Meters 34.23%
*Total Commercial/Industrial Land: 64,842 Square Meters out of 700,530 total land area (9.26%)
Residential Inundated %
One Meter Inundation 282 Square Meters 0.10% Two Meter Inundation 2671 Square Meters 0.93% Three Meter Inundation 11400 Square Meters 3.96% Four meter inundation 18280 Square Meters 6.34%
*Total Residential Land: 288,105 Square Meters out of 700,530 total land area (41.13%)