Embed Size (px)
Citation preview

www.elsevier.com/locate/epsl
Earth and Planetary Science Letters 224 (2004) 563–575
Sea level in Roman time in the Central Mediterranean and
implications for recent change
Kurt Lambecka,*, Marco Anzideib, Fabrizio Antoniolic,Alessandra Beninid, Alessandra Espositob
aResearch School of Earth Sciences, The Australian National University, Canberra 0200, Australiab Istituto Nazionale di Geofisica e Vulcanologia, Via di Vigna Murata 605, 00143 Rome, Italy
cENEA, via Anguillarese 301, S. Maria di Galeria, 00060 Rome, ItalydDeparment of World’s Ancient Sciences, University of Tuscia, Viale Universita, 01100 Viterbo, Italy
Received 26 January 2004; received in revised form 24 May 2004; accepted 26 May 2004
Available online
Abstract
Instrumental records indicate that ocean volumes during the 20th century have increased so as to raise eustatic sea level by
f 1–2 mm/year and the few available records suggest that this is higher than for the previous century. Geological data indicate
that ocean volumes have increased since the main phase of deglaciation about 7000 years ago but whether this continued into
the recent past remains unclear. Yet, this is important for establishing whether the recent rise is associated with global warming
or is part of a longer duration non-anthropogenic signal. Here, we present results for sea-level change in the central
Mediterranean basin for the Roman Period using new archaeological evidence. These data provide a precise measure of local
sea level of � 1.35F 0.07 m at 2000 years ago. Part of this change is the result of ongoing glacio-hydro isostatic adjustment of
the crust subsequent to the last deglaciation. When corrected for this, using geologically constrained model predictions, the
change in eustatic sea level since the Roman Period is � 0.13F 0.09 m. A comparison with tide-gauge records from nearby
locations and with geologically constrained model predictions of the glacio-isostatic contributions establishes that the onset of
modern sea-level rise occurred in recent time at f 100F 53 years before present.
D 2004 Elsevier B.V. All rights reserved.
Keywords: sea-level change; Mediterranean; Roman Period; recent eustatic change
1. Introduction
Sea-level change is a measure of the relative
vertical movement between land and sea surfaces
0012-821X/$ - see front matter D 2004 Elsevier B.V. All rights reserved.
doi:10.1016/j.epsl.2004.05.031
* Corresponding author. Tel.: +61-2-6125-5161; fax: +61-2-
6249-5443.
E-mail address: [email protected] (K. Lambeck).
and any observed change reflects both land movement
and change in ocean volume. In the absence of
tectonic processes, the principal contribution is from
the growth and decay of ice sheets which introduces
changes in ocean volume, in the shape of the ocean
surface, and in the vertical position of the Earth’s
surface. Superimposed on this will be any vertical
land movements, driven by tectonic forces or by
sediment loading, and changes in volume caused,
Fig. 1. Location map of the Roman epoch piscinae and tide-gauge
sites along the central Tyrrhenian coast of Italy: (1) Santa Liberata,
(2) Punta della Vipera, (3a) Santa Marinella Odescalchi, (3b) Santa
Marinella Le Grottacce, (4a) La Banca, (4b) Torre Astura, (5a.b)
Ponza (outdoor and indoor fish tank), (6a,b) Ventotene harbour and
fish tanks, (7) Serapo and (8) Sarinola. The four tide gauge sites are
located at Genoa, Civitavecchia, Naples and Cagliari.
K. Lambeck et al. / Earth and Planetary Science Letters 224 (2004) 563–575564
for example, by changes in the thermal structure of the
oceans. Inferences of the changes in ocean volume
from sea-level data, therefore, require an independent
estimate of land movements that are the result of the
tectonic processes and of the earth’s isostatic response
to ice and water loads during glacial cycles [1,2].
Estimation of this change during the present intergla-
cial interval is important in the debate on the impact of
humans on climate; for establishing whether processes
such as thermal expansion of the oceans or the
exchange of mass between the oceans and ground
and surface water contribute to present or recent sea-
level rise [3].
For the past five or six millennia, following the
end of major deglaciation, changes in sea level have
generally been small [1] and often less than the local
tidal range. Thus, the preserved geological records of
change loose resolution, and it is usually only possi-
ble to place upper limits of f 0.5 m on the accuracy
of fluctuations in global ocean levels for this interval.
The much more precise instrumental records for the
past 100 or so years indicate that changes of the order
1–2 mm/year have occurred, but the duration of this
change or the time of its onset remains uncertain
[3,4].
Archaeological evidence from areas of small tidal
range can provide significant information for this
time interval using coastal structures whose success-
ful functioning requires a precisely defined relation-
ship to sea level at time of construction. Along
Mediterranean shores, in particular, the increasing
sophistication of human development has led to there
being a number of archaeological remains that can be
used to establish constraints on relative sea level
although they often provided limiting values only
[5–7]. We restrict ourselves here to one class of
construction that is particularly important for defining
precisely past sea levels, namely complexes of the
coastal fish tanks (piscinae), constructed during the
Roman Period from about 100 BC to 100 AD. These
possess constructional elements that relate precisely
to sea level [8,9].
In this paper, we examine the evidence from the
central Tyrrhenian coast of Italy (Fig. 1). This is the
region where the development of piscinae reached its
greatest concentration in Roman time and where many
well-preserved remains occur today. The best pre-
served of these sites have been re-examined providing
new information on constructional levels of the pisci-
nae that can be accurately related to mean sea level
2000 years ago. Isostatic and tectonic contributions to
this change are then estimated from observational and
model considerations to establish the eustatic change
over this period. Comparison with estimates of pres-
ent-day sea-level change recorded at nearby tide
gauges, similarly corrected for isostatic and tectonic
signatures, then permits the timing of the onset of the
recent rate of eustatic change to be inferred.
2. Roman piscinae as sea-level indicators
Roman piscinae have constructional elements that
bear directly on sea level at the time of construction
[8] and well-preserved remains of these features
provide a precise measure of sea-level change [5–

K. Lambeck et al. / Earth and Planetary Science Letters 224 (2004) 563–575 565
7,9]. According to Plinius [10] and Varro [11], the use
of piscinae as holding tanks and fish culture was
introduced between the end of the second century
and early first century BC. But because of high
construction and maintenance costs, they were used
for a relatively short period only and the building of
new tanks ceased during the second century AD
[8,11]. Most of the known fish tanks in Italy (f 54
Fig. 2. Remains of Roman Epoch fish tanks at (A) La Banca and (B) at Pun
were built to protect the tanks from wave action are clearly visible bu
construction. The inner walls of the tanks rising above present sea level rep
tanks (see Fig. 3 for details). At Punta della Vipera, these upper-level walks
examples, the lowest level of foot-walks are now covered by sand and m
sites) occur along the Tyrrhenian coastline [9,12] near
large Roman villas and only one is known along the
Adriatic coast [13]. Only for a small number of these
known sites have precise sea-level markers been
preserved or identified (Figs. 1 and 2). Remains of
piscinae are also found along the Mediterranean
coasts beyond the Italian borders [5,14] but these
are often lacking in the very features that give the
ta della Vipera. At La Banca, the foundations of the outer walls that
t they cannot be directly related to sea level at the time of their
resent the highest-level foot-walks that surround the now-submerged
are more clearly seen and occur just below modern sea level. In both
arine growth.

K. Lambeck et al. / Earth and Planetary Science Letters 224 (2004) 563–575566
high accuracy for the Tyrrhenian examples and most
of them have not yet been examined in detail.
The selected Roman fish tanks were, with one
exception, carved into rock to a depth of 2.7 m or less
. . .in pedes novem defondiatur piscina. . . dependingon fish species, the exception being Sarinola where the
tanks were built on limestone bedrock. Thus, local
basin subsidence is negligible. The basins themselves
were protected from wave and storm action by exterior
walls, ‘‘Mox praeiaciuntur in gyrum moles, ita ut
conplectantur sinu suo et tamen excedant stagni
modum’’ [8], whose foundations have mostly been

K. Lambeck et al. / Earth and Planetary Science Letters 224 (2004) 563–575 567
preserved but whose relation to sea level is not defined.
From Latin publications and new field surveys, the
significant sea-level markers that have been identified
including foot-walks (crepidines), channels, sluice
gates with posts, sliding grooves and, in some cases,
the actual sliding gates, and thresholds (Fig. 3) [9–12].
The foot-walks border the internal pools and occur at
two or three levels but in most piscinae examined the
lowest levels of crepidines are covered by sand and
were not recognized or interpreted in earlier investiga-
tions [5–7,9,15]. The lowest surface is cut by channels
that permit water exchange between the tanks and the
open sea, with the flow being controlled by sluice
gates. These gates consist of (i) a horizontal stone
surface that defines the threshold and is cut by a groove
to receive the gate; (ii) two vertical posts with grooves
to guide the vertical movement of the gate; (iii) an
upper stone slab with horizontal slot to extract the gate;
and (iv) the gate itself with small holes to permit water
exchange and prevent the escape of fish. The base of
the channels coincides with the position of the thresh-
old slab. The top of the sluice gate coincides with the
elevation of the lowest level foot-walk and, to keep a
safety margin, corresponds, as reported by Columella
[8], ‘‘Spissi deinde clatri marginibus infiguntur, qui
super aquam semper emineant, etiam cummaris aestus
intumuerit,’’ to a position above the highest tide level.
From sites with complete preservation of sluice gates,
channels and foot-walks, we estimate that the level of
the lowest crepidine occurred at f 20 cm above the
highest tide level. In the Tyrrhenian Sea the maximum
tidal excursion is V 40–45 cm [16], equal to the
observed depths of the channels, and this indicates that
the flow of water into the holding tanks was tidally
controlled.
Fig. 3. (A) Underwater photo of the in situ sluice gate at La Banca. The co
threshold with a groove to receive the gate; (ii) two vertical posts with groo
horizontal slot to extract the gate; (iv) the gate itself, f 65 cm high, with sm
covered by sand and the bright zone is that part of the gate that has been cle
lies f 10 cm below the measuring rod that is calibrated at 10-cm interval
and lowest level crepidinae as viewed from within the fish tank. The top of
walks and corresponds to a position above the highest tide. In this example,
of measurement and the threshold is 1.37 m below present sea level. (C)
structures that identify limiting values to sea level, including the lowest leve
is f 1.40 m below present mean sea level (m.s.l.), the now-submerged bol
quay-side foot-walks are estimated to have been f 0.30 m above m.s.l.
remained operational at all tidal levels. (D) Detail of the submerged sluice
with the holes to permit water exchange is clearly visible as is the lower-
3. Piscinae results
Table 1 summarizes the local relative sea-level
estimates for 15 sea-level indicators from 10 different
localities. Only well-preserved sites, constructed on or
in bedrock, have been used, particularly one where this
sediment cover provided protection of important fea-
tures of the basins. Upper-limit estimates are from the
lowest foot-walks that coincide with the top of the
sluice gate and lower-limit estimates are from the
channel thresholds. At some sites (Santa Liberata, La
Banca, Ponza, Ventotene), both levels have been inde-
pendently observed and the differences between the
two limits correspond to the tidal range of 40–45 cm.
At other sites, only one of the two limits has been
directly observed and, based on the evidence from the
sites with complete records, the missing limit has been
estimated at 40 cm lower or higher, depending on
whether the observation is an upper or lower limiting
value. The two pairs of closely spaced sites, La Banca
and Torre Astura and Santa Marinella Odescalchi and
Santa Marinella Le Grottacce, provide a means of
verifying the interpretations. At Ponza and Ventotene,
independent measurements have been obtained from
different foot-walks, channels and sluice gates, as well
as from channels and foot-walks within the nearby
harbour of Ventotene and their intercomparison pro-
vides further verification of the interpretation and the
estimation of the precision of the observations as well
as confirming that there has been no differential vertical
displacements within the construction. In compiling
Table 1, we have avoided using thresholds of channels
that control water exchange within the pool complex
itself because in some piscinae brackish-water environ-
ments were created for fish breeding by mixing fresh
mplete gate consist of: (i) a horizontal stone surface that defines the
ves to guide the movement of the gate; (iii) an upper stone slab with
all holes for water exchange. In this illustration, the gate is partially
aned of sand and biological growth. The threshold, covered by sand,
s. (B) Sketch of the channel sluice gate with sliding posts, threshold
the sluice gates coincides with the elevation of the lowest level foot-
the lowest foot-walk is now 0.72 m below the sea surface at the time
Plan and cross-section of the Ventotene Roman harbour indicating
l foot-walks and bollards carved into the rock. Roman time sea level
lard would have been at f 0.85 m above m.s.l. and the lowest level
The channel through the breakwater at B for flushing the harbour
gate within the interior of the pool complex at Ventotene. The gate
threshold stone at the base of the gate.

Table 1
Local relative sea level inferred from the Roman fish tanks
Point, type Age Significant Dh Below sea Previous measurements (m) MIS 5.5 (m), Isostatic change in the last
features level (m)
[UL, LL]A B C
Tectonic rate
(mm/year)
2 ka, and reduced observed
levels in brackets (m)
(a) (b) (c) (d) (e) (f) (g)
Santa Liberata
1 0–100 SP, TH 0.79 UL m � 0.61 � 0.45 � 0.30/ 6 � 1.16
PEL AD CH 1.29 LL m � 0.40 � 0.01F 0.05 (� 1.11)
1.04F 0.25
Punta della Vipera
2 0–100 TH, CH 1.08 UL m � 0.65 � 0.45 � 0.32/ 30 � 1.15
PES AD 1.48 LL e � 0.44 0.18F 0.05 (� 1.75)
1.28F 0.20
Santa Marinella Odescalchi
3a 50 BC/ TH, CH 1.29 UL e – – – 30 � 1.14
PES 50 AD 1.69 LL e 0.18F 0.05 (� 1.93)
1.49F 0.20
Santa Marinella Le Grottacce
3b 50 BC/ CR, SG 1.17 UL m � 0.60 � 0.40 � 0.65 30 � 1.14
PES 50 AD SP 1.57 LL e 0.18F 0.05 (� 1.81)
1.37F 0.20
La Banca
4a 50 BC/ CR, SG 0.92 UL m – – – 10 � 1.22
PET 50 AD SP 1.37 LL m 0.02F 0.05 (� 1.19)
1.145F 0.225
Torre Asture
4b 50 BC/ CR 0.82 UL m � 0.65 � 0.50 � 0.30/ 10 � 1.22
PET 50 AD 1.22 LL m � 0.50 0.02F 0.05 (� 1.06)
1.02F 0.20
Ponza
5a 20 BC/ CR, SP 0.92 UL m – – – n.d. (7.5) � 1.35
OPER 30 AD TH 1.32 LL m 0.0F 0.5 (� 1.00)
1.12F 0.20
0.73 UL e
OPER SP 1.88 LL m
TH 1.30F 0.57 (� 1.18)
5b 20 BC/ SP, TH 0.91 UL m � 1.05 – – n.d. (7.5) � 1.35
IPER 30 AD CR, SG 1.34 LL m 0.0F 0.5 (� 1.00)
1.13F 0.22
CR 0.86 UL e
IPER TH 1.66 LL m
1.26F 0.40 (� 1.14)
Ventotene
6a 20 BC/ CH, CR 1.30 UL m >� 0.48 – – 7.5 � 1.30
HET 30 AD BA (pier) 1.70 LL m 0.0F 0.05 (� 1.42)
1.50F 0.20
6b 20 BC/ CR (tunnel), 1.35 UL m � 0.80/ – – 7.5 � 1.30
PET 30 AD TH, SG, 1.70 LL m � 1.33 0F 0.05 (� 1.45)
K. Lambeck et al. / Earth and Planetary Science Letters 224 (2004) 563–575568

Table 1 (continued)
Point, type Age Significant Dh Below sea Previous measurements (m) MIS 5.5 (m), Isostatic change in the last
features level (m)
[UL, LL]A B C
Tectonic rate
(mm/year)
2 ka, and reduced observed
levels in brackets (m)
(a) (b) (c) (d) (e) (f) (g)
SP, CH 1.53F 0.18
1.30 UL e
1.70 LL m
1.50F 0.20 (� 1.42)
Serapo
7 0–100 CR 1.28 UL m – – – 4.0 � 1.32
PES AD 1.68 LL � 0.03F 0.05 (� 1.37)
1.48F 0.20
Sarinola
8 50 BC/ CR, TH 0.88 UL m � 0.55 � 0.40 � 0.32/ 6.0 � 1.32
PBL 100 AD SP, CH 1.28 LL m � 0.36 � 0.01F 0.05 (� 0.98)
(a) Site names and numbers as indicated in Fig. 1 and the type of archaeological remain: PEL= piscinae excavated in limestone; PES= piscinae
excavated in sandstone; PET= piscinae excavated in tuff; OPER= outdoor piscinae excavated in ryolithe; IPER= indoor piscinae excavated in
ryolithe; HET= harbour excavated in tuff (east side); PBL= piscinae built on limstone.
(b) Age estimates are based on historical documentation [9,12] or on the assumption that they were built in a 100-year interval from 50 BC to 50
AD. Due to high construction and maintenance costs the piscinae were used during a short period only and the building of new tanks ceased in
the second century AD [10,11].
(c) Architectural features used to define sea level: SP= sliding posts; TH= threshold; CH= channel; CR= crepidinae; SG= sluice gate;
BA= bollard. The lowest crepidinae are assumed to be at 20 cm above high tide [8].
(d) Survey data: UL= upper limit, LL= lower limit, m =measured position, e = estimated position. UL, LL, m and e as well as the final values
have been corrected for tides and atmospheric pressure. The maximum tidal range for the Tyrrhenian Sea is 0.40 m and tidal corrections are
based on data from the Instituto Geografico della Marina, Tidal Data Base 2002. The atmospheric pressure correction is for the difference in
pressure at the time of observation and the mean annual pressure for the site and is based on the inverted barometer assumption using nearby
station data from www.metoffice.com.
(e) Previous measurements (A= Schmiedt [9], B = Pirazzoli [7], C = Leoni and Dai Pra [15]).
(f) Height of the MIS 5.5 shoreline (m) and vertical tectonic rate (mm/year) based on assumption of uniform uplift rate, an elevation of
7.5F 2.5 m for this shoreline in the absence of tectonics, and a formation age of 124F 5 ka. n.d. = not determined and assumed to be
tectonically stable.
(g) Glacio-hydro-isostatic sea level change based on geologically calibrated models for Italy of the adjustment of the Earth to the redistribution
of ice and water loads during the last glacial cycle [28]. The numbers in parenthesis are the estimates of sea level reduced to the Torre Astura site
for the differential isostatic corrections, vertical tectonics and to the common epoch of 2000 years ago.
K. Lambeck et al. / Earth and Planetary Science Letters 224 (2004) 563–575 569
and marine waters and in these cases the internal
thresholds may not relate precisely to sea level.
All measurements of the depths of the archaeolog-
ical features were made at times of little wave action
and with respect to the instantaneous sea-level posi-
tion. Because the piscinae were used year round, the
defining levels are assumed to correspond to annual
mean conditions at the time of construction. The
measurements are therefore reduced to mean sea level
using tidal corrections from the Instituto Geografico
della Marina, Tidal Data Base 2002 [16]. The atmo-
spheric pressure effect on sea level is calculated to
allow for the difference in pressure between the time
of observation and the mean annual pressure for the
site. These corrections are based on the inverted
barometer assumption using nearby station meteoro-
logical data [17].
Differences between results for the coastal locali-
ties may occur if all observations do not correspond to
the same epoch. For some of the piscinae, the exact
period of construction can be established from the
historical documentation [9] and where they differ
from 2000 before present (BP) they have been re-
duced to this common epoch using the rates of sea-
level rise for this epoch that has been estimated from
the geologically constrained isostatic model (see dis-
cussion later). When direct age estimates are not
available, the adopted ages are based on the assump-
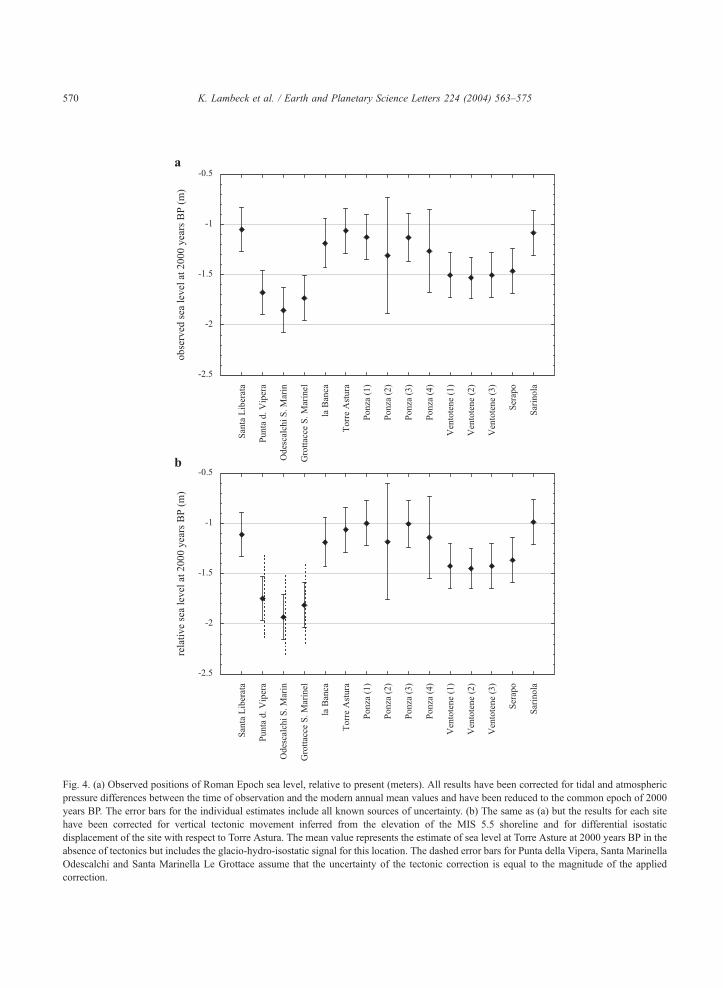
Fig. 4. (a) Observed positions of Roman Epoch sea level, relative to present (meters). All results have been corrected for tidal and atmospheric
pressure differences between the time of observation and the modern annual mean values and have been reduced to the common epoch of 2000
years BP. The error bars for the individual estimates include all known sources of uncertainty. (b) The same as (a) but the results for each site
have been corrected for vertical tectonic movement inferred from the elevation of the MIS 5.5 shoreline and for differential isostatic
displacement of the site with respect to Torre Astura. The mean value represents the estimate of sea level at Torre Asture at 2000 years BP in the
absence of tectonics but includes the glacio-hydro-isostatic signal for this location. The dashed error bars for Punta della Vipera, Santa Marinella
Odescalchi and Santa Marinella Le Grottace assume that the uncertainty of the tectonic correction is equal to the magnitude of the applied
correction.
K. Lambeck et al. / Earth and Planetary Science Letters 224 (2004) 563–575570
K. Lambeck et al. / Earth and Planetary Science Letters 224 (2004) 563–575 571
tion that the piscinae were built in a 100-year interval
from 50 BC to 50 AD. The uncertainty that this
introduces is not significant here with all differential
corrections less than a few centimeters. But because of
the short duration of the construction period, the
piscinae data do not span a sufficiently long time
interval to establish the rate of sea-level change in
Roman time. Also, an examination of harbour and
quarry remains from earlier Etruscan and Hellenic
[7,14] periods have not yet yielded sufficiently precise
sea-level markers to be useful for estimating the rate
of change.
Fig. 4a illustrates the tidally and atmospherically
reduced results and reduced to the common epoch of
2000 years BP. Independent estimates from within the
same pool complex (e.g., Ponza, Ventotene) are inter-
nally consistent, as are estimates from pool features
from nearby complexes (the two Santa Marinella fish
tanks and T. Astura and La Banca) and the pool and
harbour results from Ventotene. The results indicate
that at the time of construction, sea levels were
between 1.1 and 1.8 m lower than today and up to
0.6 m lower than previously determined [6,7,9,15].
This latter difference is primarily because the previ-
ously unrecognized lowest-level foot-walks, with their
close positional relationship to the sluice gates and
channel thresholds, have been used here rather than
the higher levels used in the earlier investigations.
Also, we have not used thresholds that control water
exchange inside the pool complex, nor have we used
elevations of the remains of the outer protective walls
because these do not bear a precise relationship to
mean sea level.
4. Tectonic and isostatic contributions to vertical
land movements
The central Tyrrehenian coast is a comparatively
stable tectonic province and has been devoid of major
seismic activity for the past 2000 years [18–20].
Stability is also indicated by the MIS 5.5 shoreline
(formed 129,000 to 119,000 years BP), which is well
defined along the Tyrrhenian coast by geomorpholog-
ical features and by the occurrence of the Senegalese
fauna that is characteristic of this interglacial interval
[21]. It occurs mostly at elevations of between 5 and
10 m, which is consistent with its position at tecton-
ically stable regions of Sardinia and elsewhere [22–
24]. But between Punta della Vipera and Anzio, this
shoreline occurs at higher elevations, reaching f 30
m at Punta Della Vipera [25,26] possibly as a result of
lithospheric flexure and/or thermal effects associated
with nearby Late Quaternary volcanic loading. In
calculating the rate of vertical tectonics and the
accuracy of this rate, we assume that the ‘expected
position’ of this shoreline in this region is, in the
absence of tectonics, at 7.5F 2.5 m above present sea
level. We also assume an age of 124F 5 ka for this
shoreline and assume that uplift has been uniform.
(However, the absence of historically recorded earth-
quakes from this region suggests that these average
rates may not be representative of the last few
thousand years.) Table 1 includes the estimated ele-
vation of the MIS 5.5 shoreline and the resulting
average rate of vertical movement.
Sea levels along the Tyrrhenian coast, like else-
where in the Mediterranean [27–29], are subject to
the isostatic response of the planet to glacial unload-
ing of high-latitude ice sheets during the last deglaci-
ation as well as to the loading of the ocean floor by the
melt water (glacio-dhydro-isostasy) at rates that are
functions of the glacial history of the ice and of the
rheology of the mantle. The glacio-isostatic response
is one of an ongoing collapse of a broad bulge that
formed around the ice sheet at the time of glacial
loading and which extends into the eastern Mediter-
ranean region [29–31]. The hydro-isostatic response
is one of the loading of the sea floor by the glacial
melt water and superimposes a shorter wavelength
spatial variability on the more regional glacio-isostatic
response. Both include the effect of the change in
gravity field due to the redistribution of surface mass
and the deformation of the solid planet [1,2]. The
predominant consequence of the isostatic rebound is
that sea levels have continued to rise up until recent
time along the entire length of the Italian coast at a
rate that is a function of distance from the centres of
former glaciation but which is also a function of the
coastal geometry. Because of the high precision of the
observational data the solution of the isostatic sea-
level equation [32] has been carried out to the ninth
iteration to ensure convergence at the millimetre level.
Abundant geological evidence exists for the sea-
level change for the past f 14 ka and, together with
evidence for the elevation of the Last Interglacial
K. Lambeck et al. / Earth and Planetary Science Letters 224 (2004) 563–575572
shoreline, this provides the means of estimating the
rebound-model parameters and of separating this
rebound from other tectonic influences [28]. Analysis
of data from Italy for the past 14 ka yields response
parameters that are consistent with analyses from
other regions of the world [1,28] and Table 2 summa-
rises the range of earth-model parameters that yield
solutions that are consistent with the geological data.
The glacio-hydro-isostatic rebound model is based on
an ice history that extends back through two full
glacial cycles with the assumption that, while most
melting has ceased by 7000 years BP, a small increase
in ocean volume continued until about 3000 years
before present, consistent with sea-level evidence
from localities inside and outside the Mediterranean
[2,27,33,34] as well as with observations of decreas-
ing Late Holocene ice volumes in Antarctica [35].
The adopted error model for the isostatic calcula-
tions is based on the predicted values for a range of
earth- and ice-model parameters that are consistent
with the geological evidence along the Tyrrhenian
coast. This range is specified by the parameters in
Table 2 for the earth models while for the ice-sheet
contribution different models for Scandinavia and
North America have been used [28], that are consis-
tent with rebound analyses for these two regions. The
resulting uncertainty estimates of the isostatic correc-
tions are less than 10% of the corrections themselves.
Some spatial variability in the isostatic response
occurs, with some sites (e.g., Santa Liberata) closer
to the former ice sheets than others (e.g., Sarinola) and
two sites located offshore (Ponza and Ventotene). But
for this section of the Tyrrhenian coast, the spatial
variability of the isostatic response is small, f 20 cm
at 2000 years BP, and to facilitate intercomparison,
sea-level observations from the piscinae sites have
been reduced to a common location by applying
differential isostatic corrections. The Torre Astura site
Table 2
Earth-model parameter range for the three-layer mantle model
Lithospheric thickness: H1 = (50–100) km
Upper mantle viscosity: lum = (2–5)� 1020 Pa s
Lower mantle viscosity: llm = (5–20)� 1021 Pa s
The upper– lower mantle boundary occurs at 670 km depth. Elastic
moduli and density profiles follow standard seismic models for
mantle structure.
has been adopted here as the reference point although
any other site could have been equally adopted.
Fig. 4b illustrates the tectonically corrected esti-
mates of relative sea-level change at 2000 years BP
that have also been reduced for the differential iso-
static corrections. These corrections are earth-model
dependent, but their magnitudes are small and we
adopt the centroid value for the range defined in Table
2. The precision of this estimate has been evaluated by
subdividing the parameter space defined in Table 2
uniformly in log-space for viscosity and at 10-km
intervals for lithospheric thickness and the isostatic
values have been predicted for each combination of
parameters within this space. These individual esti-
mates are then weighted according to the ‘distance’ of
the individual parameters from the mean values and
the results in Fig. 4b are for weights of 1 for models
near the centroid value (corresponding to f 15% of
the total model space defined by Table 2), 0.25 for the
outermost zone (corresponding to f 50% of the total
model space) and 0.5 for the intermediate region.
However, different weights, including equal weights,
result in insignificant differences for the precision
estimates and the final choice is unimportant.
The consistency between the individual site esti-
mates is high and mostly within the estimated obser-
vational uncertainties for the individual results. The
possible exceptions are for Punta Della Vipera, Santa
Marinella Odescalchi and Santa Marinella Le Grot-
tacce which yield lower estimates than the other sites.
This suggests that the assumed uplift, based on the
elevation of the nearby MIS 5.5 shoreline, may not be
appropriate for the shorter time interval and that these
sites may actually have been subject to some subsi-
dence over the past 2000 years. But without further
information on the tectonic history of the region, we
use the tectonically corrected values for these sites
and we conclude that the Roman piscinae evidence
provides a precise and reliable estimate of sea level.
Furthermore, we adopt the weighted mean of the
individual site estimates as a measure of sea level
for a tectonically stable site at Torre Astura, where the
weights are defined as the inverse of the sum of the
observational and tectonic-correction variances, and
conclude that sea level at 2000 years ago was
1.35F 0.07 m (standard deviation of the mean) lower
than today. (This uncertainty estimate is based on the
range of individual estimates in the earth-model and

K. Lambeck et al. / Earth and Planetary Science Letters 224 (2004) 563–575 573
site-location space and is consistent with the value
obtained from analysis of the individual error contri-
butions.) This estimate of sea level at 2000 years BP
is also in agreement with estimates of sea level based
on less precise sedimentological evidence from the
central Tyrrhenian coast [28] and, in the absence of
further information on the uniformity or otherwise of
the tectonic component, we adopt the latter value. (If
the tectonic uncertainties of the Punta Della Vipera,
Santa Marinella Odescalchi and Santa Marinella Le
Grottacce sites are increased to the amplitude of the
tectonic correction itself, then the estimated sea level
at 2000 years BP is � 1.26F 0.06 m.)
The total isostatic contribution to the change in sea
level over the past 2000 years at Torre Astura is
estimated at � 1.22F 0.06 m at 2000 years BP for
the weighted mean earth model. When compared with
the observed value, this indicates that eustatic sea
level in Roman time was at � 0.13F 0.09 m.
5. Tide gauge results
Modern tide-gauge results are available for the
Tyrrhenian coast from Naples, Civitavecchia, Genoa
Fig. 5. The individual sea-level records from the annual means at four moder
and the composite record. Tectonic corrections have been applied where a
reduce the results to a fictitious site at Torre Astura. The secular trend for the
rate of change that would be observed at a tectonically stable site at Torre
and Cagliari (see Fig. 1 for locations). The records
extend back into the late nineteenth century, but no
single record is continuous. The longest record is
from Genoa, but it suffers from a major gap in the
data. However, the other records, while of shorter
duration, bridge this interval. Also, because they
exhibit considerable coherence (Fig. 5) and there is
some overlap, a pseudo-observational record can be
established. This has been achieved here using the
annual mean ‘RLR’ data set from the Permanent
Service for Mean Sea Level [36] and a least squares
parameter estimation for relative datum shifts and
regional secular sea-level trend, after corrections for
differential isostatic rebound, have been applied.
(The RLR files contain some annual means that
are marked as being less reliable than the others
and in all parameter estimations these points have
been given a weight of 0.5 compared with 1 for the
others. Solutions in which this difference is in-
creased do not lead to significantly different results.)
Two separate records from Naples give overlapping
and internally consistent results, and these have been
combined into a single record by calculating the
offset between the two records from the common
time data points. Of the four sites, only Civitavec-
n tide gauge records for the Tyrrhenian coast and Cagliari (see Fig. 1)
ppropriate and differential isostatic corrections have been applied to
composite record is shown by the black line. This is the present-day
Astura and includes the isostatic signal for this site.
K. Lambeck et al. / Earth and Planetary Science Letters 224 (2004) 563–575574
chia, near Punta della Vipera, is from a region that
may have been subjected to tectonic vertical move-
ment if the elevation of the MIS 5.5 shoreline is used
as a tectonic indicator. Thus, the above-discussed
long-term geological estimate has been applied to
the record although, because this record is relatively
short, analyses for the regional secular change with or
without this correction are not significantly different.
The differential isostatic corrections reduce the tide-
gauge records to the ‘observed’ value at a fictitious site
at Torre Astura, using the previously discussed iso-
static model and parameter range. The dependence of
the secular rate on the choice of earth model is small
with values ranging from � 1.51 to � 1.60 mm/year
across the earth-model space. Calculations with differ-
ent weighting schemes discussed above for calculating
the mean earth-model result give essentially the same
result and we adopt � 1.56F 0.20 mm/year for the
‘observed’ present-day relative sea-level rise reduced
to Torre Astura. (If the above tectonic uplift rate of
0.18F 0.02 mm/year for nearby Punta della Vipera is
applied to the Civitavecchia record with an increased
uncertainy equal to the rate of uplift itself, then the
composite estimate for the eustatic sea-level rise is
1.53F 0.21 mm/year.) The standard deviation is based
on the covariance matrix of the least squares solution
for the trend and datum shifts and has been scaled by
the variance of unit weight estimated from the differ-
ences between observed and predicted sea levels. The
isostatic sea-level correction for Torre Astura, based on
the weighted mean earth model, is � 0.54F 0.03 mm/
year resulting in a eustatic sea-level estimate of
� 1.02F 0.21 mm/year. This estimate for the regional
sea-level rise along the central Tyrrhenian coast com-
pares with global analyses of sea level that indicate an
averaged rise, corrected for the isostatic signal, of
1.8F 0.2 mm/year [37] but with significant regional
departures from the mean value, with some regional
trends as low as 1.0 mm/year [3,37]. In particular, it
has been previously noted [38,39] that not only has
sea-level rise in the Mediterranean been less than
global estimates but that the rate of rise decreased
significantly, or even changed sign, in the 1960–1990
interval.
Despite the isostatic corrections being relatively
large and uncertain, the comparison of the isostatically
reduced observation of the integrated eustatic change
over 2000 years with the present rate of change is valid
because consistent isostatic model corrections are
applied to both data sets and the difference in isostatic
rates for the two epochs is less dependent on the choice
of model parameters then on the magnitude estimates.
Then, if the present-day eustatic rate is extrapolated
linearly back in time, the time at which the Roman
Epoch value of the total eustatic change is reached can
be estimated and this defines the time of onset of the
modern sea-level rise. To allow for the correlation
between the integrated and present-day rate of the
eustatic change introduced by the isostatic corrections
to the two components, this interval has been calcu-
lated for the range of earth models in the defined
parameter space of Table 2 from which the weighted
mean and variance is calculated as before. This yields
100F 53 years ago as the best estimate for the onset of
the present-day sea-level rise. This result remains
unchanged (96 years) if the tectonic uncertainties of
the three sites are increased as discussed above for
both data types. Solutions with different weighting
schemes for averaging across the earth-model space
give the same results within the above error bars.
The comparison of the Roman piscinae and tide-
gauge results for eustatic sea level indicate that the
present-day rate of change can only be representative
of a short interval of time unless sea levels in the
intervening period were actually lower than the Ro-
man values. In the absence of evidence for this, the
comparison indicates that this duration was of the
order 100F 50 years and, while the uncertainties in
this estimate remain large, the results are consistent
with an onset of the present sea-level rise in the late
nineteenth century or early twentieth century.
Acknowledgements
The research was partially funded by CNR-Agenzia
2000, ENEA and the Australian National University.
We thank Prof. M. Caputo, who first recognized the
importance of the Tyrrhenian fish tanks as sea level
recorders, for helpful comments. [VC]
References
[1] K. Lambeck, J. Chappell, Sea level change through the last
glacial cycle, Science 292 (2001) 679–686.

K. Lambeck et al. / Earth and Planetary Science Letters 224 (2004) 563–575 575
[2] G.A.Milne, J. Mitrovica, J.L. Davis, Near-field hydro-isostasy:
the implementation of a revised sea level equation, Geophys. J.
Int. 139 (1999) 464–482.
[3] J.A. Church, J.M. Gregor, P. Huybrechts, M. Kuhn, K.
Lambeck, M.T. Nhuan, D. Qin, P.L. Woodworth, in: J.T.
Houghton, et al. (Ed.), Intergovernmental Panel on Climate
Change, Third Assessment Report, Chapter 11, Cambridge
University Press, Cambridge, 2001, pp. 641–693.
[4] P.L. Woodworth, High waters at Liverpool since 1768: the
UK’s longest sea level record, Geophys. Res. Lett. 26 (1999)
1589–1592.
[5] N.C. Flemming, Archaeological evidence for eustatic changes
of sea level and earth movements in the Western Mediterra-
nean in the last 2000 years, Spec. Pap.-Geol. Soc. Am. 109
(1969) 1–125.
[6] M. Caputo, L. Pieri, Eustatic variation in the last 2000 years in
the Mediterranean, J. Geophys. Res. 81 (1976) 5787–5790.
[7] P.A. Pirazzoli, Sea level variations in the northwest Mediter-
ranean during Roman times, Science 194 (1976) 519–521.
[8] Columella, De Re Rustica, XVII.
[9] G. Schmiedt, Il livello antico del mar Tirreno, Testimonianze
da resti archeologici, E. Olschki, Firenze, 323 pp.
[10] Plinius, Naturalis Historia, IX.
[11] Varro, De Re Rustica III.
[12] L. Giacobini, B. Marchesini, L. Rustico, L’itticoltura nell’an-
tichita, ENEL eds. Roma, 1997, 275 pp.
[13] E. Fouache, S. Faivre, J.J. Dufaure, V. Kovacic, F. Tassaux,
New observations on the evolution of the Croatian shoreline
between Porea and Zadar over the past 2000 years, Z. Geo-
morphol. N.F., Suppl.bd 122 (2000) 33–46.
[14] N.C. Flemming, C.O. Webb, Tectonic and eustatic coastal
changes during the last 10,000 years derived from archaeo-
logical data, Tectonic and eustatic coastal changes during the
last 10,000 years derived from archaeological data, Z. Geo-
morphol. N.F. 62 (1986) 1–29.
[15] G. Leonim, G. Dai Pra, Variazioni di livello del mare nel tardo
Olocene lungo la costa del Lazio in base ad indicatori geo-
archeologici. (ENEATech. Rep. RT/AMB/97/8) Rome, 1997,
127 pp.
[16] Istituto Idrografico della Marina, Tidal Data Base (2002).
[17] www.metoffice.com.
[18] E. Guidoboni, I terremoti prima del Mille in Italia e nell’area
Mediterranea. Storia, Archeologia, Sismologia, Ed. Istituto
Nazionale di Geofisica, SGA, Bologna, 1989, 65 pp.
[19] E. Boschi, E. et al., Catalogo dei Forti Terremoti in Italia dal
461 a.C. al 1997 d.C., Eds. Istituto Nazionale di Geofisica,
1995, 644 pp.
[20] E. Guidoboni, Catalogue of Ancient Earthquakes in the Medi-
terranean Area Up to the 10th Century, Istituto Nazionale di
Geofisica, Rome, 1994, 504 pp.
[21] M. Gignoux, Les formation marines pliocenes et Quateraires
de l’Italie du Sud et de la Sicilie, Ann. Univ. Lyon 36 (1913).
[22] P.J. Hearty, G. Dai Pra, Aminostratigraphy of quaternary ma-
rine deposits in the Lazio Region of central Italy, Z. Geomor-
phol. 62 (1986) 131–140.
[23] F. Antonioli, S. Silenzi, E. Vittori, C. Villani, C., Sea level
changes and tectonic stability: precise measurements in 3
coastlines of Italy considered stable during last 125 ky, Phys.
Chem. Earth 24 (1999) 337–342.
[24] M.F. Nisi, F. Antonioli, G. Dai Pra, G. Leoni, S. Silenzi,
Coastal deformation between the Versilia and the Garigliano
plains (Italy) derived from the elevations of the Last Intergla-
cial Highstand data, J. Quat. Sci. 18 (2003) 13–27.
[25] G. Giordano, et al., The sedimentation along the Roman coast
between middle and upper Pleistocene: the interplay of eusta-
tism, tectonics and volcanism. New data and review, Il Quat.
16 (2003) 115–121.
[26] C. Carrara, M. Cremaschi, G. Dai Pra, Oscillazioni del live-
llo marino, depositi e morfogenesi continentali nelle isole
pontine (Italia Centrale), Geogr. Fis. Din. Quat. 17 (1994)
139–153.
[27] K. Lambeck, E. Bard, Sea-level change along the French
Mediterranean coast for the past 30000 years, Earth Planet.
Sci. Lett. 175 (2000) 203–222.
[28] K. Lambeck, F. Antonioli, A. Purcell, S. Silenzi. Sea level
change along the Italian coast for the past 10,000 years, Quat.
Sci. Rev. 23 (2004) 1567–1598.
[29] K. Lambeck, Sea-level change and shore-line evolution in
Aegean Greece since Upper Palaeolithic time, Antiquity 70
(1996) 588–611.
[30] D. Sivan, K. Lambeck, E. Galili, A. Raban, Holocene sea-
level changes along the Mediterranean coast of Israel, based
on archaeological observations and numerical model, Palae-
ogeogr. Palaeoclimatol. Palaeoecol. 167 (2001) 101–117.
[31] J.X. Mitrovica, J.L. Davis, Present-day post-glacial sea level
change far from the Late Pleistocene ice sheets: implications
for recent analysis of tide gauge records, Geophys. Res. Lett.
22 (1995) 2529–2532.
[32] K. Lambeck, A. Purcell, P. Johnston,M. Nakada, Y. Yokoyama,
Water-load definition in the glacio-hydro-isostatic sea-level
equation, Quat. Sci. Rev. 22 (2003) 309–318.
[33] M. Nakada, K. Lambeck, The melting history of the late
Pleistocene Antarctic ice sheet, Nature 333 (1998) 36–40.
[34] K. Lambeck, Sea level change from mid-Holocene to recent
time: an Australian example with global implications, Amer-
ican Geophysical Union Geodynamics Series 29 (2001)
33–50.
[35] J.O. Stone, et al., Holocene deglaciation of Marie Byrd Land,
West Antarctica, Science 299 (2003) 99–102.
[36] www.pol.ac.uk/psmsl.
[37] J.A. Church, N.J. White, R. Coleman, K. Lambeck, J.X.
Mitrovica, Estimates of the regional distribution of sea-level
rise over the 1950 to 2000 period, J. Climate 17 (2004)
2609–2625.
[38] M. Tsimplis, S.A. Josey, Forcing of the Mediterranean Sea by
atmospheric oscillations over the North Atlantic, Geophys.
Res. Lett. 28 (2001) 803–806.
[39] M.N. Tsimplis, M. Rixen, Sea level in the Mediterranean Sea:
the contribution of temperature and salinity changes, Geophys.
Res. Lett. 29 (2002) 51.1–51.4.