Embed Size (px)
Citation preview
-iAie awbJaLe under lASA spnorshrp intO nt rst of e3y and wVamp8 dishy u Eflarh Ptzources ampavy r3r~m icmv~rn thout lability-nd
Glaciological and Iarine Biological Studies at
Perimeter of Dronning laud Land Antarctica
Investigation No 28550
rr
( Final Report
dchltD from
Olav Orheim -Z6 Norsk Polarinstitutt
m Postboks 158
1330 Oslo ILuthavn -C NORWAY
Z mp Ho P40 June 1977
O 0 4 Sponsoring organization The Royal NorwegianCouncil 4 Pd H H 04 for Scientific and Industrial Research (NTNF)
QH4 0 o HO
0- F4 0
- 44
0 El 4J
0H 4 1 I4 HE P977 12
4OC -H 409
SE1 1977
TABLE OF CONTENTS
Irage
INTRODUCTION 1
TECHNIQUES 2
Assessing rate of iceberg calving to evaluate
Distribution and frecuency of large sheets
Distribution of sea ice and ic6bergs lO-
RESULTS 2
mass balances 2
Drift of icebergs and ice floes 7
of plankton 9
Other results 12
SIGNIFICANT RESULTS 14
CONCLUSIONS 16
ACKNOWLEDGMENTS 16-
RE ERETTCES 17
7
4 001QUQU
LIST OF FIGURES
Figure Page
1 Dronning Naud Land coast from 20W - 29DE 3
2 Dronning Maud Land coast from 6 - 10Ow 4
3 Successive Landsat imagery used for ice drift determinations
4 Landsat imagery showing ice rises 13
5 Landsat imageries of melt phenomena 15
LIST OF TIBLES
Table Page
1 Frequency distribution of floe sizes 11
2 Percentage contribution fo the total ice covered area of floes of various sizes 12
3 Dimensions of ice riseg 14
INTRODUCTION
The overall objective of this investigation was to utishy
ljzlandsat imagery to analyze changes in the Dronning
Naud Land coastline and to obtain statistical data on
ocean dynamics plankton distribution and sea icd and
iceberg distribution in this region of the Antarctic
The specific objectiveswere as follows
1 To develop a technique for assessing the rate of
iceberg calving from the Dronning Maud Land coast so that
the mass balance of Antarctica in general and of the
Dronning Maud Land Ice Dome in particular can be understood
2 To study iceberg drift in the coastal waters of
Dronning Maud Land and to develop techniques for charting
marine currents in this area
3 To determine the distribution and frequency of
large sheets of plankton in these coastal waters in order
to better understand their relationship to the primary
and secb6ndary production rates and the geographic
distributioh of organisms higher in the food chain
4 To study the statistical distributlon of sea ice
and icebergs in this area in order to determine any
prevailing patterns which might affect the selection of
a site for a new scientific station on the Dronning Naud
Iand coast
The first imagery for this investigation vas received
in August 1975 and over the following year altogether 67
imageries of the test area were received from the
following periods
February 1975 5 October 1975 15 November 1975 15 December1975 14 January 1976 5 February 1976 13
This number of imageries were significantly less than
anticipated and planned for And it will be shown below
- 2 shy
that for most objectives of this investigation the
imageries have been too few and too unsystematically collected to allow quantitative conclusions But at
the same time the potential of many of the methods have
been verified
TEOHNIQUES
MSS -7of all the negatives received have been copied
in BW at 11 mill scale The other bands have also been
used for selected imageries to attempt differentiation
between ice floes and icebergs and to identify areas of
plankton concentrations with inconclusive results
The drift determinations of icebergs and floes have
been done by tracing these on BW MSS 7 taken on successive
days Correct positioning has been assured by having
parts of the ice shelfincluded in the imageries
The frequency distribution of the size of the floes
has been determined from B (1500000 scale) by a semishy
automatic planimeter Some of the imageries have been investigated in an
additive colour viewer to attempt delineation of -areas of
plankton concentrations This investigation was negative
The best method to distinguish between tke iceshelf
edge and the fast ice and to bring out ice rises on the
ice shelf has been to copy the MSS 7 negatives at 5 --10 times normal exposure
RESULTS
Assessing rate of iceberg calving-to evaluate mass blances
Figs 1 and 2 show the Dronning Maud Land coastline 0from lO1 to 29degE as determined from LahdsAt imagery
and a comparison with former mapping The map has been made
at scale of 11 mill and the Mend~at imageries have been
positioned by use of rock outcrops of known positions
which in some cases have involved making a strip of
imageries taken sequentially to make the tie from outcrops
DRONNING 1A10D I3AIr ANTARCTICA
D
4 ~18
Solid line = Coast line determined frcom Landsat imagery Dotted line- Coast line determined from Norsk Polarinstitutts 195152 and 5859 air photography Heavy dashed line =Outer limit fast ice At time of photographyimagery Thin dashed line Outline of ice rises
Sclelt
0 l0 200 km
0
DRONMIING MAUD LAND ANTARCTICA
700
-7030
-
Solid line = Coast line determined from Landsatimagery Dashed line = Outer limit fast ice at time of photographyimageryDotted-dashed line = Coastline uncertain
0 i25 50 IM
l000000
-5shy
to the coast The former mapping is based on airphotoshy
graphy mostly from 195152 and 195859 with limited ground
control and exists mostly as unpublished maps here at
Norsk Polarinstitutt Some of the-differences in coastshy
line shorn in Figs 1 and 2 may be due to errors in the
earlier mapping or in positioning of the Tiandsat imagery
Examples of this may be the coastline from 16 to 210E in Fig 1 the impression is that the two coastline
determinations show the same shape and that stretching
compressing the older mapping in the eastwest direction
would bring the two determinations into close accord
That errors are present in the eastwest determinations
of the earlier aerial photography is very likely
The major changes between the earlier photography
andthe Landsat imagery must be real however In Fig 1
are shovmi five areas where the differences in coastline
determinations most likely are caused by calving of large
parts of the ice shelf Area A Trolltunga broke off
around 1967 as was described in our proposal for this
investigation We believe -that the calving of areas B
0 D and E have not been described before Olose
inspection of Fig 1 will also reveal many smaller areas
of differing coastline which have a form indicatilg that
these differences too are caused by calving However we
are hesitant to evaluate these because of the obvious
uncertainties in the positionings Areas A - E cov~r a
total of 6275 kmn2 which assuming an average thickness
of 200 m equals 1255 Im5 This corresponds to an average
minimum calving rate from this part of the Antarctic
coastline-of around 60 km3year This clearly is a very
minimum determination as only a few large areas are
included and as no account is taken of the changes in
coastline caused by the outward movement of the ice shelf
The calving of the ice shelf takes place at intermittent
and possibly irregular intervals and determinations over
many more decades are probably needed for accurate assessment
ofthe average calving rate On the assumption of ste dy
state the average calving rate should equal the rate of
mass outflow It is interesting to note thet the mass
outflow computed from this same sector by Budd Jenssen and
6-ORIGINAL PAGE IS
V POOR QUALITY Radok (1971 p 41) is about 100 bi2year Cnsidering
the errorsamp of our minimum estimate as well as the errors
clearly-presectent in their estimate these two estimates
are in good agreement
The comparison between the earlier map of the coast
and that made from the Landsatimagery is especially
hampered by the lack of ground control in the early air
photography It was hoped during this investigation to
make more precise comparisons by making several maps from
repetitive Landsat imagery and thus determine outflow
rates and areas of large calvings We believe that this
still is a feasible project and that the applicability
of the technique is demonstrated by the above results
-Unfortunatelyhowever we have not received any imagery
which has permitted us to carry out this part of the
project We have received only a few instances of
repetitivecbvetage of the same area at time intervals
greater than one month and none greater than three months
These have been examined for any changes in the coastline
but-no changes have been detected The fastest ice
shelves have an outward movement of around 500 myear so
with the few examples we have it would have been very
fortuitous should we have been able to detect changes
over such short intervals What we needed Were imagery
covering an inter-ral of minimum one year pre-erably
with int6rmediate imagerr as well
Despite the lack of such imagery we believe the
results of this part of the investigation to be significant
and useful We have been able to produampe a coastline map
which will now serve as reference to-compare with future
mapping This is an important result even though the
map contains some defects As will be apparent from
Figs 1 and 2 there are some gaps notably from $ to 20 W and atl150 E We would also have liked better control
on the positions as we know that there can be errors in
the landsat positions (Nyc andTomas1974) We were able
to make a small test of the latter during the 197677
Norwegian Antarctic Research Expedition which positioned
the coastline from about 440 W to-93O0W with an estimated
7
precision of t 200 m We were able to compare this with the coastline on imagery 2034-08125 which extendedto
100 W andthe errors in the Image were found to be less
than 500 m However a thin cloud bank obscured the
coast on the imagery to such an extent that it is not
possible to delineate the coast with absolute confidence
(Fig 2) and for this reason we cannot closer estimate
the positioning precision of this image During the
planned 197879 Norwegian Antarctic Research Expedition
we intend to make position determinati6ns of the whole
coast covered by Fig 1 This control will allow us to
make a better assessment of the reliability of the
Landsat-determined coastline
-Drift of icebergs and ice floes
Fig 3 shows imageries at successive dates (18 and
19 December 1975) from which drift speed determinations
i-eremade of the cluster of (probably) icebergs and floes
around 60 - 70E The ice moved westward at between 12
and 20 kmday with most determinationsin the lower range
The-only other instance of Landsat imagery sufficiently
closein timeand space to allow drift determinations
covered a three day period from 27 to 30-October 1975
whenvelocities varied between 9 and 13 knmdak with an
average of 10 kmday This took place at 30 - 5Ethe
ice was moving westwards andthere was a divergence in
the field amounting to 10xlO- 5sec These velocities
are close to the determinations by Tcheirnia (1974) and
Swithinbank M6olain and Little (1977) and the feasibility
of the method is clearly demonstrated But the data set
is too small to make any conclusions about the marineshy
currents in the area
A particular problem that we have not resolved
satisfactorily is to distinguish between ice floes and
icebergs We expeoted to be able to distinguish between
these at low sun angles by the shadow of the icebergs
which are approximately20 m above sea level However
when floes and bergs are together there is commonly open
water on one side of icebergs- because of differential
8- Fig3
j ~iiiiiiiiiiiiiiiiiiiiiiiiii~~~ii~~i IiIh
i ii Iiiiiii~iiiii= = ii ~iii~i =iiiiiiiiilliiiiliiiiiliI
i iiI
+
Nhig Iii I iiiiiiii Ii
iiiiiiiiiiii~~~~Iiiii iiiiiiiIiiiiii iiiiiiiiiiiiiiiiiiiiiiiiiiiiiiiiiiiiiiIiii degshy
movements making it often impossible to distinguish the
shadow of the berg On the other hand it cannot be
assumed that open water within an ice mass indicates
presence of icebergs
A second method by which we had hoped to distinguish
between floes and bergs was to use imageries at-different
MSS bands We expected that the sea ice which at times
is wet with seawater should be distinguishable from the icebergs Because the imageries of floesbergs available
have been mostly from early in the season (October to December) when both the sea ice and the bergsare covered
by snow it has not been possible to verify this
satisfactorily This question can probably not be solved
without some ground truth For example we consider -it likely that Fig 3 shows some icebergs surroundied by sea
ice but without ground truth we cannot prove this The shapes are of course also important if the shape is
rectangular then the chances increase that the object is
aniceberg
A combination of several remote sensing techniques
would probably resolve these questions and there is no
doubt that repetitive imagery of an area with recognized floes and bergs would be a cheap and very useful technique
for dhartingS- the marine currents Becausd-- I-the floes
are essentially surface windcurrent driven While the
bergs show the combined effedt of thesutface windsand
the Integrated ocean currents down to 2-300 m the
tracking of both together would give much oceanographic
and meteorological information
Distribution and frequpoundenc_ f largesheetsofplankton
This aspect of the investigation was inconclusive We did not detect any sheets of plankton despite various
attempts at technical enhancement to bring out the
expected brown-red coloured-sheets One reason for the
failure was that we received vety little imagery that was
suited for this part of the investigation -From biological
considerations it was clear that the best possibility of detecting the plankton was on mid-late summer imageryshy
-with large areas of open water Of the 67 scenes received
only four taken in December or later in the summer
contained large significant areas of open water In View-of the results of the 197677 Norwegisn Antarctic
ResearchExpedition this number-was clearly so small that
it would be very unlikely that plankton sheets should be included in the imageries On that expedition an echo-
sounder was run over 10000 km track line during January and FebrUary 1977 with only small registrations of
zooplankton and only at one occasion vere plankton swarms
seen at the surface The larger amounts of zoolankton
were observed 2000 lmes north of Antarctica and only
small qatches were made near Dronning Iaud Land Thus
we believe that the zooplankton possibly is not as plentiful
near the continent as has been suggested by some The
imageries we had available to test this question were
clearly insufficient
Distribution of sea ice and icebergs
Table 1 shows the frequency distribution of the size of the floes as determined from 3W (1500000) by
a semi-automatic planimeter Six cases during October
and November 1975 covering altogether an area of oyer
72000 km2 have been -onsidered (Table 1) Because of
high cloudiness it was not possible to fihd suitable
imageries for the rest of the investigation period Only-
floes writh an area greater than 10 A2 have been considered as the determination of 1he area of smaller floes-becomes
unreliable
Around Svalbard in the Arctic there is an indication
of a bimodal distribution in the floe sizes (vinje
Landeat Investigation N6 28 540 Final Report) This is
not established in the more limited material from Antarctica
instead there is a more or less irregular decrease of the
percentage ooverage from about 6 tewrds 1-2as the
sizes of the floes increase from 10 to 100 km The mean
area of the 636 floes considered is 30 ]dh2 -
Table 2 shows the percentage covered with respect
to the total amount of ice of the different fl6e sizes
- -
A -TABLE1 2 AREA CONSIDERED11726 KM AREA CONSIDERED1118304
10 125 FLOESgt 10 KM 128 FLOES 10 KM 9- T1FLOE5 IOOKhz 9 14FLOE5 gt0OK
-GREATEST FLOE H50 KM GREATEST FLOEH3ZKM 7- 7
S 0 OPEN SEA 6 15 OPEN 5EA
tL52 52 - 41- isA444 shy
R 2
10 20 30 40 50 60 70 80 90 100 20 40 60 80 100
2270-06385 (19 OCT 75) 2278 -072Pq (22 OCT 75) 69 11S -1757E 690 12S- 650E
C DLLI
AREA CONSIDERED11182 KM9 AREA C0N5DERED1jq9OqKMK (_ 92 FLOES 1OKM2 4 l 81FLOES gt10KM12 FLOES gt 100tK 15FLObE5gt100KMl
ltGREATEST FLOE -59[ KMI2 6-GREATESTFLOE a6KM 0 OPEN 5EA bull qOOPEN 5EA
c 444 --- -- --
tjKcent4
gt 2b 40 60 0 1 20 -40 60 so 100 Obq Z30q -06Z70 (22 NOV T5)-06265 (zZ NOVT5)0 6 005-2deg3OE 690 195 -20degHlE
E F
AREA CONSIDERED 11789-1K 1 z AREA CONSIDERED 11182KM 125 FLOES gt 10 K1z
2 92 FLOE5gtIO KM2 S 11 FLOES ) 100 K FLOES gt1001-M2
6
GREATEST FLOE 229 KM2 GREATEST FLOE 219 KM2
46 O OPEN SEA - 6 H0OPENSEA A 4 - shy
24 - 4-2
igc
20 40- 60 80 100- 40 60 80 100 shy20
Z308-06q93 (26 NOV 75) 208-06q95 (Z6 NOV 75) S7o595 - 160 GE 69O1715 -1H-5 6E
- 12 -
Table 2
Percentagecontribution to the total ice covered area of -fToesdf vartous -sizes--
Floe-size intervals3m2 Imagery- Ice covered areakm2
Table 1- 0-10 10-O0o above 100
A 9380 37 29 54
B 9680 34 35 31
0 6710 26 49 25
D 8940 23 44 33
7070 22 47 31
F 6710 48 38 14
Mean 8080 32 40 28
The table shows mostly only small differences in the
percentage coverage from class to class This indicates that the-number of floes roughly changes with a factor of
10 from class to class ie an exponential rblatiDhbhip -between number and area of floes
It was intended to evaluate thesea ice distribution
to determine any prevailing patterns that might affect the selection of a station site As should be clear from -
the previous remarks there were too few su-itAle imageries available to make any approach at this problem We needed
repetitive imagery of the coast from January and February
to recognize those possible areas where the fast ice
and ice floes might hinder access
Other results
One important result of the investigation has been
the recogniti6n of several ice rises that could be
important sited for future ice drillings for paleoDlimatic
studies These ice rises are shoim on the map Fig 1
and in Fig 4 and as discussed in the-3rd Quarterly Report
of this investigation they have been most-easily discoveredby making overexposed copies of the 1SS 7 imagery Table 3 gives the dimensions of the ice rises
-13- Fg 4
Part of Landsat imagery 2278-07250 SS 7 showing four
ice rises at the Dronning 1aud Land coast between 3
and 703 These ice rises are only slightly above the
general surface of the ice shelf and can be very
see from ground level They may havedifficult to
occupied fairly constant positions over long time
periods and promise to be important sites for palooshy
climatic studies
- 14 shy
as measured from BW 11 mill imageries
Table 3
Ice rise position Lengthcn Widthkm Lengthwidth
1) 71025S 100011 31 17 055 2) 70301S 300E 32 19 059 3) 70201S 40301B 29 19 066
4) 70020S 530E 13 10 077 5) 7o01OS 6301E 12 9 075
6) 700201S 7030E 31 19 061 7) 70201S 9000E 42 24 057
8) 70 1 0 S 260 001E 41 54 083
The Landsat imageries have also pjrovided much other information on land phenomena The major ice streams are show+rn with their flowlines and blue ice field and snow drift patterns are clearly brought out One interesting
and unexpected discovery was the significant melt phenomena shoiw-n in Fig 5 a) and b) from 10 January and 14 February 1976 1-e see heze a blue ice field which presumably because of lower albedo experiences significant melting with the melt phenomena extending many ams dovnslope Some of the darker areas could at first glance be mistaken for solid rock but examinations of all MSS bands show that the phenomena become very indistinct in bands 4 and 5 aid it is clear that the imagery shows only ate snow and ice Note also the persistence of the snow drift
patterns south of the melt phenomena
SIGNIFICANT RESULTS
As the ar-ea of this investigation is remote and not easily accessible it is clear that the Landsat imageries
will give original information of great interest The
most important result in our view is the production of a nearly complete map of the Dronning Land coastline from
10OW to 290E Based on this we have determined that for
the past 20 years the minimum calving rate from this part of the coastline has been 60 km3year The coastline map
-15shy4tii===mi
Fig 5 a)T~taLnstiaey25-58EStkno 0 Jaouary 1976 at scale 11 mill with centre of picture at 70045S 2703E oriented with N and dovmslope upwards parallel the short sides
Fig 5 b) Part of Landsat imagery 2388-05515 3S$7 taken on 14 February 1976 with scale and orientation as for Fig 5 a) and covering approximately the same area ate the various melt phenomena 97tendingtawnslope from blue ice fields and the unshychanging pattern of the snowdrifts south of the melt features
ORIGoAL PAGES o PoR QUALITY
- 16 shy
will also serve as an important data set to compare with
future studies We have measured the drift speeds of icefloes and
bergs to between 9 and 20 kmday and we have found that
the number of ice floes of given size decreases
exponentially with size so that each size class covers
approximately the same area
We have identified and measured a series of ice
rises which could be important localities for future
paleoclimatic studies We have also discovered large melt
phenomena at blue ice fields around 70045S and 26-290E
CORCLUSIONS
We received only about 14 of the imageries planned
for this investigation and the resulting lack of repetitive
imageries has prevented us from reaching satisfactory
conclusions about most of the problems this investigation
was aimed at On the other hand the number was adequate
to prove the potential of most of the planned investigation
The Landsat imageries have clearly a remarkable potential
for investigation of many problems in inaccessible areas
with which costly expeditions cannot hope to compete
For us working in polar areas the Landsat imageries already
available will constitute an important data source and
we hope that future developments will be such that we can
continue to receive imageries of Antarctica
ACKNOILEDGMENTS
This report has been prepared in cooperation with
Mr T Vinje at the Norwegian Polar Research Institute
Mr 0 PinmekAsa also at this institute prepared the
photoproduets and extracted the necessary back ground data
for the investigation
17-
REFERENCES
Budd WF Jenssen D and Radok U 1971 Derived
physical characteristics of the Antarctic
ice sheet ANARE Interim Reports
Publication No 120 178 pp
Nye JF and Thomas DR 1974 The use of satellite
photographs to give the movement and
deformation of sea ice AIDJEX Bulletin
No 27 Seattle
Swithinbank C McClain P and Little P 1977
Drift tracks of Antarctic icebergs Polar
Record Vol 18 No 116 p 495-501
Tchernia MP 1974 Atude de la d6rive antaretique
Est-Ouest an moyen dicebergs suivis par le
satellite tole Comptes Rendus Hebdomadaires
des S6ances de lAcad4mie de Sciences (Paris)
S~rie B Tome 278 No 14 p 667-70
ORIGINAL PAGE IS OF POOR QUALM
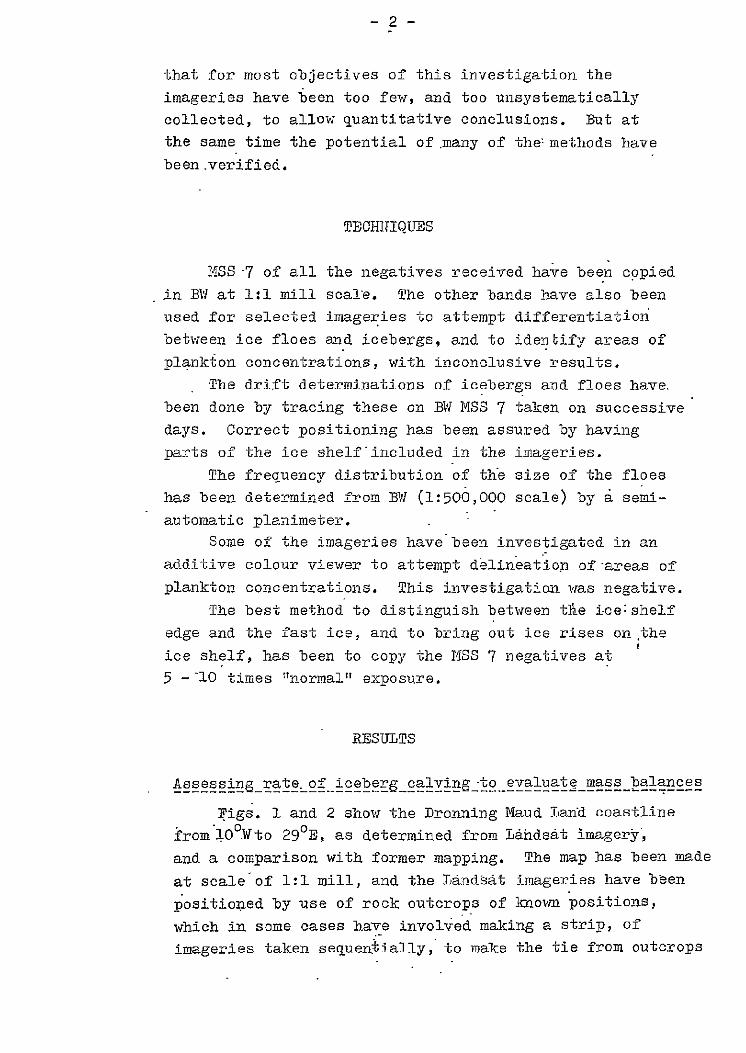
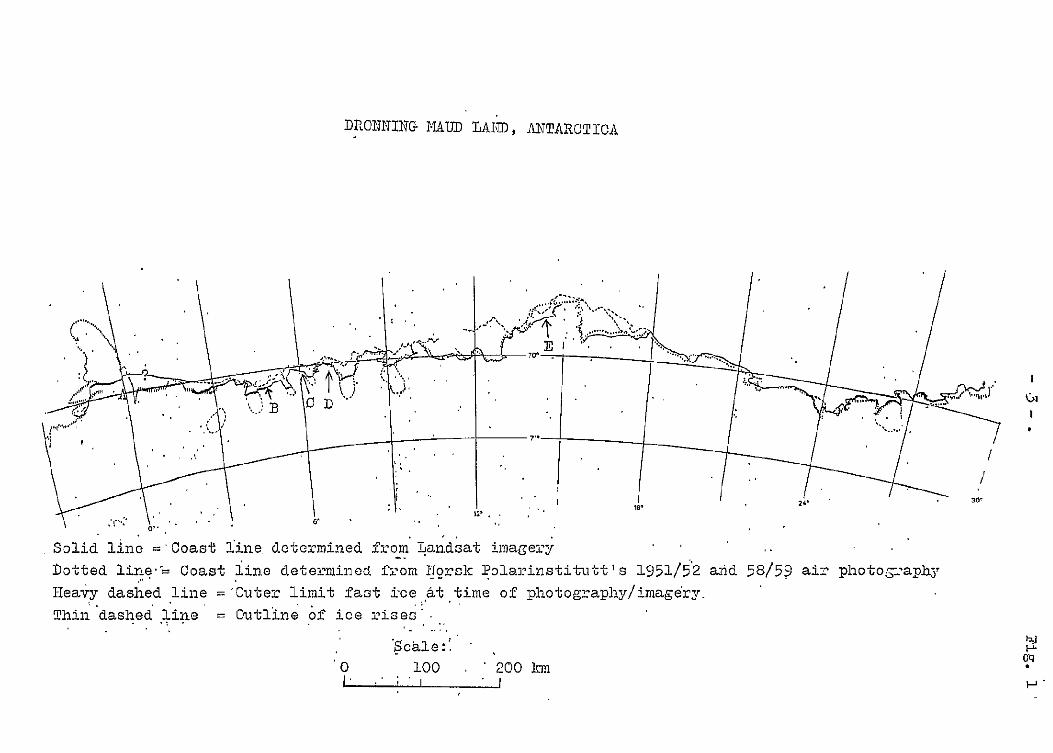
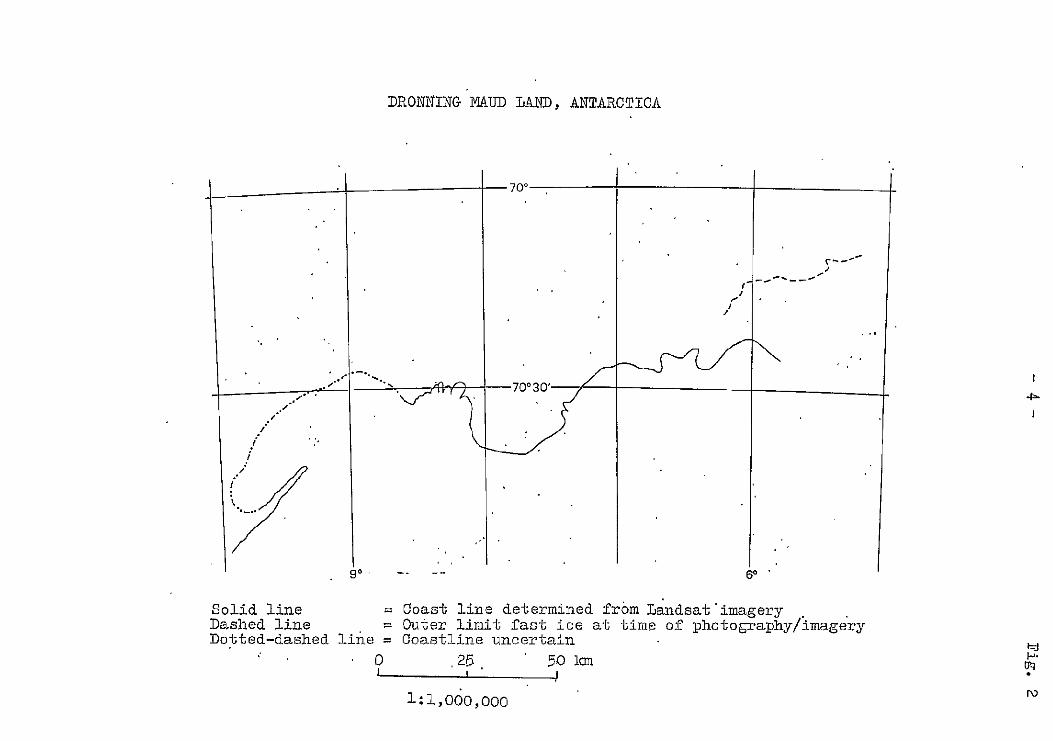
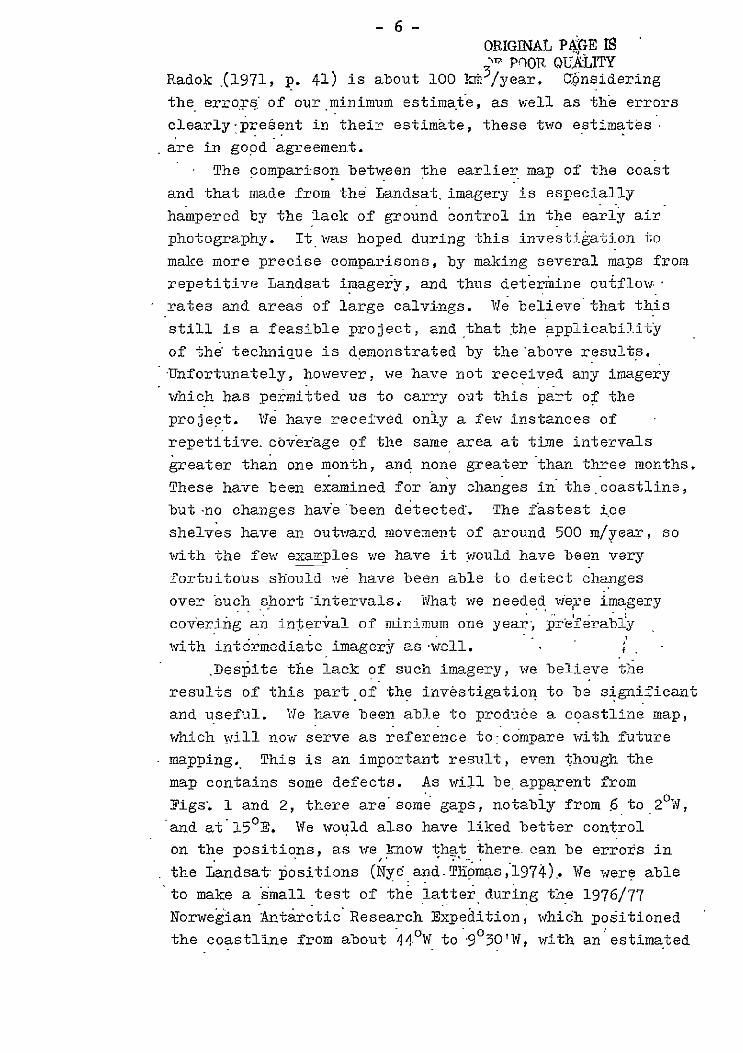
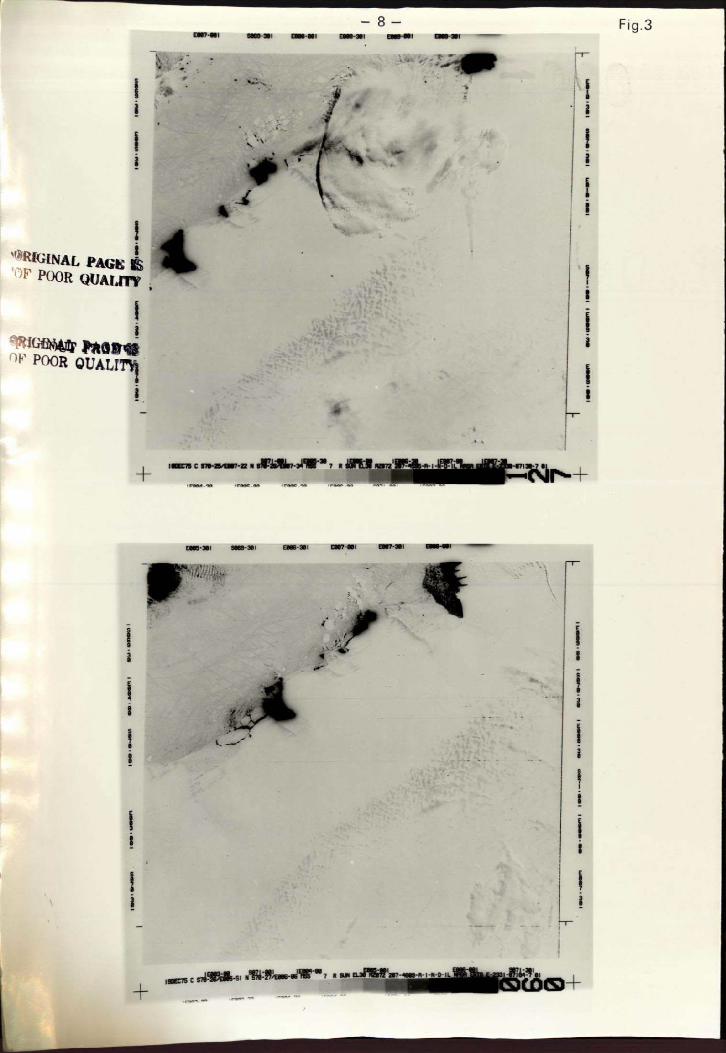
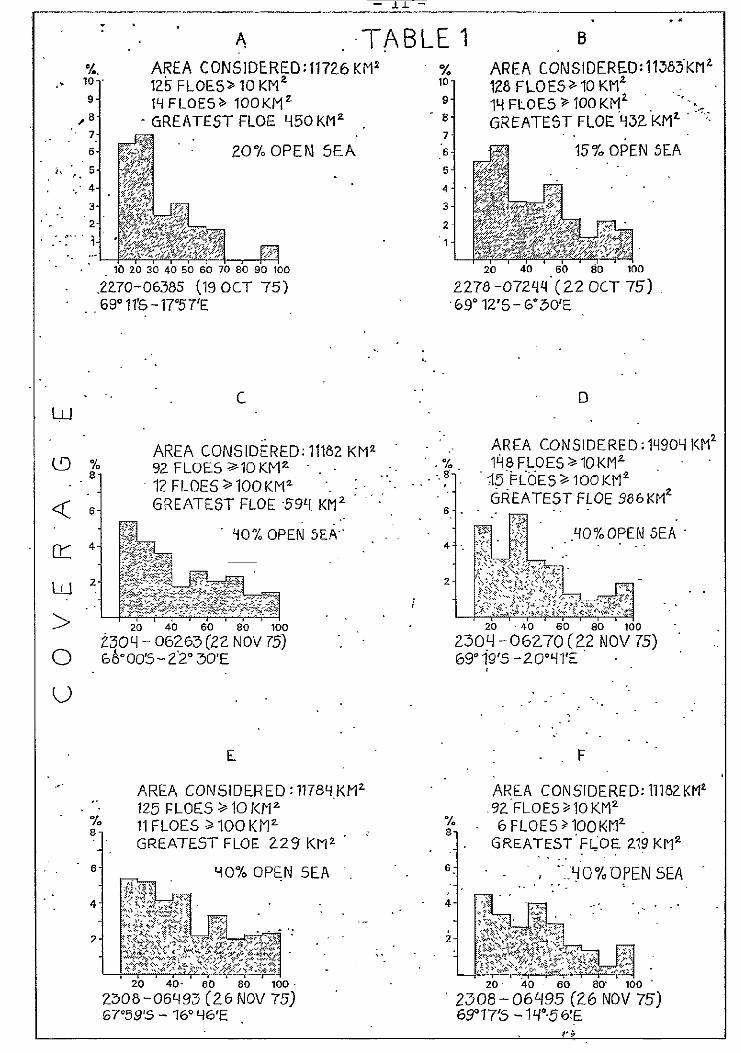
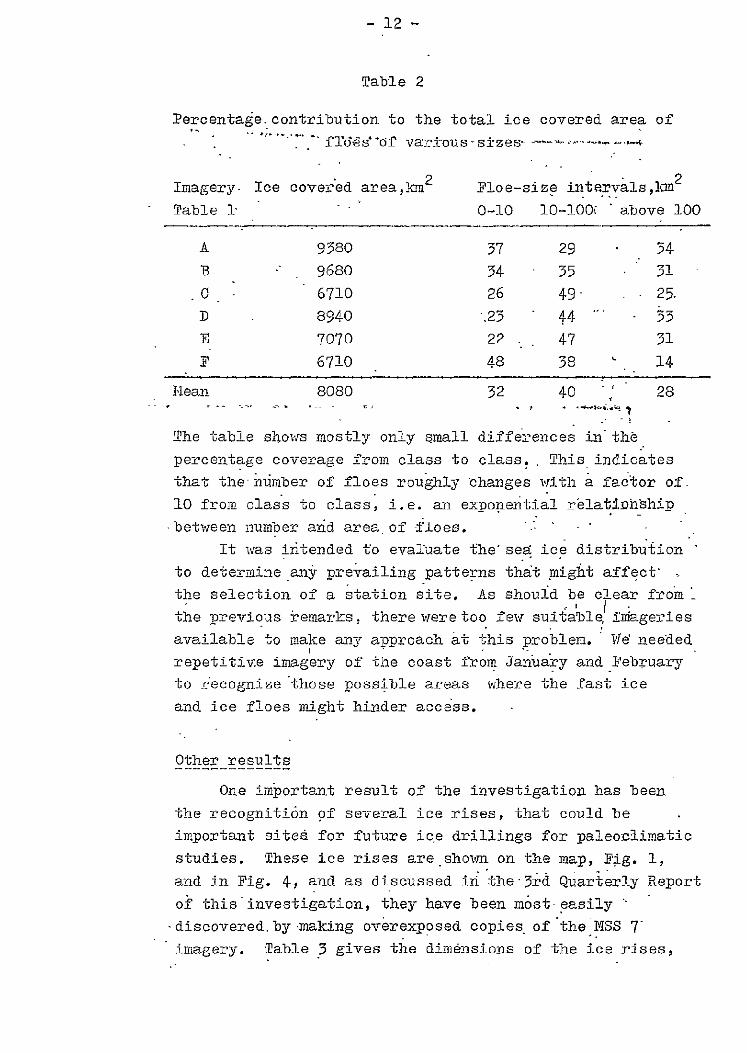
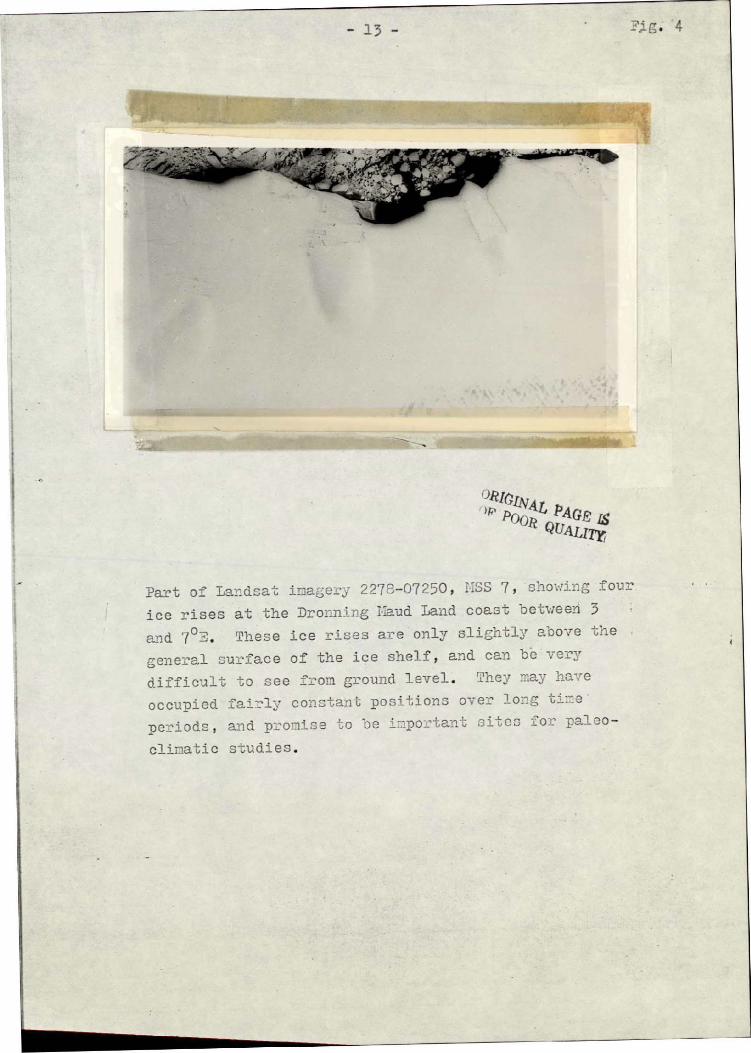
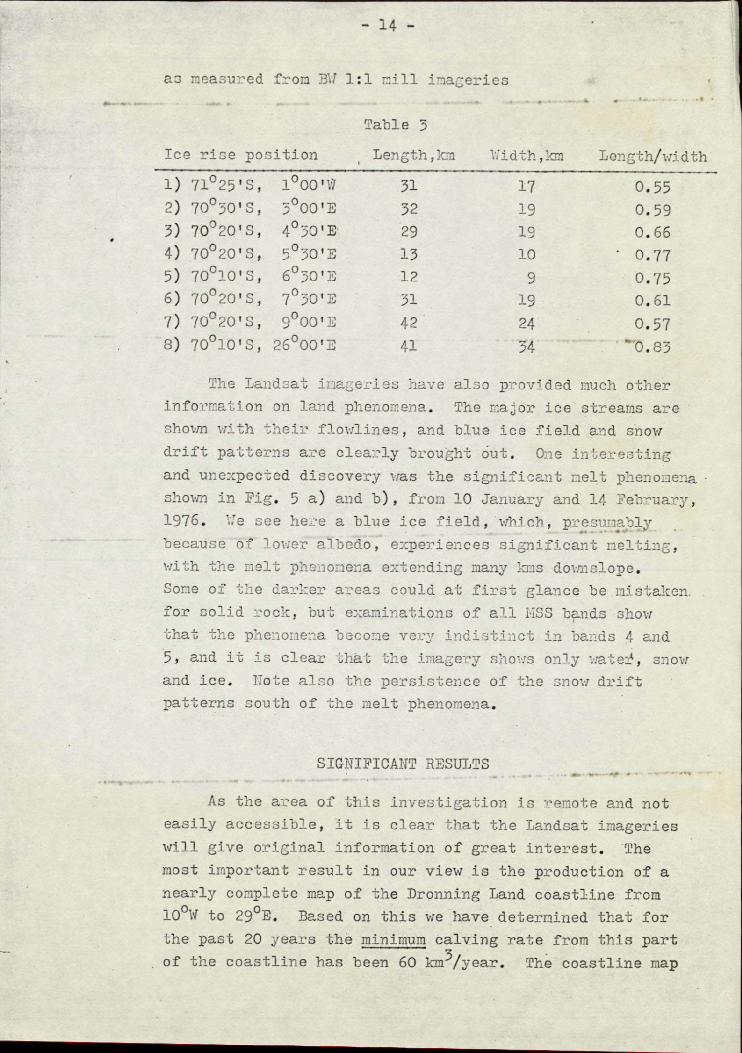
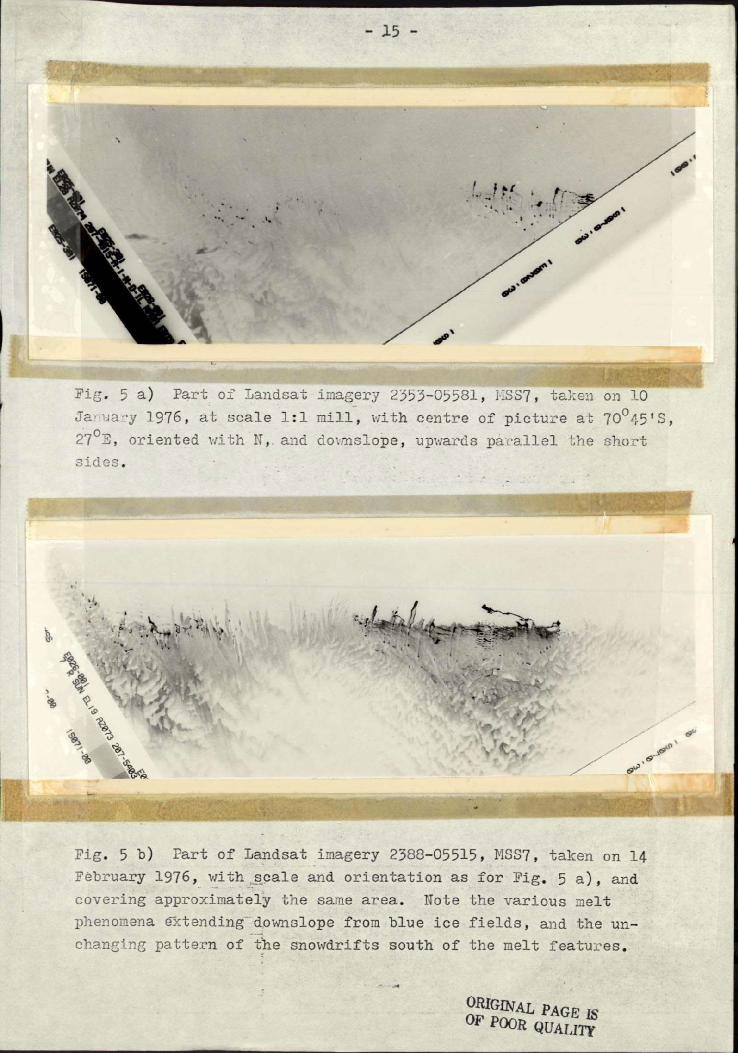
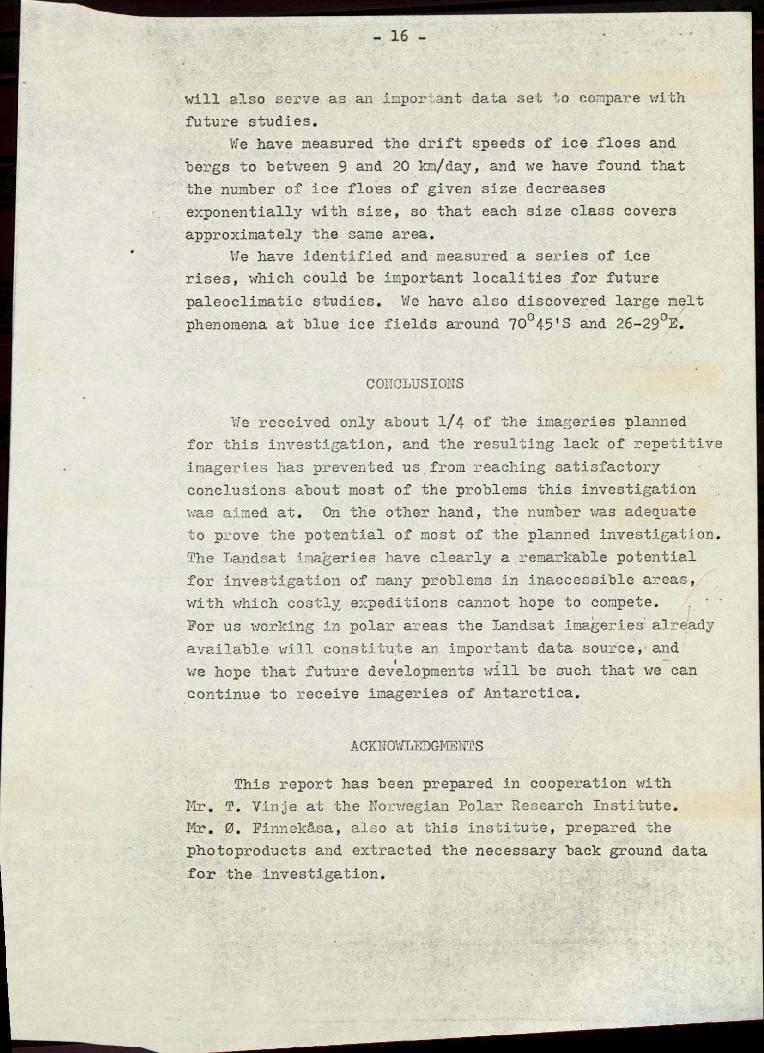