Embed Size (px)
Citation preview

C A R B O N 9 1 ( 2 0 1 5 ) 1 8 8 – 1 9 9
.sc iencedi rect .com
Avai lab le at wwwScienceDirect
journal homepage: www.elsev ier .com/ locate /carbon
SDS-stabilized graphene nanosheets for highlyelectrically conductive adhesives
http://dx.doi.org/10.1016/j.carbon.2015.04.0390008-6223/� 2015 Elsevier Ltd. All rights reserved.
* Corresponding author at: Department of Chemical Engineering, University of Waterloo, 200 University Avenue West, Waterlo3G1, Canada.
E-mail address: [email protected] (B. Zhao).
Behnam Meschi Amoli a,b,d, Josh Trinidad a,b, Geoffrey Rivers b,c, Serubbabel Sy a,b,Paola Russo b,c,d, Aping Yu a,b, Norman Y. Zhou b,c,d, Boxin Zhao a,b,d,*
a Department of Chemical Engineering, University of Waterloo, 200 University Avenue West, Waterloo, ON N2L 3G1, Canadab Waterloo Institute for Nanotechnology, University of Waterloo, 200 University Avenue West, Waterloo, ON N2L 3G1, Canadac Department of Mechanical and Mechatronics Engineering, University of Waterloo, 200 University Avenue West, Waterloo, ON N2L 3G1,
Canadad Center for Advanced Materials Joining, University of Waterloo, 200 University Avenue West, Waterloo, ON N2L 3G1, Canada
A R T I C L E I N F O
Article history:
Received 18 December 2014
Accepted 13 April 2015
Available online 20 April 2015
A B S T R A C T
We report sodium dodecyl sulfate (SDS) stabilization of graphene nanosheets, with two dif-
ferent sizes as auxiliary fillers inside the conventional electrically conductive adhesive
(ECA) composite. Using this non-covalent modification approach we were able to preserve
the single-layer structure of graphene layers and prevent their re-stacking inside the com-
posite, which resulted in a significant electrical conductivity improvement of ECAs at
noticeably low filler content. Addition of 1.5 wt% small and large SDS-modified graphene
into the conventional ECAs with 10 wt% silver flakes led to low electrical resistivity values
of 5.5 · 103 X cm and 35 X cm, respectively, while at least 40 wt% of silver flakes was
required for the conventional ECA to be electrically conductive. A highly conductive ECA
with very low bulk resistivity of 1.6 · 10�5 X cm was prepared by adding 1.5 wt% of SDS-
modified large graphene into the conventional ECA with 80 wt% silver flakes which is less
than that of eutectic lead-based solders.
� 2015 Elsevier Ltd. All rights reserved.
1. Introduction
Electrically conductive adhesives (ECAs) are polymeric com-
posites reinforced by conductive fillers ranging from metallic
particles to carbon materials. These composites have drawn
considerable attention as promising alternative materials
for traditionally used toxic lead-based solders for a variety
of applications such as light emitting diodes (LEDs) [1], liquid
crystal displays (LCDs) [2], and electronic packaging [3] to
resolve the environmental concerns, reduce the operating
cost, provide finer pitch capability, etc [4].
To meet the minimum requirements for today’s competing
advanced electronic industries, ECAs are required to have
high electrical conductivity at low filler content. The conven-
tional ECAs (usually consist of epoxy and silver micro flakes)
have low electrical conductivity even at high filler content,
which jeopardizes their potential to replace lead-based sol-
ders for a wide variety of applications. Many efforts have been
devoted to improving the electrical conductivity of ECAs at
low silver content by introducing the nano-sized conductive
fillers into the conventional formulation of ECAs [5–11]. A
key parameter in electrical conductivity of an ECA is the
o, ON N2L

C A R B O N 9 1 ( 2 0 1 5 ) 1 8 8 – 1 9 9 189
quality of the electrical network. The conductive nanofillers,
depending on their type and morphology, affect the quality
of network by influencing the contact resistance. The contact
resistance is characterized by constriction resistances and
tunnelling resistances [5]. It should be noted that the tun-
nelling resistance is a dominant parameter at low silver con-
tent [9,12]. It has been reported that the contact resistance
can be remarkably reduced by introducing high aspect-ratio
nanomaterials [13]. Many research groups have studied the
effects of different high aspect-ratio nanomaterials such as
silver nanowire (Ag NWs) [13,14], silver nanobelt (Ag NBs)
[9], and carbon nanotubes (CNTs) [15,16] on the electrical
properties of ECAs and reported the establishment of a perco-
lated network at low silver content.
Recently, graphene, a flat monolayer of carbon atoms, den-
sely packed into a honeycomb two-dimensional (2-D) lattice
structure, has attracted great interest due to its exceptional
electrical, thermal and mechanical properties [17–19].
Possessing the highest aspect-ratio and specific surface area
among all the nanostructure materials, graphene can provide
a more complete electrical network at lower filler content,
making it a promising nanofiller for ECAs application [20].
Pu et al. used nitrogen-doped graphene inside the system of
epoxy and silver powder and reported that the percolation
of silver powder reduced to 30 wt% [21]. Their results con-
firmed that 2-D graphene is much more effective than other
types of high aspect-ratio carbon-based fillers such as carbon
nanotubes and carbon black. However, the challenge of
attaining a homogeneous dispersion, as well as preserving
its single-layer structure inside the composite acts as a bottle-
neck in ECA fabrication.
Surface modification of graphene using organic materials
is one approach to exfoliate graphene in which the interac-
tion occurs via either covalent bonding or via p–p stacking.
Although this technique is shown to be effective to exfoliate
graphene layers, it hinders their electrical properties because
it disturbs the p-electrons delocalization of graphene surface
[22–25]. The surface decoration of graphene with inorganic
nanoparticles (NPs) such as Ag NPs is another approach that
can effectively exfoliate graphene nanosheets [26]. Some
research groups applied this idea into ECA applications and
used the Ag NP-decorated graphene for the formulation of
ECAs; they reported a positive effect of Ag NP-decorated gra-
phene on the electrical conductivity of ECAs [20,27,28].
Based on our recent study, we believe that the improved elec-
trical conductivity of ECAs via addition of Ag NP-decorated
graphene is mainly because of the reduction of the tunnelling
resistance; however, the increased number of contact points
(due to the presence of Ag NPs on the graphene surface)
may cancel out this positive effect [29]. We showed that to
decrease the number of contact points sintering of NPs must
occur which requires elevated curing temperatures (higher
than 150 �C). We hypothesize the single layer graphene with-
out metallic decoration is a better option as auxiliary filler for
ECA application if a proper exfoliation technique is applied to
preserve its single layer structure within the epoxy matrix.
In our current study, we used a simple surfactant-assisted
approach (based on the use of an ionic surfactant, sodium
dodecyl sulfate (SDS)) to stabilize graphene nanosheets and
disperse them inside the conventional ECAs (consisting of
epoxy and silver micro flakes). Although the production of
surfactant-stabilized graphene from graphite powder has
been reported in literature [30], it is the first time that we
report direct stabilization of graphene to be used inside ECA
composites. In this technique, graphene layers are exfoliated
by the mechanical energy provided by bath or horn sonica-
tion, which breaks the van der Waals interactions between
graphene layers. At the same time, surfactant molecules are
adsorbed onto the graphene layers surface and prevent their
re-stacking via steric repulsions [25,30,31] (see Fig. 1A). The
main advantage of using this approach for ECAs application
is that we are able to preserve the single layer structure of gra-
phene and prevent their re-stacking inside the nanocompos-
ite without disturbing its structure. The exfoliated graphene
nanosheets can effectively bridge between separated silver
flakes and provide more surface area for electron transporta-
tion inside the electrical network (as illustrated in Fig. 1B). To
shed further light on the effect of graphene aspect-ratio, we
used graphene nanosheets with two different sizes (1 lm,
and 3–5 lm diameter) and applied the same SDS modification
approach to exfoliate and disperse them inside the conven-
tional ECAs. The electrical resistivities of the hybrid ECAs
(with small and large SDS-modified graphenes) were mea-
sured at different silver contents and compared with those
of conventional and hybrid ECAs with non-modified gra-
phene. The effect of SDS modification on the curing beha-
viour of epoxy and the thermal stability of hybrid composite
was also investigated.
2. Experiments and methods
2.1. Large and small size graphenes and their SDS-stabilization
Large size graphene was produced via reduction of graphene
oxide (GrO) which was synthesized by modified Hummer’s
method [32,33]. Large graphite pellets with average sizes of
1 mm to 5 mm was used to produce GrO. The reduction of
GrO to produce graphene was achieved by pre-heating of
GrO in vacuum oven for 6 h followed by thermal annealing
in a furnace (protected with Ar) at 900 �C for 10 min. This pro-
cess ensures the total removal of the oxygen functionality
and restoration of the graphitic surface, so that the highest
electrical conductivity can be achieved for the resulted large
size graphene. Small size graphene was purchased from
ACS material (USA).
In order to modify the graphene surface with SDS, both
large and small graphene powders were dispersed into a solu-
tion of SDS (Sigma–Aldrich, P99.0%) and ethanol. The con-
centration of SDS in ethanol was 0.06 mol/L. Then, the
solution was ultrasonicated using a low power sonic bath
(Branson 2510R-MT) for 30 min. In order to remove the un-
bonded SDS, the graphene dispersion was washed four times
by repeatedly dispersing in fresh ethanol and centrifugation
at 8000 rpm for 10 min to remove the supernatant. The final
solution was then filtered using a polycarbonate (PC) mem-
brane (with a pore size of 400 nm) and dried overnight at
room temperature in a vacuum oven.

Fig. 1 – (A) SDS modification of graphene leads to exfoliation of graphene flakes; (B) the bridging of SDS-modified graphene
between separated silver flakes establishes a compete electrical network inside epoxy. (A colour version of this figure can be
viewed online.)
190 C A R B O N 9 1 ( 2 0 1 5 ) 1 8 8 – 1 9 9
2.2. Nanocomposite preparation
Diglycidyl ether of bisphenol A epoxy (DERTM 322) and tri-
ethylenetetramine (TETA), supplied by DOW chemical com-
pany (USA), were used as the adhesive base and hardener,
respectively. The weight ratio of hardener to epoxy was 0.13.
Two general types of sample (conventional and hybrid ECAs)
were prepared, as listed in Table 1. The conventional ECA con-
tained only silver flakes (Aldrich, 10 lm) and epoxy, whereas
the hybrid ECAs contained epoxy and a mixture of the gra-
phene (either SDS-modified or non-modified) with silver
flakes at different weight percent. To make a hybrid ECA with
SDS-modified graphene (either small or large size), silver
flakes were mixed with a dispersion of modified graphene
in ethanol for 30 min and then epoxy was added to the mix-
ture. The composite was mixed using the vortex mixer for
one hour. In order to remove ethanol from the composite,
the mixture was placed inside a desiccator and degassed in
the consequent of 30 min followed by 5 min vortex mixing
until ethanol was fairly removed (the final amount of in each
composite type is shown in Table 2). Then the TETA was
added to the mixture and the resultant paste was filled into
a mold (7 mm · 7 mm · 0.5 mm) made using a glass slide
Table 1 – ECA samples and their conductive fillers.
Samples Conductive filler system
CCA Silver flakesHCA-SGS Silver flakes and SDS-modifieHCA-SGN Silver flakes and non-modifieHCA-LGS Silver flakes and SDS-modifieHCA-LGN Silver flakes and non-modifie
and pieces of adhesive tape. A clean copper sheet was placed
on top of the mold to ensure that the thickness of the sample
remained constant, as well as to consistently produce a
smooth surface. The samples were then pre-cured inside an
oven at 60 �C for 30 min, and then cured at 150 �C for 2 h.
After curing, the copper plate and the adhesive tape were
removed. The schematic of nanocomposite preparation is
presented in Fig. 2. A similar procedure was followed for the
preparation of the hybrid ECA with non-modified graphene.
2.3. Characterization methods
Fourier Transform Infrared Spectroscopy (FTIR) (Tensor 27,
Bruker Co.) analysis was carried out to confirm the SDS mod-
ification of graphene. A High Resolution Transmission
Electron Microscope (HRTEM, JEOL 2010 F FEG) equipped with
a field emission gun running at high resolution was used to
determine the quality of exfoliation of graphene layers. The
morphology of layers was investigated with an atomic force
microscope (AFM) (Parks system NSOM model) in non-contact
mode. Raman spectroscopy was performed using Bruker
Senterra spectrometer (with 532 nm laser source). The bulk
resistivity of ECAs and graphene pallets samples was tested
Type of ECA
Conventional ECAd small graphene Hybrid ECAd small graphened large graphened large graphene

Table 2 – Characteristic Cure and Tg data from DSC.
Composition
Name Control 1 Control 2 HCA-SGN HCA-SGSDescription (Neat epoxy) (Ethanol diluted)
Ethanol content PHR 0 PHR 40.8 PHR 40.4 PHR 40.4 PHRwt% 0 wt% 26.5 wt% 12.5 wt% 12.5 wt%
DHtot J/g 452.7 380.5 132.7 148.3DHnorm J/gmatrix 452.7 517.5 380.9 436.2Tg1 �C 129.7 117.8 111.9 111.9
Fig. 2 – A schematic of a hybrid ECA nanocomposite preparation. (A colour version of this figure can be viewed online.)
C A R B O N 9 1 ( 2 0 1 5 ) 1 8 8 – 1 9 9 191
through sheet resistance measurements using a four-point
probe configuration. The setup is comprised of a probe unit
(Cascade Microtech Inc.) and a source meter (Keithley 2440
5A Source meter, Keithley Instruments Inc.) The acquired
sheet resistance was then converted into bulk resistivity
using the following equation:
q ¼ Ftp
ln2VI
� �ð1Þ
where F is a correction factor for samples with finite thick-
nesses, t is the sample thickness, I is the applied current
and V is the voltage drop, measured by the source meter.
The correction factor is defined as a function of the ratio of
the sample thickness-to-probe spacing, denoted as s and so,
for situations where the ratio between t and s is 0.4 < t/
s < 1.0, F can be approximated to 1 [29]. For our measure-
ments, the sample thickness is �0.5 mm and the spacing is
1 mm, therefore it is safe to assume that F = 1.
Using a Scanning Electron Microscope (SEM, LEO 1530, Carl
Zeiss NTS), a study was carried out on the morphology of the
electrical network inside the composites, as well as the filler–
filler interaction between the graphene and the silver flakes.
Differential Scanning Calorimetry (DSC) was performed for
pure epoxy and composite to determine the rate of curing
and their glass transition temperature (Tg). Polymer and com-
posite DSC samples were encapsulated in hermetically sealed
aluminum pans and cured during a 3 �C/min ramp to 180 �C in
a TA4600 differential scanning calorimeter. The area under
the exothermal peak was taken as the specific cure reaction
enthalpy (DHtot), in accordance with ASTM E2160-04.
Samples were then cooled to 50 �C at 3 �C/min, and a sec-
ond-heating scan performed to 180 �C using a modulation of
±0.477 �C every 60 s and an underlying heating rate of 3 �C/
min. The glass transition temperature (Tg) of polymer and
composite samples was determined from the reversing heat
capacity (Rev Cp) signal of the second scan, using the method-
ology described by ASTM D7426-08. No residual cure signal
was observed, confirming completion of the detectable
enthalpic cure in the first heating scan [34]. Samples were
then cooled to 50 �C at 3 �C/min before post-curing. Polymer

192 C A R B O N 9 1 ( 2 0 1 5 ) 1 8 8 – 1 9 9
and composite samples were post-cured using heat-treat-
ment cycles, applied by DSC. Each cycle consisted of heating
the sample to 150 �C with an underlying heating rate of
3 �C/min, holding isothermally for 60 min, then cooling to
50 �C at 3 �C/min. Heating was modulated at ±0.477 �C ampli-
tude every 60 s to obtain the reversing Cp component of the
signal, determining the Tg at the beginning of each post-cure
cycle. The Tg1 value reported is the value obtained when Tg
stopped changing significantly between post-cure cycles,
indicating post-cure was complete. Each sample was cycled
10 times to ensure that they reached a completely post-cured
state. The thermogravimetric Analysis (TGA, TA instruments
Q5000-1254) was used to study the thermal stability of the
nanocomposites. Approximate 10 mg samples were placed
in the TGA sample pan. Dynamic scan was performed from
40 to 800 �C with a heating rate of 10 �C/min under nitrogen
atmosphere.
3. Results and discussion
Considering that the two types of graphene are from different
sources, we first studied and compared their surface chem-
istry, defect contents, thickness, and even their intrinsic elec-
trical conductivity so that we are able to draw a fair
comparison when they are employed as auxiliary fillers inside
the ECA. First, FTIR spectroscopy was performed for both
types of graphenes to examine if there is any significant dif-
ference between their surface chemistry. As can be seen in
Fig. S1, both of the small and large graphenes have similar
FTIR spectra. More specifically, for both of them, the most
characteristic peaks belong to C@C and C@O bonds, as high-
lighted by red dashed square. The FTIR results indicate there
is no significant difference between the surface functional
groups of the as-prepared small and large graphenes.
Raman spectroscopy was also carried out for these two
types of graphene to examine the content of defects on their
surface. The defect content is indicated by the ratio of the
intensity of the D band (�1350 cm�1) to the intensity of the
G band (�1580 cm�1), defined as ID/IG ratio [30]. As can be
observed in Fig. S2, both of the small and large graphenes
have almost the same ID/IG ratio (�0.96), indicating similar
surface quality between the two graphene.
AFM was also performed to compare the thickness of these
graphenes before SDS treatment. Figs. S3A and S3B show the
images of non-modified small and large graphenes, and
Figs. S3D and S3E present their relative height profile, respec-
tively. It can be noticed that the step between the substrate
and the layers of large graphene is�7 nm, as the average value
found for the small non-modified graphene (�6–7 nm).
These values may denote that approximately 10 layers of
graphene stacked together, as others reported 1–2 nm height
for single layer graphene [20]. Representative SEM images of
small and large graphenes are shown in Fig. S4, indicating
similarity in their crumpled morphology. The bulk resistivity
of the compressed pallets of the small graphenes prior to
SDS modification was measured and compared to that of large
graphene (Fig. S5). The inserted image shows an optical image
of a typical pallet which was used for the electrical conductiv-
ity measurements of the graphenes. The results showed that
the bulk resistivities of both small and large graphenes
(0.088 X.cm compared to 0.091 X cm, respectively) are in the
same range with a slight difference.
To verify the adsorption of SDS on graphene layer surface,
the FTIR was performed for pure SDS, non-modified gra-
phene, and the SDS-modified graphene; the results are shown
in Fig. 3. To make sure there was no un-bonded SDS left in the
system, the mixture of SDS and graphene after sonication
was vigorously washed with fresh ethanol using sonication
and centrifugation. In the FTIR spectrum of non-modified gra-
phene, the peaks at 1589 cm�1 and 1740 cm�1 are related to
the stretching vibration of C@C and C@O bands, respectively
[35]. Both of these peaks can be seen in the spectrum of
SDS-modified graphene with slightly reduced intensities.
Also, the peak at 1240 cm�1 in the spectrum of non-modified
graphene is considered to be C–H in plane bending [36]. This
peak is too weak and in the most cases cannot be seen, as it
was diminished in the spectrum of the SDS-modified gra-
phene. The spectrum of pure SDS shows peaks at
1248 cm�1, 1219 cm�1, and 1084 cm�1 which correspond to
asymmetric and symmetric stretching modes of SO4�2, respec-
tively. Furthermore, pure SDS spectrum shows CH3 asymmet-
ric, symmetric (2955 cm�1, 2873 cm�1) and CH2 asymmetric,
symmetric (2917 cm�1, 2850 cm�1) stretching vibrational fre-
quencies [37]. The same peaks are observed in the spectrum
of SDS-modified graphene (as highlighted in red and green),
implying the presence of SDS on the graphene surface even
after multiple vigorous washing cycles. These results confirm
that graphene layers have been successfully stabilized with
SDS.
TEM was carried out to examine the effectiveness of SDS
modification on exfoliation of both small and large gra-
phenes. The transparency of flakes to the electron beam
implies the level of exfoliation [30]. The number of graphene
layers can be indicated by counting the number of distin-
guishable edges in TEM images [38]. Fig. 4A and B are repre-
sentative TEM images of non-modified and SDS-modified
small graphene, respectively. The opaque feature of non-
modified graphene implies the stacking of graphene layers
which hindered the electron beam to pass through the sam-
ple. However, after SDS modification, we see a bright and
transparent graphene layer with a single distinguishable
edge. The HRTEM image of the red square-marked area of
Fig. 4B clearly shows that the graphene layers are exfoliated
to individual layers. Electron diffraction (ED) pattern of black
square-marked area also confirms the single layer feature of
the selected area, as the inner set of spots are more intense
than the secondary set [38,39]. The blurry ring in the ED pat-
tern is attributed to the amorphous structure of SDS covering
the graphene surface. A representative TEM image of non-
modified large graphene flakes is shown in Fig. 4C which
have a similar dark structure as small graphene. However,
as can be seen in Fig. 4D, after SDS treatment, the large gra-
phene flake is transparent to the electron beams. The
HRTEM image of the red square-marked area of Fig. 4D also
shows there is only a single layer at the edge of the large flake.
We used the TEM images to analyze the effect of SDS mod-
ification on the lateral size of graphene. The end-to-end diag-
onal size of 20 flakes of both the small and large graphene
before and after SDS treatment was measured. The average
number for each case is shown in Fig. 4E. As can be observed

Fig. 3 – FTIR spectra of pure SDS (1), SDS-modified graphene (2), and non-modified graphene (3). (A colour version of this figure
can be viewed online.)
C A R B O N 9 1 ( 2 0 1 5 ) 1 8 8 – 1 9 9 193
in this figure, the diagonal sizes of SDS-stabilized small gra-
phenes were always bigger than those of the non-modified
ones. For the large graphene, the diagonal size difference
was more evident. One explanation for the observed bigger
size of the SDS-stabilized graphene compared to that of the
graphenes before modification could be that there might be
less folding for the SDS-modified graphene on the TEM grid,
hence, giving a larger diagonal size. Overall, it is safe to con-
clude that the SDS modification did not reduce the size of
the graphene layer.
To further study the effect of SDS modification on the
structural properties of graphene, Raman spectroscopy was
performed for the small graphene before and after SDS treat-
ment to determine if the SDS treatment causes any additional
defect to the structure of graphene. The results, presented in
Fig. 5, are representative Raman spectra of small non-modi-
fied graphene and SDS-stabilized small graphene. As shown
in Fig. 5A, the intensity of the G and D bands for both the
non-modified and SDS-stabilized graphenes was in the same
range. Comparison between ID/IG ratios of small graphene
before and after SDS modification (0.963 and 0.959, respec-
tively) indicates that the SDS modification did not disturb
the chemical structure of graphene.
AFM was performed for small graphene before and after
treatment to study the effect of SDS modification on the
thickness of graphene layers. Figs. S3A and S3C show the
AFM image of the non-modified small graphene and SDS-sta-
bilized small graphene, respectively. Figs. S3D and S3F also
show their relative height profiles, respectively. As mentioned
earlier, it is possible to notice that small graphene layers are
stacked together, leading to a multilayer structure. In particu-
lar, the height profile of Fig. S3A (displayed in Fig. S3D) shows
a step between the substrate and the layer of 6.53 nm, which
can be associated to the presence of approximately 10 layers
of stacked graphene [20]. Graphene layers tend to re-stack
together in solution and this is the reason why we found val-
ues around 6–7 nm for the thickness of non-modified
graphene. The height profile of SDS-stabilized graphene
(Fig. S3F) shows a step of 3.03 nm between the substrate
and the first layer and a step of 3.03 nm between two consec-
utive layers. As expected, upon modification of the graphene
layers with SDS, a better exfoliation of the material was
achieved (see Fig. S3C). One may think that the value of
3.03 nm is far to be identified as single layer graphene, but it
should be considered that the presence of the SDS on the gra-
phene surface could lead to an overestimation of the thick-
ness. The step of 3.03 nm could be attributed to the SDS
molecules adsorbed on a single layer graphene sheet which
is in the agreement with the observations of others [20].
Also, it should be noted that the graphene is easy to bend
on AFM substrate leading to overestimated height profile.
Before adding graphene into the ECA formulation, the
effect of SDS modification on the electrical properties of gra-
phene was examined by measuring the bulk resistivity of
small graphene pallets before and after the SDS treatment.
As expected and can be seen in Fig. S5, the SDS modification
of graphene increased the resistivity of graphene pallets
because of the insulating layer of SDS. Note that even though
the SDS-modified graphene has lower electrical conductivity,
the electrical conductivity of the ECA filled the SDS-modified
graphene is higher than that of the ECA with non-modified
graphene, indicating the importance of stabilizing graphene
inside ECA formulation.
To investigate the effectiveness of the SDS modification of
graphene on enhancing the electrical conductivity and reduc-
ing the total silver content of hybrid ECAs, SDS-modified
small graphene (1.5 wt%) was added into the conventional
formulation of ECAs (denoted as CCAs) as a conductive co-fil-
ler to produce a customized hybrid ECAs (denoted as HCAs).
The effect of SDS on electrical conductivity of ECAs was inves-
tigated by comparing the bulk resistivity of HCAs containing
SDS-modified small graphene (denoted as HCA-SGSs) to that
of HCAs with non-modified graphene (denoted as HCA-
SGNs). The electrical resistivities of both the CCA and the

Fig. 4 – (A) a representative TEM image of a non-modified small graphene; (B) a representative TEM image of SDS-stabilized
small graphene, the black inset is an electron diffraction pattern of the black marked area, the red inset is a HRTEM image of
the red marked area of graphene edge; (C) a representative TEM image of a non-modified large graphene flake; (D) a
representative TEM image of SDS-stabilized large graphene, the red inset is a HRTEM image of the red marked area of
graphene edge, (E) the end-to-end diagonal size of small and large graphenes before and after SDS modification. (A colour
version of this figure can be viewed online.)
194 C A R B O N 9 1 ( 2 0 1 5 ) 1 8 8 – 1 9 9
HCA-SGNs at silver flakes contents less than 30 wt% were
higher than the upper limit of our four-probe electrometer
while a relatively low electrical resistivity of 0.4 X cm was
achieved for HCA-SGSs at 30 wt% silver flakes. As can be seen
in Fig. 6A, the percolation threshold for both the CCAs and
the HCA-SGNs was 40 wt%, although the HCA-SGNs rendered
lower bulk resistivity compared to the conventional ECAs. The
lower bulk resistivity of the HCA-SGNs is because of the bridg-
ing effect of the graphene layers between the silver flakes.
However, for HCA-SGS composites the percolation threshold
was decreased to 10 wt%. This significant reduction in perco-
lation content indicates the effectiveness of SDS to exfoliate
and stabilize the graphene sheet inside the composite. The
SDS modification of graphene provides the opportunity to
fully take advantage of its high aspect-ratio which is crucial
for decreasing the tunnelling resistance by bridging between
separated silver flakes. It should be noted that a low bulk
resistivity of 3 · 10�5 X cm was achieved for the HCA-SGS
with 80 wt% silver flakes and 1.5 wt% SDS-modified graphene,
showing one order of magnitude electrical conductivity
improvement compared to CCA with the same silver flakes
content.
Although we showed that the SDS-modified graphene
improves the electrical conductivity of the hybrid ECAs,
exceeding the optimal nanofiller concentration may hinder
its positive performance. Hence, to investigate the effect of

Fig. 5 – The Raman spectra of small graphene before and
after SDS treatment. (A colour version of this figure can be
viewed online.)
1.00E-05
1.00E-03
1.00E-01
1.00E+01
1.00E+03
1.00E+05
1.00E+07
1.00E+09
0 10 20 30 40 50 60 70 80 90
Bulk
resi
s�vi
ty (Ω
.cm
)
Silver content (wt%)
CCAs HCA-SGSs HCA-SGNs
1.00E-05
1.00E-04
1.00E-03
1.00E-02
1.00E-01
0 0.5 1 1.5 2
Bul
k re
sis�
vity
(Ω
.cm
)
Graphene weight frac�on (wt%)
50 wt% silver flakes
60 wt% silver flakes
70 wt% silver flakes
80 wt% silver flakes
60 wt% silver flakes (without SDS)
80 wt% silver flakes (without SDS)
A
B
Graphene content (wt%) = 1.5
Fig. 6 – (A) Bulk resistivity of conventional ECAs (CCAs),
hybrid ECAs with non-modified small graphene (HCA-
SGNs), and hybrid ECAs with SDS-modified small graphene
(HCA-SGSs), (B) the effect of SDS-modified small graphene
concentration on the bulk resistivity of hybrid ECAs with
different silver contents. (A colour version of this figure can
be viewed online.)
Fig. 7 – The effect of the size of graphene on the electrical
conductivity of ECAs. (A colour version of this figure can be
viewed online.)
C A R B O N 9 1 ( 2 0 1 5 ) 1 8 8 – 1 9 9 195
graphene concentration on the electrical conductivity of
hybrid ECAs, SDS-modified graphene of varying concentra-
tions were added into the CCAs and the bulk resistivity of
the HCA-SGSs were measured. The same ranges of graphene
concentrations were applied for CCAs with different silver
concentrations to identify the optimal graphene content at
each silver concentration (see Fig. 6B). The optimum gra-
phene content was 1 wt% for the HCA-SGSs with 50 and
60 wt% of silver flakes while that concentration was 1.5 wt%
for the HCA-SGSs with 70 and 80 wt% of silver flakes, indicat-
ing the importance of the weight ratio between silver micro
flakes and graphene nanosheets on the electrical perfor-
mance of HCAs. The increased bulk resistivity of the HCA-
SGSs after the optimum concentration may attribute to the
agglomeration of graphene at higher concentration. The
dashed lines of Fig. 6B show the bulk resistivity of the HCA-
SGNs at 60 and 80 wt% of silver flakes. The higher bulk resis-
tivity of these samples compared to the HCA-SGSs with the
same filler content is in agreement with our previous discus-
sion on the positive effect of SDS treatment on the electrical
conductivity of ECAs.
We demonstrated that the graphene with a proper surface
functionality is a promising nanofiller to reduce the amount
of silver flakes because of its high aspect-ratio. To shed fur-
ther light on the relative significances of the graphene size
(or aspect-ratio) and the surface functionality, another set of
hybrid ECAs were produced using large graphene (3–5 lm in
diameter) in contrast to the small graphene (1 lm in diame-
ter), either unmodified or modified with SDS (HCA-LGN and
HCA-LGS, respectively). Fig. 7 presents the bulk resistivity of
these, in comparison with those of HCA-SGSs with compara-
ble silver contents. As can be observed in Fig. 7, the bulk resis-
tivity of the HCA-LGSs is noticeably lower than that of the
HCA-SGSs, especially at low silver concentrations, when the
silver flakes would be separated and rarely in direct contact.
This demonstrates that when either are well distributed by
SDS modification, the large graphene sheets are better able
to bridge the gaps between the silver flakes than the small
graphene sheets, allowing further reductions in silver con-
tent. Addition of 1.5 wt% of large SDS-modified graphene into
CCAs with 10 wt%, 20 wt%, and 30 wt% led to bulk resistivities
196 C A R B O N 9 1 ( 2 0 1 5 ) 1 8 8 – 1 9 9
of 35 X cm, 0.5 X cm, and 7.6 · 10�3 X cm, respectively, while
those resistivities for the HCA-SGSs were 5.5 · 103 X cm,
122 X cm, and 0.4 X cm, respectively. Fig. 7 also confirms the
effectiveness of SDS in improving the electrical conductivity
of the hybrid ECAs. Although the bulk resistivity of the
HCA-LGNs was lower than that of the CCAs in all the silver
content, those resistivity values were higher than those of
HCA-LGSs. It should be noted that a highly conductive ECA
with a very low electrical resistivity of 1.6 · 10�5 X cm was
prepared by adding 1.5 wt% of SDS-modified large graphene
into the CCA with 80 wt% of silver flakes. This bulk resistivity
is even lower than that of eutectic lead-based solders [40].
Fig. 6 also shows that the electrical resistivity of HCA-LGNs
is higher than that of HCA-SGSs in all the silver contents,
indicating that the SDS modification effect might be more
dominant in electrical conductivity improvement of ECAs
than the effect of the aspect-ratio of conductive fillers.
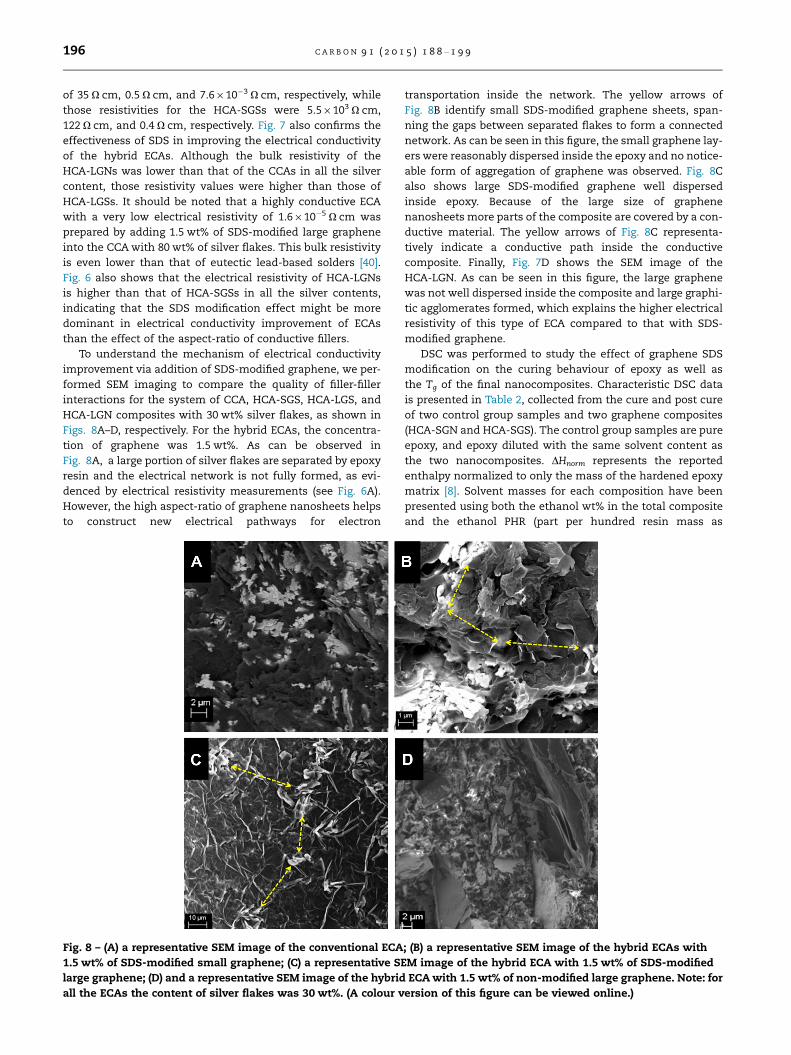
To understand the mechanism of electrical conductivity
improvement via addition of SDS-modified graphene, we per-
formed SEM imaging to compare the quality of filler-filler
interactions for the system of CCA, HCA-SGS, HCA-LGS, and
HCA-LGN composites with 30 wt% silver flakes, as shown in
Figs. 8A–D, respectively. For the hybrid ECAs, the concentra-
tion of graphene was 1.5 wt%. As can be observed in
Fig. 8A, a large portion of silver flakes are separated by epoxy
resin and the electrical network is not fully formed, as evi-
denced by electrical resistivity measurements (see Fig. 6A).
However, the high aspect-ratio of graphene nanosheets helps
to construct new electrical pathways for electron
Fig. 8 – (A) a representative SEM image of the conventional ECA
1.5 wt% of SDS-modified small graphene; (C) a representative S
large graphene; (D) and a representative SEM image of the hybrid
all the ECAs the content of silver flakes was 30 wt%. (A colour v
transportation inside the network. The yellow arrows of
Fig. 8B identify small SDS-modified graphene sheets, span-
ning the gaps between separated flakes to form a connected
network. As can be seen in this figure, the small graphene lay-
ers were reasonably dispersed inside the epoxy and no notice-
able form of aggregation of graphene was observed. Fig. 8C
also shows large SDS-modified graphene well dispersed
inside epoxy. Because of the large size of graphene
nanosheets more parts of the composite are covered by a con-
ductive material. The yellow arrows of Fig. 8C representa-
tively indicate a conductive path inside the conductive
composite. Finally, Fig. 7D shows the SEM image of the
HCA-LGN. As can be seen in this figure, the large graphene
was not well dispersed inside the composite and large graphi-
tic agglomerates formed, which explains the higher electrical
resistivity of this type of ECA compared to that with SDS-
modified graphene.
DSC was performed to study the effect of graphene SDS
modification on the curing behaviour of epoxy as well as
the Tg of the final nanocomposites. Characteristic DSC data
is presented in Table 2, collected from the cure and post cure
of two control group samples and two graphene composites
(HCA-SGN and HCA-SGS). The control group samples are pure
epoxy, and epoxy diluted with the same solvent content as
the two nanocomposites. DHnorm represents the reported
enthalpy normalized to only the mass of the hardened epoxy
matrix [8]. Solvent masses for each composition have been
presented using both the ethanol wt% in the total composite
and the ethanol PHR (part per hundred resin mass as
; (B) a representative SEM image of the hybrid ECAs with
EM image of the hybrid ECA with 1.5 wt% of SDS-modified
ECA with 1.5 wt% of non-modified large graphene. Note: for
ersion of this figure can be viewed online.)

-0.1
-0.08
-0.06
-0.04
-0.02
0
0.02
0.04
0.06
0.08
0.1
-15 5 25 45 65 85 105 125 145
Hea
t Flo
w (W
/g)
Temperature (°C)
72.99 °C
35.54 °C148.3 J/g
0.65
0.7
0.75
0.8
0.85
0.9
0.95
75 80 85 90 95 100 105 110 115 120 125 130 135 140
Rev
Cp
(J/g
)
Temperature (°C)
Cp Tg Analysis
Tg : 111.9 °C
103.95 °C
103.95 °C
A
B
Fig. 9 – DSC data for HCA-SGS, demonstrating methods by
which characteristic data was determined for (A) composite
cure from heat flow and (B) composite Tg from Reversing Cp.
Each trace was performed at 3 �C/min underlying heating
rate. Modulation of ±0.477 �C every 60 s used in (B) only. (A
colour version of this figure can be viewed online.)
0
0.2
0.4
0.6
0.8
1
1.2
50 150 250 350
Wei
ght r
a�o
Temp
Fig. 10 – The TGA results for pure SDS, pure epoxy, the convent
hybrid ECA with SDS-modified graphene. (A colour version of th
C A R B O N 9 1 ( 2 0 1 5 ) 1 8 8 – 1 9 9 197
reference), referencing the amount of ethanol present after
degassing and at the start of curing. DSC traces for cure and
post cure of HCA-SGS are presented in Fig. 9A and B, respec-
tively, as examples to demonstrate the means by which the
characteristic data was obtained. From the data of both con-
trol groups in Table 2, we see that the addition of ethanol
reduced DHtot, and reduced Tg1 by 12 �C, indicating a reduc-
tion in epoxy crosslinking. This may be partially due to the
typical dilution effects of solvents during the curing stage
[34]. However, contrasting the reduced DHtot, the increase in
DHnorm implies that the ethanol also reduced the crosslinking
by taking part in the matrix cure reaction and competing with
the main stoichiometric epoxy/TETA reaction.
From the composite containing silver flake and graphene
without SDS (HCA-SGN) in Table 2, we can see that the addi-
tion of filler substantially reduces DHnorm compared to that of
the representative ethanol diluted epoxy control. In addition,
the Tg1 was reduced by 5 �C by the addition of filler. Since it is
known that silver microflake has no significant effect on Tg1
[34], it appears that the addition of graphene produced both of
these effects. Comparing the data for composites HCA-SGN
and HCA-SGS from Table 2, where the only difference is the
modification of graphene by SDS, we see no change in Tg1.
However, the addition of SDS-modified graphene does not
reduce the DHnorm as much as the addition of untreated gra-
phene did. The reduction of DHnorm may be partly due to the
moiety of oxygen functionality on graphene surfaces (i.e.,
C@O characteristic peak of carboxylic group at 1740 cm�1 in
Fig. 3) acting catalytically on the reactions of epoxides and
amines, or the reaction of epoxides and hydroxyls (from etha-
nol and the epoxy autocatalytic reaction) as discussed by
others [41–44]. These would lead to an unaccounted fraction
of the total reaction heat being released before the sample
is placed in the DSC, reducing the reported DHnorm. However,
in the case of HCA-SGS, SDS would have covered a large frac-
tion of the graphene surface, reducing the ability of graphene
to act as a catalyst. This would slow the unintended reactions
of the composite before it enters the DSC, increasing the frac-
tion of enthalpy captured. However, further investigations are
450 550 650 750
erature (°C)
SDS
Epoxy
CCA
HCA-SGNs
HCA-SGS
ional ECA, hybrid ECA with non-modified graphene, and
is figure can be viewed online.)

198 C A R B O N 9 1 ( 2 0 1 5 ) 1 8 8 – 1 9 9
needed to clarify the exact mechanism by which the gra-
phene and the SDS influence the reaction enthalpy.
TGA was used to characterize the thermal stability of the
ECA composites. The experiment was performed for pure
epoxy, pure SDS, CCA, HCA-SGN, and HCA-SGS. For all the
composites, the concentration of silver flakes was 60 wt%
and for the hybrid ECAs the graphene content was 1.5 wt%.
As the TGA results show that pure epoxy decomposition
started slowly around 300 �C, then greatly accelerated at
around 325 �C (see Fig. 10). The pure SDS degraded at a much
lower temperature of 200 �C. HCA-SGNs began its decomposi-
tion rapidly at approximately 325 �C, demonstrating a small
but noticeable reinforcement effect from the presence of the
graphene surface. HCA-SGS has a relatively lower decomposi-
tion temperature than the HCA-SGNs, perhaps because of the
SDS layer between the graphene and epoxy that may weaken
the reinforcement effect of graphene surface. It was noted
that HCA-SGS had 12 wt% more residue after TGA degrada-
tion than the SDS-free CCA and HCA-SGN composites. This
is consistent with results reported by Wang et al.; they stud-
ied composites of epoxy and SDS and observed an increase
in residual wt% in the SDS-containing epoxy [45]. It is possibly
due to the formation of SO2 or a sulfonate, during SDS degra-
dation, which would then be available to promote formation
of stable char [46,47]
4. Conclusions
Graphene nanosheets with two different sizes (1 lm and 3–
5 lm) were stabilizedwith SDS and introduced into the conven-
tional formulation of ECAs; the effect of the graphene surface
modification and its size on the electrical conductivity of
ECAs was investigated. FTIR results confirmed the adsorption
of SDS on graphene surface. TEM imaging confirmed the effec-
tiveness of SDS on exfoliation of graphene nanosheets. The
SDS modification of graphene decreased the percolation
threshold of silver content from 40 wt% to the interestingly
low value of 10 wt% while the percolation value did not change
for the hybrid ECA with non-modified graphene. The electrical
conductivity measurements also showed that the larger gra-
phene is more effective in improving the electrical conductivity
of ECAs and reducing the amount silver flakes than the small
graphene. The bulk resistivity of HCA-LGS with 10 wt% silver
flakes and 1.5 wt% graphene was 35 X cm while the bulk resis-
tivity for the HCA-SGS with the same filler composition was
5.5 · 103 X cm. TGA and DSC experiments were performed to
explore the possible effect of the SDS modification of graphene
on the thermal properties of ECAs. According to DSC results,
additions of both SDS-modified and unmodified graphene
reduced the crosslinking of the epoxy matrix based on the
reduction in Tg compared to an appropriate control group.
The TGA results showed a small but noticeable reinforcement
effect from the presence of the graphene surface; the SDS mod-
ification weakened this reinforcement effect.
Acknowledgements
This work was supported by a Strategic Project Grant from the
Natural Sciences and Engineering Research Council of Canada
(NSERC) and a Voucher for Innovation and Productivity Grant
from the Ontario Centres of Excellence (OCE), Canada. We
thank Mr. Andreas Korinek from Canadian Center for
Electron Microscopy, McMaster University for help with TEM
observation.
Appendix A. Supplementary data
Supplementary data associated with this article can be found,
in the online version, at http://dx.doi.org/10.1016/j.carbon.
2015.04.039.
R E F E R E N C E S
[1] Zhang R, Lin W, Moon K, Wong CP. Fast preparation ofprintable highly conductive polymer nanocomposites bythermal decomposition of silver carboxylate and sintering ofsilver nanoparticles. ACS Appl Mater Interfaces2010;2:2637–45.
[2] Wang SJ, Geng Y, Zheng Q, Kim J-K. Fabrication of highlyconducting and transparent graphene films. Carbon N Y2010;48:1815–23.
[3] Li Z, Zhang R, Moon KS, Liu Y, Hansen K, Le T, et al. Highlyconductive, flexible, polyurethane-based adhesives forflexible and printed electronics. Adv Funct Mater2013;23:1459–65.
[4] Li Y, Moon K, Wong CP. Electronics without lead. Science2005;308:1419–20.
[5] Meschi Amoli B, Gumfekar S, Hu A, Zhou YN, Zhao B.Thiocarboxylate functionalization of silver nanoparticles:effect of chain length on the electrical conductivity ofnanoparticles and their polymer composites. J Mater Chem2012;22:20048–56.
[6] Jiang H, Moon K, Li Y, Wong CP. Surface functionalized silvernanoparticles for ultrahigh conductive polymer composites.Chem Mater 2006;18:2969–73.
[7] Jeong W, Nishikawa H, Itou D, Takemoto T. Electricalcharacteristics of a new class of conductive adhesive. MaterTrans 2005;46:2276–81.
[8] Jiang H, Moon K, Lu J. Conductivity enhancement of nanosilver-filled conductive adhesives by particle surfacefunctionalization. J Electron Mater 2005;34:1432–9.
[9] Meschi Amoli B, Marzbanrad E, Hu A, Zhou YN, Zhao B.Electrical conductive adhesives enhanced with high-aspect-ratio silver nanobelts. Macromol Mater Eng 2014;299:739–47.
[10] Zhang R, Moon K, Lin W, Agar JC, Wong CP. A simple, low-costapproach to prepare flexible highly conductive polymercomposites by in situ reduction of silver carboxylate forflexible electronic applications. Compos Sci Technol2011;71:528–34.
[11] Long Y, Wu J, Wang H, Zhang X, Zhao N, Xu J. Rapid sinteringof silver nanoparticles in an electrolyte solution at roomtemperature and its application to fabricate conductive silverfilms using polydopamine as adhesive layers. J Mater Chem2011;21:4875–81.
[12] Oh Y, Chun KY, Lee E, Kim YJ, Baik S. Functionalized nano-silver particles assembled on one-dimensional nanotubescaffolds for ultra-highly conductive silver/polymercomposites. J Mater Chem 2010;20:3579–82.
[13] Luan VH, Tien HN, Cuong TV, Kong B, Chung JS, Kim EJ, et al.Novel conductive epoxy composites composed of 2-Dchemically reduced graphene and 1-D silver nanowire hybridfillers. J Mater Chem 2012;22:8649.

C A R B O N 9 1 ( 2 0 1 5 ) 1 8 8 – 1 9 9 199
[14] Wu HP, Liu JF, Wu XJ, Ge MY, Wang YW, Zhang GQ, et al. Highconductivity of isotropic conductive adhesives filled withsilver nanowires. Int J Adhes Adhes 2006;26:617–21.
[15] Chun KY, Oh Y, Rho J, Ahn JH, Kim YJ, Choi HR, et al. Highlyconductive, printable and stretchable composite films ofcarbon nanotubes and silver. Nat Nanotechnol 2010;5:853–7.
[16] Ma R, Kwon S, Zheng Q, Kwon HY, Kim JIL, Choi HR, et al.Carbon-nanotube/silver networks in nitrile butadiene rubberfor highly conductive flexible adhesives. Adv Mater2012;24:3344–9.
[17] Stankovich S, Dikin Da, Dommett GHB, Kohlhaas KM, ZimneyEJ, Stach Ea, et al. Graphene-based composite materials.Nature 2006;442:282–6.
[18] Loh KP, Bao Q, Ang PK, Yang J. The chemistry of graphene. JMater Chem 2010;20:2277–89.
[19] Georgakilas V, Otyepka M, Bourlinos AB, Chandra V, Kim N,Kemp KC, et al. Functionalization of graphene: covalent andnon-covalent approaches, derivatives and applications.Chem Rev 2012;112:6156–214.
[20] Liu K, Liu L, Luo Y, Jia D. One-step synthesis of metalnanoparticle decorated graphene by liquid phase exfoliation.J Mater Chem 2012;22:20342–52.
[21] Pu NW, Peng YY, Wang PC, Chen CY, Shi JN, Liu Y-M, et al.Application of nitrogen-doped graphene nanosheets inelectrically conductive adhesives. Carbon N Y 2014;67:449–56.
[22] Bao C, Guo Y, Song L, Kan Y, Qian X, Hu Y. In situ preparationof functionalized graphene oxide/epoxy nanocompositeswith effective reinforcements. J Mater Chem 2011;21:13290–8.
[23] Kim H, Miura Y, Macosko CW. Graphene/polyurethanenanocomposites for improved gas barrier and electricalconductivity. Chem Mater 2010;22:3441–50.
[24] Kim J, Yim B, Kim J, Kim J. The effects of functionalizedgraphene nanosheets on the thermal and mechanicalproperties of epoxy composites for anisotropic conductiveadhesives (ACAs). Microelectron Reliab 2012;52:595–602.
[25] Tkalya EE, Ghislandi M, de With G, Koning CE. The use ofsurfactants for dispersing carbon nanotubes and graphene tomake conductive nanocomposites. Curr Opin ColloidInterface Sci 2012;17:225–32.
[26] Pasricha R, Gupta S, Srivastava AK. A facile and novelsynthesis of Ag-graphene-based nanocomposites. Small2009;5:2253–9.
[27] Liu K, Chen S, Luo Y, Jia D, Gao H, Hu G, et al. Edge-functionalized graphene as reinforcement of epoxy-basedconductive composite for electrical interconnects. ComposSci Technol 2013;88:84–91.
[28] Peng X, Tan F, Wang W, Qiu X, Sun F, Qiao X, et al.Conductivity improvement of silver flakes filled electricalconductive adhesives via introducing silver–graphenenanocomposites. J Mater Sci Mater Electron 2014;25:1149–55.
[29] Meschi Amoli B, Trinidad J, Hu A, Zhou YN, Zhao B. Highlyelectrically conductive adhesives using silver nanoparticle(Ag NP)-decorated graphene: the effect of NPs sintering onthe electrical conductivity improvement. J Mater Sci MaterElectron 2015;26:590–600.
[30] Lotya M, King PJ, Khan U, De S, Coleman JN. High-concentration, surfactant-stabilized graphene dispersions.ACS Nano 2010;4:3155–62.
[31] Si Y, Samulski ET. Synthesis of water soluble graphene. NanoLett 2008;8:1679–82.
[32] Yu A, Roes I, Davies A, Chen Z. Ultrathin, transparent, andflexible graphene films for supercapacitor application. ApplPhys Lett 2010;96:253105.
[33] Davies A, Audette P, Farrow B, Hassan F, Chen Z, Choi J-Y,et al. Graphene-based flexible supercapacitors: pulse-electropolymerization of polypyrrole on free-standinggraphene films. J Phys Chem C 2011;115:17612–20.
[34] Rivers G, Rogalsky A, Lee-Sullivan P, Zhao B. Thermal analysisof epoxy-based nanocomposites: have solvent effects beenoverlooked? J Therm Anal Calorim 2015;119. 797-05.
[35] Marcano DC, Kosynkin DV, Berlin JM, Sinitskii A, Sun Z,Slesarev A, et al. Improved synthesis of graphene oxide. ACSNano 2010;4:4806–14.
[36] Wojtoniszak M, Roginska D, Machalinski B, Drozdzik M,Mijowska E. Graphene oxide functionalized with methyleneblue and its performance in singlet oxygen generation. MaterRes Bull 2013;48:2636–9.
[37] Viana RB, da Silva ABF, Pimentel AS. Infrared spectroscopy ofanionic, cationic, and zwitterionic surfactants. Adv PhysChem 2012;2012:1–14.
[38] Liu K, Chen S, Luo Y, Jia D, Gao H, Hu G, et al. Noncovalentlyfunctionalized pristine graphene/metal nanoparticle hybridfor conductive composites. Compos Sci Technol 2014;94:1–7.
[39] O’Neill A, Khan U, Nirmalraj PN, Boland J, Coleman JN.Graphene dispersion and exfoliation in low boiling pointsolvents. J Phys Chem C 2011;115:5422–8.
[40] Yang C, Wong CP, Yuen MMF. Printed electrically conductivecomposites: conductive filler designs and surfaceengineering. J Mater Chem C 2013;1:4052–69.
[41] Qiu SL, Wang CS, Wang YT, Liu CG, Chen XY, Xie HF, et al.Effects of graphene oxides on the cure behaviors of atetrafunctional epoxy resin. Express Polym Lett2011;5:809–18.
[42] Boukhvalov DW, Dreyer DR, Bielawski CW, Son YW. Acomputational investigation of the catalytic properties ofgraphene oxide: exploring mechanisms by using DFTmethods. ChemCatChem 2012;4:1844–9.
[43] Parker RE, Isaacs NS. Mechanisms of epoxide reactions.Chem Rev 1959;59:737–99.
[44] Yang H, Shan C, Li F, Zhang Q, Han D, Niu L. Convenientpreparation of tunably loaded chemically convertedgraphene oxide/epoxy resin nanocomposites from grapheneoxide sheets through two-phase extraction. J Mater Chem2009;19:8856.
[45] Wang W, Lu H, Liu Y, Leng J. Sodium dodecyl sulfate/epoxycomposite: water-induced shape memory effect and itsmechanism. J Mater Chem A 2014;2:5441.
[46] Patterson JM, Kortylewicz Z, Smith WT. Thermal degradationof sodium dodecyl sulfate. J Agric Food Chem 1984;32:782–4.
[47] Chiu YC, Chou IC, Tseng WC, Ma CCM. Preparation andthermal properties of diglycidylether sulfone epoxy. PolymDegrad Stab 2008;93:668–76.