Embed Size (px)
Citation preview
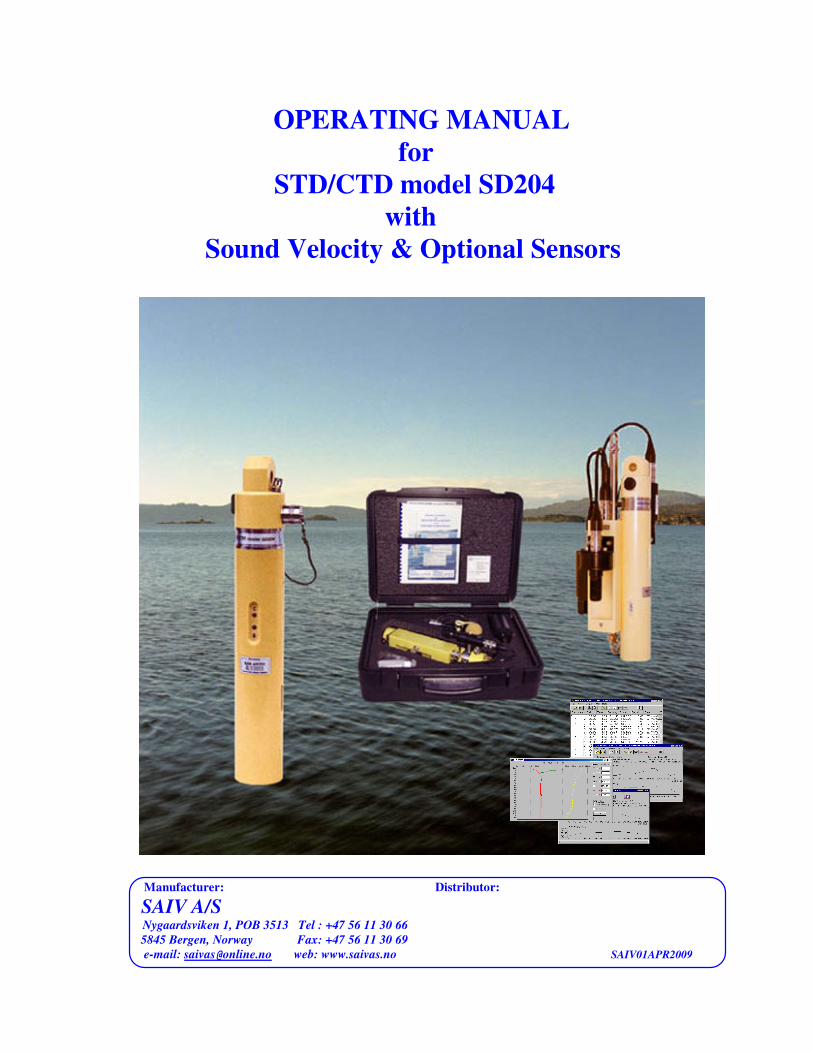
OPERATING MANUAL
for
STD/CTD model SD204
with
Sound Velocity & Optional Sensors
Manufacturer: Distributor: SAIV A/S Nygaardsviken 1, POB 3513 Tel : +47 56 11 30 66 5845 Bergen, Norway Fax: +47 56 11 30 69
e-mail: [email protected] web: www.saivas.no SAIV01APR2009
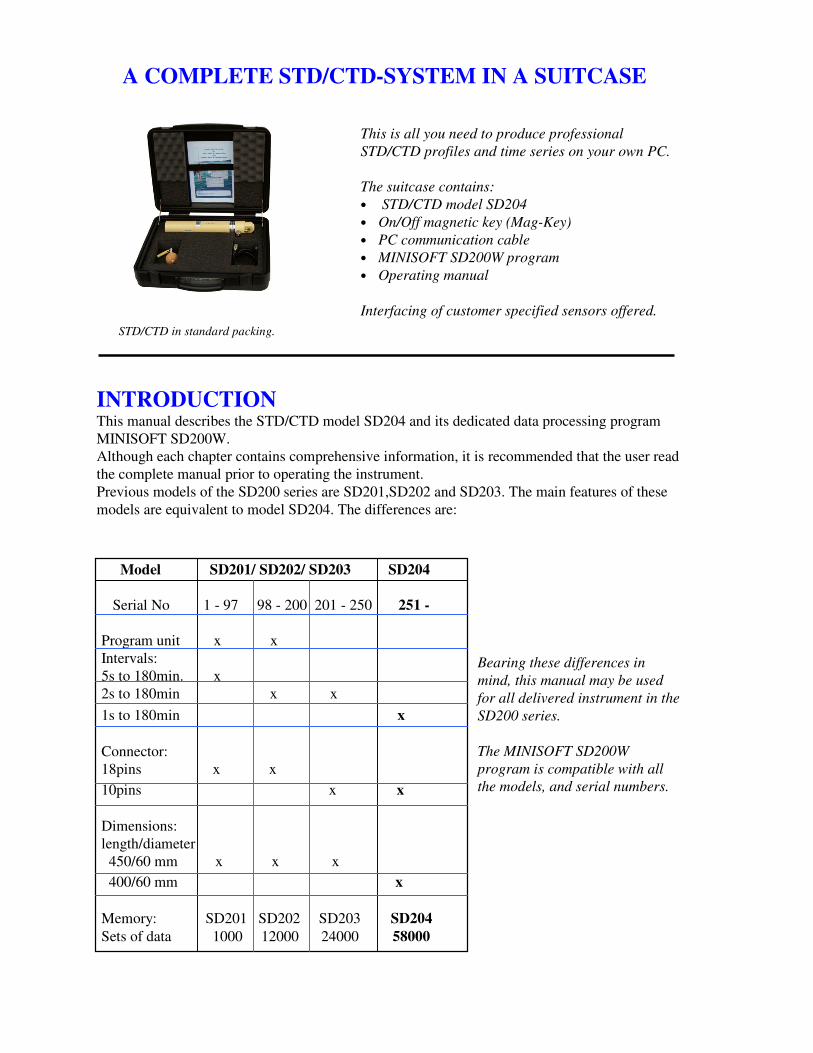
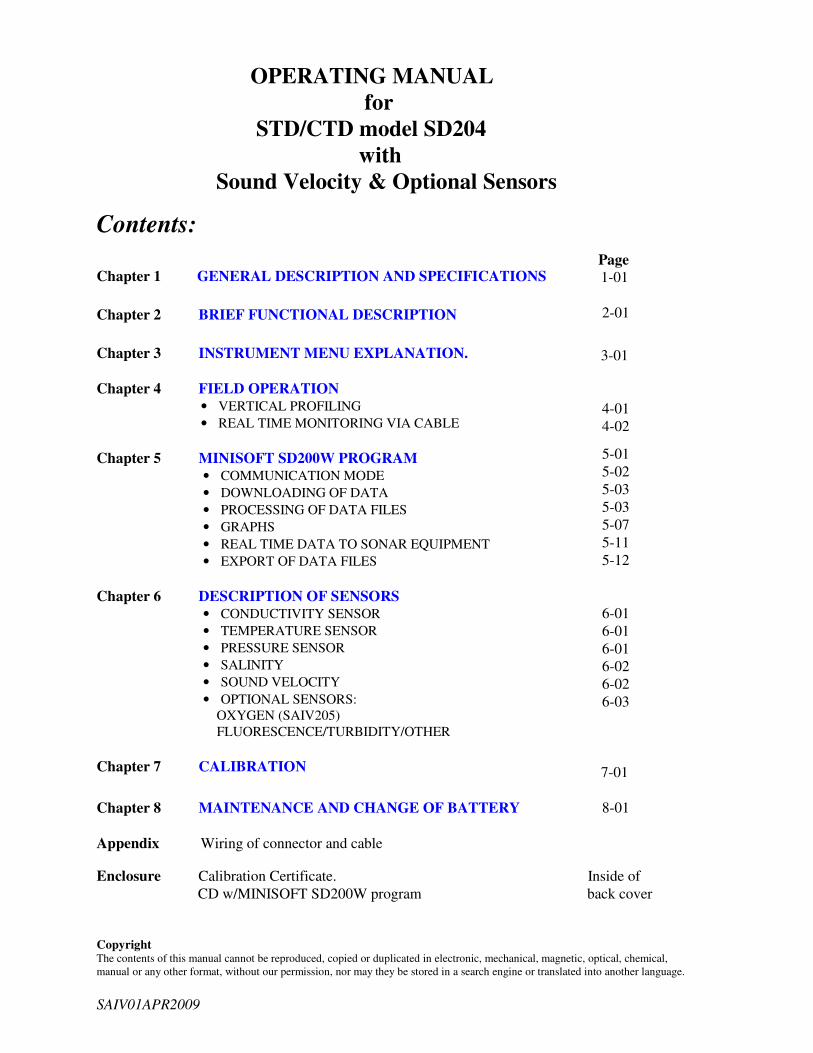
A COMPLETE STD/CTD-SYSTEM IN A SUITCASE
STD/CTD in standard packing.
INTRODUCTION This manual describes the STD/CTD model SD204 and its dedicated data processing program
MINISOFT SD200W.
Although each chapter contains comprehensive information, it is recommended that the user read
the complete manual prior to operating the instrument.
Previous models of the SD200 series are SD201,SD202 and SD203. The main features of these
models are equivalent to model SD204. The differences are:
This is all you need to produce professional
STD/CTD profiles and time series on your own PC.
The suitcase contains:
• STD/CTD model SD204
• On/Off magnetic key (Mag-Key)
• PC communication cable
• MINISOFT SD200W program
• Operating manual
Interfacing of customer specified sensors offered.
Model SD201/ SD202/ SD203 SD204
Serial No 1 - 97 98 - 200 201 - 250 251 -
Program unit x x
Intervals:
5s to 180min. x
2s to 180min x x
1s to 180min x
Connector:
18pins x x
10pins x x
Dimensions:
length/diameter
450/60 mm x x x
400/60 mm x
Memory: SD201 SD202 SD203 SD204
Sets of data 1000 12000 24000 58000
Bearing these differences in
mind, this manual may be used
for all delivered instrument in the
SD200 series.
The MINISOFT SD200W
program is compatible with all
the models, and serial numbers.
OPERATING MANUAL
for
STD/CTD model SD204 with
Sound Velocity & Optional Sensors
Contents:
Chapter 1 GENERAL DESCRIPTION AND SPECIFICATIONS
Chapter 2 BRIEF FUNCTIONAL DESCRIPTION
Chapter 3 INSTRUMENT MENU EXPLANATION.
Chapter 4 FIELD OPERATION
• VERTICAL PROFILING
• REAL TIME MONITORING VIA CABLE
Chapter 5 MINISOFT SD200W PROGRAM • COMMUNICATION MODE
• DOWNLOADING OF DATA
• PROCESSING OF DATA FILES
• GRAPHS
• REAL TIME DATA TO SONAR EQUIPMENT
• EXPORT OF DATA FILES
Chapter 6 DESCRIPTION OF SENSORS • CONDUCTIVITY SENSOR
• TEMPERATURE SENSOR
• PRESSURE SENSOR
• SALINITY
• SOUND VELOCITY
• OPTIONAL SENSORS:
OXYGEN (SAIV205)
FLUORESCENCE/TURBIDITY/OTHER
Chapter 7 CALIBRATION
Chapter 8 MAINTENANCE AND CHANGE OF BATTERY
Appendix Wiring of connector and cable
Enclosure Calibration Certificate. Inside of
CD w/MINISOFT SD200W program back cover
Copyright The contents of this manual cannot be reproduced, copied or duplicated in electronic, mechanical, magnetic, optical, chemical,
manual or any other format, without our permission, nor may they be stored in a search engine or translated into another language.
SAIV01APR2009
Page
1-01
2-01
3-01
4-01
4-02 5-01
5-02
5-03
5-03
5-07
5-11
5-12
6-01
6-01
6-01
6-02
6-02
6-03
7-01
8-01

Chapter 1 Page 1-01
GENERAL DESCRIPTION AND SPECIFICATIONS
MENU-DRIVEN PROGRAMMING When the SD204 is connected to a PC, the user may read out recorded data, change the measuring
mode or enter calibration mode etc. according to a displayed menu.
Several measuring modes are available as selective combinations of CTD/STD, with/without
sound velocity and/or optional sensors, e.g. oxygen, fluorescence and turbidity.
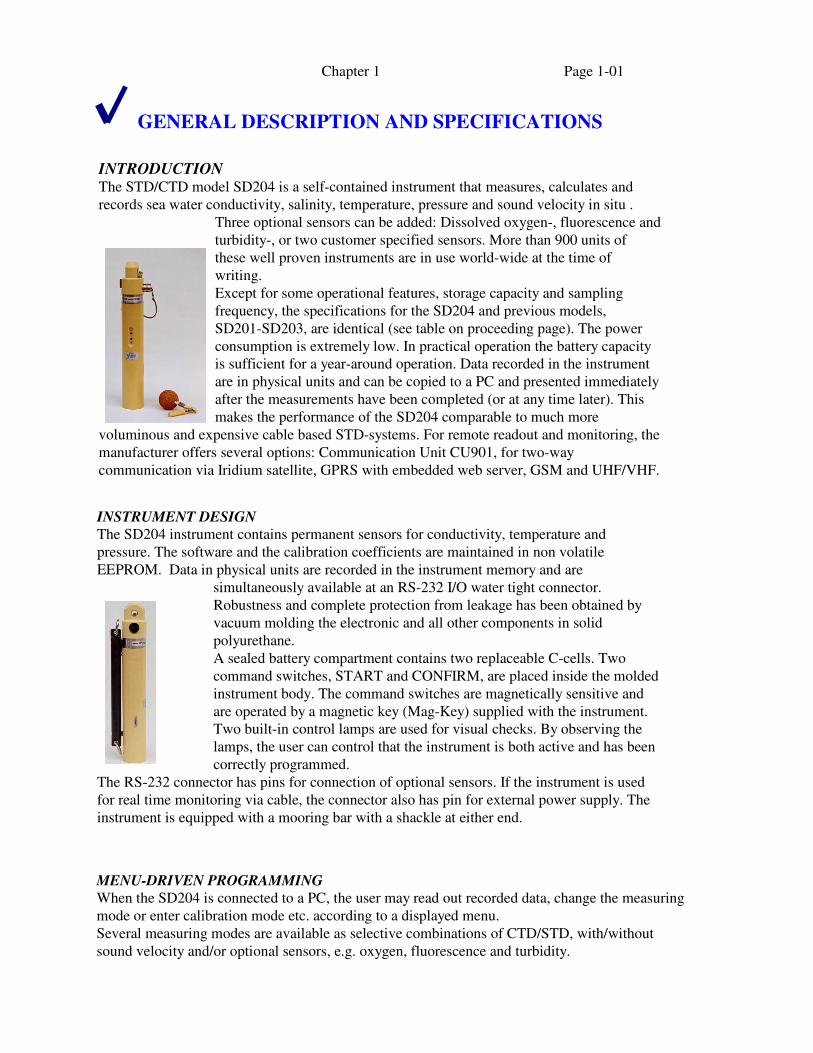
INTRODUCTION The STD/CTD model SD204 is a self-contained instrument that measures, calculates and
records sea water conductivity, salinity, temperature, pressure and sound velocity in situ .
Three optional sensors can be added: Dissolved oxygen-, fluorescence and
turbidity-, or two customer specified sensors. More than 900 units of
these well proven instruments are in use world-wide at the time of
writing.
Except for some operational features, storage capacity and sampling
frequency, the specifications for the SD204 and previous models,
SD201-SD203, are identical (see table on proceeding page). The power
consumption is extremely low. In practical operation the battery capacity
is sufficient for a year-around operation. Data recorded in the instrument
are in physical units and can be copied to a PC and presented immediately
after the measurements have been completed (or at any time later). This
makes the performance of the SD204 comparable to much more
voluminous and expensive cable based STD-systems. For remote readout and monitoring, the
manufacturer offers several options: Communication Unit CU901, for two-way
communication via Iridium satellite, GPRS with embedded web server, GSM and UHF/VHF.
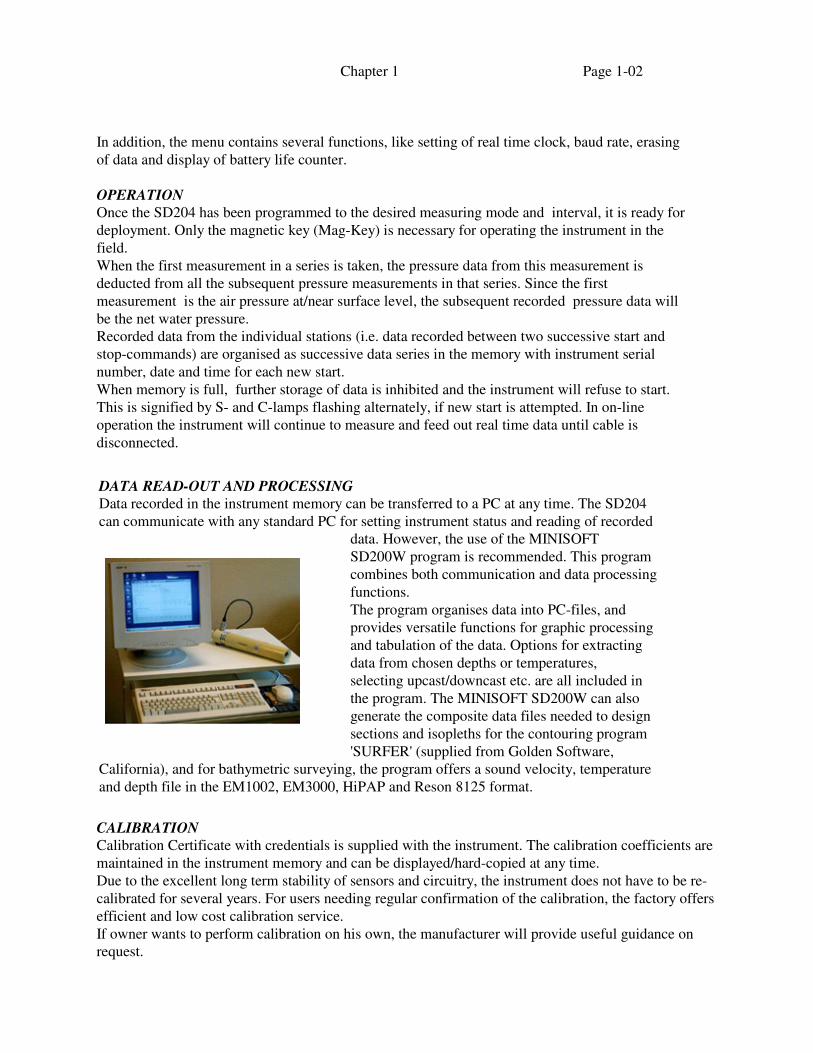
INSTRUMENT DESIGN
The SD204 instrument contains permanent sensors for conductivity, temperature and
pressure. The software and the calibration coefficients are maintained in non volatile
EEPROM. Data in physical units are recorded in the instrument memory and are
simultaneously available at an RS-232 I/O water tight connector.
Robustness and complete protection from leakage has been obtained by
vacuum molding the electronic and all other components in solid
polyurethane.
A sealed battery compartment contains two replaceable C-cells. Two
command switches, START and CONFIRM, are placed inside the molded
instrument body. The command switches are magnetically sensitive and
are operated by a magnetic key (Mag-Key) supplied with the instrument.
Two built-in control lamps are used for visual checks. By observing the
lamps, the user can control that the instrument is both active and has been
correctly programmed.
The RS-232 connector has pins for connection of optional sensors. If the instrument is used
for real time monitoring via cable, the connector also has pin for external power supply. The
instrument is equipped with a mooring bar with a shackle at either end.
Chapter 1 Page 1-02
In addition, the menu contains several functions, like setting of real time clock, baud rate, erasing
of data and display of battery life counter.
OPERATION
Once the SD204 has been programmed to the desired measuring mode and interval, it is ready for
deployment. Only the magnetic key (Mag-Key) is necessary for operating the instrument in the
field.
When the first measurement in a series is taken, the pressure data from this measurement is
deducted from all the subsequent pressure measurements in that series. Since the first
measurement is the air pressure at/near surface level, the subsequent recorded pressure data will
be the net water pressure.
Recorded data from the individual stations (i.e. data recorded between two successive start and
stop-commands) are organised as successive data series in the memory with instrument serial
number, date and time for each new start.
When memory is full, further storage of data is inhibited and the instrument will refuse to start.
This is signified by S- and C-lamps flashing alternately, if new start is attempted. In on-line
operation the instrument will continue to measure and feed out real time data until cable is
disconnected.
CALIBRATION
Calibration Certificate with credentials is supplied with the instrument. The calibration coefficients are
maintained in the instrument memory and can be displayed/hard-copied at any time.
Due to the excellent long term stability of sensors and circuitry, the instrument does not have to be re-
calibrated for several years. For users needing regular confirmation of the calibration, the factory offers
efficient and low cost calibration service.
If owner wants to perform calibration on his own, the manufacturer will provide useful guidance on
request.
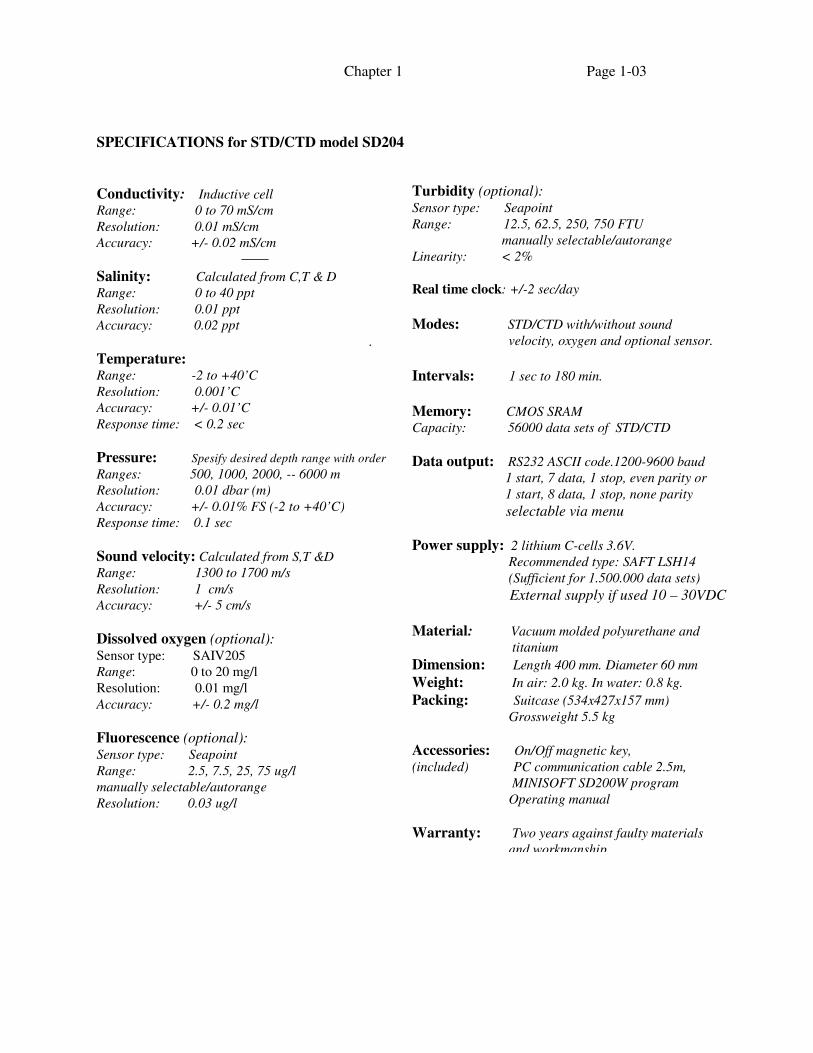
DATA READ-OUT AND PROCESSING
Data recorded in the instrument memory can be transferred to a PC at any time. The SD204
can communicate with any standard PC for setting instrument status and reading of recorded
data. However, the use of the MINISOFT
SD200W program is recommended. This program
combines both communication and data processing
functions.
The program organises data into PC-files, and
provides versatile functions for graphic processing
and tabulation of the data. Options for extracting
data from chosen depths or temperatures,
selecting upcast/downcast etc. are all included in
the program. The MINISOFT SD200W can also
generate the composite data files needed to design
sections and isopleths for the contouring program
'SURFER' (supplied from Golden Software,
California), and for bathymetric surveying, the program offers a sound velocity, temperature
and depth file in the EM1002, EM3000, HiPAP and Reson 8125 format.
Chapter 1 Page 1-03
SPECIFICATIONS for STD/CTD model SD204
Conductivity: Inductive cell
Range: 0 to 70 mS/cm
Resolution: 0.01 mS/cm
Accuracy: +/- 0.02 mS/cm
Salinity: Calculated from C,T & D
Range: 0 to 40 ppt
Resolution: 0.01 ppt
Accuracy: 0.02 ppt
.
Temperature: Range: -2 to +40’C
Resolution: 0.001’C
Accuracy: +/- 0.01’C
Response time: < 0.2 sec
Pressure: Spesify desired depth range with order
Ranges: 500, 1000, 2000, -- 6000 m
Resolution: 0.01 dbar (m)
Accuracy: +/- 0.01% FS (-2 to +40’C)
Response time: 0.1 sec
Sound velocity: Calculated from S,T &D
Range: 1300 to 1700 m/s
Resolution: 1 cm/s
Accuracy: +/- 5 cm/s
Dissolved oxygen (optional): Sensor type: SAIV205
Range: 0 to 20 mg/l
Resolution: 0.01 mg/l Accuracy: +/- 0.2 mg/l
Fluorescence (optional): Sensor type: Seapoint
Range: 2.5, 7.5, 25, 75 ug/l
manually selectable/autorange
Resolution: 0.03 ug/l
Turbidity (optional): Sensor type: Seapoint
Range: 12.5, 62.5, 250, 750 FTU
manually selectable/autorange
Linearity: < 2%
Real time clock: +/-2 sec/day
Modes: STD/CTD with/without sound
velocity, oxygen and optional sensor.
Intervals: 1 sec to 180 min.
Memory: CMOS SRAM
Capacity: 56000 data sets of STD/CTD
Data output: RS232 ASCII code.1200-9600 baud
1 start, 7 data, 1 stop, even parity or
1 start, 8 data, 1 stop, none parity
selectable via menu
Power supply: 2 lithium C-cells 3.6V.
Recommended type: SAFT LSH14
(Sufficient for 1.500.000 data sets)
External supply if used 10 – 30VDC
Material: Vacuum molded polyurethane and
titanium
Dimension: Length 400 mm. Diameter 60 mm
Weight: In air: 2.0 kg. In water: 0.8 kg.
Packing: Suitcase (534x427x157 mm)
Grossweight 5.5 kg
Accessories: On/Off magnetic key,
(included) PC communication cable 2.5m,
MINISOFT SD200W program
Operating manual
Warranty: Two years against faulty materials
and workmanship
Chapter 1 Page 1-04
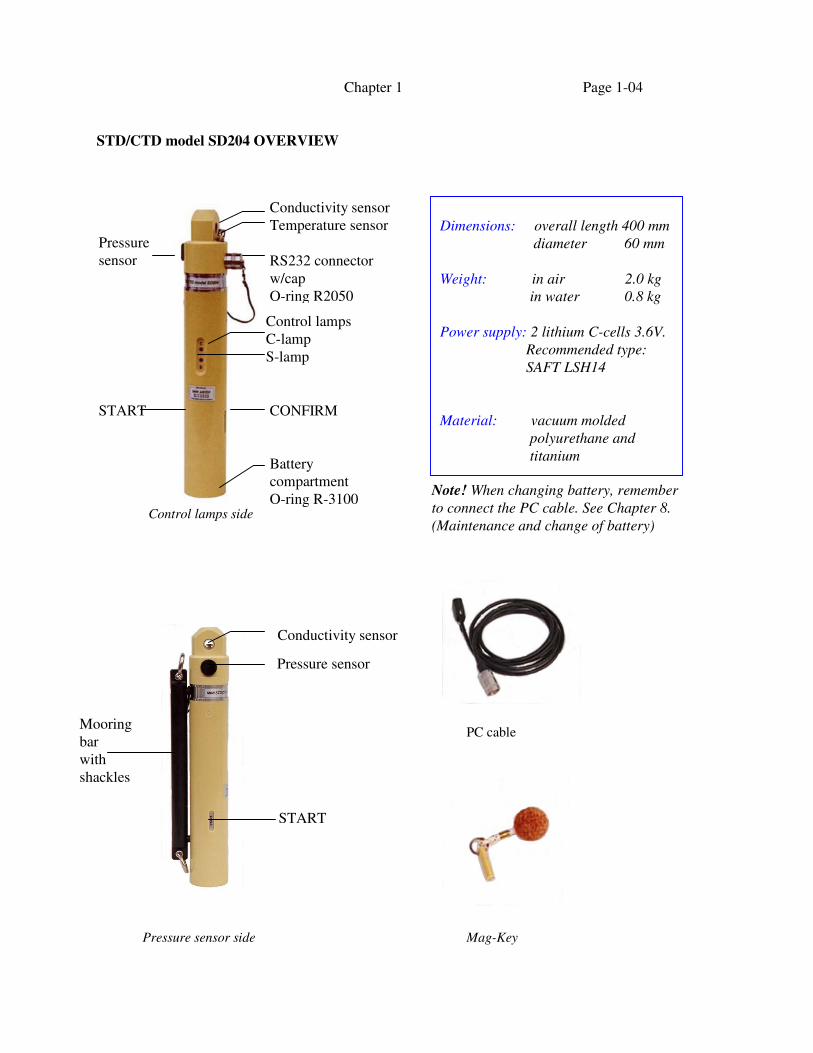
STD/CTD model SD204 OVERVIEW
Control lamps side
Conductivity sensor
Temperature sensor
RS232 connector
w/cap
O-ring R2050
Dimensions: overall length 400 mm
diameter 60 mm
Weight: in air 2.0 kg
in water 0.8 kg
Power supply: 2 lithium C-cells 3.6V.
Recommended type:
SAFT LSH14
Material: vacuum molded
polyurethane and
titanium
CONFIRM
Battery
compartment
O-ring R-3100 Note! When changing battery, remember
to connect the PC cable. See Chapter 8.
(Maintenance and change of battery)
START
Control lamps
C-lamp
S-lamp
START
Pressure sensor
Pressure
sensor
Pressure sensor side Mag-Key
Mooring
bar
with
shackles
Conductivity sensor
PC cable
Chapter 2 Page 2-01
BRIEF FUNCTIONAL DESCRIPTION
• Read/change instrument status
• Start/stop measurements using the Mag-Key
• Memory capacity
• Read recorded data into your PC
• Real time monitoring via cable To take full advantage of this chapter, it is recommended that one is familiar with the content of Chapter
5.
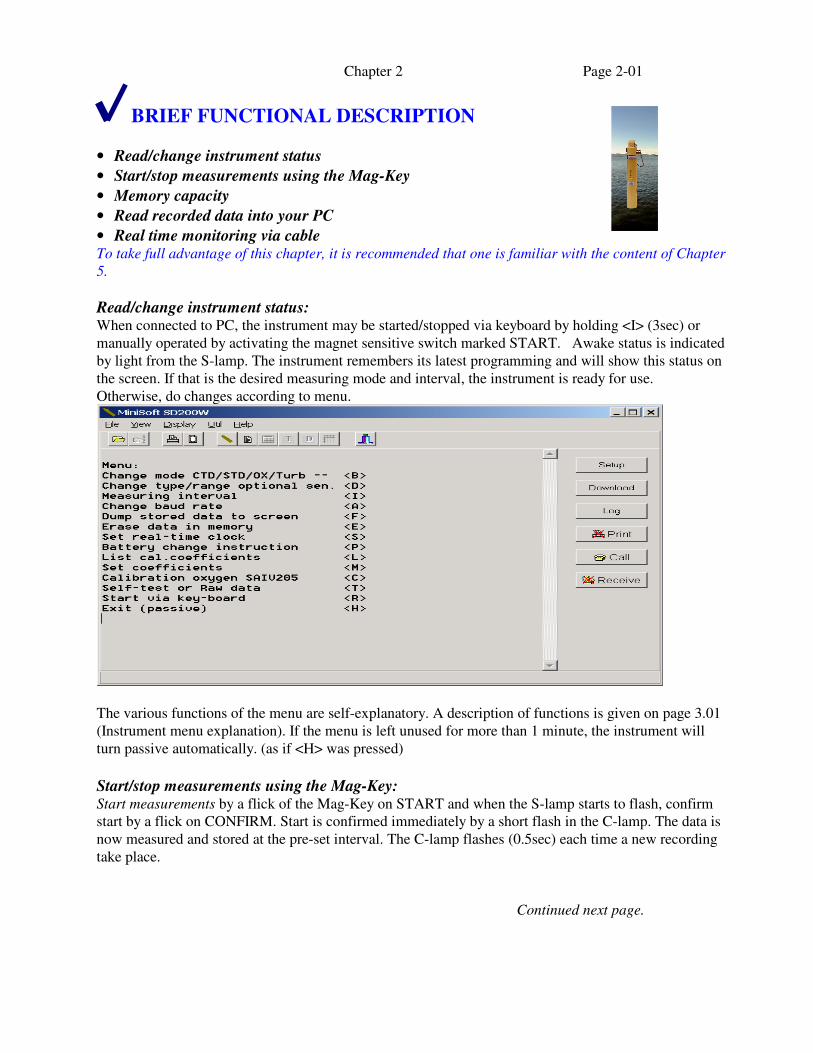
Read/change instrument status: When connected to PC, the instrument may be started/stopped via keyboard by holding <I> (3sec) or
manually operated by activating the magnet sensitive switch marked START. Awake status is indicated
by light from the S-lamp. The instrument remembers its latest programming and will show this status on
the screen. If that is the desired measuring mode and interval, the instrument is ready for use.
Otherwise, do changes according to menu.
The various functions of the menu are self-explanatory. A description of functions is given on page 3.01
(Instrument menu explanation). If the menu is left unused for more than 1 minute, the instrument will
turn passive automatically. (as if <H> was pressed)
Start/stop measurements using the Mag-Key: Start measurements by a flick of the Mag-Key on START and when the S-lamp starts to flash, confirm
start by a flick on CONFIRM. Start is confirmed immediately by a short flash in the C-lamp. The data is
now measured and stored at the pre-set interval. The C-lamp flashes (0.5sec) each time a new recording
take place.
Continued next page.
Chapter 2 Page 2-02
Stop a running series by a flick of the Mag-Key on CONFIRM and then on START.
The C-lamp will flash for a few seconds, after which the SD204 enters passive.
Memory capacity: The storage memory is sufficient for 16 hours of continuos recording of CTD/STD data at 1 second
interval. At longer intervals, multiply by the chosen interval in seconds to find total recording capacity in
hours. F.ex. at interval 5 sec: 16x5 = 80 hours.
When the memory is full, further storage of data is inhibited and the instrument will go to passive. If start is
attempted, S- and C-lamps will flash alternately, signifying that memory is full.
To erase memory see Chapter 3.
Read recorded data into your PC: Click Download. A sub-window appears, and data from the SD204 are downloaded to your computer.
When all recorded data have been received, the program requires a filename. The cursor is already in
correct position. Just write a filename without extension, f.ex. <myfile>, and click ‘OK’. The file will be
stored with the extension .sd2 (<myfile.sd2>).
After the instrument has transferred the data, it returns its menu to the PC screen. Wait until the menu is
complete, then press <H> to switch the SD204 back to passive. Remove the instrument cable.
For detailed information on processing of data see Chapter 5 (MINISOFT SD200W).
Real time monitoring via cable: The SD204 provides on-line data in physical units.
Using STD/CTD mode, on-line output will operate with all baud rates (1200 -9600) at any chosen interval.
At 1 sec interval, using STD/CTD with one extra sensor/parameter, use 4800 or 9600 baud.
Using STD/CTD with more than one extra sensor/parameter, the on-line output will be inhibited at 1
second interval.
For further operating details see Chapter 4.
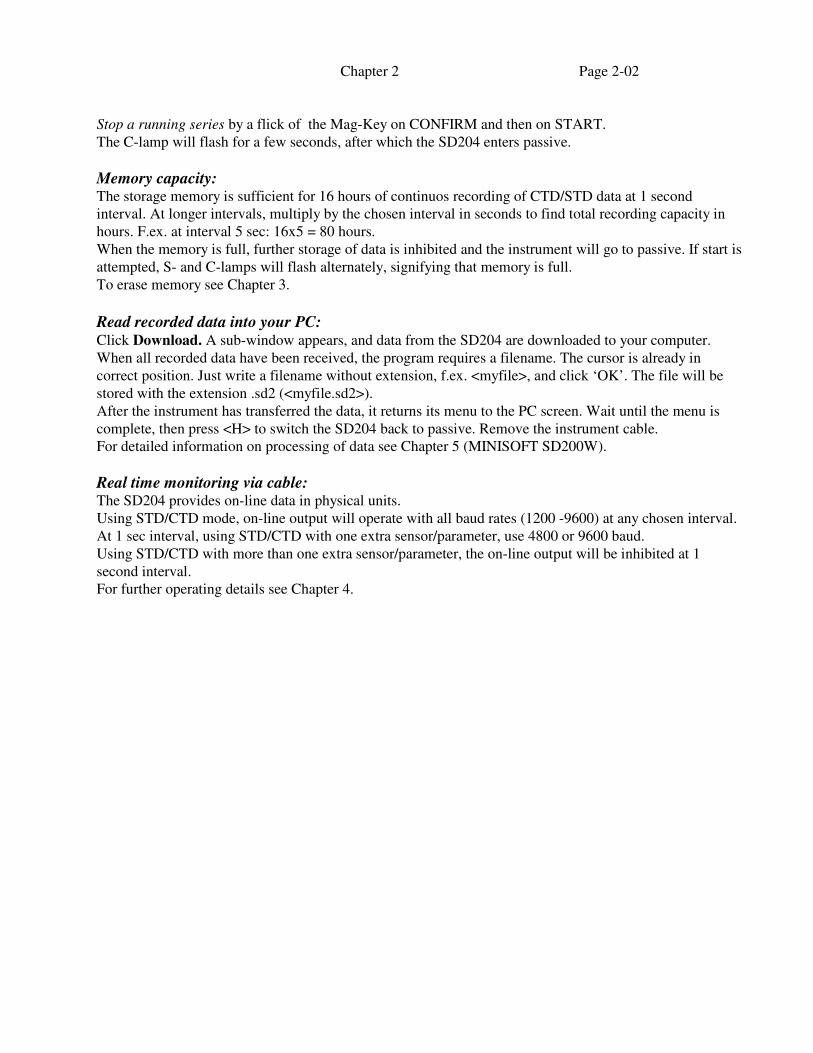
Chapter 3 Page 3-01
INSTRUMENT MENU EXPLANATION
Connect the SD204 to your PC with MINISOFT SD200W installed. Wake up the instrument (hold Mag-
Key on START) and wait 10 seconds. Menu will appear as follows:
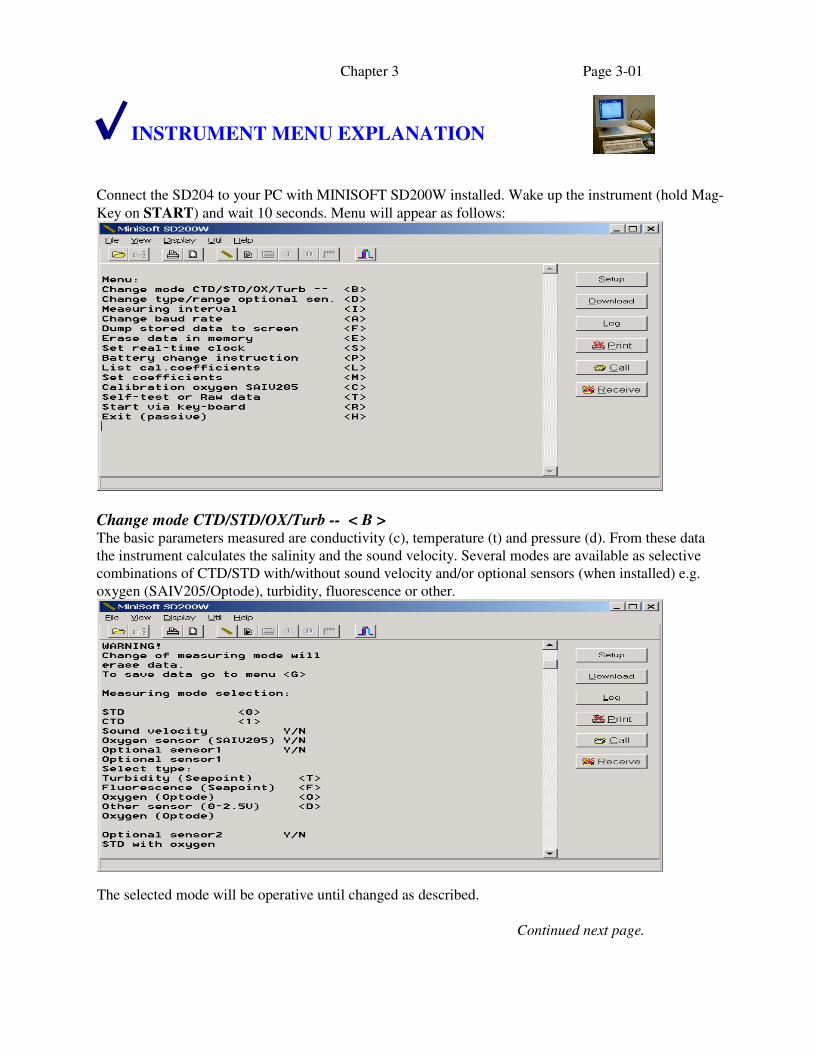
Change mode CTD/STD/OX/Turb -- < B > The basic parameters measured are conductivity (c), temperature (t) and pressure (d). From these data
the instrument calculates the salinity and the sound velocity. Several modes are available as selective
combinations of CTD/STD with/without sound velocity and/or optional sensors (when installed) e.g.
oxygen (SAIV205/Optode), turbidity, fluorescence or other.
The selected mode will be operative until changed as described.
Continued next page.
Chapter 3 Page 3-02
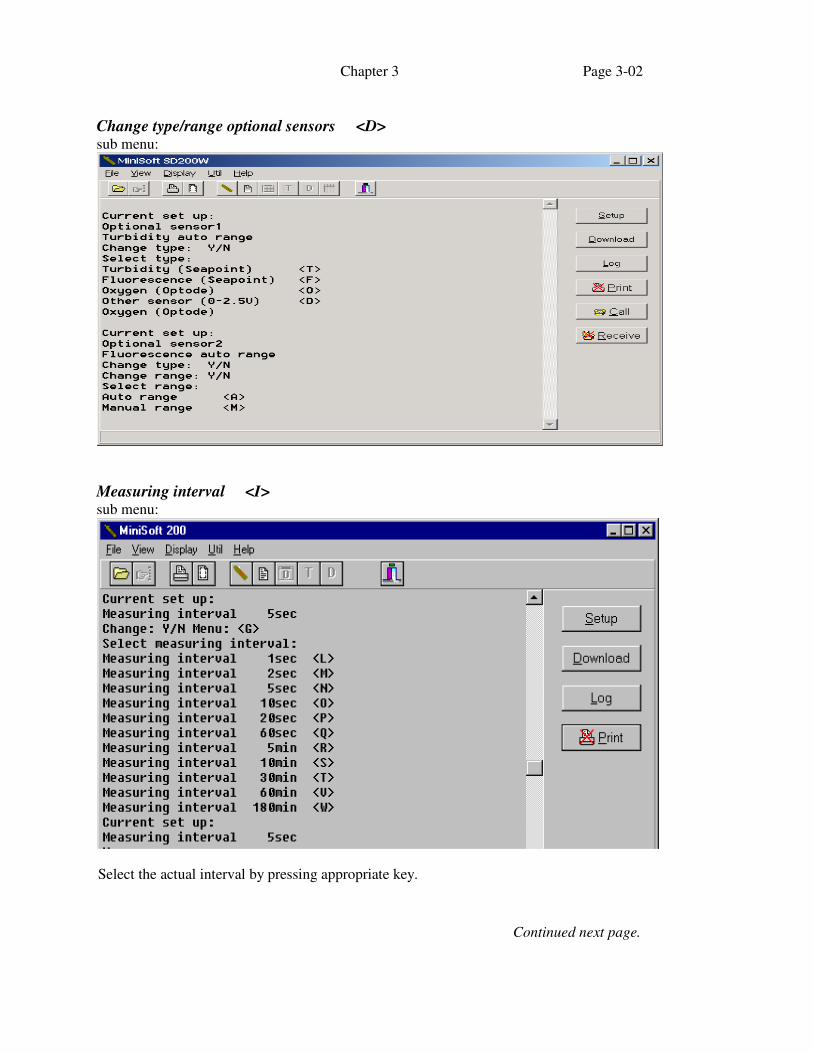
Change type/range optional sensors <D> sub menu:
Measuring interval <I> sub menu:
Continued next page.
Select the actual interval by pressing appropriate key.
Chapter 3 Page 3-03
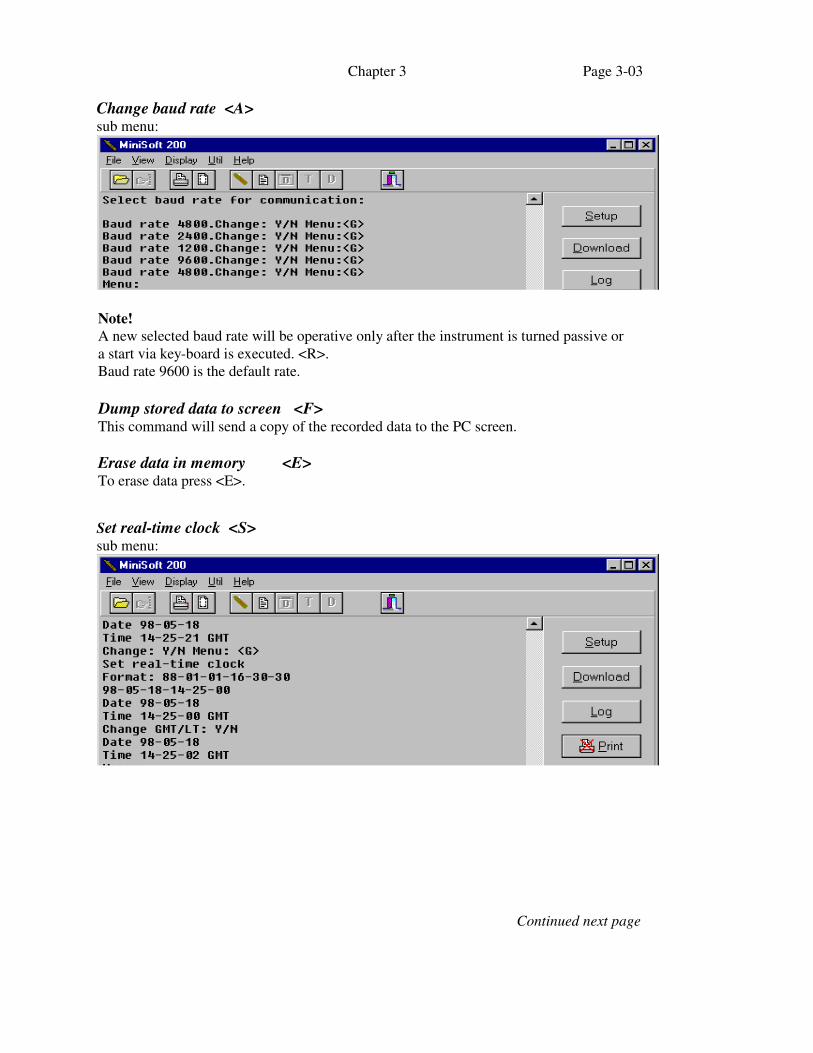
Change baud rate <A> sub menu:
Set real-time clock <S> sub menu:
Continued next page
Note!
A new selected baud rate will be operative only after the instrument is turned passive or
a start via key-board is executed. <R>.
Baud rate 9600 is the default rate.
Dump stored data to screen <F> This command will send a copy of the recorded data to the PC screen.
Erase data in memory <E> To erase data press <E>.
Chapter 3 Page 3-04
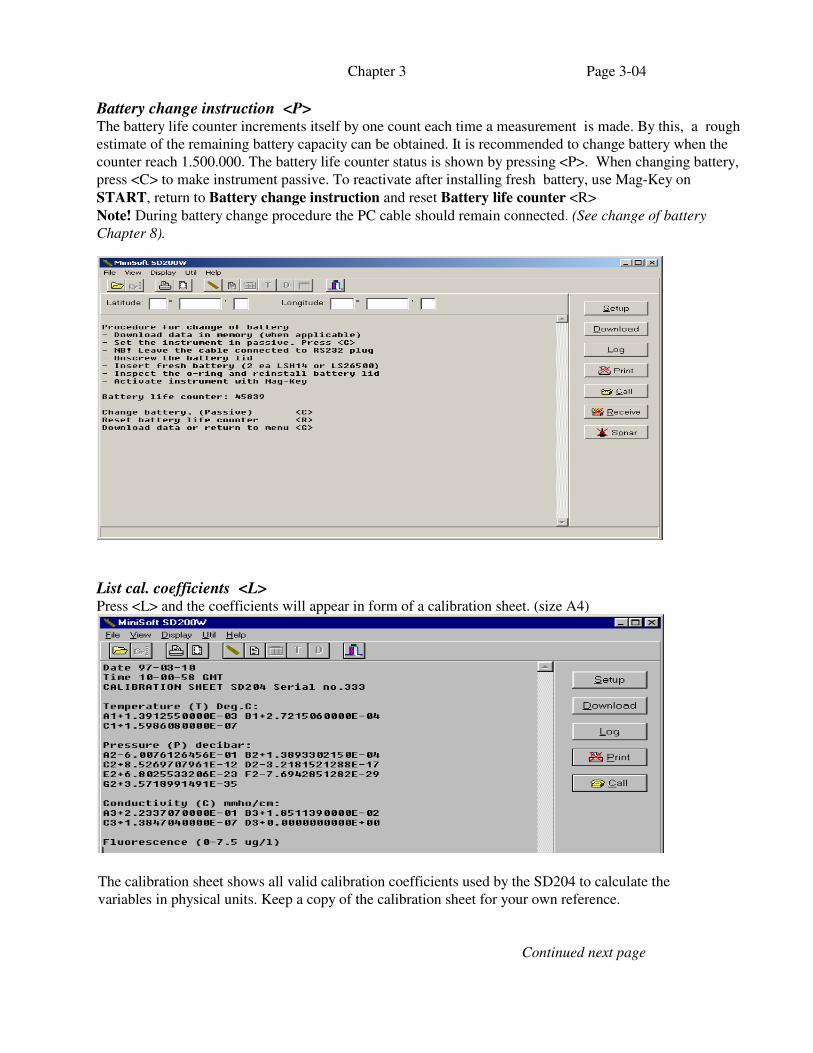
Battery change instruction <P> The battery life counter increments itself by one count each time a measurement is made. By this, a rough
estimate of the remaining battery capacity can be obtained. It is recommended to change battery when the
counter reach 1.500.000. The battery life counter status is shown by pressing <P>. When changing battery,
press <C> to make instrument passive. To reactivate after installing fresh battery, use Mag-Key on
START, return to Battery change instruction and reset Battery life counter <R>
Note! During battery change procedure the PC cable should remain connected. (See change of battery
Chapter 8).
List cal. coefficients <L> Press <L> and the coefficients will appear in form of a calibration sheet. (size A4)
The calibration sheet shows all valid calibration coefficients used by the SD204 to calculate the
variables in physical units. Keep a copy of the calibration sheet for your own reference.
Continued next page
Chapter 3 Page 3-05
For printout see Chapter 5 (MINISOFT SD200W PROGRAM.)
If one or several calibration coefficients become faulty, e.g. due to incorrect procedure during
change of battery, the instrument will calculate incorrect data. Incorrect coefficients can be
corrected. See ‘Set coefficients <M>’.
Set coefficients <M> (mainly for factory use)
Each of the coefficients in the calibration sheet is presented one by one followed by a ‘change Y/N’
press <N> to proceed to next coefficient. It is possible to correct a specific coefficient, press <Y> and
type the correct coefficient including correct sign. If you make a formal error (a missing sign, missing
digits etc).-the instrument will demand a repeated entry.
Calibration oxygen sensor <C>
See Chapter 7(Calibration) and Chapter 6(Description of sensors)
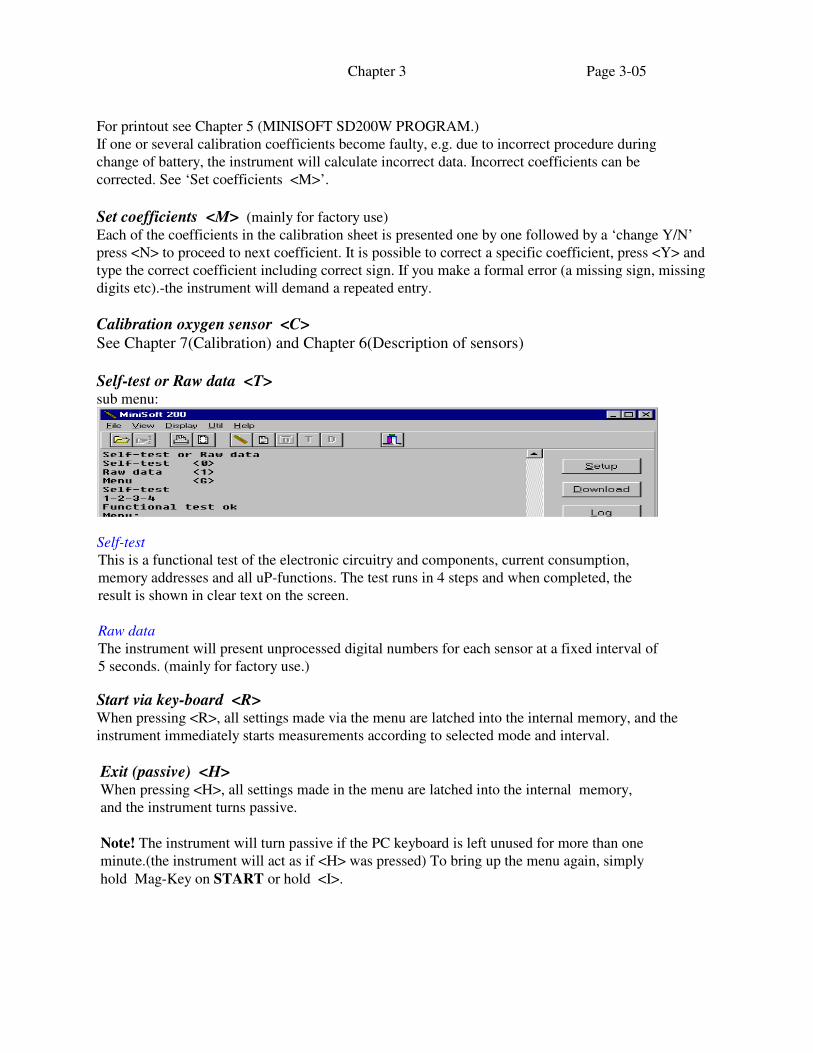
Self-test or Raw data <T>
sub menu:
Start via key-board <R>
When pressing <R>, all settings made via the menu are latched into the internal memory, and the
instrument immediately starts measurements according to selected mode and interval.
Exit (passive) <H> When pressing <H>, all settings made in the menu are latched into the internal memory,
and the instrument turns passive.
Note! The instrument will turn passive if the PC keyboard is left unused for more than one
minute.(the instrument will act as if <H> was pressed) To bring up the menu again, simply
hold Mag-Key on START or hold <I>.
Self-test
This is a functional test of the electronic circuitry and components, current consumption,
memory addresses and all uP-functions. The test runs in 4 steps and when completed, the
result is shown in clear text on the screen.
Raw data
The instrument will present unprocessed digital numbers for each sensor at a fixed interval of
5 seconds. (mainly for factory use.)

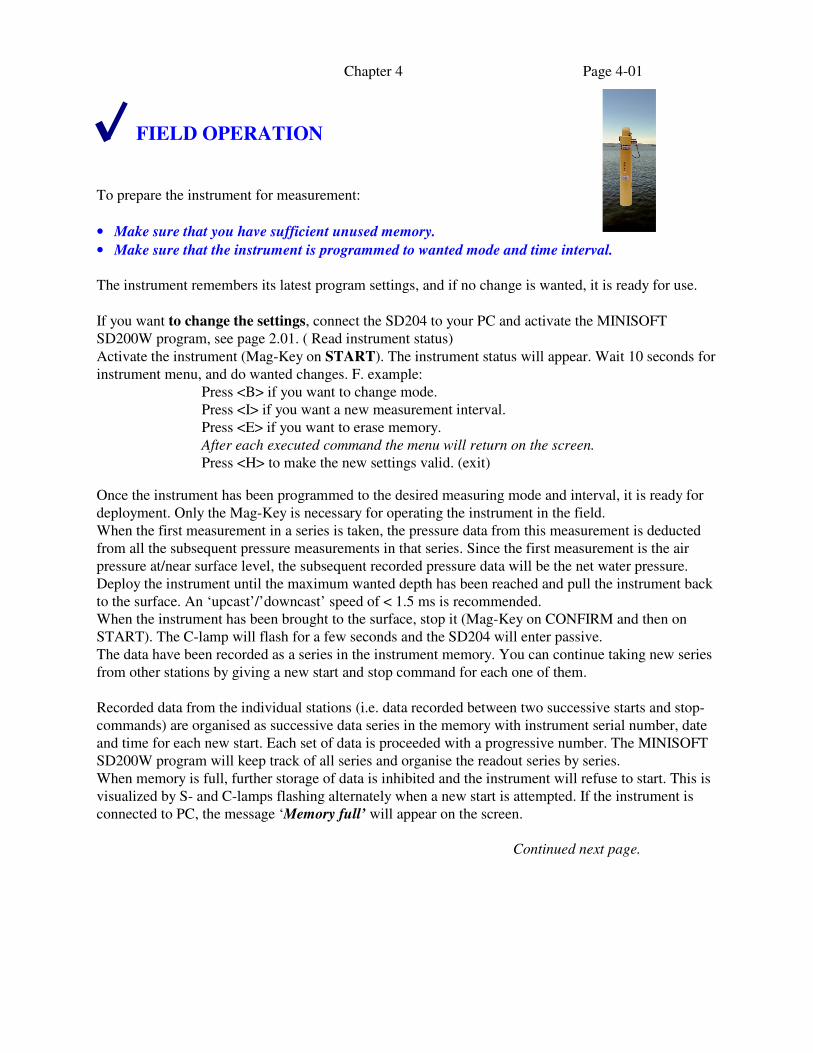
Chapter 4 Page 4-01
FIELD OPERATION
To prepare the instrument for measurement:
• Make sure that you have sufficient unused memory.
• Make sure that the instrument is programmed to wanted mode and time interval.
The instrument remembers its latest program settings, and if no change is wanted, it is ready for use.
If you want to change the settings, connect the SD204 to your PC and activate the MINISOFT
SD200W program, see page 2.01. ( Read instrument status)
Activate the instrument (Mag-Key on START). The instrument status will appear. Wait 10 seconds for
instrument menu, and do wanted changes. F. example:
Press <B> if you want to change mode.
Press <I> if you want a new measurement interval.
Press <E> if you want to erase memory.
After each executed command the menu will return on the screen.
Press <H> to make the new settings valid. (exit)
Once the instrument has been programmed to the desired measuring mode and interval, it is ready for
deployment. Only the Mag-Key is necessary for operating the instrument in the field.
When the first measurement in a series is taken, the pressure data from this measurement is deducted
from all the subsequent pressure measurements in that series. Since the first measurement is the air
pressure at/near surface level, the subsequent recorded pressure data will be the net water pressure.
Deploy the instrument until the maximum wanted depth has been reached and pull the instrument back
to the surface. An ‘upcast’/’downcast’ speed of < 1.5 ms is recommended.
When the instrument has been brought to the surface, stop it (Mag-Key on CONFIRM and then on
START). The C-lamp will flash for a few seconds and the SD204 will enter passive.
The data have been recorded as a series in the instrument memory. You can continue taking new series
from other stations by giving a new start and stop command for each one of them.
Recorded data from the individual stations (i.e. data recorded between two successive starts and stop-
commands) are organised as successive data series in the memory with instrument serial number, date
and time for each new start. Each set of data is proceeded with a progressive number. The MINISOFT
SD200W program will keep track of all series and organise the readout series by series.
When memory is full, further storage of data is inhibited and the instrument will refuse to start. This is
visualized by S- and C-lamps flashing alternately when a new start is attempted. If the instrument is
connected to PC, the message ‘Memory full’ will appear on the screen.
Continued next page.
Chapter 4 Page 4-02
Real time monitoring via cable The SD204 provides on-line data in physical units.
Using STD/CTD mode, on-line output will operate with all baud rates (1200 -9600) at any chosen interval.
At 1 sec interval, using STD/CTD with one extra sensor/parameter, use 4800 or 9600 baud.
Using STD/CTD with more than one extra sensor/parameter, the on-line output will be inhibited at 1
second interval.
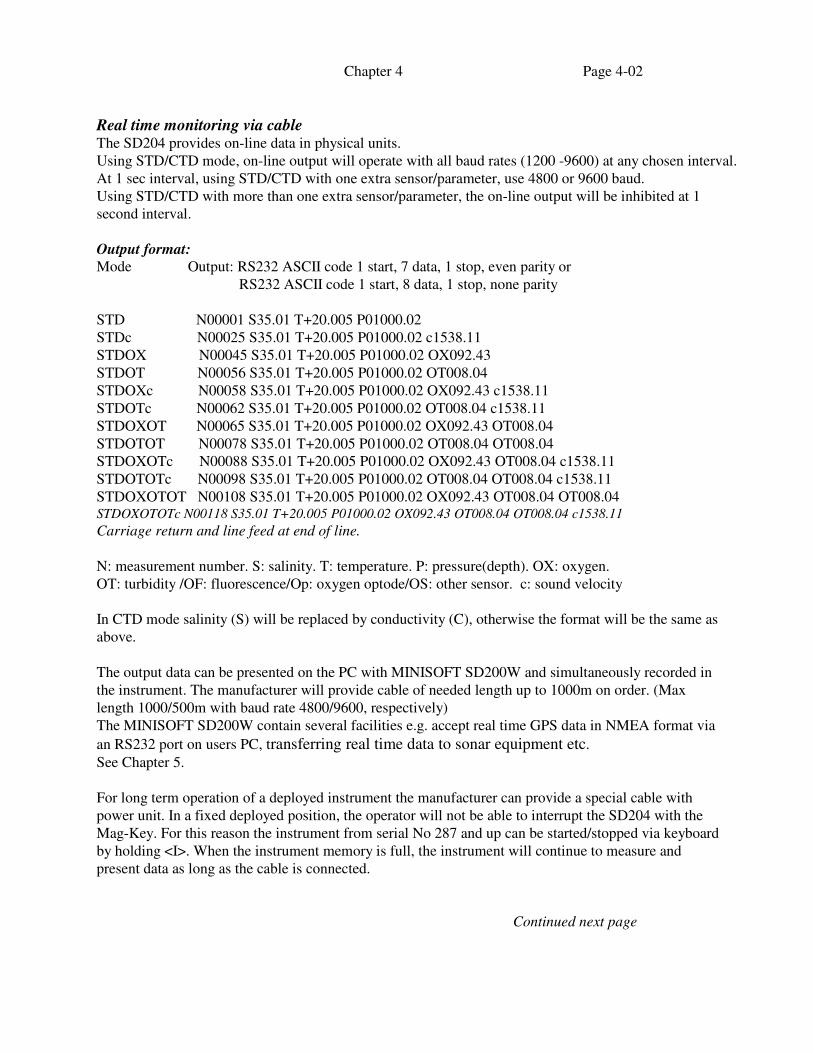
Output format:
Mode Output: RS232 ASCII code 1 start, 7 data, 1 stop, even parity or
RS232 ASCII code 1 start, 8 data, 1 stop, none parity
STD N00001 S35.01 T+20.005 P01000.02
STDc N00025 S35.01 T+20.005 P01000.02 c1538.11
STDOX N00045 S35.01 T+20.005 P01000.02 OX092.43
STDOT N00056 S35.01 T+20.005 P01000.02 OT008.04
STDOXc N00058 S35.01 T+20.005 P01000.02 OX092.43 c1538.11
STDOTc N00062 S35.01 T+20.005 P01000.02 OT008.04 c1538.11
STDOXOT N00065 S35.01 T+20.005 P01000.02 OX092.43 OT008.04
STDOTOT N00078 S35.01 T+20.005 P01000.02 OT008.04 OT008.04
STDOXOTc N00088 S35.01 T+20.005 P01000.02 OX092.43 OT008.04 c1538.11
STDOTOTc N00098 S35.01 T+20.005 P01000.02 OT008.04 OT008.04 c1538.11
STDOXOTOT N00108 S35.01 T+20.005 P01000.02 OX092.43 OT008.04 OT008.04 STDOXOTOTc N00118 S35.01 T+20.005 P01000.02 OX092.43 OT008.04 OT008.04 c1538.11
Carriage return and line feed at end of line.
N: measurement number. S: salinity. T: temperature. P: pressure(depth). OX: oxygen.
OT: turbidity /OF: fluorescence/Op: oxygen optode/OS: other sensor. c: sound velocity
In CTD mode salinity (S) will be replaced by conductivity (C), otherwise the format will be the same as
above.
The output data can be presented on the PC with MINISOFT SD200W and simultaneously recorded in
the instrument. The manufacturer will provide cable of needed length up to 1000m on order. (Max
length 1000/500m with baud rate 4800/9600, respectively)
The MINISOFT SD200W contain several facilities e.g. accept real time GPS data in NMEA format via
an RS232 port on users PC, transferring real time data to sonar equipment etc.
See Chapter 5.
For long term operation of a deployed instrument the manufacturer can provide a special cable with
power unit. In a fixed deployed position, the operator will not be able to interrupt the SD204 with the
Mag-Key. For this reason the instrument from serial No 287 and up can be started/stopped via keyboard
by holding <I>. When the instrument memory is full, the instrument will continue to measure and
present data as long as the cable is connected.
Continued next page
Chapter 4 Page 4-03
Be aware that, when the SD204 is started with the cable connected, it will not update the air pressure,
but use the latest stored value from latest start without cable.
If you want to update the air pressure, remove the RS232 plug and start a new measurement (see page
2.01), and then connect the plug again after first measurement is completed (C-lamp blinks once).
Note! From serial No.287, the SD204 is equipped with an additional feature for manually setting of Air
pressure. Simply hold the <I> until submenu appears. This feature is especially made for using the
SD204 on an R.O.V. or on an on-line profiling system.
Remote readout and monitoring For remote readout and monitoring, the manufacturer offers several options: Communication Unit
CU901, for two-way communication via Iridium satellite, GPRS with embedded web server, GSM and
UHF/VHF.

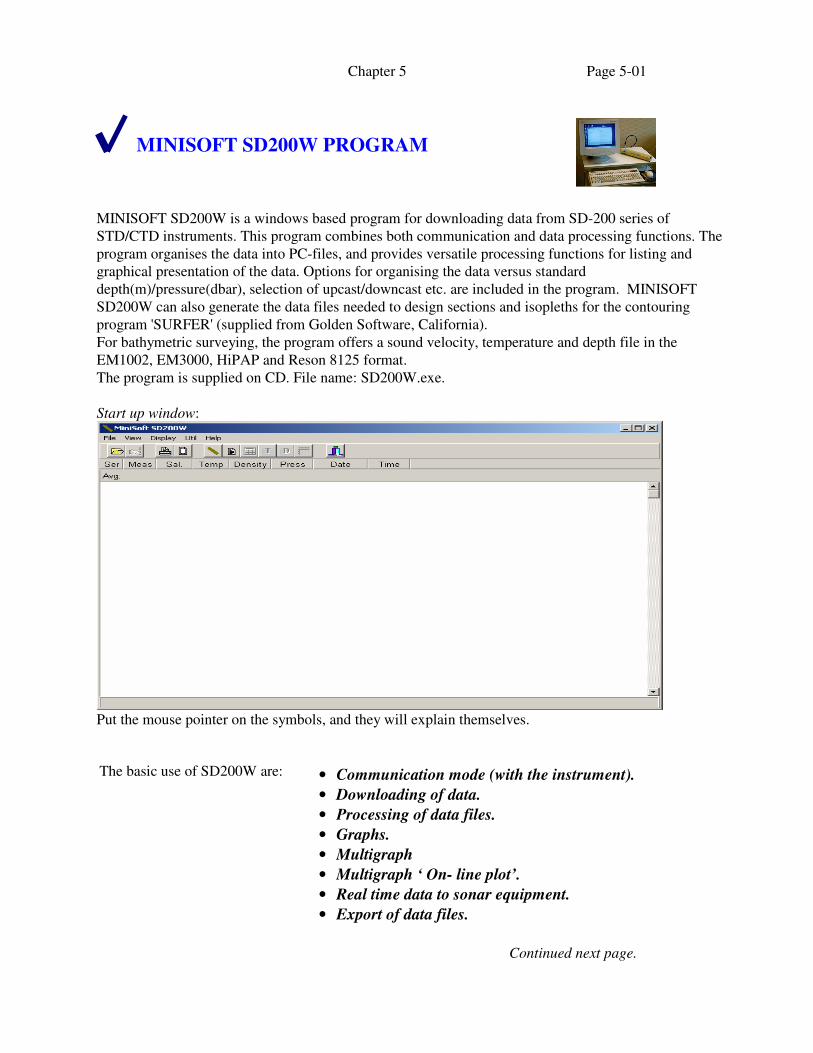
Chapter 5 Page 5-01
MINISOFT SD200W PROGRAM
MINISOFT SD200W is a windows based program for downloading data from SD-200 series of
STD/CTD instruments. This program combines both communication and data processing functions. The
program organises the data into PC-files, and provides versatile processing functions for listing and
graphical presentation of the data. Options for organising the data versus standard
depth(m)/pressure(dbar), selection of upcast/downcast etc. are included in the program. MINISOFT
SD200W can also generate the data files needed to design sections and isopleths for the contouring
program 'SURFER' (supplied from Golden Software, California).
For bathymetric surveying, the program offers a sound velocity, temperature and depth file in the
EM1002, EM3000, HiPAP and Reson 8125 format.
The program is supplied on CD. File name: SD200W.exe.
Start up window:
Put the mouse pointer on the symbols, and they will explain themselves.
• Communication mode (with the instrument).
• Downloading of data.
• Processing of data files.
• Graphs.
• Multigraph
• Multigraph ‘ On- line plot’.
• Real time data to sonar equipment.
• Export of data files.
Continued next page.
The basic use of SD200W are:
Chapter 5 Page 5-02
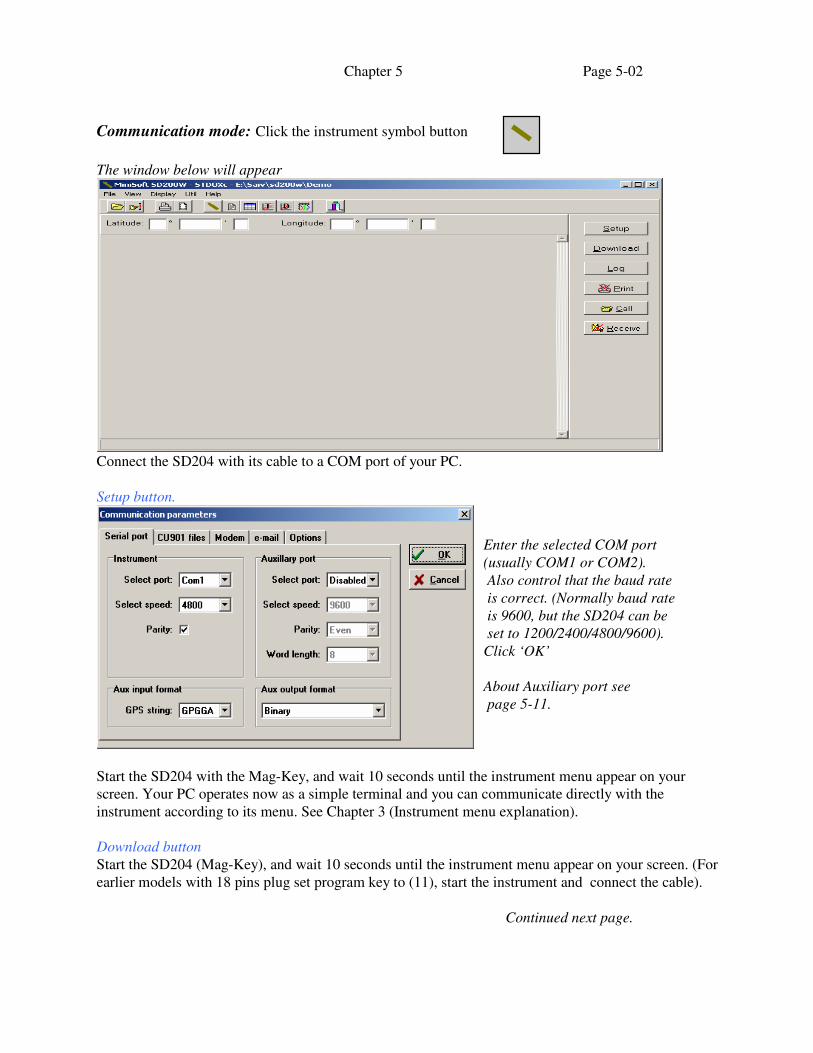
Communication mode: Click the instrument symbol button
The window below will appear
Connect the SD204 with its cable to a COM port of your PC.
Setup button.
Start the SD204 with the Mag-Key, and wait 10 seconds until the instrument menu appear on your
screen. Your PC operates now as a simple terminal and you can communicate directly with the
instrument according to its menu. See Chapter 3 (Instrument menu explanation).
Download button
Start the SD204 (Mag-Key), and wait 10 seconds until the instrument menu appear on your screen. (For
earlier models with 18 pins plug set program key to (11), start the instrument and connect the cable).
Continued next page.
Enter the selected COM port
(usually COM1 or COM2).
Also control that the baud rate
is correct. (Normally baud rate
is 9600, but the SD204 can be
set to 1200/2400/4800/9600).
Click ‘OK’
About Auxiliary port see
page 5-11.
Chapter 5 Page 5-03
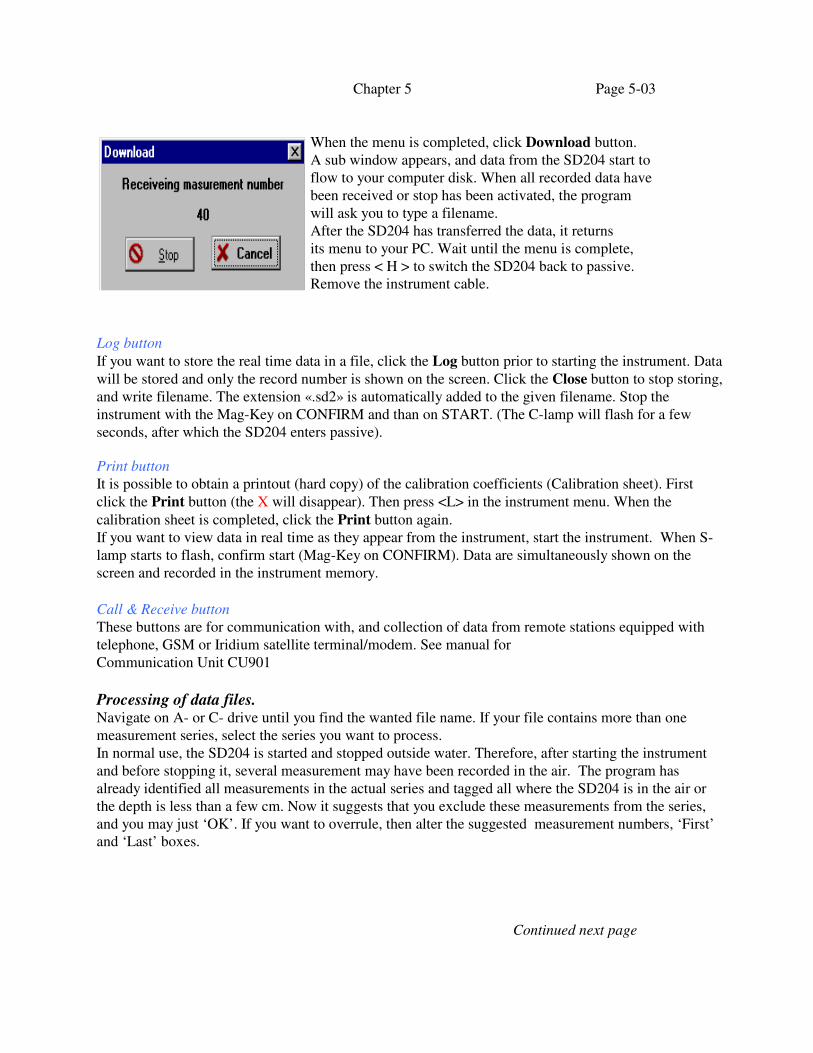
When the menu is completed, click Download button.
A sub window appears, and data from the SD204 start to
flow to your computer disk. When all recorded data have
been received or stop has been activated, the program
will ask you to type a filename.
After the SD204 has transferred the data, it returns
its menu to your PC. Wait until the menu is complete,
then press < H > to switch the SD204 back to passive.
Remove the instrument cable.
Log button
If you want to store the real time data in a file, click the Log button prior to starting the instrument. Data
will be stored and only the record number is shown on the screen. Click the Close button to stop storing,
and write filename. The extension «.sd2» is automatically added to the given filename. Stop the
instrument with the Mag-Key on CONFIRM and than on START. (The C-lamp will flash for a few
seconds, after which the SD204 enters passive).
Print button
It is possible to obtain a printout (hard copy) of the calibration coefficients (Calibration sheet). First
click the Print button (the X will disappear). Then press <L> in the instrument menu. When the
calibration sheet is completed, click the Print button again.
If you want to view data in real time as they appear from the instrument, start the instrument. When S-
lamp starts to flash, confirm start (Mag-Key on CONFIRM). Data are simultaneously shown on the
screen and recorded in the instrument memory.
Call & Receive button
These buttons are for communication with, and collection of data from remote stations equipped with
telephone, GSM or Iridium satellite terminal/modem. See manual for
Communication Unit CU901
Processing of data files. Navigate on A- or C- drive until you find the wanted file name. If your file contains more than one
measurement series, select the series you want to process.
In normal use, the SD204 is started and stopped outside water. Therefore, after starting the instrument
and before stopping it, several measurement may have been recorded in the air. The program has
already identified all measurements in the actual series and tagged all where the SD204 is in the air or
the depth is less than a few cm. Now it suggests that you exclude these measurements from the series,
and you may just ‘OK’. If you want to overrule, then alter the suggested measurement numbers, ‘First’
and ‘Last’ boxes.
Continued next page
Chapter 5 Page 5-04
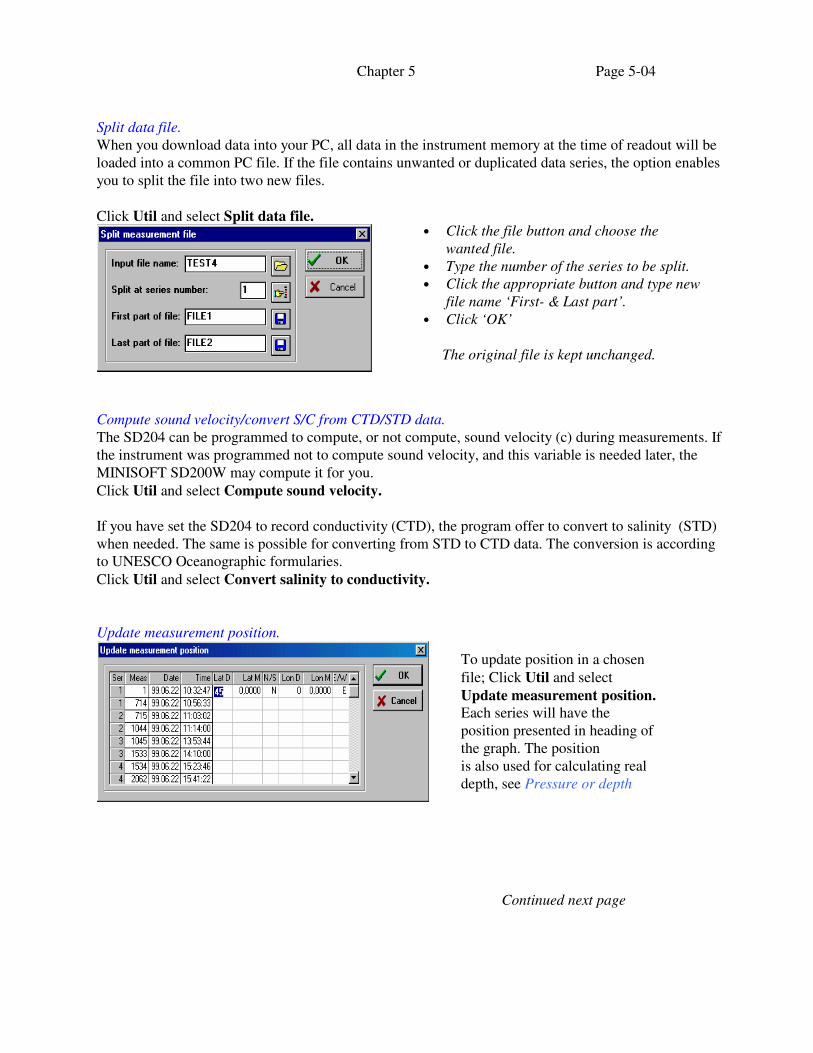
Split data file.
When you download data into your PC, all data in the instrument memory at the time of readout will be
loaded into a common PC file. If the file contains unwanted or duplicated data series, the option enables
you to split the file into two new files.
Click Util and select Split data file.
Compute sound velocity/convert S/C from CTD/STD data.
The SD204 can be programmed to compute, or not compute, sound velocity (c) during measurements. If
the instrument was programmed not to compute sound velocity, and this variable is needed later, the
MINISOFT SD200W may compute it for you.
Click Util and select Compute sound velocity.
If you have set the SD204 to record conductivity (CTD), the program offer to convert to salinity (STD)
when needed. The same is possible for converting from STD to CTD data. The conversion is according
to UNESCO Oceanographic formularies.
Click Util and select Convert salinity to conductivity.
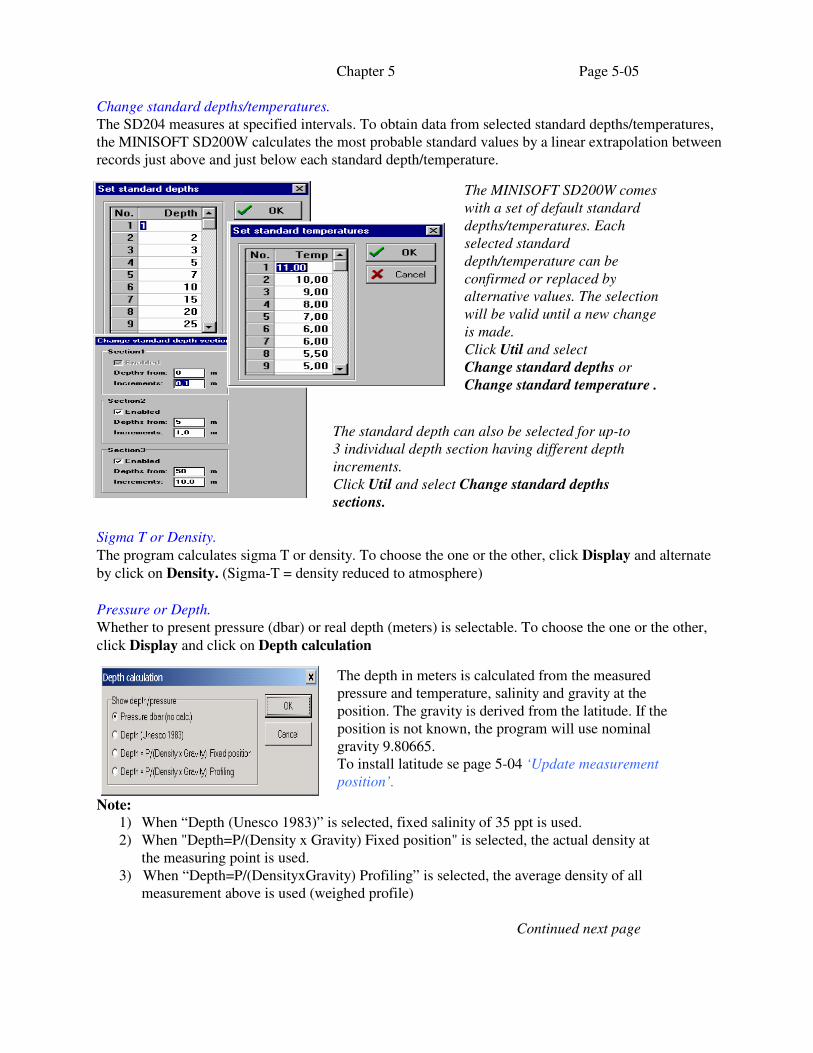
Update measurement position.
Continued next page
To update position in a chosen
file; Click Util and select
Update measurement position.
Each series will have the
position presented in heading of
the graph. The position
is also used for calculating real
depth, see Pressure or depth
• Click the file button and choose the
wanted file.
• Type the number of the series to be split.
• Click the appropriate button and type new
file name ‘First- & Last part’.
• Click ‘OK’
The original file is kept unchanged.
Chapter 5 Page 5-05
Change standard depths/temperatures.
The SD204 measures at specified intervals. To obtain data from selected standard depths/temperatures,
the MINISOFT SD200W calculates the most probable standard values by a linear extrapolation between
records just above and just below each standard depth/temperature.
The standard depth can also be selected for up-to
3 individual depth section having different depth
increments.
Click Util and select Change standard depths
sections.
Sigma T or Density.
The program calculates sigma T or density. To choose the one or the other, click Display and alternate
by click on Density. (Sigma-T = density reduced to atmosphere)
Pressure or Depth.
Whether to present pressure (dbar) or real depth (meters) is selectable. To choose the one or the other,
click Display and click on Depth calculation
Note:
1) When “Depth (Unesco 1983)” is selected, fixed salinity of 35 ppt is used.
2) When "Depth=P/(Density x Gravity) Fixed position" is selected, the actual density at
the measuring point is used.
3) When “Depth=P/(DensityxGravity) Profiling” is selected, the average density of all
measurement above is used (weighed profile)
Continued next page
The depth in meters is calculated from the measured
pressure and temperature, salinity and gravity at the
position. The gravity is derived from the latitude. If the
position is not known, the program will use nominal
gravity 9.80665.
To install latitude se page 5-04 ‘Update measurement
position’.
The MINISOFT SD200W comes
with a set of default standard
depths/temperatures. Each
selected standard
depth/temperature can be
confirmed or replaced by
alternative values. The selection
will be valid until a new change
is made.
Click Util and select
Change standard depths or
Change standard temperature .
Chapter 5 Page 5-06
GPS position.
Click the Display symbol and select GPS position Position will be shown in real time if GPS receiver is
connected.
Average values.
Click the Display symbol and select Average Calculated average values for the chosen series will be
shown as heading in ‘list file. (Only selected series)
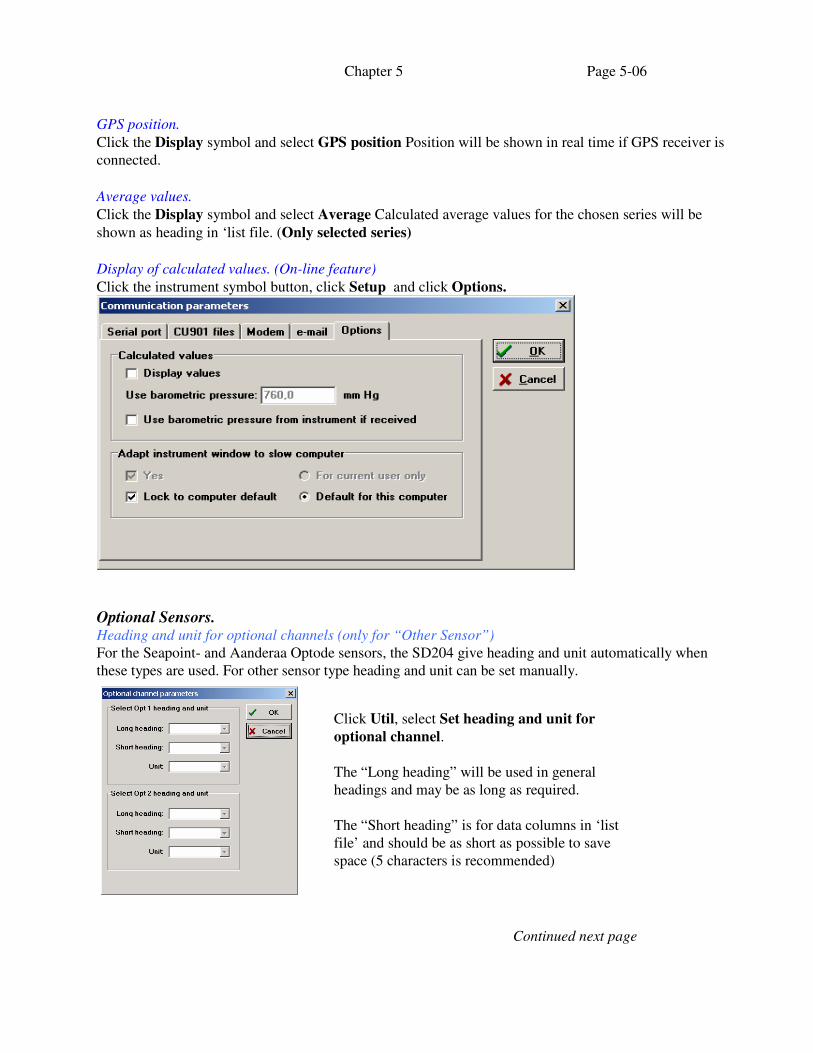
Display of calculated values. (On-line feature)
Click the instrument symbol button, click Setup and click Options.
Optional Sensors. Heading and unit for optional channels (only for “Other Sensor”)
For the Seapoint- and Aanderaa Optode sensors, the SD204 give heading and unit automatically when
these types are used. For other sensor type heading and unit can be set manually.
Continued next page
Click Util, select Set heading and unit for
optional channel.
The “Long heading” will be used in general
headings and may be as long as required.
The “Short heading” is for data columns in ‘list
file’ and should be as short as possible to save
space (5 characters is recommended)
Chapter 5 Page 5-07
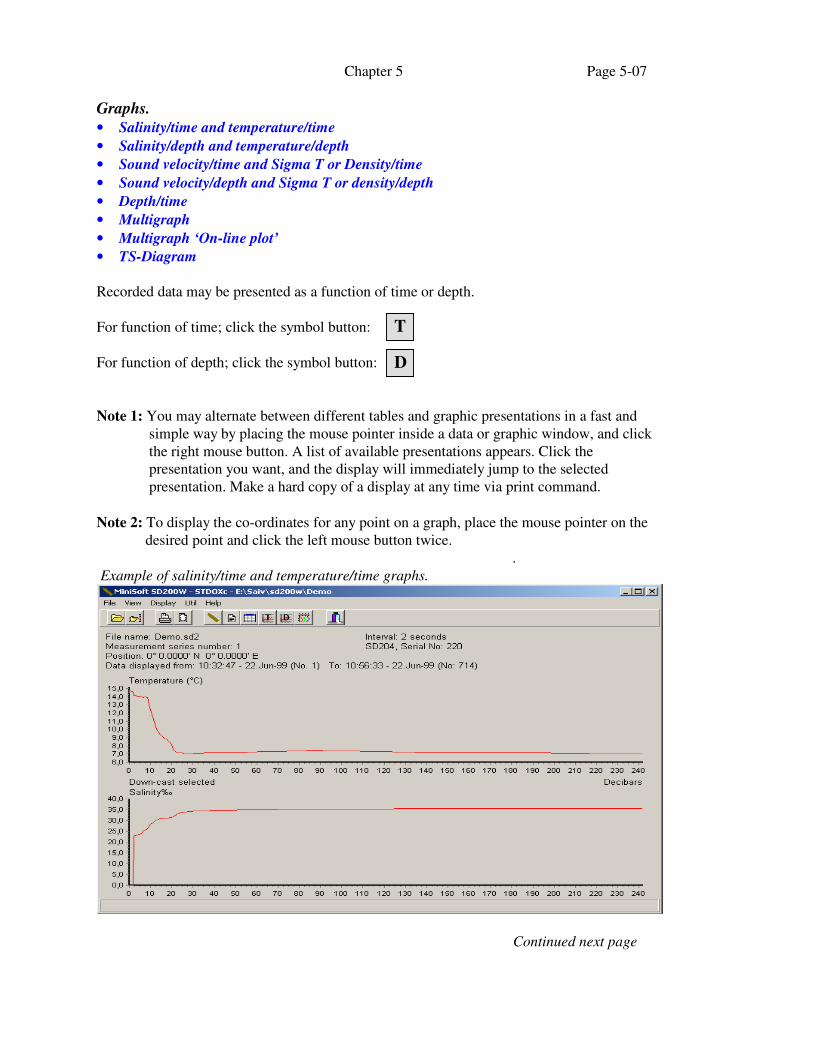
Graphs.
• Salinity/time and temperature/time
• Salinity/depth and temperature/depth
• Sound velocity/time and Sigma T or Density/time
• Sound velocity/depth and Sigma T or density/depth
• Depth/time
• Multigraph
• Multigraph ‘On-line plot’
• TS-Diagram
Recorded data may be presented as a function of time or depth.
For function of time; click the symbol button:
For function of depth; click the symbol button:
Note 1: You may alternate between different tables and graphic presentations in a fast and
simple way by placing the mouse pointer inside a data or graphic window, and click
the right mouse button. A list of available presentations appears. Click the
presentation you want, and the display will immediately jump to the selected
presentation. Make a hard copy of a display at any time via print command.
Note 2: To display the co-ordinates for any point on a graph, place the mouse pointer on the
desired point and click the left mouse button twice.
.
Example of salinity/time and temperature/time graphs.
Continued next page
T
D
Chapter 5 Page 5-08
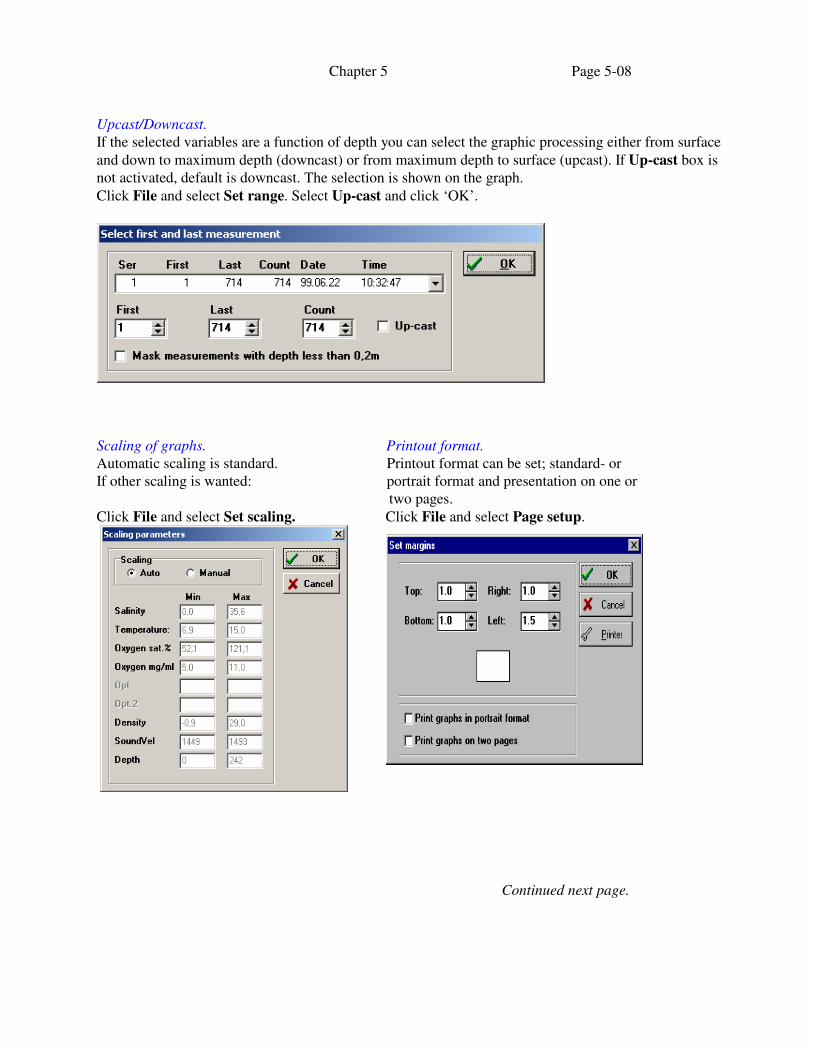
Upcast/Downcast. If the selected variables are a function of depth you can select the graphic processing either from surface
and down to maximum depth (downcast) or from maximum depth to surface (upcast). If Up-cast box is
not activated, default is downcast. The selection is shown on the graph.
Click File and select Set range. Select Up-cast and click ‘OK’.
Scaling of graphs. Printout format.
Automatic scaling is standard. Printout format can be set; standard- or
If other scaling is wanted: portrait format and presentation on one or
two pages.
Click File and select Set scaling. Click File and select Page setup.
Continued next page.
Chapter 5 Page 5-09
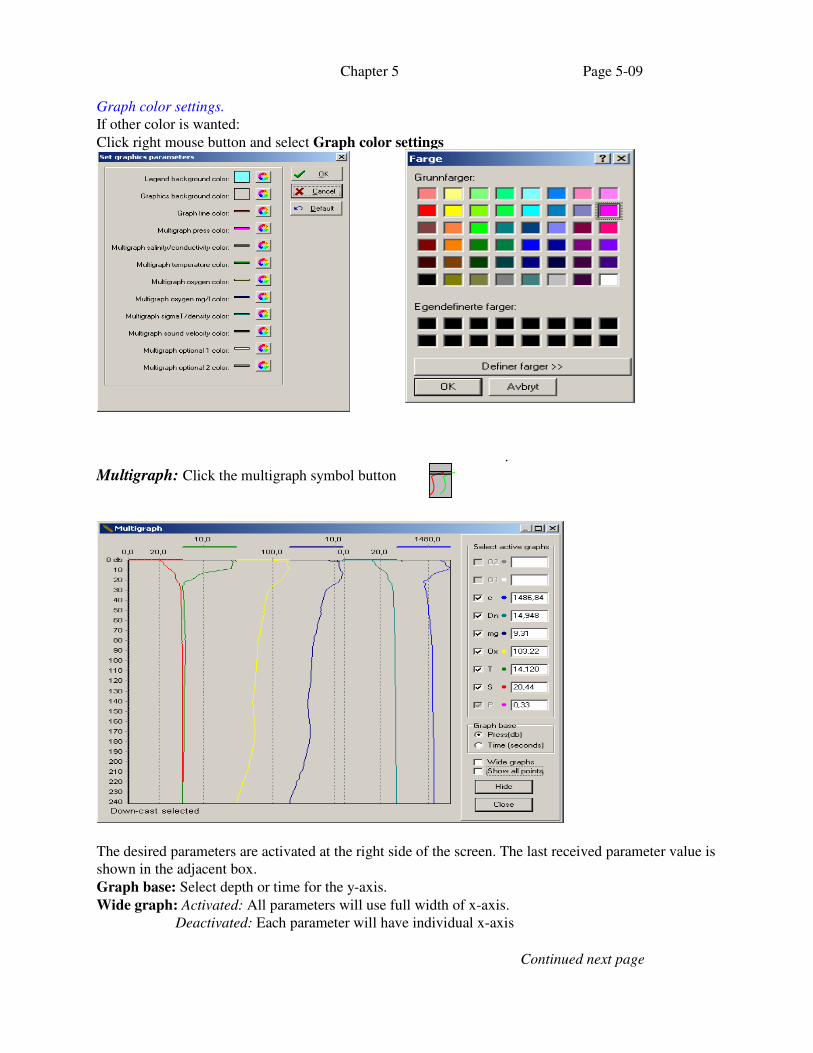
Graph color settings.
If other color is wanted:
Click right mouse button and select Graph color settings
.
Multigraph: Click the multigraph symbol button
The desired parameters are activated at the right side of the screen. The last received parameter value is
shown in the adjacent box.
Graph base: Select depth or time for the y-axis.
Wide graph: Activated: All parameters will use full width of x-axis.
Deactivated: Each parameter will have individual x-axis
Continued next page
Chapter 5 Page 5-10
Zoom in: Place the mouse pointer in the desired area, press left button and move downwards toward right side and
release button. Repeat one or more times to increase resolution.
Zoom out (return to normal): Use mouse pointer as for ‘Zoom in’ but move upwards toward left side.
Scroll: Press right mouse button and use the ‘hand’ to move the displayed area up/down
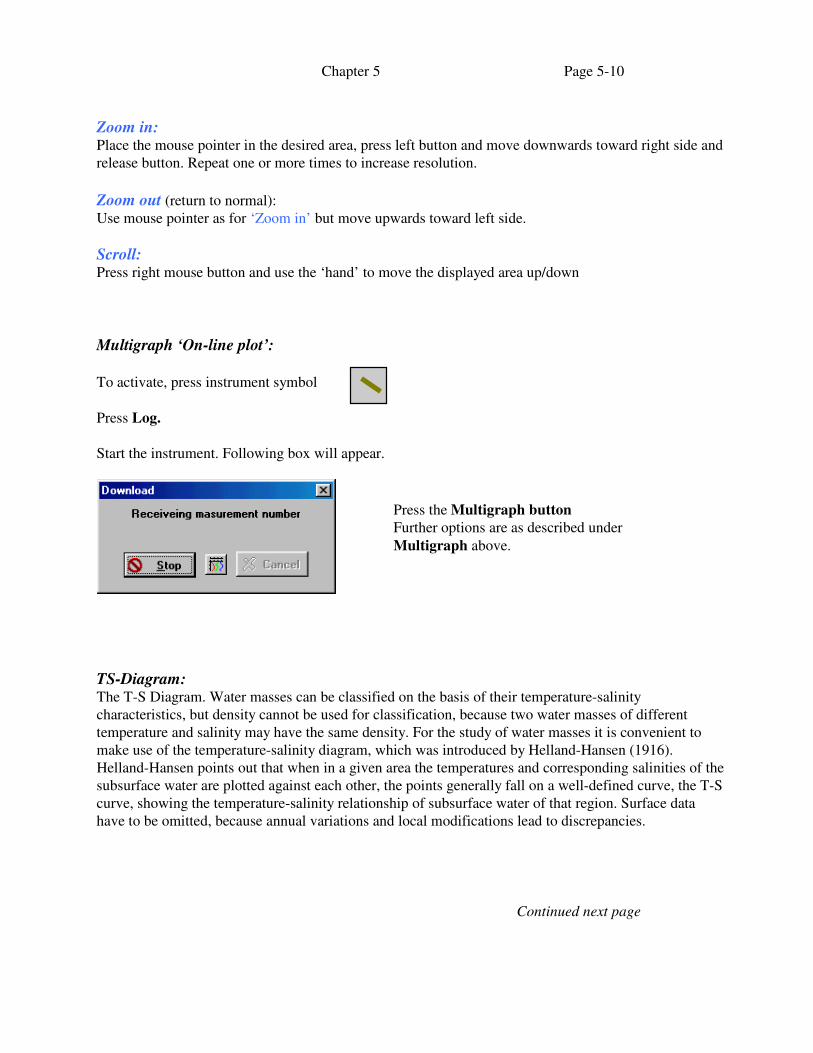
Multigraph ‘On-line plot’:
To activate, press instrument symbol
Press Log.
Start the instrument. Following box will appear.
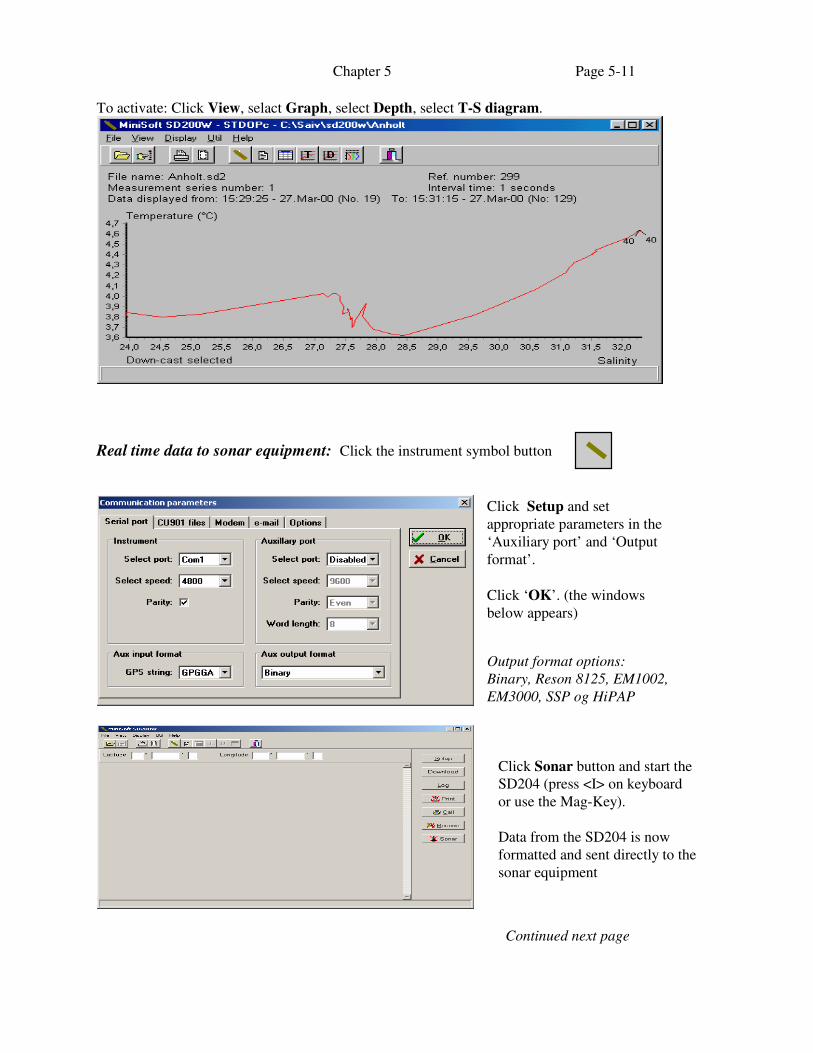
TS-Diagram: The T-S Diagram. Water masses can be classified on the basis of their temperature-salinity
characteristics, but density cannot be used for classification, because two water masses of different
temperature and salinity may have the same density. For the study of water masses it is convenient to
make use of the temperature-salinity diagram, which was introduced by Helland-Hansen (1916).
Helland-Hansen points out that when in a given area the temperatures and corresponding salinities of the
subsurface water are plotted against each other, the points generally fall on a well-defined curve, the T-S
curve, showing the temperature-salinity relationship of subsurface water of that region. Surface data
have to be omitted, because annual variations and local modifications lead to discrepancies.
Continued next page
Press the Multigraph button
Further options are as described under
Multigraph above.
Chapter 5 Page 5-11
To activate: Click View, selact Graph, select Depth, select T-S diagram.
Real time data to sonar equipment: Click the instrument symbol button
Continued next page
Click Sonar button and start the
SD204 (press <I> on keyboard
or use the Mag-Key).
Data from the SD204 is now
formatted and sent directly to the
sonar equipment
Click Setup and set
appropriate parameters in the
‘Auxiliary port’ and ‘Output
format’.
Click ‘OK’. (the windows
below appears)
Output format options:
Binary, Reson 8125, EM1002,
EM3000, SSP og HiPAP
Chapter 5 Page 5-12
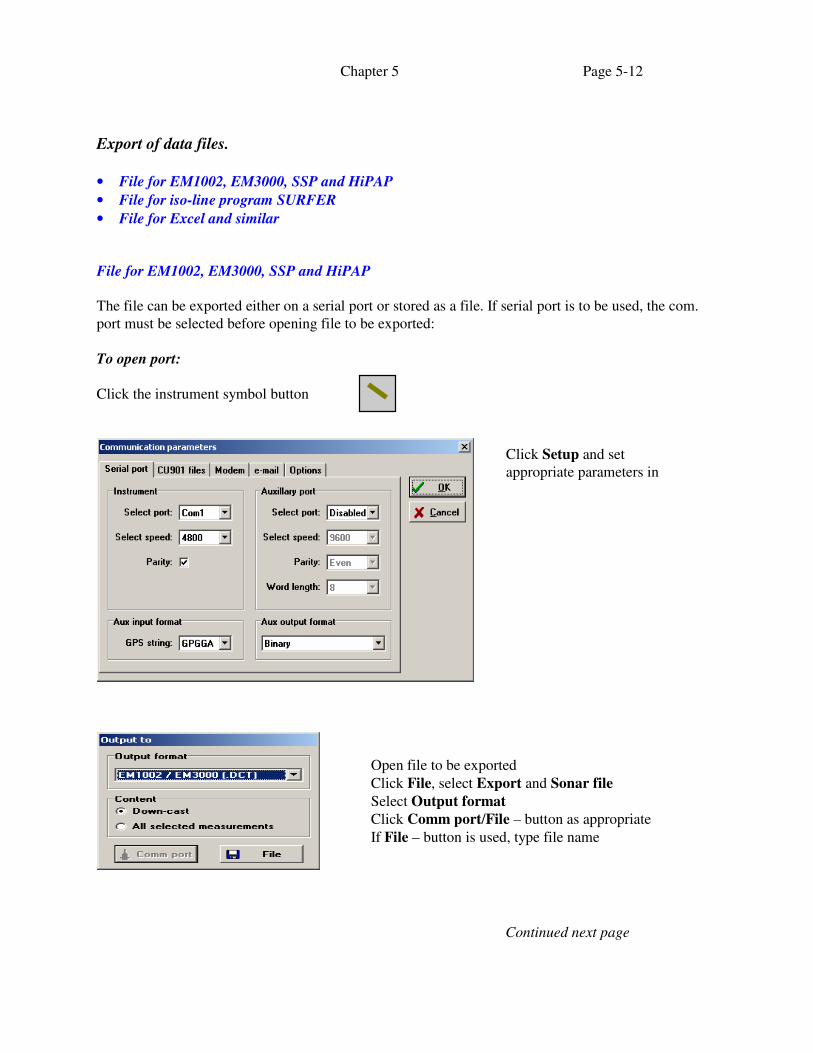
Export of data files.
• File for EM1002, EM3000, SSP and HiPAP
• File for iso-line program SURFER
• File for Excel and similar
File for EM1002, EM3000, SSP and HiPAP
The file can be exported either on a serial port or stored as a file. If serial port is to be used, the com.
port must be selected before opening file to be exported:
To open port:
Click the instrument symbol button
Continued next page
Click Setup and set
appropriate parameters in
Open file to be exported
Click File, select Export and Sonar file
Select Output format
Click Comm port/File – button as appropriate
If File – button is used, type file name
Chapter 5 Page 5-13
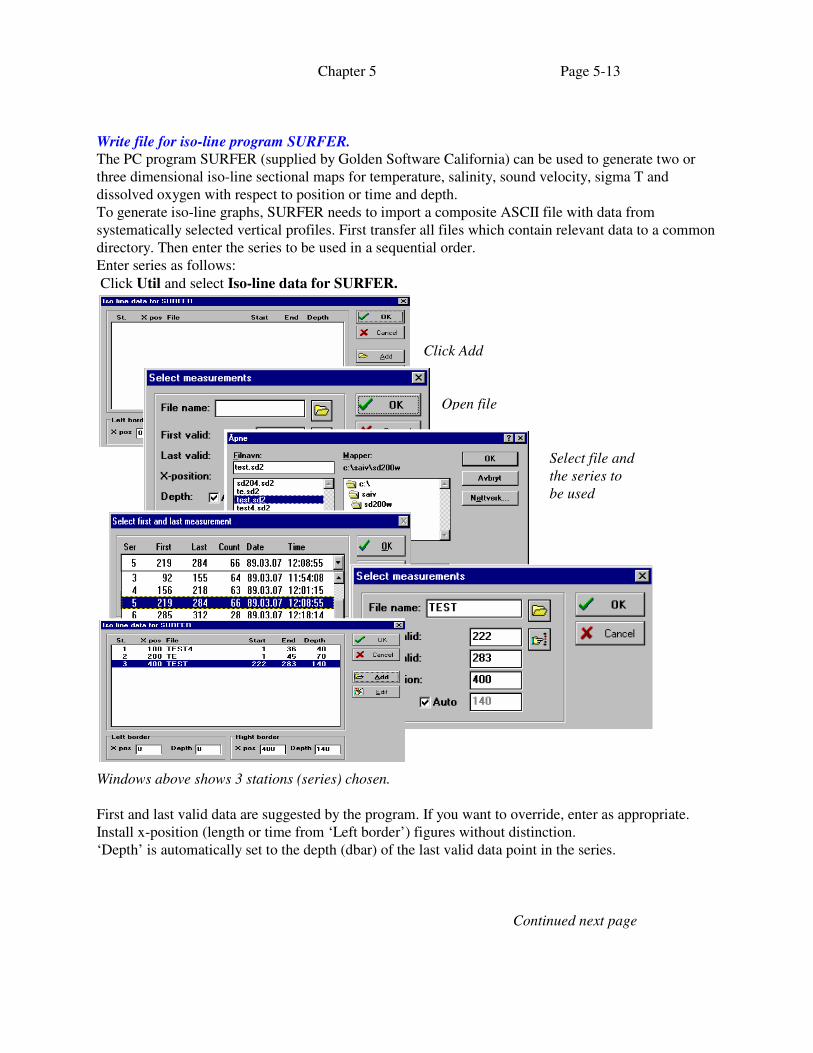
Write file for iso-line program SURFER.
The PC program SURFER (supplied by Golden Software California) can be used to generate two or
three dimensional iso-line sectional maps for temperature, salinity, sound velocity, sigma T and
dissolved oxygen with respect to position or time and depth.
To generate iso-line graphs, SURFER needs to import a composite ASCII file with data from
systematically selected vertical profiles. First transfer all files which contain relevant data to a common
directory. Then enter the series to be used in a sequential order.
Enter series as follows:
Click Util and select Iso-line data for SURFER.
Windows above shows 3 stations (series) chosen.
First and last valid data are suggested by the program. If you want to override, enter as appropriate.
Install x-position (length or time from ‘Left border’) figures without distinction.
‘Depth’ is automatically set to the depth (dbar) of the last valid data point in the series.
Continued next page
Click Add
Open file
Select file and
the series to
be used
Chapter 5 Page 5-14
If the actual water depth is deeper, and you want to include the bottom line, inhibit ‘Auto’ and enter the
actual water depth at each series. Enter the relevant series in sequence from ‘Left border’ to ‘Right
border’.
The program assumes that ‘Left border’ is a landside point at depth = 0, and that ‘Right border’ is at
depth = 0 on the opposite side. (e.g. of a fjord)
Therefore, in order to have a full cross-section, ‘x-position’ of first series (station) should be the distance
from left landside, and last ‘x-position’ should be the accumulated distance from left to right.
If only a section from first to last station is wanted (a partial section), install the corresponding depths
for first- and last station in ‘Left border’ and ‘Right border’ boxes.
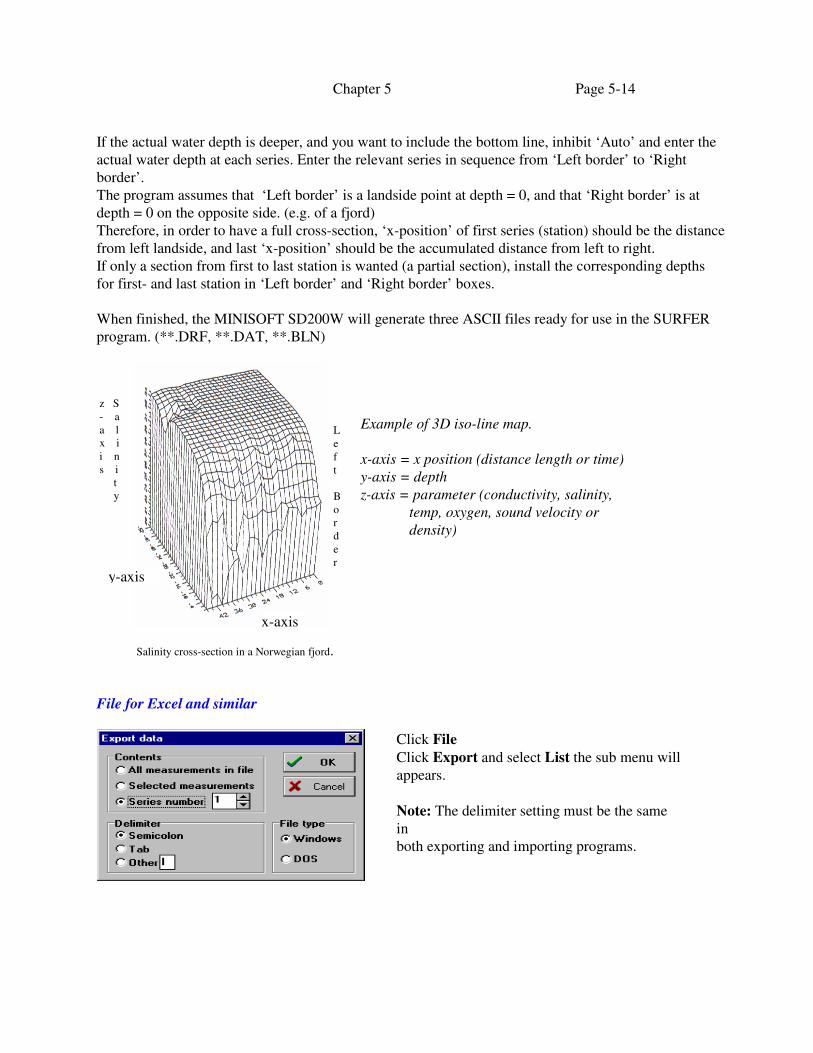
When finished, the MINISOFT SD200W will generate three ASCII files ready for use in the SURFER
program. (**.DRF, **.DAT, **.BLN)
Salinity cross-section in a Norwegian fjord.
File for Excel and similar
z S
- a
a l
x i
i n
s i
t
y
L
e
f
t
B
o
r
d
e
r
x-axis
y-axis
Example of 3D iso-line map.
x-axis = x position (distance length or time)
y-axis = depth
z-axis = parameter (conductivity, salinity,
temp, oxygen, sound velocity or
density)
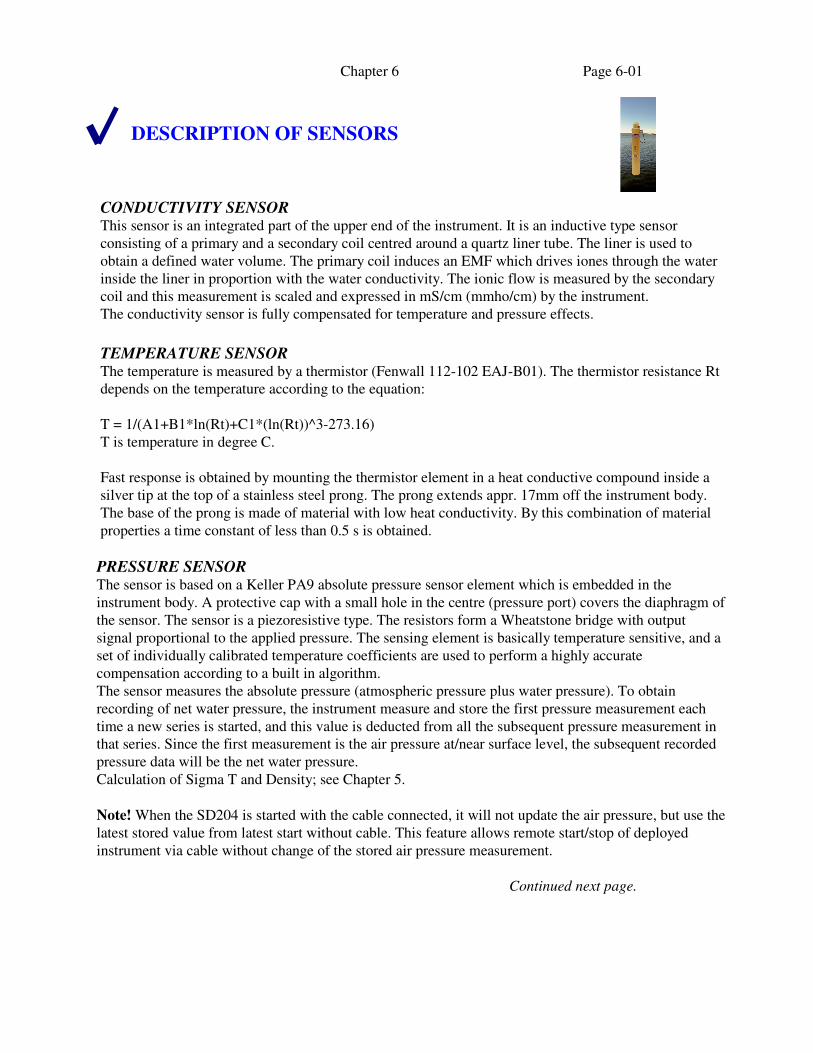
Click File
Click Export and select List the sub menu will
appears.
Note: The delimiter setting must be the same
in
both exporting and importing programs.
Chapter 6 Page 6-01
DESCRIPTION OF SENSORS
CONDUCTIVITY SENSOR
This sensor is an integrated part of the upper end of the instrument. It is an inductive type sensor
consisting of a primary and a secondary coil centred around a quartz liner tube. The liner is used to
obtain a defined water volume. The primary coil induces an EMF which drives iones through the water
inside the liner in proportion with the water conductivity. The ionic flow is measured by the secondary
coil and this measurement is scaled and expressed in mS/cm (mmho/cm) by the instrument.
The conductivity sensor is fully compensated for temperature and pressure effects.
TEMPERATURE SENSOR The temperature is measured by a thermistor (Fenwall 112-102 EAJ-B01). The thermistor resistance Rt
depends on the temperature according to the equation:
T = 1/(A1+B1*ln(Rt)+C1*(ln(Rt))^3-273.16)
T is temperature in degree C.
Fast response is obtained by mounting the thermistor element in a heat conductive compound inside a
silver tip at the top of a stainless steel prong. The prong extends appr. 17mm off the instrument body.
The base of the prong is made of material with low heat conductivity. By this combination of material
properties a time constant of less than 0.5 s is obtained.
PRESSURE SENSOR The sensor is based on a Keller PA9 absolute pressure sensor element which is embedded in the
instrument body. A protective cap with a small hole in the centre (pressure port) covers the diaphragm of
the sensor. The sensor is a piezoresistive type. The resistors form a Wheatstone bridge with output
signal proportional to the applied pressure. The sensing element is basically temperature sensitive, and a
set of individually calibrated temperature coefficients are used to perform a highly accurate
compensation according to a built in algorithm.
The sensor measures the absolute pressure (atmospheric pressure plus water pressure). To obtain
recording of net water pressure, the instrument measure and store the first pressure measurement each
time a new series is started, and this value is deducted from all the subsequent pressure measurement in
that series. Since the first measurement is the air pressure at/near surface level, the subsequent recorded
pressure data will be the net water pressure.
Calculation of Sigma T and Density; see Chapter 5.
Note! When the SD204 is started with the cable connected, it will not update the air pressure, but use the
latest stored value from latest start without cable. This feature allows remote start/stop of deployed
instrument via cable without change of the stored air pressure measurement.
Continued next page.
Chapter 6 Page 6-02
SALINITY When the SD204 is set to record salinity(STD) it uses the measured conductivity, temperature and
pressure data to calculate salinity in accordance with equations recommended by UNESCO. (Technical
Papers in Marine Science, 83).
SOUND VELOCITY When the SD204 is set to record sound velocity (STDc/CTDc) it uses the measured conductivity,
temperature and pressure data to calculate sound velocity in accordance to equations given by: Chen &
Millero 1977
OPTIONAL SENSORS The SD204 has 3 channels available for optional sensors. The one channel is devoted for measurement
of dissolved oxygen SAIV205. The two other channels will operate with sensors having 0-2.5V output
signal. Often required sensors are turbidity and fluorescence. (see below). From serial No 473, the
SD204 is also prepared for the Aanderaa Oxygen Optode Sensor 3975S.
OXYGEN SENSOR SAIV205
This sensor is based on a sensing element from OxyGuard and is furnished with a breathing hole for
pressure compensation to water depth down to 2000 meters. The breathing hole should be sealed to
avoid evaporation of electrolyte when sensor is not in use. An O-ring on the probe is provided for this.
The sensor uses silver as cathodic material and pure zinc as anodic material. When combined with the
supplied electrolyte, the sensor generates a polarisation voltage which attracts dissolved oxygen to the
cathode through a membrane.
In operation dissolved oxygen from the water diffuses through the membrane to the cathode. This
causes electrons (current) to flow between the anode and the cathode via an external circuit. The output
signal is proportional to the oxygen saturation (%).
In order to make the oxygen reading independent of temperature, the instrument measure the membrane
temperature and compensates for the effect.
The recorded data represent the degree of saturation in %, The MINISOFT SD200W presents data both
in degree saturation and mg/l compensated for salinity and pressure.
The oxygen sensor require frequent calibration. To simplify this procedure, the instrument has a built in
automatic calibration routine see Chapter 7. (Calibration)
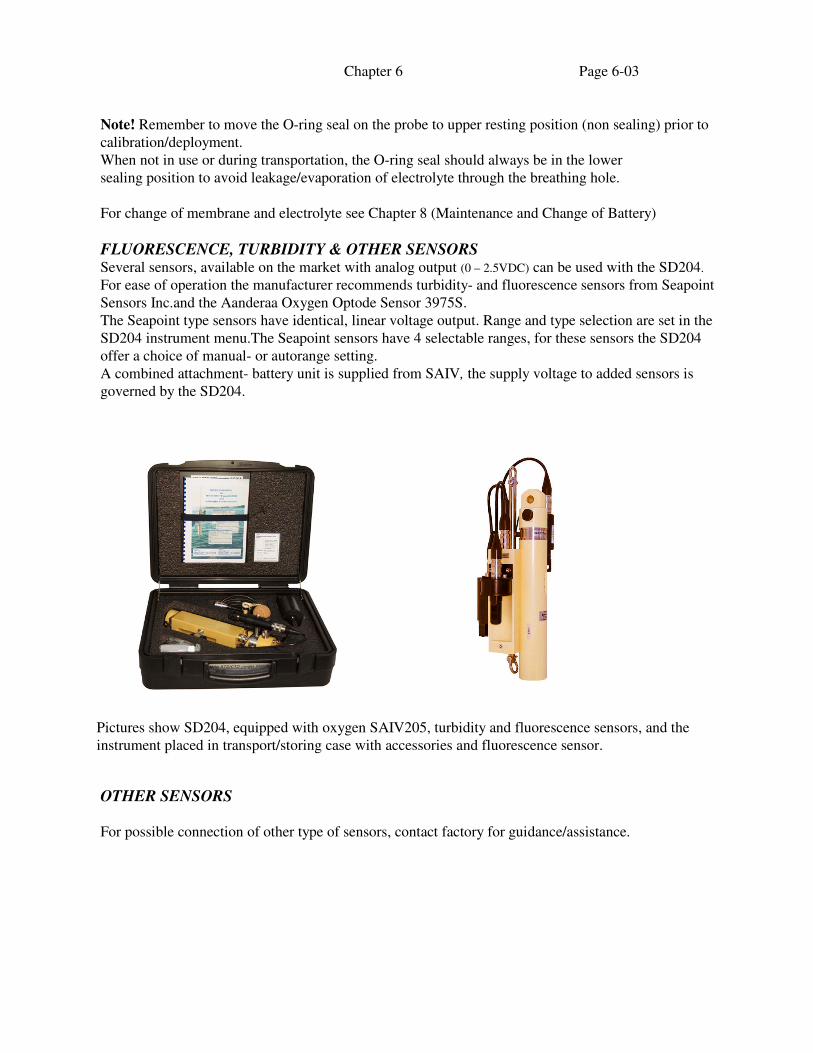
Installation of the oxygen sensor (when supplied separately)
The sensor is connected to the RS232 plug on the instrument and fixed with a securing screw.
First plug in the sensor and tighten the sleeve nut completely. The sensor is
now correctly connected and the securing screw can be installed. This screw
has an O-ring under the head and should only be tightened lightly to allow
some flexibility.
The RS232 output/input of the instrument is extended to the plug on top of
the oxygen sensor and the cover cap must be installed on this plug prior to
deployment.
Continued next page.
Chapter 6 Page 6-03
Note! Remember to move the O-ring seal on the probe to upper resting position (non sealing) prior to
calibration/deployment.
When not in use or during transportation, the O-ring seal should always be in the lower
sealing position to avoid leakage/evaporation of electrolyte through the breathing hole.
For change of membrane and electrolyte see Chapter 8 (Maintenance and Change of Battery)
FLUORESCENCE, TURBIDITY & OTHER SENSORS Several sensors, available on the market with analog output (0 – 2.5VDC) can be used with the SD204.
For ease of operation the manufacturer recommends turbidity- and fluorescence sensors from Seapoint
Sensors Inc.and the Aanderaa Oxygen Optode Sensor 3975S.
The Seapoint type sensors have identical, linear voltage output. Range and type selection are set in the
SD204 instrument menu.The Seapoint sensors have 4 selectable ranges, for these sensors the SD204
offer a choice of manual- or autorange setting.
A combined attachment- battery unit is supplied from SAIV, the supply voltage to added sensors is
governed by the SD204.
Pictures show SD204, equipped with oxygen SAIV205, turbidity and fluorescence sensors, and the
instrument placed in transport/storing case with accessories and fluorescence sensor.
OTHER SENSORS
For possible connection of other type of sensors, contact factory for guidance/assistance.

Chapter 7 Page 7-01
CALIBRATION
CTD Calibration Certificate with credentials is supplied with each instrument. See example on next
page. The calibration coefficients is maintained in the instrument in non volatile memory, and can be
displayed/hard-copied at any time.
Due to the excellent long term stability of the CTD sensors and the electronic circuitry of the SD204, the
instrument does not have to be re-calibrated for several years. However, for users requiring periodic
confirmation of calibration, the factory offers an efficient and low cost calibration service. The
calibration procedure and the reference equipment used at the factory are described on the Calibration
Certificate as shown on next page.
If owner wants to perform calibration on his own, the manufacturer will provide useful guidance on
request.
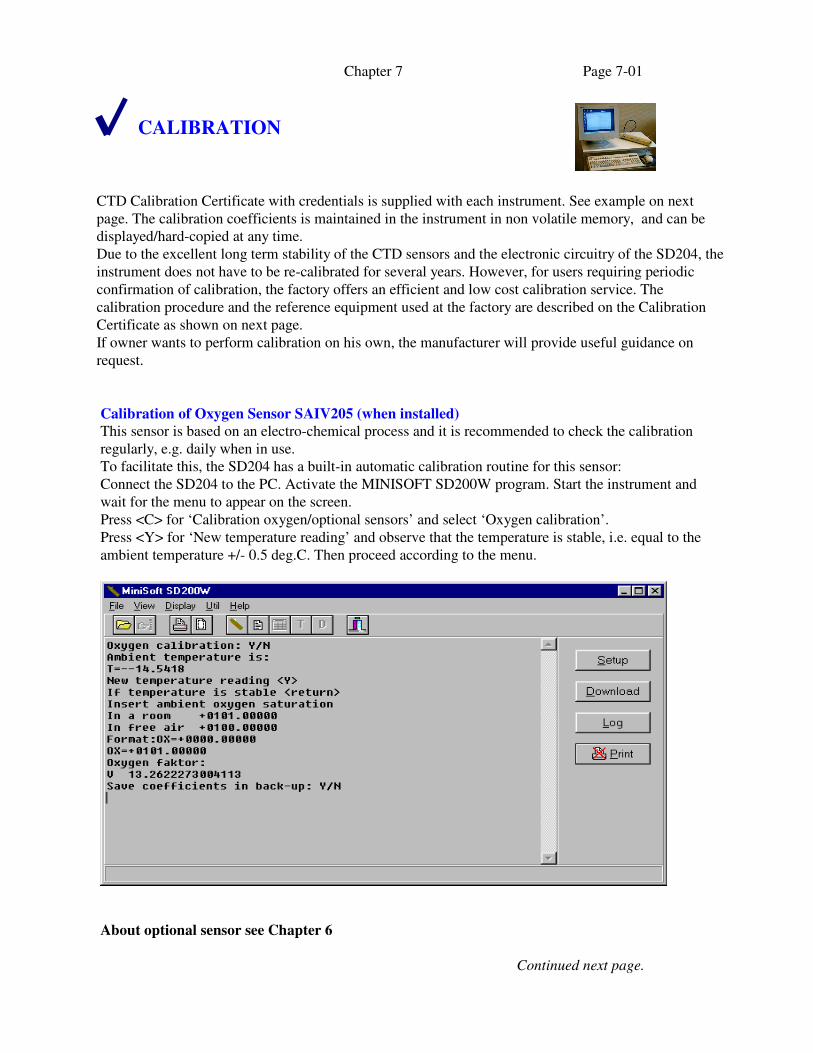
Calibration of Oxygen Sensor SAIV205 (when installed)
This sensor is based on an electro-chemical process and it is recommended to check the calibration
regularly, e.g. daily when in use.
To facilitate this, the SD204 has a built-in automatic calibration routine for this sensor:
Connect the SD204 to the PC. Activate the MINISOFT SD200W program. Start the instrument and
wait for the menu to appear on the screen.
Press <C> for ‘Calibration oxygen/optional sensors’ and select ‘Oxygen calibration’.
Press <Y> for ‘New temperature reading’ and observe that the temperature is stable, i.e. equal to the
ambient temperature +/- 0.5 deg.C. Then proceed according to the menu.
About optional sensor see Chapter 6
Continued next page.
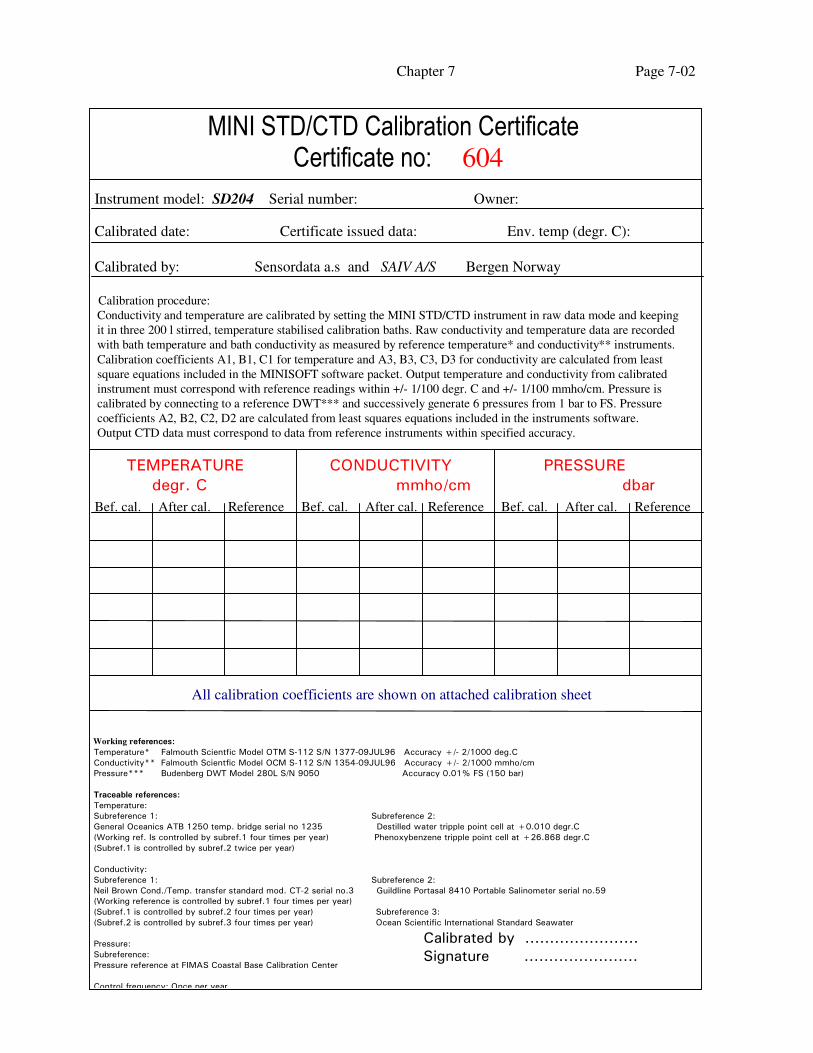
Chapter 7 Page 7-02
Instrument model: SD204 Serial number: Owner:
Calibrated date: Certificate issued data: Env. temp (degr. C):
Calibrated by: Sensordata a.s and SAIV A/S Bergen Norway
Calibration procedure:
Conductivity and temperature are calibrated by setting the MINI STD/CTD instrument in raw data mode and keeping
it in three 200 l stirred, temperature stabilised calibration baths. Raw conductivity and temperature data are recorded
with bath temperature and bath conductivity as measured by reference temperature* and conductivity** instruments.
Calibration coefficients A1, B1, C1 for temperature and A3, B3, C3, D3 for conductivity are calculated from least
square equations included in the MINISOFT software packet. Output temperature and conductivity from calibrated
instrument must correspond with reference readings within +/- 1/100 degr. C and +/- 1/100 mmho/cm. Pressure is
calibrated by connecting to a reference DWT*** and successively generate 6 pressures from 1 bar to FS. Pressure
coefficients A2, B2, C2, D2 are calculated from least squares equations included in the instruments software.
Output CTD data must correspond to data from reference instruments within specified accuracy.
TEMPERATURE CONDUCTIVITY PRESSURE
degr. C mmho/cm dbar
Bef. cal. After cal. Reference Bef. cal. After cal. Reference Bef. cal. After cal. Reference
Working references:
Temperature* Falmouth Scientfic Model OTM S-112 S/N 1377-09JUL96 Accuracy +/- 2/1000 deg.C
Conductivity** Falmouth Scientfic Model OCM S-112 S/N 1354-09JUL96 Accuracy +/- 2/1000 mmho/cm
Pressure*** Budenberg DWT Model 280L S/N 9050 Accuracy 0.01% FS (150 bar)
Traceable references:
Temperature:
Subreference 1: Subreference 2:
General Oceanics ATB 1250 temp. bridge serial no 1235 Destilled water tripple point cell at +0.010 degr.C
(Working ref. Is controlled by subref.1 four times per year) Phenoxybenzene tripple point cell at +26.868 degr.C
(Subref.1 is controlled by subref.2 twice per year)
Conductivity:
Subreference 1: Subreference 2:
Neil Brown Cond./Temp. transfer standard mod. CT-2 serial no.3 Guildline Portasal 8410 Portable Salinometer serial no.59
(Working reference is controlled by subref.1 four times per year)
(Subref.1 is controlled by subref.2 four times per year) Subreference 3:
(Subref.2 is controlled by subref.3 four times per year) Ocean Scientific International Standard Seawater
Pressure:
Subreference:
Pressure reference at FIMAS Coastal Base Calibration Center
Control frequency: Once per year
Calibrated by .......................
Signature .......................
MINI STD/CTD Calibration Certificate
Certificate no: 604
All calibration coefficients are shown on attached calibration sheet
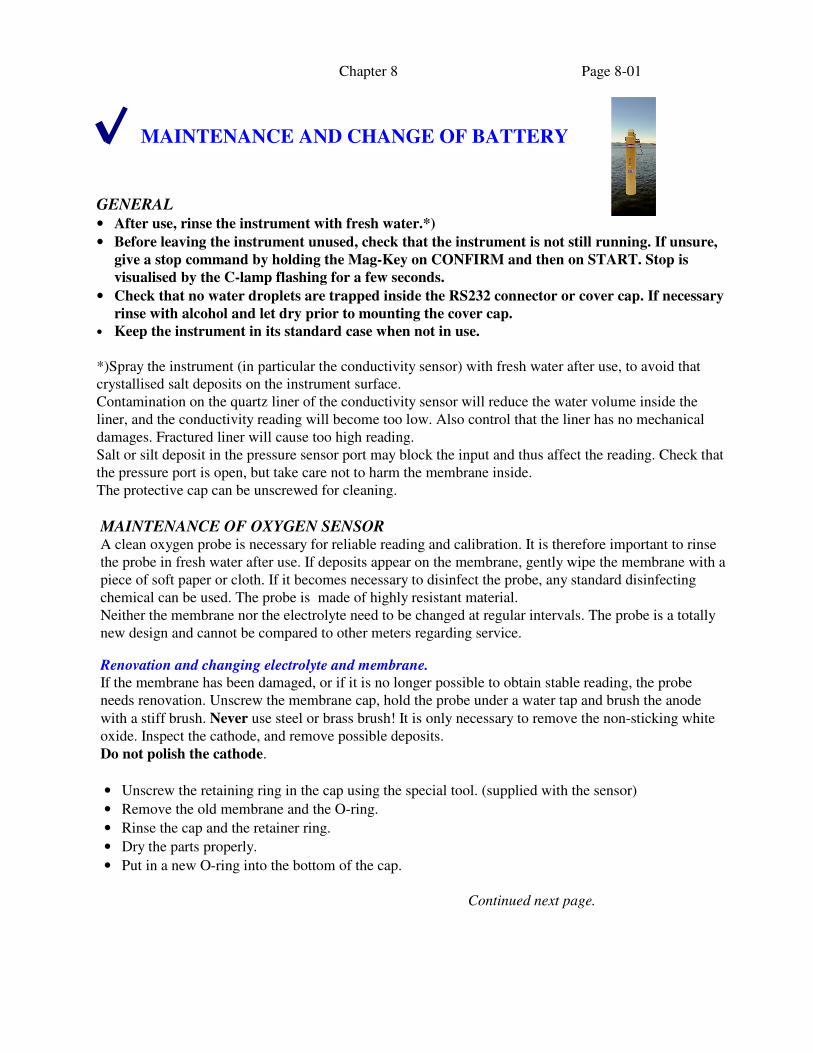
Chapter 8 Page 8-01
MAINTENANCE AND CHANGE OF BATTERY
GENERAL
• After use, rinse the instrument with fresh water.*)
• Before leaving the instrument unused, check that the instrument is not still running. If unsure,
give a stop command by holding the Mag-Key on CONFIRM and then on START. Stop is
visualised by the C-lamp flashing for a few seconds.
• Check that no water droplets are trapped inside the RS232 connector or cover cap. If necessary
rinse with alcohol and let dry prior to mounting the cover cap.
• Keep the instrument in its standard case when not in use.
*)Spray the instrument (in particular the conductivity sensor) with fresh water after use, to avoid that
crystallised salt deposits on the instrument surface.
Contamination on the quartz liner of the conductivity sensor will reduce the water volume inside the
liner, and the conductivity reading will become too low. Also control that the liner has no mechanical
damages. Fractured liner will cause too high reading.
Salt or silt deposit in the pressure sensor port may block the input and thus affect the reading. Check that
the pressure port is open, but take care not to harm the membrane inside.
The protective cap can be unscrewed for cleaning.
MAINTENANCE OF OXYGEN SENSOR
A clean oxygen probe is necessary for reliable reading and calibration. It is therefore important to rinse
the probe in fresh water after use. If deposits appear on the membrane, gently wipe the membrane with a
piece of soft paper or cloth. If it becomes necessary to disinfect the probe, any standard disinfecting
chemical can be used. The probe is made of highly resistant material.
Neither the membrane nor the electrolyte need to be changed at regular intervals. The probe is a totally
new design and cannot be compared to other meters regarding service.
Renovation and changing electrolyte and membrane.
If the membrane has been damaged, or if it is no longer possible to obtain stable reading, the probe
needs renovation. Unscrew the membrane cap, hold the probe under a water tap and brush the anode
with a stiff brush. Never use steel or brass brush! It is only necessary to remove the non-sticking white
oxide. Inspect the cathode, and remove possible deposits.
Do not polish the cathode.
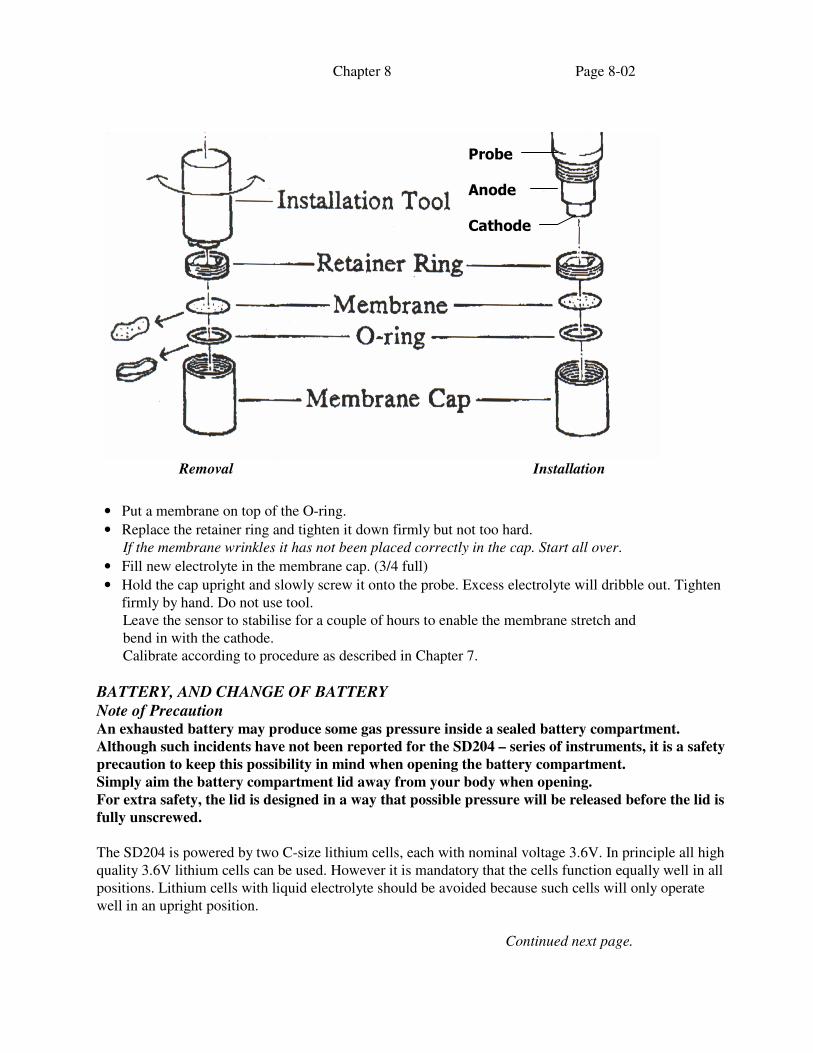
• Unscrew the retaining ring in the cap using the special tool. (supplied with the sensor)
• Remove the old membrane and the O-ring.
• Rinse the cap and the retainer ring.
• Dry the parts properly.
• Put in a new O-ring into the bottom of the cap.
Continued next page.
Chapter 8 Page 8-02
Removal Installation
• Put a membrane on top of the O-ring.
• Replace the retainer ring and tighten it down firmly but not too hard.
If the membrane wrinkles it has not been placed correctly in the cap. Start all over.
• Fill new electrolyte in the membrane cap. (3/4 full)
• Hold the cap upright and slowly screw it onto the probe. Excess electrolyte will dribble out. Tighten
firmly by hand. Do not use tool.
Leave the sensor to stabilise for a couple of hours to enable the membrane stretch and
bend in with the cathode.
Calibrate according to procedure as described in Chapter 7.
BATTERY, AND CHANGE OF BATTERY
Note of Precaution An exhausted battery may produce some gas pressure inside a sealed battery compartment.
Although such incidents have not been reported for the SD204 – series of instruments, it is a safety
precaution to keep this possibility in mind when opening the battery compartment.
Simply aim the battery compartment lid away from your body when opening.
For extra safety, the lid is designed in a way that possible pressure will be released before the lid is
fully unscrewed.
The SD204 is powered by two C-size lithium cells, each with nominal voltage 3.6V. In principle all high
quality 3.6V lithium cells can be used. However it is mandatory that the cells function equally well in all
positions. Lithium cells with liquid electrolyte should be avoided because such cells will only operate
well in an upright position.
Continued next page.
Probe
Anode
Cathode
Chapter 8 Page 8-03
Recommended battery cells:
LSH14, 3.6V SAFT, France
BCX 72 C, 3.6V Electrochem, USA
Both type of cells are available world wide. The SAFT type can be purchased from SAIV at any time.
The instrument has a battery life counter which counts the number of measurements done. In general,
approximately half of the battery capacity will be spent to sustain the measurement process, while the
remaining capacity is spent during readout and programming. When battery life counter reach 1.500.000,
change of battery is recommended.
Practically, most customers change battery yearly, unless the counter has reached the mentioned number
sooner.
The instrument checks the battery voltage continuously, and if the voltage drops below 5V, it will give
the message: ‘LOW BATTERY’ and then halt operation. This ensures that remaining battery capacity is
saved to retain recorded data in the memory. If start is attempted, S- and C-lamps will flash alternately,
signifying that battery is low. If cable is connected the message appears on the PC screen.
Note! In practical use a ‘low battery’ situation may occur in the field where the ambient temperature is
relative low. When the instrument is back in the laboratory, the battery voltage may increase due to
higher temperature and the instrument will allow new start. This may deceive the operator, and from
Serial No.267 the instrument will ‘remember’ that ‘low battery’ occurred. The instrument will refuse to
start, (S- and C-lamps will flash alternately) even if the battery has gained voltage due to increased
ambient temperature. If connected to PC the following message will appear:
!!Warning!!
Low battery detected.
Remember to reset ‘battery life counter’ after installing fresh battery.
Change of battery
The communication cable supplied with the instrument contains a small lithium cell which will support
the internal clock and the memory during battery change. (The programming-key has similar device for
instruments with serial No. up to 200.)
Note! For safety reasons, we recommend that the data in memory is downloaded to PC prior to change
of battery.
Procedure for change of battery:
• Download data in memory (when applicable)
• Set the instrument in passive (See Battery change instruction Chapter 3)
• Leave the cable connected to the RS232 plug /(Programming-key when applicable)
• Unscrew the battery cap
• Insert two fresh lithium cells (+ terminal pointing inwards)
• Inspect the O-ring and reinstall battery cap
• Connect the instrument to your PC and reset battery life counter
Continued next page.

Chapter 8 Page 8-04
Note! If power has been interrupted, either due to battery failure or if the above procedure was not
correctly followed, the internal clock will revert to default setting and stored data will be lost. All other
settings will remain unchanged. After installing fresh battery, the instrument will send the following
message to the PC: ‘Battery power has been interrupted. Internal clock can be corrected. Correct
clock Y/N’
Press <Y> and set the clock. If the keyboard is left unused for more than 10 second the instrument will
continue and status will appear.
It is advised in such cases to check that all calibration coefficients are unchanged. Compare with your
hard copy of the calibration sheet.
O-RING SEALS The SD204 is equipped with two O-ring seals. One on the battery cap, and one on the RS232 connector.
It is practical to install new O-ring at the time of changing battery.
O-rings: R-3100 (Battery cap)
R2050 (RS232 connector)