Embed Size (px)
Citation preview
1
SCS Span Capital Services
Entertainment & Media Industry- Set To Take Off Feb 2002
Price PER Recom'tionRs Rsm USDm FY01 FY02E FY03F
Mukta Arts 91 2057 43 34.2 14.4 10.4 BUY
Magnasound 30 315 7 63.0 NA 28.6 SUBSCRIBE
Saregama 124 1158 24 23.0 NA NA HOLD
Tips 164 1970 41 27.4 NA NA HOLD
ETC 29 403 8 16.5 16.4 9.5 BUY
SABTNL 191 1606 33 15.5 18.9 9.3 BUY
Balaji 408 4202 88 96.4 12.9 8.5 BUY
CEEITV 12 175 4 19.5 8.7 5.3 SUBSCRIBE
Cinevistaas 45 456 9 NA NA 7.7 BUY
Creative Eye 35 702 15 17.4 14.7 7.1 BUY
PNC 42 440 9 9.5 7.2 5.9 BUY
TV18 109 1192 25 37.5 NA 53.7 SELL
Adlabs 53 1140 24 9.2 8.8 9.9 HOLD
Galaxy 4 35 1 NA NA NA HOLDMukta Financial Year- Jan-Dec, Figures for CY00, CY01, CY02EMagnasound Financial Year- Oct-Sept, Figures for FY99/00/01, FY01- 6 MonthsSABTNL FY03- Consolidated with ChannelTV18 FY02/FY03- Consolidated with Subsidiaries
Market Cap
Post-Production/ Movie Exhibitors
Movie Content Producers
Music Companies
Broadcasters
Television Content Producers
2
Span Capital Services
Address
www.spancap.com
1104, Maker Chamber V,Nariman Point,
Mumbai- 400 021
Tel- 91 22 281 9383Telefax- 91 22 282 6643, Ext-26
AnalystSETU DIVEKAR, EXT-21
SalesNIRAJ SOMAIYA, [email protected]
KAUSHIK SHAH, [email protected]
3
CONTENT INDEXPage
Entertainment & Media Industry
Movie Industry-
Mukta Arts Ltd.
Music Industry-
Magnasound India Ltd.
Saregama India Ltd.
Tips Industries Ltd.
Broadcasting Industry-
ETC Networks Ltd.
Sri Adhikari Brothers Television Networks Ltd.
Television Content Producers-
Balaji Telefilms Ltd.
CEE I TV India Ltd.
Cinevistaas Ltd.
Creative Eye Ltd.
Pritish Nandy Communications Ltd.
Television 18 Ltd.
Post-Production/ Movie Exhibitors
Adlabs Films Ltd.
Galaxy Multimedia Ltd.
Comparison Table
4
5
7
9
11
13
15
17
19
21
23
25
27
29
31
33
35
37
38
40
42
4
Entertainment & Media Industry:
Indian Entertainment and Media Industry is clearly going through thetransition and consolidation phase. The ongoing consolidation wouldchange industry's shape for forever for good. We tried to understandthe trends, which are surfacing in the process. We analyzed themajor industry segments and the performance of the major playersin each segment, though we couldn't cover every corner of theindustry.
We tried to understand-
Movie Industry-The success ratio has consistently come down, but at the same timenew revenue avenues offered tremendous non-exploitedopportunities to the quality content producers. The entry of bigcorporate houses and corporatisation would change industry's facefor forever.
Music Industry-The gold rush to acquire music content at inflated prices, sluggishofftake and the poor quality content are the main culprits forindustry's problems. The industry is fighting back with an 'aggressivepricing' policy, reducing acquisition cost and by applying qualitystandards. The consolidation is imminent in the industry.
Broadcasting Industry-Advertising industry, the main revenue source for the broadcasterswas flat last year due to the sluggishness in the economy. Themarket also declared its verdict in favor of three leadingbroadcasters. The other players would either merge with leaders orclose the shop. Subscription revenue and an expected growth inadvertising revenue linked to economy will drive the future growth.
Television Content Producers-The bargaining power is clearly tilted towards content producersthan broadcasters as the latter scrambled to get best quality showon its channel, to attract more eyeballs. The industry has shifted itsloyalty in favor of commissioned programs from sponsored onesearlier. TRP linked incentives and the possible hold on IPR, even onsatellite channels, have made proposition more attractive to contentproducers.
Post- Production/ Film Exhibition:Low entry barrier, high Capex and a long break even period makesthese projects unattractive. In house Post-production by contentproducers have made life miserable for the pure post-productionhouses. Lack of quality content, low capacity utilization and anincreased operational cost are the main threats to the industry.Synergetic business diversification is the key to survival and growthfor the industry.
Transition Phase
5
Movie Industry
Corporatization
It was a mixed year for Hindi film industry, while few multistarer moviesbiting the dust; there were few successful movies like 'Lagaan', 'KabhiKhushi Kabhi Gham' and 'Gadar'. The success ratio was intact at 10% inCY01, as only one out of ten movies was a Hit and made money for theirproducers. Last year there was no clear trend in the industry as films in allcategories failed and succeeded with a same vigor. Films with strongscripts and directors' ability of story telling ruled the audiences' mindshare.
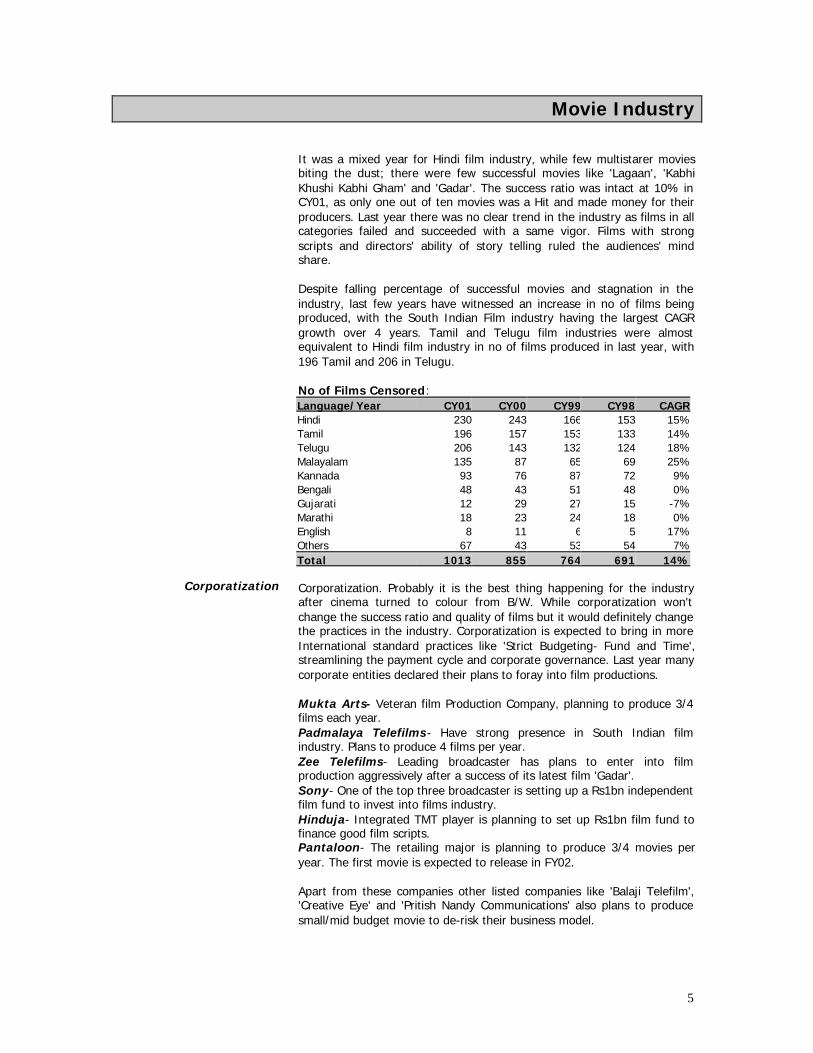
Despite falling percentage of successful movies and stagnation in theindustry, last few years have witnessed an increase in no of films beingproduced, with the South Indian Film industry having the largest CAGRgrowth over 4 years. Tamil and Telugu film industries were almostequivalent to Hindi film industry in no of films produced in last year, with196 Tamil and 206 in Telugu.
No of Films Censored:Language/Year CY01 CY00 CY99 CY98 CAGRHindi 230 243 166 153 15%Tamil 196 157 153 133 14%Telugu 206 143 132 124 18%Malayalam 135 87 65 69 25%Kannada 93 76 87 72 9%Bengali 48 43 51 48 0%Gujarati 12 29 27 15 -7%Marathi 18 23 24 18 0%English 8 11 6 5 17%Others 67 43 53 54 7%Total 1013 855 764 691 14%
Corporatization. Probably it is the best thing happening for the industryafter cinema turned to colour from B/W. While corporatization won'tchange the success ratio and quality of films but it would definitely changethe practices in the industry. Corporatization is expected to bring in moreInternational standard practices like 'Strict Budgeting- Fund and Time',streamlining the payment cycle and corporate governance. Last year manycorporate entities declared their plans to foray into film productions.
Mukta Arts- Veteran film Production Company, planning to produce 3/4films each year.Padmalaya Telefilms- Have strong presence in South Indian filmindustry. Plans to produce 4 films per year.Zee Telefilms- Leading broadcaster has plans to enter into filmproduction aggressively after a success of its latest film 'Gadar'.Sony- One of the top three broadcaster is setting up a Rs1bn independentfilm fund to invest into films industry.Hinduja- Integrated TMT player is planning to set up Rs1bn film fund tofinance good film scripts.Pantaloon- The retailing major is planning to produce 3/4 movies peryear. The first movie is expected to release in FY02.
Apart from these companies other listed companies like 'Balaji Telefilm','Creative Eye' and 'Pritish Nandy Communications' also plans to producesmall/mid budget movie to de-risk their business model.
6
Business Potential
Future Unfolds
Its purely the un-exploited market potential of the film industry that drivesthese companies to pursue their plans of film production. Today filmindustry is no more dependent only on Indian Theatrical revenuecollection. The new revenue avenues and an improved realization from theexisting revenue sources have enhanced the success chance of the filmindustry.
Overseas Theatrical Revenue- The success of 'Kabhi Khushi KabhiGham'- estimated revenue Rs200-250m and 'Lagaan'- estimated revenueRs200m has forced other producers to look at this market more seriouslyand an urgent need to improve technical aspects of the film. The openingup of an overseas market is expected to enhance production qualities atthe par with International standards, which would be helpful to attractdisappearing audience towards cinema halls.
Music Revenue- Despite all problems and falling sales in a musicindustry, Music revenue covers a major part of the film production cost.We believe music revenue will be rationalized going forward and itscontribution to movie industry revenue would come down to around 20%from an existing 32%.
In Film Advertising- If done smartly, this is an excellent revenueresource for the film industry and producer can recover around 5%+ of itsproduction cost.
Satellite/Terrestrial Rights Sale- Realization from satellite/terrestrialright sale would be dependent on broadcasting industry and tends tofluctuate a lot. Rights sale at the right time is the key to enhance overallrealization of the product.
Cable/DVD/VCD- Cable and DVD/VCD rights sale provides some icingon cake but not exactly to the potential of the market. The realization islow and does not cover much of the production cost, as piracy is rampantin this market.
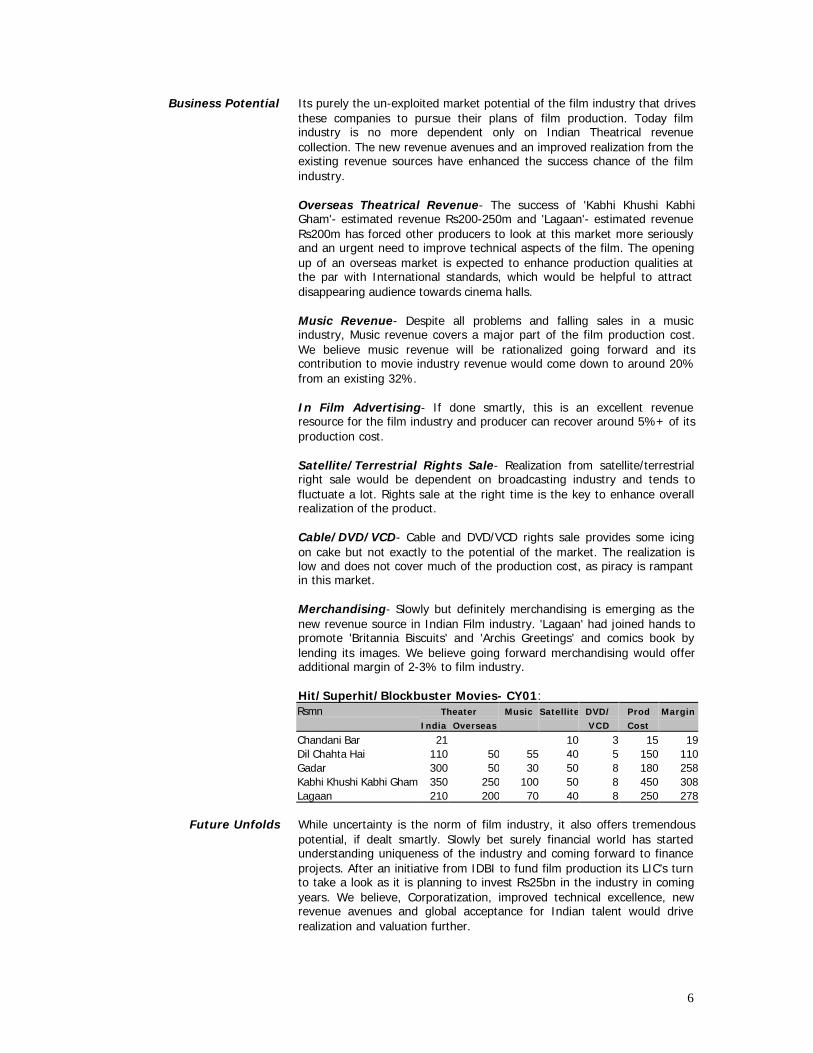
Merchandising- Slowly but definitely merchandising is emerging as thenew revenue source in Indian Film industry. 'Lagaan' had joined hands topromote 'Britannia Biscuits' and 'Archis Greetings' and comics book bylending its images. We believe going forward merchandising would offeradditional margin of 2-3% to film industry.
Hit/Superhit/Blockbuster Movies- CY01:Rsmn Theater Music Satellite DVD/ Prod Margin
India Overseas VCD Cost
Chandani Bar 21 10 3 15 19Dil Chahta Hai 110 50 55 40 5 150 110Gadar 300 50 30 50 8 180 258Kabhi Khushi Kabhi Gham 350 250 100 50 8 450 308Lagaan 210 200 70 40 8 250 278
While uncertainty is the norm of film industry, it also offers tremendouspotential, if dealt smartly. Slowly bet surely financial world has startedunderstanding uniqueness of the industry and coming forward to financeprojects. After an initiative from IDBI to fund film production its LIC’s turnto take a look as it is planning to invest Rs25bn in the industry in comingyears. We believe, Corporatization, improved technical excellence, newrevenue avenues and global acceptance for Indian talent would driverealization and valuation further.
7
Mukta Arts Ltd. (Rs91) BUY
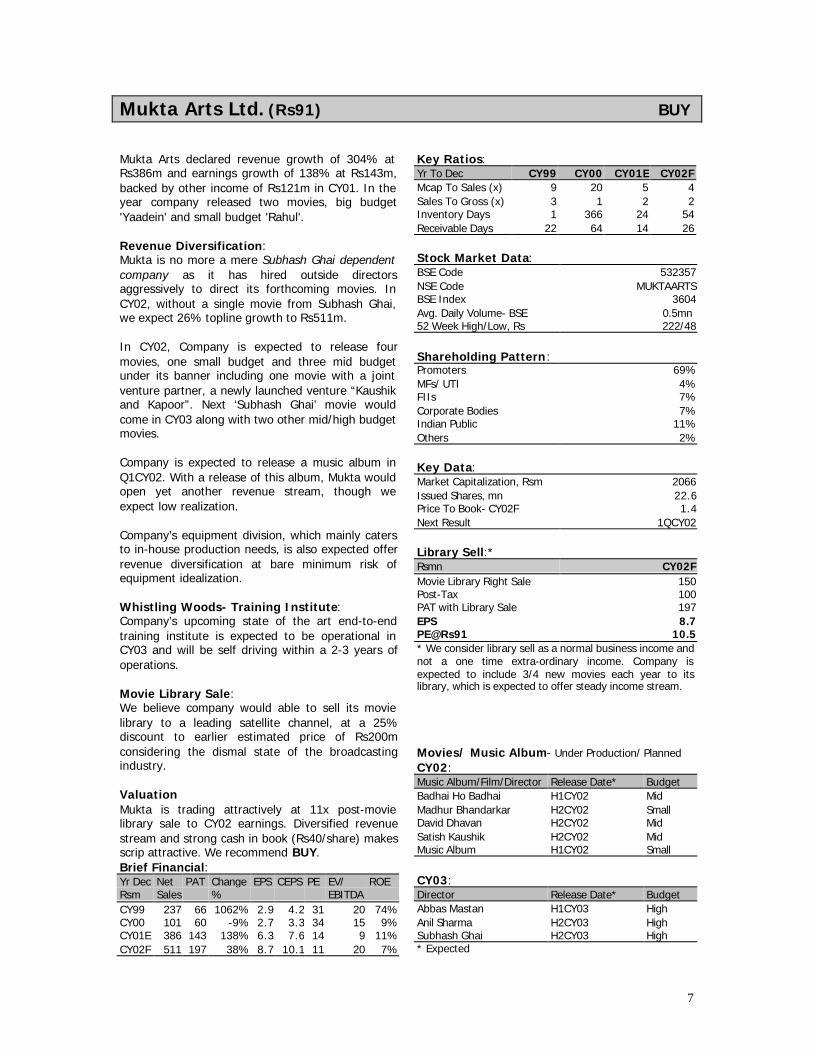
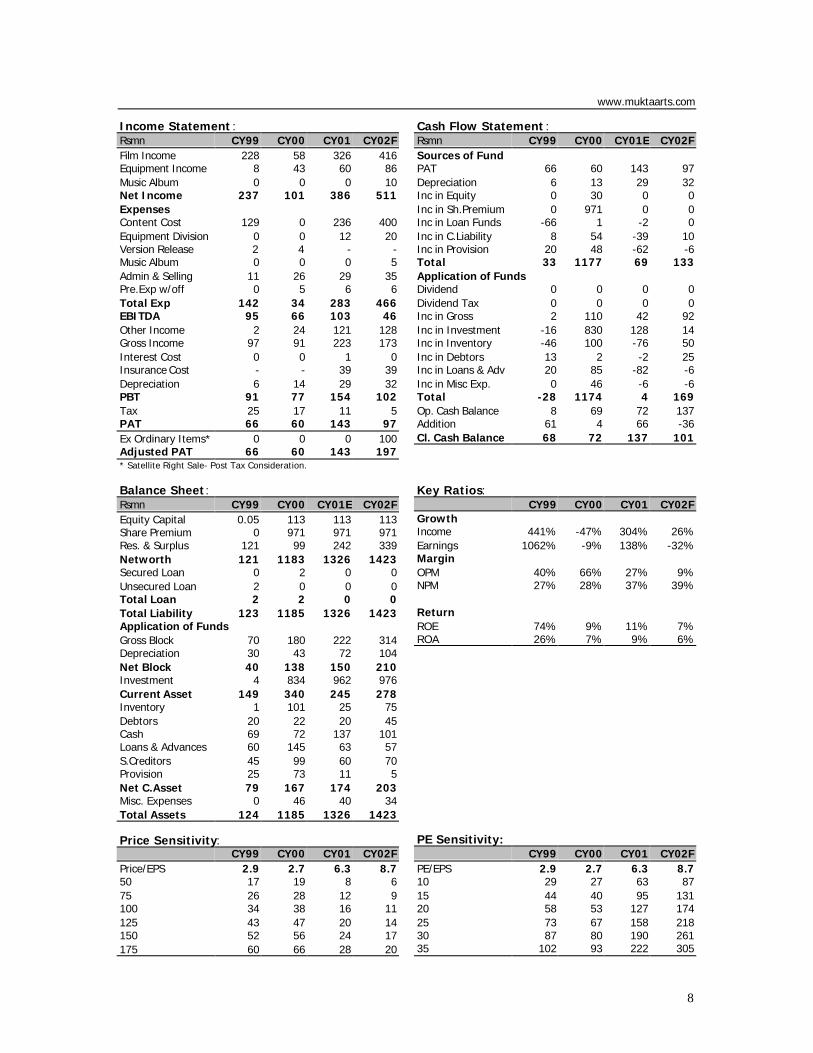
Mukta Arts declared revenue growth of 304% atRs386m and earnings growth of 138% at Rs143m,backed by other income of Rs121m in CY01. In theyear company released two movies, big budget'Yaadein' and small budget 'Rahul'.
Revenue Diversification:Mukta is no more a mere Subhash Ghai dependentcompany as it has hired outside directorsaggressively to direct its forthcoming movies. InCY02, without a single movie from Subhash Ghai,we expect 26% topline growth to Rs511m.
In CY02, Company is expected to release fourmovies, one small budget and three mid budgetunder its banner including one movie with a jointventure partner, a newly launched venture “Kaushikand Kapoor”. Next ‘Subhash Ghai’ movie wouldcome in CY03 along with two other mid/high budgetmovies.
Company is expected to release a music album inQ1CY02. With a release of this album, Mukta wouldopen yet another revenue stream, though weexpect low realization.
Company’s equipment division, which mainly catersto in-house production needs, is also expected offerrevenue diversification at bare minimum risk ofequipment idealization.
Whistling Woods- Training Institute:Company’s upcoming state of the art end-to-endtraining institute is expected to be operational inCY03 and will be self driving within a 2-3 years ofoperations.
Movie Library Sale:We believe company would able to sell its movielibrary to a leading satellite channel, at a 25%discount to earlier estimated price of Rs200mconsidering the dismal state of the broadcastingindustry.
ValuationMukta is trading attractively at 11x post-movielibrary sale to CY02 earnings. Diversified revenuestream and strong cash in book (Rs40/share) makesscrip attractive. We recommend BUY.Brief Financial:Yr Dec Net PAT Change EPS CEPS PE EV/ ROERsm Sales % EBITDACY99 237 66 1062% 2.9 4.2 31 20 74%CY00 101 60 -9% 2.7 3.3 34 15 9%CY01E 386 143 138% 6.3 7.6 14 9 11%CY02F 511 197 38% 8.7 10.1 11 20 7%
Key Ratios:Yr To Dec CY99 CY00 CY01E CY02FMcap To Sales (x) 9 20 5 4Sales To Gross (x) 3 1 2 2Inventory Days 1 366 24 54Receivable Days 22 64 14 26
Stock Market Data:BSE Code 532357NSE Code MUKTAARTSBSE Index 3604Avg. Daily Volume- BSE 0.5mn52 Week High/Low, Rs 222/48
Shareholding Pattern:Promoters 69%MFs/ UTI 4%FIIs 7%Corporate Bodies 7%Indian Public 11%Others 2%
Key Data:Market Capitalization, Rsm 2066Issued Shares, mn 22.6Price To Book- CY02F 1.4Next Result 1QCY02
Library Sell:*Rsmn CY02FMovie Library Right Sale 150Post-Tax 100PAT with Library Sale 197EPS 8.7PE@Rs91 10.5* We consider library sell as a normal business income andnot a one time extra-ordinary income. Company isexpected to include 3/4 new movies each year to itslibrary, which is expected to offer steady income stream.
Movies/ Music Album- Under Production/ PlannedCY02:Music Album/Film/Director Release Date* BudgetBadhai Ho Badhai H1CY02 MidMadhur Bhandarkar H2CY02 SmallDavid Dhavan H2CY02 MidSatish Kaushik H2CY02 MidMusic Album H1CY02 Small
CY03:Director Release Date* BudgetAbbas Mastan H1CY03 HighAnil Sharma H2CY03 HighSubhash Ghai H2CY03 High* Expected
8
www.muktaarts.com
Income Statement :Rsmn CY99 CY00 CY01 CY02FFilm Income 228 58 326 416Equipment Income 8 43 60 86Music Album 0 0 0 10Net Income 237 101 386 511ExpensesContent Cost 129 0 236 400Equipment Division 0 0 12 20Version Release 2 4 - -Music Album 0 0 0 5Admin & Selling 11 26 29 35Pre.Exp w/off 0 5 6 6Total Exp 142 34 283 466EBITDA 95 66 103 46Other Income 2 24 121 128Gross Income 97 91 223 173Interest Cost 0 0 1 0Insurance Cost - - 39 39Depreciation 6 14 29 32PBT 91 77 154 102Tax 25 17 11 5PAT 66 60 143 97Ex Ordinary Items* 0 0 0 100Adjusted PAT 66 60 143 197* Satellite Right Sale- Post Tax Consideration.
Balance Sheet:Rsmn CY99 CY00 CY01E CY02FEquity Capital 0.05 113 113 113Share Premium 0 971 971 971Res. & Surplus 121 99 242 339Networth 121 1183 1326 1423Secured Loan 0 2 0 0Unsecured Loan 2 0 0 0Total Loan 2 2 0 0Total Liability 123 1185 1326 1423Application of FundsGross Block 70 180 222 314Depreciation 30 43 72 104Net Block 40 138 150 210Investment 4 834 962 976Current Asset 149 340 245 278Inventory 1 101 25 75Debtors 20 22 20 45Cash 69 72 137 101Loans & Advances 60 145 63 57S.Creditors 45 99 60 70Provision 25 73 11 5Net C.Asset 79 167 174 203Misc. Expenses 0 46 40 34Total Assets 124 1185 1326 1423
Price Sensitivity:CY99 CY00 CY01 CY02F
Price/EPS 2.9 2.7 6.3 8.750 17 19 8 675 26 28 12 9100 34 38 16 11125 43 47 20 14150 52 56 24 17175 60 66 28 20
Cash Flow Statement :Rsmn CY99 CY00 CY01E CY02FSources of FundPAT 66 60 143 97Depreciation 6 13 29 32Inc in Equity 0 30 0 0Inc in Sh.Premium 0 971 0 0Inc in Loan Funds -66 1 -2 0Inc in C.Liability 8 54 -39 10Inc in Provision 20 48 -62 -6Total 33 1177 69 133Application of FundsDividend 0 0 0 0Dividend Tax 0 0 0 0Inc in Gross 2 110 42 92Inc in Investment -16 830 128 14Inc in Inventory -46 100 -76 50Inc in Debtors 13 2 -2 25Inc in Loans & Adv 20 85 -82 -6Inc in Misc Exp. 0 46 -6 -6Total -28 1174 4 169Op. Cash Balance 8 69 72 137Addition 61 4 66 -36Cl. Cash Balance 68 72 137 101
Key Ratios:CY99 CY00 CY01 CY02F
GrowthIncome 441% -47% 304% 26%Earnings 1062% -9% 138% -32%MarginOPM 40% 66% 27% 9%NPM 27% 28% 37% 39%
ReturnROE 74% 9% 11% 7%ROA 26% 7% 9% 6%
PE Sensitivity:CY99 CY00 CY01 CY02F
PE/EPS 2.9 2.7 6.3 8.710 29 27 63 8715 44 40 95 13120 58 53 127 17425 73 67 158 21830 87 80 190 26135 102 93 222 305
9
Music Industry
Music Acquisition Cost
Piracy
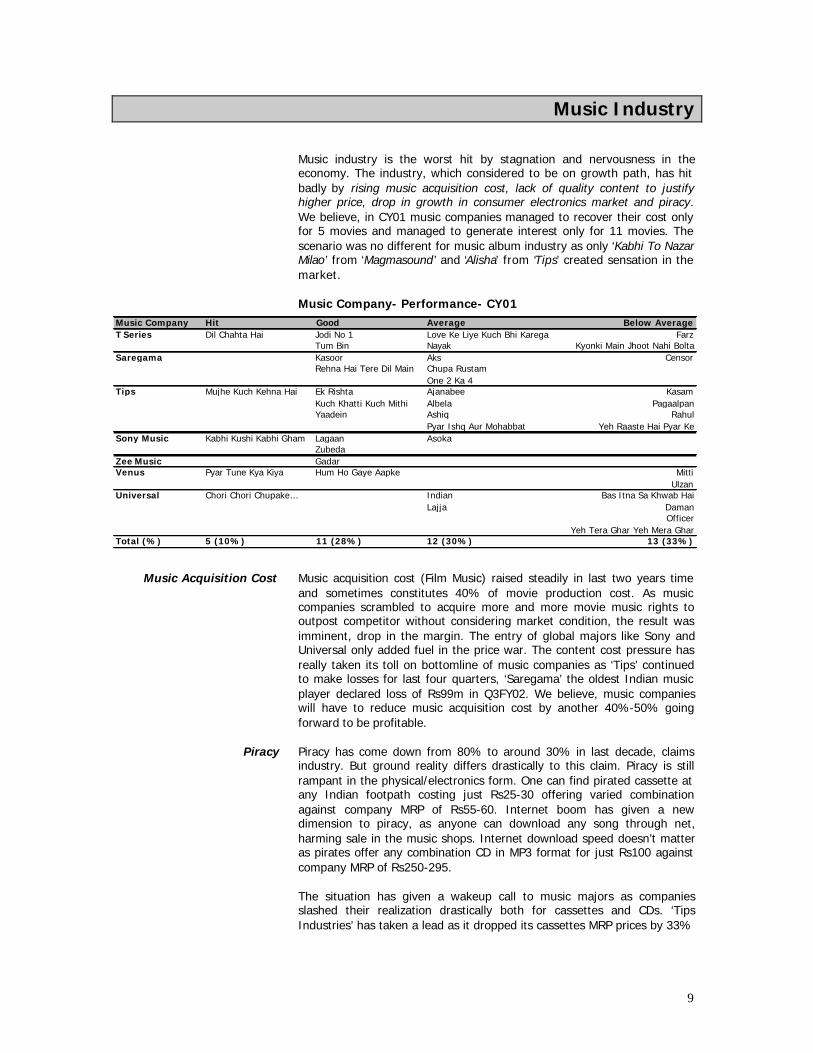
Music industry is the worst hit by stagnation and nervousness in theeconomy. The industry, which considered to be on growth path, has hitbadly by rising music acquisition cost, lack of quality content to justifyhigher price, drop in growth in consumer electronics market and piracy.We believe, in CY01 music companies managed to recover their cost onlyfor 5 movies and managed to generate interest only for 11 movies. Thescenario was no different for music album industry as only ‘Kabhi To NazarMilao’ from ‘Magmasound ’ and ‘Alisha’ from ‘Tips’ created sensation in themarket.
Music Company- Performance- CY01
Music acquisition cost (Film Music) raised steadily in last two years timeand sometimes constitutes 40% of movie production cost. As musiccompanies scrambled to acquire more and more movie music rights tooutpost competitor without considering market condition, the result wasimminent, drop in the margin. The entry of global majors like Sony andUniversal only added fuel in the price war. The content cost pressure hasreally taken its toll on bottomline of music companies as ‘Tips’ continuedto make losses for last four quarters, ‘Saregama’ the oldest Indian musicplayer declared loss of Rs99m in Q3FY02. We believe, music companieswill have to reduce music acquisition cost by another 40%-50% goingforward to be profitable.
Piracy has come down from 80% to around 30% in last decade, claimsindustry. But ground reality differs drastically to this claim. Piracy is stillrampant in the physical/electronics form. One can find pirated cassette atany Indian footpath costing just Rs25-30 offering varied combinationagainst company MRP of Rs55-60. Internet boom has given a newdimension to piracy, as anyone can download any song through net,harming sale in the music shops. Internet download speed doesn’t matteras pirates offer any combination CD in MP3 format for just Rs100 againstcompany MRP of Rs250-295.
The situation has given a wakeup call to music majors as companiesslashed their realization drastically both for cassettes and CDs. ‘TipsIndustries’ has taken a lead as it dropped its cassettes MRP prices by 33%
Music Company Hit Good Average Below AverageT Series Dil Chahta Hai Jodi No 1 Love Ke Liye Kuch Bhi Karega Farz
Tum Bin Nayak Kyonki Main Jhoot Nahi BoltaSaregama Kasoor Aks Censor
Rehna Hai Tere Dil Main Chupa RustamOne 2 Ka 4
Tips Mujhe Kuch Kehna Hai Ek Rishta Ajanabee KasamKuch Khatti Kuch Mithi Albela PagaalpanYaadein Ashiq Rahul
Pyar Ishq Aur Mohabbat Yeh Raaste Hai Pyar KeSony Music Kabhi Kushi Kabhi Gham Lagaan Asoka
ZubedaZee Music GadarVenus Pyar Tune Kya Kiya Hum Ho Gaye Aapke Mitti
UlzanUniversal Chori Chori Chupake… Indian Bas Itna Sa Khwab Hai
Lajja DamanOfficer
Yeh Tera Ghar Yeh Mera GharTotal (%) 5 (10%) 11 (28%) 12 (30%) 13 (33%)
10
Content Quality
Future Unfolds
to Rs40 from a high of Rs60 and CD MRP prices by 68% to Rs95 from ahigh of Rs295. We believe, such a bold step would definitely earn yield inthe long run in curbing piracy to the great extent and improving share ofCD sales in total music sale. We expect the result of this aggressive pricingpolicy will be evident only after 2/3 quarters, as companies have to pushvolume more aggressively to justify price cut to maintain profitability.
Music quality is the most important factor in industry's success, whichwould drive industry in future. Lack of adequate films with good music isthe root cause for industry’s woes. Last year only five films had a music,which appealed to the audience clearly shows the dearth of qualitycontent. Unless the situation improves and fresh talent flows in like in caseof ‘Dil Chahta Hai’, we are not very optimistic for the industry.
Success of ‘Aggressive Pricing’ policy in curbing piracy has already startedshowing signs of improving volume. Increase percentage of CD sale intotal music sale, recovery of economy to improve sale of consumerelectronics items and most importantly, the improved music quality woulddrive future valuation of the industry.
11
Magnasound India (Rs30) Subscribe
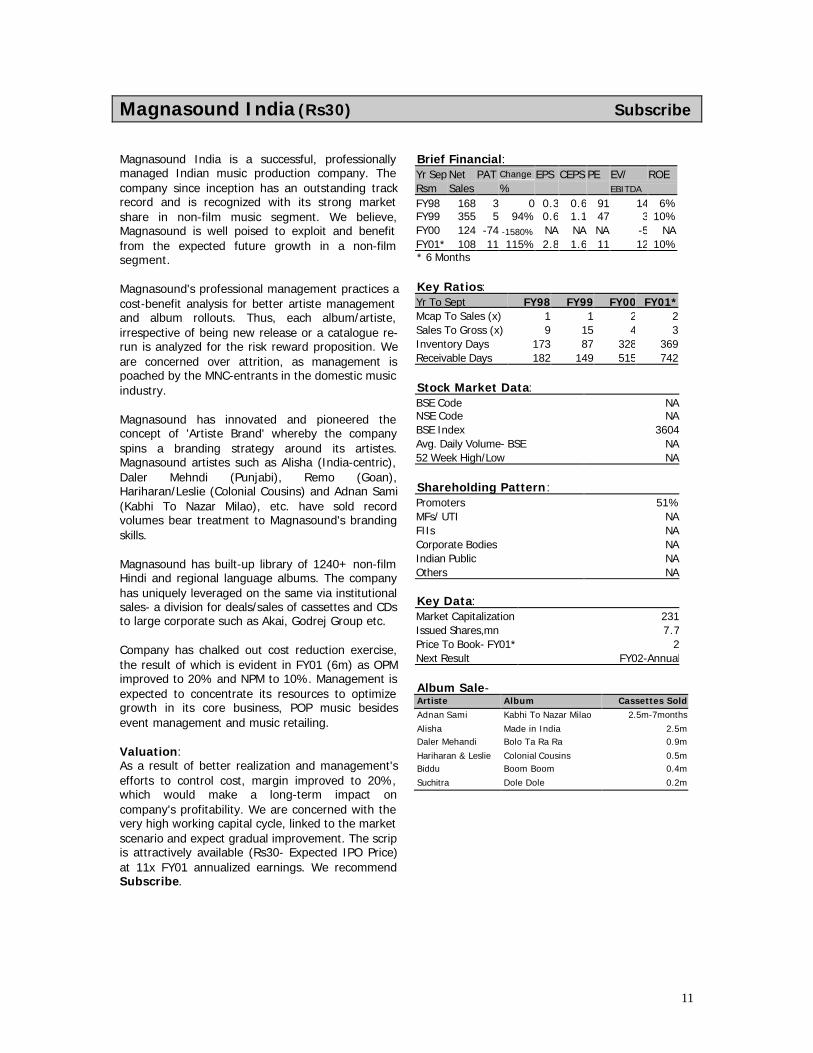
Magnasound India is a successful, professionallymanaged Indian music production company. Thecompany since inception has an outstanding trackrecord and is recognized with its strong marketshare in non-film music segment. We believe,Magnasound is well poised to exploit and benefitfrom the expected future growth in a non-filmsegment.
Magnasound's professional management practices acost-benefit analysis for better artiste managementand album rollouts. Thus, each album/artiste,irrespective of being new release or a catalogue re-run is analyzed for the risk reward proposition. Weare concerned over attrition, as management ispoached by the MNC-entrants in the domestic musicindustry.
Magnasound has innovated and pioneered theconcept of 'Artiste Brand' whereby the companyspins a branding strategy around its artistes.Magnasound artistes such as Alisha (India-centric),Daler Mehndi (Punjabi), Remo (Goan),Hariharan/Leslie (Colonial Cousins) and Adnan Sami(Kabhi To Nazar Milao), etc. have sold recordvolumes bear treatment to Magnasound's brandingskills.
Magnasound has built-up library of 1240+ non-filmHindi and regional language albums. The companyhas uniquely leveraged on the same via institutionalsales- a division for deals/sales of cassettes and CDsto large corporate such as Akai, Godrej Group etc.
Company has chalked out cost reduction exercise,the result of which is evident in FY01 (6m) as OPMimproved to 20% and NPM to 10%. Management isexpected to concentrate its resources to optimizegrowth in its core business, POP music besidesevent management and music retailing.
Valuation:As a result of better realization and management'sefforts to control cost, margin improved to 20%,which would make a long-term impact oncompany's profitability. We are concerned with thevery high working capital cycle, linked to the marketscenario and expect gradual improvement. The scripis attractively available (Rs30- Expected IPO Price)at 11x FY01 annualized earnings. We recommendSubscribe.
Brief Financial:Yr Sep Net PAT Change EPS CEPS PE EV/ ROERsm Sales % EBITDA
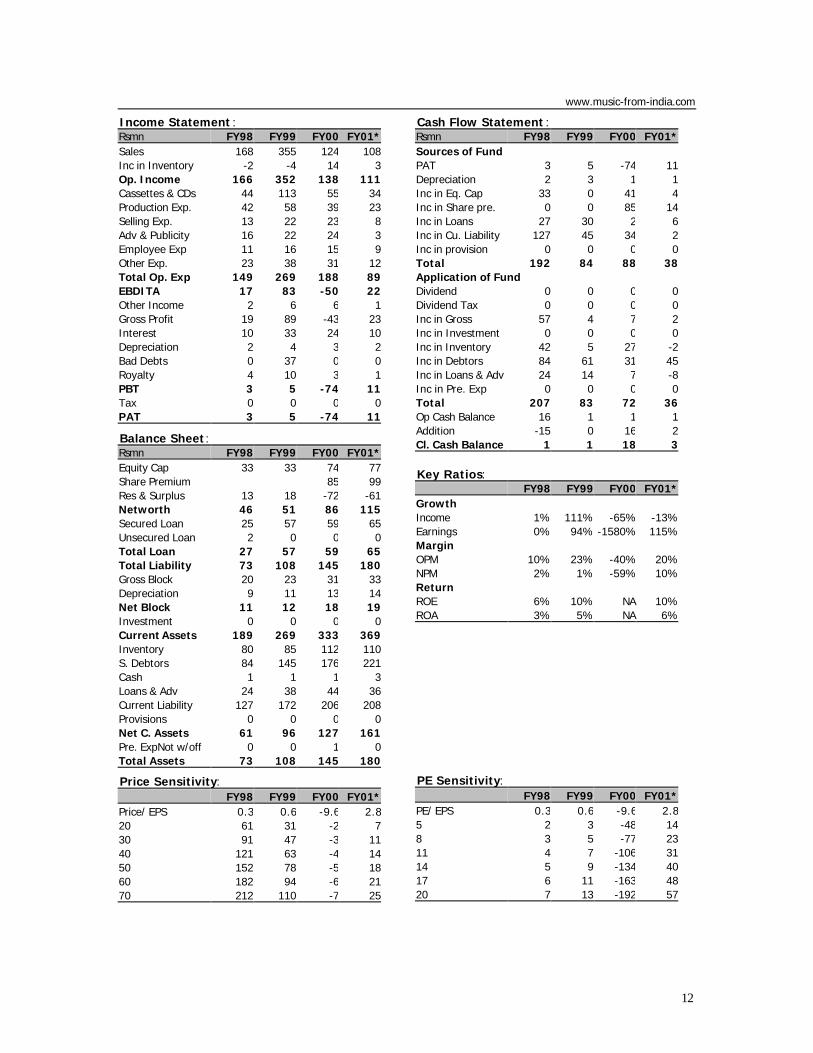
FY98 168 3 0 0.3 0.6 91 14 6%FY99 355 5 94% 0.6 1.1 47 3 10%FY00 124 -74 -1580% NA NA NA -5 NAFY01* 108 11 115% 2.8 1.6 11 12 10%* 6 Months
Key Ratios:Yr To Sept FY98 FY99 FY00 FY01*Mcap To Sales (x) 1 1 2 2Sales To Gross (x) 9 15 4 3Inventory Days 173 87 328 369Receivable Days 182 149 515 742
Stock Market Data:BSE Code NANSE Code NABSE Index 3604Avg. Daily Volume- BSE NA52 Week High/Low NA
Shareholding Pattern:Promoters 51%MFs/ UTI NAFIIs NACorporate Bodies NAIndian Public NAOthers NA
Key Data:Market Capitalization 231Issued Shares,mn 7.7Price To Book- FY01* 2Next Result FY02-Annual
Album Sale-Artiste Album Cassettes Sold
Adnan Sami Kabhi To Nazar Milao 2.5m-7months
Alisha Made in India 2.5mDaler Mehandi Bolo Ta Ra Ra 0.9m
Hariharan & Leslie Colonial Cousins 0.5mBiddu Boom Boom 0.4m
Suchitra Dole Dole 0.2m
12
www.music-from-india.com
Income Statement :Rsmn FY98 FY99 FY00 FY01*Sales 168 355 124 108Inc in Inventory -2 -4 14 3Op. Income 166 352 138 111Cassettes & CDs 44 113 55 34Production Exp. 42 58 39 23Selling Exp. 13 22 23 8Adv & Publicity 16 22 24 3Employee Exp 11 16 15 9Other Exp. 23 38 31 12Total Op. Exp 149 269 188 89EBDITA 17 83 -50 22Other Income 2 6 6 1Gross Profit 19 89 -43 23Interest 10 33 24 10Depreciation 2 4 3 2Bad Debts 0 37 0 0Royalty 4 10 3 1PBT 3 5 -74 11Tax 0 0 0 0PAT 3 5 -74 11
Balance Sheet:Rsmn FY98 FY99 FY00 FY01*Equity Cap 33 33 74 77Share Premium 85 99Res & Surplus 13 18 -72 -61Networth 46 51 86 115Secured Loan 25 57 59 65Unsecured Loan 2 0 0 0Total Loan 27 57 59 65Total Liability 73 108 145 180Gross Block 20 23 31 33Depreciation 9 11 13 14Net Block 11 12 18 19Investment 0 0 0 0Current Assets 189 269 333 369Inventory 80 85 112 110S. Debtors 84 145 176 221Cash 1 1 1 3Loans & Adv 24 38 44 36Current Liability 127 172 206 208Provisions 0 0 0 0Net C. Assets 61 96 127 161Pre. ExpNot w/off 0 0 1 0Total Assets 73 108 145 180
Price Sensitivity: FY98 FY99 FY00 FY01*Price/ EPS 0.3 0.6 -9.6 2.820 61 31 -2 730 91 47 -3 1140 121 63 -4 1450 152 78 -5 1860 182 94 -6 2170 212 110 -7 25
Cash Flow Statement :Rsmn FY98 FY99 FY00 FY01*Sources of Fund PAT 3 5 -74 11Depreciation 2 3 1 1Inc in Eq. Cap 33 0 41 4Inc in Share pre. 0 0 85 14Inc in Loans 27 30 2 6Inc in Cu. Liability 127 45 34 2Inc in provision 0 0 0 0Total 192 84 88 38Application of FundDividend 0 0 0 0Dividend Tax 0 0 0 0Inc in Gross 57 4 7 2Inc in Investment 0 0 0 0Inc in Inventory 42 5 27 -2Inc in Debtors 84 61 31 45Inc in Loans & Adv 24 14 7 -8Inc in Pre. Exp 0 0 0 0Total 207 83 72 36Op Cash Balance 16 1 1 1Addition -15 0 16 2Cl. Cash Balance 1 1 18 3
Key Ratios: FY98 FY99 FY00 FY01*Growth Income 1% 111% -65% -13%Earnings 0% 94% -1580% 115%MarginOPM 10% 23% -40% 20%NPM 2% 1% -59% 10%ReturnROE 6% 10% NA 10%ROA 3% 5% NA 6%
PE Sensitivity: FY98 FY99 FY00 FY01*PE/ EPS 0.3 0.6 -9.6 2.85 2 3 -48 148 3 5 -77 2311 4 7 -106 3114 5 9 -134 4017 6 11 -163 4820 7 13 -192 57
13
Saregama India (Rs124) HOLD
'Saregama India', the oldest Indian music Goliathstarted reeling under market pressure as it declaredRs99m loss in Q3FY02. The result clearly reflectsthe lack of availability of good quality content andan inflated music acquisition cost, which is overduefor correction, sooner than later.
Saregama is fighting back with the situation on bothfronts, to improve sales volume and to reduce itsoperational cost to improve margin. The companyhas aggressively acquired music rights, as almost80% of the big-ticket music rights, to be released inFY03 are with Saregama. Company has identifiedregional and rural market as a core segment forfuture growth and started mass-market project. Theproject would tap devotional and folk genre. Weexpect, the project to add value in the long run,which is currently served by unorganized players.Saregama's VRS and restructuring of its marketingnetwork efforts are expected to bring downoperational cost by Rs60m in FY03.
Company has scaled down its content productionfor FM radio considerably as the industry didn't takeoff as expected due to legal and operationalhassles.
To de-risk business model, Saregama has enteredinto television content production and currentlythree serials are running on regional channels.Serial Language ChannelShoolam Tamil Sun
Telgu- Dubbed GeminiShighram Tamil SunVeelan Tamil Sun
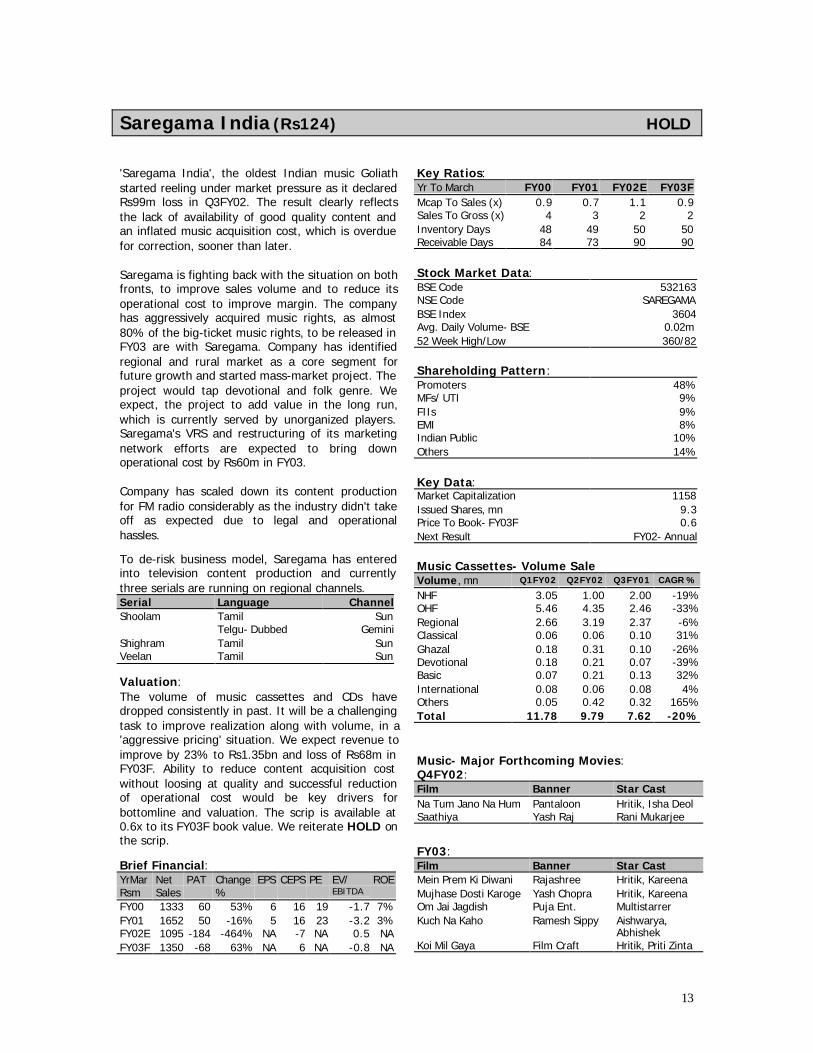
Valuation:The volume of music cassettes and CDs havedropped consistently in past. It will be a challengingtask to improve realization along with volume, in a'aggressive pricing' situation. We expect revenue toimprove by 23% to Rs1.35bn and loss of Rs68m inFY03F. Ability to reduce content acquisition costwithout loosing at quality and successful reductionof operational cost would be key drivers forbottomline and valuation. The scrip is available at0.6x to its FY03F book value. We reiterate HOLD onthe scrip.
Brief Financial:YrMar Net PAT Change EPS CEPS PE EV/ ROERsm Sales % EBITDA
FY00 1333 60 53% 6 16 19 -1.7 7%FY01 1652 50 -16% 5 16 23 -3.2 3%FY02E 1095 -184 -464% NA -7 NA 0.5 NAFY03F 1350 -68 63% NA 6 NA -0.8 NA
Key Ratios:Yr To March FY00 FY01 FY02E FY03FMcap To Sales (x) 0.9 0.7 1.1 0.9Sales To Gross (x) 4 3 2 2Inventory Days 48 49 50 50Receivable Days 84 73 90 90
Stock Market Data:BSE Code 532163NSE Code SAREGAMABSE Index 3604Avg. Daily Volume- BSE 0.02m52 Week High/Low 360/82
Shareholding Pattern:Promoters 48%MFs/ UTI 9%FIIs 9%EMI 8%Indian Public 10%Others 14%
Key Data:Market Capitalization 1158Issued Shares, mn 9.3Price To Book- FY03F 0.6Next Result FY02- Annual
Music Cassettes- Volume SaleVolume, mn Q1FY02 Q2FY02 Q3FY01 CAGR %
NHF 3.05 1.00 2.00 -19%OHF 5.46 4.35 2.46 -33%Regional 2.66 3.19 2.37 -6%Classical 0.06 0.06 0.10 31%Ghazal 0.18 0.31 0.10 -26%Devotional 0.18 0.21 0.07 -39%Basic 0.07 0.21 0.13 32%International 0.08 0.06 0.08 4%Others 0.05 0.42 0.32 165%Total 11.78 9.79 7.62 -20%
Music- Major Forthcoming Movies:Q4FY02:Film Banner Star CastNa Tum Jano Na Hum Pantaloon Hritik, Isha DeolSaathiya Yash Raj Rani Mukarjee
FY03:Film Banner Star CastMein Prem Ki Diwani Rajashree Hritik, KareenaMujhase Dosti Karoge Yash Chopra Hritik, KareenaOm Jai Jagdish Puja Ent. MultistarrerKuch Na Kaho Ramesh Sippy Aishwarya,
AbhishekKoi Mil Gaya Film Craft Hritik, Priti Zinta
14
www.saregama.com
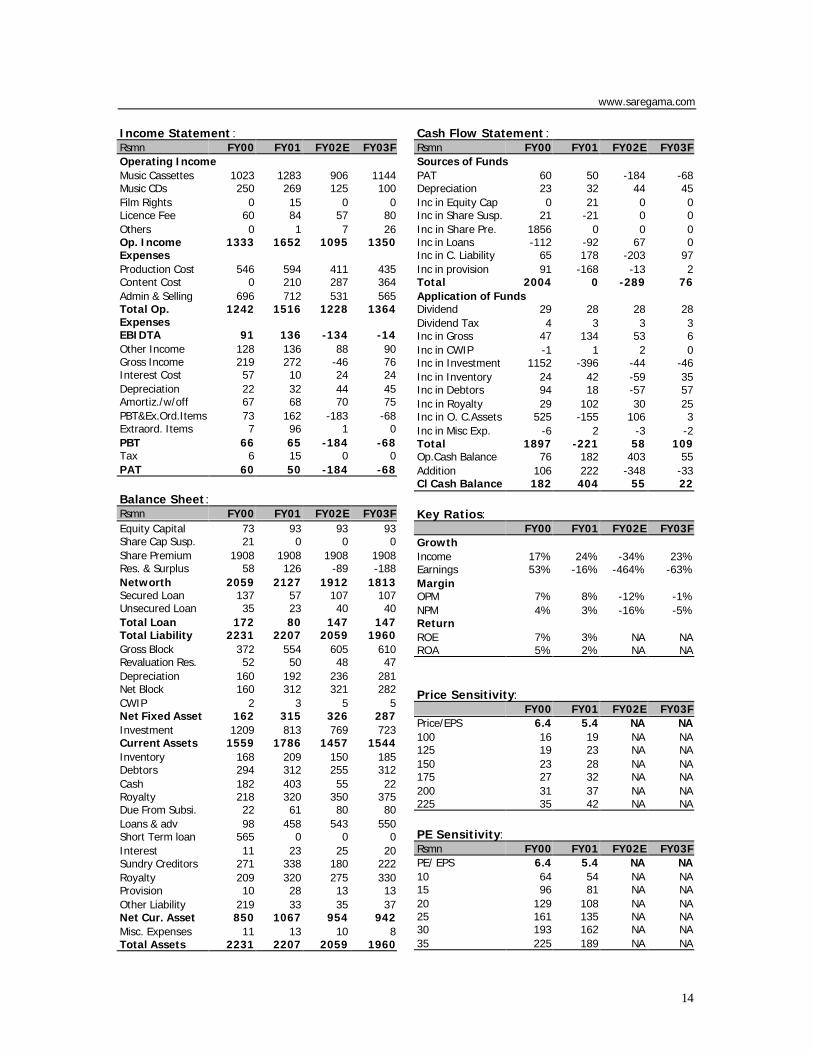
Income Statement :Rsmn FY00 FY01 FY02E FY03FOperating IncomeMusic Cassettes 1023 1283 906 1144Music CDs 250 269 125 100Film Rights 0 15 0 0Licence Fee 60 84 57 80Others 0 1 7 26Op. Income 1333 1652 1095 1350ExpensesProduction Cost 546 594 411 435Content Cost 0 210 287 364Admin & Selling 696 712 531 565Total Op.Expenses
1242 1516 1228 1364
EBIDTA 91 136 -134 -14Other Income 128 136 88 90Gross Income 219 272 -46 76Interest Cost 57 10 24 24Depreciation 22 32 44 45Amortiz./w/off 67 68 70 75PBT&Ex.Ord.Items 73 162 -183 -68Extraord. Items 7 96 1 0PBT 66 65 -184 -68Tax 6 15 0 0PAT 60 50 -184 -68
Balance Sheet:Rsmn FY00 FY01 FY02E FY03FEquity Capital 73 93 93 93Share Cap Susp. 21 0 0 0Share Premium 1908 1908 1908 1908Res. & Surplus 58 126 -89 -188Networth 2059 2127 1912 1813Secured Loan 137 57 107 107Unsecured Loan 35 23 40 40Total Loan 172 80 147 147Total Liability 2231 2207 2059 1960Gross Block 372 554 605 610Revaluation Res. 52 50 48 47Depreciation 160 192 236 281Net Block 160 312 321 282CWIP 2 3 5 5Net Fixed Asset 162 315 326 287Investment 1209 813 769 723Current Assets 1559 1786 1457 1544Inventory 168 209 150 185Debtors 294 312 255 312Cash 182 403 55 22Royalty 218 320 350 375Due From Subsi. 22 61 80 80Loans & adv 98 458 543 550Short Term loan 565 0 0 0Interest 11 23 25 20Sundry Creditors 271 338 180 222Royalty 209 320 275 330Provision 10 28 13 13Other Liability 219 33 35 37Net Cur. Asset 850 1067 954 942Misc. Expenses 11 13 10 8Total Assets 2231 2207 2059 1960
Cash Flow Statement :Rsmn FY00 FY01 FY02E FY03FSources of FundsPAT 60 50 -184 -68Depreciation 23 32 44 45Inc in Equity Cap 0 21 0 0Inc in Share Susp. 21 -21 0 0Inc in Share Pre. 1856 0 0 0Inc in Loans -112 -92 67 0Inc in C. Liability 65 178 -203 97Inc in provision 91 -168 -13 2Total 2004 0 -289 76Application of FundsDividend 29 28 28 28Dividend Tax 4 3 3 3Inc in Gross 47 134 53 6Inc in CWIP -1 1 2 0Inc in Investment 1152 -396 -44 -46Inc in Inventory 24 42 -59 35Inc in Debtors 94 18 -57 57Inc in Royalty 29 102 30 25Inc in O. C.Assets 525 -155 106 3Inc in Misc Exp. -6 2 -3 -2Total 1897 -221 58 109Op.Cash Balance 76 182 403 55Addition 106 222 -348 -33Cl Cash Balance 182 404 55 22
Key Ratios:FY00 FY01 FY02E FY03F
GrowthIncome 17% 24% -34% 23%Earnings 53% -16% -464% -63%MarginOPM 7% 8% -12% -1%NPM 4% 3% -16% -5%ReturnROE 7% 3% NA NAROA 5% 2% NA NA
Price Sensitivity:FY00 FY01 FY02E FY03F
Price/EPS 6.4 5.4 NA NA100 16 19 NA NA125 19 23 NA NA150 23 28 NA NA175 27 32 NA NA200 31 37 NA NA225 35 42 NA NA
PE Sensitivity:Rsmn FY00 FY01 FY02E FY03FPE/ EPS 6.4 5.4 NA NA10 64 54 NA NA15 96 81 NA NA20 129 108 NA NA25 161 135 NA NA30 193 162 NA NA35 225 189 NA NA
15
Tips Industries (Rs164) HOLD
‘Everything has a price'; the old adage has morerelevance than any other thing in case of 'TipsIndustries' and for the music industry. Theskyrocketed music acquisition cost has taken its tollrather heavily on whole music industry and Tips, inparticular.
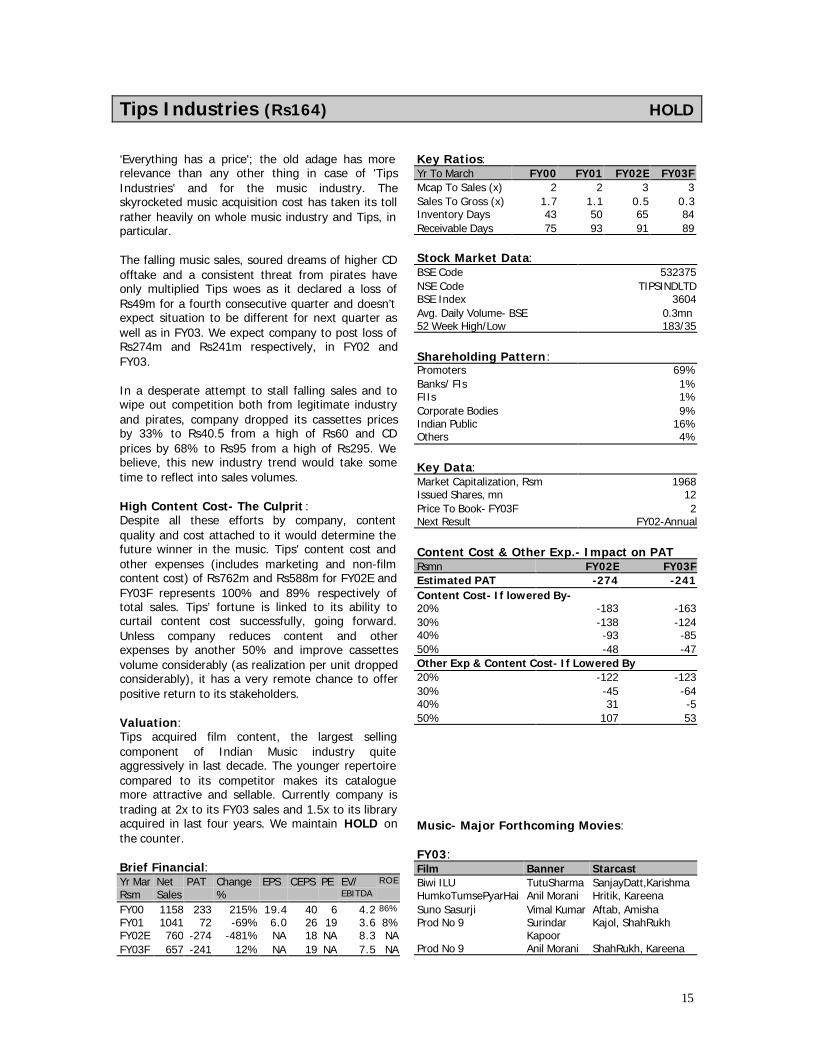
The falling music sales, soured dreams of higher CDofftake and a consistent threat from pirates haveonly multiplied Tips woes as it declared a loss ofRs49m for a fourth consecutive quarter and doesn’texpect situation to be different for next quarter aswell as in FY03. We expect company to post loss ofRs274m and Rs241m respectively, in FY02 andFY03.
In a desperate attempt to stall falling sales and towipe out competition both from legitimate industryand pirates, company dropped its cassettes pricesby 33% to Rs40.5 from a high of Rs60 and CDprices by 68% to Rs95 from a high of Rs295. Webelieve, this new industry trend would take sometime to reflect into sales volumes.
High Content Cost- The Culprit :Despite all these efforts by company, contentquality and cost attached to it would determine thefuture winner in the music. Tips' content cost andother expenses (includes marketing and non-filmcontent cost) of Rs762m and Rs588m for FY02E andFY03F represents 100% and 89% respectively oftotal sales. Tips’ fortune is linked to its ability tocurtail content cost successfully, going forward.Unless company reduces content and otherexpenses by another 50% and improve cassettesvolume considerably (as realization per unit droppedconsiderably), it has a very remote chance to offerpositive return to its stakeholders.
Valuation:Tips acquired film content, the largest sellingcomponent of Indian Music industry quiteaggressively in last decade. The younger repertoirecompared to its competitor makes its cataloguemore attractive and sellable. Currently company istrading at 2x to its FY03 sales and 1.5x to its libraryacquired in last four years. We maintain HOLD onthe counter.
Brief Financial:Yr Mar Net PAT Change EPS CEPS PE EV/ ROE
Rsm Sales % EBITDA
FY00 1158 233 215% 19.4 40 6 4.2 86%
FY01 1041 72 -69% 6.0 26 19 3.6 8%FY02E 760 -274 -481% NA 18 NA 8.3 NAFY03F 657 -241 12% NA 19 NA 7.5 NA
Key Ratios:Yr To March FY00 FY01 FY02E FY03FMcap To Sales (x) 2 2 3 3Sales To Gross (x) 1.7 1.1 0.5 0.3Inventory Days 43 50 65 84Receivable Days 75 93 91 89
Stock Market Data:BSE Code 532375NSE Code TIPSINDLTDBSE Index 3604Avg. Daily Volume- BSE 0.3mn52 Week High/Low 183/35
Shareholding Pattern:Promoters 69%Banks/ FIs 1%FIIs 1%Corporate Bodies 9%Indian Public 16%Others 4%
Key Data:Market Capitalization, Rsm 1968Issued Shares, mn 12Price To Book- FY03F 2Next Result FY02-Annual
Content Cost & Other Exp.- Impact on PATRsmn FY02E FY03FEstimated PAT -274 -241Content Cost- If lowered By-20% -183 -16330% -138 -12440% -93 -8550% -48 -47Other Exp & Content Cost- If Lowered By20% -122 -12330% -45 -6440% 31 -550% 107 53
Music- Major Forthcoming Movies:
FY03:Film Banner StarcastBiwi ILU TutuSharma SanjayDatt,KarishmaHumkoTumsePyarHai Anil Morani Hritik, KareenaSuno Sasurji Vimal Kumar Aftab, AmishaProd No 9 Surindar
KapoorKajol, ShahRukh
Prod No 9 Anil Morani ShahRukh, Kareena
16
www.tipsmusicfilms.com
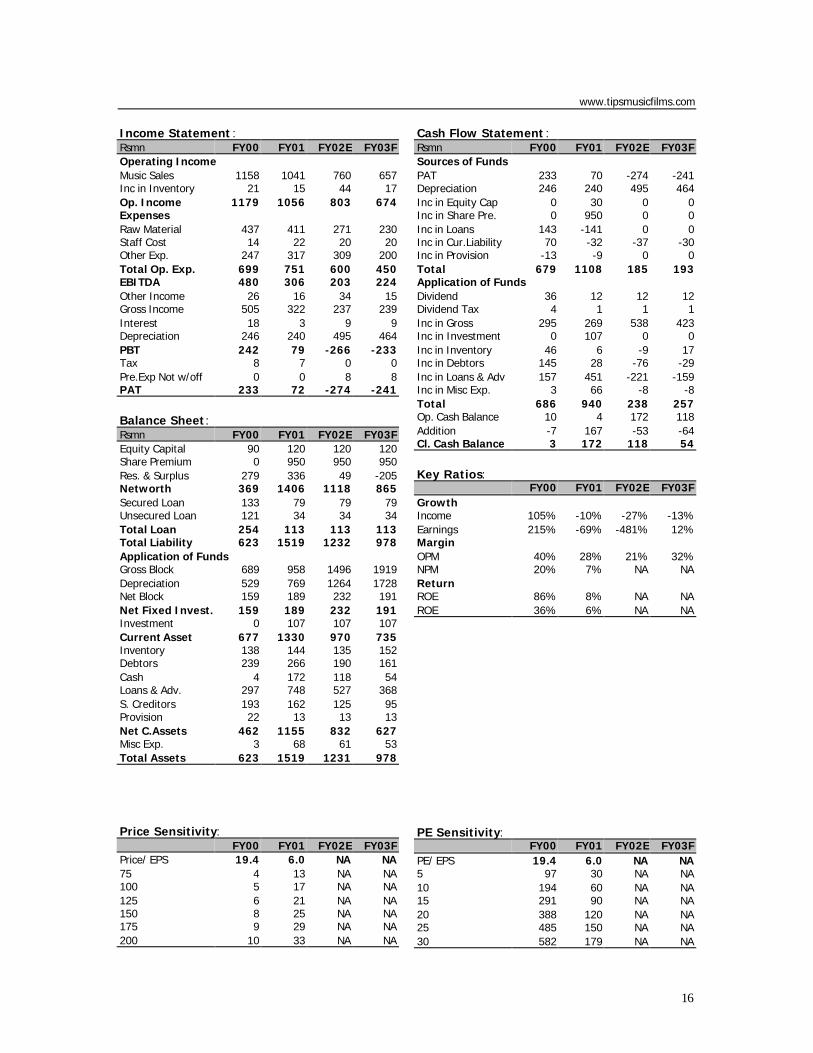
Income Statement :Rsmn FY00 FY01 FY02E FY03FOperating IncomeMusic Sales 1158 1041 760 657Inc in Inventory 21 15 44 17Op. Income 1179 1056 803 674ExpensesRaw Material 437 411 271 230Staff Cost 14 22 20 20Other Exp. 247 317 309 200Total Op. Exp. 699 751 600 450EBITDA 480 306 203 224Other Income 26 16 34 15Gross Income 505 322 237 239Interest 18 3 9 9Depreciation 246 240 495 464PBT 242 79 -266 -233Tax 8 7 0 0Pre.Exp Not w/off 0 0 8 8PAT 233 72 -274 -241
Balance Sheet:Rsmn FY00 FY01 FY02E FY03FEquity Capital 90 120 120 120Share Premium 0 950 950 950Res. & Surplus 279 336 49 -205Networth 369 1406 1118 865Secured Loan 133 79 79 79Unsecured Loan 121 34 34 34Total Loan 254 113 113 113Total Liability 623 1519 1232 978Application of FundsGross Block 689 958 1496 1919Depreciation 529 769 1264 1728Net Block 159 189 232 191Net Fixed Invest. 159 189 232 191Investment 0 107 107 107Current Asset 677 1330 970 735Inventory 138 144 135 152Debtors 239 266 190 161Cash 4 172 118 54Loans & Adv. 297 748 527 368S. Creditors 193 162 125 95Provision 22 13 13 13Net C.Assets 462 1155 832 627Misc Exp. 3 68 61 53Total Assets 623 1519 1231 978
Price Sensitivity:FY00 FY01 FY02E FY03F
Price/ EPS 19.4 6.0 NA NA75 4 13 NA NA100 5 17 NA NA125 6 21 NA NA150 8 25 NA NA175 9 29 NA NA200 10 33 NA NA
Cash Flow Statement :Rsmn FY00 FY01 FY02E FY03FSources of FundsPAT 233 70 -274 -241Depreciation 246 240 495 464Inc in Equity Cap 0 30 0 0Inc in Share Pre. 0 950 0 0Inc in Loans 143 -141 0 0Inc in Cur.Liability 70 -32 -37 -30Inc in Provision -13 -9 0 0Total 679 1108 185 193Application of FundsDividend 36 12 12 12Dividend Tax 4 1 1 1Inc in Gross 295 269 538 423Inc in Investment 0 107 0 0Inc in Inventory 46 6 -9 17Inc in Debtors 145 28 -76 -29Inc in Loans & Adv 157 451 -221 -159Inc in Misc Exp. 3 66 -8 -8Total 686 940 238 257Op. Cash Balance 10 4 172 118Addition -7 167 -53 -64Cl. Cash Balance 3 172 118 54
Key Ratios:FY00 FY01 FY02E FY03F
GrowthIncome 105% -10% -27% -13%Earnings 215% -69% -481% 12%MarginOPM 40% 28% 21% 32%NPM 20% 7% NA NAReturnROE 86% 8% NA NAROE 36% 6% NA NA
PE Sensitivity:FY00 FY01 FY02E FY03F
PE/ EPS 19.4 6.0 NA NA5 97 30 NA NA10 194 60 NA NA15 291 90 NA NA20 388 120 NA NA25 485 150 NA NA30 582 179 NA NA
17
Broadcasting Industry
Star Performance
Advertising Industry
Cost Per Rating Point-CPRP
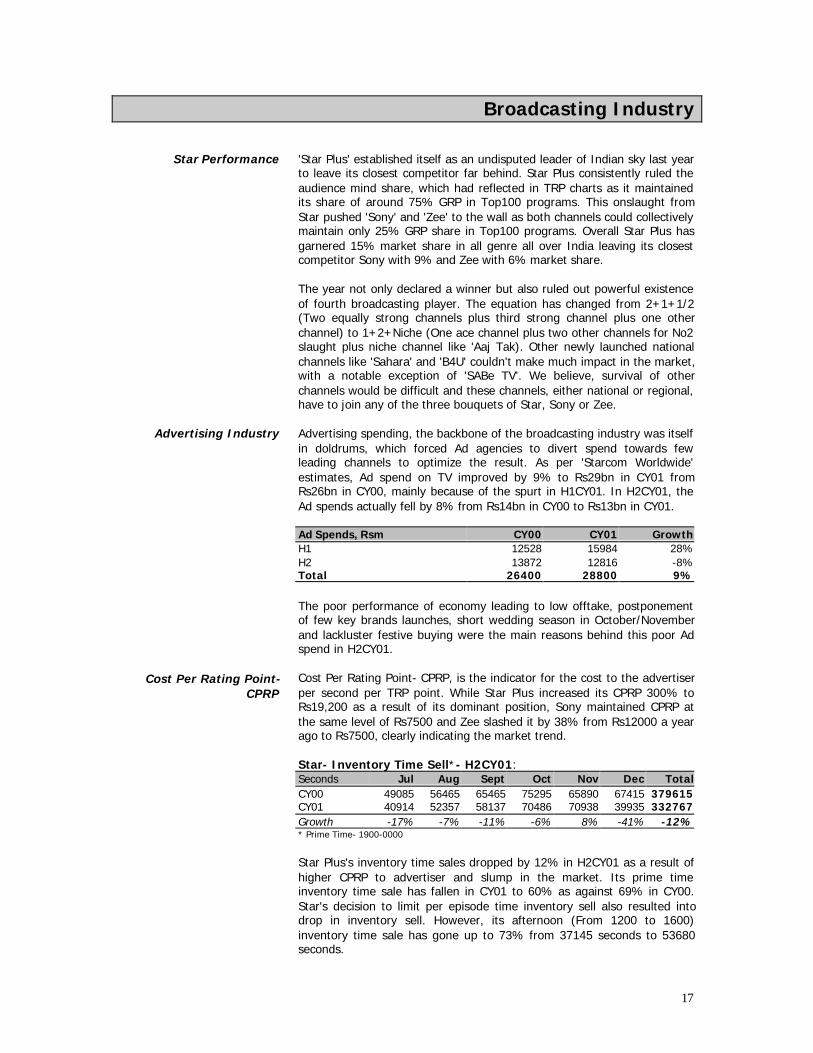
'Star Plus' established itself as an undisputed leader of Indian sky last yearto leave its closest competitor far behind. Star Plus consistently ruled theaudience mind share, which had reflected in TRP charts as it maintainedits share of around 75% GRP in Top100 programs. This onslaught fromStar pushed 'Sony' and 'Zee' to the wall as both channels could collectivelymaintain only 25% GRP share in Top100 programs. Overall Star Plus hasgarnered 15% market share in all genre all over India leaving its closestcompetitor Sony with 9% and Zee with 6% market share.
The year not only declared a winner but also ruled out powerful existenceof fourth broadcasting player. The equation has changed from 2+1+1/2(Two equally strong channels plus third strong channel plus one otherchannel) to 1+2+Niche (One ace channel plus two other channels for No2slaught plus niche channel like 'Aaj Tak). Other newly launched nationalchannels like 'Sahara' and 'B4U' couldn't make much impact in the market,with a notable exception of 'SABe TV'. We believe, survival of otherchannels would be difficult and these channels, either national or regional,have to join any of the three bouquets of Star, Sony or Zee.
Advertising spending, the backbone of the broadcasting industry was itselfin doldrums, which forced Ad agencies to divert spend towards fewleading channels to optimize the result. As per 'Starcom Worldwide'estimates, Ad spend on TV improved by 9% to Rs29bn in CY01 fromRs26bn in CY00, mainly because of the spurt in H1CY01. In H2CY01, theAd spends actually fell by 8% from Rs14bn in CY00 to Rs13bn in CY01.
Ad Spends, Rsm CY00 CY01 GrowthH1 12528 15984 28%H2 13872 12816 -8%Total 26400 28800 9%
The poor performance of economy leading to low offtake, postponementof few key brands launches, short wedding season in October/Novemberand lackluster festive buying were the main reasons behind this poor Adspend in H2CY01.
Cost Per Rating Point- CPRP, is the indicator for the cost to the advertiserper second per TRP point. While Star Plus increased its CPRP 300% toRs19,200 as a result of its dominant position, Sony maintained CPRP atthe same level of Rs7500 and Zee slashed it by 38% from Rs12000 a yearago to Rs7500, clearly indicating the market trend.
Star- Inventory Time Sell*- H2CY01:Seconds Jul Aug Sept Oct Nov Dec TotalCY00 49085 56465 65465 75295 65890 67415 379615CY01 40914 52357 58137 70486 70938 39935 332767Growth -17% -7% -11% -6% 8% -41% -12%* Prime Time- 1900-0000
Star Plus's inventory time sales dropped by 12% in H2CY01 as a result ofhigher CPRP to advertiser and slump in the market. Its prime timeinventory time sale has fallen in CY01 to 60% as against 69% in CY00.Star's decision to limit per episode time inventory sell also resulted intodrop in inventory sell. However, its afternoon (From 1200 to 1600)inventory time sale has gone up to 73% from 37145 seconds to 53680seconds.
18
Uplinking from India
Subscription Revenue
Future Unfolds
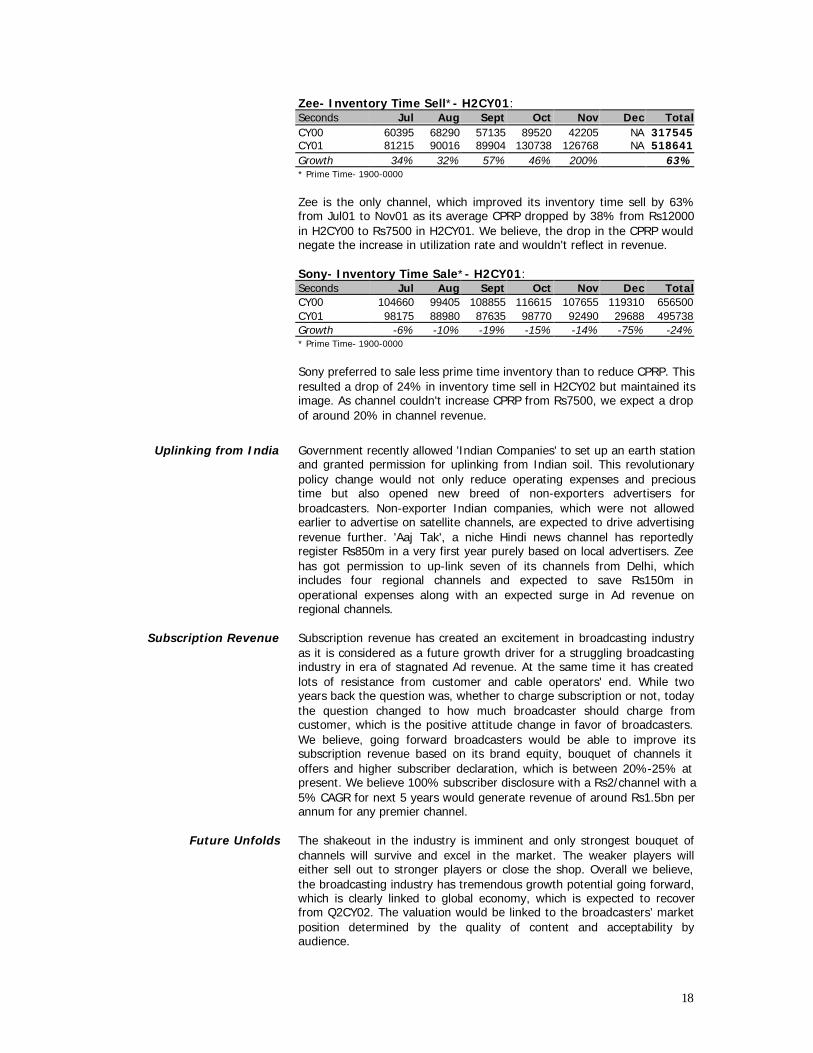
Zee- Inventory Time Sell*- H2CY01:Seconds Jul Aug Sept Oct Nov Dec TotalCY00 60395 68290 57135 89520 42205 NA 317545CY01 81215 90016 89904 130738 126768 NA 518641Growth 34% 32% 57% 46% 200% 63%* Prime Time- 1900-0000
Zee is the only channel, which improved its inventory time sell by 63%from Jul01 to Nov01 as its average CPRP dropped by 38% from Rs12000in H2CY00 to Rs7500 in H2CY01. We believe, the drop in the CPRP wouldnegate the increase in utilization rate and wouldn't reflect in revenue.
Sony- Inventory Time Sale*- H2CY01:Seconds Jul Aug Sept Oct Nov Dec TotalCY00 104660 99405 108855 116615 107655 119310 656500CY01 98175 88980 87635 98770 92490 29688 495738Growth -6% -10% -19% -15% -14% -75% -24%* Prime Time- 1900-0000
Sony preferred to sale less prime time inventory than to reduce CPRP. Thisresulted a drop of 24% in inventory time sell in H2CY02 but maintained itsimage. As channel couldn't increase CPRP from Rs7500, we expect a dropof around 20% in channel revenue.
Government recently allowed 'Indian Companies' to set up an earth stationand granted permission for uplinking from Indian soil. This revolutionarypolicy change would not only reduce operating expenses and precioustime but also opened new breed of non-exporters advertisers forbroadcasters. Non-exporter Indian companies, which were not allowedearlier to advertise on satellite channels, are expected to drive advertisingrevenue further. 'Aaj Tak', a niche Hindi news channel has reportedlyregister Rs850m in a very first year purely based on local advertisers. Zeehas got permission to up-link seven of its channels from Delhi, whichincludes four regional channels and expected to save Rs150m inoperational expenses along with an expected surge in Ad revenue onregional channels.
Subscription revenue has created an excitement in broadcasting industryas it is considered as a future growth driver for a struggling broadcastingindustry in era of stagnated Ad revenue. At the same time it has createdlots of resistance from customer and cable operators' end. While twoyears back the question was, whether to charge subscription or not, todaythe question changed to how much broadcaster should charge fromcustomer, which is the positive attitude change in favor of broadcasters.We believe, going forward broadcasters would be able to improve itssubscription revenue based on its brand equity, bouquet of channels itoffers and higher subscriber declaration, which is between 20%-25% atpresent. We believe 100% subscriber disclosure with a Rs2/channel with a5% CAGR for next 5 years would generate revenue of around Rs1.5bn perannum for any premier channel.
The shakeout in the industry is imminent and only strongest bouquet ofchannels will survive and excel in the market. The weaker players willeither sell out to stronger players or close the shop. Overall we believe,the broadcasting industry has tremendous growth potential going forward,which is clearly linked to global economy, which is expected to recoverfrom Q2CY02. The valuation would be linked to the broadcasters’ marketposition determined by the quality of content and acceptability byaudience.
19
ETC Networks (Rs29) BUY
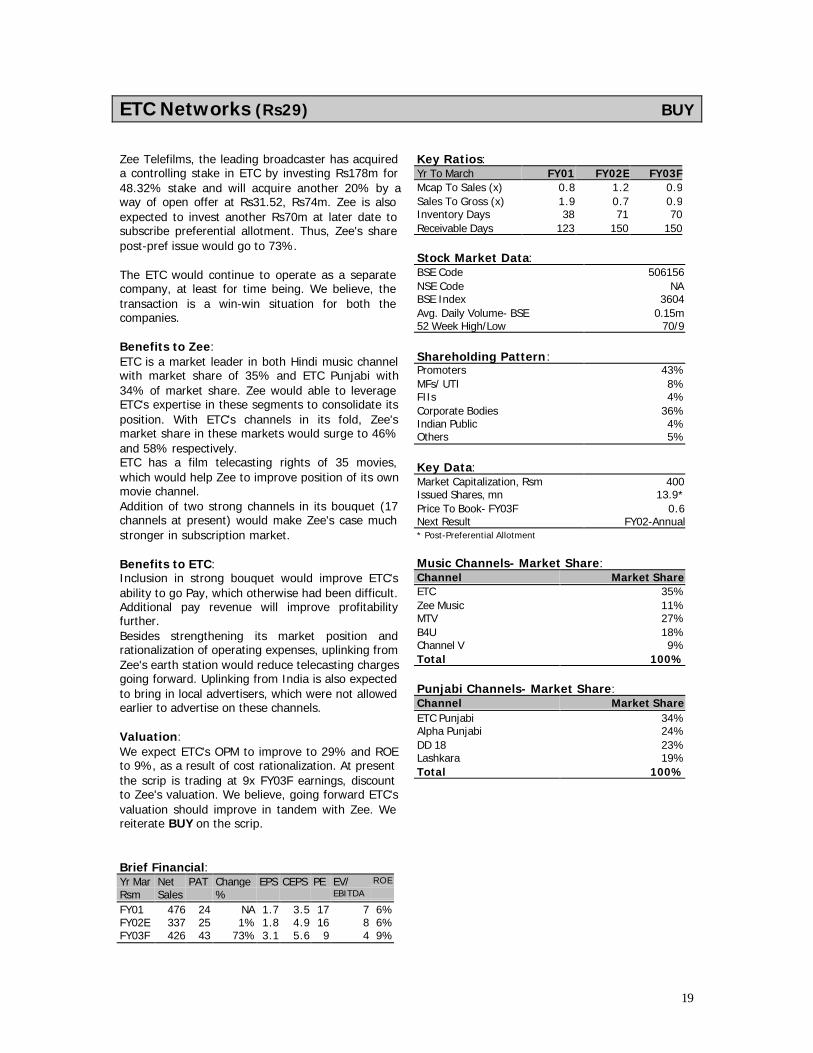
Zee Telefilms, the leading broadcaster has acquireda controlling stake in ETC by investing Rs178m for48.32% stake and will acquire another 20% by away of open offer at Rs31.52, Rs74m. Zee is alsoexpected to invest another Rs70m at later date tosubscribe preferential allotment. Thus, Zee's sharepost-pref issue would go to 73%.
The ETC would continue to operate as a separatecompany, at least for time being. We believe, thetransaction is a win-win situation for both thecompanies.
Benefits to Zee:ETC is a market leader in both Hindi music channelwith market share of 35% and ETC Punjabi with34% of market share. Zee would able to leverageETC's expertise in these segments to consolidate itsposition. With ETC's channels in its fold, Zee'smarket share in these markets would surge to 46%and 58% respectively.ETC has a film telecasting rights of 35 movies,which would help Zee to improve position of its ownmovie channel.Addition of two strong channels in its bouquet (17channels at present) would make Zee's case muchstronger in subscription market.
Benefits to ETC:Inclusion in strong bouquet would improve ETC'sability to go Pay, which otherwise had been difficult.Additional pay revenue will improve profitabilityfurther.Besides strengthening its market position andrationalization of operating expenses, uplinking fromZee's earth station would reduce telecasting chargesgoing forward. Uplinking from India is also expectedto bring in local advertisers, which were not allowedearlier to advertise on these channels.
Valuation:We expect ETC's OPM to improve to 29% and ROEto 9%, as a result of cost rationalization. At presentthe scrip is trading at 9x FY03F earnings, discountto Zee's valuation. We believe, going forward ETC'svaluation should improve in tandem with Zee. Wereiterate BUY on the scrip.
Brief Financial:Yr Mar Net PAT Change EPS CEPS PE EV/ ROE
Rsm Sales % EBITDA
FY01 476 24 NA 1.7 3.5 17 7 6%FY02E 337 25 1% 1.8 4.9 16 8 6%FY03F 426 43 73% 3.1 5.6 9 4 9%
Key Ratios:Yr To March FY01 FY02E FY03FMcap To Sales (x) 0.8 1.2 0.9Sales To Gross (x) 1.9 0.7 0.9Inventory Days 38 71 70Receivable Days 123 150 150
Stock Market Data:BSE Code 506156NSE Code NABSE Index 3604Avg. Daily Volume- BSE 0.15m52 Week High/Low 70/9
Shareholding Pattern:Promoters 43%MFs/ UTI 8%FIIs 4%Corporate Bodies 36%Indian Public 4%Others 5%
Key Data:Market Capitalization, Rsm 400Issued Shares, mn 13.9*Price To Book- FY03F 0.6Next Result FY02-Annual* Post-Preferential Allotment
Music Channels- Market Share:Channel Market ShareETC 35%Zee Music 11%MTV 27%B4U 18%Channel V 9%Total 100%
Punjabi Channels- Market Share:Channel Market ShareETC Punjabi 34%Alpha Punjabi 24%DD 18 23%Lashkara 19%Total 100%
20
www.entertainmenttv.com
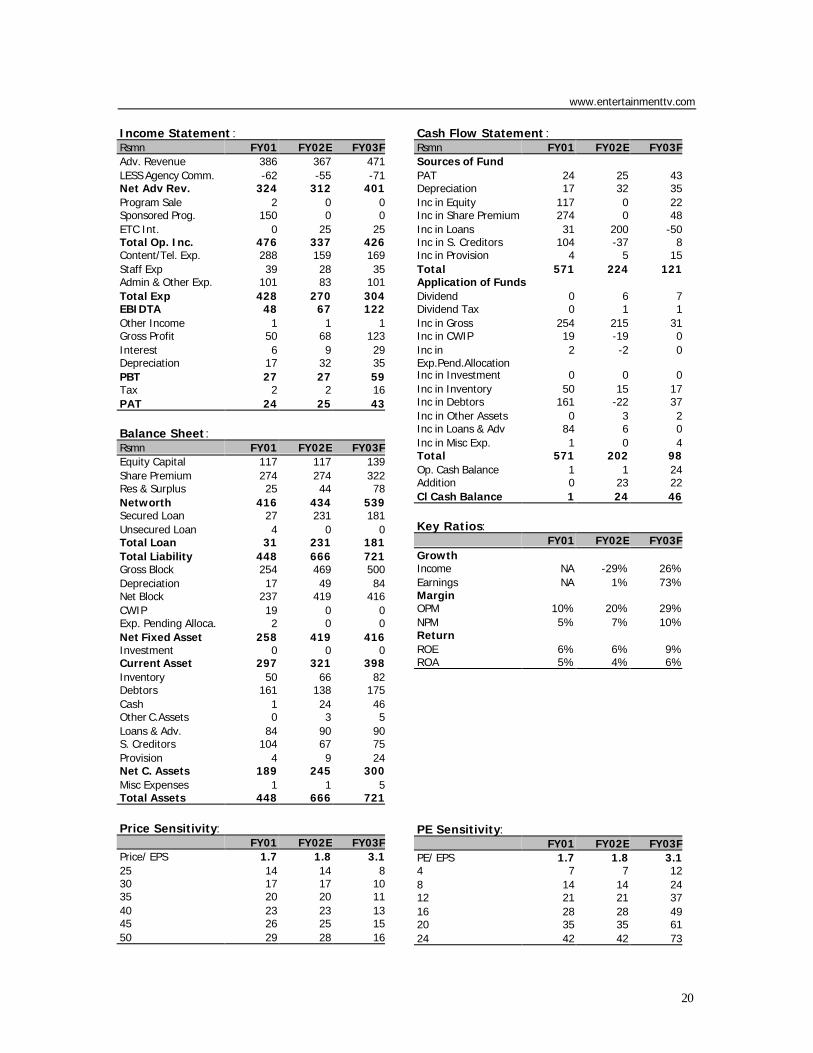
Income Statement :Rsmn FY01 FY02E FY03FAdv. Revenue 386 367 471LESS Agency Comm. -62 -55 -71Net Adv Rev. 324 312 401Program Sale 2 0 0Sponsored Prog. 150 0 0ETC Int. 0 25 25Total Op. Inc. 476 337 426Content/Tel. Exp. 288 159 169Staff Exp 39 28 35Admin & Other Exp. 101 83 101Total Exp 428 270 304EBIDTA 48 67 122Other Income 1 1 1Gross Profit 50 68 123Interest 6 9 29Depreciation 17 32 35PBT 27 27 59Tax 2 2 16PAT 24 25 43
Balance Sheet:Rsmn FY01 FY02E FY03FEquity Capital 117 117 139Share Premium 274 274 322Res & Surplus 25 44 78Networth 416 434 539Secured Loan 27 231 181Unsecured Loan 4 0 0Total Loan 31 231 181Total Liability 448 666 721Gross Block 254 469 500Depreciation 17 49 84Net Block 237 419 416CWIP 19 0 0Exp. Pending Alloca. 2 0 0Net Fixed Asset 258 419 416Investment 0 0 0Current Asset 297 321 398Inventory 50 66 82Debtors 161 138 175Cash 1 24 46Other C.Assets 0 3 5Loans & Adv. 84 90 90S. Creditors 104 67 75Provision 4 9 24Net C. Assets 189 245 300Misc Expenses 1 1 5Total Assets 448 666 721
Price Sensitivity:FY01 FY02E FY03F
Price/ EPS 1.7 1.8 3.125 14 14 830 17 17 1035 20 20 1140 23 23 1345 26 25 1550 29 28 16
Cash Flow Statement :Rsmn FY01 FY02E FY03FSources of FundPAT 24 25 43Depreciation 17 32 35Inc in Equity 117 0 22Inc in Share Premium 274 0 48Inc in Loans 31 200 -50Inc in S. Creditors 104 -37 8Inc in Provision 4 5 15Total 571 224 121Application of FundsDividend 0 6 7Dividend Tax 0 1 1Inc in Gross 254 215 31Inc in CWIP 19 -19 0Inc inExp.Pend.Allocation
2 -2 0
Inc in Investment 0 0 0Inc in Inventory 50 15 17Inc in Debtors 161 -22 37Inc in Other Assets 0 3 2Inc in Loans & Adv 84 6 0Inc in Misc Exp. 1 0 4Total 571 202 98Op. Cash Balance 1 1 24Addition 0 23 22Cl Cash Balance 1 24 46
Key Ratios:FY01 FY02E FY03F
GrowthIncome NA -29% 26%Earnings NA 1% 73%MarginOPM 10% 20% 29%NPM 5% 7% 10%ReturnROE 6% 6% 9%ROA 5% 4% 6%
PE Sensitivity:FY01 FY02E FY03F
PE/ EPS 1.7 1.8 3.14 7 7 128 14 14 2412 21 21 3716 28 28 4920 35 35 6124 42 42 73
21
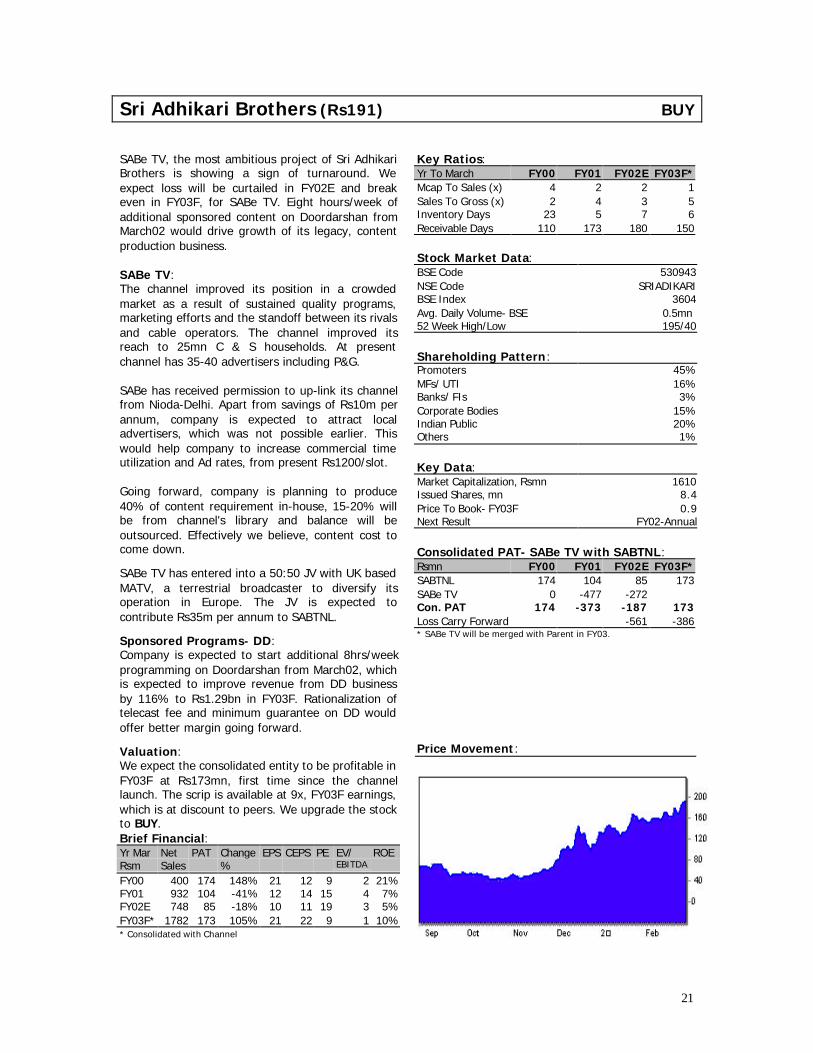
Sri Adhikari Brothers (Rs191) BUY
SABe TV, the most ambitious project of Sri AdhikariBrothers is showing a sign of turnaround. Weexpect loss will be curtailed in FY02E and breakeven in FY03F, for SABe TV. Eight hours/week ofadditional sponsored content on Doordarshan fromMarch02 would drive growth of its legacy, contentproduction business.
SABe TV:The channel improved its position in a crowdedmarket as a result of sustained quality programs,marketing efforts and the standoff between its rivalsand cable operators. The channel improved itsreach to 25mn C & S households. At presentchannel has 35-40 advertisers including P&G.
SABe has received permission to up-link its channelfrom Nioda-Delhi. Apart from savings of Rs10m perannum, company is expected to attract localadvertisers, which was not possible earlier. Thiswould help company to increase commercial timeutilization and Ad rates, from present Rs1200/slot.
Going forward, company is planning to produce40% of content requirement in-house, 15-20% willbe from channel's library and balance will beoutsourced. Effectively we believe, content cost tocome down.
SABe TV has entered into a 50:50 JV with UK basedMATV, a terrestrial broadcaster to diversify itsoperation in Europe. The JV is expected tocontribute Rs35m per annum to SABTNL.
Sponsored Programs- DD:Company is expected to start additional 8hrs/weekprogramming on Doordarshan from March02, whichis expected to improve revenue from DD businessby 116% to Rs1.29bn in FY03F. Rationalization oftelecast fee and minimum guarantee on DD wouldoffer better margin going forward.
Valuation:We expect the consolidated entity to be profitable inFY03F at Rs173mn, first time since the channellaunch. The scrip is available at 9x, FY03F earnings,which is at discount to peers. We upgrade the stockto BUY.Brief Financial:Yr Mar Net PAT Change EPS CEPS PE EV/ ROERsm Sales % EBITDA
FY00 400 174 148% 21 12 9 2 21%FY01 932 104 -41% 12 14 15 4 7%FY02E 748 85 -18% 10 11 19 3 5%FY03F* 1782 173 105% 21 22 9 1 10%* Consolidated with Channel
Key Ratios:Yr To March FY00 FY01 FY02E FY03F*Mcap To Sales (x) 4 2 2 1Sales To Gross (x) 2 4 3 5Inventory Days 23 5 7 6Receivable Days 110 173 180 150
Stock Market Data:BSE Code 530943NSE Code SRIADIKARIBSE Index 3604Avg. Daily Volume- BSE 0.5mn52 Week High/Low 195/40
Shareholding Pattern:Promoters 45%MFs/ UTI 16%Banks/ FIs 3%Corporate Bodies 15%Indian Public 20%Others 1%
Key Data:Market Capitalization, Rsmn 1610Issued Shares, mn 8.4Price To Book- FY03F 0.9Next Result FY02-Annual
Consolidated PAT- SABe TV with SABTNL:Rsmn FY00 FY01 FY02E FY03F*SABTNL 174 104 85 173SABe TV 0 -477 -272Con. PAT 174 -373 -187 173Loss Carry Forward -561 -386* SABe TV will be merged with Parent in FY03.
Price Movement:
22
www.sabtv.com
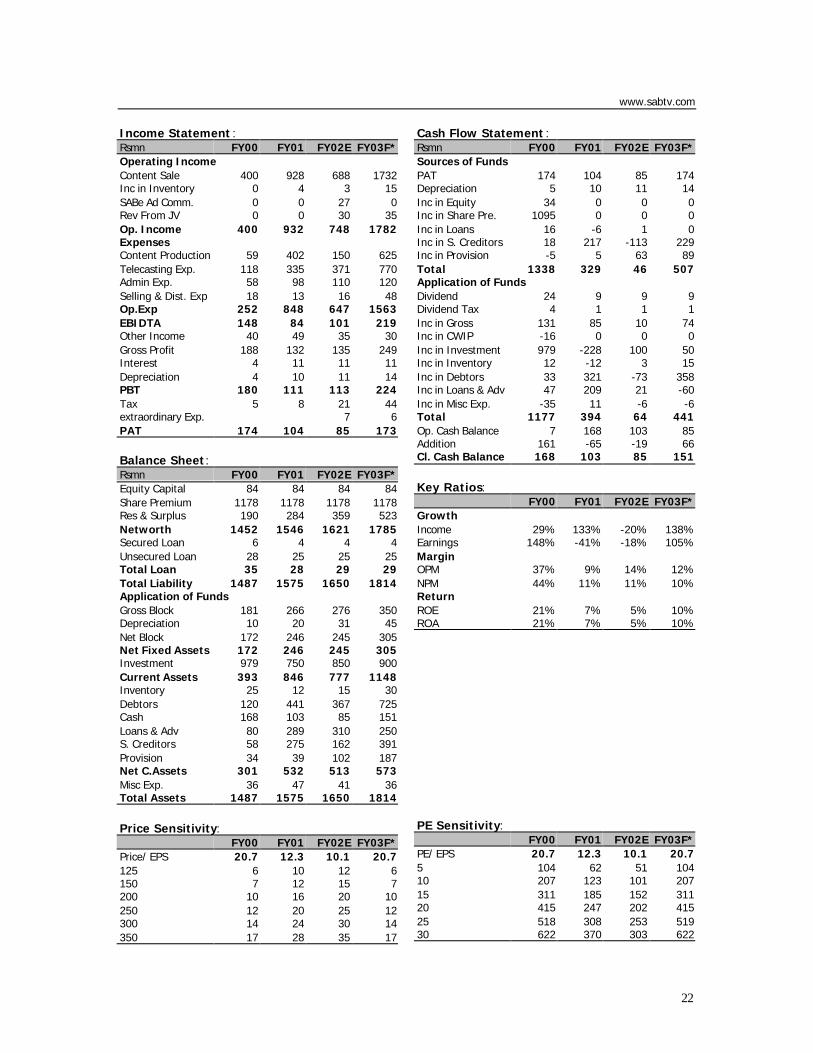
Income Statement :Rsmn FY00 FY01 FY02E FY03F*Operating IncomeContent Sale 400 928 688 1732Inc in Inventory 0 4 3 15SABe Ad Comm. 0 0 27 0Rev From JV 0 0 30 35Op. Income 400 932 748 1782ExpensesContent Production 59 402 150 625Telecasting Exp. 118 335 371 770Admin Exp. 58 98 110 120Selling & Dist. Exp 18 13 16 48Op.Exp 252 848 647 1563EBIDTA 148 84 101 219Other Income 40 49 35 30Gross Profit 188 132 135 249Interest 4 11 11 11Depreciation 4 10 11 14PBT 180 111 113 224Tax 5 8 21 44extraordinary Exp. 7 6PAT 174 104 85 173
Balance Sheet:Rsmn FY00 FY01 FY02E FY03F*Equity Capital 84 84 84 84Share Premium 1178 1178 1178 1178Res & Surplus 190 284 359 523Networth 1452 1546 1621 1785Secured Loan 6 4 4 4Unsecured Loan 28 25 25 25Total Loan 35 28 29 29Total Liability 1487 1575 1650 1814Application of FundsGross Block 181 266 276 350Depreciation 10 20 31 45Net Block 172 246 245 305Net Fixed Assets 172 246 245 305Investment 979 750 850 900Current Assets 393 846 777 1148Inventory 25 12 15 30Debtors 120 441 367 725Cash 168 103 85 151Loans & Adv 80 289 310 250S. Creditors 58 275 162 391Provision 34 39 102 187Net C.Assets 301 532 513 573Misc Exp. 36 47 41 36Total Assets 1487 1575 1650 1814
Price Sensitivity:FY00 FY01 FY02E FY03F*
Price/ EPS 20.7 12.3 10.1 20.7125 6 10 12 6150 7 12 15 7200 10 16 20 10250 12 20 25 12300 14 24 30 14350 17 28 35 17
Cash Flow Statement :Rsmn FY00 FY01 FY02E FY03F*Sources of FundsPAT 174 104 85 174Depreciation 5 10 11 14Inc in Equity 34 0 0 0Inc in Share Pre. 1095 0 0 0Inc in Loans 16 -6 1 0Inc in S. Creditors 18 217 -113 229Inc in Provision -5 5 63 89Total 1338 329 46 507Application of FundsDividend 24 9 9 9Dividend Tax 4 1 1 1Inc in Gross 131 85 10 74Inc in CWIP -16 0 0 0Inc in Investment 979 -228 100 50Inc in Inventory 12 -12 3 15Inc in Debtors 33 321 -73 358Inc in Loans & Adv 47 209 21 -60Inc in Misc Exp. -35 11 -6 -6Total 1177 394 64 441Op. Cash Balance 7 168 103 85Addition 161 -65 -19 66Cl. Cash Balance 168 103 85 151
Key Ratios:FY00 FY01 FY02E FY03F*
GrowthIncome 29% 133% -20% 138%Earnings 148% -41% -18% 105%MarginOPM 37% 9% 14% 12%NPM 44% 11% 11% 10%ReturnROE 21% 7% 5% 10%ROA 21% 7% 5% 10%
PE Sensitivity:FY00 FY01 FY02E FY03F*
PE/ EPS 20.7 12.3 10.1 20.75 104 62 51 10410 207 123 101 20715 311 185 152 31120 415 247 202 41525 518 308 253 51930 622 370 303 622
23
Television Content Producer
Broadcaster’s Backbone
Genre Performance
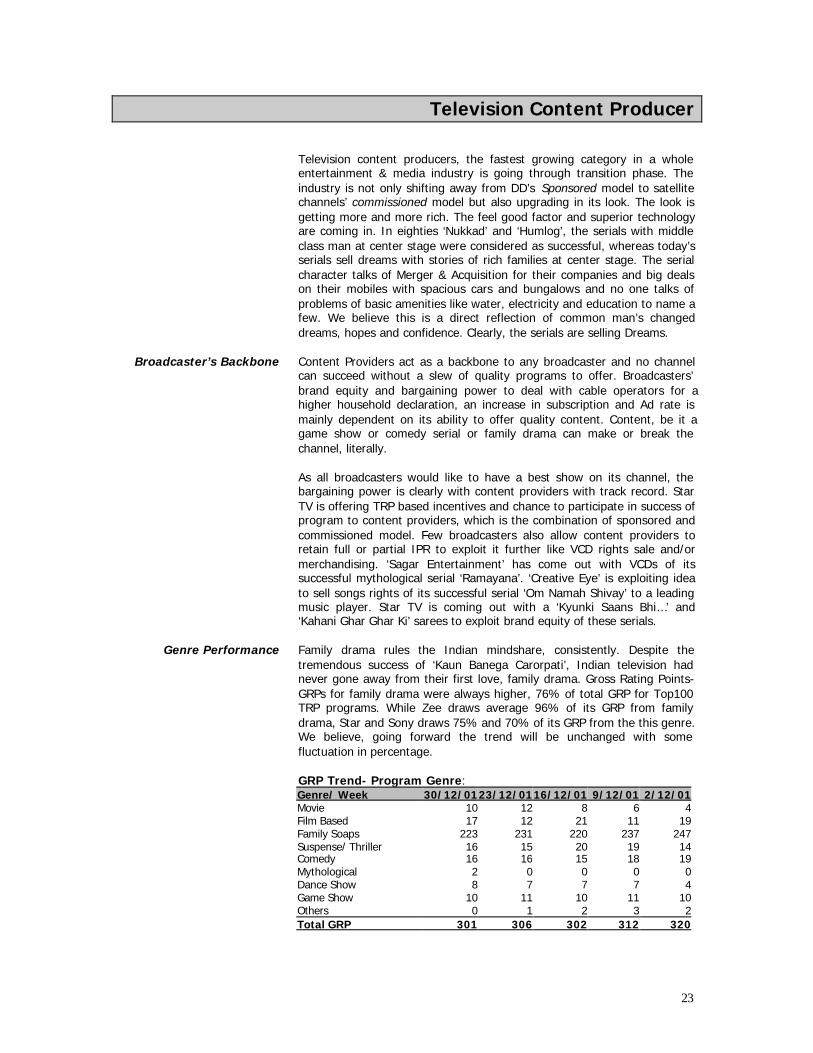
Television content producers, the fastest growing category in a wholeentertainment & media industry is going through transition phase. Theindustry is not only shifting away from DD’s Sponsored model to satellitechannels’ commissioned model but also upgrading in its look. The look isgetting more and more rich. The feel good factor and superior technologyare coming in. In eighties ‘Nukkad’ and ‘Humlog’, the serials with middleclass man at center stage were considered as successful, whereas today’sserials sell dreams with stories of rich families at center stage. The serialcharacter talks of Merger & Acquisition for their companies and big dealson their mobiles with spacious cars and bungalows and no one talks ofproblems of basic amenities like water, electricity and education to name afew. We believe this is a direct reflection of common man’s changeddreams, hopes and confidence. Clearly, the serials are selling Dreams.
Content Providers act as a backbone to any broadcaster and no channelcan succeed without a slew of quality programs to offer. Broadcasters’brand equity and bargaining power to deal with cable operators for ahigher household declaration, an increase in subscription and Ad rate ismainly dependent on its ability to offer quality content. Content, be it agame show or comedy serial or family drama can make or break thechannel, literally.
As all broadcasters would like to have a best show on its channel, thebargaining power is clearly with content providers with track record. StarTV is offering TRP based incentives and chance to participate in success ofprogram to content providers, which is the combination of sponsored andcommissioned model. Few broadcasters also allow content providers toretain full or partial IPR to exploit it further like VCD rights sale and/ormerchandising. ‘Sagar Entertainment’ has come out with VCDs of itssuccessful mythological serial ‘Ramayana’. ‘Creative Eye’ is exploiting ideato sell songs rights of its successful serial ‘Om Namah Shivay’ to a leadingmusic player. Star TV is coming out with a ‘Kyunki Saans Bhi…’ and‘Kahani Ghar Ghar Ki’ sarees to exploit brand equity of these serials.
Family drama rules the Indian mindshare, consistently. Despite thetremendous success of ‘Kaun Banega Carorpati’, Indian television hadnever gone away from their first love, family drama. Gross Rating Points-GRPs for family drama were always higher, 76% of total GRP for Top100TRP programs. While Zee draws average 96% of its GRP from familydrama, Star and Sony draws 75% and 70% of its GRP from the this genre.We believe, going forward the trend will be unchanged with somefluctuation in percentage.
GRP Trend- Program Genre:Genre/ Week 30/12/0123/12/0116/12/01 9/12/01 2/12/01Movie 10 12 8 6 4Film Based 17 12 21 11 19Family Soaps 223 231 220 237 247Suspense/ Thriller 16 15 20 19 14Comedy 16 16 15 18 19Mythological 2 0 0 0 0Dance Show 8 7 7 7 4Game Show 10 11 10 11 10Others 0 1 2 3 2Total GRP 301 306 302 312 320
24
Episode Costing
Future Potential
Future Unfolds
As every player try to exploit situation to its benefit, the winner will bethose who enhance its software quality by keeping cost per episode atminimum. Each content genre would require different cost of production.Mythological serials’ production would be much difficult, time consumingand costlier affair than its family drama counterparts. Also the singleserial, new Production Company would end up with higher cost ofproduction than its multi-serial seasoned counterparts. Production houselike ‘Balaji’ produces mainly family drama and rarely shoots on outsidelocations. With its own equipment and drama in the four walls offers‘Balaji’ much crucial 'Time Float' and reduces content production cost tothe great extent.
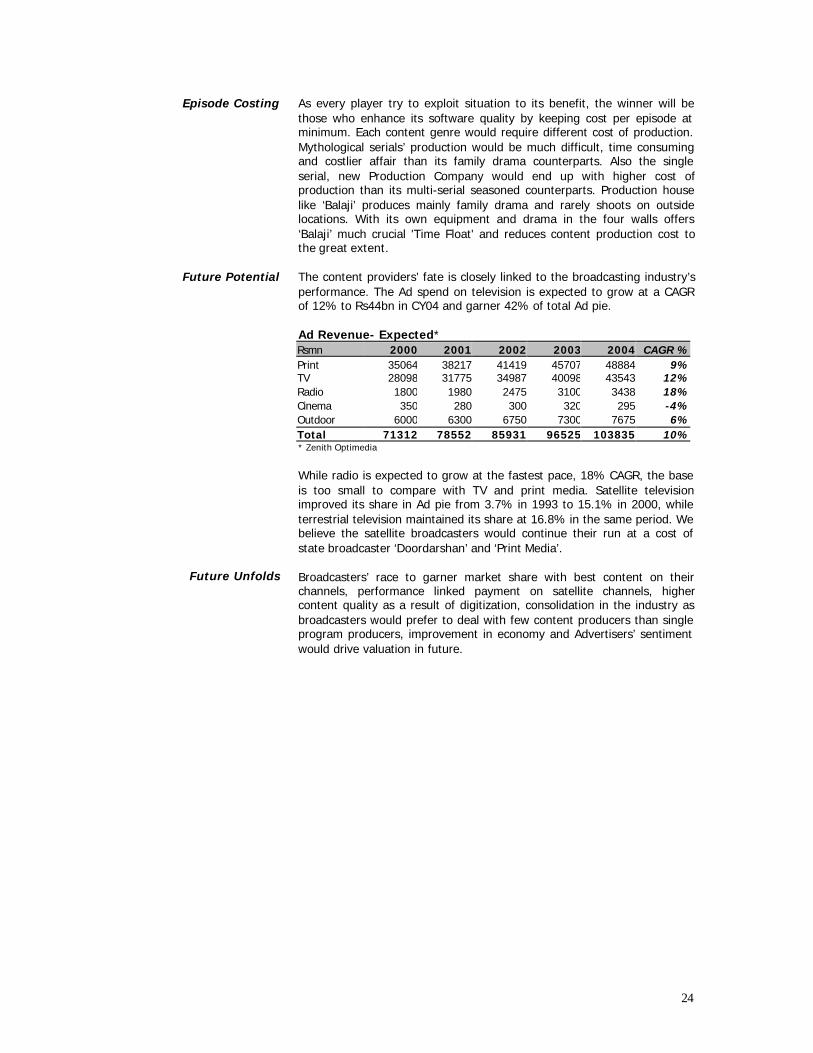
The content providers’ fate is closely linked to the broadcasting industry’sperformance. The Ad spend on television is expected to grow at a CAGRof 12% to Rs44bn in CY04 and garner 42% of total Ad pie.
Ad Revenue- Expected*Rsmn 2000 2001 2002 2003 2004 CAGR %Print 35064 38217 41419 45707 48884 9%TV 28098 31775 34987 40098 43543 12%Radio 1800 1980 2475 3100 3438 18%Cinema 350 280 300 320 295 -4%Outdoor 6000 6300 6750 7300 7675 6%Total 71312 78552 85931 96525 103835 10%* Zenith Optimedia
While radio is expected to grow at the fastest pace, 18% CAGR, the baseis too small to compare with TV and print media. Satellite televisionimproved its share in Ad pie from 3.7% in 1993 to 15.1% in 2000, whileterrestrial television maintained its share at 16.8% in the same period. Webelieve the satellite broadcasters would continue their run at a cost ofstate broadcaster ‘Doordarshan’ and ‘Print Media’.
Broadcasters’ race to garner market share with best content on theirchannels, performance linked payment on satellite channels, highercontent quality as a result of digitization, consolidation in the industry asbroadcasters would prefer to deal with few content producers than singleprogram producers, improvement in economy and Advertisers’ sentimentwould drive valuation in future.
25
Balaji Telefilms (Rs408) BUY
Balaji Telefilms Ltd.- BTL emerged as the strongestand most preferred content provider to satellitechannels, in CY01. Today Balaji's shows are themost sought after be it on Star, Sony or Zee, threemajor Hindi entertainment channels.
Revenue Mix:Balaji has successfully altered revenue mix fromsponsored programs to more lucrativecommissioned programs. In Q3FY02, 76% of itsrevenue has come from commissioned programsagainst 66% previously. The decisive shift, notwithout reason has helped company to improveoperating margin to 45% in Q3FY02 from a mere16% in FY01.
Balaji's programs commands premium over theircounterparts, purely based on quality and an abilityto rule audience mind-share for a longer period. Infact, the recent 35% price hike for its fourprograms, effective from 1st Jan02, from Star Plus isa vindication of a content superiority.
Growth Strategy:Balaji is trying to explore weekend slots, wheremargin would be higher than weekdays programsand an afternoon slot, to cater its main audiencesegment, housewives.
We believe, company's entry into small budgetmovie production would help company to de-risk itsbusiness model along with tremendous growthprospects.
Valuation:The scrip is trading attractively at 9x FY03Fearnings. We believe higher realization per episode,thrust on commissioned programs, sustained qualityof programs on various channels and an entry intomovie production would help company to enhanceits performance. We maintain BUY on the scrip.
Brief Financial:Y. Mar Net PAT Ch'ng EPS CEPS PE EV/ ROERsm Sales % EBITDAFY00 201 43 53% 4.2 4.3 98 62 63%FY01 489 44 2% 4.2 4.6 96 48 17%FY02E 1126 326 648% 31.7 32.8 13 8 57%FY03F 1644 492 51% 47.8 49.7 9 5 55%
Key Ratios:Yr To March FY00 FY01 FY02E FY03FMcap To Sales(x) 21 9 4 3Sales To Gross(x) 13 5 4 5Inventory Days 47 37 14 17Receivable Days 108 103 88 77
Stock Market Data:BSE Code 532382NSE Code BALAJITELEBSE Index 3604Avg. Daily Volume- BSE 0.2mn52 Week High/Low, Rs 469/87
Shareholding Pattern:As on Dec 31st,2001 % of EquityPromoters 68%MFs/ UTI 11%FIIs 6%Corporate Bodies 8%Indian Public 6%Others 1%
Key Data:Market Capitalization, Rsm 4202Issued Shares,mn 10.3Price To Book- FY03F 4.0Next Result FY02-Annual
Program Positions*:Channel Program TRP Position on ChannelStar Kyunki Saans… 10.9 1Sony Kkusum 7.7 1Zee Kohi Apna Sa 3.3 1Gemini Pavitrabandham 16.3 1Udaya Kavyanjali 16.0 2* As on Feb 10th, 2002, Fe15+.
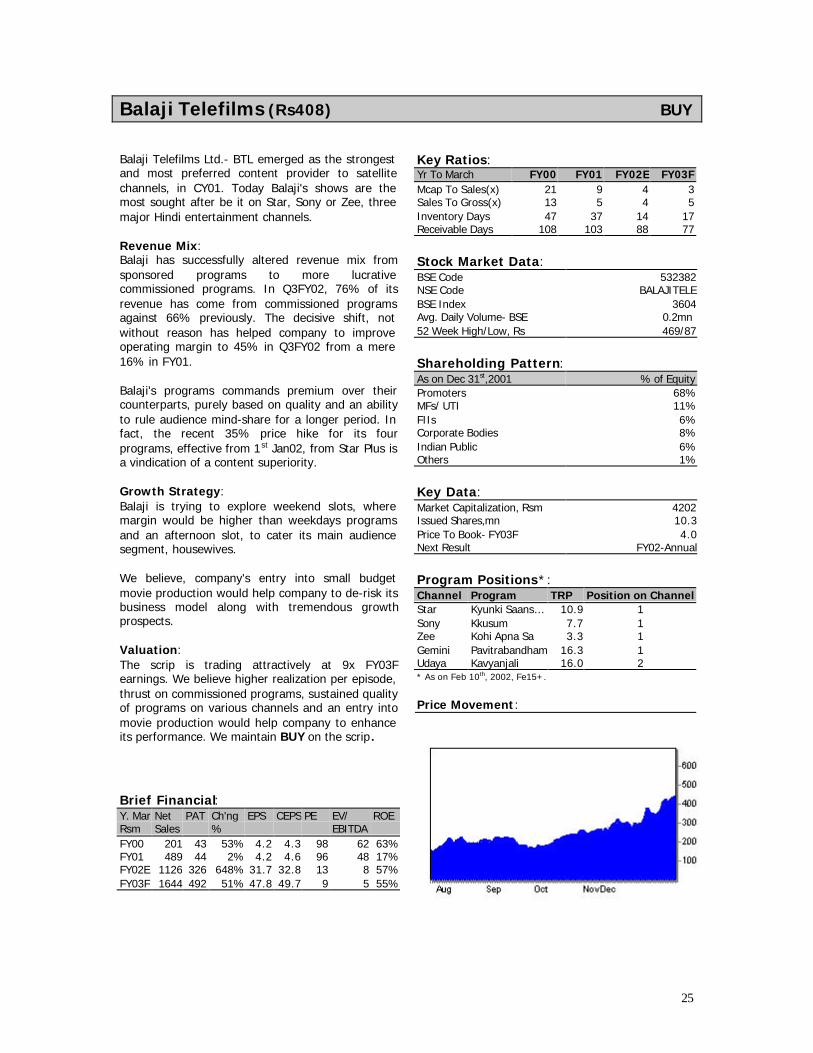
Price Movement:
26
www.balajitelefilms.com
Income Statement :Rsmn FY00 FY01 FY02E FY03FContent SaleSerials 201 489 1126 1596Movies 49Op. Income 201 489 1126 1644ExpensesContent production 118 378 555 794Employee 3 9 17 30Other Exp. 13 25 56 85Total Exp. 134 412 628 909EBIDTA 67 76 499 735Other Income 1 8 11 27Gross Income 67 84 509 762Interest 5 7 0 0Depreciation 1 3 12 20PBT 62 74 498 742Def. Rev. Exp.w/off 7 17 31 10Tax 12 14 140 240PAT 43 44 326 492
Balance Sheet:Rsmn FY00 FY01 FY02E FY03FShare Capital 10 103 103 103Share Premium 0 301 301 301Res. & Surplus 74 36 305 684Networth 84 440 710 1088Secured Loan 40 0 0 0Unsecured Loan 5 0 0 0Total Loan 45 0 0 0Total Liability 129 440 710 1088Application of FundsGross Block 15 92 267 325Depreciation 2 5 17 37Net Block 13 87 250 288WIP 0 21 0 0Net Fixed Invest. 13 108 250 288Pre.Exp. Not w/off 0 0 0 0Def.R.Ep. Not w/off 43 41 10 0Investment 0 93 175 500Current Assets 124 322 514 676Inventory 26 50 42 77Debtors 60 138 273 345Cash 4 20 85 139Loans & Advances 35 115 115 115Creditors 36 77 94 125Provisions 15 46 145 251Net C. Asset 73 198 275 301Total Assets 129 440 710 1088
Price Sensitivity:FY00 FY01 FY02E FY03F
Price/ EPS 4.2 4.2 31.7 47.8350 84 83 11 7400 96 95 13 8450 108 106 14 9500 120 118 16 10550 132 130 17 12600 144 142 19 13
Cash Flow Statement :Rsmn FY00 FY01 FY02E FY03FSources Of FundPAT 36 44 326 492Depreciation 1 3 12 20Inc in Equity 0 28 0 0Inc in Share Prem. 0 301 0 0Inc in Debt 12 -45 0 0Inc in C. Libility 3 41 17 31Inc in provision 12 31 99 105Total 64 403 454 649Utilization of FundDividend 0 15 52 103Dividend Tax 0 2 5 11Inc in Gross Block 7 77 175 58Inc in CWIP 0 21 -21 0Def. Rev. Exp. 11 -2 -31 -10Inc in Investment 0 93 82 325Inc in Inventory 14 24 -8 36Inc in Debtors 16 78 135 72Inc in Loans & Adv 25 80 0 0Total 76 387 388 594Op. Cash Balance 17 4 20 85Add -13 16 65 54Cl. Cash Balance 4 20 85 139
Key Ratios:FY00 FY01 FY02E FY03F
GrowthIncome 52% 143% 130% 46%Earnings 53% 2% 648% 51%MarginOPM 33% 16% 44% 45%NPM 21% 8% 28% 29%ReturnROE 63% 17% 57% 55%ROA 20% 9% 33% 33%
PE Sensitivity:FY00 FY01 FY02E FY03F
PE/ EPS 4.2 4.2 31.7 47.85 21 21 158 2398 33 34 253 38211 46 47 348 52614 58 59 443 66917 71 72 538 81220 83 85 633 956
27
CEE I TV (Rs12) Subscribe
Southern 'Minnale'CEE I TV Entertainment Ltd., is the South Indiabased seasoned entertainment company. Companyengaged into 'Film Production' (Hindi and Regional),'Film Distribution' (Hindi and Regional), 'Televisioncontent production' and 'Content Export'.
CEEITV is coming with an IPO by issuing 4.74mnshares by diluting 32.5% of its equity at Rs12.Company is planning to raise Rs56.9m, primarily tofund content acquizition-Rs19.9m and to cater itslong term working capital requirement- Rs32.2mn.
Company holds overseas rights of 930 films inTamil, Telgu, Malayalam and Kannada. Its libraryalso contains 102 English films and audio rights of10 movies.
'Minnale', the movie produced by CEEITV was themost successful Tamil movie of the year, which ranfor 175 days in many theaters. Its recently releasedTamil movie 'Majunu' is also doing extremely well inTamilnadu. Company has sold re-make rights ofboth the films to Hindi and other languageproducers to generate additional revenue.Previously company had co-produced well-receivedfilms like 'Jeans' and the super-hit 'Jodi'.
In near future, CEEITV is expected to release twomore movies. 'Arasaktchi', the Tamil movie directedby star Tamil director 'Maharajan' and a Hindi movie'Love You Hamesha' starring 'Akshaye Khanna andSonali Bendre'.
Television content production is also a core area forthe company. In past CEEITV had produced serialslike 'Hasini Suhasini' and 'Mayavi Marichan', for SunTV. Apart from Sun TV, company had also producedcontent for Vijay TV, Doordarshan and DD2.
Valuation:CEEITV is expected to release 2/3 films per yearand has recently agreed to provide 300 episodescontent to Gemini TV. We expect company's toplineto grow at a CAGR of 58% and bottomline at 92%for a next two years. ROE to improve steadily at14%, in FY03 from 9% in FY01. The stock is offeredat 5x FY03F earnings, which is at discount to peers.We recommend Subscribe.
Key Data:YrMar Net PAT Change EPS CEPS PE EV/ ROE
Rsm Sales % EBITDA
FY00 73 3 233% 0.2 0.2 70 28 0%FY01 112 9 260% 0.6 0.7 19 14 9%FY02E 173 20 123% 1.4 1.5 9 3 12%FY03F 281 33 66% 2.3 2.3 5 2 14%
Key Ratios:Yr To March FY00 FY01 FY02E FY03FMcap To Sales(x) 2.4 1.6 1.0 0.6Sales To Gross(x) 8 4 6 6Inventory Days 320 358 199 124Receivable Days 63 108 60 60
Stock Market Data:BSE Code NANSE Code NABSE IndexAvg. Daily Volume- BSE NA52 Week High/Low NA
Shareholding Pattern: Post-IssuePromoters/ Associates 68%MFs/ UTI NAFIIs NACorporate Bodies NAIndian Public 32%Others NA
Key Data:Market Capitalization 175Issued Shares, mn 15Price To Book- FY03F 2Next Result FY02- Annual
Serials Produced:Serial Channel GenreManu Needhi Mandaram Sun Talk ShowHe-Man… DD CartoonPattigal Jagirathi Sun ComedyDasavatharam Sun MythoAduthathu Nee Sun FamilyVasool Chakravarthy Sun FamilyMayavi Marichan Sun FantacyMarma Desam Sun ThrillerHasini Suhasini Vijay ComedyShree Tirupati Balaji DD-2 Mytho
Film Distributed- FY01/FY02Film Genre LanguageSnegethiye Thriller TamilChithiram Love Story TamilRahul Family HindiYaadein Love Story Hindi
Films Produced- FY01/FY02Film Genre LanguageMinnale Love Story TamilMajunu Love Story TamilArasaktchi Action TamilLove You Hamesha Love Story Hindi
28
www.ceeitv.com
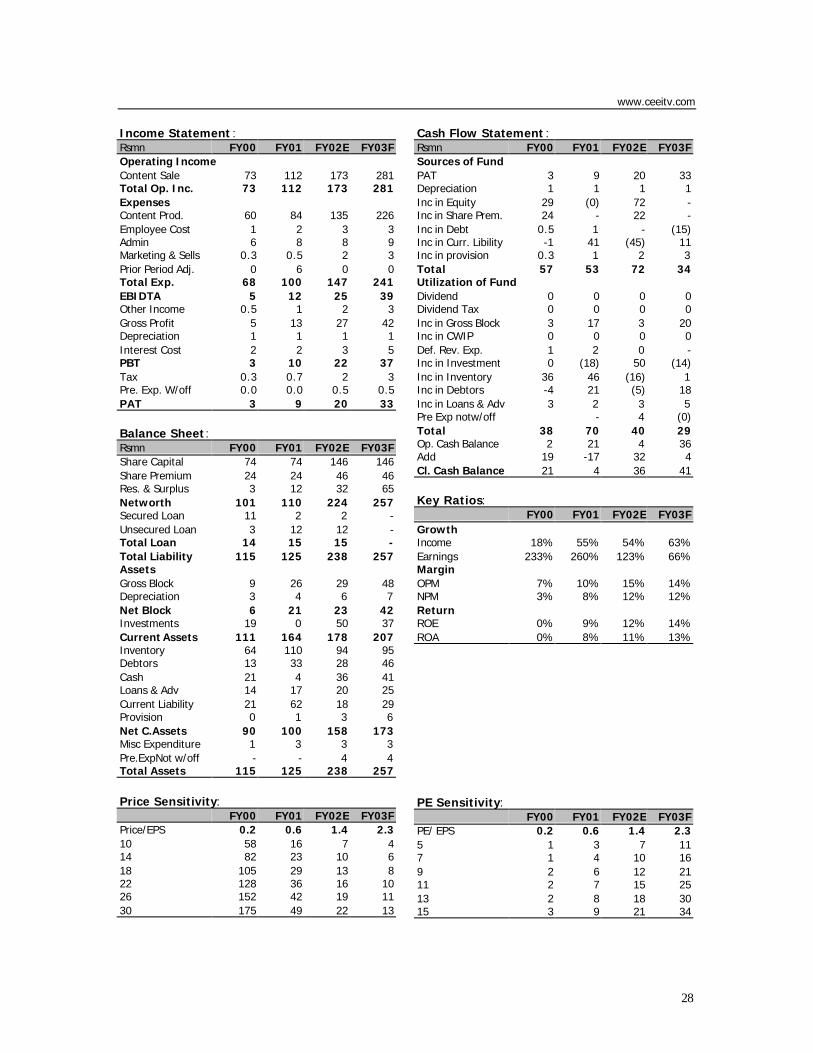
Income Statement :Rsmn FY00 FY01 FY02E FY03FOperating IncomeContent Sale 73 112 173 281Total Op. Inc. 73 112 173 281ExpensesContent Prod. 60 84 135 226Employee Cost 1 2 3 3Admin 6 8 8 9Marketing & Sells 0.3 0.5 2 3Prior Period Adj. 0 6 0 0Total Exp. 68 100 147 241EBIDTA 5 12 25 39Other Income 0.5 1 2 3Gross Profit 5 13 27 42Depreciation 1 1 1 1Interest Cost 2 2 3 5PBT 3 10 22 37Tax 0.3 0.7 2 3Pre. Exp. W/off 0.0 0.0 0.5 0.5PAT 3 9 20 33
Balance Sheet:Rsmn FY00 FY01 FY02E FY03FShare Capital 74 74 146 146Share Premium 24 24 46 46Res. & Surplus 3 12 32 65Networth 101 110 224 257Secured Loan 11 2 2 -Unsecured Loan 3 12 12 -Total Loan 14 15 15 -Total Liability 115 125 238 257AssetsGross Block 9 26 29 48Depreciation 3 4 6 7Net Block 6 21 23 42Investments 19 0 50 37Current Assets 111 164 178 207Inventory 64 110 94 95Debtors 13 33 28 46Cash 21 4 36 41Loans & Adv 14 17 20 25Current Liability 21 62 18 29Provision 0 1 3 6Net C.Assets 90 100 158 173Misc Expenditure 1 3 3 3Pre.ExpNot w/off - - 4 4Total Assets 115 125 238 257
Price Sensitivity:FY00 FY01 FY02E FY03F
Price/EPS 0.2 0.6 1.4 2.310 58 16 7 414 82 23 10 618 105 29 13 822 128 36 16 1026 152 42 19 1130 175 49 22 13
Cash Flow Statement :Rsmn FY00 FY01 FY02E FY03FSources of FundPAT 3 9 20 33Depreciation 1 1 1 1Inc in Equity 29 (0) 72 -Inc in Share Prem. 24 - 22 -Inc in Debt 0.5 1 - (15)Inc in Curr. Libility -1 41 (45) 11Inc in provision 0.3 1 2 3Total 57 53 72 34Utilization of FundDividend 0 0 0 0Dividend Tax 0 0 0 0Inc in Gross Block 3 17 3 20Inc in CWIP 0 0 0 0Def. Rev. Exp. 1 2 0 -Inc in Investment 0 (18) 50 (14)Inc in Inventory 36 46 (16) 1Inc in Debtors -4 21 (5) 18Inc in Loans & Adv 3 2 3 5Pre Exp notw/off - 4 (0)Total 38 70 40 29Op. Cash Balance 2 21 4 36Add 19 -17 32 4Cl. Cash Balance 21 4 36 41
Key Ratios:FY00 FY01 FY02E FY03F
GrowthIncome 18% 55% 54% 63%Earnings 233% 260% 123% 66%MarginOPM 7% 10% 15% 14%NPM 3% 8% 12% 12%ReturnROE 0% 9% 12% 14%ROA 0% 8% 11% 13%
PE Sensitivity:FY00 FY01 FY02E FY03F
PE/ EPS 0.2 0.6 1.4 2.35 1 3 7 117 1 4 10 169 2 6 12 2111 2 7 15 2513 2 8 18 3015 3 9 21 34
29
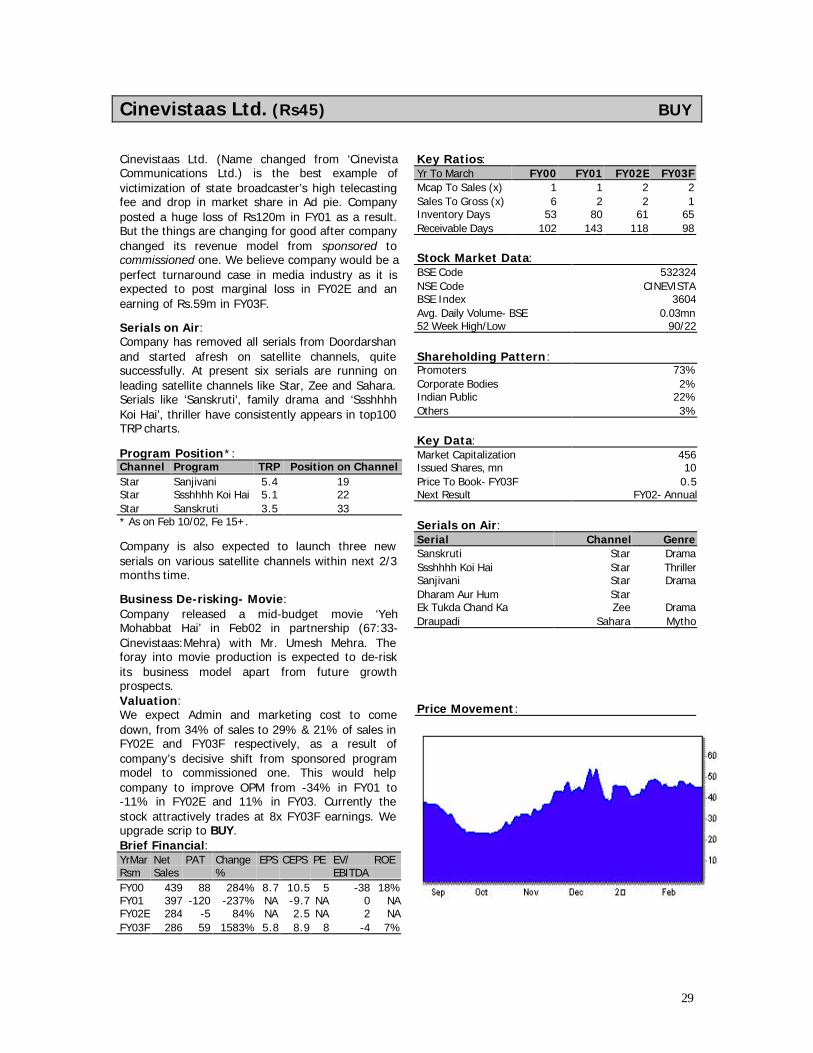
Cinevistaas Ltd. (Rs45) BUY
Cinevistaas Ltd. (Name changed from ‘CinevistaCommunications Ltd.) is the best example ofvictimization of state broadcaster’s high telecastingfee and drop in market share in Ad pie. Companyposted a huge loss of Rs120m in FY01 as a result.But the things are changing for good after companychanged its revenue model from sponsored tocommissioned one. We believe company would be aperfect turnaround case in media industry as it isexpected to post marginal loss in FY02E and anearning of Rs.59m in FY03F.
Serials on Air:Company has removed all serials from Doordarshanand started afresh on satellite channels, quitesuccessfully. At present six serials are running onleading satellite channels like Star, Zee and Sahara.Serials like ‘Sanskruti’, family drama and ‘SsshhhhKoi Hai’, thriller have consistently appears in top100TRP charts.
Program Position*:Channel Program TRP Position on ChannelStar Sanjivani 5.4 19Star Ssshhhh Koi Hai 5.1 22Star Sanskruti 3.5 33* As on Feb 10/02, Fe 15+.
Company is also expected to launch three newserials on various satellite channels within next 2/3months time.
Business De-risking- Movie:Company released a mid-budget movie ‘YehMohabbat Hai’ in Feb02 in partnership (67:33-Cinevistaas:Mehra) with Mr. Umesh Mehra. Theforay into movie production is expected to de-riskits business model apart from future growthprospects.Valuation:We expect Admin and marketing cost to comedown, from 34% of sales to 29% & 21% of sales inFY02E and FY03F respectively, as a result ofcompany’s decisive shift from sponsored programmodel to commissioned one. This would helpcompany to improve OPM from -34% in FY01 to-11% in FY02E and 11% in FY03. Currently thestock attractively trades at 8x FY03F earnings. Weupgrade scrip to BUY.Brief Financial:YrMar Net PAT Change EPS CEPS PE EV/ ROERsm Sales % EBITDAFY00 439 88 284% 8.7 10.5 5 -38 18%FY01 397 -120 -237% NA -9.7 NA 0 NAFY02E 284 -5 84% NA 2.5 NA 2 NAFY03F 286 59 1583% 5.8 8.9 8 -4 7%
Key Ratios:Yr To March FY00 FY01 FY02E FY03FMcap To Sales (x) 1 1 2 2Sales To Gross (x) 6 2 2 1Inventory Days 53 80 61 65Receivable Days 102 143 118 98
Stock Market Data:BSE Code 532324NSE Code CINEVISTABSE Index 3604Avg. Daily Volume- BSE 0.03mn52 Week High/Low 90/22
Shareholding Pattern:Promoters 73%Corporate Bodies 2%Indian Public 22%Others 3%
Key Data:Market Capitalization 456Issued Shares, mn 10Price To Book- FY03F 0.5Next Result FY02- Annual
Serials on Air:Serial Channel GenreSanskruti Star DramaSsshhhh Koi Hai Star ThrillerSanjivani Star DramaDharam Aur Hum StarEk Tukda Chand Ka Zee DramaDraupadi Sahara Mytho
Price Movement:
30
www.cine-vista.com
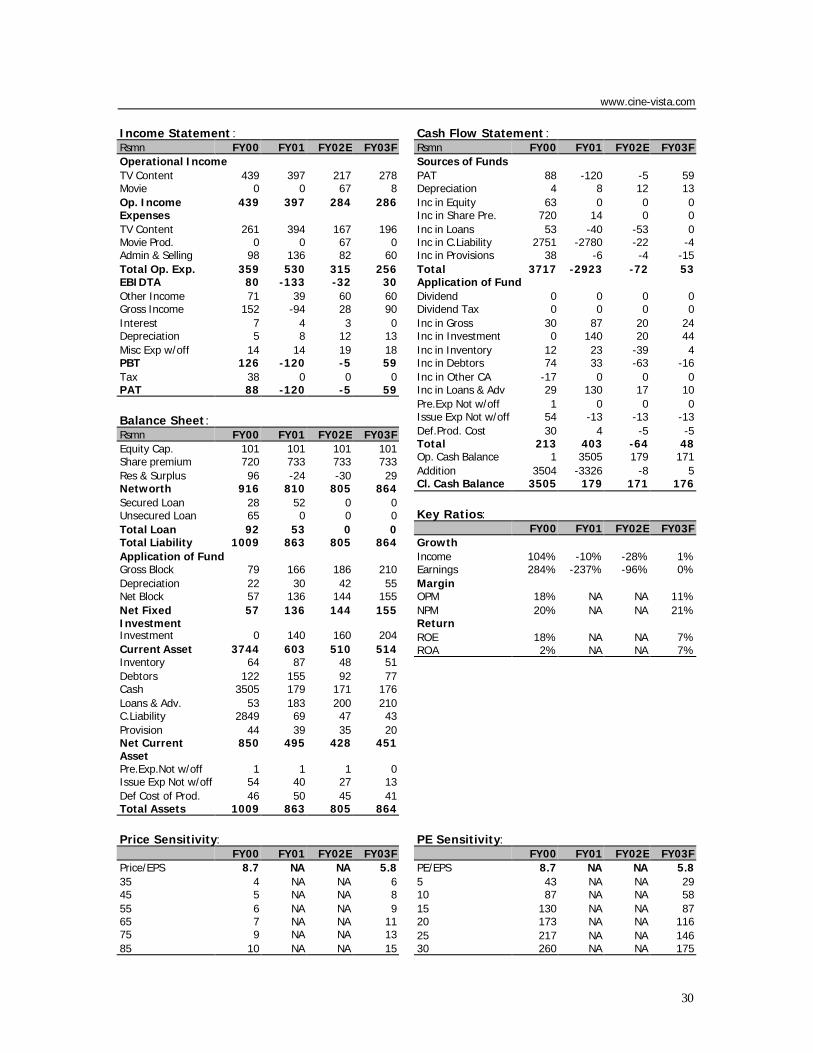
Income Statement :Rsmn FY00 FY01 FY02E FY03FOperational IncomeTV Content 439 397 217 278Movie 0 0 67 8Op. Income 439 397 284 286ExpensesTV Content 261 394 167 196Movie Prod. 0 0 67 0Admin & Selling 98 136 82 60Total Op. Exp. 359 530 315 256EBIDTA 80 -133 -32 30Other Income 71 39 60 60Gross Income 152 -94 28 90Interest 7 4 3 0Depreciation 5 8 12 13Misc Exp w/off 14 14 19 18PBT 126 -120 -5 59Tax 38 0 0 0PAT 88 -120 -5 59
Balance Sheet:Rsmn FY00 FY01 FY02E FY03FEquity Cap. 101 101 101 101Share premium 720 733 733 733Res & Surplus 96 -24 -30 29Networth 916 810 805 864Secured Loan 28 52 0 0Unsecured Loan 65 0 0 0Total Loan 92 53 0 0Total Liability 1009 863 805 864Application of FundGross Block 79 166 186 210Depreciation 22 30 42 55Net Block 57 136 144 155Net FixedInvestment
57 136 144 155
Investment 0 140 160 204Current Asset 3744 603 510 514Inventory 64 87 48 51Debtors 122 155 92 77Cash 3505 179 171 176Loans & Adv. 53 183 200 210C.Liability 2849 69 47 43Provision 44 39 35 20Net CurrentAsset
850 495 428 451
Pre.Exp.Not w/off 1 1 1 0Issue Exp Not w/off 54 40 27 13Def Cost of Prod. 46 50 45 41Total Assets 1009 863 805 864
Price Sensitivity:FY00 FY01 FY02E FY03F
Price/EPS 8.7 NA NA 5.835 4 NA NA 645 5 NA NA 855 6 NA NA 965 7 NA NA 1175 9 NA NA 1385 10 NA NA 15
Cash Flow Statement :Rsmn FY00 FY01 FY02E FY03FSources of FundsPAT 88 -120 -5 59Depreciation 4 8 12 13Inc in Equity 63 0 0 0Inc in Share Pre. 720 14 0 0Inc in Loans 53 -40 -53 0Inc in C.Liability 2751 -2780 -22 -4Inc in Provisions 38 -6 -4 -15Total 3717 -2923 -72 53Application of FundDividend 0 0 0 0Dividend Tax 0 0 0 0Inc in Gross 30 87 20 24Inc in Investment 0 140 20 44Inc in Inventory 12 23 -39 4Inc in Debtors 74 33 -63 -16Inc in Other CA -17 0 0 0Inc in Loans & Adv 29 130 17 10Pre.Exp Not w/off 1 0 0 0Issue Exp Not w/off 54 -13 -13 -13Def.Prod. Cost 30 4 -5 -5Total 213 403 -64 48Op. Cash Balance 1 3505 179 171Addition 3504 -3326 -8 5Cl. Cash Balance 3505 179 171 176
Key Ratios:FY00 FY01 FY02E FY03F
GrowthIncome 104% -10% -28% 1%Earnings 284% -237% -96% 0%MarginOPM 18% NA NA 11%NPM 20% NA NA 21%ReturnROE 18% NA NA 7%ROA 2% NA NA 7%
PE Sensitivity:FY00 FY01 FY02E FY03F
PE/EPS 8.7 NA NA 5.85 43 NA NA 2910 87 NA NA 5815 130 NA NA 8720 173 NA NA 11625 217 NA NA 14630 260 NA NA 175
31
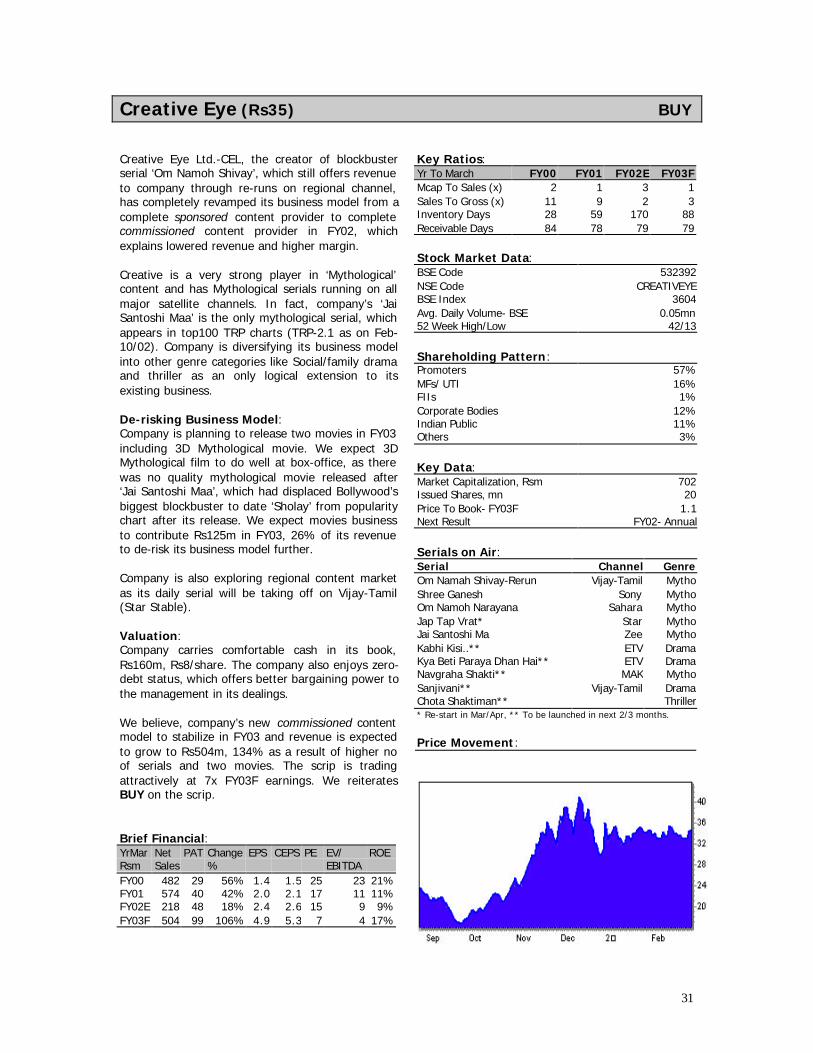
Creative Eye (Rs35) BUY
Creative Eye Ltd.-CEL, the creator of blockbusterserial ‘Om Namoh Shivay’, which still offers revenueto company through re-runs on regional channel,has completely revamped its business model from acomplete sponsored content provider to completecommissioned content provider in FY02, whichexplains lowered revenue and higher margin.
Creative is a very strong player in ‘Mythological’content and has Mythological serials running on allmajor satellite channels. In fact, company’s ‘JaiSantoshi Maa’ is the only mythological serial, whichappears in top100 TRP charts (TRP-2.1 as on Feb-10/02). Company is diversifying its business modelinto other genre categories like Social/family dramaand thriller as an only logical extension to itsexisting business.
De-risking Business Model:Company is planning to release two movies in FY03including 3D Mythological movie. We expect 3DMythological film to do well at box-office, as therewas no quality mythological movie released after‘Jai Santoshi Maa’, which had displaced Bollywood’sbiggest blockbuster to date ‘Sholay’ from popularitychart after its release. We expect movies businessto contribute Rs125m in FY03, 26% of its revenueto de-risk its business model further.
Company is also exploring regional content marketas its daily serial will be taking off on Vijay-Tamil(Star Stable).
Valuation:Company carries comfortable cash in its book,Rs160m, Rs8/share. The company also enjoys zero-debt status, which offers better bargaining power tothe management in its dealings.
We believe, company’s new commissioned contentmodel to stabilize in FY03 and revenue is expectedto grow to Rs504m, 134% as a result of higher noof serials and two movies. The scrip is tradingattractively at 7x FY03F earnings. We reiteratesBUY on the scrip.
Brief Financial:YrMar Net PAT Change EPS CEPS PE EV/ ROERsm Sales % EBITDAFY00 482 29 56% 1.4 1.5 25 23 21%FY01 574 40 42% 2.0 2.1 17 11 11%FY02E 218 48 18% 2.4 2.6 15 9 9%FY03F 504 99 106% 4.9 5.3 7 4 17%
Key Ratios:Yr To March FY00 FY01 FY02E FY03FMcap To Sales (x) 2 1 3 1Sales To Gross (x) 11 9 2 3Inventory Days 28 59 170 88Receivable Days 84 78 79 79
Stock Market Data:BSE Code 532392NSE Code CREATIVEYEBSE Index 3604Avg. Daily Volume- BSE 0.05mn52 Week High/Low 42/13
Shareholding Pattern:Promoters 57%MFs/ UTI 16%FIIs 1%Corporate Bodies 12%Indian Public 11%Others 3%
Key Data:Market Capitalization, Rsm 702Issued Shares, mn 20Price To Book- FY03F 1.1Next Result FY02- Annual
Serials on Air:Serial Channel GenreOm Namah Shivay-Rerun Vijay-Tamil MythoShree Ganesh Sony MythoOm Namoh Narayana Sahara MythoJap Tap Vrat* Star MythoJai Santoshi Ma Zee MythoKabhi Kisi..** ETV DramaKya Beti Paraya Dhan Hai** ETV DramaNavgraha Shakti** MAK MythoSanjivani** Vijay-Tamil DramaChota Shaktiman** Thriller* Re-start in Mar/Apr, ** To be launched in next 2/3 months.
Price Movement:

32
www.creativeeye.com
Income Statement :Rsmn FY00 FY01 FY02E FY03FContent Sale 452 524 207 484Inc in Inventory 30 50 11 20Op.Income 482 574 218 504ExpensesContent Purchase 94 0 3 0Content Production 37 0 81 337Telecast Expenses 297 0 44 0Admin & Other 26 28 35 45Total 454 530 163 382EBITDA 28 44 54 121Other Income 15 9 18 20Gross Income 43 54 72 141Interest Cost 0 1 0 0Depreciation 2 3 5 7Bad Debts w/off 4 0 0 0Def.Rev.Exp.w/off 1 0 0 0Pre. Exp. W/off 0 0 3 3PBT 37 50 64 131Tax 8 10 16 33PAT 29 40 48 99
Balance Sheet:Rsmn FY00 FY01 FY02E FY03FEquity Capital 75 100 100 100Share Premium 133 360 360 360Res. & Surplus 13 38 76 166Networth 221 498 537 626Secured Loan 1 0 0 0Unsecured Loan 0 0 0 0Total Loan 1 0 0 0Total Liability 222 499 537 626Application of FundGross Block 42 61 106 140Brand Acquisition 135 135 135 135Depreciation 7 10 15 22Net Block 170 186 226 253CWIP 1 0 0 0Net Fixed Inv. 170 186 226 253Investment 1 1 1 1Current Asset 207 420 356 458Inventory 35 85 96 116Debtors 104 112 45 105Cash 45 205 187 197Other CA 7 6 10 15Loans & Adv. 16 12 18 25S.Creditors 143 127 48 68Provision 12 11 25 42Net Cur. Asset 52 282 283 348Pre.Exp.Not w/off 0 30 27 24Total Assets 222 499 537 626
Price Sensitivity:FY00 FY01 FY02E FY03F
Price/EPS 1.4 2.0 2.4 4.925 18 12 10 535 25 17 15 745 32 22 19 955 39 27 23 1165 46 32 27 1375 53 37 31 15
Cash Flow Statement :Rsmn FY00 FY01 FY02E FY03FSources of FundPAT 29 40 48 99Depreciation 2 2 5 7Inc in Equity 7 25 0 0Inc in Share pre. 0 220 0 0Inc in Loan -1 -1 0 0Inc in C.Liability 6 -16 -79 20Inc in Provision -1 -1 14 17Total 41 271 -13 143Application of FundsDividend 4 8 8 8Dividend Tax 0 1 1 1Inc in Gross 10 19 45 34Inc in CWIP 1 -1 0 0Inc in Investment 0 0 0 0Inc in Inventory 30 50 11 20Inc in Debtors 2 8 -67 60Inc in Other CA 1 -1 4 5Inc in Loans & Adv 8 -4 6 7Inc in Misc Exp. 0 30 -3 -3Total 56 111 6 132Op. Cash Balance 56 45 205 187Addition -11 160 -18 10Cl. Cash Balance 45 205 187 197
Key Ratios:FY00 FY01 FY02E FY03F
GrowthIncome 16% 16% -61% 134%Earnings 56% 42% 18% 106%MarginOPM 6% 8% 25% 24%NPM 6% 7% 22% 20%ReturnROE 21% 11% 9% 17%ROA 10% 8% 8% 15%
PE Sensitivity:FY00 FY01 FY02E FY03F
PE/EPS 1.4 2.0 2.4 4.95 7 10 12 2510 14 20 24 4915 21 30 36 7420 28 40 48 9825 36 50 60 12330 43 60 71 147
33
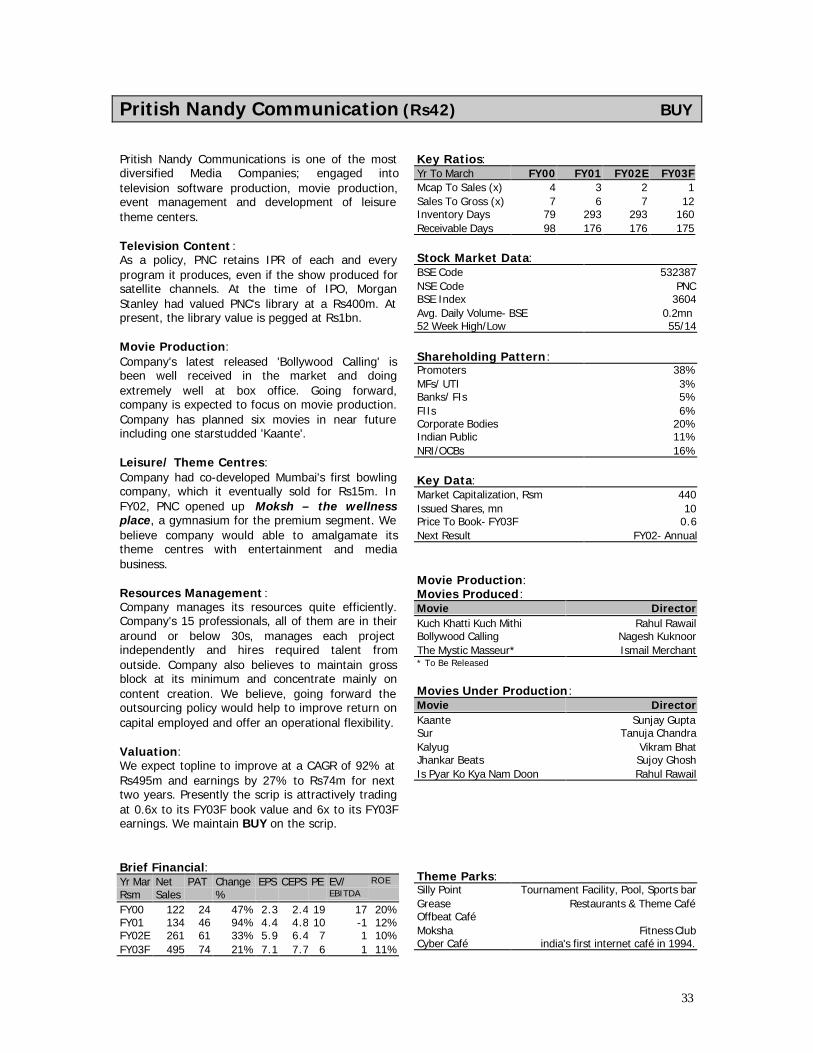
Pritish Nandy Communication (Rs42) BUY
Pritish Nandy Communications is one of the mostdiversified Media Companies; engaged intotelevision software production, movie production,event management and development of leisuretheme centers.
Television Content :As a policy, PNC retains IPR of each and everyprogram it produces, even if the show produced forsatellite channels. At the time of IPO, MorganStanley had valued PNC's library at a Rs400m. Atpresent, the library value is pegged at Rs1bn.
Movie Production:Company's latest released 'Bollywood Calling' isbeen well received in the market and doingextremely well at box office. Going forward,company is expected to focus on movie production.Company has planned six movies in near futureincluding one starstudded 'Kaante'.
Leisure/ Theme Centres:Company had co-developed Mumbai's first bowlingcompany, which it eventually sold for Rs15m. InFY02, PNC opened up Moksh – the wellnessplace, a gymnasium for the premium segment. Webelieve company would able to amalgamate itstheme centres with entertainment and mediabusiness.
Resources Management :Company manages its resources quite efficiently.Company's 15 professionals, all of them are in theiraround or below 30s, manages each projectindependently and hires required talent fromoutside. Company also believes to maintain grossblock at its minimum and concentrate mainly oncontent creation. We believe, going forward theoutsourcing policy would help to improve return oncapital employed and offer an operational flexibility.
Valuation:We expect topline to improve at a CAGR of 92% atRs495m and earnings by 27% to Rs74m for nexttwo years. Presently the scrip is attractively tradingat 0.6x to its FY03F book value and 6x to its FY03Fearnings. We maintain BUY on the scrip.
Brief Financial:Yr Mar Net PAT Change EPS CEPS PE EV/ ROE
Rsm Sales % EBITDA
FY00 122 24 47% 2.3 2.4 19 17 20%FY01 134 46 94% 4.4 4.8 10 -1 12%FY02E 261 61 33% 5.9 6.4 7 1 10%FY03F 495 74 21% 7.1 7.7 6 1 11%
Key Ratios:Yr To March FY00 FY01 FY02E FY03FMcap To Sales (x) 4 3 2 1Sales To Gross (x) 7 6 7 12Inventory Days 79 293 293 160Receivable Days 98 176 176 175
Stock Market Data:BSE Code 532387NSE Code PNCBSE Index 3604Avg. Daily Volume- BSE 0.2mn52 Week High/Low 55/14
Shareholding Pattern:Promoters 38%MFs/ UTI 3%Banks/ FIs 5%FIIs 6%Corporate Bodies 20%Indian Public 11%NRI/OCBs 16%
Key Data:Market Capitalization, Rsm 440Issued Shares, mn 10Price To Book- FY03F 0.6Next Result FY02- Annual
Movie Production:Movies Produced:Movie DirectorKuch Khatti Kuch Mithi Rahul RawailBollywood Calling Nagesh KuknoorThe Mystic Masseur* Ismail Merchant* To Be Released
Movies Under Production:Movie DirectorKaante Sunjay GuptaSur Tanuja ChandraKalyug Vikram BhatJhankar Beats Sujoy GhoshIs Pyar Ko Kya Nam Doon Rahul Rawail
Theme Parks:Silly Point Tournament Facility, Pool, Sports barGrease Restaurants & Theme CaféOffbeat CaféMoksha Fitness ClubCyber Café india's first internet café in 1994.
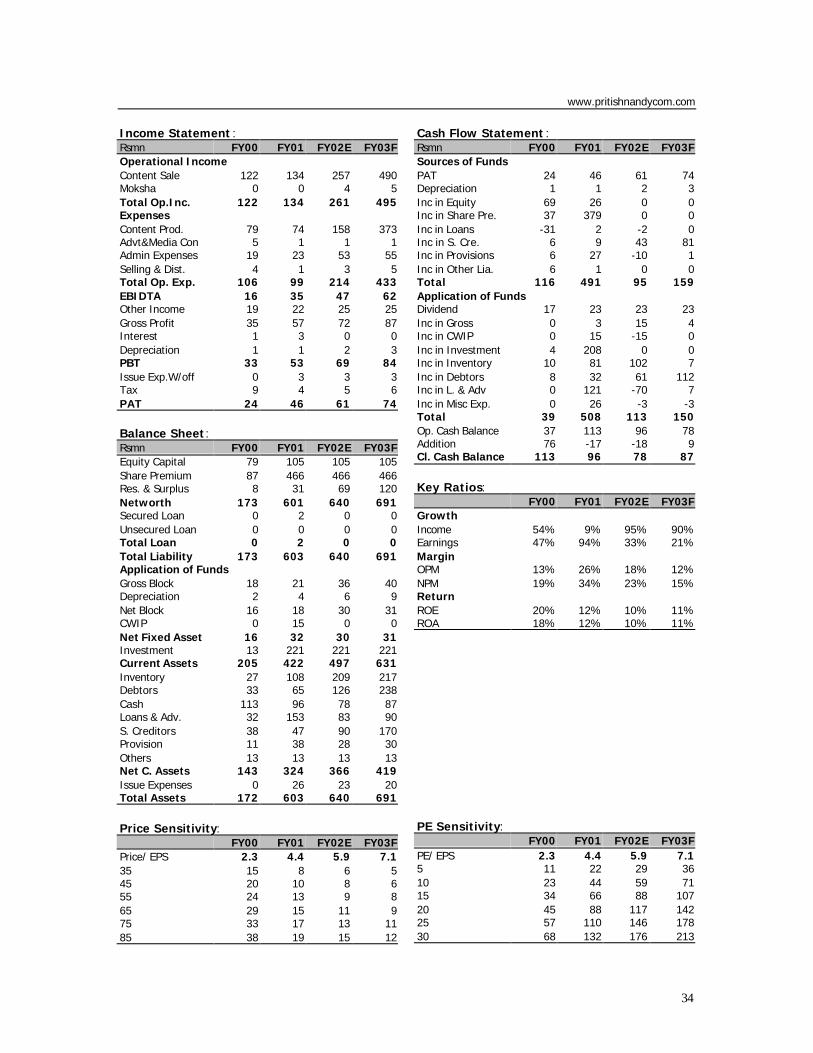
34
www.pritishnandycom.com
Income Statement :Rsmn FY00 FY01 FY02E FY03FOperational IncomeContent Sale 122 134 257 490Moksha 0 0 4 5Total Op.Inc. 122 134 261 495ExpensesContent Prod. 79 74 158 373Advt&Media Con 5 1 1 1Admin Expenses 19 23 53 55Selling & Dist. 4 1 3 5Total Op. Exp. 106 99 214 433EBIDTA 16 35 47 62Other Income 19 22 25 25Gross Profit 35 57 72 87Interest 1 3 0 0Depreciation 1 1 2 3PBT 33 53 69 84Issue Exp.W/off 0 3 3 3Tax 9 4 5 6PAT 24 46 61 74
Balance Sheet:Rsmn FY00 FY01 FY02E FY03FEquity Capital 79 105 105 105Share Premium 87 466 466 466Res. & Surplus 8 31 69 120Networth 173 601 640 691Secured Loan 0 2 0 0Unsecured Loan 0 0 0 0Total Loan 0 2 0 0Total Liability 173 603 640 691Application of FundsGross Block 18 21 36 40Depreciation 2 4 6 9Net Block 16 18 30 31CWIP 0 15 0 0Net Fixed Asset 16 32 30 31Investment 13 221 221 221Current Assets 205 422 497 631Inventory 27 108 209 217Debtors 33 65 126 238Cash 113 96 78 87Loans & Adv. 32 153 83 90S. Creditors 38 47 90 170Provision 11 38 28 30Others 13 13 13 13Net C. Assets 143 324 366 419Issue Expenses 0 26 23 20Total Assets 172 603 640 691
Price Sensitivity:FY00 FY01 FY02E FY03F
Price/ EPS 2.3 4.4 5.9 7.135 15 8 6 545 20 10 8 655 24 13 9 865 29 15 11 975 33 17 13 1185 38 19 15 12
Cash Flow Statement :Rsmn FY00 FY01 FY02E FY03FSources of FundsPAT 24 46 61 74Depreciation 1 1 2 3Inc in Equity 69 26 0 0Inc in Share Pre. 37 379 0 0Inc in Loans -31 2 -2 0Inc in S. Cre. 6 9 43 81Inc in Provisions 6 27 -10 1Inc in Other Lia. 6 1 0 0Total 116 491 95 159Application of FundsDividend 17 23 23 23Inc in Gross 0 3 15 4Inc in CWIP 0 15 -15 0Inc in Investment 4 208 0 0Inc in Inventory 10 81 102 7Inc in Debtors 8 32 61 112Inc in L. & Adv 0 121 -70 7Inc in Misc Exp. 0 26 -3 -3Total 39 508 113 150Op. Cash Balance 37 113 96 78Addition 76 -17 -18 9Cl. Cash Balance 113 96 78 87
Key Ratios:FY00 FY01 FY02E FY03F
GrowthIncome 54% 9% 95% 90%Earnings 47% 94% 33% 21%MarginOPM 13% 26% 18% 12%NPM 19% 34% 23% 15%ReturnROE 20% 12% 10% 11%ROA 18% 12% 10% 11%
PE Sensitivity:FY00 FY01 FY02E FY03F
PE/ EPS 2.3 4.4 5.9 7.15 11 22 29 3610 23 44 59 7115 34 66 88 10720 45 88 117 14225 57 110 146 17830 68 132 176 213
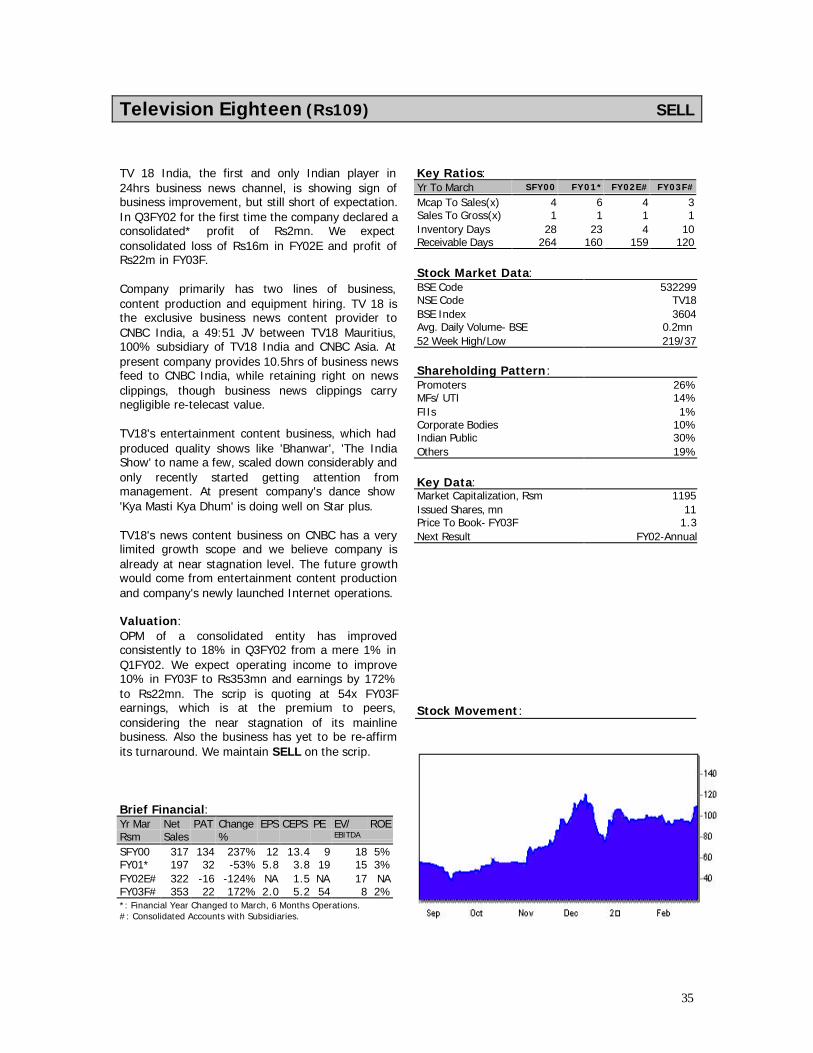
35
Television Eighteen (Rs109) SELL
TV 18 India, the first and only Indian player in24hrs business news channel, is showing sign ofbusiness improvement, but still short of expectation.In Q3FY02 for the first time the company declared aconsolidated* profit of Rs2mn. We expectconsolidated loss of Rs16m in FY02E and profit ofRs22m in FY03F.
Company primarily has two lines of business,content production and equipment hiring. TV 18 isthe exclusive business news content provider toCNBC India, a 49:51 JV between TV18 Mauritius,100% subsidiary of TV18 India and CNBC Asia. Atpresent company provides 10.5hrs of business newsfeed to CNBC India, while retaining right on newsclippings, though business news clippings carrynegligible re-telecast value.
TV18's entertainment content business, which hadproduced quality shows like 'Bhanwar', 'The IndiaShow' to name a few, scaled down considerably andonly recently started getting attention frommanagement. At present company's dance show'Kya Masti Kya Dhum' is doing well on Star plus.
TV18's news content business on CNBC has a verylimited growth scope and we believe company isalready at near stagnation level. The future growthwould come from entertainment content productionand company's newly launched Internet operations.
Valuation:OPM of a consolidated entity has improvedconsistently to 18% in Q3FY02 from a mere 1% inQ1FY02. We expect operating income to improve10% in FY03F to Rs353mn and earnings by 172%to Rs22mn. The scrip is quoting at 54x FY03Fearnings, which is at the premium to peers,considering the near stagnation of its mainlinebusiness. Also the business has yet to be re-affirmits turnaround. We maintain SELL on the scrip.
Brief Financial:Yr Mar Net PAT Change EPS CEPS PE EV/ ROERsm Sales % EBITDA
SFY00 317 134 237% 12 13.4 9 18 5%FY01* 197 32 -53% 5.8 3.8 19 15 3%FY02E# 322 -16 -124% NA 1.5 NA 17 NAFY03F# 353 22 172% 2.0 5.2 54 8 2%*: Financial Year Changed to March, 6 Months Operations.#: Consolidated Accounts with Subsidiaries.
Key Ratios:Yr To March SFY00 FY01* FY02E# FY03F#
Mcap To Sales(x) 4 6 4 3Sales To Gross(x) 1 1 1 1Inventory Days 28 23 4 10Receivable Days 264 160 159 120
Stock Market Data:BSE Code 532299NSE Code TV18BSE Index 3604Avg. Daily Volume- BSE 0.2mn52 Week High/Low 219/37
Shareholding Pattern:Promoters 26%MFs/ UTI 14%FIIs 1%Corporate Bodies 10%Indian Public 30%Others 19%
Key Data:Market Capitalization, Rsm 1195Issued Shares, mn 11Price To Book- FY03F 1.3Next Result FY02-Annual
Stock Movement:
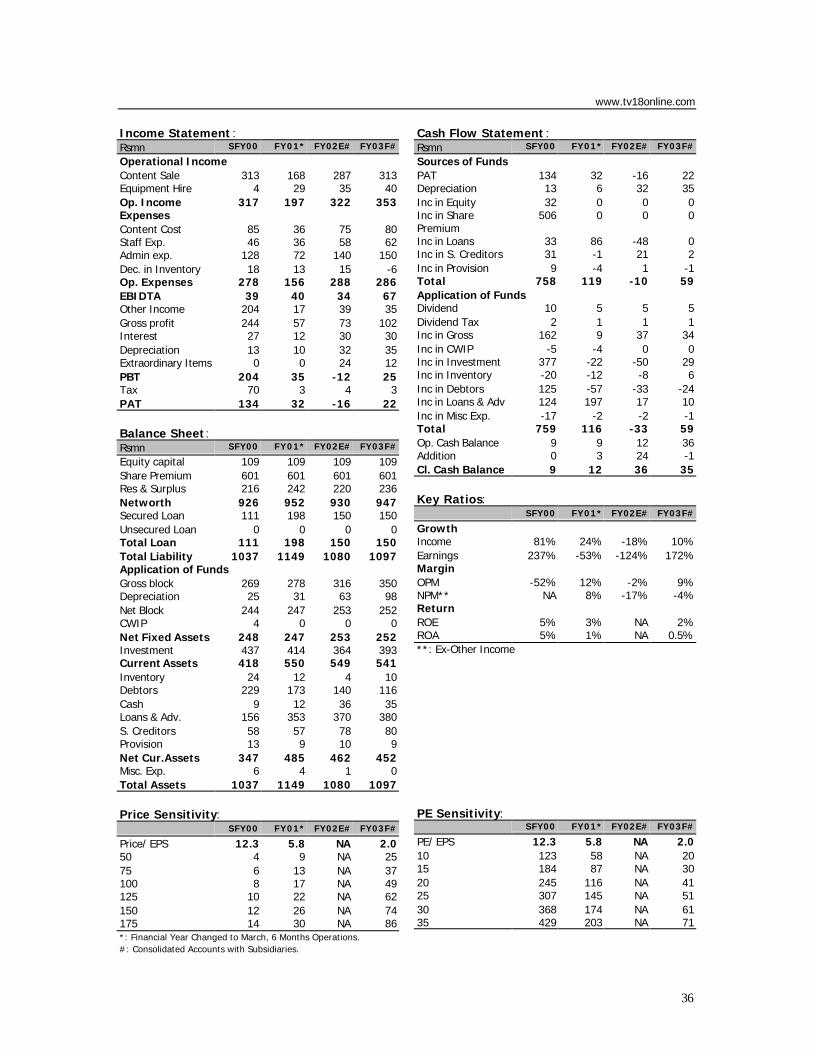
36
www.tv18online.com
Income Statement :Rsmn SFY00 FY01* FY02E# FY03F#
Operational IncomeContent Sale 313 168 287 313Equipment Hire 4 29 35 40Op. Income 317 197 322 353ExpensesContent Cost 85 36 75 80Staff Exp. 46 36 58 62Admin exp. 128 72 140 150Dec. in Inventory 18 13 15 -6Op. Expenses 278 156 288 286EBIDTA 39 40 34 67Other Income 204 17 39 35Gross profit 244 57 73 102Interest 27 12 30 30Depreciation 13 10 32 35Extraordinary Items 0 0 24 12PBT 204 35 -12 25Tax 70 3 4 3PAT 134 32 -16 22
Balance Sheet:Rsmn SFY00 FY01* FY02E# FY03F#
Equity capital 109 109 109 109Share Premium 601 601 601 601Res & Surplus 216 242 220 236Networth 926 952 930 947Secured Loan 111 198 150 150Unsecured Loan 0 0 0 0Total Loan 111 198 150 150Total Liability 1037 1149 1080 1097Application of FundsGross block 269 278 316 350Depreciation 25 31 63 98Net Block 244 247 253 252CWIP 4 0 0 0Net Fixed Assets 248 247 253 252Investment 437 414 364 393Current Assets 418 550 549 541Inventory 24 12 4 10Debtors 229 173 140 116Cash 9 12 36 35Loans & Adv. 156 353 370 380S. Creditors 58 57 78 80Provision 13 9 10 9Net Cur.Assets 347 485 462 452Misc. Exp. 6 4 1 0Total Assets 1037 1149 1080 1097
Price Sensitivity:SFY00 FY01* FY02E# FY03F#
Price/ EPS 12.3 5.8 NA 2.050 4 9 NA 2575 6 13 NA 37100 8 17 NA 49125 10 22 NA 62150 12 26 NA 74175 14 30 NA 86*: Financial Year Changed to March, 6 Months Operations.#: Consolidated Accounts with Subsidiaries.
Cash Flow Statement :Rsmn SFY00 FY01* FY02E# FY03F#
Sources of FundsPAT 134 32 -16 22Depreciation 13 6 32 35Inc in Equity 32 0 0 0Inc in SharePremium
506 0 0 0
Inc in Loans 33 86 -48 0Inc in S. Creditors 31 -1 21 2Inc in Provision 9 -4 1 -1Total 758 119 -10 59Application of FundsDividend 10 5 5 5Dividend Tax 2 1 1 1Inc in Gross 162 9 37 34Inc in CWIP -5 -4 0 0Inc in Investment 377 -22 -50 29Inc in Inventory -20 -12 -8 6Inc in Debtors 125 -57 -33 -24Inc in Loans & Adv 124 197 17 10Inc in Misc Exp. -17 -2 -2 -1Total 759 116 -33 59Op. Cash Balance 9 9 12 36Addition 0 3 24 -1Cl. Cash Balance 9 12 36 35
Key Ratios:SFY00 FY01* FY02E# FY03F#
GrowthIncome 81% 24% -18% 10%Earnings 237% -53% -124% 172%MarginOPM -52% 12% -2% 9%NPM** NA 8% -17% -4%ReturnROE 5% 3% NA 2%ROA 5% 1% NA 0.5%**: Ex-Other Income
PE Sensitivity:SFY00 FY01* FY02E# FY03F#
PE/ EPS 12.3 5.8 NA 2.010 123 58 NA 2015 184 87 NA 3020 245 116 NA 4125 307 145 NA 5130 368 174 NA 6135 429 203 NA 71
37
Post-Production/ Film Exhibition
In-house Post-Production
Film Exhibition
Cable/VCD
Future Unfolds
Film exhibition business, traditional and big format and post productioncompanies though provides infrastructure network to entertainment &media industry and end-to-end service, its valuation always lags behind toits counterparts in content creation and content marketers. The industryrequires huge investment to start with and apart from initial investment,entry barriers are low for new entrant. Be it a Film printing and processingbusiness, film exhibition business or post-production services like editing,mixing etc, technical talent is available abundant and cheaply. Besides lowentry barriers, large initial investment and longer break-even period alsomakes projects unattractive.
Many of the film producers and television content producers, the maincustomers of post-production houses have recently gone public and raisedpublic money to set up their own post-production studios, which savestime and operational expenses for them and offer much neededoperational flexibility. The situation is showing on many post-productioncompanies as they either diversified their business into serial productions,animation or started perishing. We believe going forward pure post-production play wouldn’t add any value to its stakeholders and companiesneed to find out their own synergies with other industries to diversify.
Film exhibitors were hit very badly in the last two years due to the lack ofavailability of quality content. While operational cost moved upsignificantly along with irrational entertainment taxes at the wish of stategovernments, the industry is reeling under pressure. Recently ‘Maharastra’government declared multiplex policy with five-year entertainment taxholiday. Buoyed with the policy, Maharastra is expected to witness amultiplex boom with approximately 50 screens to be added in next twoyears time. While policy is been received quite enthusiastically, it doesn’toffer anything to standalone cinemas, which is crucial for film industry, asnew multiplexes will take time to be operational to offer any tangible gain.
Association of film producers has banned producers to sellCable/Satellite/DVD or VCD rights of any films before 12 months of theaterrelease. Despite this strict ruling and all efforts from security agencies,pirates managed to release VCD of any film just on the same day of filmrelease. While cinema halls charge anywhere between Rs30-100 perperson for film viewing, pirates offer their service just for Rs25/per view,at any time of the day. Improved quality of pirated VCDs, flexibility of filmviewing and considerable price drop in VCD players (Rs2500 onwards)after the entry of Chinese players made market much tougher for thecinema halls.
The fate of the film exhibition business is more in hands of film producersthan exhibitors themselves. Despite higher pricing, lower flexibility it isseen that audiences do turn to cinema halls, provided the content is good.As film success ratio is dropping consistently over a period of time, onlygood content would improve capacity utilization for the industry.
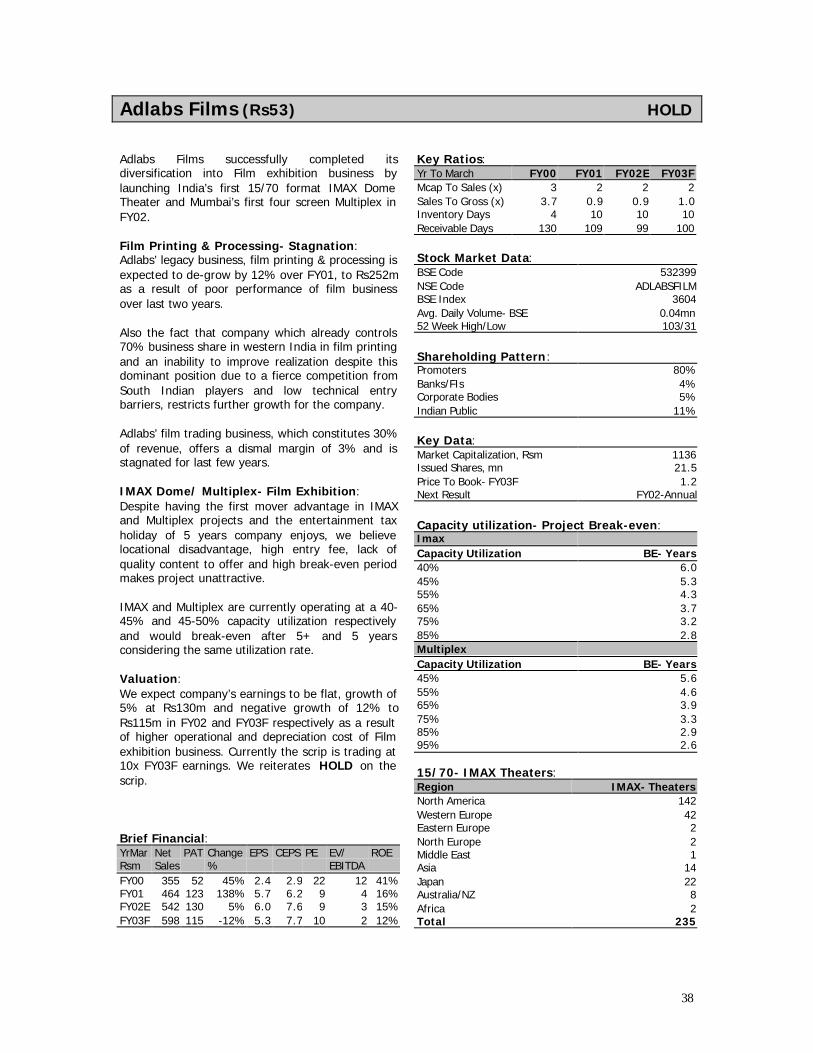
38
Adlabs Films (Rs53) HOLD
Adlabs Films successfully completed itsdiversification into Film exhibition business bylaunching India’s first 15/70 format IMAX DomeTheater and Mumbai’s first four screen Multiplex inFY02.
Film Printing & Processing- Stagnation:Adlabs’ legacy business, film printing & processing isexpected to de-grow by 12% over FY01, to Rs252mas a result of poor performance of film businessover last two years.
Also the fact that company which already controls70% business share in western India in film printingand an inability to improve realization despite thisdominant position due to a fierce competition fromSouth Indian players and low technical entrybarriers, restricts further growth for the company.
Adlabs’ film trading business, which constitutes 30%of revenue, offers a dismal margin of 3% and isstagnated for last few years.
IMAX Dome/ Multiplex- Film Exhibition:Despite having the first mover advantage in IMAXand Multiplex projects and the entertainment taxholiday of 5 years company enjoys, we believelocational disadvantage, high entry fee, lack ofquality content to offer and high break-even periodmakes project unattractive.
IMAX and Multiplex are currently operating at a 40-45% and 45-50% capacity utilization respectivelyand would break-even after 5+ and 5 yearsconsidering the same utilization rate.
Valuation:We expect company’s earnings to be flat, growth of5% at Rs130m and negative growth of 12% toRs115m in FY02 and FY03F respectively as a resultof higher operational and depreciation cost of Filmexhibition business. Currently the scrip is trading at10x FY03F earnings. We reiterates HOLD on thescrip.
Brief Financial:YrMar Net PAT Change EPS CEPS PE EV/ ROERsm Sales % EBITDAFY00 355 52 45% 2.4 2.9 22 12 41%FY01 464 123 138% 5.7 6.2 9 4 16%FY02E 542 130 5% 6.0 7.6 9 3 15%FY03F 598 115 -12% 5.3 7.7 10 2 12%
Key Ratios:Yr To March FY00 FY01 FY02E FY03FMcap To Sales (x) 3 2 2 2Sales To Gross (x) 3.7 0.9 0.9 1.0Inventory Days 4 10 10 10Receivable Days 130 109 99 100
Stock Market Data:BSE Code 532399NSE Code ADLABSFILMBSE Index 3604Avg. Daily Volume- BSE 0.04mn52 Week High/Low 103/31
Shareholding Pattern:Promoters 80%Banks/FIs 4%Corporate Bodies 5%Indian Public 11%
Key Data:Market Capitalization, Rsm 1136Issued Shares, mn 21.5Price To Book- FY03F 1.2Next Result FY02-Annual
Capacity utilization- Project Break-even:ImaxCapacity Utilization BE- Years40% 6.045% 5.355% 4.365% 3.775% 3.285% 2.8MultiplexCapacity Utilization BE- Years45% 5.655% 4.665% 3.975% 3.385% 2.995% 2.6
15/70- IMAX Theaters:Region IMAX- TheatersNorth America 142Western Europe 42Eastern Europe 2North Europe 2Middle East 1Asia 14Japan 22Australia/NZ 8Africa 2Total 235

39
www.adlabsfilms.com
Income Statement :Rsmn FY00 FY01 FY02E FY03FFilm Print & Proce. 174 286 252 277Traded Goods 181 178 194 203IMAX 0 0 65 74Multiplex 0 0 31 44Op. Income 355 464 542 598Production Exp 74 91 80 90Traded Goods 173 171 187 197IMAX/Multiplex 0 2 62 88Staff & Admin 24 37 40 45Inventory Adj. 0 -2 -2 -1Op. Expenses 270 301 367 419EBIDTA 84 163 175 179Other Income 14 27 54 50Gross Profit 98 191 229 228Interest 0 2 11 11Depreciation 10 9 33 50PBT 88 179 185 167Tax 33 50 45 42Prior Period Items 2 0 0 0Depre. W/back 0 4 0 0Issue Exp. W/off 1 10 10 10PAT 52 123 130 115
Balance Sheet:Rsmn FY00 FY01 FY02E FY03FEquity Capital 86 108 108 108Share Premium 0 506 506 506Res & Surplus 42 140 245 335Networth 127 754 859 949Unsecured Loans 52 74 63 63Total Loan 52 74 63 63Total Liability 179 828 922 1012Application of FundsGross Block 96 531 589 600Depreciation 36 42 74 124Net Block 60 489 515 476CWIP 0 33 0 0Net Fixed Asset 60 522 515 476Investment 117 0 0 0Current Assets 308 693 766 950Inventory 4 13 15 16Debtors 126 138 146 163Cash 45 74 204 321Other C. Assets 97 0 0 0Loans & Advances 35 467 400 450S. Creditors 175 257 238 274Provision 131 172 153 162Net C. Assets 2 263 375 514IssueExp. Not w/off 0 43 32 22Total Assets 179 828 922 1012
Price Sensitivity:FY00 FY01 FY02E FY03F
Price/ EPS 2.4 5.7 6.0 5.335 15 6 6 745 19 8 7 855 23 10 9 1065 27 11 11 1275 31 13 12 1485 35 15 14 16
Cash Flow Statement :Rsmn FY00 FY01 FY02E FY03FSources of FundsPAT 52 123 130 115Depreciation 10 5 33 50Inc in Equity 0 22 0 0Inc in Share Prem. 0 506 0 0Inc in Loans 40 22 -11 0Inc in C.Liability 28 82 -19 36Inc in Provision 66 42 -19 9Total 195 802 114 210Application of FundsDividend 30 23 23 23Dividend Tax 3 2 2 2Inc in Gross 8 435 59 11Inc in CWIP 0 33 -33 0Inc in Investment 117 -117 0 0Inc in Inventory 0 9 2 1Inc in Debtors 24 12 8 17Inc in Other CA -3 -97 0 0Inc in Loans & Adv -14 432 -67 50Inc in Misc Exp 0 43 -11 -10Total 166 773 -17 93Op. Cash Balance 16 45 74 204Addition 29 29 131 117Cl. Cash Balance 45 74 204 321
Key Ratios:FY00 FY01 FY02E FY03F
GrowthIncome 21% 31% 17% 10%Earnings 45% 138% 5% -12%MarginOPM 24% 35% 32% 30%NPM 15% 27% 24% 19%ReturnROE 41% 16% 15% 12%ROA 13% 14% 10% 8%
PE Sensitivity:FY00 FY01 FY02E FY03F
PE/ EPS 2.4 5.7 6.0 5.35 12 29 30 2710 24 57 60 5315 36 86 91 8020 48 115 121 10725 60 144 151 13430 72 172 181 160
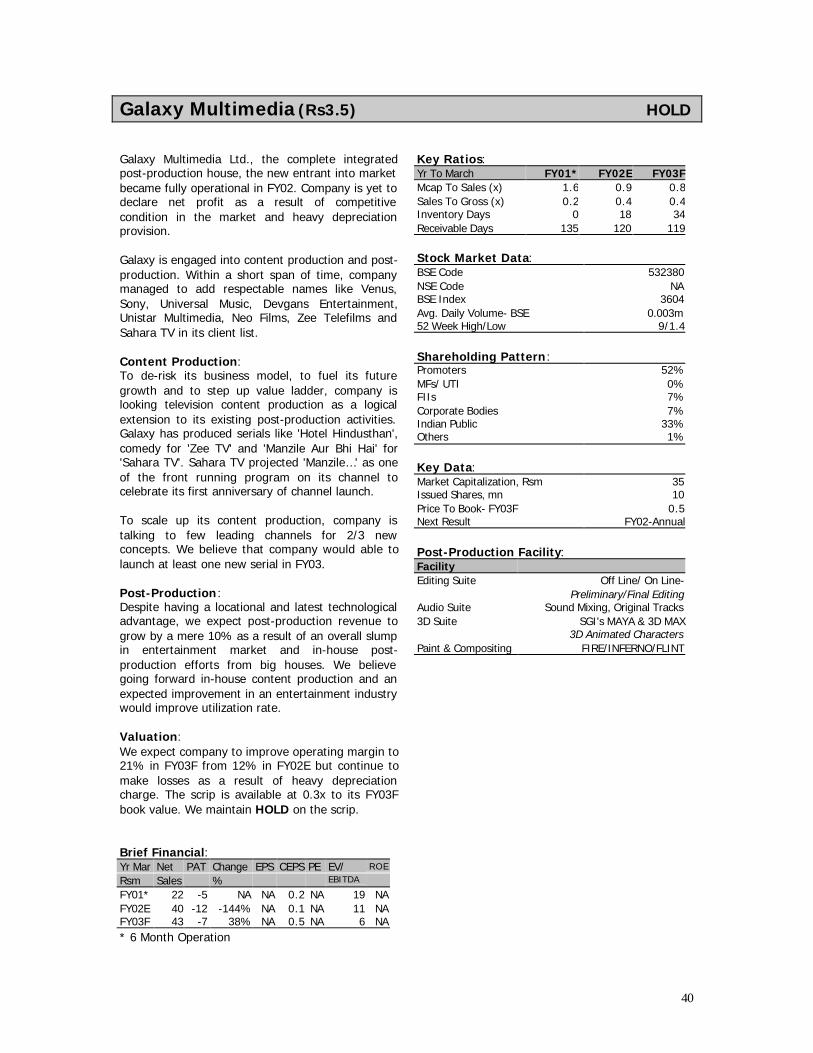
40
Galaxy Multimedia (Rs3.5) HOLD
Galaxy Multimedia Ltd., the complete integratedpost-production house, the new entrant into marketbecame fully operational in FY02. Company is yet todeclare net profit as a result of competitivecondition in the market and heavy depreciationprovision.
Galaxy is engaged into content production and post-production. Within a short span of time, companymanaged to add respectable names like Venus,Sony, Universal Music, Devgans Entertainment,Unistar Multimedia, Neo Films, Zee Telefilms andSahara TV in its client list.
Content Production:To de-risk its business model, to fuel its futuregrowth and to step up value ladder, company islooking television content production as a logicalextension to its existing post-production activities.Galaxy has produced serials like 'Hotel Hindusthan',comedy for 'Zee TV' and 'Manzile Aur Bhi Hai' for'Sahara TV'. Sahara TV projected 'Manzile…' as oneof the front running program on its channel tocelebrate its first anniversary of channel launch.
To scale up its content production, company istalking to few leading channels for 2/3 newconcepts. We believe that company would able tolaunch at least one new serial in FY03.
Post-Production:Despite having a locational and latest technologicaladvantage, we expect post-production revenue togrow by a mere 10% as a result of an overall slumpin entertainment market and in-house post-production efforts from big houses. We believegoing forward in-house content production and anexpected improvement in an entertainment industrywould improve utilization rate.
Valuation:We expect company to improve operating margin to21% in FY03F from 12% in FY02E but continue tomake losses as a result of heavy depreciationcharge. The scrip is available at 0.3x to its FY03Fbook value. We maintain HOLD on the scrip.
Brief Financial:Yr Mar Net PAT Change EPS CEPS PE EV/ ROE
Rsm Sales % EBITDA
FY01* 22 -5 NA NA 0.2 NA 19 NAFY02E 40 -12 -144% NA 0.1 NA 11 NAFY03F 43 -7 38% NA 0.5 NA 6 NA* 6 Month Operation
Key Ratios:Yr To March FY01* FY02E FY03FMcap To Sales (x) 1.6 0.9 0.8Sales To Gross (x) 0.2 0.4 0.4Inventory Days 0 18 34Receivable Days 135 120 119
Stock Market Data:BSE Code 532380NSE Code NABSE Index 3604Avg. Daily Volume- BSE 0.003m52 Week High/Low 9/1.4
Shareholding Pattern:Promoters 52%MFs/ UTI 0%FIIs 7%Corporate Bodies 7%Indian Public 33%Others 1%
Key Data:Market Capitalization, Rsm 35Issued Shares, mn 10Price To Book- FY03F 0.5Next Result FY02-Annual
Post-Production Facility:FacilityEditing Suite Off Line/ On Line-
Preliminary/Final EditingAudio Suite Sound Mixing, Original Tracks3D Suite SGI's MAYA & 3D MAX
3D Animated CharactersPaint & Compositing FIRE/INFERNO/FLINT
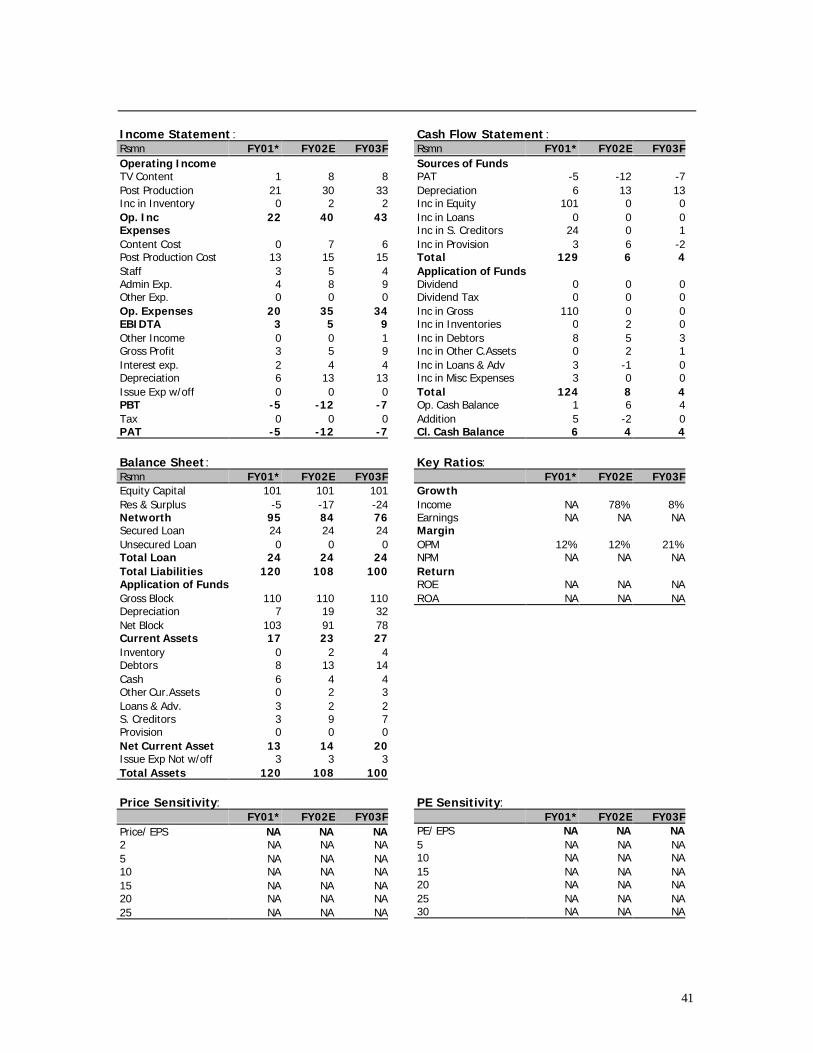
41
Income Statement :Rsmn FY01* FY02E FY03FOperating IncomeTV Content 1 8 8Post Production 21 30 33Inc in Inventory 0 2 2Op. Inc 22 40 43ExpensesContent Cost 0 7 6Post Production Cost 13 15 15Staff 3 5 4Admin Exp. 4 8 9Other Exp. 0 0 0Op. Expenses 20 35 34EBIDTA 3 5 9Other Income 0 0 1Gross Profit 3 5 9Interest exp. 2 4 4Depreciation 6 13 13Issue Exp w/off 0 0 0PBT -5 -12 -7Tax 0 0 0PAT -5 -12 -7
Balance Sheet:Rsmn FY01* FY02E FY03FEquity Capital 101 101 101Res & Surplus -5 -17 -24Networth 95 84 76Secured Loan 24 24 24Unsecured Loan 0 0 0Total Loan 24 24 24Total Liabilities 120 108 100Application of FundsGross Block 110 110 110Depreciation 7 19 32Net Block 103 91 78Current Assets 17 23 27Inventory 0 2 4Debtors 8 13 14Cash 6 4 4Other Cur.Assets 0 2 3Loans & Adv. 3 2 2S. Creditors 3 9 7Provision 0 0 0Net Current Asset 13 14 20Issue Exp Not w/off 3 3 3Total Assets 120 108 100
Price Sensitivity:FY01* FY02E FY03F
Price/ EPS NA NA NA2 NA NA NA5 NA NA NA10 NA NA NA15 NA NA NA20 NA NA NA25 NA NA NA
Cash Flow Statement :Rsmn FY01* FY02E FY03FSources of FundsPAT -5 -12 -7Depreciation 6 13 13Inc in Equity 101 0 0Inc in Loans 0 0 0Inc in S. Creditors 24 0 1Inc in Provision 3 6 -2Total 129 6 4Application of FundsDividend 0 0 0Dividend Tax 0 0 0Inc in Gross 110 0 0Inc in Inventories 0 2 0Inc in Debtors 8 5 3Inc in Other C.Assets 0 2 1Inc in Loans & Adv 3 -1 0Inc in Misc Expenses 3 0 0Total 124 8 4Op. Cash Balance 1 6 4Addition 5 -2 0Cl. Cash Balance 6 4 4
Key Ratios:FY01* FY02E FY03F
GrowthIncome NA 78% 8%Earnings NA NA NAMarginOPM 12% 12% 21%NPM NA NA NAReturnROE NA NA NAROA NA NA NA
PE Sensitivity:FY01* FY02E FY03F
PE/ EPS NA NA NA5 NA NA NA10 NA NA NA15 NA NA NA20 NA NA NA25 NA NA NA30 NA NA NA
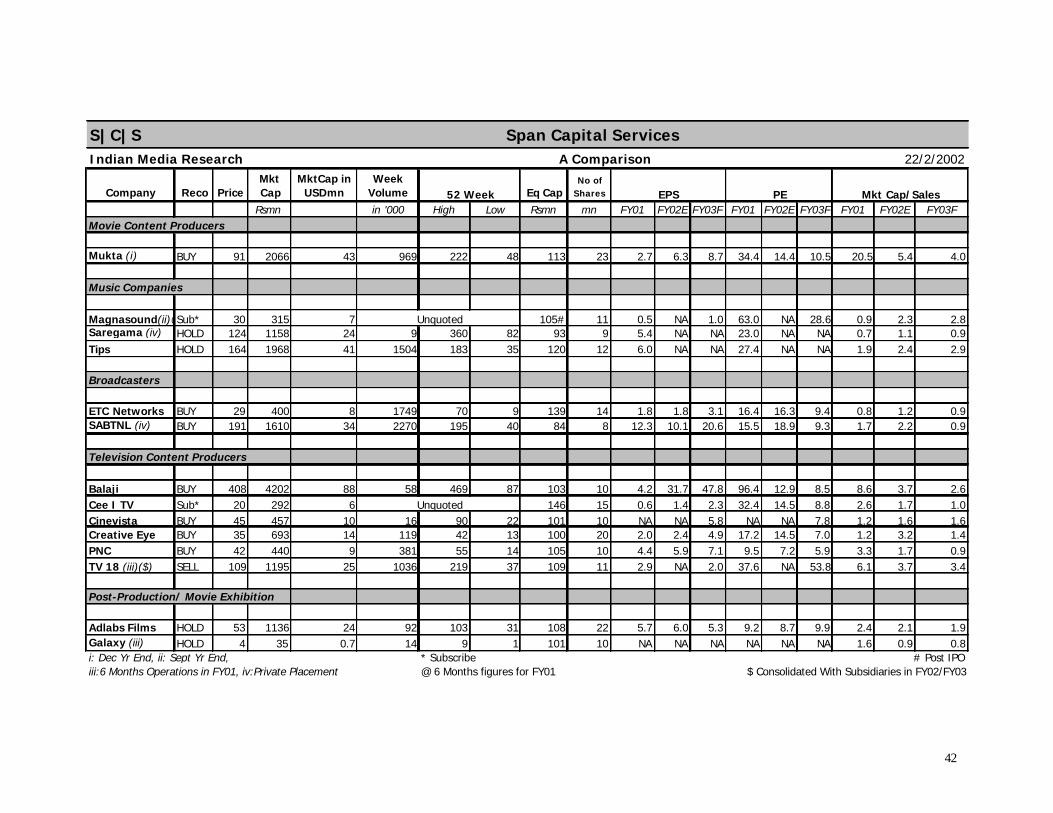
42
S|C|S Span Capital ServicesIndian Media Research A Comparison 22/2/2002
Company Reco PriceMkt Cap
MktCap in USDmn
Week Volume Eq Cap
No of Shares
Rsmn in '000 High Low Rsmn mn FY01 FY02E FY03F FY01 FY02E FY03F FY01 FY02E FY03FMovie Content Producers
Mukta (i) BUY 91 2066 43 969 222 48 113 23 2.7 6.3 8.7 34.4 14.4 10.5 20.5 5.4 4.0
Music Companies
Magnasound(ii)@Sub* 30 315 7 105# 11 0.5 NA 1.0 63.0 NA 28.6 0.9 2.3 2.8Saregama (iv) HOLD 124 1158 24 9 360 82 93 9 5.4 NA NA 23.0 NA NA 0.7 1.1 0.9Tips HOLD 164 1968 41 1504 183 35 120 12 6.0 NA NA 27.4 NA NA 1.9 2.4 2.9
Broadcasters
ETC Networks BUY 29 400 8 1749 70 9 139 14 1.8 1.8 3.1 16.4 16.3 9.4 0.8 1.2 0.9SABTNL (iv) BUY 191 1610 34 2270 195 40 84 8 12.3 10.1 20.6 15.5 18.9 9.3 1.7 2.2 0.9
Television Content Producers
Balaji BUY 408 4202 88 58 469 87 103 10 4.2 31.7 47.8 96.4 12.9 8.5 8.6 3.7 2.6Cee I TV Sub* 20 292 6 146 15 0.6 1.4 2.3 32.4 14.5 8.8 2.6 1.7 1.0Cinevista BUY 45 457 10 16 90 22 101 10 NA NA 5.8 NA NA 7.8 1.2 1.6 1.6Creative Eye BUY 35 693 14 119 42 13 100 20 2.0 2.4 4.9 17.2 14.5 7.0 1.2 3.2 1.4PNC BUY 42 440 9 381 55 14 105 10 4.4 5.9 7.1 9.5 7.2 5.9 3.3 1.7 0.9TV 18 (iii)($) SELL 109 1195 25 1036 219 37 109 11 2.9 NA 2.0 37.6 NA 53.8 6.1 3.7 3.4
Post-Production/ Movie Exhibition
Adlabs Films HOLD 53 1136 24 92 103 31 108 22 5.7 6.0 5.3 9.2 8.7 9.9 2.4 2.1 1.9Galaxy (iii) HOLD 4 35 0.7 14 9 1 101 10 NA NA NA NA NA NA 1.6 0.9 0.8i: Dec Yr End, ii: Sept Yr End, * Subscribe # Post IPOiii:6 Months Operations in FY01, iv:Private Placement @ 6 Months figures for FY01 $ Consolidated With Subsidiaries in FY02/FY03
Unquoted
Unquoted
EPS PE Mkt Cap/Sales52 Week
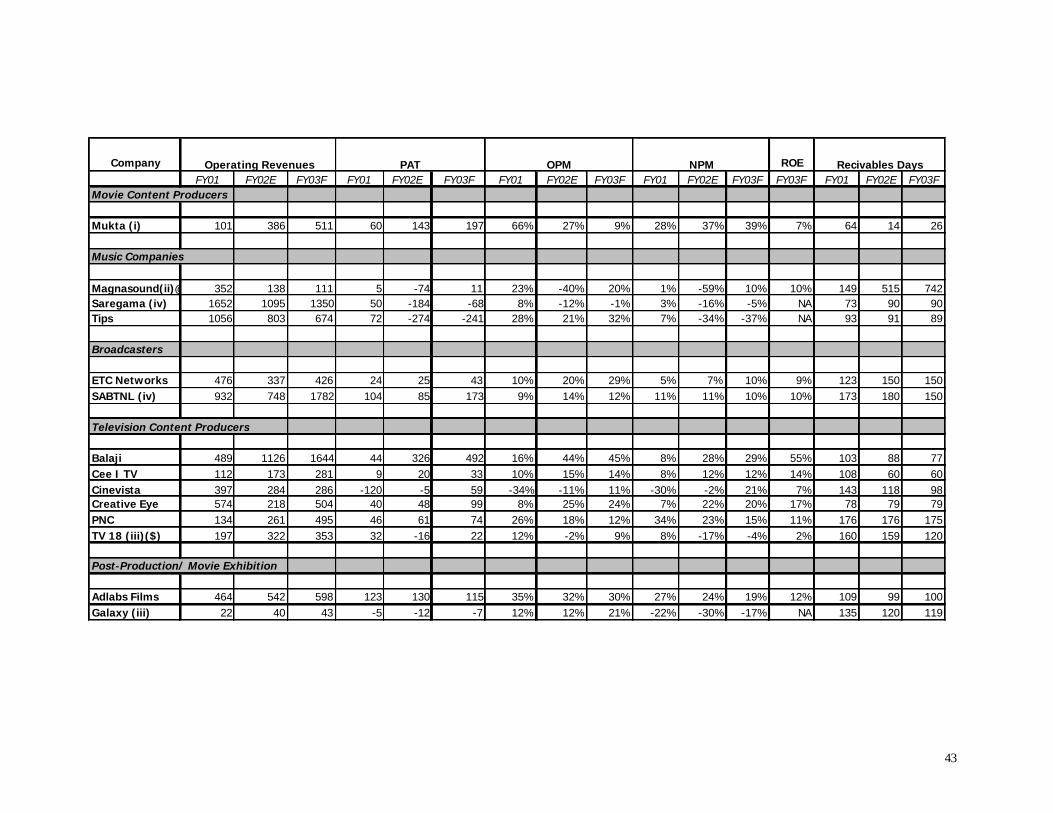
43
Company ROE
FY01 FY02E FY03F FY01 FY02E FY03F FY01 FY02E FY03F FY01 FY02E FY03F FY03F FY01 FY02E FY03FMovie Content Producers
Mukta (i) 101 386 511 60 143 197 66% 27% 9% 28% 37% 39% 7% 64 14 26
Music Companies
Magnasound(ii)@ 352 138 111 5 -74 11 23% -40% 20% 1% -59% 10% 10% 149 515 742Saregama (iv) 1652 1095 1350 50 -184 -68 8% -12% -1% 3% -16% -5% NA 73 90 90Tips 1056 803 674 72 -274 -241 28% 21% 32% 7% -34% -37% NA 93 91 89
Broadcasters
ETC Networks 476 337 426 24 25 43 10% 20% 29% 5% 7% 10% 9% 123 150 150SABTNL (iv) 932 748 1782 104 85 173 9% 14% 12% 11% 11% 10% 10% 173 180 150
Television Content Producers
Balaji 489 1126 1644 44 326 492 16% 44% 45% 8% 28% 29% 55% 103 88 77Cee I TV 112 173 281 9 20 33 10% 15% 14% 8% 12% 12% 14% 108 60 60Cinevista 397 284 286 -120 -5 59 -34% -11% 11% -30% -2% 21% 7% 143 118 98Creative Eye 574 218 504 40 48 99 8% 25% 24% 7% 22% 20% 17% 78 79 79PNC 134 261 495 46 61 74 26% 18% 12% 34% 23% 15% 11% 176 176 175TV 18 (iii)($) 197 322 353 32 -16 22 12% -2% 9% 8% -17% -4% 2% 160 159 120
Post-Production/ Movie Exhibition
Adlabs Films 464 542 598 123 130 115 35% 32% 30% 27% 24% 19% 12% 109 99 100Galaxy (iii) 22 40 43 -5 -12 -7 12% 12% 21% -22% -30% -17% NA 135 120 119
Recivables DaysOperating Revenues PAT OPM NPM
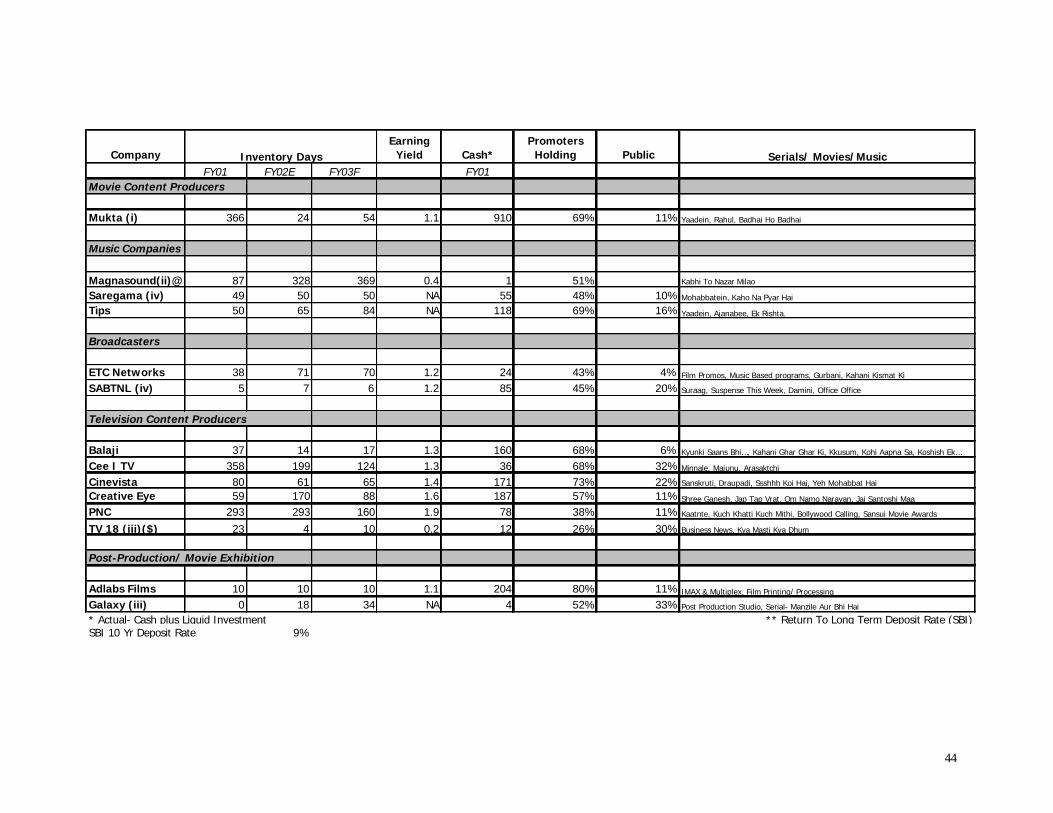
44
CompanyEarning
Yield Cash*Promoters
Holding Public
FY01 FY02E FY03F FY01Movie Content Producers
Mukta (i) 366 24 54 1.1 910 69% 11%
Music Companies
Magnasound(ii)@ 87 328 369 0.4 1 51%Saregama (iv) 49 50 50 NA 55 48% 10%Tips 50 65 84 NA 118 69% 16%
Broadcasters
ETC Networks 38 71 70 1.2 24 43% 4%SABTNL (iv) 5 7 6 1.2 85 45% 20%
Television Content Producers
Balaji 37 14 17 1.3 160 68% 6%Cee I TV 358 199 124 1.3 36 68% 32%Cinevista 80 61 65 1.4 171 73% 22%Creative Eye 59 170 88 1.6 187 57% 11%PNC 293 293 160 1.9 78 38% 11%
TV 18 (iii)($) 23 4 10 0.2 12 26% 30%
Post-Production/ Movie Exhibition
Adlabs Films 10 10 10 1.1 204 80% 11%Galaxy (iii) 0 18 34 NA 4 52% 33%* Actual- Cash plus Liquid Investment ** Return To Long Term Deposit Rate (SBI)SBI 10 Yr Deposit Rate 9%
Business News, Kya Masti Kya Dhum
Post Production Studio, Serial- Manzile Aur Bhi Hai
IMAX & Multiplex, Film Printing/ Processing
Yaadein, Ajanabee, Ek Rishta.
Kaatnte, Kuch Khatti Kuch Mithi, Bollywood Calling, Sansui Movie Awards
Mohabbatein, Kaho Na Pyar Hai
Kabhi To Nazar Milao
Sanskruti, Draupadi, Ssshhh Koi Hai, Yeh Mohabbat Hai
Shree Ganesh, Jap Tap Vrat, Om Namo Narayan, Jai Santoshi Maa
Suraag, Suspense This Week, Damini, Office Office
Film Promos, Music Based programs, Gurbani, Kahani Kismat Ki
Kyunki Saans Bhi…, Kahani Ghar Ghar Ki, Kkusum, Kohi Aapna Sa, Koshish Ek…
Minnale, Majunu, Arasaktchi
Serials/ Movies/MusicInventory Days
Yaadein, Rahul, Badhai Ho Badhai
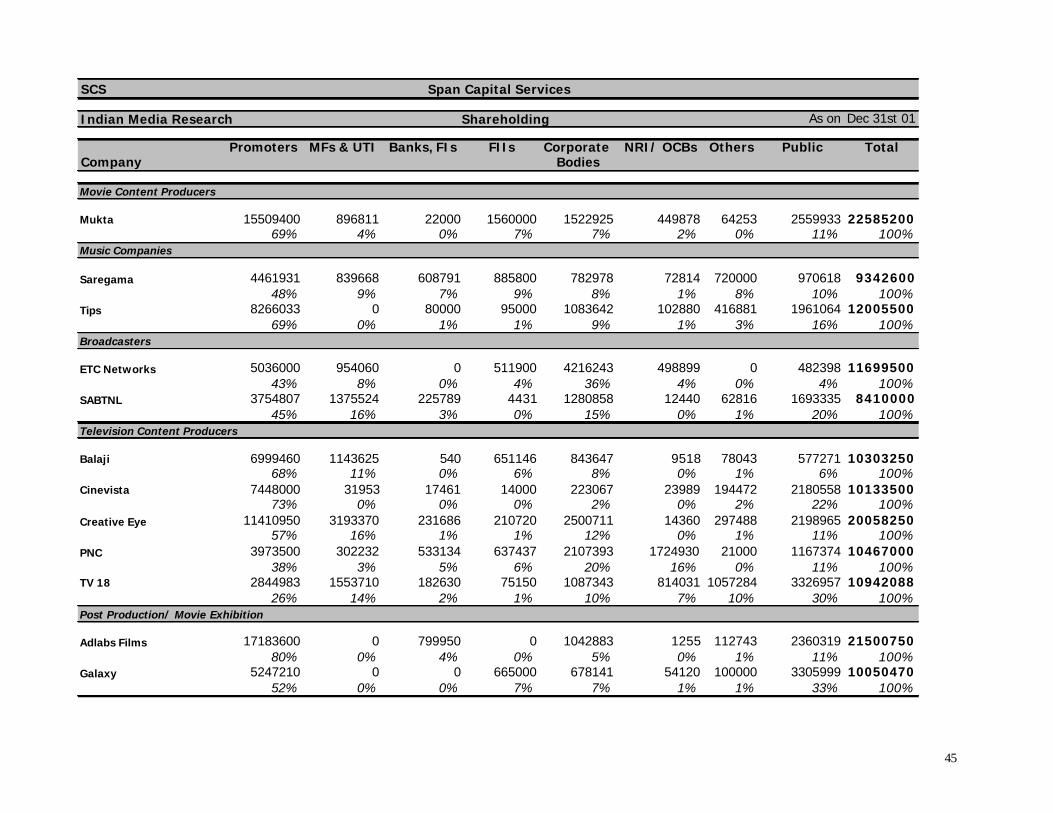
45
SCS Span Capital Services
Indian Media Research Shareholding As on Dec 31st 01
Promoters MFs & UTI Banks, FIs FIIs Corporate NRI/ OCBs Others Public TotalCompany Bodies
Movie Content Producers
Mukta 15509400 896811 22000 1560000 1522925 449878 64253 2559933 2258520069% 4% 0% 7% 7% 2% 0% 11% 100%
Music Companies
Saregama 4461931 839668 608791 885800 782978 72814 720000 970618 934260048% 9% 7% 9% 8% 1% 8% 10% 100%
Tips 8266033 0 80000 95000 1083642 102880 416881 1961064 1200550069% 0% 1% 1% 9% 1% 3% 16% 100%
Broadcasters
ETC Networks 5036000 954060 0 511900 4216243 498899 0 482398 1169950043% 8% 0% 4% 36% 4% 0% 4% 100%
SABTNL 3754807 1375524 225789 4431 1280858 12440 62816 1693335 841000045% 16% 3% 0% 15% 0% 1% 20% 100%
Television Content Producers
Balaji 6999460 1143625 540 651146 843647 9518 78043 577271 1030325068% 11% 0% 6% 8% 0% 1% 6% 100%
Cinevista 7448000 31953 17461 14000 223067 23989 194472 2180558 1013350073% 0% 0% 0% 2% 0% 2% 22% 100%
Creative Eye 11410950 3193370 231686 210720 2500711 14360 297488 2198965 2005825057% 16% 1% 1% 12% 0% 1% 11% 100%
PNC 3973500 302232 533134 637437 2107393 1724930 21000 1167374 1046700038% 3% 5% 6% 20% 16% 0% 11% 100%
TV 18 2844983 1553710 182630 75150 1087343 814031 1057284 3326957 1094208826% 14% 2% 1% 10% 7% 10% 30% 100%
Post Production/ Movie Exhibition
Adlabs Films 17183600 0 799950 0 1042883 1255 112743 2360319 2150075080% 0% 4% 0% 5% 0% 1% 11% 100%
Galaxy 5247210 0 0 665000 678141 54120 100000 3305999 1005047052% 0% 0% 7% 7% 1% 1% 33% 100%