1
Corporatization, Conservation, and Corn Shifting patterns of agricultural subsidies in the Southern Great Plains Austin Boardman 1 , Jacqueline M. Vadjunec 1 , and Todd Fagin 2 1 Department of Geography, Oklahoma State University, Stillwater, OK; 2 Oklahoma Biosurvey, University of Oklahoma, Norman, OK INTRODUCTION A semi-arid climate and cyclical drought present challenges to farmers and ranchers in the Southern Great Plains (SGP). To increase resilience, the federal government provides subsidies to agriculturalists for growing certain commodities (e.g. wheat and corn), aiding in the implementation of technologies such as center pivot irrigation (CPI) through the Environmental Quality Incentives Program (EQIP), preserving land through the Conservation Reserve Program (CRP), and in response to natural disasters such as drought. Historically, the region endured the 1930s Dust Bowl and has subsequently faced periodic drought conditions. These patterns have continued to the present, with a drought since 2000 more severe than the Dust Bowl era, and especially low precipitation from 2011-2015 (U.S. Drought Monitor 2018). Since the mid-1900s, agriculture in the United States has shifted from family farms to corporate operations, raising concerns about the sustainability and ethics of “factory farm” practices (Ikerd 2008, Vadjunec et al. 2016). Despite this, the consequences of agricultural corporatization are largely unstudied, particularly in regard to the roles of subsidy dispersal, land and water conservation, and vulnerability to disaster. Boardman et al. (2017) found a 24-fold increase in corporate landownership in Cimarron County, OK between 1954 and 2014. Additionally, household surveys conducted by Vadjunec et al. (2016) in our study area suggest that family farms may struggle to compete with agribusiness in obtaining land, and that there may be regional differences in the extent of corporate encroachment. As an added complexity, many agriculturalists in our study area frequently operate lands both in their home counties and out-of-state, due to challenges in acquiring land, and as a strategy for risk mitigation (Vadjunec et al. 2018). While cattle ranching and wheat and sorghum cultivation have long been the primary sources of income, corn is an increasingly popular cash crop, given the recent boost in prices (see Fig. 1). The increasing corporatization of agriculture raises questions regarding who is receiving the greatest benefit from agricultural subsidies. Here, we seek to answer three primary questions: 1) How have the different types, rates, and amounts of subsidies (commodity, conservation, disaster, etc.) changed over the past two decades, and why? 2) Has there been an increase in the share of subsidies paid to corporations and/or out-of-county/state agriculturalists? 3) How have subsidies (such as EQIP) impacted the growth or contraction of CPI in the region? METHODS We selected a four-county/four-state study area (Fig. 2), which serves as a natural laboratory for examining how policy differences lead to different outcomes for farmers. Within our temporal frame of the past two decades, we collected the following data to triangulate patterns of change: Web scraping: We employed the ‘rvest’ package (Wickham 2016) in R to download subsidy recipients’ names and dollar amounts for 1995-2016. Data were obtained from the non-profit Environmental Working Group (EWG) Farm Subsidy Database (2016). In total, we collected 902,664 subsidy records. Geolocation: We used the ‘noncensus’ package (Ramey 2014) in R to merge subsidy recipients’ hometowns with their county and state to examine the extent of out-of-county/state operators. Key informant interviews: We conducted semi-structured interviews with landowners, government officials, and other stakeholders in our study area. CPI digitizing: We obtained Landsat imagery (USGS 2015) for our study area for summer months in 1995, 2005, and 2015. We digitized farmland under center pivot irrigation and calculated changes in CPI acreage in each county (methods adapted from Wenger et al. 2017). DISCUSSION & CONCLUSION SCOPE & LIMITATIONS ACKNOWLEDGEMENTS LITERATURE CITED Fig. 2 Our study area includes Las Animas County, CO, Union County, NM, Cimarron County, OK, and Dallam County, TX. 1) Conservation subsidies have decreased over time, while disaster subsidies have increased, especially during drought. Subsidies for land and water conservation were reduced by $165,000 per year, on average, during our study period. Commodity subsidies varied greatly over time, but ultimately decreased (β = $1.4 million/year). Meanwhile, disaster payments increased, becoming one of the most costly subsidy types during the region’s most recent drought (2011-2015). Fig. 3 Subsidies paid to all operators within our study area (n=902,664 payments). Source: EWG (2016). 2a) The proportion of corporate subsidies has doubled over the past two decades. Corporate recipients were paid just 22% of total agricultural subsidies in 1995. By 2016, this proportion increased to nearly half of all payments. The proportion of corporate subsidies during the second half of our study period was 9% greater than the first half (t= -3.129, p=.007). While the corporate proportion of all subsidy types increased, commodity subsidies were the largest driver. 62% of all direct payments for corn were paid to corporations. Dallam County, TX, had the greatest proportion of corporate subsidies, with 47% of payments going to agribusiness (ANOVA F= 79.28, p<.0001). Union County, NM was next (40%), followed by Cimarron County, OK (20%), and Las Animas County, CO (16%). Fig. 4 Corporate status of subsidy recipients in our study area (n=7,164 recipients). Source: EWG (2016). 2b) The percent of out-of-state recipients held steady, but Union County’s out-of- state payments were notably high. Many agriculturalists in our study area operate farms and ranches in several states, but reside in only one. For Dallam County, TX, and Las Animas County, CO, only about 10-20% of subsidy dollars for farms and ranches in those counties were paid to operators living in a different state. For Union County, NM, however, we observed up to 72% of subsidy dollars being paid to out-of- state operators. Although we expected out-of-state payments to increase over time in complement with corporatization, we did not observe such a pattern. Additionally, these trends were generally reflected when examining out-of- county operators. Fig. 5 Many subsidy recipients in our study area received payments for land operated in a different state than their residence (n=7,164 recipients). Source: EWG (2016). 3) CPI increased by 58%, with EQIP paid to both corporate and independent farms. Center Pivot Irrigation As of 1995 As of 2005 As of 2015 Ogallala Aquifer Á Union County, NM Cimarron County, OK Dallam County, TX L 0 0 20 Kilometers 20 Miles Fig. 6 Time series of digitized center pivot irrigation from Landsat imagery. Las Animas County, CO practices mainly floodplain and piped irrigation, and therefore had not installed any CPI as of 2015. Sources: USGS 2015 (Landsat imagery), Qi 2009 (Aquifer extent). Although the EQIP did not subsidize irrigation until the Ground and Surface Water Conservation (GSWC) prgram began in 2002, CPI was thoroughly established in our study area across the Ogallala Aquifer in 1995. Despite this, irrigated acres continued to expand throughout three counties in our study area. Notably, the only CPI installations outside the aquifer were installed in Union County, NM after 1995, suggesting that landowners may take additional risks when given subsidies. Overall, Dallam County, TX led in CPI expansion, installing 553 new pivots, resulting in 28% of all the county’s land under CPI. Cimarron and Union Counties increased their CPI by 246 and 141 installations, respectively. EQIP payments are the likely source of many recent CPI development projects. Dallam County, TX, and Cimarron County, OK each received 36% of the overall GSWC subsidies in the study area. Overall, 32% of EQIP GSWC payments were paid to corporations, which is consistent with other subsidy types. RESULTS Complex interactions of agricultural corporatization, subsidies, and technology have resulted in trends that may not be sustainable for the long-term viability of agriculture in the Southern Great Plains. Alarmingly, conservation subsidies have decreased over the past two decades (Fig 3). CRP, in which agriculturalists are compensated for taking cropland out of production, is a primary component of this trend. Our key informant interviews suggest that many farmers are self-selecting out of the CRP program, since high corn prices appear to have incentivized producers to convert CRP lands into cultivated land for lucrative corn production. With the eminent threat of global environmental change, disaster payments have helped agriculturalists recover from challenging environmental conditions. One of the most popular programs, according to our key informant interviews, was the Livestock Forage Program, which compensated ranchers for grazing losses during the drought (a primary reason for the large spike in 2014). While we expected the corporate share of subsidies to increase as agribusiness expands and local producers create their own businesses to reduce liability, the rate of increase was greater than expected (Fig 4). While Boardman et al. (2017) found a 67% increase in corporate acreage in Cimarron County from 1998-2014, the proportion of corporate subsidies in our study area doubled over roughly the same time. This finding suggests that corporations may be more adept at securing federal payments than individuals. Questioning the region’s sustainability, CPI increased by 58% in just 20 years. Farmers value the technology, which increases yields for crops such as corn that would not normally grow in the semi-arid climate. However, with the Ogallala Aquifer rapidly depleting, EQIP subsidies that were marketed as water conservation incentives appear to have the opposite effect. Although EQIP subsidies were not disproportionately paid to corporations, Boardman et al. (2017) showed that corporations aggressively adopted CPI in the 1980s. Those investments seem to have paid off, with 62% of corn subsidies being paid to agribusiness. Boardman, Austin, Brian Birchler, Todd Fagin, Peter Kedron, Michael Larson, and Jacqueline M. Vadjunec. ”Surviving ‘No Man’s Land’: Using Historical Geographic Information Systems (HGIS) to explore family history, resource access, and land-use/land-cover change in Cimarron County, Oklahoma. Poster Presentation. (2017). Annual Meeting of the American Association of Geographers. Boston, Massachusetts. Environmental Working Group, “Farm Subsidy Database.” (2016). https://farm.ewg.org Accessed 1/25/18-4/1/18. Ikerd, J. E. (2008). Crisis and opportunity: Sustainability in American agriculture. University of Nebraska Press. Qi, Sharon L. Digital map of aquifer boundary for the High Plains aquifer in parts of Colorado, Kansas, Nebraska, New Mexico, Oklahoma, South Dakota, Texas, and Wyoming (2009). United States Geological Survey. Ramey, John A. noncensus: U.S. Census Regional and Demographic Data. (2014). R package version 0.1. https://CRAN.R- project.org/package=noncensus U.S. Drought Monitor (2018). National Drought Mitigation Center (NDMC), the U.S. Department of Agriculture (USDA) and the National Oceanic and Atmospheric Association. http://droughtmonitor.unl.edu. Accessed 4/4/18. USGS (2015). Landsat 7 ETM+ C1 Level 1. USGS Earth Resources Observation and Science (EROS) Center. Vadjunec, J. M., Radel, C., & Turner II, B. L. (2016). Introduction: The continued importance of smallholders today. Land, 5(4), 1-12. Vadjunec, J. M., Frazier, A. E., Kedron, P., Fagin, T., & Zhao, Y. (2018). A Land Systems Science Framework for Bridging Land System Architecture and Landscape Ecology: A Case Study from the Southern High Plains. Land, 7(1), 27. Wenger, K., Vadjunec, J. M., & Fagin, T. (2017). Groundwater Governance and the Growth of Center Pivot Irrigation in Cimarron County, OK and Union County, NM: Implications for Community Vulnerability to Drought. Water, 9(1), 39. Wickham, Hadley. rvest: Easily Harvest (Scrape) Web Pages. (2016). R package version 0.3.2. https://CRAN.R-project. org/package=rvest. We thank our research participants in the Southern Great Plains, including a variety of community leaders, government officials, and landowners. Thank you to Michael Larson for poster printing. This research has been funded by a National Science Foundation (NSF) research grant (#CMMI-1266381: Vadjunec, Phillips, & Fagin). Any opinions, findings, and conclusions or recommendations expressed here are those of the authors and do not necessarily reflect the views of our funders. This investigation focused primarily on subsidy data obtained and organized by EWG, which is not likely to be a comprehensive ledger of all types of farm payments. However, we believe the subsidy data collected for this poster to be reflective of the greater trends occurring in our study area. Additionally, while web scraping large datasets presents challenges in validating the accuracy and completeness of the data, we implemented intensive quality assurance measures to identify and correct any potential errors. We delineated independent vs. corporate recipients based on whether EWG listed multiple ownership shares for the entity. While some of the “corporations” in our investigation may have been small mom-and-pop LLCs established to mitigate risk, the trend of agribusiness encroachment is well-documented in our study area. Fig. 7 Center pivot irrigation (CPI) is subsidized by USDA’s Environmental Quality Incentives Program (EQIP). The technology wastes less water than other irrigation methods, but its mass adoption has resulted in rapid drawdown of the Ogallala Aquifer. Fig. 1 Corn prices increased dramatically from the late 1990s to 2013. Source: USDA National Agricultural Statistics Service (2018). Union County Las Animas County Cimarron County Dallam County

Corporatization, Conservation, and Corn DISCUSSION

  • Upload
    others

  • View
    2

  • Download
    0

Embed Size (px)

Citation preview

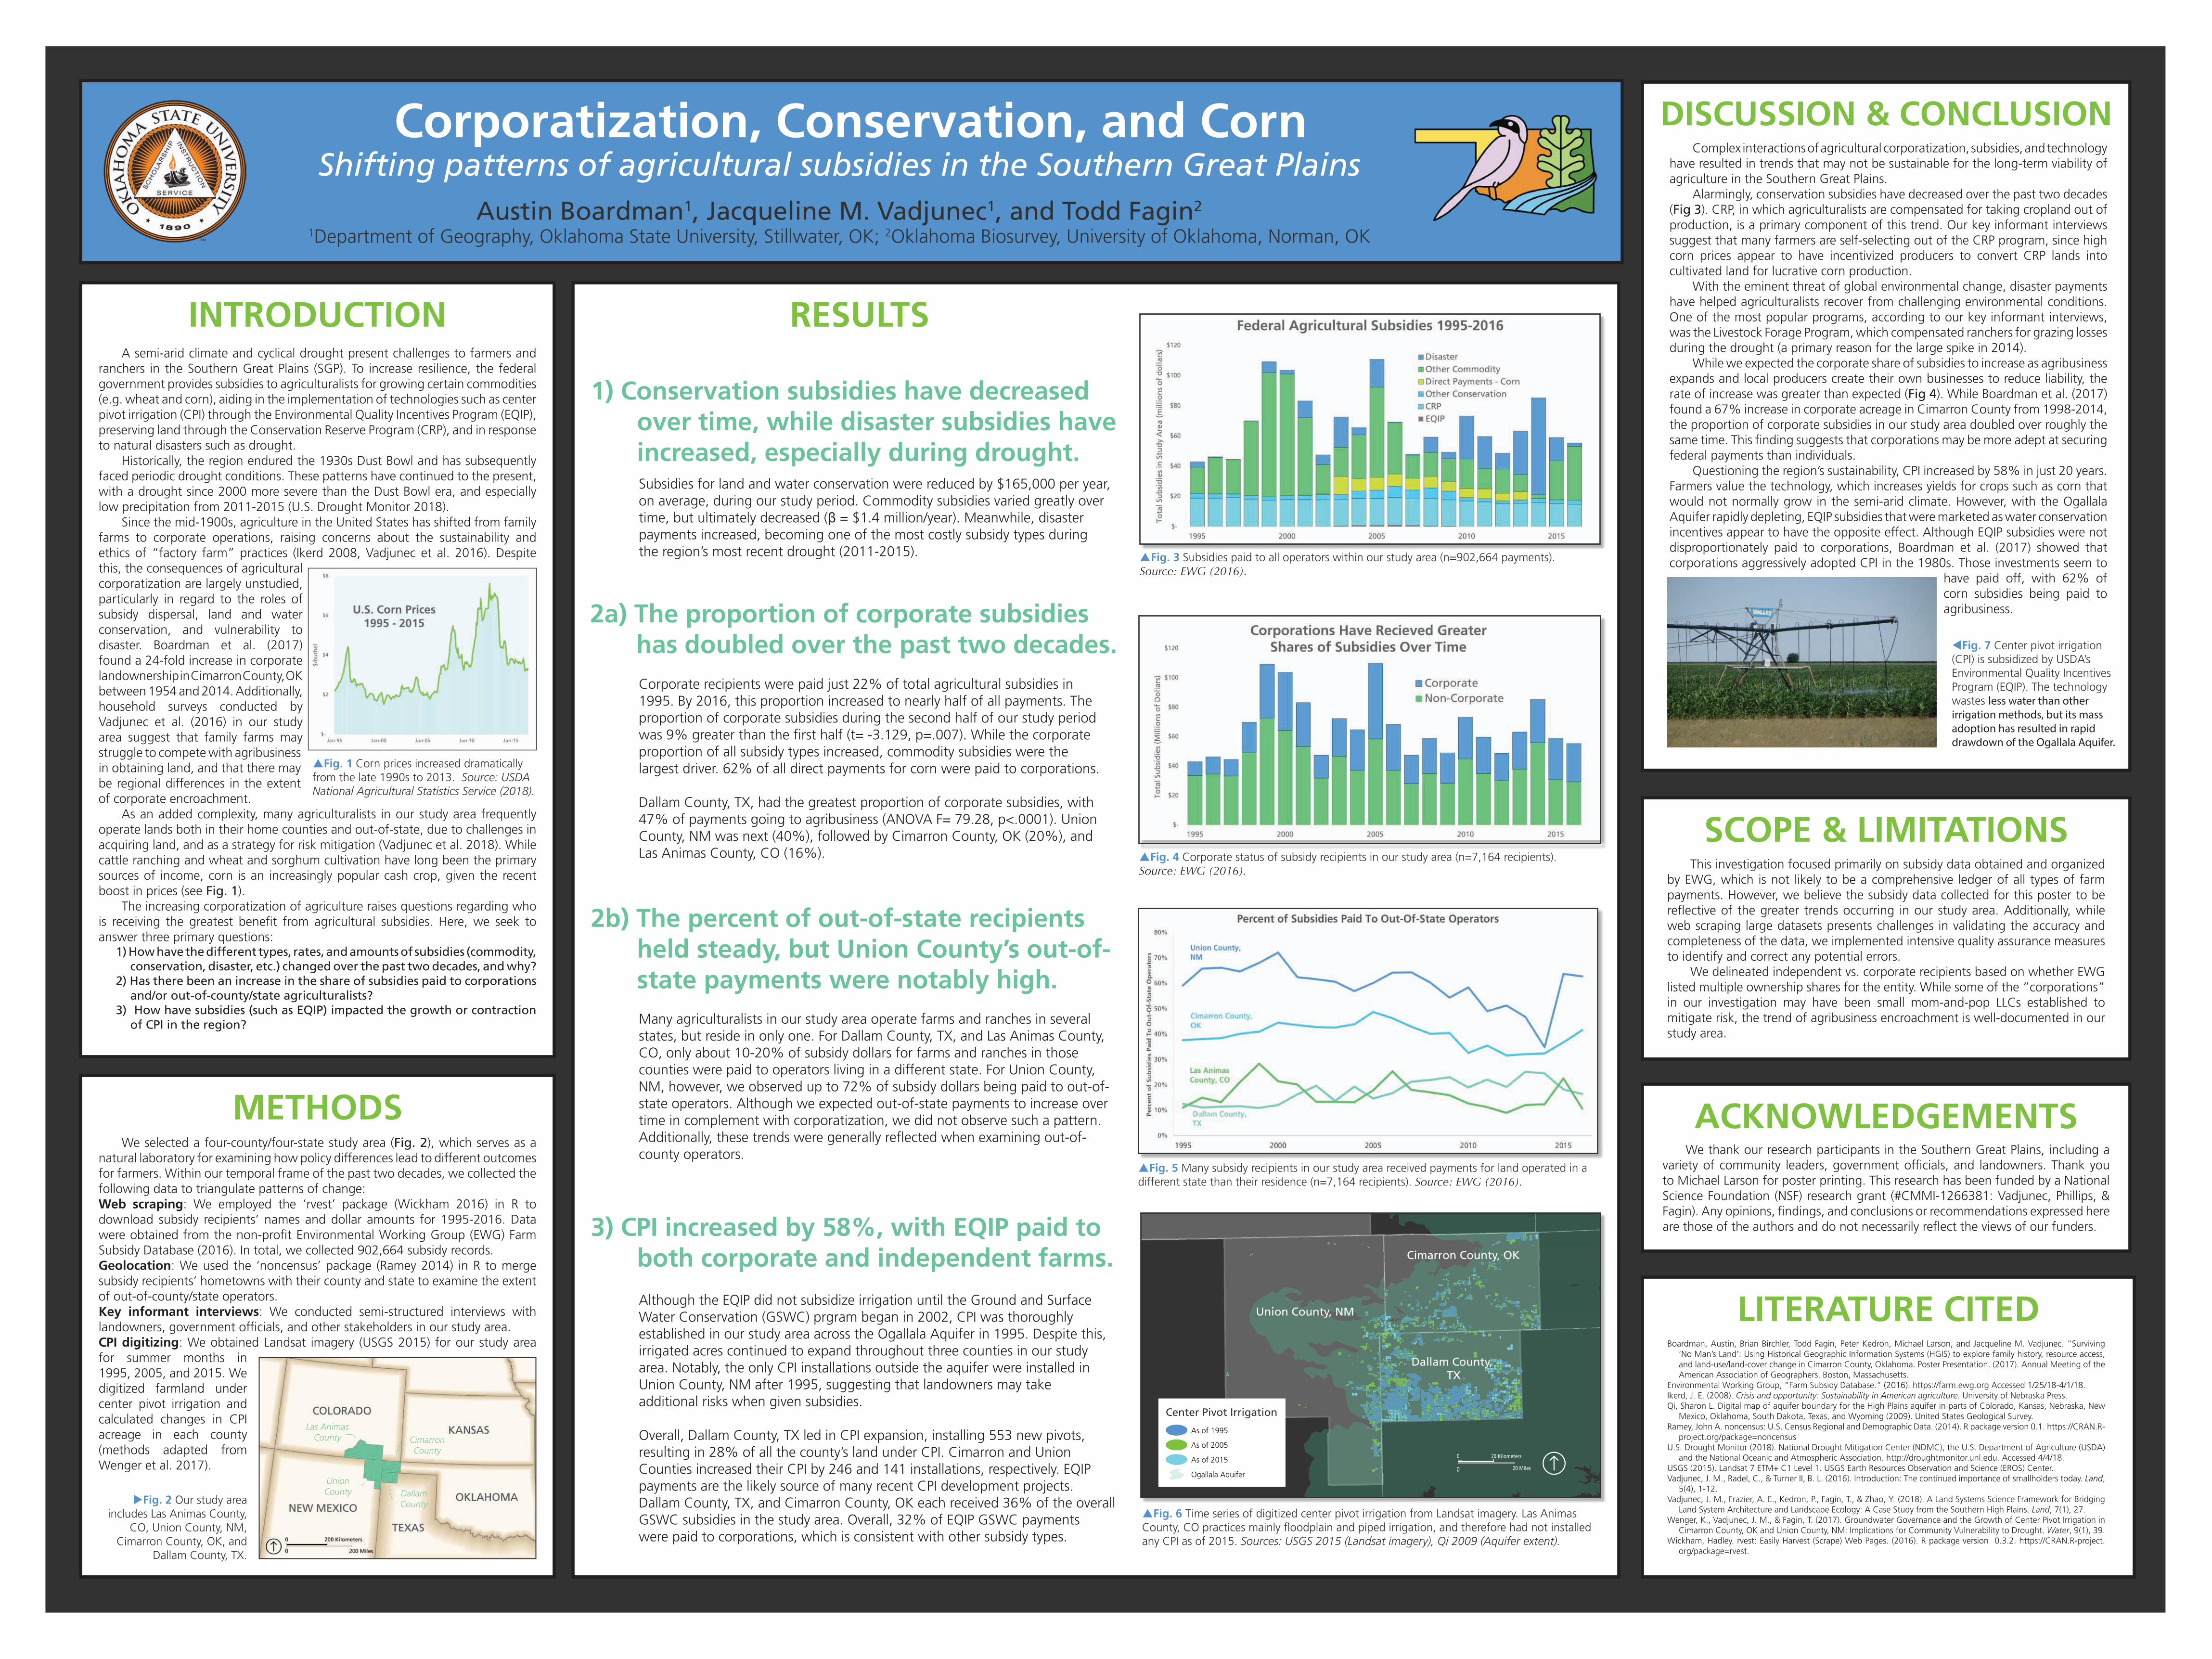
Corporatization, Conservation, and CornShifting patterns of agricultural subsidies in the Southern Great Plains

Austin Boardman1, Jacqueline M. Vadjunec1, and Todd Fagin2

1Department of Geography, Oklahoma State University, Stillwater, OK; 2Oklahoma Biosurvey, University of Oklahoma, Norman, OK

INTRODUCTION A semi-arid climate and cyclical drought present challenges to farmers and ranchers in the Southern Great Plains (SGP). To increase resilience, the federal government provides subsidies to agriculturalists for growing certain commodities (e.g. wheat and corn), aiding in the implementation of technologies such as center pivot irrigation (CPI) through the Environmental Quality Incentives Program (EQIP), preserving land through the Conservation Reserve Program (CRP), and in response to natural disasters such as drought. Historically, the region endured the 1930s Dust Bowl and has subsequently faced periodic drought conditions. These patterns have continued to the present, with a drought since 2000 more severe than the Dust Bowl era, and especially low precipitation from 2011-2015 (U.S. Drought Monitor 2018). Since the mid-1900s, agriculture in the United States has shifted from family farms to corporate operations, raising concerns about the sustainability and ethics of “factory farm” practices (Ikerd 2008, Vadjunec et al. 2016). Despite this, the consequences of agricultural corporatization are largely unstudied, particularly in regard to the roles of subsidy dispersal, land and water conservation, and vulnerability to disaster. Boardman et al. (2017) found a 24-fold increase in corporate landownership in Cimarron County, OK between 1954 and 2014. Additionally, household surveys conducted by Vadjunec et al. (2016) in our study area suggest that family farms may struggle to compete with agribusiness in obtaining land, and that there may be regional differences in the extent of corporate encroachment. As an added complexity, many agriculturalists in our study area frequently operate lands both in their home counties and out-of-state, due to challenges in acquiring land, and as a strategy for risk mitigation (Vadjunec et al. 2018). While cattle ranching and wheat and sorghum cultivation have long been the primary sources of income, corn is an increasingly popular cash crop, given the recent boost in prices (see Fig. 1). The increasing corporatization of agriculture raises questions regarding who is receiving the greatest benefit from agricultural subsidies. Here, we seek to answer three primary questions:

1) How have the different types, rates, and amounts of subsidies (commodity, conservation, disaster, etc.) changed over the past two decades, and why?

2) Has there been an increase in the share of subsidies paid to corporations and/or out-of-county/state agriculturalists?

3) How have subsidies (such as EQIP) impacted the growth or contraction of CPI in the region?

METHODS We selected a four-county/four-state study area (Fig. 2), which serves as a natural laboratory for examining how policy differences lead to different outcomes for farmers. Within our temporal frame of the past two decades, we collected the following data to triangulate patterns of change:Web scraping: We employed the ‘rvest’ package (Wickham 2016) in R to download subsidy recipients’ names and dollar amounts for 1995-2016. Data were obtained from the non-profit Environmental Working Group (EWG) Farm Subsidy Database (2016). In total, we collected 902,664 subsidy records.Geolocation: We used the ‘noncensus’ package (Ramey 2014) in R to merge subsidy recipients’ hometowns with their county and state to examine the extent of out-of-county/state operators.Key informant interviews: We conducted semi-structured interviews with landowners, government officials, and other stakeholders in our study area.CPI digitizing: We obtained Landsat imagery (USGS 2015) for our study area for summer months in 1995, 2005, and 2015. We digitized farmland under center pivot irrigation and calculated changes in CPI acreage in each county (methods adapted from Wenger et al. 2017).

DISCUSSION & CONCLUSION

SCOPE & LIMITATIONS

ACKNOWLEDGEMENTS

LITERATURE CITED

Fig. 2 Our study area includes Las Animas County,

CO, Union County, NM, Cimarron County, OK, and

Dallam County, TX.

1) Conservation subsidies have decreased over time, while disaster subsidies have increased, especially during drought.Subsidies for land and water conservation were reduced by $165,000 per year, on average, during our study period. Commodity subsidies varied greatly over time, but ultimately decreased (β = $1.4 million/year). Meanwhile, disaster payments increased, becoming one of the most costly subsidy types during the region’s most recent drought (2011-2015). Fig. 3 Subsidies paid to all operators within our study area (n=902,664 payments).

Source: EWG (2016).

2a) The proportion of corporate subsidies has doubled over the past two decades.Corporate recipients were paid just 22% of total agricultural subsidies in 1995. By 2016, this proportion increased to nearly half of all payments. The proportion of corporate subsidies during the second half of our study period was 9% greater than the first half (t= -3.129, p=.007). While the corporate proportion of all subsidy types increased, commodity subsidies were the largest driver. 62% of all direct payments for corn were paid to corporations.

Dallam County, TX, had the greatest proportion of corporate subsidies, with 47% of payments going to agribusiness (ANOVA F= 79.28, p<.0001). Union County, NM was next (40%), followed by Cimarron County, OK (20%), and Las Animas County, CO (16%). Fig. 4 Corporate status of subsidy recipients in our study area (n=7,164 recipients).

Source: EWG (2016).

2b) The percent of out-of-state recipients held steady, but Union County’s out-of-state payments were notably high.Many agriculturalists in our study area operate farms and ranches in several states, but reside in only one. For Dallam County, TX, and Las Animas County, CO, only about 10-20% of subsidy dollars for farms and ranches in those counties were paid to operators living in a different state. For Union County, NM, however, we observed up to 72% of subsidy dollars being paid to out-of-state operators. Although we expected out-of-state payments to increase over time in complement with corporatization, we did not observe such a pattern. Additionally, these trends were generally reflected when examining out-of-county operators.

Fig. 5 Many subsidy recipients in our study area received payments for land operated in a different state than their residence (n=7,164 recipients). Source: EWG (2016).

3) CPI increased by 58%, with EQIP paid to both corporate and independent farms.

Center Pivot Irrigation

As of 1995

As of 2005

As of 2015

Ogallala Aquifer Á

0 10 20Miles

Union County, NM

Cimarron County, OK

Dallam County, TX

L0

0

20 Kilometers

20 Miles

Fig. 6 Time series of digitized center pivot irrigation from Landsat imagery. Las Animas County, CO practices mainly floodplain and piped irrigation, and therefore had not installed any CPI as of 2015. Sources: USGS 2015 (Landsat imagery), Qi 2009 (Aquifer extent).

Although the EQIP did not subsidize irrigation until the Ground and Surface Water Conservation (GSWC) prgram began in 2002, CPI was thoroughly established in our study area across the Ogallala Aquifer in 1995. Despite this, irrigated acres continued to expand throughout three counties in our study area. Notably, the only CPI installations outside the aquifer were installed in Union County, NM after 1995, suggesting that landowners may take additional risks when given subsidies. Overall, Dallam County, TX led in CPI expansion, installing 553 new pivots, resulting in 28% of all the county’s land under CPI. Cimarron and Union Counties increased their CPI by 246 and 141 installations, respectively. EQIP payments are the likely source of many recent CPI development projects. Dallam County, TX, and Cimarron County, OK each received 36% of the overall GSWC subsidies in the study area. Overall, 32% of EQIP GSWC payments were paid to corporations, which is consistent with other subsidy types.

RESULTS

Complex interactions of agricultural corporatization, subsidies, and technology have resulted in trends that may not be sustainable for the long-term viability of agriculture in the Southern Great Plains. Alarmingly, conservation subsidies have decreased over the past two decades (Fig 3). CRP, in which agriculturalists are compensated for taking cropland out of production, is a primary component of this trend. Our key informant interviews suggest that many farmers are self-selecting out of the CRP program, since high corn prices appear to have incentivized producers to convert CRP lands into cultivated land for lucrative corn production. With the eminent threat of global environmental change, disaster payments have helped agriculturalists recover from challenging environmental conditions. One of the most popular programs, according to our key informant interviews, was the Livestock Forage Program, which compensated ranchers for grazing losses during the drought (a primary reason for the large spike in 2014). While we expected the corporate share of subsidies to increase as agribusiness expands and local producers create their own businesses to reduce liability, the rate of increase was greater than expected (Fig 4). While Boardman et al. (2017) found a 67% increase in corporate acreage in Cimarron County from 1998-2014, the proportion of corporate subsidies in our study area doubled over roughly the same time. This finding suggests that corporations may be more adept at securing federal payments than individuals. Questioning the region’s sustainability, CPI increased by 58% in just 20 years. Farmers value the technology, which increases yields for crops such as corn that would not normally grow in the semi-arid climate. However, with the Ogallala Aquifer rapidly depleting, EQIP subsidies that were marketed as water conservation incentives appear to have the opposite effect. Although EQIP subsidies were not disproportionately paid to corporations, Boardman et al. (2017) showed that corporations aggressively adopted CPI in the 1980s. Those investments seem to

have paid off, with 62% of corn subsidies being paid to agribusiness.

Boardman, Austin, Brian Birchler, Todd Fagin, Peter Kedron, Michael Larson, and Jacqueline M. Vadjunec. ”Surviving ‘No Man’s Land’: Using Historical Geographic Information Systems (HGIS) to explore family history, resource access, and land-use/land-cover change in Cimarron County, Oklahoma. Poster Presentation. (2017). Annual Meeting of the American Association of Geographers. Boston, Massachusetts.

Environmental Working Group, “Farm Subsidy Database.” (2016). https://farm.ewg.org Accessed 1/25/18-4/1/18.Ikerd, J. E. (2008). Crisis and opportunity: Sustainability in American agriculture. University of Nebraska Press.Qi, Sharon L. Digital map of aquifer boundary for the High Plains aquifer in parts of Colorado, Kansas, Nebraska, New

Mexico, Oklahoma, South Dakota, Texas, and Wyoming (2009). United States Geological Survey.Ramey, John A. noncensus: U.S. Census Regional and Demographic Data. (2014). R package version 0.1. https://CRAN.R-

project.org/package=noncensusU.S. Drought Monitor (2018). National Drought Mitigation Center (NDMC), the U.S. Department of Agriculture (USDA)

and the National Oceanic and Atmospheric Association. http://droughtmonitor.unl.edu. Accessed 4/4/18.USGS (2015). Landsat 7 ETM+ C1 Level 1. USGS Earth Resources Observation and Science (EROS) Center.Vadjunec, J. M., Radel, C., & Turner II, B. L. (2016). Introduction: The continued importance of smallholders today. Land,

5(4), 1-12.Vadjunec, J. M., Frazier, A. E., Kedron, P., Fagin, T., & Zhao, Y. (2018). A Land Systems Science Framework for Bridging

Land System Architecture and Landscape Ecology: A Case Study from the Southern High Plains. Land, 7(1), 27.Wenger, K., Vadjunec, J. M., & Fagin, T. (2017). Groundwater Governance and the Growth of Center Pivot Irrigation in

Cimarron County, OK and Union County, NM: Implications for Community Vulnerability to Drought. Water, 9(1), 39.Wickham, Hadley. rvest: Easily Harvest (Scrape) Web Pages. (2016). R package version 0.3.2. https://CRAN.R-project.

org/package=rvest.

We thank our research participants in the Southern Great Plains, including a variety of community leaders, government officials, and landowners. Thank you to Michael Larson for poster printing. This research has been funded by a National Science Foundation (NSF) research grant (#CMMI-1266381: Vadjunec, Phillips, & Fagin). Any opinions, findings, and conclusions or recommendations expressed here are those of the authors and do not necessarily reflect the views of our funders.

This investigation focused primarily on subsidy data obtained and organized by EWG, which is not likely to be a comprehensive ledger of all types of farm payments. However, we believe the subsidy data collected for this poster to be reflective of the greater trends occurring in our study area. Additionally, while web scraping large datasets presents challenges in validating the accuracy and completeness of the data, we implemented intensive quality assurance measures to identify and correct any potential errors. We delineated independent vs. corporate recipients based on whether EWG listed multiple ownership shares for the entity. While some of the “corporations” in our investigation may have been small mom-and-pop LLCs established to mitigate risk, the trend of agribusiness encroachment is well-documented in our study area.

Fig. 7 Center pivot irrigation (CPI) is subsidized by USDA’s Environmental Quality Incentives Program (EQIP). The technology wastes less water than other irrigation methods, but its mass adoption has resulted in rapid drawdown of the Ogallala Aquifer.

Fig. 1 Corn prices increased dramatically from the late 1990s to 2013. Source: USDA National Agricultural Statistics Service (2018).

UnionCounty

Las AnimasCounty Cimarron

County

DallamCounty