Embed Size (px)
Citation preview

Screening for Depression in Primary Care
Kathryn M. Magruder, M.P.H., Ph.D.Derik E. Yeager, M.B.S.
VA Medical CenterMedical University of South Carolina
Charleston SC
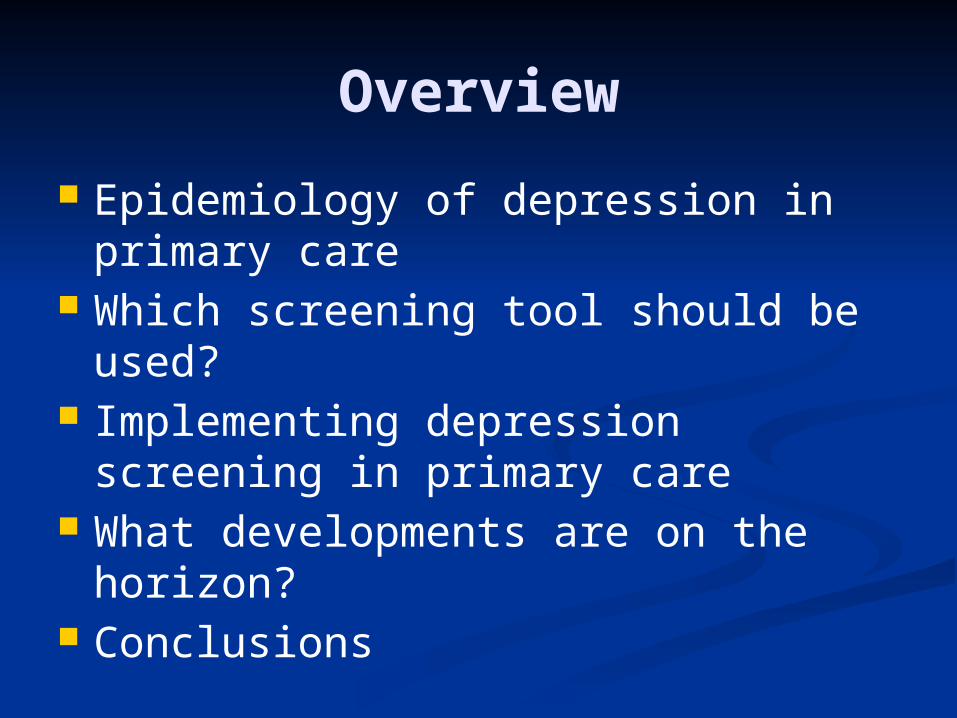
Overview
Epidemiology of depression in primary care
Which screening tool should be used?
Implementing depression screening in primary care
What developments are on the horizon?
Conclusions

Epidemiology:1. Population Prevalence
NCS-R: DSM-IV dx (12 month prevalence) 9.5% any mood disorder 6.7% MDD
19.5% mild 50.1% moderate 30.4% serious
1.5% dysthymia European 6-country study (12 month
prevalence) MDD 3.9%
European meta-analysis (27 studies) (12 month prevalence) MDD 3.1-10.1%

Epidemiology:2. Primary Care Prevalence
Pre-DSM-III-R PC MDD prevalence: 4.8-8.6%
WHO PPGHC (15 cities/14 countries) MDD (ICD10): 10.4% (2.6-29.5%)
Backenstrass et al. (2006) 4.6% MDD 6.2% minor depression 9.1% nonspecific depression sx

Primary Care:The de facto MH System
ECA MDD (12 months prior) 45% any health service
27.8% specialty mental health care 25.3% general medical sector
NCS-R MDD (12 months prior) 51.6% any health service
27.2% general medical sector 12.8% classified as mild
50-80% of all depression management in PC

Recognition of Depression:The Primary Care Irony
General medical settings: primary venue for treating depression (and other mental disorders)
<50% with MDD are diagnosed in PC Magruder et al. VA sample of 819: 52%
correct dx of depression (MDD, NOS, dysthymia)
WHO PPGHS: 54.2% (range 19.3%-74.0%) with depression correctly recognized as having psychological illness

Which Screening Tool?1. Standard Screeners
Tool Scope # Items Min.
Self
BDI Sx severity today 7, 13, or 21
2-5 yes
CES-D Sx frequency past wk
10 or 20 2-5 yes
GDS Sx endorsement past wk
15 or 30 2-5
ID Sx recently 15 2-5
SDS Sx frequency recently
20 2-5 yes

Which Screening Tool?2. Short Screeners
Tool Scope # Items Min.
Self
HADS Sx severity past wk 14 <2
MOS-D Sx frequency past wk
8 <2 yes
PHQ Sx frequency past 2 wk
9 <2 yes

Which Screening Tool?3. Ultra-Short/Ultra-Brief
Screeners
Tool Scope # Items
Min.
Self
PRIME-MD (PHQ-2)
Sx past month
2 1-2 yes
SDDS-PC Sx past month
5 1-2

Two-stage Approaches
Combine screening and diagnosis Quick screen (“stem” questions) Dx modules for screen+ patients
SDDS-PC PRIME-MD

Screening for General Emotional Distress
Tool Scope # Items
Min.
Self
WHO-5
Degree of well-being 5
GHQ General psychiatric distress; sx frequency past week
12, 28, or 30
2-10
yes
HSCL General distress; sx frequency past wk
13 or 25
2-5

Screening for Multiple Disorders
General screener – 1-2 items/disorder
Anxiety & Depression Detector (ADD) (Means-Christensen et al., 2006): 5 questions Panic d/o PTSD Social phobia GAD MDD

Severity Ratings
Beyond case-finding Evaluate treatment
response/effectiveness Helps with “watchful waiting” for at
risk patients with subthreshold or minor depression
Administer screeners repeatedly Sx changes
Examples Zung SDS PHQ-9
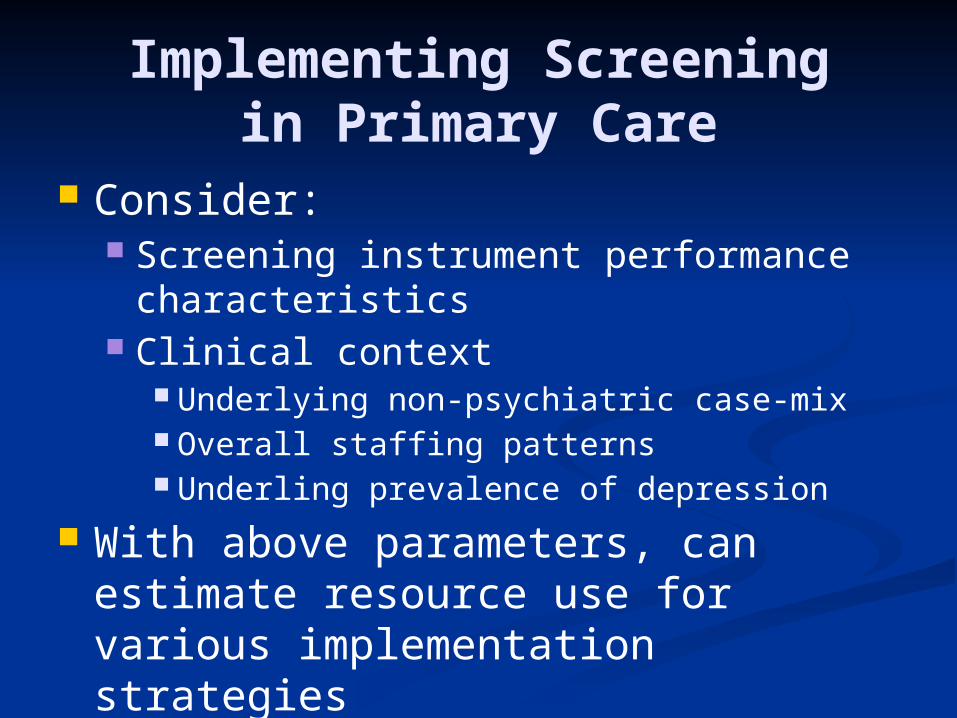
Implementing Screeningin Primary Care
Consider: Screening instrument performance
characteristics Clinical context
Underlying non-psychiatric case-mix Overall staffing patterns Underling prevalence of depression
With above parameters, can estimate resource use for various implementation strategies

1-Stage Screening Approach
5% Prevalence80% Sensitivity, 80% Specificity
Gold StandardMDD + MDD -
PHQ-9 + 40 190 230
True Positive False Positive Screen Positive
PHQ-9 -10 760 770
False Negative
True Negative Screen Negative
50 950 1000MDD Positive MDD
NegativeTotal Sample
PPV: 40/230 = 17.4%. For every 100 screen positives, only approximately 17 would be depressed
Excess diagnostic burden: 190/1000 = 19%. Diagnostic assessment would be performed on 190 patients who were not depressed.

1-Stage Screening Approach
10% Prevalence80% Sensitivity, 80% Specificity
Gold StandardMDD + MDD -
PHQ-9 + 80 180 260
True Positive False Positive Screen Positive
PHQ-9 -20 720 740
False Negative
True Negative Screen Negative
100 900 1000MDD Positive MDD
NegativeTotal Sample
PPV: 80/260 = 30.8%. For every 100 screen positives, only approximately 31 would be depressed
Excess diagnostic burden: 180/1000 = 18%. Diagnostic assessment would be performed on 180 patients who were not depressed.

1-Stage Screening Approach
20% Prevalence80% Sensitivity, 80% Specificity
Gold StandardMDD + MDD -
PHQ-9 + 160 160 320
True Positive False Positive Screen Positive
PHQ-9 -40 640 680
False Negative
True Negative Screen Negative
200 800 1000MDD Positive MDD
NegativeTotal Sample
PPV: 160/320 = 50%. For every 100 screen positives, only approximately 50 would be depressed
Excess diagnostic burden: 160/1000 = 16%. Diagnostic assessment would be performed on 160 patients who were not depressed.

Performance of a One-Stage Screening Approach
Prevalence # Cases PPV
Excess Diagnostic Burden
5% 50 17.4 19.0
10% 100 30.8 18.0
20% 200 50.0 16.0
Sample size: 1000Sensitivity: 80%Specificity: 80%

2-Stage Screening Approach
5% PrevalenceGold Standard
TotalMDD + MDD -
Stage I 95% Sensitivity, 60% SpecificityPPV: 48/428 = 11.2%. For every 100 screen positives, approximately 11 would be depressed
Screen +48 380 428True
PositiveFalse
PositiveScreen Positive
Screen -2 570 572
False Negative
True Negative
Screen Negative
50 950 1000MDD
PositiveMDD
NegativeTotal
Sample
Stage II 80% Sensitivity, 80% Specificity PPV: 38/114 = 33.3%. For every 100 screen positives, approximately 33 would be depressedExcess diagnostic burden: 76/1000 = 7.6%. Diagnostic assessment would be performed on 76 patients who were not depressed.
Screen +38 76 114True
PositiveFalse
PositiveScreen Positive
Screen -10 304 314
False Negative
True Negative
Screen Negative
48 380 428MDD
PositiveMDD
NegativeTotal
Sample

2-Stage Screening Approach
10% PrevalenceGold Standard
TotalMDD + MDD -
Stage I 95% Sensitivity, 60% SpecificityPPV: 95/455 = 20.9%. For every 100 screen positives, approximately 21 would be depressed
Screen +95 360 455True
PositiveFalse
PositiveScreen Positive
Screen -5 540 545
False Negative
True Negative
Screen Negative
100 900 1000MDD
PositiveMDD
NegativeTotal
Sample
Stage II 80% Sensitivity, 80% Specificity PPV: 76/148 = 51.4%. For every 100 screen positives, approximately 51 would be depressedExcess diagnostic burden: 72/1000 = 7.2%. Diagnostic assessment would be performed on 72 patients who were not depressed.
Screen +76 72 148True
PositiveFalse
PositiveScreen Positive
Screen -19 288 307
False Negative
True Negative
Screen Negative
95 360 455MDD
PositiveMDD
NegativeTotal
Sample
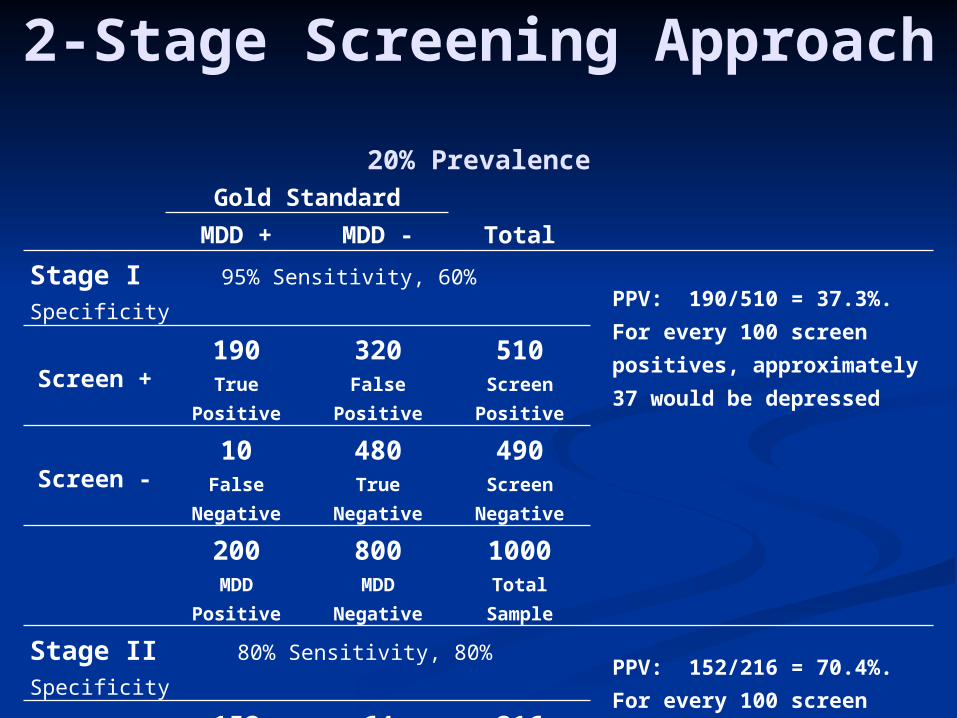
2-Stage Screening Approach
20% PrevalenceGold Standard
TotalMDD + MDD -
Stage I 95% Sensitivity, 60% SpecificityPPV: 190/510 = 37.3%. For every 100 screen positives, approximately 37 would be depressed
Screen +190 320 510True
PositiveFalse
PositiveScreen Positive
Screen -10 480 490
False Negative
True Negative
Screen Negative
200 800 1000MDD
PositiveMDD
NegativeTotal
Sample
Stage II 80% Sensitivity, 80% Specificity PPV: 152/216 = 70.4%. For every 100 screen positives, approximately 70 would be depressedExcess diagnostic burden: 64/1000 = 6.4%. Diagnostic assessment would be performed on 64 patients who were not depressed.
Screen +152 64 216True
PositiveFalse
PositiveScreen Positive
Screen -10 304 314
False Negative
True Negative
Screen Negative
48 380 428MDD
PositiveMDD
NegativeTotal
Sample

Performance of a Two-Stage Screening Approach
Prevalence # Cases PPV
Excess Diagnostic Burden
5% 5033.3 15.9
7.6 11.4
10% 10051.4 20.6
7.2 10.8
20% 20070.4 20.4
6.4 9.6
Sample size: 1000Sensitivity: 95% (Stage I); 80% (Stage II)Specificity: 60% (Stage I); 80% (Stage II)

Screening Burden by Task

Single Stage Screening Approach (Sensitivity: 80%, Specificity
80%)
Time Burden (min)
MDD Prevalence
5% 10% 20%Screening (Patient)
2,000 (1000*2) 2,000 (1000*2) 2,000 (1000*2)
Scoring (Staff)2,000
(1000*2) 2,000 (1000*2) 2,000 (1000*2)Screening Yield
23.0% (230/1000)
26.0% (260/1000)
32.0% (320/1000)
Diagnostic Interview
Patient4,600
(230*20) 5,200 (260*20) 6,400 (320*20)
Provider4,600
(230*20) 5,200 (260*20) 6,400 (320*20)
PPV17.4%
(40/230) 30.8% (80/260) 50% (160/320)
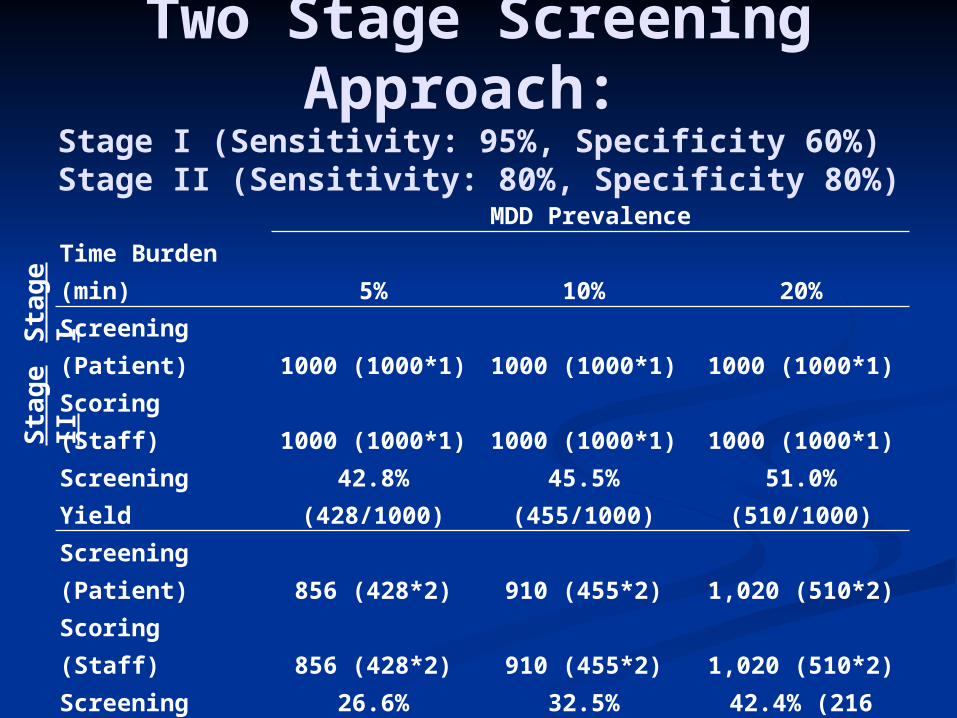
Two Stage Screening Approach:
Stage I (Sensitivity: 95%, Specificity 60%) Stage II (Sensitivity: 80%, Specificity 80%)
Time Burden (min)
MDD Prevalence
5% 10% 20%Screening (Patient) 1000 (1000*1) 1000 (1000*1) 1000 (1000*1)Scoring (Staff) 1000 (1000*1) 1000 (1000*1) 1000 (1000*1)Screening Yield
42.8% (428/1000)
45.5% (455/1000)
51.0% (510/1000)
Screening (Patient) 856 (428*2) 910 (455*2) 1,020 (510*2)Scoring (Staff) 856 (428*2) 910 (455*2) 1,020 (510*2)Screening Yield
26.6% (114/428)
32.5% (148/455)
42.4% (216 /510)
Diagnostic Interview
Patient2,280
(114*20) 2,960 (148*20) 4,320 (216*20)
Provider2,280
(114*20) 2,960 (148*20) 4,320 (216*20)
PPV33.3%
(38/114) 51.4% (76/148)70.4%
(152/216)
Sta
ge
IS
tag
e
II

Comparison of Patient, Staff, and Provider Time (min) for One and Two
Stage ScreenersMDD Prevalence
5% 10% 20%One
StageTwo
StageOne
StageTwo
StageOne
StageTwo
StagePatient 6,600 4,136 7,200 4,870 8,400 6,340
Staff 2,000 1,856 2,000 1,910 2,000 2,020
Provider 4,600 2,280 5,200 2,960 6,400 4,320

What Developments Are on the Horizon?
Increasing acceptance of screening (USPSTF) Reduce stigma Improve screening benefit/cost ratio
Improve tx outcomes Reduce screening time Reduce clinician and staff time by modifying screening
modality Patient self-administered computerized screens Automated EMR screening reminders 2-stage screening process Dedicated nurses for screening & dx (also case-
management) Screening for multiple psychiatric disorders Screening less often (e.g., 2-5 years instead of every
year)
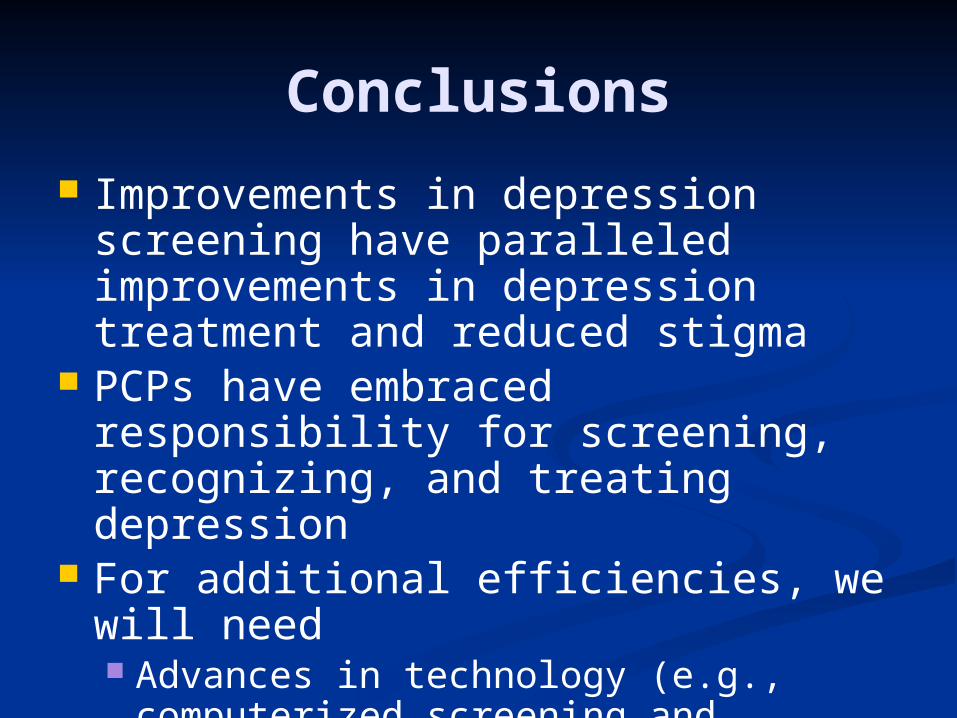
Conclusions
Improvements in depression screening have paralleled improvements in depression treatment and reduced stigma
PCPs have embraced responsibility for screening, recognizing, and treating depression
For additional efficiencies, we will need Advances in technology (e.g.,
computerized screening and scoring) Improved tx outcomes


![M.M.S./M.B.S. (Semester – I) Examination, 2011 102 ... · [4079] – 102 M.M.S./M.B.S. (Semester – I) Examination, 2011 102 : BUSINESS POLICY AND STRATEGIC MANAGEMENT (2008 Pattern)](https://img.pdfslide.us/doc/110x75/5ad46f067f8b9a075a8babca/mmsmbs-semester-i-examination-2011-102-4079-102-mmsmbs.jpg)