Embed Size (px)
Citation preview

30 Churchill Place ● Canary Wharf ● London E14 5EU ● United Kingdom
An agency of the European Union
Telephone +44 (0)20 3660 6000 Facsimile +44 (0)20 3660 5520
Send a question via our website www.ema.europa.eu/contact
© European Medicines Agency, 2016. Reproduction is authorised provided the source is acknowledged.
19 December 2016 EMA/849944/2016
Inspections, Human Medicines, Pharmacovigilance and Committees Division
Screening for adverse reactions in EudraVigilance
Table of contents
1. Introduction ............................................................................................ 3
2. Scope....................................................................................................... 4
3. An integrated approach to signal detection ............................................. 5
3.1. Considerations related to performance .................................................................... 5
4. Screening for adverse reactions in the total population .......................... 6
4.1. Disproportionality methods .................................................................................... 6
4.1.1. Components of the statistical signal detection system based on disproportionality
methods .................................................................................................................... 6
4.1.2. Selection of a disproportionality method ............................................................... 7
4.1.3. Thresholds defining SDRs in EudraVigilance .......................................................... 9
4.1.4. Subgroup analyses and stratification .................................................................. 11
4.1.5. Some operational choices ................................................................................. 15
4.2. Alternatives to SDR based on clinical information ................................................... 15
4.2.1. Characterisation of additional methods ............................................................... 16
4.3. Conclusions on screening methods for the general population .................................. 17
5. Interpretation of screening results based on spontaneous report data . 18
5.1. Review of ICSRs ................................................................................................. 19
5.2. Review of other evidence .................................................................................... 19
6. Methods aimed at specific patient populations ...................................... 20
6.1. Paediatric population .......................................................................................... 20
6.1.1. Disproportionality methods ............................................................................... 20
6.1.2. Clinical based methods ..................................................................................... 21
6.1.3. Conclusions .................................................................................................... 21
6.2. Geriatric population ............................................................................................ 22
6.2.1. Disproportionality methods ............................................................................... 22
6.2.2. Clinical based methods ..................................................................................... 23
6.2.3. Conclusions .................................................................................................... 23

Screening for adverse reactions in EudraVigilance
EMA/849944/2016 Page 2/34
7. Other areas of interest .......................................................................... 23
7.1. Abuse, misuse, overdose, medication error or occupational exposure ........................ 23
7.2. Positive re-challenge ........................................................................................... 23
7.3. Literature cases ................................................................................................. 24
7.4. Conclusions ....................................................................................................... 24
8. Application to other reporting systems .................................................. 24
9. Areas for further development .............................................................. 24
10. Conclusion ........................................................................................... 26
11. List of abbreviations ............................................................................ 27
12. Reference ............................................................................................ 28
13. Appendix ............................................................................................. 30
13.1. ROR calculation ................................................................................................ 30
13.2. Methodological considerations for subgroup analysis and stratification ..................... 31
13.3. Additional information for Figure 1 and 3 and summary table ................................. 33

Screening for adverse reactions in EudraVigilance
EMA/849944/2016 Page 3/34
1. Introduction
When a pharmaceutical product is first authorised for use in clinical practice the information regarding
its use is usually only that obtained from the programme of clinical trials supporting the marketing
authorisation application. While these trials will have demonstrated a positive benefit-risk under
carefully monitored conditions, adverse reactions that are rare, only emerge after prolonged exposure,
or affect types of patients under-represented in clinical trials may remain undetected. To identify such
reactions an elaborate system of post-authorisation surveillance is conducted by pharmaceutical
companies, regulators and the World Health Organisation.
Many sources of data are used to detect adverse drug reactions (ADRs) but one kind of data collection
in particular, the collection of individual case safety reports (ICSR) concerning suspected ADRs in
people exposed to medicines, is specifically performed for this purpose. The data processing system for
ICSRs used by the EU regulatory network is called EudraVigilance (EV) and includes a management
system for reporting and evaluating suspected ADRs of medicinal products marketed in the European
Economic Area (EEA). The first version was launched in December 2001.
When EV was first set up, direct access to the data was limited to regulatory authorities. At the current
time (2016) plans are under way to extend routine access to Marketing Authorisation Holders (MAH)
and the Uppsala Monitoring Centre. Moreover, access is granted in various forms to research groups
and the public. Hence, there is increased interest in how the processes of signal detection are
performed in EV.
Regulatory guidance is provided concerning signal detection in spontaneous report data in the Annex to
Good Pharmacovigilance Practice Module IX. The purpose of this guidance is to give a more discursive
account of the potential uses of EV in screening for ADRs and to clarify the changes implemented and
the rationale behind them based on evidence from recent research activities, including the IMI
PROTECT project (http://www.imi-protect.eu/). Thus, this guidance should be viewed as a scientific
discussion, not as providing regulatory requirements. This guidance also updates and supersedes the
previous guideline on the use of statistical signal detection in EV (EMEA/106464/2006 rev. 1)
The focus of the document is, where possible, on evidence based recommendations; therefore the
structure followed throughout is to provide results of studies or empirical evidence first and then detail
how these have been translated in recommendations and actual implementation in EV. A section is
dedicated to each of the populations for which specific methods are implemented: total population,
paediatric and geriatric. In each section the approach is first to discuss the more classical
disproportionality methods that are the starting points of most of the signal detection systems and
then alternative rule-based methods using clinical information. Finally, a simple approach is proposed
to integrate the disproportionality and alternative methods efficiently. After the different populations
are described, a section is dedicated to other approaches that can potentially influence the decision of
the pharmacovigilance experts to further investigate a drug-event combination (DEC).
When the screening methods identify a DEC for further investigation, it can be evaluated in a number
of ways that will be discussed in section 5. Only after such evaluation can a DEC be considered as a
signal related to the safety of the medicinal products. It should also be noted that, when a signal has
been identified from other sources of evidence, the absence of a positive screening result in EV does
not refute the signal.
Two tools are used in EV for signal detection. The electronic Reaction Monitoring Report (eRMR) is a
standard report that provides summarised signal detection data from EV. The EudraVigilance Data
Analysis System (EVDAS), which operates on the EudraVigilance Data Warehouse, is used in

Screening for adverse reactions in EudraVigilance
EMA/849944/2016 Page 4/34
conjunction with the eRMR to enhance signal detection1. It contains many predefined tables and graph
formats for report presentation and has a variety of functions useful in the later stage of the signal
management activities. The eRMR and the reports providing statistical information in EVDAS
incorporate many of the principles discussed in this guidance; hence, this discussion gives some
insights into the thinking behind them and the methods are discussed in relation to these electronic
tools when appropriate. However, these tools and their use are described in separate user manuals
(User Manual of the electronic Reaction Monitoring Report and EVDAS User Manual2).
This report is aimed at all those using EV for signal detection and in particular those with an interest in
understanding the logic behind the eRMR, interpreting its outputs and, possibly, contributing to future
development of the system. This may include those involved in signal detection and evaluation
activities, pharmacovigilance scientists and programmers or statisticians involved in setting up signal
detection systems. A basic level of understanding of statistical signal detection is assumed,
introductory notions of the concepts developed in this guidance can be found in Almenoff 2005 and
Bate 2009.
In order to maintain the performance of a signal detection system it should be run using clearly
defined signal detection rules. Each of these rules should be characterised by tests run within the
dataset to which they are applied. Of course, any new process of signal detection added subsequently
in EV will be formally tested to investigate its impact on the overall performance of the system and
afterwards this guidance will be updated.
2. Scope
This guidance concerns methods of routine signal detection as used on EV data together with the
elements for their interpretation and their potential advantages and limitations in the frame of
pharmacovigilance. It also addresses the evidence behind the methods, how to use them efficiently
and the areas of uncertainty that require resolution before firm recommendations can be made. The
recommended methods were selected and tested by the European Medicines Agency (EMA) in
consultation with experts from National Competent Authorities (NCAs) and subsequently provided to all
NCAs. Most of the methods implemented are also available, from 2017, to MAHs; when a specific
recommendation applies only to the EU regulatory network it is noted.
Alongside the routine signal detection in EV based on statistical methods, a number of other criteria
are used to indicate when a DEC requires further investigation. This guidance also describes these
criteria and, when available, the evidence supporting them.
Some areas will not be addressed, most particularly signal detection based only on clinical review. This
is often the preferred method when few reports have been received for a product. Also, the guidance
focus is on signal detection activities, not on signal validation or evaluation for which more extensive
data review and analysis are required.
Finally, this guidance is not intended as a review of quantitative methods in pharmacovigilance in
general as such theoretical discussions are available elsewhere (Bate 2009, Gould 2015).
A common observation (Hauben 2005), and one also confirmed in IMI PROTECT (Wisniewski 2016), is
that the absolute performance of a signal detection method may vary between ADR databases and it
should be noted that any information regarding performance of the methods described in this guideline
1 For the EU regulatory network, the eRMR is provided both as a separate tool and in EVDAS; in the latter, however, the full spectrum of functionalities is not available. For MAH, the eRMR is only provided through EVDAS. 2 The user manuals are available on EMA website under the EudraVigilance training section from Janaury 2017.

Screening for adverse reactions in EudraVigilance
EMA/849944/2016 Page 5/34
relates only to their use in EV unless otherwise stated and cannot be assumed to translate to other
databases.
3. An integrated approach to signal detection
Disproportionality methods used in EV have been demonstrated to detect about 50% of ADRs before
other, currently used methods of signal detection (Alvarez 2010). However, substantial numbers of
adverse reactions cannot be detected by these statistical methods or can be detected earlier by
alternative methods. Hence, any comprehensive and efficient routine signal detection system will seek
to integrate a number of different methods to prioritise DECs for further evaluation.
An example of a commonly used alternative method is prioritising specific AEs which are both clinically
important and commonly associated with exposure to drugs (e.g. Stevens Johnson Syndrome, SJS) so
that even a single report with a new drug should prompt further investigation. In addition, quantitative
assessments of concomitant variables, e.g. reporter assessments of the likelihood of causality, may
also have a role in signal detection. Other statistical rules based on spontaneous reports may also be
considered as useful supplements to disproportionality. Typically, such rules may look for increases in
the reporting rate for a particular adverse event even when no disproportionality exists. The creation of
methods that take into account other information besides disproportionality statistics is a matter for
ongoing research. Some simple methods are described in the second part of this guidance and
evaluated within the EV signal detection environment.
3.1. Considerations related to performance
Even when only one carefully characterised method of signal detection is used a major challenge is to
reliably assess its performance. When a signal detection system is constructed using several different
methods then these parameters should ideally be established for each method in competition with the
other methods. In addition, if this performance is to be maintained in a working pharmacovigilance
system, each method must be carefully standardised so that a set of rules or criteria are consistently
applied. This includes not just the statistical methods, which lend themselves to standardisation, but
also non-statistical methods.
To evaluate and compare the performance of the methods used it is necessary to specify what
properties define an effective signal detection system and then to set up experiments to measure the
extent to which these properties are achieved. In PROTECT (Candore 2015) the properties considered
were:
Sensitivity: the probability that a known ADR would be detected;
Positive predictive value (PPV or precision): the probability that a DEC highlighted for review
identifies an ADR;
Time to detection of known ADRs.
The element of time is introduced since a DEC highlighted for review at an earlier time point may allow
earlier action to reduce the risk to patients.
The probability that a DEC not corresponding to an ADR would not be highlighted (specificity) was not
estimated partly because the heterogeneous nature of MedDRA terms makes the concept of a non-ADR
somewhat arbitrary and partly because levels of evidence of non-association vary across DECs and
those with high levels of evidence are likely to form an atypical set (Slattery 2016). The positive
predictive value was instead preferred for its useful role as an indicator of the effort expended per

Screening for adverse reactions in EudraVigilance
EMA/849944/2016 Page 6/34
signal detected3 which is an important consideration in designing an efficient signal detection system.
Hence, it was a natural choice of performance parameter.
The target performance that should be aimed for in a signal detection system is likely to differ between
different user groups. In particular, it will depend on the signal evaluation resources available but, in
allocating these, it must be borne in mind that these resources must be shared between assessment of
the DECs highlighted for review and other methods of signal detection. The effort which is put into
each method should ideally reflect the likelihood of finding an ADR and may also need to consider the
likely clinical impact of the signal.
How a reference database to establish the performance of a signal detection system should be
constructed is a matter for debate but certain rules are clear. The set of ADRs for the products used to
assess the performance of a signal detection method should be moderately comprehensive and the
subject of a reasonable level of consensus. When comparing two different detection methods the same
set of products and ADRs should be used. When assessing the performance for a particular setting –
e.g. across a company’s portfolio of products, it is best to mirror the conditions in which the method is
routinely used as closely as possible. For the performance statistics described above, no set of ‘non
ADRs’ is required and this somewhat eases the construction of the database as it is usually simpler to
identify ADRs than products and events that are reliably known to be unrelated.
The reference standard used to classify a signal as true positive or a false positive/unknown for the
results shown in this guidance is based mainly on the reference used in PROTECT. This includes the
EMA database4 that maps section 4.8 of the summary of product characteristics (SPC) for centrally
authorised products (CAP) to MedDRA preferred terms (PT)5 and a set of non-CAPs product for which a
dedicated mapping exercise was carried out.
The performance of SDAs can be analysed over all MedDRA preferred terms or on a subset that reflects
more closely the concerns of pharmacovigilance experts. The second alternative is chosen when
showing all empirical results in this guidance as it reflects the real world pharmacovigilance process.
Therefore, all performances shown were evaluated using only known ADRs that are also Important
Medical Event (IME6) reactions identified in MedDRA7.
4. Screening for adverse reactions in the total population
4.1. Disproportionality methods
4.1.1. Components of the statistical signal detection system based on
disproportionality methods
Spontaneous reports are sent to EV only when a patient experiences an adverse event that may have
been caused by a medicine. Two facts that can be inferred from this reporting process is that
examination of the dataset will not give direct information about the numbers of patients taking the
medicine who do not experience an adverse event or the numbers of patients having the clinical event
who are not taking a medicine. A consequence of this is that relative association measures at
3 More precisely the reciprocal of the PPV will reflect workload. 4 The database is available at the bottom of this webpage http://www.imi-protect.eu/adverseDrugReactions.shtml. 5 For the CAPs it was also possible to identify which adverse drug reactions had been added to the SPC after the marketing authorisation was granted: these data were used to check the robustness of the results provided. 6 The IME list was created to facilitate both the classification of suspected adverse reactions and the pharmacovigilance data analysis activities of stakeholders in the EU. Its development is co-ordinated by the EudraVigilance Expert Working Group: https://eudravigilance.ema.europa.eu/human/textforIME.asp 7 Results based on the whole set of MedDRA reactions were evaluated as well: these results do not change any practical recommendation.
Screening for adverse reactions in EudraVigilance
EMA/849944/2016 Page 7/34
population level (e.g., relative risks or odds) of clinical events for patients taking a medicine compared
with those not taking the medicine cannot be calculated. Instead, signal detection relies on
disproportionality measures which are relative proportions conditional on reporting to the database.
The functional form of these measures is identical to that of the population measures restricted to the
persons in the database but the values calculated cannot be directly transformed into measures of
clinical relevance or impact.
Disproportionality statistics take the form of a ratio of the observed proportion of spontaneous ICSRs
with a medicinal product that include a specific adverse event to the proportion that would be expected
if no association existed between the product and the event. The calculation of the expected value is
based on ICSRs that do not contain the specific product and it is assumed that these ICSRs contain a
diverse selection of products most of which will not be associated with the adverse event. Hence, these
ICSRs reflect the background incidence of the event in patients receiving any medicine.
There are a number of different ways to calculate such statistics and this choice is the first step
involved in designing a statistical signal detection system. Secondly a set of rules, based on the
observed value of the disproportionality statistic and, usually, also on other statistics (e.g. number of
reports received), is adopted to indicate when a given drug-event combination (DEC) should be
highlighted for further inspection. When this occurs it is often referred to as a signal of
disproportionate reporting (SDR). When introducing the concept of an SDR it is conventional to note
that these statistical criteria alone do not usually constitute a ‘signal’ in the pharmacovigilance
context8. This is to emphasise that results from such statistical approaches may merely reflect a
disproportionality of reporting, which could be a result of numerous non-causal factors such as
confounding, reporting artefacts, different coding practices or combination of the above. In other
words, this statistical association may reflect, but does not imply, a causal relationship between the
exposure to the medicine and the occurrence of the adverse event.
Most disproportionality measures are designed so that they would be expected to rise if a causal
relationship exists between a medicine and an adverse event. Thus, the thresholds might incorporate
the disproportionality measure using a simple threshold criterion. It declares an SDR (if no other rules
are involved) only if the measure rises above this threshold. Such simple rules have drawbacks and
more complex conditions are usually applied but this illustrates the concept.
Lastly, the third step involved in designing a statistical signal detection system is the decision whether
the calculations and the set of rules are based across the whole database or adjusted using
subgrouping variables.
The combination of a disproportionality measure (what was referred above as the first step in
designing a statistical signal detection system), its corresponding set of rules (second step) and where
these are applied (third step) is referred to as a signal detection algorithm (SDA). An example of an
SDA is the Reporting Odds Ratio (ROR) with thresholds on both the number of reports and the lower
bound of the 95% confidence interval of the ROR calculated on the whole database. In this example, i)
the disproportionality measure chosen is the ROR, ii) the set of rules are the thresholds on both the
count and the statistics itself and iii) no subgroup or stratification is used. Based on this SDA, an SDR
is declared only when both conditions on the thresholds are met on the whole database.
4.1.2. Selection of a disproportionality method
A number of disproportionality measures have been proposed for signal detection purposes and the
performance of many of them (all based on two-by-two contingency tables) have been evaluated
8 This concern led the CIOMS VIII report to re-designate SDR as ‘statistic of disproportionate reporting’ but we do not follow this suggestion as it is not technically a statistic.

Screening for adverse reactions in EudraVigilance
EMA/849944/2016 Page 8/34
within the PROTECT project in conjunction with a range of rules to define an SDR and on several
reporting databases including EV (Candore 2015). The disproportionality statistics evaluated were the
Proportional Reporting Ratio (PRR), the Reporting Odds Ratio (ROR), the Information Component (IC),
the Empirical Bayes Geometric Mean (EBGM) and the Urn model; the set of rules to define an SDR
often being based on a lower confidence bound for the statistic and a minimum number of reports, but
in a few instances included also time trend and thresholds on the disproportionality statistics value
itself (see table 4 in the Appendix for more details on the methods used). The databases included
formed a diverse set, encompassing regulatory (EV and UK Sentinel), research (VigiBase) and industry
(Sapphire, Argus, OCEANS and ARISg). However, databases of very small size were not included.
A notable result from PROTECT and previous studies (Van Puijenbroek 2002) is that the choice of
disproportionality statistic is not an important or limiting factor in determining the performance of a
signal detection method. The performance obtained using any given disproportionality statistic is
largely determined by the set of thresholds chosen to define a SDR. This is illustrated in Figure 1 which
displays the range of achievable performance in term of sensitivity and PPV by the ROR method in EV
over a range of thresholds based on i) the lower bound of the 95% confidence interval and ii) the
number of reports.
Figure 1. Envelope of sensitivity and positive predictive value achievable with different thresholds for
the ROR in EV9
The performance of all the methods tested in PROTECT could be approximated by appropriate choice of
thresholds for the ROR. In addition to PPV and sensitivity, the time to detection, calculated as average
number of months from first report received for a product to the first time an SDR occurred, was also
roughly the same, in fact tending to be slightly shorter with the ROR method.
9 Data from PROTECT Work Package 3 project, details on the methods used in Appendix, table 4. Values in green represent unit thresholds on the 95% lower confidence bound (e.g. 0, 1, 2, 3, 4 and 5).

Screening for adverse reactions in EudraVigilance
EMA/849944/2016 Page 9/34
Disproportionality statistics differ in the amount of time and computer resources needed for
calculation, the amount of effort and expertise needed to modify them when required, and how easily
they can be communicated to non-statisticians. Hence, a conclusion of this work is that the choice of
statistic, within the set evaluated in PROTECT, should be made on the basis of convenience.
Implemented recommendation in EudraVigilance
The PRR, which is a very simple calculation, has previously been implemented as the signal detection
method in EV. However, the fact that the ROR is an equally simple method, gives the same
performance as the PRR, but also forms the basis of more complex statistical models makes it the best
choice for future development of the EV system (eRMR and EVDAS) where flexible analytical methods
to adjust for confounding and explore alternative models for signal detection will assume ever greater
importance.
4.1.3. Thresholds defining SDRs in EudraVigilance
As seen, a set of rules applied to the summary statistics calculated for each DEC is defined such that
SDRs are considered to occur only if each statistic reaches or exceeds its corresponding threshold. Too
low a threshold will result in large, and potentially unmanageable, numbers of SDRs to investigate.
This will also reduce the resources available for assessment of each SDR. Too high a threshold will
result in delay or even failure to identify important ADRs. Thus the choice of thresholds is fundamental
to the success of a signal detection system.
Thresholds for a disproportionality method are often based on two separate indicators, one reflecting
the disproportionality statistic itself and another based on the number of reports received. For the
former, in practice, rather than the point estimate, a formal lower confidence bound is often used (e.g.
ROR025 reflecting the lower bound of the 95% confidence interval). Although this is calculated using
the same formula as the confidence bound used in inference it should not be viewed in this light. The
rationale for its use is simply that when the statistic is based on few reports it falls further below the
point estimate and makes an SDR less likely. Hence it is an intuitive way of incorporating the degree of
confidence we have about the reliability of the data to support an SDR into the process. Within
PROTECT it has also been shown that a threshold based on the lower confidence bound performed
better than a threshold with an additional criteria based on the absolute value of the disproportionality
statistic itself (Candore 2015).
The ranges of sensitivity and precision that can be obtained by altering the thresholds for the lower
confidence bound of the PRR and for the number of reports of a DEC have been investigated in EV.
Early work (Slattery 2013) showed that raising the threshold for PRR025 (the lower confidence bound)
above 1 could result in appreciable loss of sensitivity with limited reduction of false positive signals. In
the light of later work (Maciá-Martínez 2016) this is understandable. This work showed that a
correlation exists between the value of a disproportionality statistic and the relative risk of an adverse
reaction estimated in epidemiological studies, therefore setting any threshold on the disproportionality
statistic above 1 might lead to missing an adverse reaction for which the risk ratio is not great enough.
By contrast, increases in the threshold for the numbers of reports of a DEC produced fewer false
positives with little loss of either sensitivity or time gained for investigation of adverse events. A
threshold of five compared to a threshold of three gave a reduction of 25% in false positive signals in
return for a loss of 12% in ADRs detected early and an increase of the median time to SDR by only one
month.

Screening for adverse reactions in EudraVigilance
EMA/849944/2016 Page 10/34
Later, results from PROTECT (based on ROR and PRR) confirmed the benefits of raising the threshold
for the count instead of the threshold for the lower confidence bound. In this study a threshold of five
compared to a threshold of three produced a fall of only 9% in true positives, a delay in the median
time to generate an SDR of eight months and a reduction of 35% in false positives. Results between
the studies are slightly different because the reference standard varied and the earlier work was
probably more reflective of the real objectives of pharmacovigilance since it included only ADRs
unknown at the time of the SDR.
Results from PROTECT (Candore 2015) also show that the proportion of SDRs that turn out to be ADRs
(positive predictive value) decreases over the lifetime of the product. Figure 2 shows this pattern for
the ROR with two different thresholds on the number of reports defining the SDRs of 3 and 5.
Figure 2. Change in positive predictive value with time from authorisation using the ROR025 in EV10
The reduction in PPV over time was mirrored in all methods tested and in all datasets and it appears
more marked during the first years after marketing authorisation. Thus there appears to be a fall in
return from statistical signal detection with time on the market; hence it might be more efficient to
vary the amount of effort invested in signal detection over the life-cycle of the product. This seems to
suggest that newly authorised products could initially be monitored efficiently and with high precision
using a lower case count threshold. Moreover, when a product has just been authorised it will take
some time to generate the minimum number of reports needed, therefore having a lower threshold on
the number of cases should help detecting safety concerns earlier, whereas later in the life cycle of a
substance it seems sensible to raise the case count threshold.
It is worth remarking that, while the above work suggests that lower thresholds should apply
particularly to newly authorised products, it may be that some older products evoke particular
concerns which suggest greater vigilance is warranted and this is easily accomplished by retaining
them in the group that is monitored more ‘intensively’. Generally, however, the majority of products
with a lower threshold on the number of report will be newly authorised products.
In conjunction with lower thresholds to detect safety concerns earlier for products for which the safety
profile is less known, a higher frequency of review than products with a more established safety profile
may be considered. The frequency to choose will depend on current uncertainty about the safety of the
10 Data from PROTECT Work Package 3 project, details on the methods used in Appendix, table 4.

Screening for adverse reactions in EudraVigilance
EMA/849944/2016 Page 11/34
products, as reflected, for example, in the risk management plan, on the rate of accrual of new reports
and also on the resources available for monitoring.
In conclusion, while there is some level of evidence on using the lower bound confidence interval of the
disproportionality statistics with a value of 1 as a threshold, there is no universally applicable rule to
define the exact number of reports for the lower and higher thresholds and the frequency of
monitoring, although it is clear that some products warrant more vigilant signal detection. In addition
to what is considered an adequate level of performance (sensitivity, PPV and time to SDR) and
marginal improvements in performance obtained by modifying the thresholds, elements such as the
amount of resources available for signal evaluation and current knowledge of the product need to be
taken into account.
Implemented recommendation in EudraVigilance
The following criteria are applied in the EV system (eRMR and EVDAS) to define an SDR:
The lower bound of the 95% confidence interval greater than one;
The number of individual cases greater than or equal to
3 for active substances contained in medicinal products included in the additional monitoring
list in accordance with REG Art 23 (see GVP Module X), unless the sole reason for inclusion on
the list is the request of a post-authorisation safety study (PASS);
5 for the other active substances;
The event belongs to the IME list.
4.1.4. Subgroup analyses and stratification
Spontaneous ADR reporting systems cover a range of very diverse products aimed at diverse
conditions and used across a broad range of patient populations. For example, vaccines are given to
healthy subjects, especially children and therefore only a very high level of safety is likely to be
acceptable. Also, ICSR reporting patterns vary over time and between different geographical regions.
The simplest statistical signal detection algorithms disregard this diversity and give equal weight to
information from all products, conditions and patients.
Ignoring the diversity and potential confounding factors within the dataset may result in signals either
being masked or false associations being flagged as potential signals. Stratification is generally used in
epidemiology to reduce bias due to confounding, when a third variable is associated both with the drug
exposure and the event of interest, and may also be of benefit in signal detection algorithms.
Information from various covariates may be used in different ways to enrich/supplement statistical
signal detection processes. Two strategies may be considered:
1. Subgrouping: different measures of disproportionality are estimated, one within each of a number
of subgroups defined by the covariates. An SDR is considered to exist if the conditions for an SDR
are met within any subgroup.
2. Stratification11: a single measure of disproportionality is estimated by a weighted average across
all the subgroups, using standard methods. An SDR is considered to exist if the conditions are met
when using this adjusted measure.
11 This terminology is used inconsistently in the literature. We have adopted what appears to be the original meaning of stratification as operating within but combining across subgroups based on, for example, usage such as ‘stratified sampling’.

Screening for adverse reactions in EudraVigilance
EMA/849944/2016 Page 12/34
A few studies have investigated the impact of stratification and subgroups analysis on SDAs
(Hopstadius 2008, Woo 2008, Evans 2008). This has also been investigated within the PROTECT
project (Seabroke 2016) on several databases (including EV) and with several disproportionality
methods (ROR, IC and EBGM).
In PROTECT both the strategies described above were tested. Variables under investigation were: age;
gender; time period (when the cases were reported); vaccines versus the other drugs; seriousness
(considering two scenarios, seriousness based on CIOMS criteria12 and seriousness if any reaction in
the case is an IME); reporter qualification (splitting patient and health care professional reports);
report source (excluding litigation cases), country and region where the report originated (see table 5
in the Appendix for more details).
A notable finding of PROTECT work was that subgroup analyses for all variables evaluated consistently
performed better than stratified/adjusted analyses in all databases; the results and following
discussion focus therefore only on the subgrouping. Moreover, in EV subgroup analyses consistently
showed benefits in both precision and sensitivity over crude13 analyses for some variables (figure 3).
Two additional findings related to EV can also be seen in figure 3. First, the effect of subgrouping
differed depending on the threshold applied to the count of reports, either 3 or 5. Using a threshold of
3 within each subgroup, appreciable improvements in both sensitivity and precision could be achieved,
while smaller improvements could be achieved with a threshold of 5 and these could be accomplished
with fewer variables. For instance, using a threshold of 3 the geographical groupings increased
sensitivity, addition of age (point labelled ‘Cont & age mis’ in figure 3, see table 5 in the Appendix for
more details on the labels used) increased PPV whilst sacrificing some of the added sensitivity but still
gave an improvement in both measures compared to ungrouped (crude) analysis. While the same
grouping variables used with a threshold of 5 increased PPV but reduced sensitivity compared to the
crude analysis.
The second finding was that the inclusion of litigation cases did not improve the performance with both
thresholds on the counts (3 and 5 reports) and, in fact, made it slightly worse (see points labelled as
‘Crude’ and ‘Spontaneous’, the former including litigation cases, the latter excluding them, in figure 3):
this result helps in providing some empirical evidence that in EV such reports should be excluded
during disproportionality analysis (but still used as a subsidiary information in signal validation). This
recommendation accords with general principles of analysis that the data should be collected using a
homogeneous procedure. It also eliminates the concern that litigation cases – which tend to increase
the chances of a specific adverse event being reported for a specific drug – could mask the same effect
with other products.
12 This variable was studied only in EV. 13 Crude analysis is the analysis performed on the whole dataset without any subgrouping or stratification.

Screening for adverse reactions in EudraVigilance
EMA/849944/2016 Page 13/34
Figure 3. Sensitivity and positive predictive value using subgroup analysis with the ROR025 in EV14
.35
.36
.37
.38
.39
.4.4
1.4
2
Se
nsitiv
ity
.1 .11 .12 .13 .14Precision
CrudeAgeAge misGenderGender misContinentCountryCIOMS SeriousYearAge & GenderAge & Gender misCont & AgeCont & Age misCont & GenderCont & Gender misCont, Age & GenderCont, Age & Gender misReporterSpontaneous
Threshold on the number of cases >= 3
.27
.28
.29
.3.3
1.3
2.3
3.3
4.3
5.3
6
Se
nsitiv
ity
.12 .14 .16 .18 .2 .22Precision
CrudeAgeAge misGenderGender misContinentCountryCIOMS SeriousYearAge & GenderAge & Gender misCont & AgeCont & Age misCont & GenderCont & Gender misCont, Age & GenderCont, Age & Gender misReporterSpontaneous
Threshold on the number of cases >= 5
14 Data from PROTECT project, details on the variables used for the subgroup in Appendix, table 5. The ‘mis’ in the variable names denote that missing data has been included as a separate category in the subgroups for that specific variable; the ‘&’ denotes that two or more covariates have been combined. In the top graph, the subgrouping by ‘Spontaneous’ and ‘CIOMS Serious’ overlap at (0.104, 0.372).

Screening for adverse reactions in EudraVigilance
EMA/849944/2016 Page 14/34
Figure 3 also suggests there may be some value in sub-grouping for variables such as patient reporting
and non-serious reporting, that are the main changes in reporting rules to EV with the new legislation.
Both subgroup calculations (point labelled respectively as ‘CIOMS - Serious’ and as ‘Reporter’ in figure
3) are associated with some improvement in performance but not as marked as for other variables. An
increase in the proportion of non-serious reports in EV is expected as a result of the 2010
pharmacovigilance legislation15 and this might impact the patient reporting as well; a further
investigation on the performance of these sub-groupings might then be useful.
The above discussion is by no means an exhaustive description of potential improvements to signal
detection based on grouping variables. Some research has suggested that restricting signal detection
to within therapeutic areas may have advantages (Grundmark 2014) and restriction to within classes
of products, most commonly vaccines, has also been studied (Seabroke 2016, De Bie 2012).
When deciding which subgroup analysis to recommend, other considerations than changes in
sensitivity and PPV (as shown in figure 3) should be considered:
Overall workload: when limited resources are available it is important to also consider any change
in the number of DECs highlighted for review with the methods proposed; this is not explicit from
sensitivity and PPV (see table 1 for an example);
Visualisation / ease of understanding: the subgroup results should be easy to present in a signal
detection system, this will also facilitate communication of their usage and meaning to the signal
evaluators;
Time to detection of known ADRs: variation in time to detection was not studied for different
subgroup sizes in PROTECT but it is credible to assume that having too many small groups might
require more time to reach the threshold on the number of reports and therefore the time to an
SDR.
Table 1. Difference in the number of true and false positives between the crude and the subgroup
analysis recommended on EV when using the ROR025
Criteria Threshold TP FP Delta % TP
Delta % FP
Delta % SDR
Crude N = 3 1,863 16,658
Subgroup on reporting region and excluding litigation cases
N = 3 2,050 16,646 10.0% -0.0% 0.0%
Crude N = 5 1,737 11,584
Subgroup on reporting region and excluding litigation cases
N = 5 1,796 9,965 3.3% -13.9% -11.7%
TP = True Positive; FP = False Positive; SDR = Signal of Disproportionate Reporting
Implemented recommendation in EudraVigilance
The following criteria are applied in the EV system (eRMR and EVDAS) to define an SDR:
The exclusion of litigation cases (these cases are still used during signal evaluation)
The use of subgrouping by geographical region of reporting.
15 Until July 2012 senders were obliged to send to EV only serious reports. However, non-serious reports from a number of organisations who were sending them were also accepted. After the new pharmacovigilance legislation was implemented a transitional period has been put in place to enable all the stakeholders to adapt to the change in EV business rules. This transitional period is foreseen to end mid 2017 (pending the successful outcome of audit of the new EV system) and only after the transitional period ends shall all non-serious reports be sent.

Screening for adverse reactions in EudraVigilance
EMA/849944/2016 Page 15/34
4.1.5. Some operational choices
As per standard pharmacovigilance practices, the following default settings are used in EV for routine
signal detection (eRMR) and signal evaluation (EVDAS) when calculating the ROR:
Type of reports: default setting uses ‘Spontaneous cases’, ‘Other’ and ‘Not available to sender
(unknown)’ as Report Type (E2B C.1.3) and exclude litigation cases as Primary Source Qualification
(E2B C.2.r.4). ‘Other’ and ‘Not available to sender (unknown)’ are included based on the
assumption that they mostly contain spontaneous cases;
Cases or adverse events: the computations are based on the count of individual cases received,
thus a given ICSR may contribute only to one cell of the table used for the ROR calculation even if
the safety report includes either multiple products or multiple events (see Appendix 13.1 for more
details). This approach has been chosen to keep the independence between the variables used to
compute the ROR so that its variance will not be underestimated;
Drug characterisation: the value of the ROR is computed taking into account the medicinal
products reported as ‘suspect’ or ‘interacting’ (in the context of a drug-drug interaction). For
specific ad hoc analyses e.g. drug-drug interactions, the concomitant medication can be added to
the calculation;
Level of hierarchy for adverse event: the MedDRA hierarchy is implemented in EV and the
Preferred Term is used for routine signal detection. For specific ad hoc analyses other levels or
groupings may be useful;
Level of hierarchy for drug: for routine signal detection the value of the ROR is computed at the
active substance level. Some grouping of active substances (e.g. by salts or route of
administration) is also performed. On occasion, for instance for vaccines, ROR for routine signal
detection is calculated at the medicinal product level (i.e. brand name). For specific ad hoc
analyses other levels or groupings may be useful.
4.2. Alternatives to SDR based on clinical information
The statistical signalling methods use only a limited part of the information contained in ICSRs and
various attempts have been made to augment signal detection using other features of the reports
(Caster 2014). These attempts have two different, and sometimes contrasting, aims: to improve safety
(not missing events that might hide causal relationship or important events for the patients) and,
possibly, to gain efficiency.
Two types of additional information are routinely employed in EV signal detection. The first of these is
a subgroup of MedDRA terms based on expert opinion and the second is information from the ICSRs
regarding the survival of the patient. These are more formally described below:
Designated medical events (DME): some types of adverse event are known to arise in a high
proportion of cases in causal association with medicinal products. Hence even a single report in
conjunction with a medicinal product for which it has not previously been observed may arouse
suspicion. A list of such adverse events, complemented by important and serious events that
should not be missed, is created and maintained by the EMA16. The list is also occasionally
reviewed and revised in the light of empirical assessment of signal detection performance and
emerging clinical opinion;
16 http://www.ema.europa.eu/ema/index.jsp?curl=pages/regulation/general/general_content_000587.jsp&mid=WC0b01ac0580727d1b

Screening for adverse reactions in EudraVigilance
EMA/849944/2016 Page 16/34
Fatal events: reports in which the patient died following an adverse event classified as an IME are
also of concern given the possibility that the death may have occurred directly as a result of the
adverse event. Whilst this does not increase the likelihood that the adverse event is causally
related to the medicinal products, such reports are given special attention because they may
impact the patient and the public health importance should they later prove to be related.
4.2.1. Characterisation of additional methods
The same reference database compiled for the evaluation of signal detection methods in the IMI
PROTECT project can also be used to examine the performance of the additional clinical measures,
either in absolute terms or viewed as supplementary to the statistical signal detection method.
Table 2. Performance of disproportionality and additional methods in EV
Criteria True positive False positive Sensitivity PPV
ROR025 (N=3)* 2,050 16,646 40.6% 11.0%
ROR025 (N=5)* 1,796 9,965 35.6% 15.3%
DME (2012 definition) 1,172 8,702 23.2%** 11.9%
DME (2015 definition) 967 6,739 19.2%** 12.5%
DME (2016 definition) 963 5,295 19.1%** 15.4%
Fatal (IME) 2,064 36,313 40.9% 5.4%
* SDR calculated as recommended in section 4.1 with threshold on the lower bound of the 95% c.i., number of reports, using geographical regions subgroups and excluding litigation cases
** The sensitivity of the DME is limited by the size of the list itself since only reactions belonging to the list can be detected
The SDRs in table 2 were calculated using the methods recommended in the first part of this guidance
(section 4.1). A threshold on the count of 3 cases returns roughly one ADR for every 9 SDRs.
Increasing the threshold on the count to 5 improves this to about one ADR per 7 SDRs, at the cost of
some sensitivity.
Overall the performance of the DME criterion appears similar to SDRs – about 1 ADR for every 7
reports fulfilling the criterion. However, it should be recalled that the SDR can detect any ADR
involving an IME and hence has wider applicability than DMEs. This makes it a more flexible and
powerful technique although it is clear that some known problem areas should always be investigated
before an SDR arises. The precision varies widely between DMEs and each revision of the list had as a
consequence an improvement of the performance.
Table 3. Performance of additional methods as complement to the SDR in EV
Criteria True
positive
False
positive
Sensitivity PPV
DME (2012 definition) - with no SDR (N=3) 971 7,718 19.2% 11.2%
DME (2012 definition) - with no SDR (N=5) 973 7,993 19.3% 10.9%
DME (2015 definition) - with no SDR (N=3) 796 5,981 15.8% 11.7%
DME (2015 definition) - with no SDR (N=5) 806 6,217 16.0% 11.5%
DME (2016 definition) - with no SDR (N=3) 793 4,707 15.7% 14.4%
DME (2016 definition) - with no SDR (N=5) 803 4,869 15.9% 14.2%
Fatal (IME) - with no SDR (N=3) 600 25,793 11.9% 2.3%
Fatal (IME) - with no SDR (N=5) 700 28,793 13.9% 2.4%

Screening for adverse reactions in EudraVigilance
EMA/849944/2016 Page 17/34
To examine how these additional criteria perform as supplement to the statistical methods, table 3
shows the performance on DECs without an SDR.
For DME, performance remain very similar. Moreover review of the confirmed signals in 2013 showed
that a quarter was related to DME PTs; of these, 53% did not yet have an SDR confirming the utility of
using the DME as a complement to the statistical criteria.
The decision to highlight fatal outcome only against IMEs, rather than against all adverse events listed
on the ICSR, was based initially on the view that non-IMEs were unlikely to contribute to the fatality. It
was also found empirically to increase efficiency. In EV, more than 90% of fatal cases are reported
with at least one IME and focusing only on fatal IME reduces the number of DECs with a fatal event by
70%17. Even with this improvement, the criterion based on fatalities only returns one ADR for around
twenty reports investigated, and this is closer to one in forty when excluding DECs with an SDR;
further research may be warranted to find ways of obtaining better precision.
Implemented recommendation in EudraVigilance
In the EV signal detection system (eRMR), both DMEs and IME fatal reports are used routinely as an
addition to SDR methods because of their additional value to augment signal detection, improving
safety (both) and efficiency (DMEs).
4.3. Conclusions on screening methods for the general population
As shown, there is some value in using both the statistical and clinical based methods presented to
achieve a more comprehensive and efficient routine signal detection system. There are different ways
in which the two can be combined, ranging from probabilistic (Caster 2014) to simpler rule based
methods.
In EV the choice made is to highlight a DEC for review if any of the statistical and clinical based
conditions is satisfied. The information about the three methods is combined and visualised in one
single variable in order for the signal detection expert to identify the DECs for further investigation
using just one variable and not three simultaneously.
In case two or more methods simultaneously trigger a DEC to be highlighted, a prioritisation rule is
applied to show only one method as a trigger, with the method to be prioritised determined on
consideration of both efficiency and safety (not missing potential important events). The DME list,
created with the aim to serve as safety net and with an overall performance similar to the SDRs,
seemed a good candidate to be prioritised; while SDRs were a good candidate to follow given their
better performance compared to the fatal events and the vast amount of research demonstrating their
utility.
The three methods are also visualised separately to allow the signal detection reviewer to see how
each of them contribute to a DEC being highlighted for review.
17 The reason lies in the fact that a fatal case with more than one event reported, will be highlighted in the eRMR multiple times according to the number of the medicinal products and events reported. For example, a fatal report with one medicinal product and 5 events, one IME and 4 non-IME, will lead to 5 DECs highlighted in the eRMR. Focusing only on IME will reduce the number of DEC highlighted to 1.

Screening for adverse reactions in EudraVigilance
EMA/849944/2016 Page 18/34
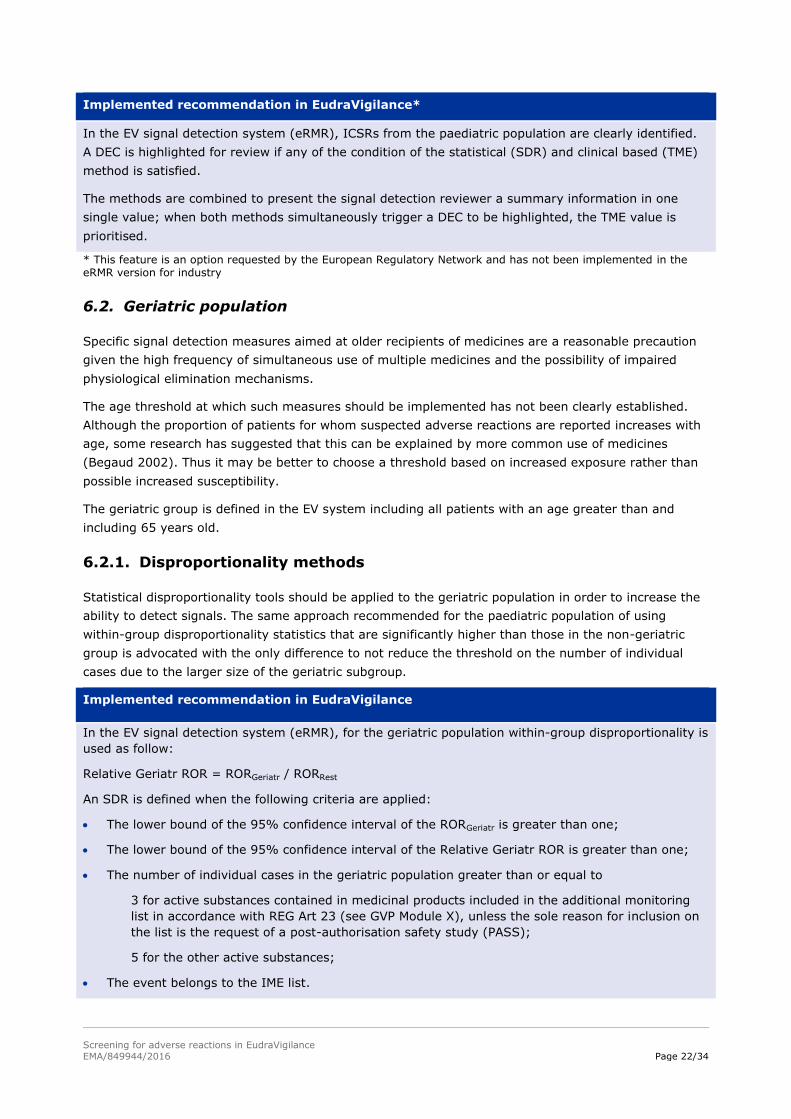
Implemented recommendation in EudraVigilance*
In the EV signal detection system (eRMR), a DEC is highlighted for review if any of the condition of the
statistical (SDR) or clinical based (DME and fatal) method is satisfied.
The methods are combined to present the signal detection reviewer with a summary information in a
single value; when two or more methods simultaneously trigger a DEC to be highlighted, the following
prioritisation is applied:
1. DME
2. IME SDR
3. IME fatal cases
The result of each of the three methods is also visualised separately.
* This feature is an option requested by the European Regulatory Network and has not been implemented in the eRMR version for industry
5. Interpretation of screening results based on spontaneous report data
The purpose of screening spontaneous report databases is to focus the attention of signal detection
experts to DECs for which further investigation of the possibility of a causal relationship appears to be
merited. This is true whether the method involves statistical algorithms, rules based on specific aspects
of the data, or unconstrained inspection of the ICSR data by a pharmacovigilance expert. The
identification by these methods of a DEC for further evaluation is only a preliminary step in a process
and should not be seen as reliable evidence of an ADR.
The further steps in assessing whether a DEC should be treated as a signal are described below and
shown schematically in the diagram (figure 4). The assessment may end at any step if evidence
emerges to show that the case for a signal is not supported.
Figure 4. Steps in assessing a DEC
DEC prioritised for further
investigation
Check the terms of marketing
authorisation (SPC, PIL)
Data quality checks
Scientific/Clinical review of ICSRs
Review of available evidence from
sources other than spontaneous reports
Progress to signal evaluation and
communicate with relevant stakeholders

Screening for adverse reactions in EudraVigilance
EMA/849944/2016 Page 19/34
A preliminary step is to check the terms of the marketing authorisation regarding the DEC under
investigation. In particular, the summary of product characteristics (SPC) and the Package Information
Leaflet (PIL) should be checked to determine if the DEC is already a known ADR and, if so, if questions
remain regarding its frequency and severity.
5.1. Review of ICSRs
The next validation step applied to DECs identified by the screening processes is a detailed review of
all the information contained in the ICSRs. When reviewing SDRs the nature of the entire database as
a background for the disproportionality statistic may also be considered. The following elements may
be relevant to this review:
The medical terminologies which have been used in the reports populating the database;
Whether the reported events are best represented by a single medical code or require a group of
codes;
The quality of the ICSRs (e.g. miscoding, duplicate reports, missing and erroneous data);
The geographical area and time period covered by the database;
Differences in coding practices between countries and reporting regions;
The type of medicinal product included in the database;
The likely drug exposure in the population covered by the reporting system;
Changes in reporting rules and practices since database creation/drug addiction;
Under-, over- and mis-reporting;
The source of ICSRs (e.g. all unsolicited reports).
In EV, some of these elements might be less relevant, e.g. - type of medicinal products included, while
other might be more important given its international character e.g. - different coding practices
between reporting countries.
Having understood all the coding of the suspected ADR related in the spontaneous reports, it should be
considered if the reports appear to support a causal relationship between the product and the adverse
event. Examples include that the event should occur in a credible temporal relationship to the exposure
to the product, events may ease upon withdrawal of a medicine and recur upon re-exposure. However,
these factors should be regarded with caution since they may also have influenced the decision to send
the ICSR. Hence the ICSRs in EV are likely to be a subset of adverse events selected on the basis of a
possibly spurious appearance of causality. Nonetheless, review of these features still has an important
role. In particular, the absence of any consistency in the temporal relationships may suggest that the
observed events are not an ADR.
5.2. Review of other evidence
Even at the initial stage of signal detection, evidence concerning a DEC may be available from sources
other than EV. If substantial doubt remains after the initial validation concerning whether the DEC
should be classified as a signal it may be appropriate to review these sources. However, if a clear
signal has been identified then all these sources will be reviewed at the stage of signal evaluation – not
covered by this document.

Screening for adverse reactions in EudraVigilance
EMA/849944/2016 Page 20/34
Sources of data that may be reviewed are the marketing authorisation application, the risk
management plan, periodic safety update reports (PSUR), data on suspected unexpected serious
adverse reactions (SUSARs), post-authorisation commitments and published reports of studies. These
sources may help to identify the existence of known class effects or increased susceptibility among
certain patient subgroups. Information in PSURs may include estimates of population exposure and
cumulative safety data aimed at ongoing evaluation of the risks and benefits of medicines, randomised
clinical trials (RCTs), observational studies, other relevant data sources and meta-analyses. It should
be noted that, although non-spontaneous reports to EV collect information from clinical studies,
imbalances in adverse events between treatment groups in a clinical trial may be seen as indicative of
a potential ADR when viewed by a clinical assessor in the context of other study information that is not
reported to EV. Hence appropriate review of relevant studies may add substantially to evaluation of
reported SUSARs.
6. Methods aimed at specific patient populations
When ICSR databases are sufficiently large, some classes of patients may be identified that merit
separate attention in signal detection due to known or suspected systematic differences in their
responses to medicines. Two such groups that can be differentiated in most databases are based on
age: paediatrics and geriatric patients.
A note of caution in designing such subgroup analyses is that too fine divisions of the data may result
in lack of power to detect signals. Thus it may be best to use quite large subgroups and to monitor
specific patient populations in parallel with analyses of the total dataset.
The methods of analysis performed on subgroups in EV mirror those for the entire database; therefore
both statistical and clinical based methods are introduced following the same structure applied in the
first part of the guidance. Separate validation is not presented because reference datasets of subgroup
specific ADRs are currently unavailable. Hence the strength of evidence for signal detection in
subgroups is somewhat lower than for the entire dataset but a prospective pilot in real-word signal
detection has confirmed a relatively low workload and the utility of applying the methodologies
proposed in these subgroups. In addition, results of the pilot have been useful in refining the methods
proposed.
6.1. Paediatric population
Often a single paediatric group is chosen below a selected age threshold. Although childhood is a
period of rapid change and no threshold is likely to define a homogenous group, this succeeds in
defining a population with marked developmental, physiological and psychological differences from
adults.
The paediatric group is defined in the EV system including all patients with an age up to and including
17 years old.
6.1.1. Disproportionality methods
Statistical disproportionality tools can be applied to ICSRs relating to the use of medicines in children
to increase the ability to detect signals in the paediatric population from spontaneous ICSR databases.
In line with the general population, the disproportionality method proposed is the ROR and the
thresholds used to define an SDR are also based on its 95% confidence interval and on the number of
individual cases. However, the lower number of ICSRs usually received for the paediatric population

Screening for adverse reactions in EudraVigilance
EMA/849944/2016 Page 21/34
compared to the rest would advocate the use of a lower threshold for the count and the avoidance of
further subgrouping within this population in order to preserve the power.
Another difference from the use in the total population is the use of within-group disproportionality
statistics: only disproportionalities that are significantly higher than those in the non-paediatric group
should be highlighted for additional consideration (Blake 2015). The rationale for this choice is to try
avoiding to consider for further review disproportionalities already highlighted in the overall population
focusing on disproportionalities that are more pronounced in the paediatric group.
Implemented recommendation in EudraVigilance
In the EV signal detection system (eRMR), for the paediatric population within-group disproportionality
is used defined as follow:
Relative Paed ROR = RORPaed / RORRest
An SDR is defined when all of the following criteria are applied:
The lower bound of the 95% confidence interval of the RORPaed is greater than one;
The lower bound of the 95% confidence interval of the Relative Paed ROR is greater than one;
The number of individual cases in the paediatric population is greater than or equal to
2 for active substances contained in medicinal products included in the additional monitoring
list in accordance with REG Art 23 (see GVP Module X), unless the sole reason for inclusion on
the list is the request of a post-authorisation safety study (PASS);
3 for the other active substances;
The event belongs to the IME list.
6.1.2. Clinical based methods
An additional way to focus on paediatric safety issues can be with the aid of a list of adverse events
clinically relevant in the children population.
This list of targeted medical events (TMEs) is similar in purpose to the DME for the general population
and shares some of its principles even if adapted to the paediatric population. It therefore contains
adverse events that are known to be causally associated with medicinal products and to have more
serious outcomes in children than adults. To identify the terms in the TME, the reactions most
commonly associated with fatal or life threatening cases in children served as a starting point based on
the assumption that these events are not expected in children. Terms that are already present in the
DME list should be excluded to avoid duplication during the screening.
Implemented recommendation in EudraVigilance*
In the EV signal detection system (eRMR), TME are also used to focus on paediatric safety issues.
* This feature is an option requested by the European Regulatory Network and has not been implemented in the eRMR version for industry
6.1.3. Conclusions
The statistical and clinical based methods are combined following the same approach as in the overall
population, both in term of prioritisation and having a separate visualisation.
Screening for adverse reactions in EudraVigilance
EMA/849944/2016 Page 22/34
Implemented recommendation in EudraVigilance*
In the EV signal detection system (eRMR), ICSRs from the paediatric population are clearly identified.
A DEC is highlighted for review if any of the condition of the statistical (SDR) and clinical based (TME)
method is satisfied.
The methods are combined to present the signal detection reviewer a summary information in one
single value; when both methods simultaneously trigger a DEC to be highlighted, the TME value is
prioritised.
* This feature is an option requested by the European Regulatory Network and has not been implemented in the eRMR version for industry
6.2. Geriatric population
Specific signal detection measures aimed at older recipients of medicines are a reasonable precaution
given the high frequency of simultaneous use of multiple medicines and the possibility of impaired
physiological elimination mechanisms.
The age threshold at which such measures should be implemented has not been clearly established.
Although the proportion of patients for whom suspected adverse reactions are reported increases with
age, some research has suggested that this can be explained by more common use of medicines
(Begaud 2002). Thus it may be better to choose a threshold based on increased exposure rather than
possible increased susceptibility.
The geriatric group is defined in the EV system including all patients with an age greater than and
including 65 years old.
6.2.1. Disproportionality methods
Statistical disproportionality tools should be applied to the geriatric population in order to increase the
ability to detect signals. The same approach recommended for the paediatric population of using
within-group disproportionality statistics that are significantly higher than those in the non-geriatric
group is advocated with the only difference to not reduce the threshold on the number of individual
cases due to the larger size of the geriatric subgroup.
Implemented recommendation in EudraVigilance
In the EV signal detection system (eRMR), for the geriatric population within-group disproportionality is
used as follow:
Relative Geriatr ROR = RORGeriatr / RORRest
An SDR is defined when the following criteria are applied:
The lower bound of the 95% confidence interval of the RORGeriatr is greater than one;
The lower bound of the 95% confidence interval of the Relative Geriatr ROR is greater than one;
The number of individual cases in the geriatric population greater than or equal to
3 for active substances contained in medicinal products included in the additional monitoring
list in accordance with REG Art 23 (see GVP Module X), unless the sole reason for inclusion on
the list is the request of a post-authorisation safety study (PASS);
5 for the other active substances;
The event belongs to the IME list.

Screening for adverse reactions in EudraVigilance
EMA/849944/2016 Page 23/34
6.2.2. Clinical based methods
No advantage was found in EV in supplementing the DME list with a TME list for the older age group
and hence the DME form of signal detection in the total dataset also covers this subgroup.
6.2.3. Conclusions
Implemented recommendation in EudraVigilance
In the EV signal detection system (eRMR) ICSRs from the geriatric population are clearly identified.
A DEC is highlighted for review if the condition of the statistical (SDR) method is satisfied.
7. Other areas of interest
In addition to the methods described, other information can play an important role in the decision
whether a DEC merits further investigation. In this section the three most important areas are
described; however, depending on the specific DEC being investigated, other information can also play
an important role and this is the reason why in the eRMR much more signal detection data is visualised
(e.g. seriousness, health care professional reports, route of administration, indication of use,…for more
details refer to the User manual of the electronic Reaction Monitoring Report).
7.1. Abuse, misuse, overdose, medication error or occupational exposure
Besides the description of the clinical manifestation of the suspected adverse reaction, ICSRs may
include information on the potential causal mechanisms for the reaction. Such information may relate
to the circumstances of medicine exposure which could have contributed to the occurrence of the
adverse reaction, e.g. abuse, misuse, overdose, medication error and/or occupational exposure.
Although the coding of these circumstances is enabled as Preferred Terms in MedDRA (see GVP Annex
IV), they are qualitatively different from the clinical circumstances which are the focus of
disproportionality-based signal detection. Firstly, they are manifestly related to at least one medicinal
product identified in the ICSR. With suspected adverse reactions in normal circumstances of use this
relationship is a matter of clinical judgement. Secondly, the circumstances described by each of these
terms differ depending on the product concerned. Hence between-medicine comparisons of reporting
frequency of ICSRs with MedDRA-codes describing these circumstances are both unnecessary and
potentially misleading.
However, knowledge of these circumstances can appreciably alter the assessment of causality when
reviewing a potential signal. Thus, it is recommended that the numbers of ICSRs with reported
MedDRA codes related to abuse, misuse, overdose, medication error and/or occupational exposure
should be displayed and highlighted for each DEC in signal detection listings and that these cases are
readily retrievable.
7.2. Positive re-challenge
An adverse event that has been reported to have reoccurred after renewed exposure, referred to as
positive re-challenge, can be consistent with a causal relationship and should be clearly identified. The
caution advised in section 5 should be noted as this circumstance may also have influenced the
decision to send the ICSR.

Screening for adverse reactions in EudraVigilance
EMA/849944/2016 Page 24/34
7.3. Literature cases
Cases derived from literature should also be highlighted when new reports arise. This is important as it
indicates that more detailed information on the case and additional review of the scientific case for a
causal relationship may be available through retrieval of the article that prompted the report. The
signal detection reviewer may wish to take advantage of this if any uncertainty remains following the
initial assessment.
7.4. Conclusions
Implemented recommendation in EudraVigilance
In the EV signal detection system (eRMR) the following information are separately visualised and
highlighted for each DEC when new reports are submitted:
Abuse, misuse, overdose, medication error or occupational exposure*;
Positive re-challenge;
Literature cases.
* This feature is an option requested by the European Regulatory Network, in the eRMR version for industry only medication error has been considered
8. Application to other reporting systems
The signal detection methods described in this document are those that have been found useful in the
EV database. Many of these, mainly the ones related to the disproportionalities methods in the overall
population, were investigated in the IMI PROTECT project. The finding of PROTECT can be directly
applied only to the databases in which they were produced. However, the changes in signal detection
performance associated with changes in methods or thresholds were similar within the PROTECT
databases and thus this may generalise to other databases.
Hence, if the performance has been measured for one SDA within a database, it is possible to use the
PROTECT results to estimate how this performance might be modified when changing to another SDA
within the group of SDAs studied. Probably this process should not be used in databases very different
from those used in PROTECT which ranged in size from about 500,000 to 5,000,000 reports but the
databases were both publicly owned and company.
If no measure of performance has been made then it is necessary to do so before attempting to
establish thresholds to achieve any desired performance level. Tools for such an assessment can be
downloaded from the PROTECT website (http://www.imi-protect.eu/).
9. Areas for further development
Spontaneous report databases remain a highly productive and effective source of early information on
ADRs and the search for new or improved methods of signal detection in these databases generates a
constant stream of ideas with potential to increase the effectiveness of pharmacovigilance. These ideas
require extensive testing. Typically they are initially developed in proof-of-concept studies in a limited
setting but then require further development to assess their added value in the context of a signal
detection system that may incorporate several competing signal detection procedures. Moreover, it
appears that different databases may have properties that influence the effectiveness of signal
detection procedures and thus it is best to test new methods on the database in which it is hoped to
use them.
Screening for adverse reactions in EudraVigilance
EMA/849944/2016 Page 25/34
We list here some methods that appear promising or areas of research that are currently not fully
investigated. These are an un-prioritised and partial list but represent possible directions for
development in EV:
Methods based on parametric modelling for time to onset for products for which exposure times
can be determined, in particular vaccines. Some research that provides a good starting point for
further development is Van Holle 2012;
Investigation of MedDRA PT ‘synonyms’: although it has proven difficult to find more effective
levels of MedDRA than the Preferred Term for signal detection (Hill 2013) it appears likely that
some PTs are similar enough that they are interchangeably used in ICSRs by an appreciable
proportion of reporters. This reduces the power to detect signals and such effective synonyms
should probably be combined at the point of signal detection analysis. Such combination should be
guided by empirical proof that the signal detection is improved;
Use of additional information in statistical signal detection: there is some evidence that VigiRank
and, possibly, adjustment using logistic regression can improve signal detection and this requires
further investigation;
Treatment of combination products in signal detection: monitoring the safety of substances that
are used within a number of different combination products presents a challenge. Should ICSRs
from all such products be combined, kept separate, or some intermediate level of combination
designed based on additional factors such as the nature of the other substances in the
combination?
Products used in combinations: certain products tend to be used simultaneously; should these also
be combined in routine signal detection and if so how can they be identified?
Detecting drug-drug interactions: statistical methods to detect interactions appear of limited utility.
Further work into incorporating information on the potential mechanism of interaction is suggested
(Strandell 2013);
Statistical signal detection within therapeutic/clinical areas: a study (Grundmark 2014) has
suggested that restricting signal detection to within therapeutic areas may improve signal
detection. Two areas were reported and positive trends were noted. Further development is
required.
Occasionally pharmacovigilance initiatives may focus on a specific group of products and cause
unrepresentative reporting. In these cases comparison to products reported under the standard
rules is inappropriate and within-group comparisons should be used. Some work has been done on
direct comparison of these products (Kurz 2011) and this should also be developed.
Investigation of processes based on critical review: although direct review of spontaneous reports
has been used for many years no data appear to exist either on the inter-reviewer reliability or the
effectiveness for signal detection. This is important as such review is often the fall-back position in
challenging areas of signal detection;
Quality assurance of existing signal detection processes: ongoing assessment of the effectiveness
of signal detection processes should be designed into every system. Thought should be given into
how to define stages of the evolution of a signal and calculate useful measures of effectiveness of
the decision making process that can be calculated over appropriate time intervals and used to
monitor the processes;

Screening for adverse reactions in EudraVigilance
EMA/849944/2016 Page 26/34
Different thresholds and/or frequency of monitoring for older and well established products:
investigate whether there is any efficiency in increasing the thresholds and/or frequency of
screening for medicinal products with a well-established safety profile;
Subgrouping effect on time to detection of an ADR: splitting the database in smaller parts might
delay reaching the thresholds on the number of case. This aspect was not studied in PROTECT and
is important to gain a clear understanding of the subgrouping performance based on smaller
groups. Moreover, the fact that some of the calculations based on random subgroups appeared to
give better performance than the crude also requires further investigation;
Use of literature cases: literature cases submitted to EV arise from a fairly heterogeneous set of
articles ranging over simple case reports, observational studies, systematic reviews etc. They are
also characterised by many reports from the same source (with some of these coming via other
routes creating duplicates) and are concentrated on specific drugs. It is not obvious that such
reports are analysable by any single method and it would be interesting to investigate how they
can be used most productively;
Whether the effectiveness of signal detection in a database changes over time: results from
PROTECT suggest that SDA performance may reduce with time. This raises a question of whether
such changes are predictable, for instance if they reflect size or increasing heterogeneity in the
background, and whether they can be controlled;
Comparison across spontaneous databases: it would be interesting to quantify the added value of
smaller specialised spontaneous databases in signal detection;
Methods for products with few spontaneous reports, in particular products that are new to the
market or have very limited exposure. In the previous guideline (EMEA/106464/2006 rev. 1) it was
suggested that: “When a medicinal product is new to the market and only a small number of ICSRs
have been received, it is feasible and probably more appropriate to assess these ICSRs individually
than to rely on statistical methods. This is partly due to the fact that the reliability of the statistical
screening is limited by the small numbers of ICSRs.” This, of course, is an unstructured review
process and it raises the question of whether a systematic process can be developed with
reasonable inter-reviewer agreement.
10. Conclusion
As the size and complexity of spontaneous reporting databases has grown, the importance of a well-
defined process of initial signal detection has increased. The use of such a process allows the overall
workload involved in signal detection to be predicted and the available resources to be focused in an
efficient manner on to DECs of most concern.
This document details how these requirements have influenced the development of signal detection
processes in EV and how those processes have been evaluated. The recommended methods have the
potential to allow more signals to be detected compared to the previously implemented methodology
without increasing workload. Implementation in business processes and through revised guidance was
preceded by a prospective pilot phase in real-world signal detection and, to gather further evidence of
the expected benefits, a protocol to study the changes in efficiency over time is being developed. This
methodology will form the basis of future quality assurance.
Signal detection is a subject of ongoing research and areas of potential promise have been identified.
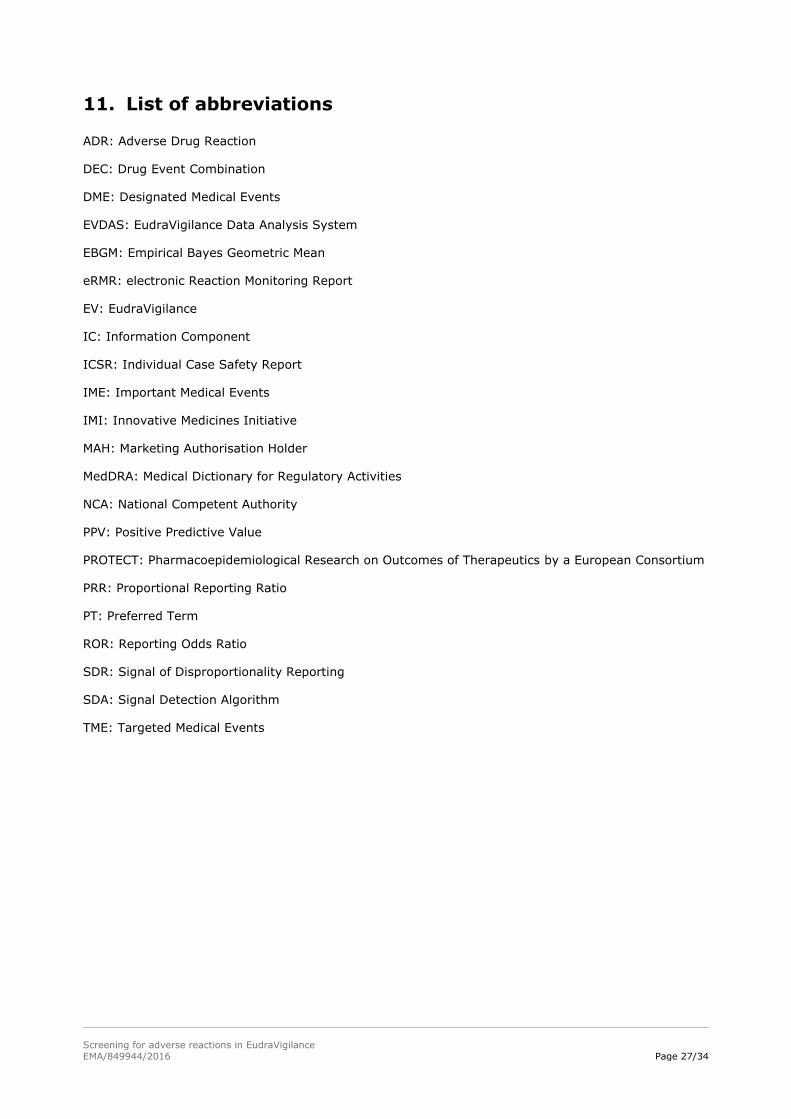
Screening for adverse reactions in EudraVigilance
EMA/849944/2016 Page 27/34
11. List of abbreviations
ADR: Adverse Drug Reaction
DEC: Drug Event Combination
DME: Designated Medical Events
EVDAS: EudraVigilance Data Analysis System
EBGM: Empirical Bayes Geometric Mean
eRMR: electronic Reaction Monitoring Report
EV: EudraVigilance
IC: Information Component
ICSR: Individual Case Safety Report
IME: Important Medical Events
IMI: Innovative Medicines Initiative
MAH: Marketing Authorisation Holder
MedDRA: Medical Dictionary for Regulatory Activities
NCA: National Competent Authority
PPV: Positive Predictive Value
PROTECT: Pharmacoepidemiological Research on Outcomes of Therapeutics by a European Consortium
PRR: Proportional Reporting Ratio
PT: Preferred Term
ROR: Reporting Odds Ratio
SDR: Signal of Disproportionality Reporting
SDA: Signal Detection Algorithm
TME: Targeted Medical Events

Screening for adverse reactions in EudraVigilance
EMA/849944/2016 Page 28/34
12. Reference
1. Guideline on the use of Statistical Signal Detection Methods in the EudraVigilance Data Analysis
System - Doc. Ref. EMEA/106464/2006 rev. 1.
http://www.ema.europa.eu/docs/en_GB/document_library/Regulatory_and_procedural_guideline/2
009/11/WC500011434.pdf
2. Almenoff, J., Tonning, J.M., Gould, A.L. et al. Perspectives on the use of data mining in pharmaco-
vigilance. Drug-Safety (2005) 28: 981.
3. Bate A, Evans S. Quantitative signal detection using spontaneous ADR reporting.
Pharmacoepidemiology and Drug Safety. 2009; 18: 427-436.
4. Gould AL, Lystig T, Lu Y, Fu H, Ma H. Methods and issues to consider for detection of safety signals
from spontaneous reporting databases: A report of the DIA Bayesian Signal detection Working
Group. Therapeutic Innovation & Regulatory Science January 2015 vol. 49(1) 65-75
5. Hauben M et al. Data mining in pharmacovigilance: the need for a balanced perspective. Drug Saf.
2005;28(10):835-42;
6. Wisniewski A, Bate A, Bousquet C, Brueckner A, Candore G, Juhlin K, Macia-Martinez M, Manlik K,
Quarcoo N, Seabroke S, Slattery J, Southworth H, Thakrar B, Tregunno P, Van Holle L, Kayser M,
Noren N. Good Signal Detection Practices: Evidence from IMI PROTECT. Drug Saf (2016) 39:469–490
7. Alvarez Y., Hidalgo A., Maignen F., Slattery J., 2010. Validation of Statistical Signal Detection
Procedures in EudraVigilance Post Authorisation Data: a retrospective evaluation of the potential
for earlier signalling. Drug Safety, 2010 33(6), pp. 475-487
8. Candore G, Juhlin K, Manlik K, Thakrar B, Quarcoo N, Seabroke S, Wisniewski A, Slattery J.
Comparison of statistical signal detection methods within and across spontaneous reporting
databases. Drug Saf. 2015 Jun;38(6):577-87
9. Slattery, J. (2016). Measuring Signal Detection Performance: Can We Trust Negative Controls and
Do We Need Them? Drug Safety, 39(5), 371–373. http://doi.org/10.1007/s40264-016-0407-z
10. Van Puijenbroek EP, Bate A, Leufkens HGM, Lindquist M, Orre R, Egberts ACG. A comparison of
measures of disproportionality for signal detection in spontaneous reporting systems for adverse
drug reactions. Pharmacoepidemiology and Drug Safety. 2002;11(1):3–10.
11. Slattery J, Alvarez Y, Hidalgo A. Choosing thresholds for statistical signal detection with the
proportional reporting ratio. Drug Saf 2013 /;36(8):687-692
12. Maciá-Martínez MA, de Abajo FJ, Roberts G, Slattery J, Thakrar B, Wisniewski AF. An Empirical
Approach to Explore the Relationship Between Measures of Disproportionate Reporting and Relative
Risks from Analytical Studies. Drug Saf. 2016 Jan;39(1):29-43.
13. Hopstadius J, Noren GNN, Bate A, Edwards IR. Impact of Stratification on Adverse Drug Reaction
Surveillance. Drug Safety 2008; 31(11):1035-48
14. Woo EJ, Ball R, Burwen DR, Braun MM. Effects of Stratification on Data Mining in the US Vaccine
Adverse Event Reporting System (VAERS). Drug Safety 2008; 31(8):667-674
15. Evans SJ. Stratification for spontaneous report databases. Drug Safety 2008; 31 (11): 1049-52

Screening for adverse reactions in EudraVigilance
EMA/849944/2016 Page 29/34
16. Seabroke S, Candore G, Juhlin K, Quarcoo N, Wisniewski A, Arani R, et al. Performance of
stratified and subgrouped disproportionality analyses in spontaneous databases. Drug Saf . 2016
Apr;39(4):355-64
17. Grundmark, B., Holmberg, L., Garmo, H., & Zethelius, B. (2014). Reducing the noise in signal
detection of adverse drug reactions by standardizing the background: a pilot study on analyses of
proportional reporting ratios-by-therapeutic area. European Journal of Clinical Pharmacology,
70(5), 627–635
18. De Bie S, Verhamme KM, Straus SM, Stricker BH, Sturkenboom MC. Vaccine-based subgroup
analysis in VigiBase: effect on sensitivity in paediatric signal detection. Drug Saf. 2012 Apr
1;35(4):335-46. PubMed PMID: 22435344.
19. Almenoff J et al. Perspectives on the use of data mining in pharmacovigilance. Drug Saf.
2005;28(11):981-1007;
20. Hauben M, Madigan D, Gerrits CM, Walsh L, Van Puijenbroek EP. The role of data mining in
pharmacovigilance. Expert Opin Drug Saf. 2005;4:929–48.
21. Caster O, Juhlin K, Watson S, Norén GN. Improved Statistical Signal Detection in
Pharmacovigilance by Combining Multiple Strength-of-Evidence Aspects in vigiRank. Drug Safety,
2014. 37(8):617-628.
22. Blake KV, Saint-Raymond A, Zaccaria C, Domergue F, Pelle B, Slattery J. Enhanced paediatric
pharmacovigilance at the European Medicines Agency: a novel query applied to adverse drug
reaction reports. Pediatr Drugs. 2016; 18: 55-63.
23. Begaud B, Martin K, Fourrier a, Haramburu F. Does age increase the risk of adverse drug
reactions? Br J Clin Pharmacol. 2002; 54: 550–552.
24. Kurz X, Domergue F, Slattery J, Segec A, Szmigiel A, Hidalgo-Simon A. Safety monitoring of
Influenza A/H1N1 pandemic vaccines in EudraVigilance. Vaccine. 2011 Jun 10;29(26):4378-87.
25. Holle L, Zeinoun Z, Bauchau V, Verstraeten T. Using time-to-onset for detecting safety signals in
spontaneous reports of adverse events following immunization: a proof of concept study.
Pharmacoepidemiol Drug Saf 2012; 21: 603–10
26. Hill R, Hopstadius J, Lerch M, Noren GN (2013) An attempt to expedite signal detection by
grouping related adverse reaction terms. Drug Saf 35:1194-1195
27. Strandell J, Caster O, Hopstadius J, Edwards IR, Noren GN. The development and evaluation of
triage algorithms for early detection of adverse drug interactions. Drug Saf 2013; 36: 371-388.

Screening for adverse reactions in EudraVigilance
EMA/849944/2016 Page 30/34
13. Appendix
13.1. ROR calculation
Calculation of the ROR is based on a classification of the individual cases in the database into four
categories based on two dichotomous variables. This is shown below:
Medicinal products \ Events Event R Not event R
Medicinal product P a b
Not product P c d
The general metrics to calculate the ROR are as follows:
The value ‘a’ indicates the number of individual cases that list the suspected medicinal product P
and the adverse event R;
The value ‘b’ indicates the number of individual cases that list the suspected medicinal product P
but not the adverse event R;
The value ‘c’ indicates the number of individual cases that list the adverse event R but not the
medicinal product P of interest;
The value ‘d’ indicates the number of individual cases that do not list the adverse event R or the
medicinal product P of interest.
The ROR is computed as follows18:
dc
baROR
/
/
The utility of this statistic for signal detection is based on the consideration that when a product causes
the event the number of observed reports for the DEC will tend to exceed the number based on chance
alone and the ROR will thus tend to exceed 1. A necessary assumption for this to function is that a fair
diversity of products is assumed to exist in the dataset so that most of those included in the
denominator will not cause the event.
Example 1:
The odds of individual cases of nausea amongst all the reports involving a particular medicinal
product P is equal to 0.05 (e.g. 5 reports of nausea amongst a total of 105 reports reported with
this medicinal product P; A = 5, B = 100);
The odds of reports of nausea amongst all the reports involving all the other medicinal products of
the database (but not the medicinal product P) is also equal to 0.05 (e.g. 5,000 reports of nausea
amongst 105,000 reports reported with all other medicinal products; C = 5,000, D = 100,000).
In this example, the ROR is equal to 1 (i.e. (5/100) / (5,000/100,000) = 0.05 / 0.05 = 1). This can be
interpreted as the odds of reports of nausea within all reports involving the medicinal product P are the
same as the odds of reports of nausea among all other reports in the database,
18 When c is equals to 0, the ROR cannot be computed. In EudraVigilance, the value of the ROR is arbitrarily set at 99.9 to reflect the presence of a possible SDR.

Screening for adverse reactions in EudraVigilance
EMA/849944/2016 Page 31/34
Example 2:
The odds of individual cases of nausea amongst all the reports involving a particular medicinal
product P is equal to 0.15 (e.g. there are 15 reports of nausea amongst a total of 115 reports
reported with this medicinal product P; A = 15, B = 100).
The odds of individual cases of nausea amongst all the reports involving all the other medicinal
products of the database (but not medicinal product P) is equal to 0.05 (e.g. 5,000 reports of
nausea amongst 105,000 reports reported with all other medicinal products; C = 5,000, D =
100,000).
In this second example, the ROR is equal to 3 (i.e. (15/100) / (5,000/100,000) = 0.15 / 0.05 = 3).
This can be interpreted as the odds of reports of nausea within all reports involving the medicinal
product P are three times higher than the odds of reports of nausea among all other reports in the
database,
The 95% confidence interval gives an indication of the precision of the estimate of the reporting odds
ratio. The 95% confidence interval of the ROR is also computed in the eRMR and EVDAS output. In
order to do this we first estimate the standard deviation of the natural logarithm of the ROR by the
following formula:
dcbas /1/1/1/1(
The 95% confidence interval for ln(ROR) is then estimated as ln(ROR) ± 1.96s and, taking the
exponential of this, we get:
95% confidence interval for ROR = (ROR / exp(1.96s), ROR x exp(1.96s))
In case of the relative ROR, the standard deviation of the natural logarithm can be estimated by the
following formula:
22
Re/ stGeritatrPaedRORROR
sss
The 95% confidence interval for ln(Relative ROR) is then estimated as ln(Relative ROR) ± 1.96s and,
taking the exponential of this, we get:
95% confidence interval for Relative ROR = (Relative ROR / exp(1.96s), Relative ROR x exp(1.96s))
13.2. Methodological considerations for subgroup analysis and
stratification
A complication in specifying which subgroups to consider for routine signal detection is that different
thresholds for continuous covariates may generate large numbers of potential groupings and these are
further multiplied by combinations of two or more covariates. In PROTECT prior definitions of
subgroups were constructed on the basis of clinical and pragmatic considerations; this allowed control
of the over-estimation of performance that can result from unrestricted multiple testing. This process
of restriction of the subsets in combination with the large reference set of ADRs used to calculate the
sensitivity and precision resulted in accurate estimates of these parameters and this was verified by
running a Bayesian model to calculate the shrunken estimates. These were very close in value to the
un-shrunk estimates suggesting that multiplicity of subgroups had little impact.
A more interesting concern than multiplicity was whether the difference between the performance
estimates from the crude analysis and sub-grouped or stratified analysis reflected some adjustment for
the variable on which the subgroups were based or if it resulted simply from the fact that the criteria

Screening for adverse reactions in EudraVigilance
EMA/849944/2016 Page 32/34
for an SDR are based on smaller groupings. In order to investigate this we performed control
calculations for each sub-grouped or stratified analysis dividing the underlying data into subgroups of
the same size but in a random fashion – not based on the values of any variable. Interestingly this
produced different estimates both from the crude and the sub-grouped or stratified analysis. For
example, random division of the dataset into groups of the same size as those associated with
separating by reporting region gave higher PPV than the crude ROR analysis but did not increase the
sensitivity as instead the analysis using the specific subgroups based on continent. Multiple repetitions
of the selection of the random subgroups showed highly consistent results. This revealed that part of
the changes observed in performance were not associated with the information contained in the
subgrouping variable but that appreciable proportions of the change could be attributed to this source.
Hence the systematic subgrouping on some variables appeared to be worthwhile. An odd feature of
this calculation was that some of the calculations based on random subgroups appeared to give better
performance than the crude and this requires further investigation.
In PROTECT a sensitivity analysis using a threshold for the number of reports summed across
subgroups, in other words the total used in the crude analysis, – results not shown – revealed that
almost all subgroup analyses gave appreciable losses in PPV but higher sensitivity. This would result in
reduced efficiency and is not useful in a resource limited signal detection system and thus this strategy
can be excluded.

Screening for adverse reactions in EudraVigilance
EMA/849944/2016 Page 33/34
13.3. Additional information for Figure 1 and 3 and summary table
Table 4. Signal detection methods in PROTECT Study (see Figure 1)
Statistical
method
Signal detection
algorithm
Current
use
Conditions for SDR
EBGM
EB05 (1.8, 3, 2.5) MHRA EB05 ≥ 1.8 & n ≥ 3 & EBGM ≥ 2.5
EB05 (1.8, trend) AZ EB05 ≥ 1.8 or positive trend flag (1)
EB05 (2.0, trend) GSK EB05 > 2.0 or positive trend flag (2)
IC IC UMC IC lower bound 95% confidence interval (c.i.) > 0
PRR PRR025 (1.0, 3) EMA PRR lower bound 95% c.i. ≥ 1 & n ≥ 3
PRR025 (1.0, 5) EMA PRR lower bound 95% c.i. ≥ 1 & n ≥ 5
PRR (3.0, 3, 4.0) No PRR ≥ 3 & 2 ≥ 4 & n ≥ 3 (3)
PRR (2.0, 3, 4.0) Bayer PRR ≥ 2 & 2 ≥ 4 & n ≥ 3 (4)
PRR (2.0, 3, 3.84) Roche PRR ≥ 2 & p (2) <= 0.05 & n ≥ 3
ROR ROR025 (1.0, SHR) UMC ROR with shrinkage, lower bound 95% c.i. > 1 (5)
ROR025 (2.0, 5) MEB ROR lower bound 95% c.i. > 2 & n ≥ 5
ROR025 (1.0, 3) No ROR lower bound 95% c.i. ≥ 1 & n ≥ 3
ROR025 (1.0, 5) No ROR lower bound 95% c.i. ≥ 1 & n ≥ 5
URN URN1 No Reporting Ratio > 1 & unexpectedeness > 1 / 0.05
URN500 No Reporting Ratio > 1 & unexpectedeness > 500 / 0.05
Table 5. Details on the variables used for subgroup analysis in PROTECT (see Figure 3)
Covariate Strata Legend in the graph
Age 0–23 months, 2–11, 12–17, 18–35, 36–64, 65–74,
75 years, unknown
Age
Gender Male, female, unknown Gender
Time period 5-yearly Year
Event seriousness Serious, non-serious CIOMS Serious
Reporter qualification Consumer only, healthcare professional only, mixed Reporter
Report source Spontaneous (excluding solicited/legal cases) Reporter
Country of origin Individual country of origin Country
Region of origin North America, Europe, Japan, rest of Asia, rest of
the world
Continent
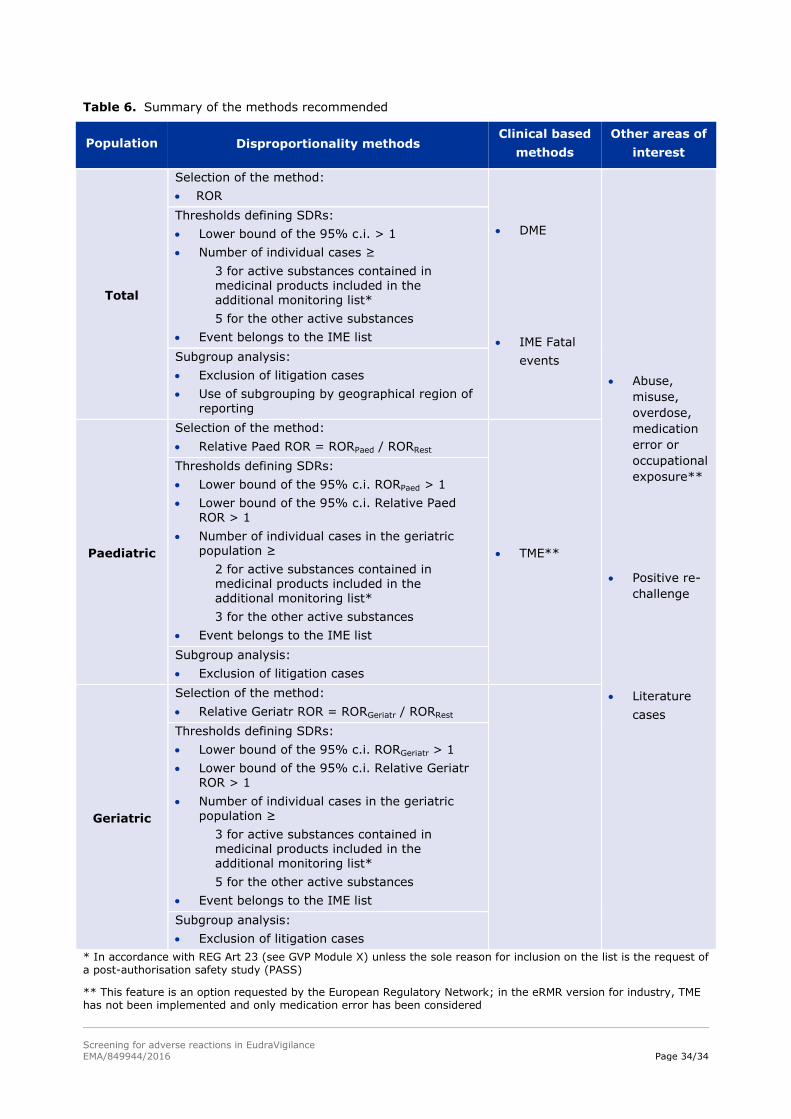
Screening for adverse reactions in EudraVigilance
EMA/849944/2016 Page 34/34
Table 6. Summary of the methods recommended
Population Disproportionality methods Clinical based
methods
Other areas of
interest
Total
Selection of the method:
ROR
DME
IME Fatal
events
Abuse,
misuse,
overdose,
medication
error or
occupational
exposure**
Positive re-
challenge
Literature
cases
Thresholds defining SDRs:
Lower bound of the 95% c.i. > 1
Number of individual cases ≥
3 for active substances contained in medicinal products included in the additional monitoring list*
5 for the other active substances
Event belongs to the IME list
Subgroup analysis:
Exclusion of litigation cases
Use of subgrouping by geographical region of reporting
Paediatric
Selection of the method:
Relative Paed ROR = RORPaed / RORRest
TME**
Thresholds defining SDRs:
Lower bound of the 95% c.i. RORPaed > 1
Lower bound of the 95% c.i. Relative Paed ROR > 1
Number of individual cases in the geriatric population ≥
2 for active substances contained in medicinal products included in the additional monitoring list*
3 for the other active substances
Event belongs to the IME list
Subgroup analysis:
Exclusion of litigation cases
Geriatric
Selection of the method:
Relative Geriatr ROR = RORGeriatr / RORRest
Thresholds defining SDRs:
Lower bound of the 95% c.i. RORGeriatr > 1
Lower bound of the 95% c.i. Relative Geriatr ROR > 1
Number of individual cases in the geriatric population ≥
3 for active substances contained in medicinal products included in the additional monitoring list*
5 for the other active substances
Event belongs to the IME list
Subgroup analysis:
Exclusion of litigation cases
* In accordance with REG Art 23 (see GVP Module X) unless the sole reason for inclusion on the list is the request of a post-authorisation safety study (PASS)
** This feature is an option requested by the European Regulatory Network; in the eRMR version for industry, TME has not been implemented and only medication error has been considered