Embed Size (px)
Citation preview
Scotland's Rural College
The challenge of modelling nitrogen management at the field scale: simulation andsensitivity analysis of N2O fluxes across nine experimental sites using DailyDayCentFitton, N; Datta, A; Hastings, A; Kuhnert, M; Topp, CFE; Cloy, JM; Rees, RM; Cardenas, LM;Williams, JR; Smith, K; Chadwick, D; Smith, PPublished in:Environmental Research Letters
DOI:10.1088/1748-9326/9/9/095003
First published: 08/09/2014
Document VersionPublisher's PDF, also known as Version of record
Link to publication
Citation for pulished version (APA):Fitton, N., Datta, A., Hastings, A., Kuhnert, M., Topp, CFE., Cloy, JM., Rees, RM., Cardenas, LM., Williams, JR.,Smith, K., Chadwick, D., & Smith, P. (2014). The challenge of modelling nitrogen management at the field scale:simulation and sensitivity analysis of N
2O fluxes across nine experimental sites using DailyDayCent.
Environmental Research Letters, 9(9 ), [095003]. https://doi.org/10.1088/1748-9326/9/9/095003
General rightsCopyright and moral rights for the publications made accessible in the public portal are retained by the authors and/or other copyright ownersand it is a condition of accessing publications that users recognise and abide by the legal requirements associated with these rights.
• Users may download and print one copy of any publication from the public portal for the purpose of private study or research. • You may not further distribute the material or use it for any profit-making activity or commercial gain • You may freely distribute the URL identifying the publication in the public portal ?
Take down policyIf you believe that this document breaches copyright please contact us providing details, and we will remove access to the work immediatelyand investigate your claim.
Download date: 14. Mar. 2022

Environmental Research Letters
PAPER • OPEN ACCESS
The challenge of modelling nitrogen managementat the field scale: simulation and sensitivityanalysis of N2O fluxes across nine experimentalsites using DailyDayCentTo cite this article: N Fitton et al 2014 Environ. Res. Lett. 9 095003
View the article online for updates and enhancements.
Related contentYield-scaled mitigation of ammoniaemission from N fertilization: the SpanishcaseA Sanz-Cobena, L Lassaletta, F Estelléset al.
-
Substantial N2O emissions from peatdecomposition and N fertilization in an oilpalm plantation exacerbated by hotspotsSatria Oktarita, Kristell Hergoualc’h,Syaiful Anwar et al.
-
Whole farm quantification of GHGemissions within smallholder farms indeveloping countriesMatthias Seebauer
-
Recent citationsMetrics of biomass, live-weight gain andnitrogen loss of ryegrass sheep pasture inthe 21st centuryAnita Shepherd et al
-
Modelling biological N fixation and grass-legume dynamics with process-basedbiogeochemical models of varyingcomplexityNuala Fitton et al
-
Martin S.A. Blackwell et al-
This content was downloaded from IP address 143.234.194.78 on 02/07/2019 at 14:07
The challenge of modelling nitrogenmanagement at the field scale: simulationand sensitivity analysis of N2O fluxes acrossnine experimental sites using DailyDayCent
N Fitton1, A Datta1,6, A Hastings1, M Kuhnert1, C F E Topp2, J M Cloy2,R M Rees2, L M Cardenas3, J R Williams4, K Smith4, D Chadwick5 andP Smith1
1 Institute of Biological and Environmental Sciences, University of Aberdeen, 23 St. Machar Drive,Aberdeen AB24 3UU, Scotland, UK2 SRUC Edinburgh, West Mains Road, Edinburgh EH9 3JG, UK3Rothamsted Research, North Wyke, Okehampton, Devon EX20 2SB, UK4ADAS, Battlegate Road, Boxworth, Cambridge CB23 4NN, UK5 School of Environment, Natural Resources and Geography, Bangor University, Deiniol Rd., Bangor,Gwynedd LL57 2UW, UK6Center for Environmental Studies, Earth Sciences and Climate Change Division, The Energy andResources Institute, Barbaru Seth Block, India Habitat Center, New Delhi 110003, India
E-mail: [email protected]
Received 27 May 2014, revised 25 July 2014Accepted for publication 25 July 2014Published 8 September 2014
AbstractThe United Kingdom currently reports nitrous oxide emissions from agriculture using the IPCCdefault Tier 1 methodology. However Tier 1 estimates have a large degree of uncertainty as theydo not account for spatial variations in emissions. Therefore biogeochemical models such asDailyDayCent (DDC) are increasingly being used to provide a spatially disaggregatedassessment of annual emissions. Prior to use, an assessment of the ability of the model to predictannual emissions should be undertaken, coupled with an analysis of how model inputs influencemodel outputs, and whether the modelled estimates are more robust that those derived from theTier 1 methodology. The aims of the study were (a) to evaluate if the DailyDayCent model canaccurately estimate annual N2O emissions across nine different experimental sites, (b) toexamine its sensitivity to different soil and climate inputs across a number of experimental sitesand (c) to examine the influence of uncertainty in the measured inputs on modelled N2Oemissions. DailyDayCent performed well across the range of cropland and grassland sites,particularly for fertilized fields indicating that it is robust for UK conditions. The sensitivity ofthe model varied across the sites and also between fertilizer/manure treatments. Overall ourresults showed that there was a stronger correlation between the sensitivity of N2O emissions tochanges in soil pH and clay content than the remaining input parameters used in this study. Thelower the initial site values for soil pH and clay content, the more sensitive DDC was to changesfrom their initial value. When we compared modelled estimates with Tier 1 estimates for eachsite, we found that DailyDayCent provided a more accurate representation of the rate of annualemissions.
Environmental Research Letters
Environ. Res. Lett. 9 (2014) 095003 (15pp) doi:10.1088/1748-9326/9/9/095003
Content from this work may be used under the terms of theCreative Commons Attribution 3.0 licence. Any further
distribution of this work must maintain attribution to the author(s) and thetitle of the work, journal citation and DOI.
1748-9326/14/095003+15$33.00 © 2014 IOP Publishing Ltd1
Keywords: DailyDayCent, nitrous oxide emissions, sensitivity and uncertainty analysis,Monte–Carlo simulations, UK croplands and grasslands
1. Introduction
Despite its relatively low atmospheric concentration, nitrousoxide (N2O) is an extremely important greenhouse gas (GHG)with a global warming potential of nearly 300 times that ofCO2. Concentrations of N2O in the atmosphere haveincreased to 324 ppb, which is approximately 20% higherthan pre-industrial level (Stocker et al 2013). Natural andmanaged soils are one of the principal sources of N2O, andincreasing pressure for food production has led to enhanced Ninputs via fertilizer application. This, in turn, has led to anincrease in N2O emissions (Jones et al 2007, Reayet al 2012). Recent estimates suggest that, despite a smalldecrease, total N2O emissions in the United Kingdom (UK) in2010 were approximately 112 Kt N2O–N, with emissionsfrom agricultural soils accounting for 77.5% of the totalemissions (National Atmospheric Emissions Inventory,2013). The UK is a signatory of the United Nations Con-vention on Climate Change (UNFFCC) and is obliged toreporting anthropogenic sources of GHG’s in a nationalinventory. Current reporting methods are based on updatedmethodologies developed by the Intergovernmental Panel onClimate Change (IPCC). For N2O emissions from soils, Tier 1default reporting assumes that between 0.3 and 3% of anysynthetic N applied to the soil is re-released as N2O–N(IPCC 2006). However, this methodology tends to produce arelatively large uncertainty of total emissions as it does not a)account for spatial variations in emissions, or b) allow for theinclusion of mitigation options other than those affecting totalN application (Abdalla et al 2010, Saggar et al 2007). Pro-cess-based models such as DailyDayCent (DDC) have beenconsidered for simulating GHG emissions across a range ofdifferent ecosystems and climate zones. Use of these modelsaim to improve inventory reporting to Tier 2 or 3 levels,which could potentially reduce the uncertainty in total emis-sions, and adequately reflect N2O emission reduction throughnitrogen management.
Prior to their use, an assessment of the suitability of themodel to simulate the GHG of interest is required, by com-paring modelled emissions with measured values. This shouldpreferably include a wide range of experimental sitesreflecting the range of climate, soil and management typesrepresented within a country. However, uncertainty in mea-sured inputs used to drive biogeochemical models can lead touncertainty in modelled outputs, due to the sensitivity of themodel to changes in inputs. Therefore, an understanding ofhow input uncertainty can propagate through the model, andthe interactions between inputs is essential (Ogle et al 2003,Hastings et al 2010, Del Grosso et al 2010, Fitton et al 2014).The aims of the study were (a) to evaluate if the DailyDay-Cent model can accurately estimate annual N2O emissionsacross nine different experimental sites (cropland and grass-land with a range of climate, soil and different rates and typesof nitrogen (N) fertilizer or manure application), (b) to
examine its sensitivity to different soil and climate inputsacross a number of experimental sites and (c) to examine theinfluence of uncertainty in the measured inputs on modelledN2O emissions.
2. Materials and methods
2.1. Experimental sites
Emissions of N2O (treatment replicate number (n) = 3) weremeasured at six cropland experimental sites; Boxworth, Ter-rington, Betley, Middleton, and two Gleadthorpe sites:Grange Field and Lamb Field using the static chambermethod (Chadwick et al 2014). The sites selected representN2O emissions from a range of different soil, climate, ferti-lizer types and rates were used across the cropland sites.Table 1 outlines the key soil and climate characteristics, croptype, fertilizer type and dates and rates of N application. Morespecific details on the experimental design for each site areoutlined in Smith et al (2011) and Dampney et al (2006)
The Boxworth and Terrington experimental sites weresub-divided into four plots with four treatment types; a con-trol and plots with ammonium nitrate (AN), urea ammoniumnitrate (UAN) and urea applied. The Betley and Middletonexperimental sites were split into a control and manureapplication plots, and both the Grange and Lamb Fieldexperimental sites were sub-divided into six plots, wherethere was an increasing target AN fertilizer application rate(table 1(a)). Emissions of N2O were also measured from threegrazed grassland sites: Crichton, Rowden and Debath. Aswith the cropland sites, each grassland site was sub-dividedinto a control and different fertilizer treatments, details ofwhich are outlined in table 1(b).
2.2. DailyDayCent model overview and validation
DailyDayCent (DDC) is a daily time-step version of theCentury model which simulates the fluxes of C and Nbetween the atmosphere, soil and vegetation (Partonet al 1998). The key sub-models in DDC include soil organicmatter pools (SOM), microbial pool, the water budget,leaching and soil temperature sub-model, as well as a Nsub–model. DDC also includes plant growth with dynamic Callocation among the above- and below-ground biomasspools. Soil carbon is distributed in a microbial pool and threeSOM pools that have three distinct decomposition rates,where C and N fluxes are simulated through the plant litterand organic pools (Parton et al 1998). In addition, N2O fluxesare controlled by soil NH4
+ and NO3− concentrations, water
content, temperature, gas diffusivity and labile C availability(Parton et al 1998). DDC uses a daily time-step, which iscontrolled by a scheduling file where fertilization, harvest andtillage events are scheduled for the dates when they occurred
2
Environ. Res. Lett. 9 (2014) 095003 N Fitton et al

during the experimental period and also, if required, over thepreceding years.
Due to the differences in climate, soil and historic landmanagement, modelled estimates of N2O for each site dif-fered from each other, especially in response to the timing andtype of management. However, for each site DDC was cali-brated by initially establishing soil carbon (C) equilibrium.
This was then followed by a period of appropriate crop orgrassland management with nitrogen (N) input, such as fer-tilizer application, to ensure that soil mineral N was not alimiting factor during the pre-experimental period. This wasthen followed by site-specific management for the time periodprior to and including the experimental measurements, wheresite specific information was available. Other than site-
Table 1. Soil, climate and management information for each of the (a) cropland and (b) grassland experimental sites used in this study.
Site nameExperimentperiod Temperaturea Precipitationa
SoilpH
Bulkdensity Soil type
Croptype
Fertilizertypes
Amount of fer-tilizer appliedd
(a)Cropland
°C mm g cm−3
Boxworth 9/3/2005–21/9/2005
10.1 556 8.2 1.2 Calcareousclay
Winterwheat
Control,AN,UAN,ureab
160 kg N yr−1
(40, 60, 60)
Terrington 1/3/2004–17/2/2005
10.8 672 8.1 1.38 Siltyclay loam
Winterwheat
Control,AN,UAN,ureab
220] kg N yr−1
(40, 90, 90)
Betley 4/11/2004–18/10/2005
10.1 625 6.5 1.09 Sandy loam Winterwheat
Control,cattleslurry(C/N= 15)
113 kg N yr−1
(113)
Middleton 5/4/2005–4/4/2006
9.6 769 7.5 0.93 Siltyclay loam
Winterwheat
Control,pigslurry(C/N= 20)
48 kg N yr−1
(48)
GrangeField
27/2/2008–10/3/2009
9.5 625 6 1.12 Sandysilt loam
Winterwheat
Control,70,140,210,280,350c
Lamb Field 19/2/2007–4/3/2008
9.4 645 5.8 1.42 Loamysand
Winterbarley
Control,70,140,210,280,350c
(b)Grassland
Crichton 10/3/2004–26/1/2005
8.9 1079 6.3 1.3 Sandy loam Grass Control,AN,UAS,urea
220 kg N yr−1
(40, 80, 100)
Rowden 2/3/2004–9/2/2005
10.1 1039 6.1 1.2 Siltyclay loam
Grass Control,AN,UAS,urea
300 kg N yr−1
(40, 80,100, 80)
Debathe 28/2/2005–2/9/2005
10.1 1039 6.7 1.6 Coarsesandyloam
Grass Control,AN,urea
120 kg N yr−1
(40, 80)
a
Long term average.b
AN is Ammonium nitrate, UAN is urea ammonium nitrate and UAS is urea ammonium sulphate.c
Indicates a target application rate of x kg of ammonium nitrate applied per hectare per year.d
Values in brackets indicate the rate of fertilizer applied on the first, second, third or fourth application dates.
3
Environ. Res. Lett. 9 (2014) 095003 N Fitton et al
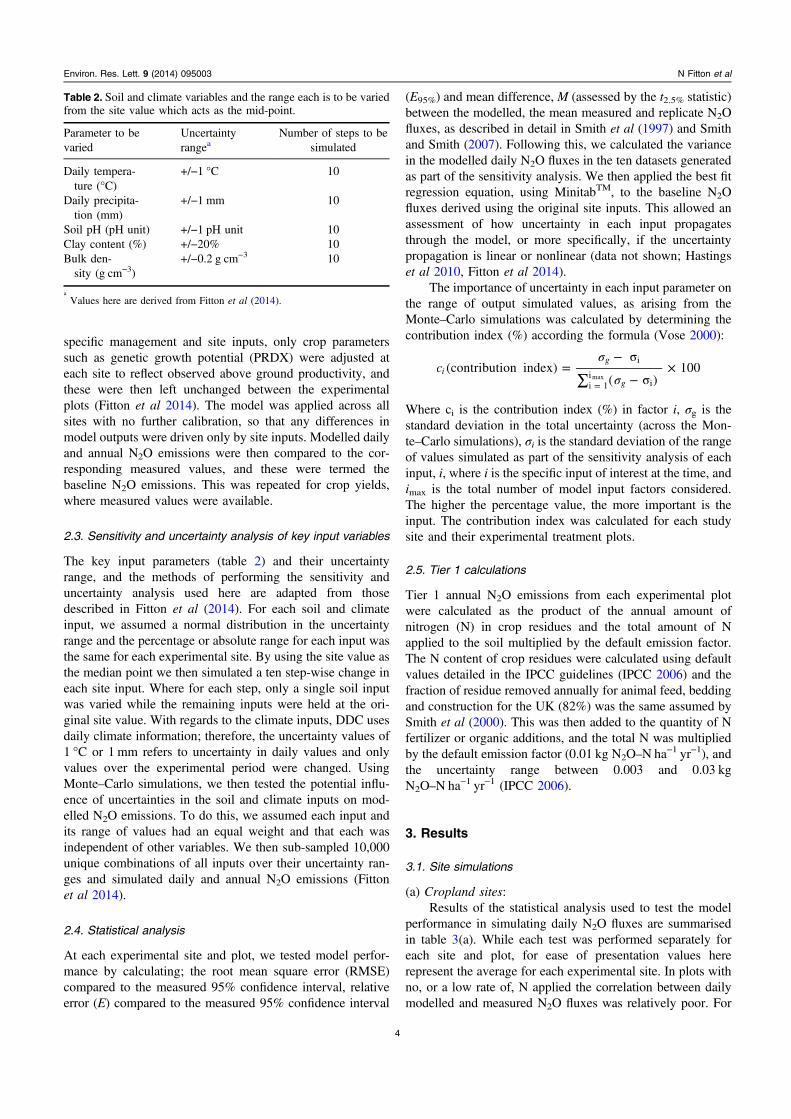
specific management and site inputs, only crop parameterssuch as genetic growth potential (PRDX) were adjusted ateach site to reflect observed above ground productivity, andthese were then left unchanged between the experimentalplots (Fitton et al 2014). The model was applied across allsites with no further calibration, so that any differences inmodel outputs were driven only by site inputs. Modelled dailyand annual N2O emissions were then compared to the cor-responding measured values, and these were termed thebaseline N2O emissions. This was repeated for crop yields,where measured values were available.
2.3. Sensitivity and uncertainty analysis of key input variables
The key input parameters (table 2) and their uncertaintyrange, and the methods of performing the sensitivity anduncertainty analysis used here are adapted from thosedescribed in Fitton et al (2014). For each soil and climateinput, we assumed a normal distribution in the uncertaintyrange and the percentage or absolute range for each input wasthe same for each experimental site. By using the site value asthe median point we then simulated a ten step-wise change ineach site input. Where for each step, only a single soil inputwas varied while the remaining inputs were held at the ori-ginal site value. With regards to the climate inputs, DDC usesdaily climate information; therefore, the uncertainty values of1 °C or 1 mm refers to uncertainty in daily values and onlyvalues over the experimental period were changed. UsingMonte–Carlo simulations, we then tested the potential influ-ence of uncertainties in the soil and climate inputs on mod-elled N2O emissions. To do this, we assumed each input andits range of values had an equal weight and that each wasindependent of other variables. We then sub-sampled 10,000unique combinations of all inputs over their uncertainty ran-ges and simulated daily and annual N2O emissions (Fittonet al 2014).
2.4. Statistical analysis
At each experimental site and plot, we tested model perfor-mance by calculating; the root mean square error (RMSE)compared to the measured 95% confidence interval, relativeerror (E) compared to the measured 95% confidence interval
(E95%) and mean difference, M (assessed by the t2.5% statistic)between the modelled, the mean measured and replicate N2Ofluxes, as described in detail in Smith et al (1997) and Smithand Smith (2007). Following this, we calculated the variancein the modelled daily N2O fluxes in the ten datasets generatedas part of the sensitivity analysis. We then applied the best fitregression equation, using MinitabTM, to the baseline N2Ofluxes derived using the original site inputs. This allowed anassessment of how uncertainty in each input propagatesthrough the model, or more specifically, if the uncertaintypropagation is linear or nonlinear (data not shown; Hastingset al 2010, Fitton et al 2014).
The importance of uncertainty in each input parameter onthe range of output simulated values, as arising from theMonte–Carlo simulations was calculated by determining thecontribution index (%) according the formula (Vose 2000):
σ
σ=
− σ
∑ − σ×
=
c (contribution index)( )
100ig
g
i
i 1i
imax
Where ci is the contribution index (%) in factor i, σg is thestandard deviation in the total uncertainty (across the Mon-te–Carlo simulations), σi is the standard deviation of the rangeof values simulated as part of the sensitivity analysis of eachinput, i, where i is the specific input of interest at the time, andimax is the total number of model input factors considered.The higher the percentage value, the more important is theinput. The contribution index was calculated for each studysite and their experimental treatment plots.
2.5. Tier 1 calculations
Tier 1 annual N2O emissions from each experimental plotwere calculated as the product of the annual amount ofnitrogen (N) in crop residues and the total amount of Napplied to the soil multiplied by the default emission factor.The N content of crop residues were calculated using defaultvalues detailed in the IPCC guidelines (IPCC 2006) and thefraction of residue removed annually for animal feed, beddingand construction for the UK (82%) was the same assumed bySmith et al (2000). This was then added to the quantity of Nfertilizer or organic additions, and the total N was multipliedby the default emission factor (0.01 kg N2O–N ha−1 yr−1), andthe uncertainty range between 0.003 and 0.03 kgN2O–N ha−1 yr−1 (IPCC 2006).
3. Results
3.1. Site simulations
(a) Cropland sites:Results of the statistical analysis used to test the model
performance in simulating daily N2O fluxes are summarisedin table 3(a). While each test was performed separately foreach site and plot, for ease of presentation values hererepresent the average for each experimental site. In plots withno, or a low rate of, N applied the correlation between dailymodelled and measured N2O fluxes was relatively poor. For
Table 2. Soil and climate variables and the range each is to be variedfrom the site value which acts as the mid-point.
Parameter to bevaried
Uncertaintyrangea
Number of steps to besimulated
Daily tempera-ture (°C)
+/−1 °C 10
Daily precipita-tion (mm)
+/−1 mm 10
Soil pH (pH unit) +/−1 pH unit 10Clay content (%) +/−20% 10Bulk den-sity (g cm−3)
+/−0.2 g cm−3 10
a
Values here are derived from Fitton et al (2014).
4
Environ. Res. Lett. 9 (2014) 095003 N Fitton et al
example, in the Terrington and Boxworth control plots, thecoefficient of determination of the linear regression wasR2 =−0.01 and R2 = 0.14, respectively. The exception to thiswas the Betley experimental site, where modelled estimatescorrelated well with measured values. As N application ratesincreased, the correlation coefficient improved. In addition,across all plots and sites, when replicate measured valueswere considered there was no statistically significant totalerror (RMSE) or bias (M with t-test) when compared tomeasured estimates (table 3(a)).
The average rate of annual N2O emissions across allcropland sites was 2 kg N2O–N ha−1 yr−1 (standard deviation:1.03 kg N2O–N ha−1 yr−1). The highest rate of annual N2Oemissions was recorded at the Gleadthorpe Lamb Fieldexperimental plot (3.8 kg N2O–N ha−1 yr−1) with a fertilizerapplication rate of 350 kg N ha−1 yr−1. The lowest measuredannual N2O emissions were recorded at the Middleton controlplot (0.41 kg N2O–N ha−1 yr−1). DailyDayCent was able toprovide a good estimate of annual emissions of N2O and areasonable estimate of crop yields across the six croplandexperimental sites. For N2O emissions there was a 50:50 splitbetween over or underestimation of annual N2O emissions(figure 1(a)), showing that any error is not systematic. In sitessuch as Boxworth and Terrington which had a higher pH,average annual temperature and clay content relative to theother sites, DDC tended to underestimate average annualemissions. In the other sites, which are characterised by lowerclay contents, DDC tended to overestimate average annualN2O emissions. Yield estimates were also collated for each ofthe experimental sites. As with N2O fluxes, yield values werealso variable due to the variation in the amount and type of Napplied. The highest yield of either winter wheat or winterbarley was measured at the Boxworth AN experimental plot(9.86Mg ha−1) and the lowest yield was measured in theTerrington control plot (4.68 Mg ha−1). DDC was able to
provide a reasonable estimate of annual yields (figure 1(b)),with R2 values between modelled and measured values lowerthan for N2O estimates. Overall DDC tended to underestimatelow yields, but provided better simulation of higher yields.
(b) Grassland sites:As with the cropland sites, the correlation between
measured and modelled N2O fluxes was poor in the controlplots (table 3(b)). For some sites (e.g. Debathe), even whenN-fertilizer was applied, there was still a poor correlationbetween measured and modelled N2O fluxes. This was pri-marily due to periods of estimated uptake of N2O from theatmosphere, a process not included yet in any process-basedmodel. DDC therefore simulated a very low rate of N2Oemissions over the same period. Despite these discrepancies,there was no statistically significant total error (RMSE) orbias (M with t-test) when compared to measured estimates.
The average annual emissions across all the grasslandexperimental plots were of a similar magnitude to croplandsat 2.9 kg N2O–N ha−1 yr−1. The highest measured annualemissions was 8.2 kg N2O–N ha−1 yr−1 recorded in theRowden AN experimental plot. The lowest annual valuesindicated there was an uptake of −0.14 kg N2O–N ha−1 yr−1 atthe Debathe control plot. The standard deviation in the rangeof values was also higher than across all the cropland sites at2.89 kg N2O–N ha−1 yr−1. With the exception of the Rowdencontrol and AN experimental plots, DDC tended to over-estimate N2O emissions. However, when we directly com-pared all modelled and measured annual N2O emissionsacross all plots (figure 1(c)) the correlation coefficient (R2)was 0.84. Yield estimates were not available for the grasslandsites.
3.2. Sensitivity analysis
(i) Variation in model sensitivity by site(a) Cropland sites
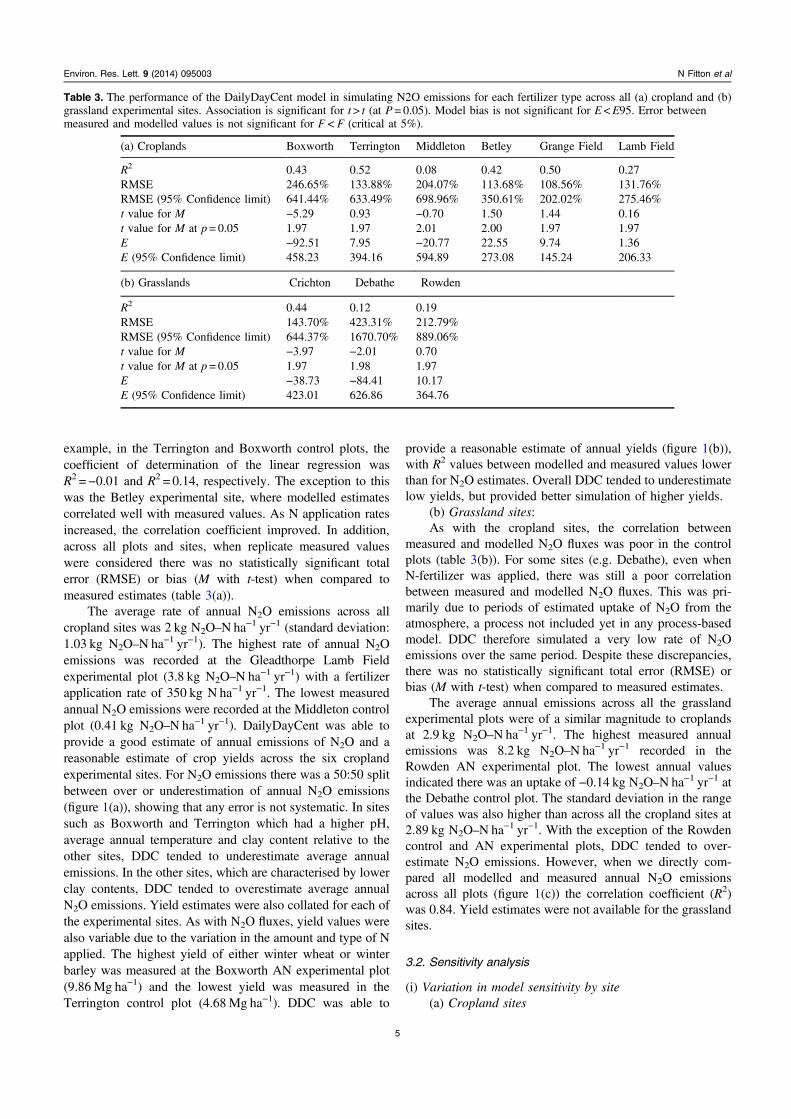
Table 3. The performance of the DailyDayCent model in simulating N2O emissions for each fertilizer type across all (a) cropland and (b)grassland experimental sites. Association is significant for t> t (at P= 0.05). Model bias is not significant for E<E95. Error betweenmeasured and modelled values is not significant for F<F (critical at 5%).
(a) Croplands Boxworth Terrington Middleton Betley Grange Field Lamb Field
R2 0.43 0.52 0.08 0.42 0.50 0.27RMSE 246.65% 133.88% 204.07% 113.68% 108.56% 131.76%RMSE (95% Confidence limit) 641.44% 633.49% 698.96% 350.61% 202.02% 275.46%t value for M −5.29 0.93 −0.70 1.50 1.44 0.16t value for M at p= 0.05 1.97 1.97 2.01 2.00 1.97 1.97E −92.51 7.95 −20.77 22.55 9.74 1.36E (95% Confidence limit) 458.23 394.16 594.89 273.08 145.24 206.33
(b) Grasslands Crichton Debathe Rowden
R2 0.44 0.12 0.19RMSE 143.70% 423.31% 212.79%RMSE (95% Confidence limit) 644.37% 1670.70% 889.06%t value for M −3.97 −2.01 0.70t value for M at p= 0.05 1.97 1.98 1.97E −38.73 −84.41 10.17E (95% Confidence limit) 423.01 626.86 364.76
5
Environ. Res. Lett. 9 (2014) 095003 N Fitton et al
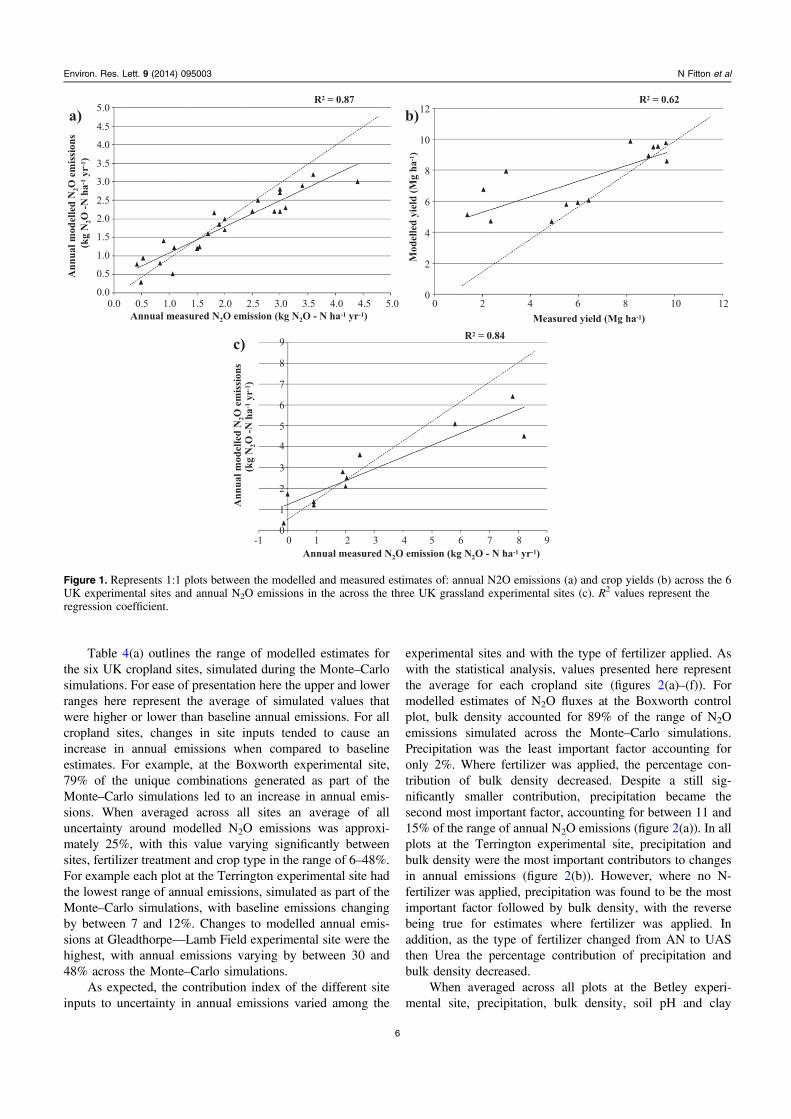
Table 4(a) outlines the range of modelled estimates forthe six UK cropland sites, simulated during the Monte–Carlosimulations. For ease of presentation here the upper and lowerranges here represent the average of simulated values thatwere higher or lower than baseline annual emissions. For allcropland sites, changes in site inputs tended to cause anincrease in annual emissions when compared to baselineestimates. For example, at the Boxworth experimental site,79% of the unique combinations generated as part of theMonte–Carlo simulations led to an increase in annual emis-sions. When averaged across all sites an average of alluncertainty around modelled N2O emissions was approxi-mately 25%, with this value varying significantly betweensites, fertilizer treatment and crop type in the range of 6–48%.For example each plot at the Terrington experimental site hadthe lowest range of annual emissions, simulated as part of theMonte–Carlo simulations, with baseline emissions changingby between 7 and 12%. Changes to modelled annual emis-sions at Gleadthorpe—Lamb Field experimental site were thehighest, with annual emissions varying by between 30 and48% across the Monte–Carlo simulations.
As expected, the contribution index of the different siteinputs to uncertainty in annual emissions varied among the
experimental sites and with the type of fertilizer applied. Aswith the statistical analysis, values presented here representthe average for each cropland site (figures 2(a)–(f)). Formodelled estimates of N2O fluxes at the Boxworth controlplot, bulk density accounted for 89% of the range of N2Oemissions simulated across the Monte–Carlo simulations.Precipitation was the least important factor accounting foronly 2%. Where fertilizer was applied, the percentage con-tribution of bulk density decreased. Despite a still sig-nificantly smaller contribution, precipitation became thesecond most important factor, accounting for between 11 and15% of the range of annual N2O emissions (figure 2(a)). In allplots at the Terrington experimental site, precipitation andbulk density were the most important contributors to changesin annual emissions (figure 2(b)). However, where no N-fertilizer was applied, precipitation was found to be the mostimportant factor followed by bulk density, with the reversebeing true for estimates where fertilizer was applied. Inaddition, as the type of fertilizer changed from AN to UASthen Urea the percentage contribution of precipitation andbulk density decreased.
When averaged across all plots at the Betley experi-mental site, precipitation, bulk density, soil pH and clay
R2 = 0.87
R2 = 0.84
R2 = 0.625.0
4.5
4.0
3.5
3.0
2.5
2.0
1.5
1.0
0.5
0.00.0 0.5 1.0 1.5 2.0 2.5 3.0 3.5 4.0 4.5 5.0
12
12
10
10
8
8
6
6
4
4
2
200
00
1
1
2
2
3
3
4
4
5
5
6
6
7
7
8
8
9
9-1
Measured yield (Mg ha-1)
Mod
elle
d yi
eld
(Mg
ha-1)
Annual measured N2O emission (kg N2O - N ha-1 yr-1)
Ann
ual m
odel
led
N2O
em
issi
ons
Annual measured N2O emission (kg N2O - N ha-1 yr-1)
(kg
N2O
-N h
a-1 y
r-1)
Ann
ual m
odel
led
N2O
em
issi
ons
(kg
N2O
-N h
a-1 y
r-1)
a) b)
c)
Figure 1. Represents 1:1 plots between the modelled and measured estimates of: annual N2O emissions (a) and crop yields (b) across the 6UK experimental sites and annual N2O emissions in the across the three UK grassland experimental sites (c). R2 values represent theregression coefficient.
6
Environ. Res. Lett. 9 (2014) 095003 N Fitton et al
content accounted for an almost equal portion of modelledvalues (figure 2(c)). Temperature was the least importantfactor in modelled estimates regardless of manure application;however, the order of importance of the remaining inputsvaried between both plots. Where manure was applied, theorder of importance of the different inputs was: soilpH (25%), precipitation (24%), bulk density (24%) and claycontent (23%). In the control plot, precipitation accounted for
44% followed by bulk density (24%) and soil pH (15%).Unlike other sites, at the Middleton experimental site therewas no difference in the order of importance of the soil andclimate inputs between modelled values at the control site andwhere manure was applied (figure 2(d)). Precipitation wasfound to be the most important factor, accounting for 44% ofthe range of modelled estimates followed by temperature(35%) and bulk density (18%). Both clay and soil
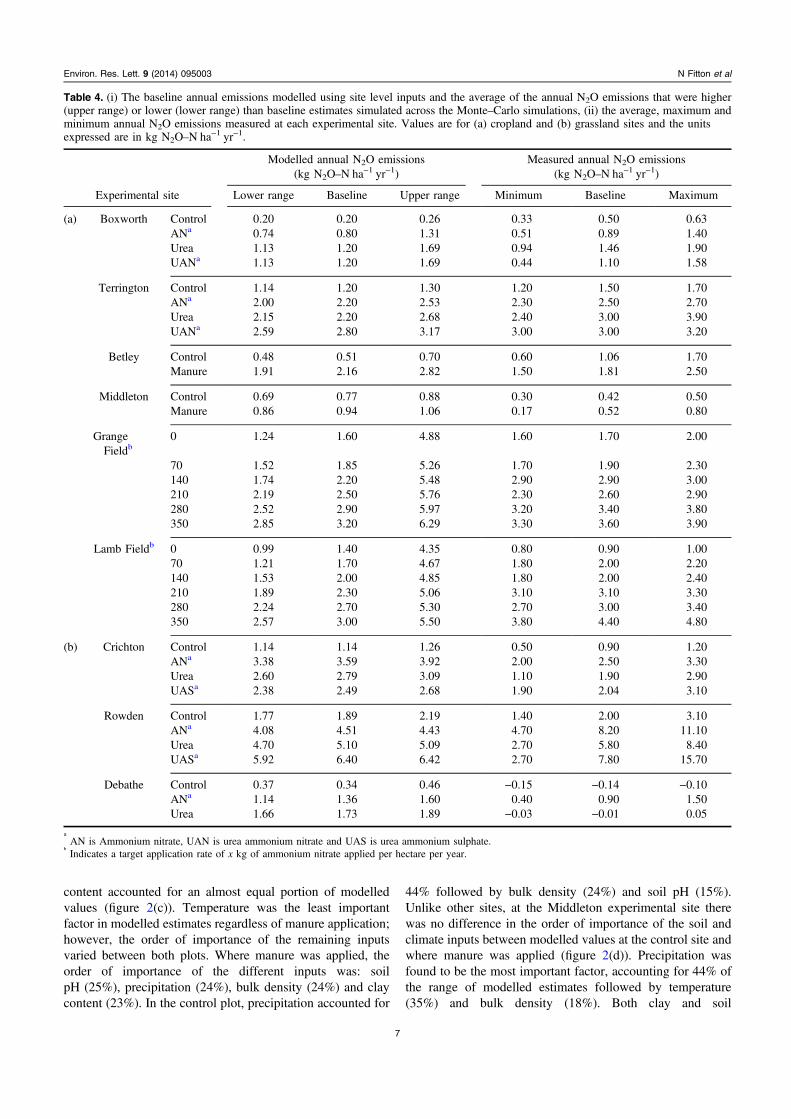
Table 4. (i) The baseline annual emissions modelled using site level inputs and the average of the annual N2O emissions that were higher(upper range) or lower (lower range) than baseline estimates simulated across the Monte–Carlo simulations, (ii) the average, maximum andminimum annual N2O emissions measured at each experimental site. Values are for (a) cropland and (b) grassland sites and the unitsexpressed are in kg N2O–N ha−1 yr−1.
Modelled annual N2O emissions(kg N2O–N ha−1 yr−1)
Measured annual N2O emissions(kg N2O–N ha−1 yr−1)
Experimental site Lower range Baseline Upper range Minimum Baseline Maximum
(a) Boxworth Control 0.20 0.20 0.26 0.33 0.50 0.63ANa 0.74 0.80 1.31 0.51 0.89 1.40Urea 1.13 1.20 1.69 0.94 1.46 1.90UANa 1.13 1.20 1.69 0.44 1.10 1.58
Terrington Control 1.14 1.20 1.30 1.20 1.50 1.70ANa 2.00 2.20 2.53 2.30 2.50 2.70Urea 2.15 2.20 2.68 2.40 3.00 3.90UANa 2.59 2.80 3.17 3.00 3.00 3.20
Betley Control 0.48 0.51 0.70 0.60 1.06 1.70Manure 1.91 2.16 2.82 1.50 1.81 2.50
Middleton Control 0.69 0.77 0.88 0.30 0.42 0.50Manure 0.86 0.94 1.06 0.17 0.52 0.80
GrangeFieldb
0 1.24 1.60 4.88 1.60 1.70 2.00
70 1.52 1.85 5.26 1.70 1.90 2.30140 1.74 2.20 5.48 2.90 2.90 3.00210 2.19 2.50 5.76 2.30 2.60 2.90280 2.52 2.90 5.97 3.20 3.40 3.80350 2.85 3.20 6.29 3.30 3.60 3.90
Lamb Fieldb 0 0.99 1.40 4.35 0.80 0.90 1.0070 1.21 1.70 4.67 1.80 2.00 2.20140 1.53 2.00 4.85 1.80 2.00 2.40210 1.89 2.30 5.06 3.10 3.10 3.30280 2.24 2.70 5.30 2.70 3.00 3.40350 2.57 3.00 5.50 3.80 4.40 4.80
(b) Crichton Control 1.14 1.14 1.26 0.50 0.90 1.20ANa 3.38 3.59 3.92 2.00 2.50 3.30Urea 2.60 2.79 3.09 1.10 1.90 2.90UASa 2.38 2.49 2.68 1.90 2.04 3.10
Rowden Control 1.77 1.89 2.19 1.40 2.00 3.10ANa 4.08 4.51 4.43 4.70 8.20 11.10Urea 4.70 5.10 5.09 2.70 5.80 8.40UASa 5.92 6.40 6.42 2.70 7.80 15.70
Debathe Control 0.37 0.34 0.46 −0.15 −0.14 −0.10ANa 1.14 1.36 1.60 0.40 0.90 1.50Urea 1.66 1.73 1.89 −0.03 −0.01 0.05
a
AN is Ammonium nitrate, UAN is urea ammonium nitrate and UAS is urea ammonium sulphate.b
Indicates a target application rate of x kg of ammonium nitrate applied per hectare per year.
7
Environ. Res. Lett. 9 (2014) 095003 N Fitton et al
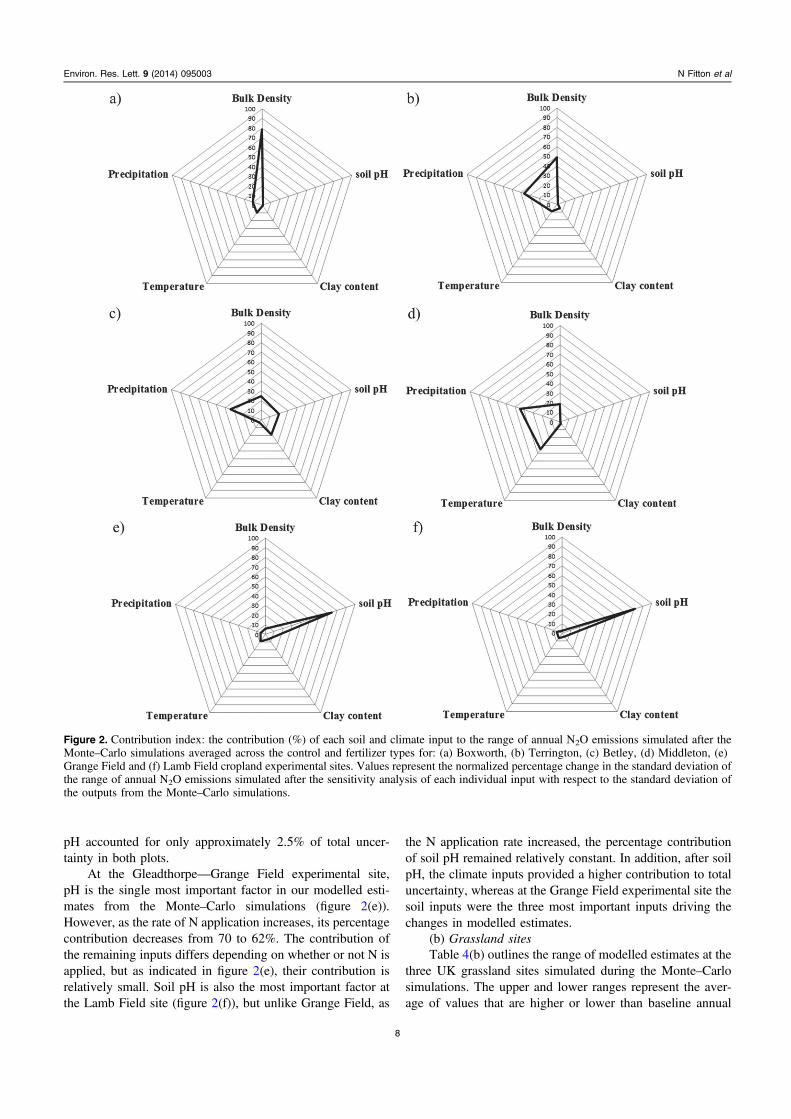
pH accounted for only approximately 2.5% of total uncer-tainty in both plots.
At the Gleadthorpe—Grange Field experimental site,pH is the single most important factor in our modelled esti-mates from the Monte–Carlo simulations (figure 2(e)).However, as the rate of N application increases, its percentagecontribution decreases from 70 to 62%. The contribution ofthe remaining inputs differs depending on whether or not N isapplied, but as indicated in figure 2(e), their contribution isrelatively small. Soil pH is also the most important factor atthe Lamb Field site (figure 2(f)), but unlike Grange Field, as
the N application rate increased, the percentage contributionof soil pH remained relatively constant. In addition, after soilpH, the climate inputs provided a higher contribution to totaluncertainty, whereas at the Grange Field experimental site thesoil inputs were the three most important inputs driving thechanges in modelled estimates.
(b) Grassland sitesTable 4(b) outlines the range of modelled estimates at the
three UK grassland sites simulated during the Monte–Carlosimulations. The upper and lower ranges represent the aver-age of values that are higher or lower than baseline annual
Figure 2. Contribution index: the contribution (%) of each soil and climate input to the range of annual N2O emissions simulated after theMonte–Carlo simulations averaged across the control and fertilizer types for: (a) Boxworth, (b) Terrington, (c) Betley, (d) Middleton, (e)Grange Field and (f) Lamb Field cropland experimental sites. Values represent the normalized percentage change in the standard deviation ofthe range of annual N2O emissions simulated after the sensitivity analysis of each individual input with respect to the standard deviation ofthe outputs from the Monte–Carlo simulations.
8
Environ. Res. Lett. 9 (2014) 095003 N Fitton et al

emissions. Across the different grassland sites, baseline esti-mates at the Crichton site tended to fall in the middle of therange of values simulated across the Monte–Carlo simula-tions. In contrast, at the Rowden and Debathe experimentalsites, baseline emissions fell in the upper range of valuessimulated.
When averaged across all plots at Crichton, precipitation,temperature and bulk density are the three most importantinputs, with these accounting for 83% of the range of valuessimulated as part of the Monte–Carlo simulations(figure 3(a)). The order of the importance of these changedbetween the control and different N fertilizer plots i.e. thepercentage contribution these three inputs always accounts forbetween 82 and 98% of the range of modelled emissions.Changes in bulk density, clay content and precipitationaccounted for most of the range of annual N2O emissionssimulated at the Rowden experimental site (figure 3(b)).Where N-fertilizer was applied, precipitation and clay contenttended to be the most important factors, accounting forbetween 56 and 63% of the variation in annual emissionsbetween them. However, where no N was applied, bulkdensity and temperature were the most important factors.Changes in soil pH accounted for 42% of the change in
emissions at the Debathe experimental site (figure 3(c)) fol-lowed by temperature, bulk density and precipitation. Unlikethe other grassland sites, the order of the importance did notsignificantly change with N application, nor did the percen-tage contribution of these inputs to total uncertainty.
(ii) Variation in the sensitivity by fertilizer type(a) Cropland sitesThe contribution of the different inputs to uncertainty in
annual emissions, across the experimental plots with the sametype of fertilizer applied is outlined in figure 4. In the controlplots there is an almost equal split in the importance of thedifferent inputs: soil pH, bulk density and precipitation whichcontribute 30, 28 and 27% (figure 4(a)). In the experimentalplots with UAN and Urea applied, bulk density was the mostimportant factor accounting for 40 and 64% of the variation inthe Monte–Carlo simulations (figures 4(c), (d)). This wasdriven by the sensitivity of DDC to changes in bulk density atthe Boxworth experimental site. Soil pH is the most importantfactor for plots with AN applied, which accounts for 64% ofthe range of annual emissions (figure 3(b)). This importanceis primarily due to the sensitivity of DDC to soil pH at theGrange and Lamb Field experimental sites. With regards tomanure application, the precipitation and temperature were
Figure 3. Contribution index: the contribution (%) of each soil and climate input to the range of annual N2O emissions simulated after theMonte–Carlo simulations averaged across the control and fertilizer types for: (a) Crichton, (b) Rowden and (c) Debathe grasslandexperimental sites. Values represent the normalized percentage change in the standard deviation of the range of annual N2O emissionssimulated after the sensitivity analysis of each individual input with respect to the standard deviation of the outputs from the Monte–Carlosimulations.
9
Environ. Res. Lett. 9 (2014) 095003 N Fitton et al
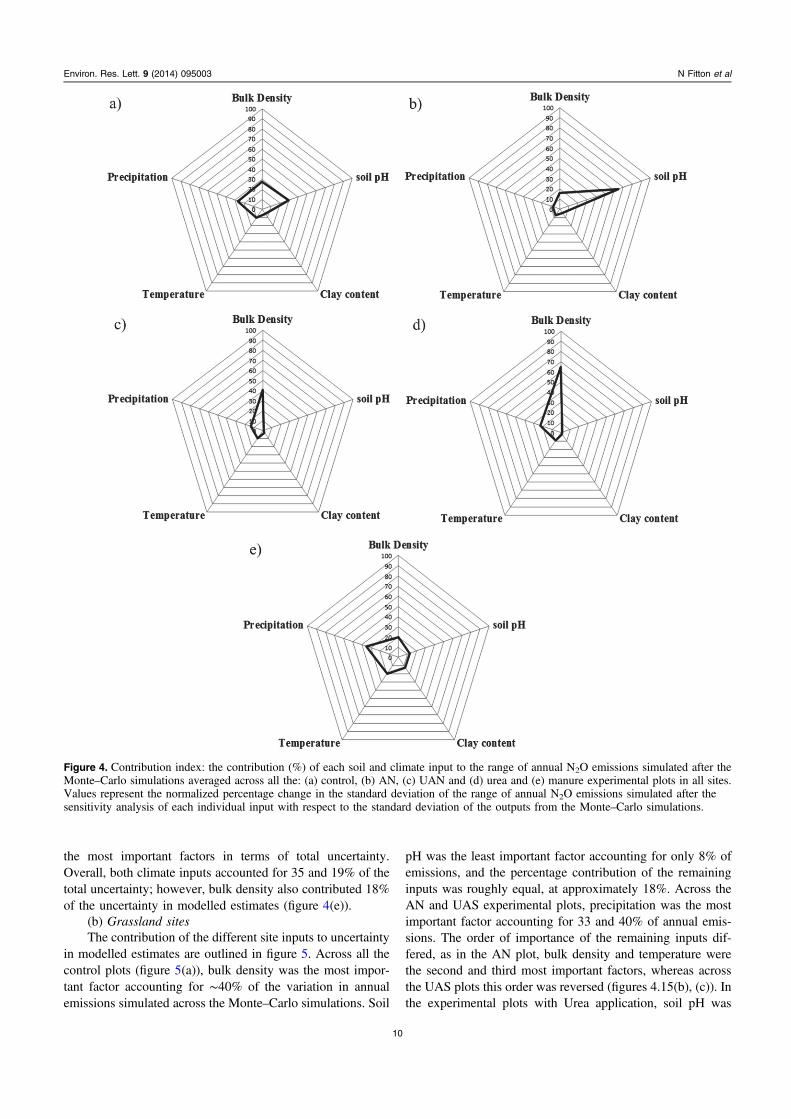
the most important factors in terms of total uncertainty.Overall, both climate inputs accounted for 35 and 19% of thetotal uncertainty; however, bulk density also contributed 18%of the uncertainty in modelled estimates (figure 4(e)).
(b) Grassland sitesThe contribution of the different site inputs to uncertainty
in modelled estimates are outlined in figure 5. Across all thecontrol plots (figure 5(a)), bulk density was the most impor-tant factor accounting for ∼40% of the variation in annualemissions simulated across the Monte–Carlo simulations. Soil
pH was the least important factor accounting for only 8% ofemissions, and the percentage contribution of the remaininginputs was roughly equal, at approximately 18%. Across theAN and UAS experimental plots, precipitation was the mostimportant factor accounting for 33 and 40% of annual emis-sions. The order of importance of the remaining inputs dif-fered, as in the AN plot, bulk density and temperature werethe second and third most important factors, whereas acrossthe UAS plots this order was reversed (figures 4.15(b), (c)). Inthe experimental plots with Urea application, soil pH was
Figure 4. Contribution index: the contribution (%) of each soil and climate input to the range of annual N2O emissions simulated after theMonte–Carlo simulations averaged across all the: (a) control, (b) AN, (c) UAN and (d) urea and (e) manure experimental plots in all sites.Values represent the normalized percentage change in the standard deviation of the range of annual N2O emissions simulated after thesensitivity analysis of each individual input with respect to the standard deviation of the outputs from the Monte–Carlo simulations.
10
Environ. Res. Lett. 9 (2014) 095003 N Fitton et al

deemed to be the most important factor accounting for 29% ofthe range in annual estimates. Precipitation (23%), bulkdensity (22%) and temperature (18%) were the next mostimportant factors, where their percentage contribution to totaluncertainty was of the same magnitude (figure 5(d)).
3.3. Tier 1 emission calculations
Figures 6(a), (b) represents a 1:1 plot between measuredannual N2O emissions and annual emissions calculated usingthe Tier 1 methods, and the default emission factor of 0.01 kgN2O–N ha−1 yr−1 in all cropland and grassland experimentalplots, respectively. For the cropland sites, Tier 1 emission
Figure 5. Contribution index: the contribution (%) of each soil and climate input to the range of annual N2O emissions simulated after theMonte–Carlo simulations averaged across all the: (a) control, (b) AN, (c) UAN and (d) urea experimental plots in all grassland sites. Valuesrepresent the normalized percentage change in the standard deviation of the range of annual N2O emissions simulated after the sensitivityanalysis of each individual input with respect to the standard deviation of the outputs from the Monte–Carlo simulations.
5.0
4.5
4.0
3.5
3.0
2.5
2.0
1.5
1.0
0.5
0.00.0 0.5 1.0 1.5 2.0 2.5 3.0 3.5 4.0 4.5 5.0
0.0
1.0
2.0
3.0
4.0
5.0
6.0
7.0
8.0
9.0
0.0 1.0 2.0 3.0 4.0 5.0 6.0 7.0 8.0 9.0-1.0
R2 = 0.72 R2 = 0.64
Annual measured N2O emission (kg N2O - N ha-1 yr-1) Annual measured N2O emission (kg N2O - N ha-1 yr-1)
Tier
1 a
nnua
l N2O
em
issi
ons
(kg
N2O
-N h
a-1 y
r-1)
Tier
1 a
nnua
l N2O
em
issi
ons
(kg
N2O
-N h
a-1 y
r-1)
a) b)
Figure 6. Represents a 1:1 plot between the measured and Tier 1 estimated annual N2O emissions across the (a) six UK croplandexperimental sites and plots and (b) the three UK grassland experimental sites and plots. R2 values represent the regression coefficient.
11
Environ. Res. Lett. 9 (2014) 095003 N Fitton et al
factors tended to underestimate annual emissions by anaverage of 32%, with the large differences occurring in esti-mated annual emissions in plots with no N applied. Theregression coefficient (R2) between measured and Tier 1values was 0.65 (figure 6(a)). The exception to this was at theBoxworth sites (except for the control plot), the TerringtonAN plot, both Middleton plots, the Grange Field 210 and350 kg N ha−1 plots. Here annual emissions, as calculatedusing Tier 1 methodology, tended to be double the corre-sponding measured values. When we assumed that 0.3% of Napplied is emitted, (lower uncertainty range), Tier 1 metho-dology underestimated annual emissions in all sites by anaverage of 70%. Where we assumed a 3% rate of emission(higher uncertainty range), Tier 1 methodology overestimatedannual emissions by an average of 43%.
In the grassland sites, there was a 50:50 split betweenunder or over-estimation of annual emissions using the Tier 1method. This was because, at the Debathe experimental siteand the control plot at each site, Tier 1 estimations wereconsistently higher. Whereas in the Rowden plot, Tier 1estimations were consistently lower and at Crichton there wasa 50:50 split (figure 6(b)). When we assumed 0.3% of Napplied is emitted (lower uncertainty range), the Tier 1methodology underestimated annual emissions by an averageof 63%. The exception to this was the DeBathe control andUrea plots, where annual emissions were still overestimated.Where we assumed 3% of N applied is emitted (higheruncertainty range), the Tier 1 method consistently over-estimated the corresponding measured annual values. Theexception to this was the control plots at the Crichton andRowden experimental sites.
4. Discussion
(a) Site simulationThis study aimed to test if the biogeochemical model
DDC could accurately replicate N2O fluxes across six crop-land and three grassland experimental sites, with a range ofsoil, climate and management types. When all experimentalplots, including (where available) comparisons with the yieldestimates were considered, we can conclude that DDC pro-vides a reasonable estimate of annual N2O emissions withinthe UK. For some experimental plots, there was no statisti-cally significant correlation in the pattern of emissionsbetween modelled and measured values (expected at lowemission rates). When other statistical tests and the variationin the measurements were considered, modelled emissionstended to show good agreement with measured values.However, there are a number of limitations in both the modelprocesses and data availability that can cause differences inthe magnitude and pattern of N2O emissions. These limita-tions can lead to a difference in the modelled N2O response tomanagement events such as fertilizer application, or evenprecipitation events, and also feed into the sensitivity of theDDC model to changes in site inputs.
(i) Limited site input information
As stated in section 2.2, model validation requires bothsite level inputs and measured data against which modelledestimates can be compared. Although not detailed here, a fullcalibration of DailyDayCent, like all biogeochemical models,requires an extensive experimental dataset (Gottschalket al 2007, Hastings et al 2010, Bell et al 2012). However,across the different experimental sites data availability varied.These included a lack of long term climate information andinitial soil C stock values as inputs, or missing yield valuesfrom experimental plots for comparing against modelledvalues. This has been well documented in other studies thathave undertaken crop modelling, especially on a larger spatialscale such as region or country level (Palosuo et al 2011,Rötter et al 2012). However measurement based experiments,especially those undertaken to inform national inventories, areincreasingly considering model requirements as part of theirexperimental design.
(ii) Rainfall when temperatures fall below zero degrees:As part of the input files used to run DDC, daily inputs of
temperature and precipitation are used. In the DDC model,once the average daily temperature falls below zero degrees atthe same time as a precipitation event, the model assumes thatprecipitation will fall as snow. Any increase in the average airtemperature to above zero degrees is coupled with snow melt,and this can lead to a large ‘pulse’ in N2O from the soil. Forexample, at the Middleton experimental plot towards the endof the calendar year, DDC modelled a large pulse of N2O ofapproximately 35 kg N2O–N immediately after a combinationof sub -zero temperatures and a precipitation event. This hasbeen observed in other modelling studies (de Bruijnet al 2009), but this pulse was not observed in the measuredvalues, as the precipitation did not fall as snow as the modelassumed.
(iii) Direction of N2O flux between soil and atmosphere:DDC assumes that at all times the concentration of N2O
is higher in soils than the atmosphere, so that there can neverbe a net uptake of N2O from the atmosphere. Uptake of N2Ohas frequently been reported in experimental studies (But-terbach-Bahl et al 2002, Syakila et al 2010), but the processesresponsible for N2O uptake remain poorly understood (But-terbach-Bahl et al 2013). At the Debathe experimental site,annual measured N2O emissions indicated there was a slightuptake of N2O of −0.01 and −0.14 kg N2O–N, in the controland Urea plots, respectively. This was driven by a periodduring the experimental study when measured values con-sistently showed an uptake of N2O. While modelled N2Oemissions over this period were low, there was always a netrelease of N2O; therefore, over a 365 day period, there was upto a 180% difference between modelled and measured annualemissions.
(b) Sensitivity of the DDC model to uncertainty in mea-sured values
The soil and climate inputs used to test the sensitivity ofDailyDayCent were selected based on the site specific infor-mation available at all experimental sites. By using the samepercentage or arbitrary change in each soil input in the sen-sitivity analysis we aimed to (a) reflect potential variation at aUK site level rather than on a larger spatial scale and (b)
12
Environ. Res. Lett. 9 (2014) 095003 N Fitton et al
investigate the sensitivity of the model both between andwithin the experimental sites, and determine the underlyingcauses of model sensitivity.
(i) Sensitivity of DDC to changes in soil parameters:For some sites, changes in site level inputs led to a
change in the initial soil C, where soil C increased ordecreased from values simulated using site level inputs. Theeffect of this change differed between the sites. In someinstances, this led to a change in both the pattern and mag-nitude of N2O emissions from baseline estimates. For othersites, only the magnitude of daily emissions changed. Forexample, at the Boxworth experimental site, DDC was mostsensitive to changes in soil bulk density. Here increasing bulkdensity led to a small increase in the initial system C duringthe spin up phase. This in turn led to the change in both theyield and N2O emissions but both the pattern of emissionsand daily crop growth remained unchanged. However onlywhen bulk density was changed by 0.2 g cm−3 (i.e. maximumallowable) there was a slight change in pattern in both thepattern of emissions and crop growth. At the Betley experi-mental site, DDC was more sensitive to any change in soilpH. This is not unexpected as the baseline value of soilpH was relatively low. This meant that, unlike at Boxworth,the larger the change in soil pH, the more effect this had onmodelled estimates. This could be seen via changes in esti-mated soil C and crop growth during the experimental yearwhich in turn led to changes in water movement within theprofile. Therefore the sensitivity of DDC to soil pH affectedboth the pattern and magnitude of emissions from the manureexperimental plot.
(ii) Sensitivity of DDC to changes in daily temperatureand precipitation patterns:
Changes in temperature and precipitation alter N2Oprocesses in a different manner to soil parameters, as bothclimate parameters were only changed over the experimentalperiod. Plant production potential evapotranspiration rate(PET) and soil decomposition rates are controlled by moistureand temperature. In addition, if the data is unavailable, soiltemperature is also estimated from daily temperature and soilmoisture (Sansoulet et al 2014). Depending on the baselineclimatic conditions, e.g. precipitation patterns in the experi-mental year, the effect on N2O emissions varied between thesites. For example rainfall patterns at the Middleton experi-mental site meant that when rainfall occurred, it was relativelyheavy and was over a few days. Reducing rainfall in theperiod up to and including this period meant that the soil wasless saturated than baseline estimates. This caused an increasein N2O emissions during these periods, as decreasing dailyprecipitation values from the baseline level soil moisturelevels became more optimal for nitrification/denitrification.As a consequence peak emissions were higher than baselineestimates, especially at lower temperatures and after man-agement events such as cultivation. Conversely, increasingdaily precipitation values meant that, while emissions werelower after the management events, N2O fluxes were higher inthe earlier part of the year, which under normal conditionswas drier. Therefore increasing daily precipitation, but not to
a point where soil saturation occurs also led to an increase indaily emissions.
(iii) Interaction of changes to total C and incorrectlysimulated snow fall:
The Grange and Lamb experimental sites were bothbased within the Gleadthorpe experimental area, and the sameclimate inputs were used for both sites. For each plot, in bothexperimental sites, N2O exhibited the largest sensitivity tochanges in soil pH. When soil pH was decreased from the sitevalue, DDC simulated a higher soil C level during the spin-upphase. This was a similar response to changes in bulk densityin Boxworth outlined above. However, the relatively largedifferences in N2O emissions was due to a fall of the averageair temperature below 0 °C towards the end of the experi-mental period, which was coupled with rainfall events. Asdiscussed earlier, DDC assumed that the precipitation fell assnow (which it did not), which was then coupled by snowmelt as temperatures increased, leading to a spike in simulatedN2O emissions. Freeze-thaw cycles have been shown to beimportant in contributing to episodes of N2O emissions(Röver et al 1998, Teepe et al, Kurganova & de Ger-enyu 2010) and various mechanisms have been used bymodels to represent the processes responsible (de Bruijnet al 2009). However in the UK, freezing is usually shortlived and often results solely in the freezing of surface soillayers. For this reason the impact of freeze thaw cycles onN2O emissions are likely to have been less important in thesites included in this study than assumed in the model. Overthe experimental period, climate data used by DDC show arepeated pattern of decreasing then increasing temperaturecoupled with precipitation. When coupled with a higher rateof N2O emissions due to higher soil C annual N2O emissions,this can increase estimates in annual emissions (Fittonet al 2014).
(iv) Sensitivity of DDC to interactions of increasingfertilizer application rate and fertilizer type:
With the exception of the Gleadthorpe experimental sites,a range of different fertilizer types were used and within eachsite, there was a difference in the sensitivity of DDC tochanges in the site level inputs. For example in the TerringtonUAN experimental plot, changes in soil pH coupled with theapplication of UAN led to higher N2O emissions relative tobaseline emissions. However, for the AN and urea plots,which were fertilized on the same day, the same pattern wasnot repeated and N2O fluxes remained unchanged. This wasalso observed at the Crichton experimental plot where, thepattern of both modelled and measured N2O fluxes in the ANand urea plots differed in the experimental year. As a con-sequence, changes to precipitation had a different effect onannual fluxes. In the AN plot, peak N2O fluxes tended tooccur early in the experimental year, and changes in pre-cipitation caused a small increase in N2O fluxes, especially inthe earlier, drier part of the year. Conversely peak N2O fluxesin the Urea plot tended to occur later in the experimental yearand changes in precipitation led to a slight decrease in N2Ofluxes. A similar pattern was observed with changes in soilpH at the Crichton experimental plot.
13
Environ. Res. Lett. 9 (2014) 095003 N Fitton et al
The sensitivity of N2O to changes in N application rateswas not expressly tested in this study because differences in Napplication rate across the sites were accompanied by varia-tions in fertilizer type. By applying the model across allexperimental plots, modelled estimates of annual N2O emis-sions showed a simple linear increase in the rate of annualN2O emissions for each fertilizer type. For example in boththe Gleadthorpe experimental sites where each plot wasmanaged with an increasing N target application rate, mod-elled emissions showed a perfect correlation (R2 = 1) with theamount of N applied. This has also been well described inother studies (Gottschalk et al 2007, Hastings et al 2010), soin this study we focused on the sensitivity of the model toenvironmental drivers.
(c) Comparison between measured, modelled and Tier 1emission calculations
Prior to the development of Tier 2/3 methodologies it isimportant to understand if they can provide a more accurateand robust representation of annual emissions when comparedwith Tier 1 methods. Despite the limitations described above,across both cropland and grassland plots, emissions estimatedby DDC (figures 1(a), (b)) tended to provide a better estimateof annual emission than Tier 1 values (figures 6(a), (b)) whencompared with the corresponding measured values. This isprimarily because Tier 1 calculations assume that the rate ofN fertilizer applied is only driver of N emissions directly fromthe soil. Therefore, when coupled with the N exported fromthe system in crop residue, annual emissions as estimated byTier 1 methods in the control plots were lower than measuredvalues. This, however, ignores natural processes in the soilsuch as microbial activity and the role other managementevents such as cultivation and harvesting have on emissions.These can be seen in measurements from the control plot ateach site, which tended to show N2O emissions despite theabsence of N application. In addition, the Tier 1 methodologyassumes that a consistent fraction of the synthetic N fertilizeror organic amendments is always emitted despite a differencein the chemical composition of the fertilizer type. However,both measured and modelled estimates in this study and otherexperimental work (Dobbie and Smith 2003, Velthofet al 1997 Jones et al 2007) showed that despite the samequantity of N applied, different fertilizer types led to differentannual emissions (table 4), although the effect of different Ntypes was far greater in the grassland site than arable sites.
5. Concluding remarks
While data limitation and model processes can lead touncertainty in our outputs in terms of overall performance,DDC performed well across a range of cropland and grasslandsites, particularly for fertilized fields (as almost all are in theUK), indicating that it is robust for UK conditions.
The methodology employed also aimed to demonstratethe sensitivity of N2O emissions to uncertainty in availablesoil and climate inputs. Testing the sensitivity of the model tosoil and climate inputs is extremely important especially ifDDC is to be used to produce national scale N2O emissions,
or even to test the suitability of different mitigation scenarios.The methodology here allowed us to capture a significant partof the sensitivity of annual N2O emissions, and also theimportance of soil and climate inputs in driving estimates ofannual emissions. This is essential as sometimes on a nationalscale specific soil descriptors can be omitted from nationaldatabases. Section 5 detailed some specific examples in theprocesses within the DDC model process that can be sensitiveto changes in inputs. Some trends are apparent; as the soilpH level decreases across the sites, DDC became increasinglysensitive to changes in pH as an input. This was also true forclay content were the lower the site clay content the moresensitive DDC to changes in its value, but less so for bulkdensity. The higher the initial site value of soil pH or claycontent the more sensitive DDC is to changes in bulk density.
Overall the results show that modelling N2O emissionson a field scale can be challenging and that modelled esti-mates are dependent on complex interaction of different soiland climate inputs. Since not all sites show the same pattern,we show that DDC responses to combinations of drivers arecomplex and nonlinear. Our results also suggest that to applythe model across larger areas such as the UK an accurate soil,climate and management database is required in order to pickup the spatial and temporal variation in N2O emissions whichcan more difficult to predict than for carbon dioxide emis-sions. If these challenges can be overcome estimates of N2Oemissions from biogeochemical models such as DDC canprovide a robust and accurate representation of annual N2Oemissions when compared to Tier 1 estimates which do notaccount for these variations.
Acknowledgements
This work contributes to the UK Defra funded projectsAC0116: InveN2Ory, and AC0114: the Greenhouse GasPlatform.
References
Abdalla M, Jones M, Ambus P and Williams M 2010 Emissions ofnitrous oxide from irish arable soils: effects of tillage andreduced N input Nutrient Cycling Agroecosyst. 86 53–65
Bell M J, Jones E, Smith J, Smith P, Yeluripati J, Augustin J,Juszczak R, Olejnik J and Sommer M 2012 Simulation of soilnitrogen, nitrous oxide emissions and mitigation scenarios at 3European cropland sites using the ECOSSE mode NutrientCycling Agroecosyst. 92 161–81
Butterbach-Bahl K, Baggs E M, Dannenmann M, Kiese R andZechmeister-Boltenstern S 2013 Nitrous oxide emissions fromsoils: how well do we understand the processes and theircontrols? Phil. Trans. R. Soc. B 368 1621
Butterbach-Bahl K, Breuer L, Gasche R, Willibald G and Papen H2002 Exchange of trace gases between soils and theatmosphere in Scots pine forest ecosystems of the northeasternGerman lowlands 1. Fluxes of N2O, NO/NO2 and CH4 atforest sites with different N-deposition Forest Ecol. Manage.167 123–34
14
Environ. Res. Lett. 9 (2014) 095003 N Fitton et al
Chadwick D R, Cardenas L, Misselbrook T H, Smith K A,Rees R M, Watson C J, McGeough K L, Williams J R,Cloy J M and Dhanoa M S 2014 Optimizing chamber methodsfor measuring nitrous oxide emissions from plot-basedagricultural experiments Eur. J. Soil Sci. 65 295–307
Dampney P, Dyer D, Goodlass G and Chambers B 2006 Report forDEFRA project Crop responses to different N fertilisermaterials
de Bruijn A M G, Butterbach-Bahl K, Blagodatsky S and Grote R2009 Model evaluation of different mechanisms drivingfreeze-thaw N2O emissions Agric. Ecosyst. Environ. 133196–207
Del Grosso S J, Ogle S M, Parton W J and Breidt F J 2010Estimating uncertainty in N2O emissions from U.S. croplandsoils Glob. Biogeochem. Cycles 24 GB1009
Dobbie K E and Smith K A 2003 Nitrous oxide emission factors foragricultural soils in Great Britain: the impact of soil water-filled pore space and other controlling variables Glob. ChangeBiol. 9 204–18
Fitton N, Datta A, Smith K, Williams J R, Hastings A, Kuhnert M,Topp C F E and Smith P 2014 Assessing the sensitivity ofmodelled estimates of N2O emissions and yield to inputuncertainty at a UK cropland experimental site using theDailyDayCent model Nutrient Cycling Agroecosyst. 99119–33
Gottschalk P, Wattenbach M, Neftel A, Fuhrer J, Jone M, Lanigan L,Davis P, Campbell C, Soussana J F and Smith P 2007 The roleof measurement uncertaintyies for the simulation of grasslandnet ecosystem exchange (NEE) in Europe Agric. Ecosyst.Environ. 121 175–85
Hastings A F, Wattenbach M, Eugster W, Li C, Buchmann N andSmith P 2010 Uncertainty propagation in soil greenhouse gasemission models: an experiment using the DNDC model and atthe Oensingen cropland site Agric. Ecosyst. Environ. 13697–110
IPCC 2006 IPCC Guidelines for National Greenhouse GasInventories; Prepared by the National Greenhouse GasInventories Programme (Japan: IPCC)
Jones S K, Rees R M, Skiba U M and Ball B C 2007 Influence oforganic and mineral N fertiliser on N2O fluxes from atemperate grassland Agric. Ecosyst. Environ. 121 74–83
Kurganova I N and de Gerenyu V O L 2010 Effect of thetemperature and moisture on the N2O emission from somearable soils Eurasian Soil Sci. 43 919–28
Ogle S M, Eve M D, Breidt F J and Paustian K 2003 Uncertainty inestimating land use and management impacts on soil organiccarbon storage for US agroecosystems between 1982 and 1997Glob. Change Biol. 9 1521–42
Palosuo T et al 2011 Simulation of winter wheat yield and itsvariability in different climates of Europe: a comparison ofeight crop growth models Eur. J. Agron. 35 103–14
Parton W J, Hartman M D, Ojima D S and Schimel D S 1998DAYCENT: Its land surface sub-model: description andtesting Glob. Plant Change 19 35–48
Reay D S, Davidson E A, Smith K A, Smith P, Melillo J M,Dentener F and Crutzen P J 2012 Global agriculture andnitrous oxide emissions Nat. Clim. Change 2 410–6
Rötter R P et al 2012 Simulation of spring barley yield in differentclimatic zones of Northern and Central Europ: a comparison ofnine crop models Field Crops Res. 133 23–36
Röver M, Heinemeyer O and Kaiser E A 1998 Microbial inducednitrous oxide emissions from an arable soil during winter SoilBiol. Biochem. 30 1859–65
Saggar D L, Giltrap C, Li K and Tate R 2007 Modelling nitrousoxide emissions from grazed grasslands in New Zealand Agric.Ecosyst. Environ. 119 205–16
Sansoulet J, Pattey E, Krobel R, Grant B, Smith W, Jego G,Desjardins R L, Tremblay N and Tremblay G 2014 Comparingthe performance of the STICS, DNDC, and DayCent modelsfor predicting N uptake and biomass of spring wheat in EasternCanada Field Crops Res. 156 135–50
Smith J and Smith P 2007 Environmental Modelling: AnIntroduction (Oxford: Oxford University Press) pp 1–178
Smith K A, Dobbie K E, Thorman R, Watson C J, Chadwick D R,Yamulki S and Ball C 2011 The effect of N fertiliser forms onnitrous oxide emissions from UK arable land and grasslandNutrient Cycling Agroecosyst. 93 127–49
Smith P et al 1997 A comparison of the performance of nine soilorganic matter models using seven long-term experimentaldatasets Geoderma 81 153–225
Smith P, Powlson D S, Smith J U, Falloon P and Coleman K 2000Meeting the UK’s climate change commitments: options forcarbon mitigation on agricultural land Soil Use Manage. 161–11
Stocker T F, Qin D, Plattner G K, Tignor M, Allen S K, Boschung J,Nauels A, Xia Y, Bex V and Midgley P M 2013 Climatechange 2013: the physical science basis Contribution ofWorking Group I to the Fifth Assessment Report of theIntergovernmental Panel on Climate Change (Cambridge:Cambridge University Press) pp 1–1535
Syakila A, Kroeze C and Slomp C P 2010 Neglecting sinks for N2Oat the Earth’s surface: does it matter? J. Itegrative Environ. Sci.7 79–87
Teepe R, Brume R and Beese F 2001 Nitorus oxide emissions fromsoil during freezing and thawing periods Soil Biol. Biochem.33 1269–75
Velthof G L, Oenema O, Postma R and Beusichem M L 1997Effects of type and amount of applied nitrogen fertilizer onnitrous oxide fluxes from intensively managed grasslandNutrient Cycling Agroecosyst. 46 257–67
Vose D 2000 Risk Analysis: A Quantitative Guide (New York:Wiley)
15
Environ. Res. Lett. 9 (2014) 095003 N Fitton et al