Embed Size (px)
Citation preview
Scotland's Rural College
Conservation agriculture practices reduce the global warming potential of rainfed lowN input semi-arid agricultureTellez-Rio, A; Vallejo, A; Garcia-Marco, S; Martin-Lammerding, D; Tenorio, JL; Rees, RM;Guardia, GPublished in:European Journal of Agronomy
DOI:10.1016/j.eja.2016.12.013
First published: 29/12/2016
Document VersionPeer reviewed version
Link to publication
Citation for pulished version (APA):Tellez-Rio, A., Vallejo, A., Garcia-Marco, S., Martin-Lammerding, D., Tenorio, JL., Rees, RM., & Guardia, G.(2016). Conservation agriculture practices reduce the global warming potential of rainfed low N input semi-aridagriculture. European Journal of Agronomy, 84, 95 - 104. https://doi.org/10.1016/j.eja.2016.12.013
General rightsCopyright and moral rights for the publications made accessible in the public portal are retained by the authors and/or other copyright ownersand it is a condition of accessing publications that users recognise and abide by the legal requirements associated with these rights.
• Users may download and print one copy of any publication from the public portal for the purpose of private study or research. • You may not further distribute the material or use it for any profit-making activity or commercial gain • You may freely distribute the URL identifying the publication in the public portal ?
Take down policyIf you believe that this document breaches copyright please contact us providing details, and we will remove access to the work immediatelyand investigate your claim.
Download date: 23. Oct. 2021
1
1 Conservation Agriculture practices can reduce yield-scaled N2O emissions and the
2 global warming potential of rainfed semi-arid agriculture
3 Angela Tellez-Rioa, Antonio Vallejo
a, Sonia García-Marco
a, Diana Martin-Lammerding
b, Jose
4 Luis Tenoriob, Robert M. Rees
c, Guillermo Guardia
a*
5 a E.T.S.I. Agronómica, Alimentaria y de Biosistemas (ETSIAAB), Technical University of Madrid
6 (UPM), Ciudad Universitaria, 28040 Madrid, Spain.
7 b Departamento de Medio Ambiente, INIA, Ctra. de La Coruña km. 7.5, 28040 Madrid, Spain.
8 c SRUC, West Mains Road, Edinburgh, EH9 3JG, UK.
9 * Corresponding author. Tf. 0034-913365643. e-mail: [email protected]
10 Abstract
11 Conservation tillage and crop rotations can potentially contribute to beneficial effects on
12 soil quality. However, the impact of these practices on greenhouse gas (GHG)
13 emissions and crop yields is not well defined, particularly in dry climates. A rainfed 2-
14 year field-experiment was conducted to evaluate the effect of three long-term (17-18
15 years) tillage systems (Conventional Tillage (CT), Minimum Tillage (MT) and No
16 Tillage (NT)) and two cropping systems (rotational wheat (Triticum aestivum L.)
17 preceded by fallow, and monoculture wheat), on nitrous oxide, (N2O) and methane,
18 (CH4) emissions, during two field campaigns. Soil mineral N, water-filled pore space,
19 dissolved organic C, and grain yield were measured and yield-scaled N2O emissions, N
20 surplus and Global Warming Potentials (GWP) were calculated. No tillage only
21 decreased cumulative N2O losses (as opposed to MT/CT) during campaign 1 (the driest
22 campaign with least synthetic N input), while tillage did not affect CH4 oxidation. The
23 GWP demonstrated that the enhancement of C sequestration under NT caused this
24 tillage management to decrease overall CO2 equivalent emissions. Wheat in
2
25 monoculture was associated with increased N2O fluxes during campaign 2 (normal year
26 and conventional N input) and decreased CH4 uptake, as opposed to rotational wheat.
27 Conversely, wheat in monoculture tended to increase C sequestration and therefore to
28 result in a lower GWP, but differences were not statistically significant. Grain yields
29 were strongly influenced by climatic variability. The NT and CT treatments yielded
30 most during the dry and the normal campaign, and the yield-scaled N2O emissions
31 followed the same tendency. Minimum tillage was not an interesting tillage
32 management considering the balance between GWP and yield-scaled N2O emissions
33 (which were increased in a 64% compared with that of NT). Regarding the crop effect,
34 wheat in rotation resulted in a 32% increase in grain yield and 31% mitigation of yield-
35 scaled N2O emissions. Low cumulative N2O fluxes (< 250 g N2O-N ha-1
campaign-1
)
36 highlighted the relevance of C sequestration and CO2 emissions from inputs and
37 operations in rainfed semi-arid cropping systems. This study suggests that NT and crop
38 rotation can be recommended as good agricultural practices in order to establish an
39 optimal balance between GHGs fluxes, GWP, yield-scaled N2O emissions and N
40 surpluses.
41 Keywords: N2O emission, CH4 emission, C sequestration, rotation, winter wheat,
42 tillage
43 Highlights
44 Different tillage treatments and wheat in rotation versus monoculture were evaluated in
45 a long-term experiment.
46 No tillage and wheat in rotation resulted in similar or lower N2O emissions than
47 conventional management.
3
48 Wheat in rotation (preceded by fallow) increased CH4 uptake when compared with
49 wheat monoculture.
50 Wheat in rotation increased grain yield and reduced yield-scaled N2O emissions.
51 No tillage decreased the net global warming potential due to enhanced C sequestration.
52 1. Introduction
53 Agriculture contributes to 10-12% of the total global anthropogenic greenhouse
54 gases (GHGs) (Stocker et al., 2013), through the release of nitrous oxide (N2O), carbon
55 dioxide (CO2) and methane (CH4). The global warming potential (GWP), which is a
56 concept that integrates the radiative properties of all GHG, expressed as CO2 equivalents
57 (CO2-eq), is very dependent on N2O emissions from agricultural crop systems. This gas,
58 which is a by-product of microbial processes of nitrification and denitrification,
59 (Firestone and Davidson, 1989), is released from soils after nitrogen (N) application
60 (through fertilizers or crop residues). By contrast, in aerated soils CH4 uptake normally
61 reduces GWP, because the amount of CH4 oxidized by methanotrophic microorganisms
62 is normally higher than the amount produced by methanogenic microoganisms (Chan
63 and Parkin 2001). Additionally, agricultural practices that favour carbon (C)
64 sequestration (Robertson et al., 2000) are also considered as valuable strategies to
65 reduce the negative effect of GHG emissions associated with crop production.
66 Therefore, agricultural management practices (e.g. tillage, fertilization and crop
67 rotation) must integrate the reduction of soil GHG emissions and the increase of C
68 sequestration, while maintaining or enhancing crop yields to satisfy increasing global
69 food demand.
70 Conservation agriculture, which involves crop rotations and reduced tillage (no
71 tillage (NT) or minimum tillage (MT)), is currently common in Mediterranean climates
4
72 due to its effects on preserving soil fertility and increasing soil C sink (Kassam et al.,
73 2012). These tillage practices often contribute to improve important abiotic parameters
74 involved in the production and consumption of GHG from soils such as soil water
75 content, aeration and soil organic C (SOC) (Martín-Lammerding et al., 2011; Plaza-
76 Bonilla et al. 2014) compared to conventional tillage (CT). However, contradictory
77 results on N2O and CH4 fluxes have been reported (i.e. Pelster et al., 2011; Dendooven
78 et al., 2012; Ball et al., 1999; Yonemura et al., 2014) due to interaction of tillage with
79 several factors, e.g. soil type, climatic conditions (which determine the prevalence of
80 nitrification or denitrification), nitrogen (N) fertilization rate, crop residues (type and
81 management), and experiment duration (van Kessel et al., 2013).
82 The effect of crop rotations on GHG emissions is variable depending on
83 rainfed/irrigated conditions, composition and management of previous crop residues
84 (Malhi and Lemke, 2007), and mineral N remaining in soil from previous cropping
85 phases. Cereal residues (high C:N ratio) can promote soil N immobilization when they
86 are applied without an additional source of mineral N, consequently leading to a
87 temporary reduction of N2O fluxes (Huang et al., 2004). However, other authors
88 (Sarkodie-Addo et al., 2003) have observed an enhancement of denitrification losses
89 when a mineral source is added together with high C:N ratio residues, providing an
90 energy supply for denitrifying microorganisms. Addition of N fertiliser may also inhibit
91 CH4 uptake due to interference of enzyme activity responsible for CH4 oxidation (CH4
92 monooxygenase) with NH3 monooxygenase (Dunfield and Knowles, 1995), depending
93 on N rate (Aronson and Helliker, 2010). Different quantities of crop residue inputs are
94 added to the soil under rotational wheat and monoculture wheat systems, which can
95 affect net N2O and CH4 production due to changes in soil C and N availability.
5
96 The influence of tillage and crop rotation on C sequestration has been previously
97 assessed, showing promising but contrasting results depending on management (e.g.
98 type and duration of rotation) and experimental (e.g. depth, number of years since the
99 beginning of the experiment) factors (Baker et al., 2007; Álvaro-Fuentes et al., 2014;
100 Triberti et al., 2016). Thus, to identify whether conservation tillage practices (MT/NT
101 and crop rotation) can mitigate both soil GHG emissions and net GWP is still unclear,
102 particularly in semi-arid areas where the weight of direct N2O losses is expected to be
103 lower.
104 In rainfed semi-arid cropping systems, characterized by a high variability in total
105 amount and distribution of rainfall, low N input systems are being promoted in order to
106 match N input to the expected N uptake by crops (Kimani et al., 2003; Tellez-Rio et al.,
107 2015), which may reduce N surplus and also N losses (van Groenigen et al. 2010).
108 Therefore, combining Conservation Agriculture practices with adjusted N-input is
109 expected to provide an optimum balance between GWP and crop yields in semi-arid
110 agro-ecosystems. In this context, the main objective of this study was to evaluate the
111 effect of three long-term tillage systems (CT, MT and NT) and two cropping systems
112 (wheat in monoculture and wheat in a 4-year rotation with fallow as preceding crop) on
113 N2O and CH4 emissions over two campaigns. Additionally, crop yield, yield-scaled N2O
114 losses (YSNE) and GWP were evaluated. We hypothesized that: 1) considering climatic
115 conditions of this experiment and the low N input, low N2O emissions would be
116 expected in all treatments; 2) emissions of N2O and CH4 in monoculture winter wheat
117 could be higher than in the rotational winter wheat, because of a combined effect of
118 previous crop residues and N fertilizer application; and 3) NT would reduce net GWP as
119 a result of the reduction of CO2-eq emissions from farm operations and the increase of
120 C sequestration (Aguilera et al., 2013a).
6
121 2. Materials and methods
122 2.1. Site characteristics
123 A two-year study was carried out at “La Canaleja” Field Station (40º 32´N, 3º
124 20´W, 600 m), in Alcalá de Henares (Madrid, Spain), where a long-term tillage
125 experiment began in 1994. Tillage systems and crop rotations including legumes and
126 fallow have been assessed from that date. The soil was a sandy-loam Calcic
127
128
129
Haploxeralf (Soil Survey Staff, 2010). The main physicochemical properties of the top
soil layer (0-15 cm) were: sand, 50.8%; silt, 37.7%; clay, 11.5%; CaCO3, 41.6 g kg -1
;
pHH2O, 7.9 and EC, 121.3 µS cm-1
. The site has a semiarid Mediterranean climate with
130 dry summer. The 1994-2013 mean annual temperature and rainfall for this area were
131 13.5 ºC and 402.7 mm, respectively.
132 Hourly rainfall and air temperature data were obtained from a meteorological
133 station located at the field site. Soil temperature was measured in each tillage system by
134 inserting a temperature probe 15 cm into the soil. Mean hourly temperature data were
135 stored on a data logger.
136 2.2. Experimental design and management
137 The experiment was conducted from October 2011 to October 2013. The
138 experimental design was a three-replicated split plot, divided into three main plots
139 assigned to the three tillage systems (NT, MT and CT) in a randomized complete block
140 design (Guardia et al., 2016). Each of the main plot was further divided into five
141 subplots (10 x 25 m) assigned in completely randomized design to the phases of an
142 annual crop rotation, involving fallow-wheat (Triticum aestivum L. var. Marius)–vetch
143 (Vicia sativa L. var. Senda)-barley (Hordeum vulgare L. var. Kika), and also wheat in
144 monoculture. In this study, we evaluated the effect of the three tillage systems
7
145 mentioned above (tillage factor) and two cropping systems (cropping factor): wheat in
146 rotation and wheat in monoculture; during two campaigns with different climatic (i.e.
147 rainfall amount) and management conditions (i.e. rate of N fertilizer at dressing)
148 (campaign factor): 2011/12 (campaign 1) and 2012/13 (campaign 2), resulting in
149 eighteen subplots (3 plots x 2 subplots x 3 replicates -blocks-).
150 Moldboard (20 cm depth) and chisel ploughs (15 cm depth) were used in autumn
151 (early-November 2011 and late-October 2012, for campaign 1 and 2, respectively) in
152 CT and MT plots, respectively. Then, a cultivator pass was carried out for both tillage
153 systems. Thus, crop residues were almost completely incorporated into the soil in CT,
154 whereas under MT they were covered over approximately 30% of the plot surface with
155
156
the previous season’s crop residues. No tillage involved direct drilling and spraying with glyphosate (at a rate of 2 L ha
-1 of Sting Monsanto ®) for weed control, and
157 previous season’s crop residues were retained on the soil surface. Different types of
158 crop residues were applied to the soil in the rotation treatment, depending on rotation
159 phase. Since wheat was preceded by fallow, the relatively little biomass generated
160 during that phase was left or incorporated into the soil surface in the following crop,
161
162
163
164
165
166
winter wheat. By contrast, in monoculture wheat, straw residue provided a greater N
and C input (235 Mg C ha-1
; 20 kg N ha-1
) to the following crop of wheat. Rotational
and monoculture wheat were sown on 26th
November 2011 and 14th
November 2012 in
campaign 1 and 2, respectively, with 210 kg seed ha-1
. Fertilizer was applied at seeding
(16 kg N ha-1
as NPK, 8-24-8) in both campaigns and at dressing as ammonium nitrate
(NH4NO3, 27-0-0) on 22nd
March 2011 and 11th
March 2012. The N fertilization rate at
167 dressing was calculated by taking into account the expected crop yield and soil mineral
168
169
N content two weeks before fertilizer application (February). There was higher average
nitrate (NO3-
-N) content in the 0-15 cm soil at dressing fertilization in campaign 1 (27
8
170
171
172
173
mg NO3- -N kg
-1) than in campaign 2 (5.6 mg NO3
- -N kg
-1), which resulted in different
N rates in campaign 1 (11 kg N ha-1
) and 2 (54 kg N ha-1
). All treatments received post-
emergency herbicide treatments (HerbimurDoble ®) at a rate of 1.6 L ha-1
for both
campaigns. Wheat was harvested on 10th
June 2012 and 18th
June 2013, for campaign 1
174 and 2, respectively.
175 2.3. GHG emissions sampling and analyzing
176 Fluxes of N2O and CH4 were measured from October 2011 to October 2013,
177 using the static chamber technique (Sanz-Cobena et al., 2014). One chamber (diameter
178 35.6 cm, height 19.3 cm) was placed in each subplot and closed (for 1 h) by fitting them
179 into stainless steel rings, which were inserted after plough events into the soil to a depth
180 of 10 cm to minimize the lateral diffusion of gases and avoid the soil disturbance
181 associated with the insertion of the chambers in the soil. They were only removed
182 during management practices. Samples were always taken with wheat plants inside the
183 chamber. Thermometers were placed inside three randomly selected chambers during
184 the closure period of each measurement in order to correct the fluxes for temperature.
185 When plants exceeded the chamber height (19.3 cm), plastic intersections of 19 cm
186 were used between the ring and the chamber.
187 Gas samples were taken three times per week during the first and second week,
188 then twice per week during the first month after fertilization events or during rainfall
189 periods and then, every week or every two weeks until the end of the cropping period.
190 After harvest, one gas sample was taken each month. To minimize any effects of diurnal
191 variation in emissions, samples were taken at the same time of day (10–12 am).
192 Gas samples (20 mL) were taken at 0, 30 and 60 min to test the linearity of gas
193 accumulation in each chamber. Samples were analyzed by gas chromatography using a
9
194 HP-6890 gas chromatograph equipped with a headspace autoanalyzer (HT3), both from
195
196
Agilent Technologies (Barcelona, Spain). HP Plot-Q capillary columns transported gas
samples to a 63
Ni electron-capture detector (Micro-ECD) to analyze N2O concentrations
197 and to a flame ionization detector (FID) connected to a methanizer to measure CH4. The
198 temperatures of the injector, oven and detector were 50, 50 and 350ºC, respectively.
199
200
The increases in GHG concentrations within the chamber headspace were
generally linear (R2
> 0.90) during the sampling period (1h). Therefore, emission rates
201 of fluxes were estimated as the slope of the linear regression between concentration and
202 time (after corrections for temperature) and from the ratio between chamber volume and
203 soil surface area (Abalos et al., 2014). Cumulative N2O-N and CH4-C emissions per
204 subplot during the sampling period were estimated by linear interpolations between
205 sampling dates, multiplying the mean flux of two successive determinations by the
206 length of the period between sampling and adding that amount to the previous
207 cumulative total (Sanz-Cobena et al., 2014).
208 2.5 Soil and crop analyses, meteorological data
209 In November 2011, composite soil samples were collected from each subplot at
210 depths of 0-7.5 cm, 7.5-15 cm and 15-30 cm. Soil samples were air-dried and sieved.
211 Then, SOC was determined following the wet oxidation method (Nelson and Sommers,
212 1996). In addition, bulk density was determined using intact core samplers as described
213 by Grossman and Reinsch (2002). Bulk density was measured once a year (before the
214 start of the experiment, as indicated above), on the basis that although bulk density
215 diminishes in the topsoil layer immediately after tillage, this effect is short-lived and is
216 followed by a rapid reorganization of the soil (Gómez-Paccard et al. 2015). In order to
217 relate gaseous emissions to soil properties, soil samples were collected from 0-15 cm
10
218 depths during the growing season on almost all gas-sampling occasions. Three soil
219 cores (2.5 cm diameter and 15 cm length) were randomly sampled close to the ring in
220 each subplot, and then mixed and homogenized in the laboratory. Dissolved organic C
221 (DOC) was determined by extracting 8 g of homogeneously mixed soil with 50 mL of
222
223
224
deionized water. Afterwards, DOC content was analyzed with a total organic carbon
analyser (multi N/C 3100 Analityk Jena) with an IR detector. Soil ammonium (NH4+
-
N) and NO3–
-N concentrations were analyzed using 8 g of homogeneously mixed soil
225 extracted with 50 mL of KCl (1M), and measured by automated colorimetric
226 determination using a flow injection analyzer (FIAS 400 Perkin Elmer) with a UV-V
227 spectrophotometer detector. The water-filled pore space (WFPS) was calculated by
228 dividing the volumetric water content by total soil porosity. Total soil porosity was
229
230
calculated according to the relationship: soil porosity = (1- soil bulk density/2.65),
assuming a particle density of 2.65 g cm-3
(Danielson et al., 1986). Gravimetric water
231 content was determined by drying soil samples at 105 °C in a MA30 Sartorius ® oven.
232 Grain yield and above-ground biomass were measured by harvesting two
233 randomly selected 0.5 x 0.5 m squares from each subplot. Aerial biomass was cut by
234 hand at the soil level and weighted after separating grain and straw. The total N content
235 of grain and straw were determined with an elemental analyzer (TruMac CN Leco).
236 2.6. Yield-scaled N2O emissions, N surplus and GWP calculations
237 Yield-scaled N2O emissions, expressed as g N2O-N per of kg N uptake, were
238 calculated based on van Groenigen et al. (2010), considering total above-ground N
239
240
uptake (wheat grain and straw). The N surplus was calculated as the above-ground N
uptake of the crop minus the N fertilizer applied, in kg N ha-1
(van Groenigen et al.,
241 2010). Carbon sequestration in the first 30 cm of soil and CO2 emissions from fuel used
11
242 in farm operations (e.g. tillage, herbicide and fertilizer application, seeding, harvest) and
243 from manufacturing inputs (operation GHG emission + input GHG emission) were
244 calculated as described by Guardia et al. (2016). The “∆ soil C GWP” component, as an
245 indicator of the soil C balance, was calculated taking the difference in SOC stocks
246 between monoculture wheat-CT (as baseline) and the other treatments. To avoid the
247 bias associated to bulk density, the comparison of C stocks was made on a fixed soil
248 mass basis, as described in Ellert and Bettany (1995). Default values of GHG emissions
249 derived from farm operations and manufacturing inputs have been reported by West and
250 Marland (2002), Lal (2004) and Snyder et al. (2009).
251 2.7. Statistical analysis
252 Statistical analyses were carried out with Statgraphics Plus 5.1. Analyses of
253 variance (two-way ANOVA) were performed for almost all variables in the experiment
254 for both campaigns (except climatic ones). A three-way ANOVA was also carried out in
255 order to assess the effect of each campaign and the possible interactions among factors
256 (campaign, tillage and crop). The normality and variance uniformity of data were
257 assessed by the Shapiro-Wilk test and Levene´s statistic, respectively, and log-
258
259
transformed before analysis when necessary. Means were separated by Tukey's honest
significance test at P < 0.05. For non-normally distributed data (mean soil NH4+
content
260 and YSNE in campaign 1 in the three-way ANOVA), the Kruskal–Wallis test was used
261 on non-transformed data to evaluate differences at P < 0.05. Linear regression analyses
262 were carried out to determine relationships between cumulative gas fluxes and soil
263 parameters, with a 95% significance level.
264 3. Results
265 3.1. Environmental conditions, soil C and mineral N contents
higher than those for MT and CT (27 and 50% for campaign 1; 36 and 42% for 290
12
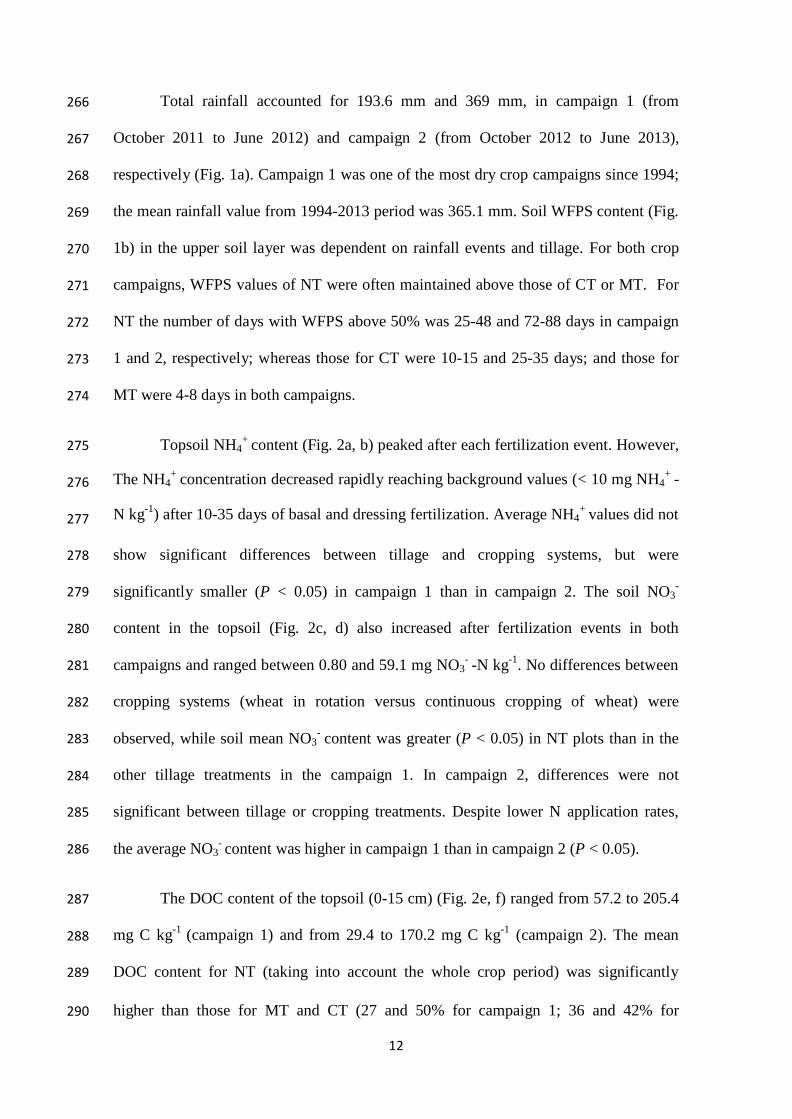
266 Total rainfall accounted for 193.6 mm and 369 mm, in campaign 1 (from
267 October 2011 to June 2012) and campaign 2 (from October 2012 to June 2013),
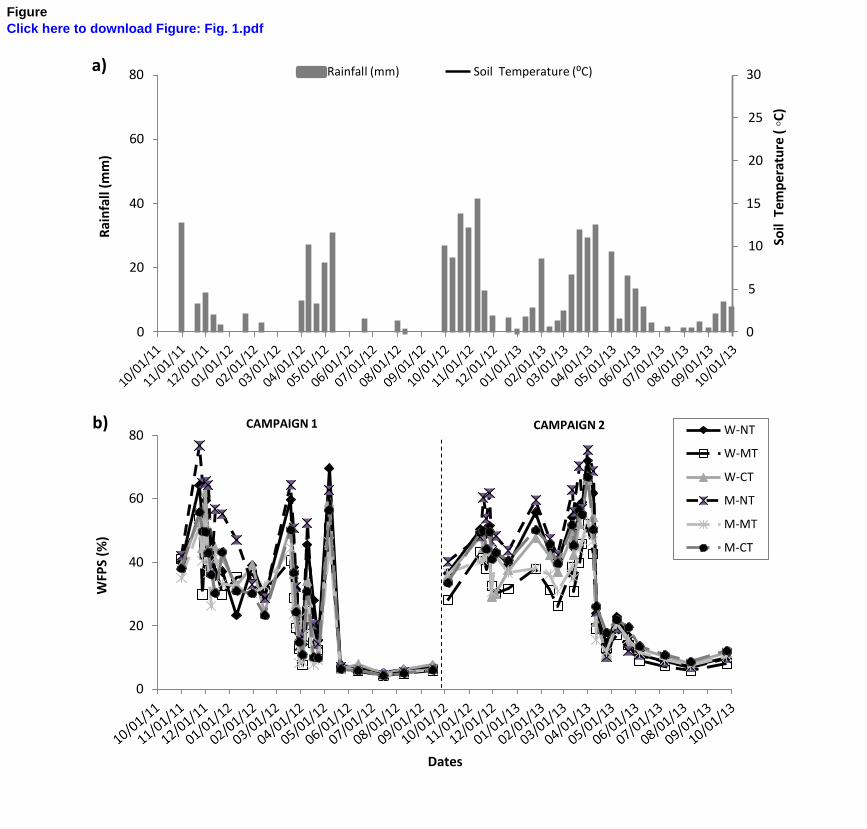
268 respectively (Fig. 1a). Campaign 1 was one of the most dry crop campaigns since 1994;
269 the mean rainfall value from 1994-2013 period was 365.1 mm. Soil WFPS content (Fig.
270 1b) in the upper soil layer was dependent on rainfall events and tillage. For both crop
271 campaigns, WFPS values of NT were often maintained above those of CT or MT. For
272 NT the number of days with WFPS above 50% was 25-48 and 72-88 days in campaign
273 1 and 2, respectively; whereas those for CT were 10-15 and 25-35 days; and those for
274 MT were 4-8 days in both campaigns.
275
276
277
Topsoil NH4+
content (Fig. 2a, b) peaked after each fertilization event. However,
The NH4+
concentration decreased rapidly reaching background values (< 10 mg NH4+
-
N kg-1
) after 10-35 days of basal and dressing fertilization. Average NH4+
values did not
278
279
show significant differences between tillage and cropping systems, but were
significantly smaller (P < 0.05) in campaign 1 than in campaign 2. The soil NO3-
280
281
content in the topsoil (Fig. 2c, d) also increased after fertilization events in both
campaigns and ranged between 0.80 and 59.1 mg NO3- -N kg
-1. No differences between
282
283
cropping systems (wheat in rotation versus continuous cropping of wheat) were
observed, while soil mean NO3- content was greater (P < 0.05) in NT plots than in the
284 other tillage treatments in the campaign 1. In campaign 2, differences were not
285
286
significant between tillage or cropping treatments. Despite lower N application rates,
the average NO3- content was higher in campaign 1 than in campaign 2 (P < 0.05).
287
288
The DOC content of the topsoil (0-15 cm) (Fig. 2e, f) ranged from 57.2 to 205.4 mg C kg
-1 (campaign 1) and from 29.4 to 170.2 mg C kg
-1 (campaign 2). The mean
289 DOC content for NT (taking into account the whole crop period) was significantly
13
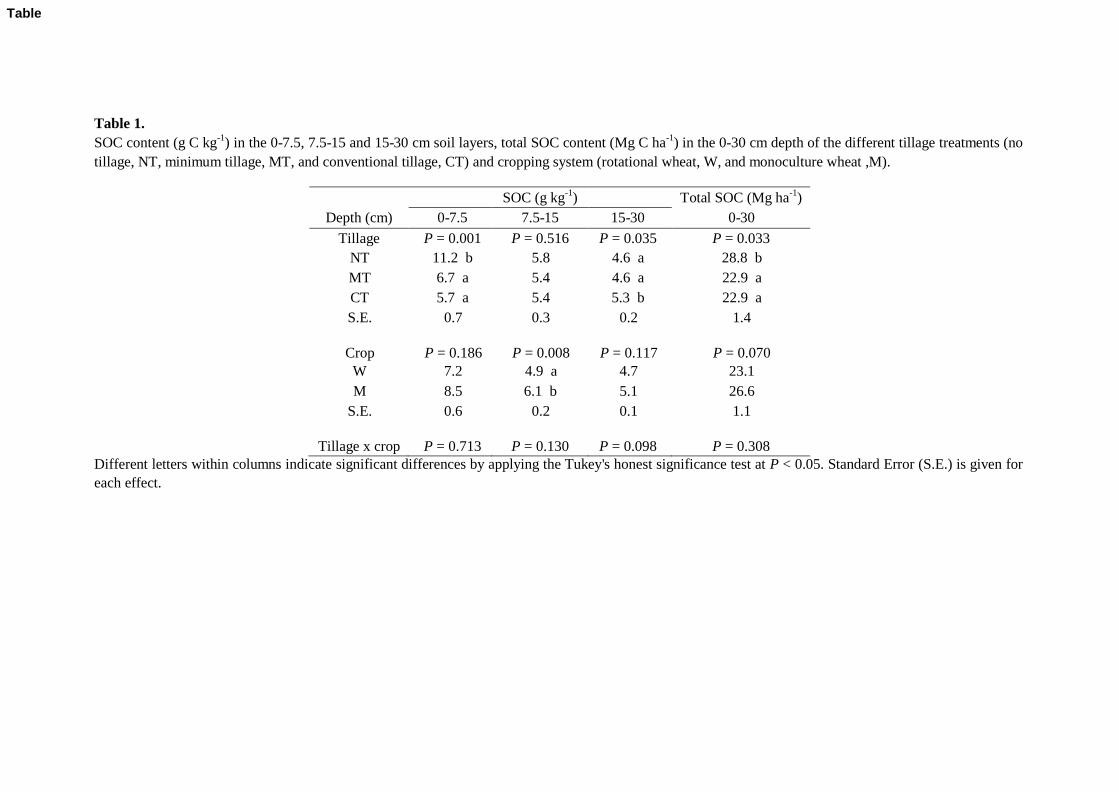
291 campaign 2, respectively). No significant differences were found between cropping
292 systems and campaigns. The SOC content in the upper layer was significantly increased
293 after 17 years of NT, as opposed to MT and CT (Table 1). The highest SOC
294 concentrations in the 15-30 cm layer were observed in CT (P < 0.05), but the SOC stock
295 of the three soil layers (0-30 cm) was significantly higher in NT treatment. With regards
296 to the cropping effect, monoculture wheat also tended to increase SOC sequestration
297 compared with rotational wheat (0.05 < P < 0.10).
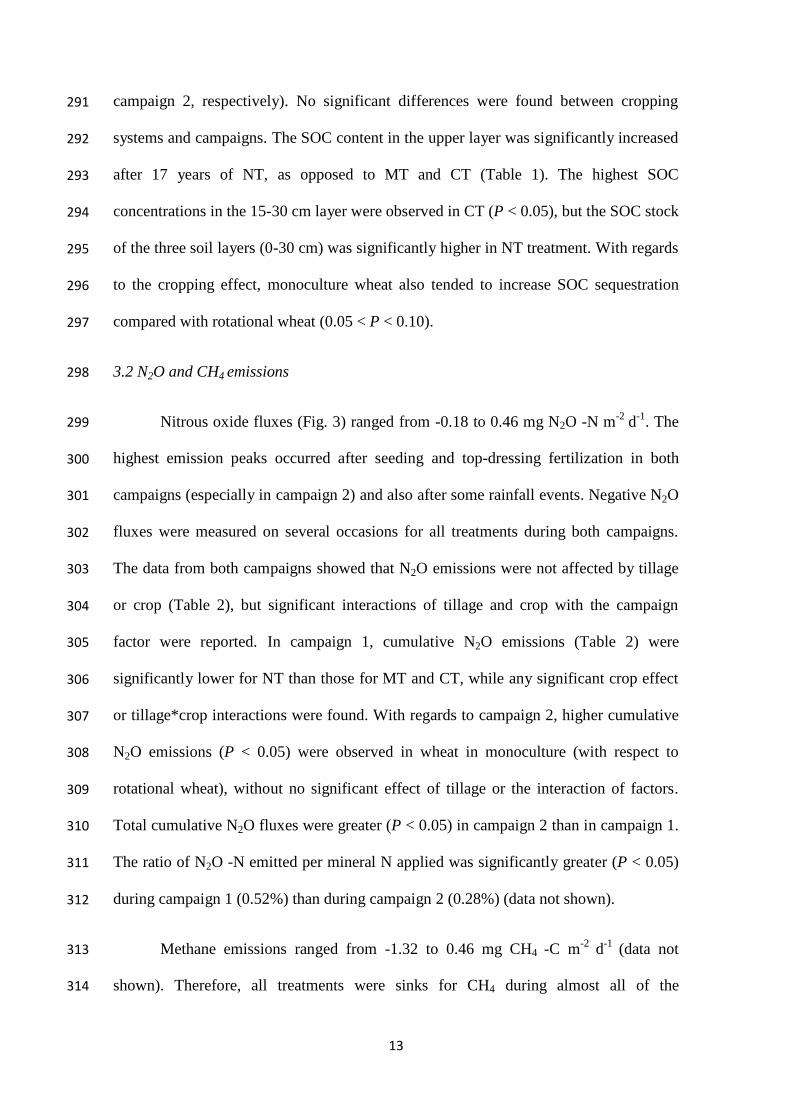
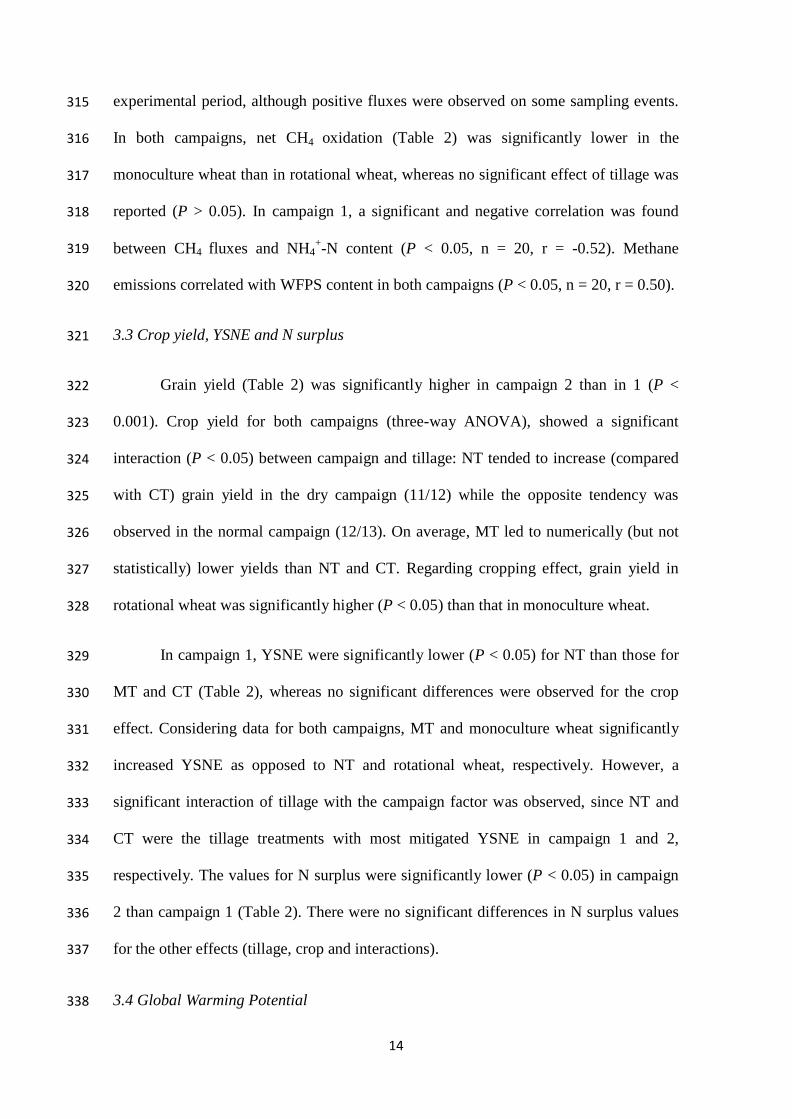
298 3.2 N2O and CH4 emissions
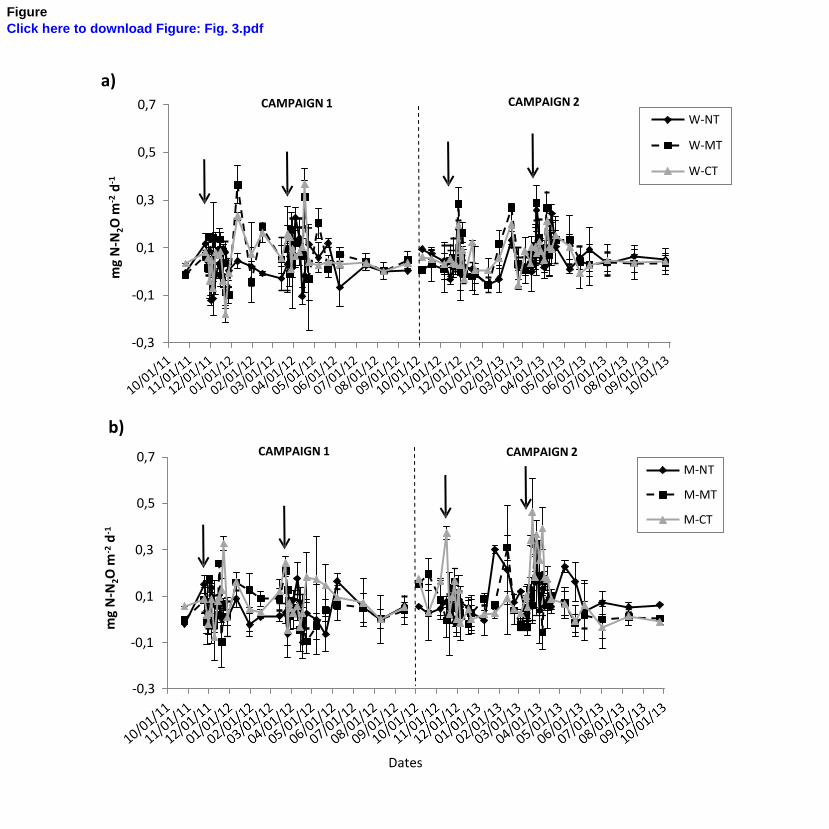
299 Nitrous oxide fluxes (Fig. 3) ranged from -0.18 to 0.46 mg N2O -N m-2
d-1
. The
300 highest emission peaks occurred after seeding and top-dressing fertilization in both
301 campaigns (especially in campaign 2) and also after some rainfall events. Negative N2O
302 fluxes were measured on several occasions for all treatments during both campaigns.
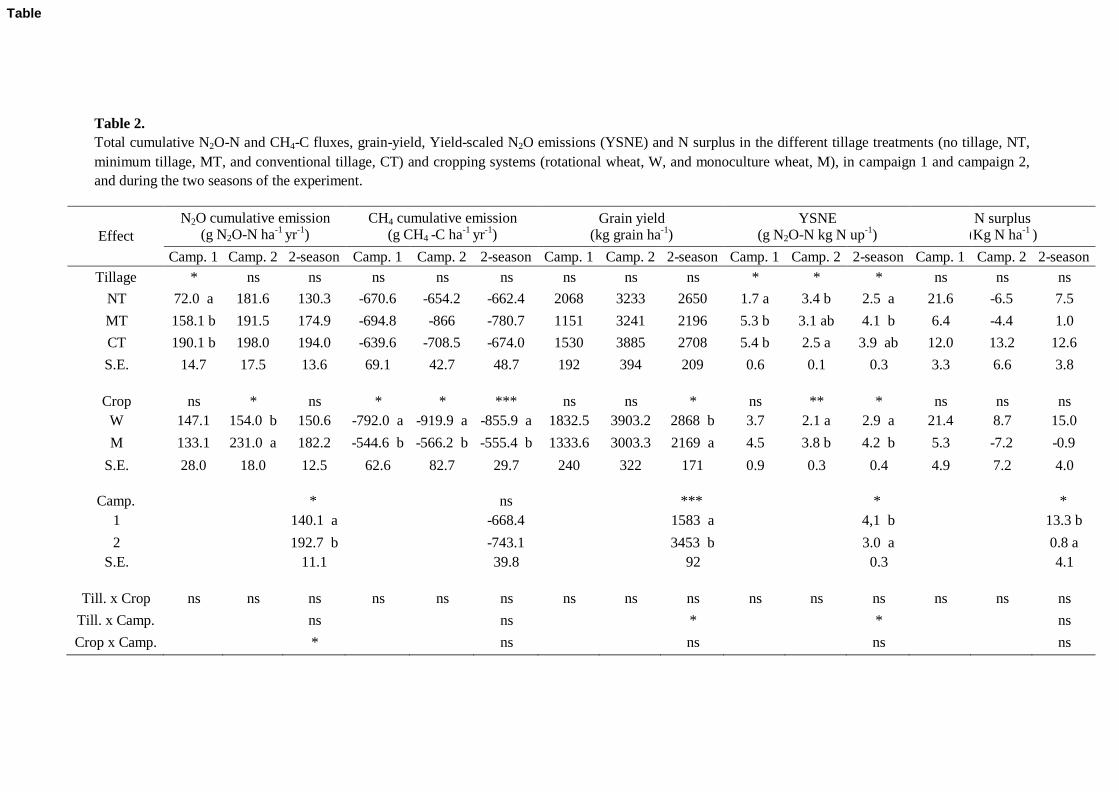
303 The data from both campaigns showed that N2O emissions were not affected by tillage
304 or crop (Table 2), but significant interactions of tillage and crop with the campaign
305 factor were reported. In campaign 1, cumulative N2O emissions (Table 2) were
306 significantly lower for NT than those for MT and CT, while any significant crop effect
307 or tillage*crop interactions were found. With regards to campaign 2, higher cumulative
308 N2O emissions (P < 0.05) were observed in wheat in monoculture (with respect to
309 rotational wheat), without no significant effect of tillage or the interaction of factors.
310 Total cumulative N2O fluxes were greater (P < 0.05) in campaign 2 than in campaign 1.
311 The ratio of N2O -N emitted per mineral N applied was significantly greater (P < 0.05)
312 during campaign 1 (0.52%) than during campaign 2 (0.28%) (data not shown).
313 Methane emissions ranged from -1.32 to 0.46 mg CH4 -C m-2
d-1
(data not
314 shown). Therefore, all treatments were sinks for CH4 during almost all of the
3.4 Global Warming Potential 338
14
315 experimental period, although positive fluxes were observed on some sampling events.
316 In both campaigns, net CH4 oxidation (Table 2) was significantly lower in the
317 monoculture wheat than in rotational wheat, whereas no significant effect of tillage was
318
319
reported (P > 0.05). In campaign 1, a significant and negative correlation was found
between CH4 fluxes and NH4+-N content (P < 0.05, n = 20, r = -0.52). Methane
320 emissions correlated with WFPS content in both campaigns (P < 0.05, n = 20, r = 0.50).
321 3.3 Crop yield, YSNE and N surplus
322 Grain yield (Table 2) was significantly higher in campaign 2 than in 1 (P <
323 0.001). Crop yield for both campaigns (three-way ANOVA), showed a significant
324 interaction (P < 0.05) between campaign and tillage: NT tended to increase (compared
325 with CT) grain yield in the dry campaign (11/12) while the opposite tendency was
326 observed in the normal campaign (12/13). On average, MT led to numerically (but not
327 statistically) lower yields than NT and CT. Regarding cropping effect, grain yield in
328 rotational wheat was significantly higher (P < 0.05) than that in monoculture wheat.
329 In campaign 1, YSNE were significantly lower (P < 0.05) for NT than those for
330 MT and CT (Table 2), whereas no significant differences were observed for the crop
331 effect. Considering data for both campaigns, MT and monoculture wheat significantly
332 increased YSNE as opposed to NT and rotational wheat, respectively. However, a
333 significant interaction of tillage with the campaign factor was observed, since NT and
334 CT were the tillage treatments with most mitigated YSNE in campaign 1 and 2,
335 respectively. The values for N surplus were significantly lower (P < 0.05) in campaign
336 2 than campaign 1 (Table 2). There were no significant differences in N surplus values
337 for the other effects (tillage, crop and interactions).
15
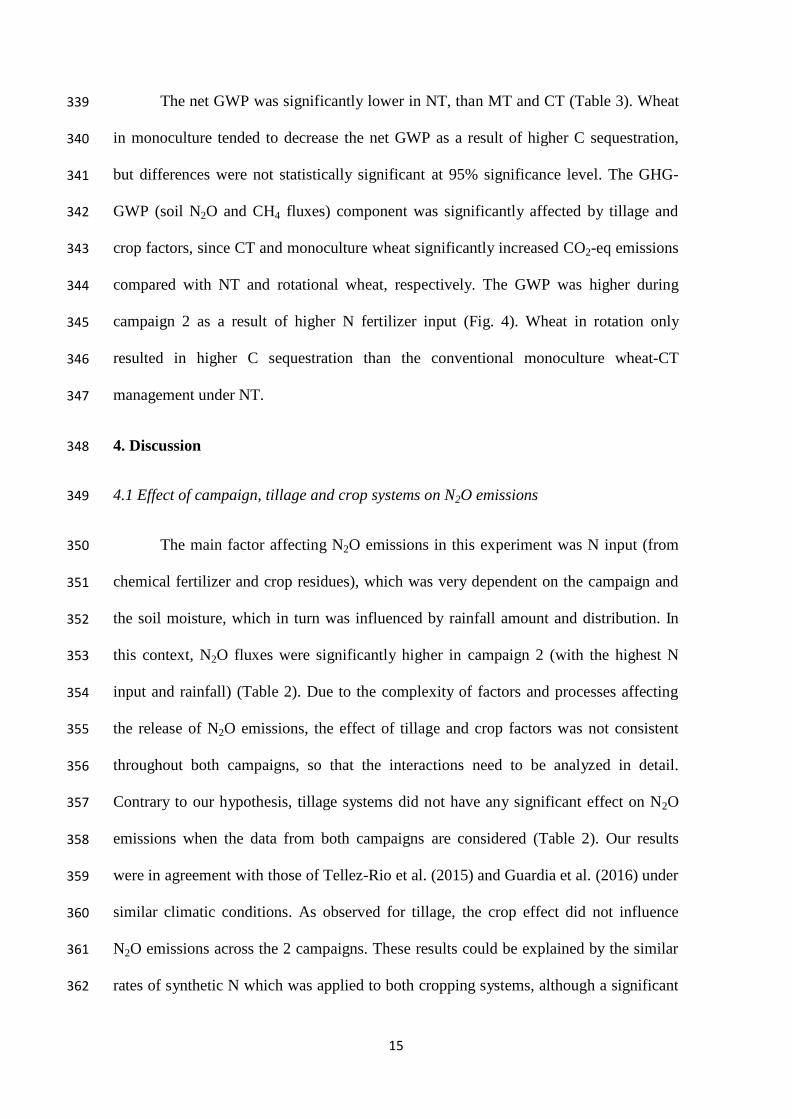
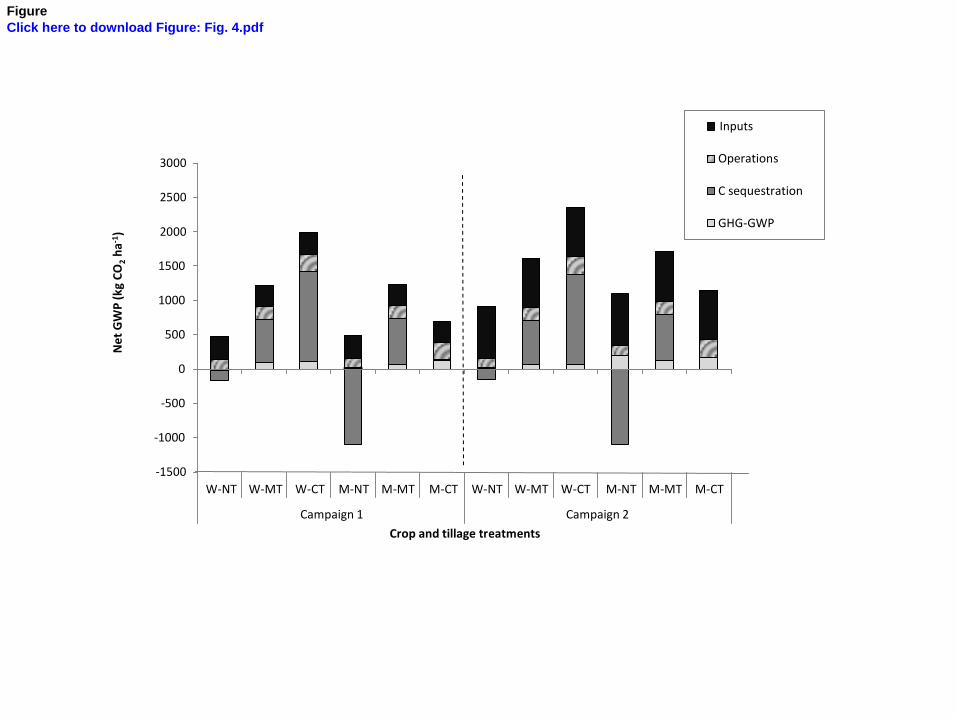
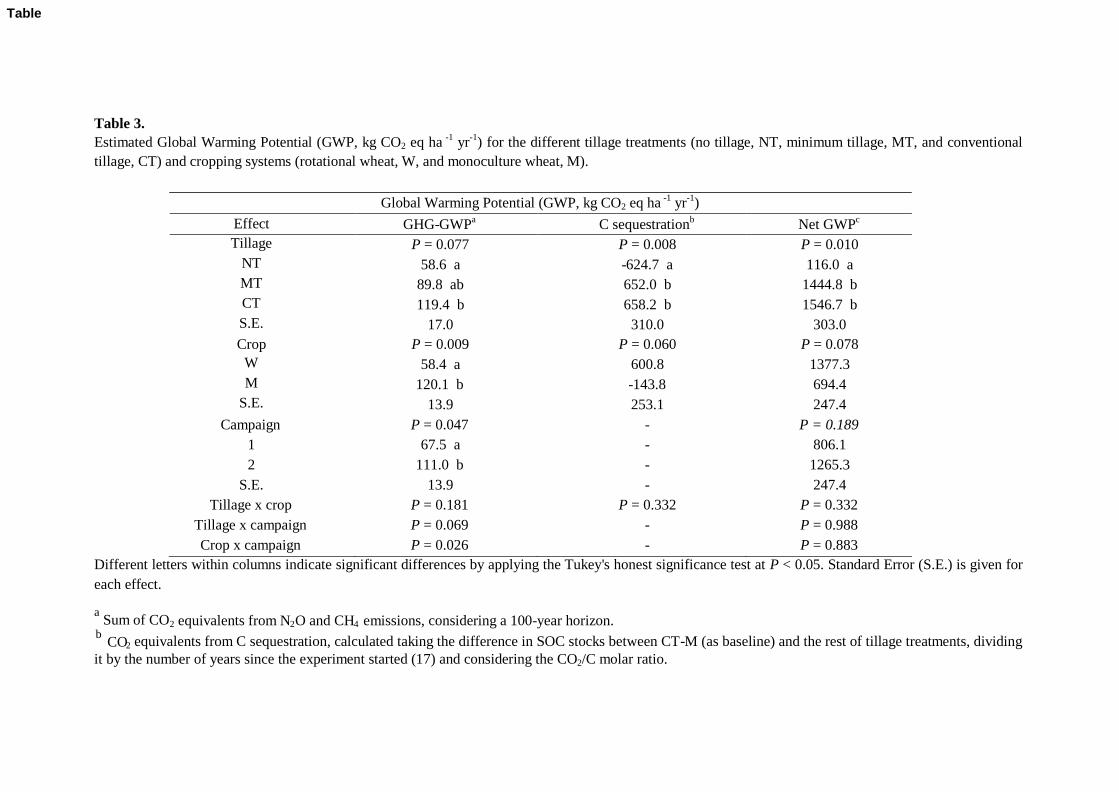
339 The net GWP was significantly lower in NT, than MT and CT (Table 3). Wheat
340 in monoculture tended to decrease the net GWP as a result of higher C sequestration,
341 but differences were not statistically significant at 95% significance level. The GHG-
342 GWP (soil N2O and CH4 fluxes) component was significantly affected by tillage and
343 crop factors, since CT and monoculture wheat significantly increased CO2-eq emissions
344 compared with NT and rotational wheat, respectively. The GWP was higher during
345 campaign 2 as a result of higher N fertilizer input (Fig. 4). Wheat in rotation only
346 resulted in higher C sequestration than the conventional monoculture wheat-CT
347 management under NT.
348 4. Discussion
349 4.1 Effect of campaign, tillage and crop systems on N2O emissions
350 The main factor affecting N2O emissions in this experiment was N input (from
351 chemical fertilizer and crop residues), which was very dependent on the campaign and
352 the soil moisture, which in turn was influenced by rainfall amount and distribution. In
353 this context, N2O fluxes were significantly higher in campaign 2 (with the highest N
354 input and rainfall) (Table 2). Due to the complexity of factors and processes affecting
355 the release of N2O emissions, the effect of tillage and crop factors was not consistent
356 throughout both campaigns, so that the interactions need to be analyzed in detail.
357 Contrary to our hypothesis, tillage systems did not have any significant effect on N2O
358 emissions when the data from both campaigns are considered (Table 2). Our results
359 were in agreement with those of Tellez-Rio et al. (2015) and Guardia et al. (2016) under
360 similar climatic conditions. As observed for tillage, the crop effect did not influence
361 N2O emissions across the 2 campaigns. These results could be explained by the similar
362 rates of synthetic N which was applied to both cropping systems, although a significant
16
363 interaction (Table 2) with the campaign effect (i.e. higher N2O losses in monoculture
364 wheat than in rotational wheat, but only in the second campaign) was observed. This
365 interaction suggests that the effect of residues from previous crops can be comparable
366 and even higher than that of synthetic fertilizers (Lenka and Lal, 2013), especially in
367 calcareous soils and low-input semi-arid cropping systems. Additionally, the effect of
368 tillage was not consistent in the two campaigns, since NT significantly reduced N2O
369 losses during campaign 1 but not during campaign 2 (normal precipitation and N input)
370 compared with to MT or CT. That caused the tillage*campaign interaction to be
371 significant at 10% significance level.
372 The meta-analysis of van Kessel et al. (2013) reported a significant mitigation of
373 N2O emissions under NT in dry climates and long-term (> 10 years) studies. Lower
374 emissions following long-term adoption of NT were explained as a result of the
375 improvements of SOC content and porosity, thus reducing the formation of anaerobic
376 microsites (Six et al., 2004). Lower emissions were generally observed under NT in our
377 study for both campaigns in the rotational wheat system and also for monoculture wheat
378 in campaign 1, supporting the results of Van Kessel et al. (2013). Conversely, the
379 results of monoculture wheat in campaign 2 did not agree with this study, because the
380 monoculture wheat-NT treatment resulted in relatively high N2O fluxes during this
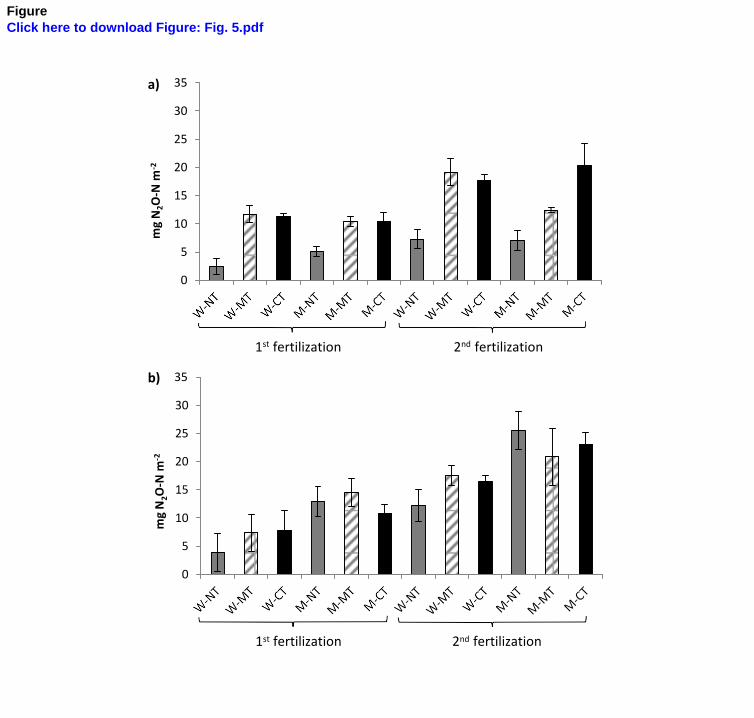
381 campaign, particularly after dressing fertilization (Fig. 5). Therefore, we hypothesized
382 that the influence of the climatic conditions (particularly rainfall) and tillage
383 (incorporating/leaving the residue on surface) on the mineralization of previous crop
384 residues (whose amount was different between cropping systems, as explained in
385 section 2.2) drove the N2O emission pattern in our experiment. In the case of rotational
386 wheat, an important part of crop residue was presumably mineralized during fallow
387 period (the previous year of rotational wheat growing phase), so N2O fluxes may have
17
388 been less dependent on the interaction of crop residue and mineral fertilizer than in
389 continuous cropping of the winter wheat. However, in campaign 1, differences in N2O
390 emissions due to crop residue inputs were not observed between cropping systems. We
391 hypothesized that the low rainfall amounts in campaign 1 limited soil water availability,
392 particularly soil moisture content, which was not enough to promote an intensive N
393 mineralization and crop residues turnover, hence not stimulating N2O production
394 (Mutegi et al., 2010). The number of days with a WFPS above 50%, which has been
395 suggested as a threshold for highest N2O losses (Linn and Doran, 1984; Li et al., 2016)
396 was lower in campaign 1 (from 4 to 48 days) than in campaign 2 (from 7 to 88 days),
397 depending on tillage system, supporting our findings.
398 By contrast, the N2O emissions during campaign 2 were higher in monoculture
399 wheat than in rotational wheat. This effect could be a result of better environmental
400 conditions for the mineralization of crop residues from the previous year (Chen et al.,
401 2013). In monoculture wheat, a combination of residue inputs with a high C:N ratio
402 (mean C:N ratio of 160.3) and mineral N fertilizer, both at seeding and dressing, may
403 have stimulated denitrification losses from mineral N added to soil (Li et al., 2016), as
404 residues provide an energy supply for denitrifying microorganisms (Sarkodie-Addo et
405 al., 2003; Sanz-Cobena et al., 2014). This effect was particularly noticeable after
406 dressing fertilization in the campaign 2, increasing fluxes in the monoculture wheat-NT
407 treatment and changing the trend observed in the first campaign and the beginning of
408 the second (Fig. 5). We hypothesized that the slower mineralization of non-incorporated
409 wheat residues in NT (with respect to MT/CT) favored the N2O release from the
410 interaction of dressing synthetic N and the mineralization of wheat residues, during the
411 stage (spring) and the campaign (2, as opposed to the dry campaign 1) with more
412 favorable conditions for mineralization (Abalos et al., 2013; Guardia et al., 2016).
18
413 4.2 CH4 emissions
414 In this long-term tillage study, cumulative emissions provided a net CH4 sink in
415 all tillage and cropping systems (Table 2), as generally reported in agricultural soils
416
417
under semiarid conditions (Snyder et al., 2009). The negative correlation found between
soil NH4+
content and CH4 fluxes (P < 0.05) in campaign 1 did not agree with previous
418 studies (e.g. Hütsch et al., 1996), which suggested a competitive inhibition of the
419 enzyme responsible for the oxidation of CH4 (CH4 monooxygenase) with the NH3
420
421
monooxygenase (Le Mer and Roger, 2001). Conversely, the meta-analysis of Aronson and Helliker (2010) reported that low amounts of N (<100 kg ha
-1) tend to stimulate
422 methanotrophy, while larger rates are inhibitory. This explains the correlation obtained
423 in our study, in which low N rates were used, particularly during campaign1.
424 Tillage systems did not produce significant differences in CH4 uptake in any
425 campaign, which is consistent with results reported by Guardia et al. (2016) and Tellez-
426 Rio et al. (2015), under semiarid Mediterranean conditions. However, some authors
427 have suggested that the improvement of soil structure in NT, associated with increases
428 in macroporosity and reduction of anaerobic microsites, can favor CH4 consumption
429 (Plaza-Bonilla et al., 2014). Our results may have been a consequence of similar topsoil
430 porosity in all tillage systems and the low soil moisture content maintained during
431 campaign 1 and 2.
432 Greater CH4 oxidation (P < 0.05) was found in rotational wheat than in
433 monoculture wheat in both campaigns, which would suggest that soil conditions under
434 this rainfed rotation can be more favorable for methanotrophic microorganisms. The
435 incorporation of high C:N crop residues has been reported to increase CH4 emissions
436 (Le Mer and Roger, 2001), and that may have partially offset the CH4 oxidation in
19
437 monoculture wheat subplots, where a higher amount of straw was retained/incorporated.
438 This was also reported by Lenka and Lal (2013), who showed that CH4 uptake capacity
439 was increased in bare soil when compared to treatments with residue amendment.
440 4.3 Grain yield, YSNE and N surplus
441 Grain yield was affected by campaigns, which decreased almost 50% in the dry
442 campaign 1 compared to campaign 2, due to the low rainfalls measured in campaign 1.
443 The tillage*campaign interaction in wheat yields showed that the most productive
444 tillage system was dependent on climate and management conditions: NT increased
445 grain yield compared to MT / CT in campaign 1 whereas CT produced higher yield than
446 NT / MT in campaign 2, although the differences were not statistically significant at
447 95% probability level. Controversy still exists about crop yield declines in NT, but CT
448 overall leads to higher crop yields in experiments with high water and nutrient
449 availability (Chatskikh and Olesen, 2007), whereas in semiarid agroecosystems,
450 increases in water content and soil fertility achieved with NT adoption can result in
451 higher yields (Morell et al., 2011; Plaza-Bonilla et al., 2014). Recently, the meta-
452 analysis of van Kessel et al. (2013) reported that long-term NT in dry climates had no
453 significant effect on yield compared to CT, but NT generally produced a yield decline.
454 Although, differences in yield between tillage systems were not observed in this
455 experiment in any campaign, our results seem to suggest that NT enhanced yield with
456 limited rainfall values below 200 mm (campaign 1), whereas higher rainfall ( > 300
457 mm) increased yield in CT (campaign 2). Our results were consistent with De Vita et al.
458 (2007) under Mediterranean conditions who explained the superior effect of NT relative
459 to CT due to lower water evaporation from soil combined with enhanced soil water
460 availability. Considering the average 2-campaigns data, MT resulted in numerically but
461 not statistically lower yield than those of CT or NT. The increased weed pressure in this
20
462 tillage system (Armengot et al., 2015) was also observed in our experimental site, and
463 could explain this tendency. With regard to crop effect, monoculture wheat significantly
464 reduced grain yield compared with rotational wheat, especially in campaign 2. Our
465 results confirm the positive effect of crop rotation on wheat yield under semi-arid
466 conditions (López-Bellido and López-Bellido, 2001).
467 The YSNE from our study were in the lowest range of values reported by van
468 Groeningen et al. (2010). These results indicate that rainfed semi-arid agro-ecosystems
469 with adjusted N rates result in low N2O emissions per kg of N uptake. Since grain yield
470
471
472
was not high (compared with other wheat cropping areas), these low YSNE were a
result of small N2O losses, ranging from 0.07 to 0.23 kg N2O ha-1
yr-1
, compared to those
(0.04-21.21 kg N2O ha-1
) for European arable sites (Rees et al., 2013). Besides the small
473 N2O emissions due to the low N fertilization rates, the low ratio of N2O -N emitted per
474 mineral N applied (see section 3.2) confirms that the N2O emission factors of rainfed
475 semi-arid areas are much lower than the IPCC default value (Aguilera et al., 2013b;
476 Cayuela et al., 2016). In this type of agro-ecosystem, N2O emissions during winter are
477 substantially limited by soil temperatures, while low WFPS is the main limiting factor
478 for large N2O losses during spring (when most growth of winter crops occurs).
479 Additionally, low SOC contents (Ussiri and Lal, 2012) and high soil pH conditions
480 (Baggs et al., 2010), as was the case for our experimental site, may have also
481
482
contributed to low N2O losses and YSNE. As a consequence, the mean values of N
surplus (Table 2) were below the threshold (20-50 kg N ha-1
) of an exponential increase
483 of YSNE (van Groenigen et al., 2010). Remarkably, N surplus was significantly higher
484 in the first campaign, with the driest conditions, in spite of the lower rate of application
485 of synthetic N. This would suggest that there was inefficient uptake of N uptake under
21
486 water stress conditions, resulting in very low grain yields, without higher N2O losses
487 due to unfavorable soil WFPS, as explained above.
488 Our results highlight the importance of crop rotation as an effective YSNE
489 mitigation strategy, due to increased yields and similar (or lower) N2O losses as
490 continuous cropping of wheat. The tillage*campaign interaction for grain yields and the
491 low N2O fluxes drove the tillage*campaign interaction observed for YSNE. Overall, NT
492 significantly mitigated YSNE as opposed to MT, which had no effect on area-scaled
493 N2O losses but was a less advantageous tillage management considering the YSNE
494 ratio. In the campaign with less rainfall than the average, NT mitigated YSNE, as
495 observed by van Kessel et al. (2013) for long-term studies under dry conditions, so it
496 emerges as an interesting option in a global change context with increased aridity. In
497 contrast, in normal rainfall campaigns CT arises as the most sustainable alternative for
498 increasing grain yields while leading to similar N2O losses as NT.
499 4.4 Global Warming Potential
500
501
Almost all treatments (except rotational wheat-NT) had positive GHG-GWP
emission values (19-204 kg CO2-eq ha-1
), showing that in spite of low N2O fluxes, CH4
502 oxidation did not offset N2O losses (Fig. 4). As reported by previous studies (e.g.
503 Aguilera et al., 2013a; 2015; Plaza-Bonilla et al., 2015; Abdalla et al., 2016), NT
504 significantly increased C sequestration compared with CT (Table 3). This occurred
505 despite the higher SOC content in the 15-30 cm layer in CT (as opposed to NT/MT), as
506 suggested by Baker et al. (2007). Carbon sequestration was the main cause of the
507 differences between tillage and crop treatments (Fig. 4), but CO2-eq emissions from
508 inputs and operations were also important, a finding which is consistent with Aguilera
509 et al. (2015) or Guardia et al. (2016). Therefore, our results indicate that management
22
510 practices which promote an increase in C stocks (e.g. NT) should be recommended in
511 semi-arid areas. Supporting our findings, the recent meta-analysis of Abdalla et al.
512 (2016) pointed out that the abatement of CO2-eq emissions through NT adoption is
513 significantly higher in arid climates with low SOC content, as opposed to CT. Nitrous
514 oxide (N2O) emissions have shown to carry less weight in GWP estimates than in
515 previous studies (Mosier et al., 2006; Adviento-Borbe et al., 2007), but uncertainties
516 associated with C sequestration dynamics and its calculation (Guardia et al., 2016) and
517 the large climatic variability in rainfed semi-arid cropping areas, suggest that strategies
518 that mitigate CO2-eq from other GWP components (N2O losses and inputs, e.g. by
519 adjusting N rates) must be also considered.
520 Regarding crop effect, wheat in rotation tended to decrease C sequestration and
521 consequently to enhance GWP (0.05 < P < 0.10). Although the wheat phase of the
522 rotation led to numerically higher CO2-eq than monoculture wheat, the widespread
523 fallow-cereal-legume-cereal rotations provide further opportunities to mitigate the GWP
524 during the legume and fallow phases, when lower (or zero) fertilizer inputs are applied.
525 5. Conclusions
526 Our results showed that cumulative N2O emissions and YSNE were low in this
527 long-term experiment carried out under rainfed semiarid conditions with adjusted N
528 inputs. On average, no significant effect of tillage or cropping system (wheat in rotation
529 and in monoculture) was observed. But this simple overview hides a more complex
530 underlying story; N2O emissions were increased in a normal campaign in monoculture
531 wheat (due to the mineralization of previous wheat residues), as opposed to rotational
532 wheat, and decreased in a dry campaign in NT, as opposed to MT/CT. Therefore,
533 Conservation Agricultural practices (NT and rotation) resulted in similar or lower N2O
23
534 losses than conventional ones. Methane uptake was significantly higher in rotational
535 wheat than in monoculture wheat, while no effect of tillage was observed. Grain yield
536 and consequently YSNE were strongly affected by climatic variability, since NT and
537 CT resulted in significantly higher productivities and lower YSNE in the dry and the
538 normal campaigns, respectively. Wheat in rotation significantly mitigated YSNE, as
539 opposed to monoculture wheat. Higher C sequestration caused NT to reduce Net GWP
540 compared with the rest of tillage treatments. No-till should be recommended in semi-
541 arid areas to mitigate the Net GWP of semi-arid agro-ecosystems, providing the
542 opportunity to reduce YSNE in dry years and therefore in a global change scenario. By
543 contrast, MT performed less well on the basis of YSNE and GWP balances. Wheat in
544 rotation tended to increase Net GWP, but the abatement of YSNE and the opportunities
545 for reducing input CO2 emissions during other rotation phases (fallow and/or legume)
546 may provide and optimum balance between grain yields and GHG mitigation.
547 Acknowledgements
548 The authors are grateful to the Spanish Ministry of Economy and Innovation and
549 the Community of Madrid for their economic support through Projects AGL2012-
550 37815-C05-01-AGR and the Agrisost-CM Project (S2013/ABI- 2717). We also thank
551 the technicians and researchers at the Department of Chemistry and Agricultural
552 Analysis of the Agronomy Faculty (Technical University of Madrid, UPM). We offer a
553 special thanks to the field assistants at the “La Canaleja” field station. This work was
554 done in the frame of the Moncloa Campus of International Excellence (UCM-UPM).
555 References
24
556 Abalos, D., Sanchez-Martin, L., Garcia-Torres, L., van Groenigen, J.W., Vallejo, A., 2014.
557 Management of irrigation frequency and nitrogen fertilization to mitigate GHG and NO
558 emissions from drip-fertigated crops. Sci. Total Environ. 490, 880-888.
559 Abalos, D., Sanz-Cobena, A., Garcia-Torres, L., van Groenigen, J.W., Vallejo, A., 2013. Role
560 of maize stover incorporation on nitrogen oxide emissions in a non-irrigated
561 Mediterranean barley field. Plant Soil 364(1-2), 357-371.
562 Abdalla, K., Chivenge, P., Ciais, P., Chaplot, V., 2015. No-tillage lessens soil CO2 emissions
563 the most under arid and sandy soil conditions: results from a meta-analysis.
564 Biogeosciences 13(12), 3619-3633.
565 Adviento‐Borbe, M.A.A., Haddix, M.L., Binder, D.L., Walters, D.T., Dobermann, A., 2007.
566 Soil greenhouse gas fluxes and global warming potential in four high‐yielding maize
567 systems. Glob. Change Biol. 13(9), 1972-1988.
568 Aguilera, E., Guzmán, G.I., Alonso, A.M., 2015. Greenhouse gas emissions from conventional
569 and organic cropping systems in Spain. I. Herbaceous crops. Agron. Sustain. Dev. 1-12.
570 Aguilera, E., Lassaletta, L., Gattinger, A., Gimeno, B.S., 2013a. Managing soil carbon for
571 climate change mitigation and adaptation in Mediterranean cropping systems: A meta-
572 analysis. Agric. Ecosyst. Environ. 168, 25-36.
573 Aguilera, E., Lassaletta, L., Sanz-Cobena, A., Garnier, J., Vallejo, A., 2013b. The potential of
574 organic fertilizers and water management to reduce N2O emissions in Mediterranean
575 climate cropping systems. A review. Agric. Ecosyst. Environ. 164, 32-52.
576 Álvaro-Fuentes, J., Plaza-Bonilla, D., Arrúe, J.L., Lampurlanés, J., Cantero-Martínez, C., 2014.
577 Soil organic carbon storage in a no-tillage chronosequence under Mediterranean
578 conditions. Plant Soil 376(1-2), 31-41.
25
579 Armengot, L., Berner, A., Blanco-Moreno, J.M., Mäder, P., Sans, F.X. 2015. Long-term
580 feasibility of reduced tillage in organic farming. Agron. Sustain. Dev. 35(1), 339-346.
581 Aronson, E.L., Helliker, B.R., 2010. Methane flux in non-wetland soils in response to nitrogen
582 addition: a meta-analysis. Ecology 91, 3242-3251.
583 Baggs, E.M., Smales, C.L., Bateman, E.J., 2010. Changing pH shifts the microbial source as
584 well as the magnitude of N2O emission from soil. Biol. Fert. Soils, 46(8), 793-805.
585 Baker, J.M., Ochsner, T.E., Venterea, R.T., Griffis, T.J., 2007. Tillage and soil carbon
586 sequestration—What do we really know?. Agric. Ecosyst. Environ. 118, 1-5.
587 Ball, B.C., Scott, A., Parker, J.P., 1999. Field N2O, CO2 and CH4 fluxes in relation to tillage,
588 compaction and soil quality in Scotland. Soil Till. Res. 53(1), 29-39.
589 Cayuela, M.L., Aguilera, E., Sanz-Cobena, A., Adams, D.C., Abalos, D., Barton, L., Ryals, R.,
590 Silver, W.L., Alfaro, M.A., Pappa, V.A., Smith, P., Garnier, J., Billen, G., Bouwman,
591 L., A Bondeau, A., Lassaletta, L., 2016. Direct nitrous oxide emissions in
592 Mediterranean climate cropping systems: emission factors based on a meta-analysis of
593 available measurement data. Agr. Ecosyst. Environ. Under review.
594 Chan, A.S.K., Parkin, T.B., 2001. Methane oxidation and production activity in soils from
595 natural and agricultural ecosystems. J. Environ. Qual., 30(6), 1896-1903.
596 Chatskikh, D., Olesen, J.E., 2007. Soil tillage enhanced CO2 and N2O emissions from loamy
597 sand soil under spring barley. Soil Till. Res. 97(1), 5-18.
598 Chen, H., Li, X., Hu, F., Shi, W., 2013. Soil nitrous oxide emissions following crop residue
599 addition: a meta‐analysis. Glob. Change Biol. 19(10), 2956-2964.
600 Danielson, R.E., Sutherland, P.L., Klute, A., 1986. Porosity. Methods of soil analysis. Part 1.
601 Physical and mineralogical methods pp. 443-461.
26
602 De Vita, P., Di Paolo, E., Fecondo, G., Di Fonzo, N., Pisante, M., 2007. No-tillage and
603 conventional tillage effects on durum wheat yield, grain quality and soil moisture
604 content in southern Italy. Soil Till. Res. 92(1), 69-78.
605 Dendooven, L., Patino-Zúniga, L., Verhulst, N., Luna-Guido, M., Marsch, R., Govaerts, B.,
606 2012. Global warming potential of agricultural systems with contrasting tillage and
607 residue management in the central highlands of Mexico. Agric. Ecosyst. Environ. 152,
608 50-58.
609 Dunfield, P., Knowles, R., 1995. Kinetics of inhibition of methane oxidation by nitrate, nitrite,
610 and ammonium in a humisol. Appl. Environ. Microb. 61, 3129-3135.
611 Ellert, B.H., Bettany, J.R., 1995. Calculation of organic matter and nutrients stored in soils
612 under contrasting management regimes. Can. J. Soil Sci. 75(4), 529-538.
613 Firestone, M.K., Davidson, E.A., 1989. Microbiological basis of NO and N2O production and
614 consumption in soil, in Andeae, M.O., Schimel, D.S. (Eds.), Exchange of Trace Gases
615 between Terrestrial Ecosystems and the Atmosphere Chichester: Wiley, pp. 7-21.
616 Gómez-Paccard, C., Hontoria, C., Mariscal-Sancho, I., Pérez, J., León, P., González, P., Espejo,
617 R., 2015. Soil–water relationships in the upper soil layer in a Mediterranean Palexerult
618 as affected by no-tillage under excess water conditions–Influence on crop yield. Soil
619 Till. Res. 146, 303-312.
620 Grossman, R.B., Reinsch, T.G., 2002. 2.1 Bulk density and linear extensibility. Methods of Soil
621 Analysis: Part 4 Physical Methods, (methodsofsoilan4), 201-228.
622 Guardia, G., Tellez-Rio, A., García-Marco, S., Martin-Lammerding, D., Tenorio, J.L., Ibáñez,
623 M.Á., Vallejo, A., 2016. Effect of tillage and crop (cereal versus legume) on greenhouse
624 gas emissions and Global Warming Potential in a non-irrigated Mediterranean field.
625 Agric. Ecosyst. Environ. 221, 187–197.
27
626 Huang, Y., Zou, J., Zheng, X., Wang, Y., Xu, X., 2004. Nitrous oxide emissions as influenced
627 by amendment of plant residues with different C: N ratios. Soil Biol. Biochem. 36(6),
628 973-981.
629 Hütsch, B.W., Mengel, K., Russell, P., 1996. CH4 oxidation in two temperate arable soils as
630 affected by nitrate and ammonium application. Biol. Fertil. Soils. 23(1), 86-92.
631 Kimani, S. K., Nandwa, S.M., Mugendi, D.N., Obanyi, S. N., Ojiem, J., Murwira, H.K.,
632 Bationo, A., 2003. Principles of integrated soil fertility management. In: Gichuri, M.P.,
633 Bationo, A., Bekunda, M.A., Goma, H.C., Mafongoya, P.L., Mugendi, D.N., Murwuira,
634 H.K., Nandwa, S.M., Nyathi, P., Swift, M.J. (Eds.), Soil fertility management in Africa:
635 A regional perspective, Academy Science Publishers (ASP), Centro Internacional de
636 Agricultura Tropical (CIAT), Tropical Soil Biology and Fertility (TSBF), Nairobi, KE,
637 pp. 51-72.
638 Lal, R., 2004. Carbon emission from farm operations. Environ. Int. 30(7), 981-990.
639 Le Mer, J., Roger, P., 2001. Production, oxidation, emission and consumption of methane by
640 soils: a review. Eur. J. Soil Biol. 37, 25-50.
641 Lenka, N. K., Lal, R., 2013. Soil aggregation and greenhouse gas flux after 15 years of wheat
642 straw and fertilizer management in a no-till system. Soil Till. Res. 126, 78-89.
643 Li, X., Sørensen, P., Olesen, J. E., Petersen, S.O., 2016. Evidence for denitrification as main
644 source of N2O emission from residue-amended soil. Soil Biol. Biochem. 92, 153-160.
645 Linn, D.M., Doran, J.W., 1984. Effect of water-filled pore space on carbon dioxide and nitrous
646 oxide production in tilled and nontilled soils. Soil Sci. Soc. Am. J. 48, 1267-1272.
647 López-Bellido, R.J., López-Bellido, L., 2001. Efficiency of nitrogen in wheat under
648 Mediterranean conditions: effect of tillage, crop rotation and N fertilization. Field Crop.
649 Res. 71(1), 31-46.
28
650 Malhi, S.S., Lemke, R., 2007. Tillage, crop residue and N fertilizer effects on crop yield,
651 nutrient uptake, soil quality and nitrous oxide gas emissions in a second 4-yr rotation
652 cycle. Soil Till.Res. 96, 269-283.
653 Martin-Lammerding, D., Hontoria, C., Tenorio, J.L., Walter, I., 2011. Mediterranean dryland
654 farming: effect of tillage practices on selected soil properties. Agron. J. 103, 382-389.
655 Morell, F.J., Lampurlanés, J., Álvaro-Fuentes, J., Cantero-Martínez, C., 2011. Yield and water
656 use efficiency of barley in a semiarid Mediterranean agroecosystem: Long-term effects
657 of tillage and N fertilization. Soil Till. Res. 117, 76-84.
658 Mosier, A.R., Halvorson, A.D., Reule, C.A., Liu, X.J., 2006. Net global warming potential and
659 greenhouse gas intensity in irrigated cropping systems in northeastern Colorado. J.
660 Environ. Qual. 35(4), 1584-1598.
661 Mutegi, J.K., Munkholm, L.J., Petersen, B.M., Hansen, E.M., Petersen, S.O., 2010. Nitrous
662 oxide emissions and controls as influenced by tillage and crop residue management
663 strategy. Soil Biol. Biochem. 42(10), 1701-1711.
664 Nelson, D.W., Sommers, L.E., 1996. Total carbon, organic carbon, and organic matter. In:
665 Sparks, D.L., Page, A.L., Helmke, P.A., Loeppert, R.H., Soltanpour, P.N., Tabatabai,
666 M.A., Johnston, C.T., Sumner, M.E. (Eds.), Methods of Soil Analysis, Part 3. Chemical
667 Methods. ASA-SSSA, Madison, WI, USA, pp. 961–1010.
668 Pelster, D.E., Larouche, F., Rochette, P., Chantigny, M.H., Allaire, S., Angers, D.A., 2011.
669 Nitrogen fertilization but not soil tillage affects nitrous oxide emissions from a clay
670 loam soil under a maize–soybean rotation. Soil Till. Res.115, 16-26.
671 Plaza-Bonilla, D., Arrúe, J. L., Cantero-Martínez, C., Fanlo, R., Iglesias, A., Álvaro-Fuentes, J.,
672 2015. Carbon management in dryland agricultural systems. A review. Agron. Sustain.
673 Dev. 35(4), 1319-1334.
29
674 Plaza-Bonilla, D., Cantero-Martínez, C., Bareche, J., Arrúe, J.L., Álvaro-Fuentes, J., 2014. Soil
675 carbon dioxide and methane fluxes as affected by tillage and N fertilization in dryland
676 conditions. Plant Soil 381, 111-130.
677 Rees, R.M., Augustin, J., Alberti, G., Ball, B.C., Boeckx, P., Cantarel, A., Castaldi, S.,
678 Chirinda, N., Chojnicki, B., Giebels, M., Gordon, H., Grosz, B., Horvath, L., Juszczak,
679 R., Kasimir Klemedtsson, Å., Klemedtsson, L., Medinets, S., Machon, A., Mapanda, F.,
680 Nyamangara, J., Olesen, J.E., Reay, D.S., Sanchez, L., Sanz-Cobena, A., Smith, K.A.,
681 Sowerby, A., Sommer, M., Soussana, J.F., Stenberg, M., Topp, C.F.E., van Cleemput,
682 O., Vallejo, A., Watson C.A., Wuta, M., 2013. Nitrous oxide emissions from European
683 agriculture–an analysis of variability and drivers of emissions from field experiments.
684 Biogeosciences 10, 2671-2682.
685 Robertson, G.P., Paul, E.A., Harwood, R.R., 2000. Greenhouse gases in intensive agriculture:
686 contributions of individual gases to the radiative forcing of the atmosphere. Science
687 289, 1922-1925.
688 Sanz-Cobena, A., García-Marco, S., Quemada, M., Gabriel, J.L., Almendros, P., Vallejo, A.,
689 2014. Do cover crops enhance N2O, CO2 or CH4 emissions from soil in Mediterranean
690 arable systems? Sci. Total Environ. 466, 164-174.
691 Sarkodie‐Addo, J., Lee, H.C., Baggs, E.M., 2003. Nitrous oxide emissions after application of
692 inorganic fertilizer and incorporation of green manure residues. Soil Use
693 Manage. 19(4), 331-339.
694 Six, J., Ogle, S.M., Conant, R.T., Mosier, A.R., Paustian, K., 2004. The potential to mitigate
695 global warming with no‐tillage management is only realized when practised in the long
696 term. Glob. Change Biol. 10, 155-160.
30
697 Snyder, C.S., Bruulsema, T.W., Jensen, T.L., Fixen, P.E., 2009. Review of greenhouse gas
698 emissions from crop production systems and fertilizer management effects. Agric.
699 Ecosyst. Environ. 133, 247-266.
700 Soil Survey Staff, 2010. Keys to soil taxonomy, 11th edn. USDA-Natural Resources
701 Conservation Service, Washington.
702 Stocker, T.F., Qin, D., Plattner, G.K., Tignor, M., Allen, S.K., Boschung, J., Nauels, A., Xia,
703 Y., Bex, V., Midgley P.M., 2013. Climate change 2013: the physical science basis.
704 Contribution of Working Group I to the Fifth Assessment Report of the
705 Intergovernmental Panel on Climate Change. 1–1535. Cambridge, United Kingdom and
706 New York, NY, USA, Cambridge University Press.
707 Tellez-Rio, A., García-Marco, S., Navas, M., López-Solanilla, E., Rees, R.M., Tenorio, J.L.,
708 Vallejo, A., 2015. Nitrous oxide and methane emissions from a vetch cropping season
709 are changed by long-term tillage practices in a Mediterranean agroecosystem. Biol.
710 Fertil. Soils. 51(1), 77-88.
711 Triberti, L., Nastri, A., Baldoni, G., 2016. Long-term effects of crop rotation, manure and
712 mineral fertilisation on carbon sequestration and soil fertility. Eur. J. Agron. 74, 47-55.
713 Ussiri, D., Lal, R., 2012. Soil emission of nitrous oxide and its mitigation, Springer Science &
714 Business Media.
715 van Groenigen, J.W., Velthof, G.L., Oenema, O., van Groenigen, K.J., van Kessel, C., 2010.
716 Towards an agronomic assessment of N2O emissions: a case study for arable crops. Eur.
717 J. Soil Sci. 61, 903-913.
718 van Kessel, C., Venterea, R., Six, J., Adviento‐Borbe, M.A., Linquist, B., van Groenigen, K.J.,
719 2013. Climate, duration, and N placement determine N2O emissions in reduced tillage
720 systems: a meta‐analysis. Glob. Change Biol. 19, 33-44.
31
721 West, T.O., Marland, G., 2002. A synthesis of carbon sequestration, carbon emissions, and net
722 carbon flux in agriculture: comparing tillage practices in the United States. Agric.
723 Ecosyst. Environ. 91, 217-232.
724 Yonemura, S., Nouchi, I., Nishimura, S., Sakurai, G., Togami, K., Yagi, K., 2014. Soil
725 respiration, N2O, and CH4 emissions from an Andisol under conventional-tillage and
726 no-tillage cultivation for 4 years. Biol. Fertil. Soils. 50(1), 63-74.
727 Figure captions
728 Fig. 1a Weekly mean soil temperature (°C) and rainfall (mm) and b evolution of soil
729 WFPS (%) in the different tillage (no tillage, NT, minimum tillage, MT, and
730 conventional tillage, CT) and cropping (rotational wheat, W, and monoculture wheat,
731 M) treatments during both crop campaigns.
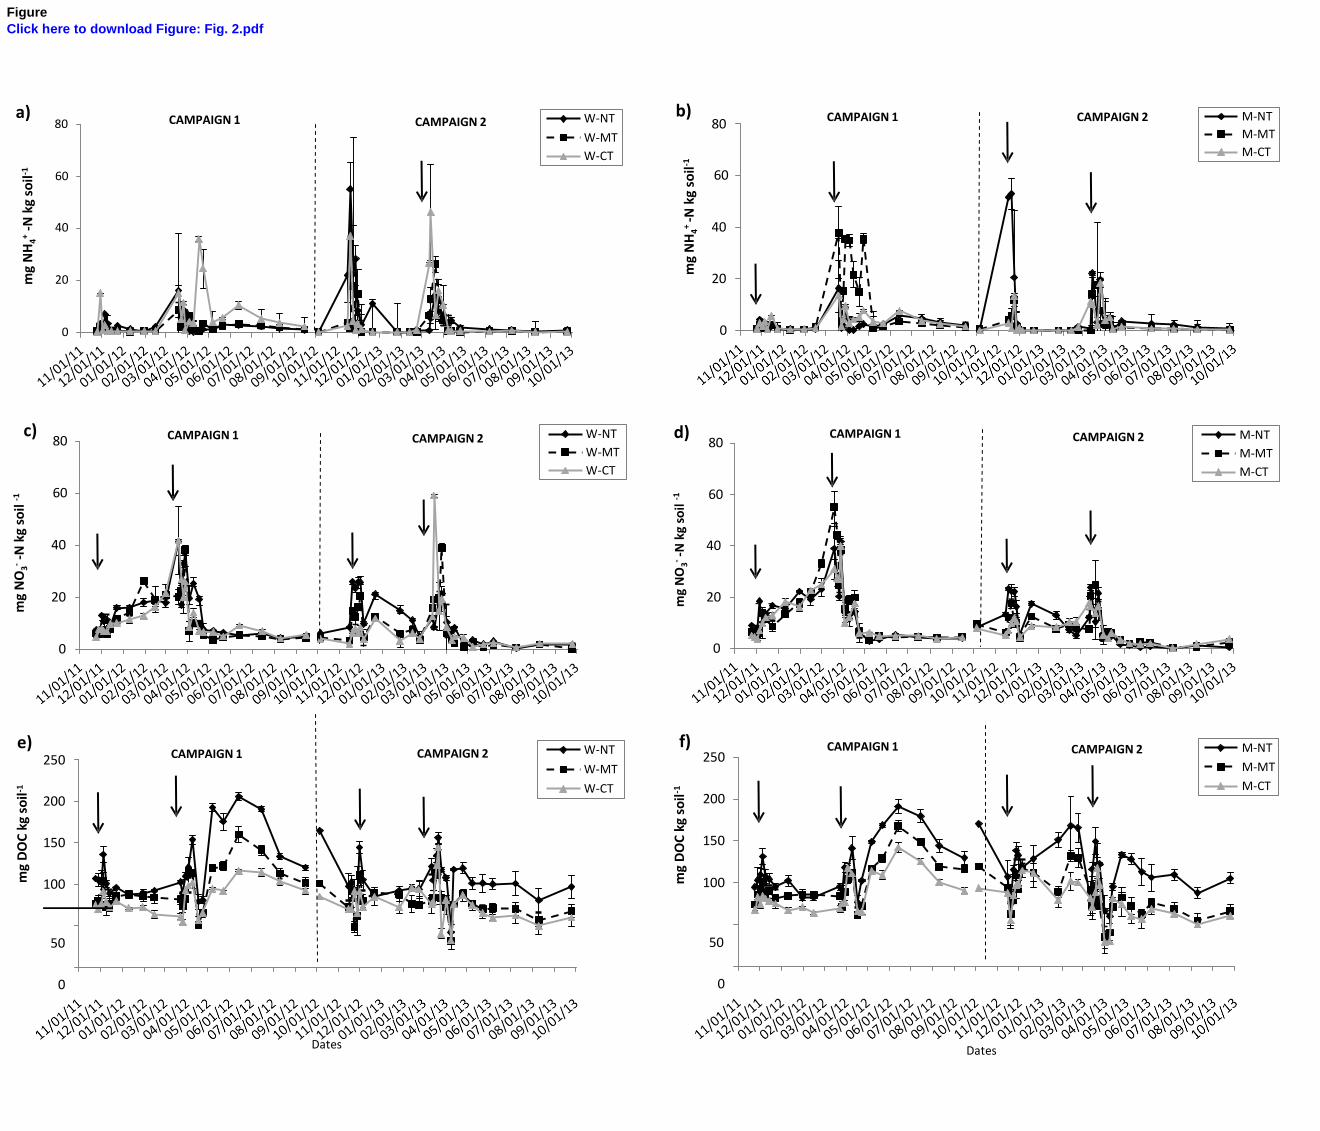
732 Fig. 2a, b NH4+
-N; c, d NO3- -N; and e, f DOC concentrations in the 0–10 cm soil layer
733 during both crop campaigns for the different tillage (no tillage, NT, minimum tillage,
734 MT, and conventional tillage, CT) treatments. Data are provided separately for
735 rotational wheat (W, right) and monoculture wheat (M, left) treatments. The arrows
736 indicate the dates of application of synthetic N. Vertical lines indicate standard errors.
737 Fig. 3 Fluxes of N2O-N during both crop campaigns for the different tillage treatments
738 (no tillage, NT, minimum tillage, MT, and conventional tillage, CT) and cropping
739 systems: a rotational wheat (W), and b monoculture wheat (M). The arrows indicate the
740 dates of application of synthetic N. Vertical lines indicate standard errors.
741 Fig. 4 Relative contribution of each component to Net Global Warming Potential
742 (GWP) in each tillage (no tillage, NT, minimum tillage, MT, and conventional tillage,
743 CT) and cropping treatment (rotational wheat, W, and monoculture wheat, M) during
744 both crop campaigns.
32
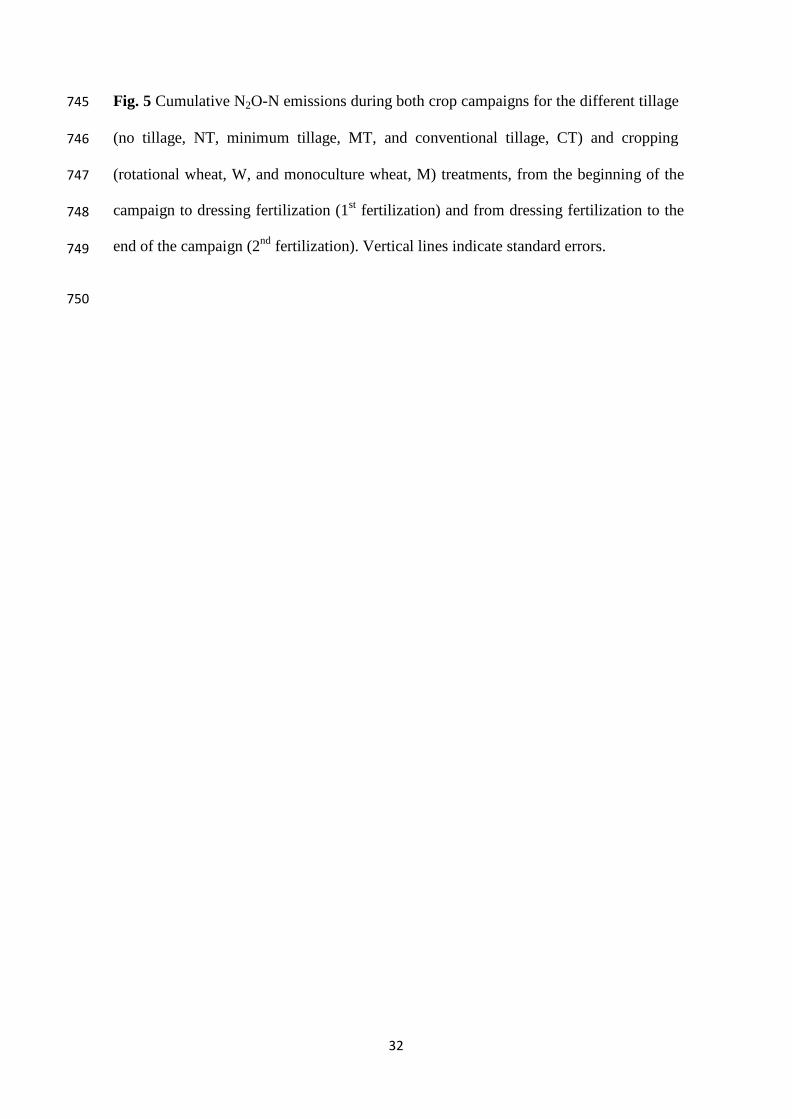
745 Fig. 5 Cumulative N2O-N emissions during both crop campaigns for the different tillage
746 (no tillage, NT, minimum tillage, MT, and conventional tillage, CT) and cropping
747
748
749
750
(rotational wheat, W, and monoculture wheat, M) treatments, from the beginning of the
campaign to dressing fertilization (1st
fertilization) and from dressing fertilization to the
end of the campaign (2nd
fertilization). Vertical lines indicate standard errors.
WFP
S (%
) R
ain
fall
(mm
)
Soil
Tem
per
atu
re (
◦C
)
Figure
Click here to download Figure: Fig. 1.pdf
a) 80
Rainfall (mm) Soil Temperature (⁰C) 30
25
60
20
40 15
10
20
5
0 0
b) CAMPAIGN 1 CAMPAIGN 2 80
60
40
W-NT
W-MT
W-CT
M-NT
M-MT
M-CT
20
0
Dates
mg
NO
3- -N
kg
soil
-1
mg
DO
C k
g so
il-1
mg
NH
4+ -
N k
g so
il-1
-1
- -1
m
g D
OC
kg
soil
mg
NO
3 -
N k
g so
il m
g N
H4+
-N k
g so
il-1
Figure
Click here to download Figure: Fig. 2.pdf
a) 80 CAMPAIGN 1
60
CAMPAIGN 2 W-NT b)
80 W-MT
W-CT
60
CAMPAIGN 1
CAMPAIGN 2
M-NT
M-MT
M-CT
40 40
20 20
0 0
c)
80
60
CAMPAIGN 1 CAMPAIGN 2
W-NT
W-MT
W-CT
d) 80
60
CAMPAIGN 1
CAMPAIGN 2
M-NT
M-MT
M-CT
40 40
20 20
0 0
e) 250
200
CAMPAIGN 1
CAMPAIGN 2
W-NT
W-MT
W-CT
f) 250
200
CAMPAIGN 1
CAMPAIGN 2
M-NT
M-MT
M-CT
150 150
100
100
50 50
0
Dates
0
Dates
mg
N-N
2O m
d
-2
-1
mg
N-N
2O m
-2 d
-1
Figure
Click here to download Figure: Fig. 3.pdf
a)
0,7
0,5
CAMPAIGN 1
CAMPAIGN 2
W-NT
W-MT
W-CT
0,3
0,1
-0,1
-0,3
b)
0,7
0,5
CAMPAIGN 1
CAMPAIGN 2
M-NT
M-MT
M-CT
0,3
0,1
-0,1
-0,3
Dates
Ne
t G
WP
(kg
CO
2 h
a-1)
Figure
Click here to download Figure: Fig. 4.pdf
Inputs
3000
2500
2000
Operations C sequestration GHG-GWP
1500
1000
500
0
-500
-1000
-1500
W-NT W-MT W-CT M-NT M-MT M-CT W-NT W-MT W-CT M-NT M-MT M-CT
Campaign 1 Campaign 2
Crop and tillage treatments
-2
mg
N2O
-N m
m
g N
2O-N
m-2
Figure
Click here to download Figure: Fig. 5.pdf
a) 35
30
25
20
15
10
5
0
1st fertilization 2nd fertilization
b) 35
30
25
20
15
10
5
0
1st fertilization 2nd fertilization
Table
Table 1.
SOC content (g C kg-1
) in the 0-7.5, 7.5-15 and 15-30 cm soil layers, total SOC content (Mg C ha-1
) in the 0-30 cm depth of the different tillage treatments (no
tillage, NT, minimum tillage, MT, and conventional tillage, CT) and cropping system (rotational wheat, W, and monoculture wheat ,M).
SOC (g kg
-1) Total SOC (Mg ha
-1)
Depth (cm) 0-7.5 7.5-15 15-30 0-30
Tillage P = 0.001 P = 0.516 P = 0.035 P = 0.033
NT 11.2 b 5.8 4.6 a 28.8 b
MT 6.7 a 5.4 4.6 a 22.9 a
CT 5.7 a 5.4 5.3 b 22.9 a
S.E. 0.7 0.3 0.2 1.4
Crop
W
P = 0.186
7.2
P = 0.008
4.9 a
P = 0.117
4.7
P = 0.070
23.1
M 8.5 6.1 b 5.1 26.6
S.E. 0.6 0.2 0.1 1.1
Tillage x crop
P = 0.713
P = 0.130
P = 0.098
P = 0.308
Different letters within columns indicate significant differences by applying the Tukey's honest significance test at P < 0.05. Standard Error (S.E.) is given for
each effect.
Table
Table 2.
Total cumulative N2O-N and CH4-C fluxes, grain-yield, Yield-scaled N2O emissions (YSNE) and N surplus in the different tillage treatments (no tillage, NT,
minimum tillage, MT, and conventional tillage, CT) and cropping systems (rotational wheat, W, and monoculture wheat, M), in campaign 1 and campaign 2,
and during the two seasons of the experiment.
Effect
N2O cumulative emission (g N2O-N ha
-1 yr
-1)
CH4 cumulative emission (g CH4 -C ha
-1 yr
-1)
Grain yield
(kg grain ha-1
) YSNE
(g N2O-N kg N up-1
)
( N surplus
Kg N ha-1
)
Camp. 1 Camp. 2 2-season Camp. 1 Camp. 2 2-season Camp. 1 Camp. 2 2-season Camp. 1 Camp. 2 2-season Camp. 1 Camp. 2 2-season
Tillage * ns ns ns ns ns ns ns ns * * * ns ns ns
NT 72.0 a 181.6 130.3 -670.6 -654.2 -662.4 2068 3233 2650 1.7 a 3.4 b 2.5 a 21.6 -6.5 7.5
MT 158.1 b 191.5 174.9 -694.8 -866 -780.7 1151 3241 2196 5.3 b 3.1 ab 4.1 b 6.4 -4.4 1.0
CT 190.1 b 198.0 194.0 -639.6 -708.5 -674.0 1530 3885 2708 5.4 b 2.5 a 3.9 ab 12.0 13.2 12.6
S.E. 14.7 17.5 13.6 69.1 42.7 48.7 192 394 209 0.6 0.1 0.3 3.3 6.6 3.8
Crop
ns
*
ns
*
*
***
ns
ns
*
ns
**
*
ns
ns
ns
W 147.1 154.0 b 150.6 -792.0 a -919.9 a -855.9 a 1832.5 3903.2 2868 b 3.7 2.1 a 2.9 a 21.4 8.7 15.0
M 133.1 231.0 a 182.2 -544.6 b -566.2 b -555.4 b 1333.6 3003.3 2169 a 4.5 3.8 b 4.2 b 5.3 -7.2 -0.9
S.E. 28.0 18.0 12.5 62.6 82.7 29.7 240 322 171 0.9 0.3 0.4 4.9 7.2 4.0
Camp. * ns *** * *
1 140.1 a -668.4 1583 a 4,1 b 13.3 b
2 192.7 b -743.1 3453 b 3.0 a 0.8 a
S.E. 11.1 39.8 92 0.3 4.1
Till. x Crop
ns
ns
ns
ns
ns
ns
ns
ns
ns
ns
ns
ns
ns
ns
ns
Till. x Camp. ns ns * * ns
Crop x Camp. * ns ns ns ns

Different letters within columns indicate significant differences by applying the Tukey's honest significance test at* P < 0.05, **P < 0.01, *** P < 0.001. "ns"
means no significant. Standard Error (S.E.) is given for each effect.
2
Table
Table 3.
Estimated Global Warming Potential (GWP, kg CO2 eq ha -1
yr-1
) for the different tillage treatments (no tillage, NT, minimum tillage, MT, and conventional
tillage, CT) and cropping systems (rotational wheat, W, and monoculture wheat, M).
Global Warming Potential (GWP, kg CO2 eq ha -1
yr-1
)
Effect GHG-GWPa C sequestration
b Net GWP
c
Tillage
NT
MT
CT
S.E.
P = 0.077
58.6 a
89.8 ab
119.4 b
17.0
P = 0.008
-624.7 a
652.0 b
658.2 b
310.0
P = 0.010
116.0 a
1444.8 b
1546.7 b
303.0
Crop
W
P = 0.009
58.4 a
P = 0.060
600.8
P = 0.078
1377.3
M 120.1 b -143.8 694.4
S.E. 13.9 253.1 247.4
Campaign P = 0.047 - P = 0.189
1 67.5 a - 806.1
2 111.0 b - 1265.3
S.E. 13.9 - 247.4
Tillage x crop P = 0.181 P = 0.332 P = 0.332
Tillage x campaign P = 0.069 - P = 0.988
Crop x campaign P = 0.026 - P = 0.883
Different letters within columns indicate significant differences by applying the Tukey's honest significance test at P < 0.05. Standard Error (S.E.) is given for
each effect.
a Sum of CO
equivalents from N O and CH
emissions, considering a 100-year horizon.
2 2 4
b CO equivalents from C sequestration, calculated taking the difference in SOC stocks between CT-M (as baseline) and the rest of tillage treatments, dividing
it by the number of years since the experiment started (17) and considering the CO2/C molar ratio.

c Sum of C02 equivalents from N20 and CR. emissions, C sequestration, operations and inputs.