Embed Size (px)
Citation preview

Scotland’s Economic and
Fiscal Forecasts
May 2018

© Crown copyright 2018
This publication is licensed under the terms of the Open Government Licence v3.0
except where otherwise stated. To view this licence, visit:
http://www.nationalarchives.gov.uk/doc/open-government-licence/version/3/ or write
to the Information Policy Team, The National Archives, Kew, London TW9 4DU, or
email: [email protected]
Where we have identified any third party copyright information you will need to obtain
permission from the copyright holders concerned.
This publication is available at www.fiscalcommission.scot
Any enquiries regarding this publication should be sent to us at: Scottish Fiscal
Commission, Governor’s House, Regent Road, Edinburgh EH1 3DE or
ISBN: 978-1-9998487-8-1
Published by the Scottish Fiscal Commission, May 2018
Laying Number: SG/2018/83

1
Foreword 1
The Scottish Fiscal Commission is the independent fiscal
institution for Scotland. Today, we present updated independent and
official forecasts of Scottish GDP, devolved tax receipts and devolved
social security expenditure.
These forecasts are a key element of the Scottish Budget process. They
represent the collective view of the Scottish Fiscal Commission, comprising the three
Commissioners. We take full responsibility for the judgements that underpin them
and for the conclusions we have reached.
The latest outlook for the Scottish economy remains subdued, with growth remaining
under 1.0 per cent for the period of the forecast. Real wage growth has been weak
over the last few years: real wages are lower today than they were a decade ago.
We provide a detailed assessment of Scotland’s recent wage growth in the report,
and have concluded that the outlook is weaker than was expected in December. This
is the main evolution in our judgement since our previous forecast, and has
consequences for our forecasts of income tax, which are also lower.
In producing our forecasts we have put into practice the new Protocol agreed with
the Scottish Government in March. This took on board the lessons learned during
the production of the forecasts that feed into the Scottish Budget 2018-19. This new
Protocol is described in the introduction to the report. Our relationship with the
Scottish Government has evolved further as we prepared the forecasts, and we will
continue to learn from what works well and what could be improved.
We would like to thank the hard-working and rigorous staff of the Commission for
their support in the production of our forecasts and underpinning analysis. We would
also like to thank officials from across the public sector for their work challenging us
on our judgements and ensuring that we considered all the available evidence. This
includes the Scottish Government, Revenue Scotland, the OBR, and HMRC.
We would also like to thank our key data providers in ensuring that we had the data
required in good time. In particular, the teams in HMRC for their flexibility in
accelerating their analysis and data provision to support our income tax forecast.
Dame Susan Rice DBE Professor Alasdair Smith David Wilson

2
3
Contents Foreword ............................................................................................................................ 1
Summary ............................................................................................................................ 5
Chapter 1 Introduction .................................................................................................... 27
Chapter 2 Economy ......................................................................................................... 37
Chapter 3 Tax .................................................................................................................. 95
Chapter 4 Social Security ............................................................................................. 151
Chapter 5 Borrowing ..................................................................................................... 189
Annex A Policy Costings .............................................................................................. 199
Annex B Policy Recostings .......................................................................................... 205
Annex C Developing our approach to forecasting VAT ............................................. 209

4
Scotland’s Economic and Fiscal Forecasts May 2018

5
Summary
Introduction
1 In April 2017 the Scottish Fiscal Commission became responsible for
producing independent economic and fiscal forecasts to inform the Scottish
Budget.
2 The Commission produces five-year forecasts of:
Revenue from fully devolved taxes
Non-savings non-dividend income tax receipts
Devolved social security expenditure
3 We also forecast onshore GDP in Scotland for the next five years, which
feeds into our fiscal forecasts.
4 The reasonableness of the Scottish Government’s borrowing projections are
assessed by the Commission. In addition, we determine whether the
condition (a ‘Scotland-specific economic shock’) that triggers additional
borrowing powers for the Scottish Government is met.
Economy
5 We published our first forecasts of the Scottish economy in December 2017.
At the time, we described the outlook for growth as subdued. Our view of the
overall outlook is broadly unchanged. The economy is growing, but the rate
of economic growth has been slower over the last decade than historic
average rates. Our view remains that this pattern of slower growth is likely to
persist over the next five years. Our headline economy forecasts are shown
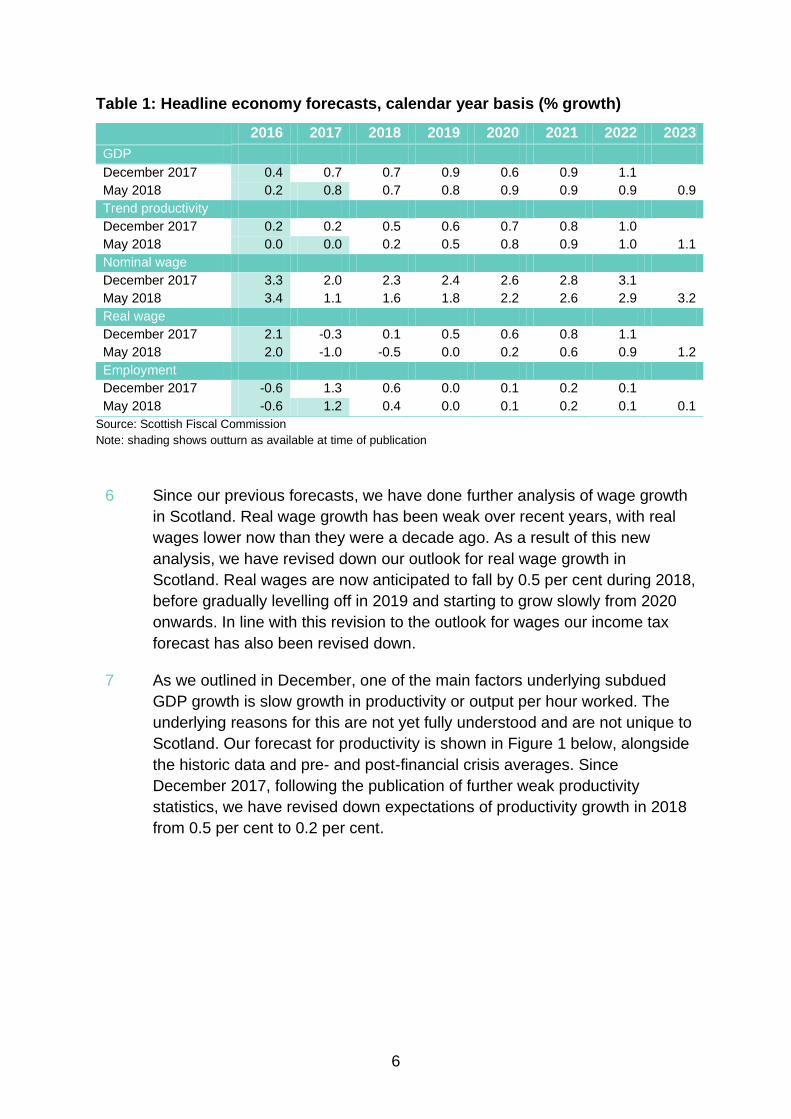
in Table 1, with comparisons to our forecasts published in December.
6
Table 1: Headline economy forecasts, calendar year basis (% growth)
2016 2017 2018 2019 2020 2021 2022 2023
GDP
December 2017 0.4 0.7 0.7 0.9 0.6 0.9 1.1
May 2018 0.2 0.8 0.7 0.8 0.9 0.9 0.9 0.9
Trend productivity
December 2017 0.2 0.2 0.5 0.6 0.7 0.8 1.0
May 2018 0.0 0.0 0.2 0.5 0.8 0.9 1.0 1.1
Nominal wage
December 2017 3.3 2.0 2.3 2.4 2.6 2.8 3.1
May 2018 3.4 1.1 1.6 1.8 2.2 2.6 2.9 3.2
Real wage
December 2017 2.1 -0.3 0.1 0.5 0.6 0.8 1.1
May 2018 2.0 -1.0 -0.5 0.0 0.2 0.6 0.9 1.2
Employment
December 2017 -0.6 1.3 0.6 0.0 0.1 0.2 0.1
May 2018 -0.6 1.2 0.4 0.0 0.1 0.2 0.1 0.1
Source: Scottish Fiscal Commission
Note: shading shows outturn as available at time of publication
6 Since our previous forecasts, we have done further analysis of wage growth
in Scotland. Real wage growth has been weak over recent years, with real
wages lower now than they were a decade ago. As a result of this new
analysis, we have revised down our outlook for real wage growth in
Scotland. Real wages are now anticipated to fall by 0.5 per cent during 2018,
before gradually levelling off in 2019 and starting to grow slowly from 2020
onwards. In line with this revision to the outlook for wages our income tax
forecast has also been revised down.
7 As we outlined in December, one of the main factors underlying subdued
GDP growth is slow growth in productivity or output per hour worked. The
underlying reasons for this are not yet fully understood and are not unique to
Scotland. Our forecast for productivity is shown in Figure 1 below, alongside
the historic data and pre- and post-financial crisis averages. Since
December 2017, following the publication of further weak productivity
statistics, we have revised down expectations of productivity growth in 2018
from 0.5 per cent to 0.2 per cent.

7
Figure 1: Historic productivity and forecast, constant prices (2014 = 100)
Source: Scottish Fiscal Commission
8 In isolation, weak economic growth observed in recent years would suggest
a lower forecast for the next five years than pre-2008 historic averages.
Scotland faces additional challenges which mean the period of slower
growth is unlikely to end in the near future.
9 Future downside risks include the UK’s changing relationship with the EU, a
weakening outlook for global trade, Scotland’s industrial and demographic
structure and weak onshore demand linked to activity in the oil and gas
industry.
UK-EU relationship
10 The Commission must make assumptions about the impact of Brexit on
Scotland. At the time of preparation of our forecasts, the outcome of the
negotiations remains unclear, and it is therefore difficult to forecast the
impact on the economy.
11 Since our previous forecasts there have been a number of developments on
Brexit, including the UK-EU agreement over the terms of a ‘transition period’
scheduled to last until 31 December 2020; the British Prime Minister’s
landmark speech on the future economic partnership with the European
Union; and, the approval by EU leaders of guidelines setting out the EU’s
80
85
90
95
100
105
110
1998 2001 2005 2008 2012 2015 2019 2022
SFC forecast Outturn
Pre-2008 average growth
Post-2008 average growth

8
trade negotiating position. The agreement on the transition period is in
principle and subject to conclusion and agreement on the terms of the
overall Withdrawal Agreement/Treaty in full. While more information has
become available, the extent of uncertainty on the outcome and implications
of the withdrawal process has not changed since December 2017, as no
agreement has yet been reached on the permanent trade and migration
arrangements between the UK and the EU after Brexit.
12 With negotiations still taking place, there continue to be rapid political
developments by the UK and EU authorities. It is likely that further headway
in the Brexit discussions will be made after the publication of our forecasts,
particularly following the next European Council meetings of 28-29 June and
18-19 October, with more clarity expected by December 2018.
13 There is also a possibility that an EU exit agreement will be reached in
October. In response to a request by the Treasury Select Committee, the
OBR has confirmed that it could incorporate a prospective October EU exit
agreement in a December Budget forecast to inform the Parliament’s vote on
the agreement, moving beyond its current Brexit assumptions as necessary.1
The OBR have said they will consider the scope and robustness of the
additional analysis involved and will assess whether this timetable can be
delivered. In the same way, we will continue to monitor progress in the
withdrawal negotiations and to keep our Brexit assumptions under review for
future forecasts.
14 At present, the Commission broadly expects both the uncertainty created by
the UK-EU negotiation and the final settlement to impact negatively on the
Scottish economy over the next five years.
15 While the ‘transition period’ means that there would be very little change in
the UK’s relationship with the EU prior to 31 December 2020, the negative
effects of this on-going uncertainty can expected to be felt also over the
shorter-term.
16 In preparing this forecast, we continue to follow the same approach as the
OBR. We use broad-brush assumptions including:
The UK leaves the EU in March 2019
New trading arrangements with the EU and others slows the pace
of import and export growth
The UK adopts a tighter immigration regime than currently in place
1 Letter from Chairman of the OBR to Chairman of the Treasury Select Committee 23 April 2018 (link)
9
17 As in our December 2017 forecast, we use the 50 per cent net EU migration
variant of the ONS 2016-based population projections for Scotland, whereas
the OBR has continued to use the principal projection for the UK.2
Population and demographic factors
18 As we set out in December, although the Scottish population has been
growing in recent years, it has not been growing as fast as the rest of the UK
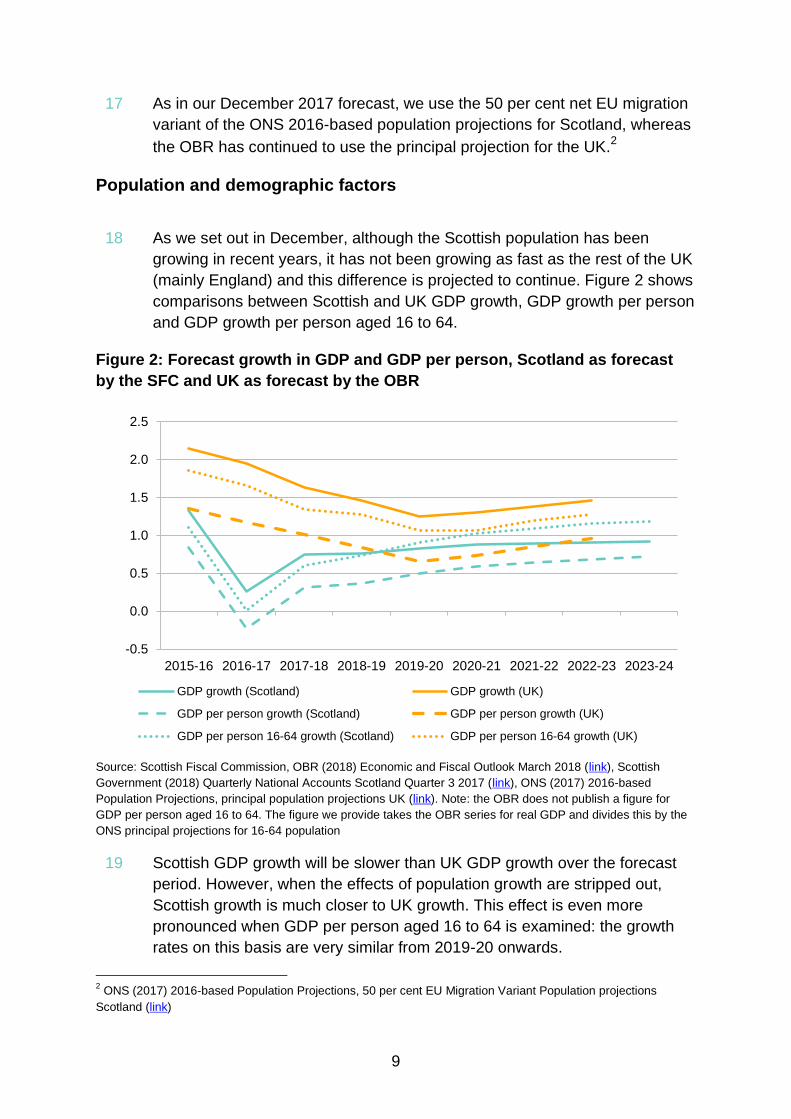
(mainly England) and this difference is projected to continue. Figure 2 shows
comparisons between Scottish and UK GDP growth, GDP growth per person
and GDP growth per person aged 16 to 64.
Figure 2: Forecast growth in GDP and GDP per person, Scotland as forecast
by the SFC and UK as forecast by the OBR
Source: Scottish Fiscal Commission, OBR (2018) Economic and Fiscal Outlook March 2018 (link), Scottish
Government (2018) Quarterly National Accounts Scotland Quarter 3 2017 (link), ONS (2017) 2016-based
Population Projections, principal population projections UK (link). Note: the OBR does not publish a figure for
GDP per person aged 16 to 64. The figure we provide takes the OBR series for real GDP and divides this by the
ONS principal projections for 16-64 population
19 Scottish GDP growth will be slower than UK GDP growth over the forecast
period. However, when the effects of population growth are stripped out,
Scottish growth is much closer to UK growth. This effect is even more
pronounced when GDP per person aged 16 to 64 is examined: the growth
rates on this basis are very similar from 2019-20 onwards.
2 ONS (2017) 2016-based Population Projections, 50 per cent EU Migration Variant Population projections
Scotland (link)
-0.5
0.0
0.5
1.0
1.5
2.0
2.5
2015-16 2016-17 2017-18 2018-19 2019-20 2020-21 2021-22 2022-23 2023-24
GDP growth (Scotland) GDP growth (UK)
GDP per person growth (Scotland) GDP per person growth (UK)
GDP per person 16-64 growth (Scotland) GDP per person 16-64 growth (UK)

10
20 The size of the population aged 16 to 64, which makes up most of the
working-age population, is important for the economy and the public
finances. These individuals are more likely to be working and will be
generating the highest tax receipts, for example, in income tax. While the
total population is expected to grow, Figure 3 demonstrates that the
population aged 16 to 64 is expected to start to shrink from 2018 onwards.
This is in contrast to a growing 16 to 64 population in the UK and places a
particular drag on growth in GDP in Scotland.
Figure 3: Forecast Scottish total population and population aged 16 to 64,
thousands
Source: Scottish Fiscal Commission, ONS (2017) 2016-based Population Projections, 50 per cent EU Migration
Variant Population projections Scotland (link)
Potential output
21 The judgements the Commission has made on the future path for
productivity, the labour market and population growth drive the potential
output of the Scottish economy as shown in Figure 4. Slow growth in the
potential size of the economy will act as a limit to GDP growth.
3,450
3,500
3,550
3,600
3,650
5,350
5,400
5,450
5,500
5,550
2016 2017 2018 2019 2020 2021 2022 2023
Total population (LHS) 16 to 64 population (RHS)

11
Figure 4: Growth in Scottish potential output by component
Source: Scottish Fiscal Commission
Earnings
22 Trend productivity growth in Scotland has been slow since 2010. Growth in
real wages has been slower still than growth in productivity would suggest.
The Commission has further developed its analysis of wage growth, looking
in particular at the disconnect between productivity growth and real wage
growth since 2010. As a result, our forecasts of real wage growth are
therefore now lower than they were previously. Following near zero or
negative real wage growth since 2010, real wages are expected to fall by 0.5
per cent in 2018-19, before gradually starting to grow from 2019-20 onwards.
23 Real household disposable income is not expected to see positive growth
until 2020-21 because of a combination of slow wage growth, limited
employment growth and inflation. Growth in real household incomes will start
to strengthen gradually from 2020 onwards as the rate of real wage growth
starts to rise.
-1.0
-0.5
0.0
0.5
1.0
1.5
2.0
2.5
3.0
3.5
1993-94 1996-97 1999-00 2002-03 2005-06 2008-09 2011-12 2014-15 2017-18 2020-21 2023-24
Population Participation rate Trend hours worked
Trend unemployment Trend productivity Trend output

12
Figure 5: Growth rate of Real Household Disposable Income, total and per
person, Scotland compared to OBR UK forecasts
Source: Scottish Fiscal Commission, OBR (2018) Economic and Fiscal Outlook March 2018 (link), Scottish
Government (2018) Quarterly National Accounts Scotland Quarter 3 2017 (link)
24 The outlook for real household disposable income, combined with an already
low savings ratio, limits growth in consumption in the early years of the
forecast. As Figure 6 shows, the economic growth achieved in 2018-19 will
be driven by net trade and expanding investment, though these factors are
not expected to persist in future years. From 2019-20, growth will be driven
by the gradually increasing consumption and spending by the public sector.
Figure 6: Contributions by component of expenditure to growth in GDP (%)
Source: Scottish Fiscal Commission. Note: Historic average is based on growth from 1998 to 2017
-1.0
-0.5
0.0
0.5
1.0
1.5
2.0
2017-18 2018-19 2019-20 2020-21 2021-22 2022-23 2023-24
Scotland - total Scotland - per person UK - total UK - per person
-2.0
-1.5
-1.0
-0.5
0.0
0.5
1.0
1.5
2.0
2.5
2016-17 2017-18 2018-19 2019-20 2020-21 2021-22 2022-23 2023-24 Historic
average
Consumption (+residual) Private investment Government
Net Trade GDP

13
Tax
25 The Commission’s fiscal forecasts directly inform the Scottish Government’s
Budget. Table 2 shows a summary of the tax forecasts produced.
Table 2: Summary of tax forecasts 2016-17 to 2023-24
£ million 2016-17 2017-18 2018-19 2019-20 2020-21 2021-22 2022-23 2023-24
Outturn*
Income Tax (NSND) 11,267 11,467 11,969 12,345 12,805 13,335 13,936 14,547
Non-Domestic Rates 2,731 2,774 2,788 2,859 2,931 3,110 3,307 3,339
Land & Buildings Transaction Tax 484 550 614 656 697 738 781 827
of which, Residential 214 259 312 342 373 405 438 473
ADS 93 91 97 100 104 108 112 116
Non-Residential 177 201 206 214 220 226 231 238
Air Passenger Duty 257 277 285 292 301 311 322 335
Scottish Landfill Tax 148 142 114 93 95 87 87 88
Total Tax 14,887 15,209 15,770 16,244 16,829 17,581 18,432 19,137
Source: Scottish Fiscal Commission. Figures may not sum to totals because of rounding * Figure for Income Tax
is forecast not outturn data, as liabilities data in 2016-17 are not yet available. See the income tax section for
further detail.

14
26 Box 1 explains how the Scottish Budget is determined both by our forecasts
and by the OBR forecasts of corresponding UK Government tax receipts.
Box 1: Commission Forecasts and the Fiscal Framework
The Scottish Fiscal Commission’s forecasts are an important component in
determining the total budget that is available to the Scottish Government to spend in
each fiscal year. However, they are not the only relevant forecasts.
The diagram below presents a stylised representation of the way the Scottish Budget
is determined. The forecast block grant adjustments are based on OBR forecasts of
UK Government receipts of corresponding taxes, they do not relate to the OBR’s
forecasts of Scottish taxes. These forecasts of UK Government receipts are then
used by the UK and Scottish Governments to calculate the block grant adjustments,
in which process the OBR and the Commission have no involvement.
Figure 7: How is the Scottish Budget Determined?
Source: SPICe Briefing (2017) UK Autumn Budget 2017 – impact on Scotland (link)
Taxes which were devolved before the Scotland Acts 2012 and 2016, such as
Council Tax and Non-Domestic Rates (NDR), are outwith the Fiscal Framework and
so have no impact on the Block Grant. This means there is no indexation mechanism
with equivalent UK Government taxes. The Commission has been tasked with
producing a forecast of NDR, but is not responsible for forecasting Council Tax.
Only some social security benefits will have corresponding BGAs, smaller benefits,
including all those already devolved, will result in additions to the block grant which
are indexed using the Barnett formula and do not directly correspond to UK
Government expenditure on the same benefit.

15
Income tax
27 The outlook for income tax is driven by the outlook for earnings and
employment. Continued slow growth in the economy, and in turn wages,
means slow growth in income tax revenues. As a result, the Commission is
forecasting lower revenue from income tax than previously forecast in
February.
Table 3: Comparison with previous February 2018 forecast
Source: Scottish Fiscal Commission (February 2018) Scotland’s Economic and Fiscal Forecasts Supplementary
Publication Updated Income Tax Forecasts (link), Scottish Fiscal Commission
*Outturn in this context for income tax refers to our analysis of the 2015-16 Survey of Personal Incomes (SPI)
data
28 Table 3 shows a range of factors and developments since our forecast in
February 2018 that have led to a small upward revisions in 2015-16 and
2016-17 tax years, with downwards revision for subsequent years. The latest
economy forecasts have reduced future tax liabilities, but other factors such
as strong employment outturn data in 2016-17 have had some impact on the
forecast.
3 Includes revisions to OBR triple lock and CPI forecasts, HMRC Gift Aid estimates, inclusion of 2017 mid-year
population estimates and model developments.
£ million 2015-16
Outturn*
2016-17 2017-18
2018-19 2019-20 2020-21 2021-22 2022-23
February 2018 10,932 11,214 11,584 12,177 12,647 13,152 13,733 14,372
2016-17 outturn data 0 30 53 78 80 84 87 92
Economy forecast 0 6 -198 -317 -405 -474 -545 -614
2015-16 SPI data 15 -5 -21 5 7 25 66 96
Tax-Motivated Incorporations 0 21 43 26 31 35 10 13
Other3 1 0 7 8 -1 0 1 -3
2017-18 policy recosting 0 0 -2 -2 -7 -7 -7 -8
2018-19 policy recosting 0 0 0 -6 -8 -9 -11 -12
May 2018 10,948 11,267 11,467 11,969 12,345 12,805 13,335 13,936
Change from February 2018 16 53 -118 -209 -302 -347 -398 -437
16
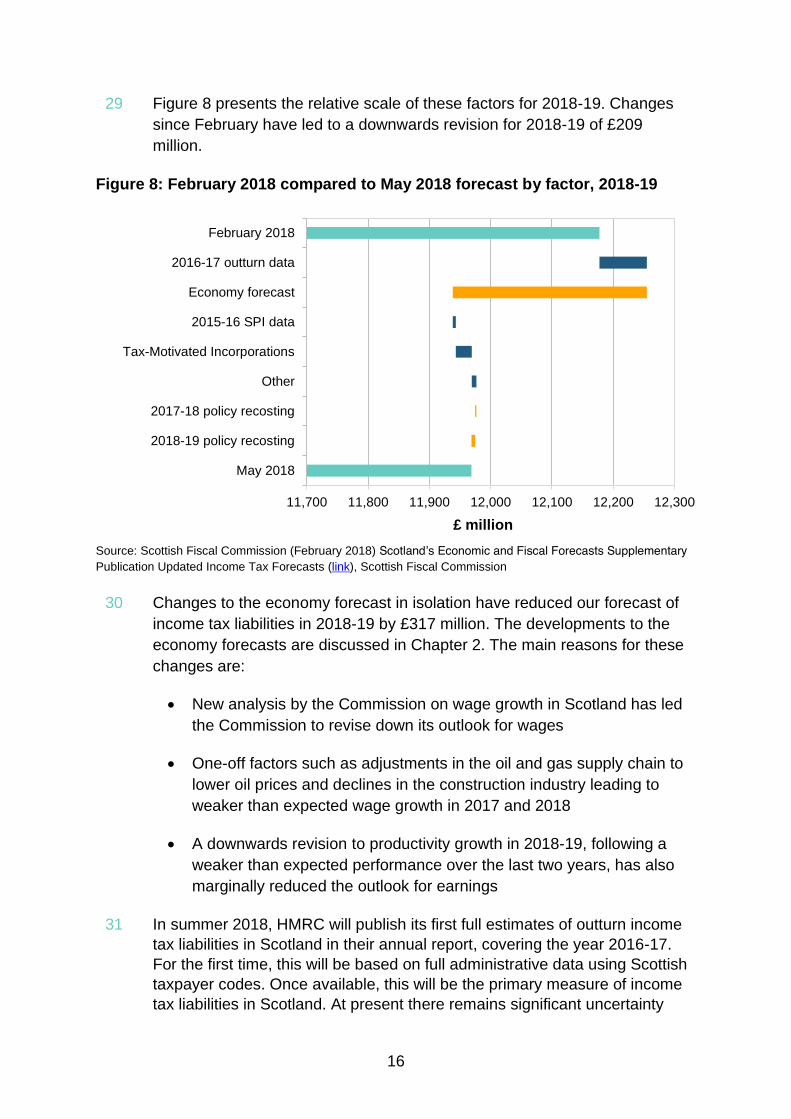
29 Figure 8 presents the relative scale of these factors for 2018-19. Changes
since February have led to a downwards revision for 2018-19 of £209
million.
Figure 8: February 2018 compared to May 2018 forecast by factor, 2018-19
Source: Scottish Fiscal Commission (February 2018) Scotland’s Economic and Fiscal Forecasts Supplementary
Publication Updated Income Tax Forecasts (link), Scottish Fiscal Commission
30 Changes to the economy forecast in isolation have reduced our forecast of
income tax liabilities in 2018-19 by £317 million. The developments to the
economy forecasts are discussed in Chapter 2. The main reasons for these
changes are:
New analysis by the Commission on wage growth in Scotland has led
the Commission to revise down its outlook for wages
One-off factors such as adjustments in the oil and gas supply chain to
lower oil prices and declines in the construction industry leading to
weaker than expected wage growth in 2017 and 2018
A downwards revision to productivity growth in 2018-19, following a
weaker than expected performance over the last two years, has also
marginally reduced the outlook for earnings
31 In summer 2018, HMRC will publish its first full estimates of outturn income
tax liabilities in Scotland in their annual report, covering the year 2016-17.
For the first time, this will be based on full administrative data using Scottish
taxpayer codes. Once available, this will be the primary measure of income
tax liabilities in Scotland. At present there remains significant uncertainty
11,700 11,800 11,900 12,000 12,100 12,200 12,300
May 2018
2018-19 policy recosting
2017-18 policy recosting
Other
Tax-Motivated Incorporations
2015-16 SPI data
Economy forecast
2016-17 outturn data
February 2018
£ million

17
over the measurement of the Scottish income tax base and the publication of
this outturn data will provide important new information for our modelling.
The outturn information may lead to some further revisions in our income tax
forecasts.
32 When the new data are published, the Commission will make appropriate
adjustments to our forecasting approach for future forecasts and
publications. We expect to be able to provide analysis of this issue in our
September 2018 Forecast Evaluation Report.
Non-Domestic Rates (NDR)
33 Our forecast of NDR for 2018-19 is £2,788 million; £24 million lower than
forecast in December 2017. The downward revision reflects higher than
expected appeals losses from the 2010 revaluation cycle. Furthermore, we
now anticipate weaker growth in the tax base than previously forecast.
34 The Government announced a number of policy measures in December
2017, some of which were introduced in response to the Barclay Review.4
Due to availability of new data, we have revised our estimates of the cost of
several of these policies. Overall, this reduces the cost of these policies by
£1 million.
35 The Commission forecasts what is known as the contributable amount of
NDR. This can be thought of as the amount collected by local authorities
through the course of the year which flows to the Scottish Government. The
amount available to local authorities to spend – the distributable amount – is
set by the Scottish Government prior to the start of the year.
36 Differences between the amount distributed by the Scottish Government and
amounts collected by local authorities are shown after year end in the
audited publication of the NDR Rating Account. While in recent years a
cumulative deficit has been carried forward, the distributable amount was set
at Draft Budget 2018-19 using our forecast with the aim of bringing the
account to balance by the end of 2018-19.
37 Given the revisions to our forecast, we now project a £59 million deficit in the
NDR Rating Account at the end of 2018-19. The audited balance of the
account will in practice depend on data returns submitted to the Scottish
Government by local authorities throughout the year. As the distributable
amount is already set for 2018-19, this projected deficit cannot be dealt with
in-year, and so may be carried forward into the calculation of the amount to
be distributed in the Scottish Budget 2019-20.
4 Report of the Barclay Review of Non-Domestic Rates 2017 (link)
18
Land and Buildings Transaction Tax (LBTT)
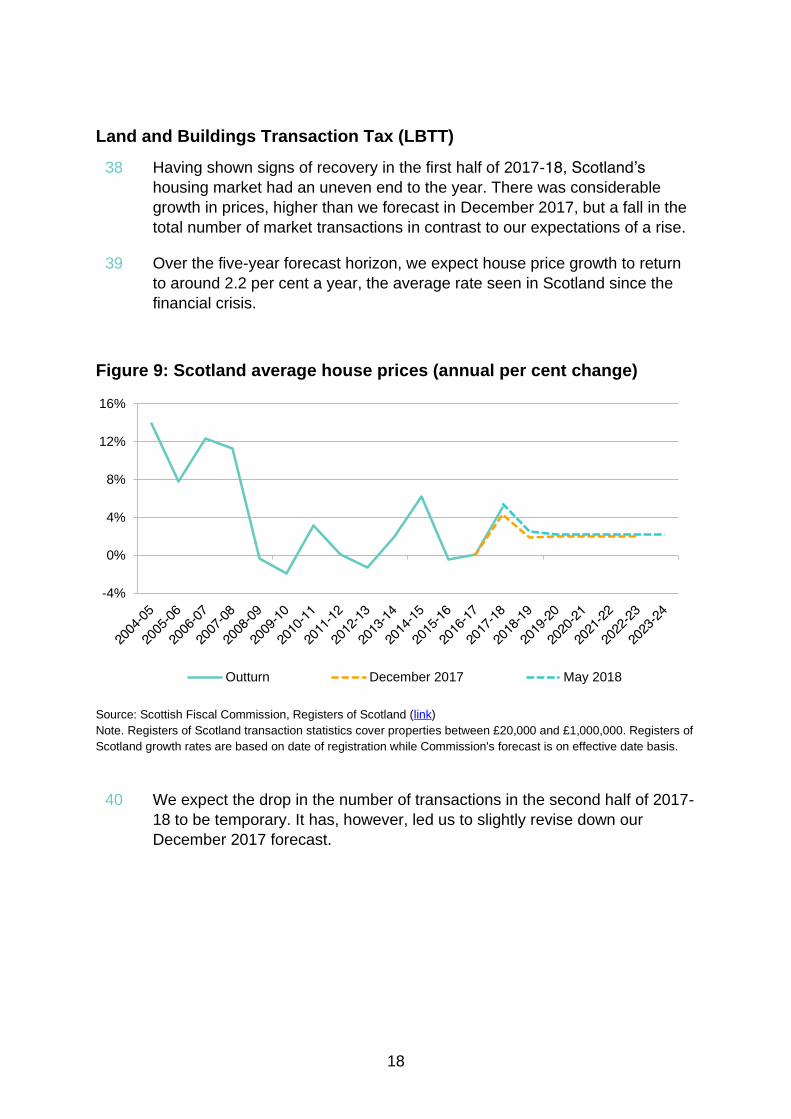
38 Having shown signs of recovery in the first half of 2017-18, Scotland’s
housing market had an uneven end to the year. There was considerable
growth in prices, higher than we forecast in December 2017, but a fall in the
total number of market transactions in contrast to our expectations of a rise.
39 Over the five-year forecast horizon, we expect house price growth to return
to around 2.2 per cent a year, the average rate seen in Scotland since the
financial crisis.
Figure 9: Scotland average house prices (annual per cent change)
Source: Scottish Fiscal Commission, Registers of Scotland (link)
Note. Registers of Scotland transaction statistics cover properties between £20,000 and £1,000,000. Registers of
Scotland growth rates are based on date of registration while Commission's forecast is on effective date basis.
40 We expect the drop in the number of transactions in the second half of 2017-
18 to be temporary. It has, however, led us to slightly revise down our
December 2017 forecast.
-4%
0%
4%
8%
12%
16%
Outturn December 2017 May 2018

19
Figure 10: Scotland residential property transactions
Source: Scottish Fiscal Commission, Revenue Scotland effective date basis data from 2015-16, HMRC Monthly
Property Transactions Statistics for data before 2015-16 (link)
41 The Scottish Government has introduced legislation for a relief for First Time
Buyers (FTBs), as announced at the Draft Budget 2018-19. It raises the zero
rate tax threshold for FTBs from £145,000 to £175,000. Our costing has
been updated slightly to reflect revisions to our price and transactions
forecasts and to capture the fact that the relief will apply from 30 June 2018
rather than 1 June 2018 as assumed in our December 2017 forecast.
42 Non-residential receipts are expected to increase over the five-year forecast
horizon. We have revised up our December 2017 forecast as a result of a
higher price growth forecast and the introduction of a new forecasting
approach, moving us fully to Scotland-specific data and forecasts. In the
medium-term, prices and transactions grow in line with the Commission’s
economy forecast.
43 The Scottish Government has brought forward secondary legislation to allow
for Group Relief to be available when there is a transfer of properties within a
corporate group structure and there is an existing ‘Share Pledge’ relating to
the buyer. We estimate that the change could reduce LBTT revenue by £0.6
million per year. We attach a high degree of uncertainty to the point estimate
for this costing. The Scottish Government is considering whether the change
could be applied retrospectively. We will continue to monitor developments
and revisit our forecast as appropriate.
0
40,000
80,000
120,000
160,000
Outturn December 2017 May 2018

20
Air Passenger Duty
44 Air Passenger Duty (APD) is paid by passengers departing from UK airports.
The Scottish Government had legislated to replace APD with Air Departure
Tax (ADT) from April 2018. In November 2017, the Scottish Government
agreed with the UK Government to defer the devolution of APD.5 The
Commission has developed a forecast for Scottish APD receipts; we will
continue to publish these forecasts to inform the future plans for devolution
of APD.
45 Our forecast of Scottish APD receipts shows revenues increasing over the
forecast horizon. Scottish passenger numbers have grown strongly in the
last four years at a time when Scottish GDP growth has been relatively
subdued.
46 The forecast of Scottish APD has changed since December 2017 with
downwards revisions to each year. The reasons for change include an
updated estimate of the reduced revenue due to child exemptions. This
reflects recently published data from HMRC. This information was not
available in December 2017 and the new estimate revised up the cost of the
exemption from two per cent of APD revenues to five per cent. Despite these
downward revisions in the tax base, we forecast similar growth to the OBR
over the forecast horizon with revenues increasing by approximately 25 per
cent between 2016-17 and 2022-23.
Scottish Landfill Tax
47 Landfill tax is an environmental tax which is intended to help reduce the
amount of waste landfilled. While this trend appears to have levelled off in
Scotland in recent years, the Commission is forecasting significant
reductions in the amount of waste landfilled together with subsequent tax
receipts over the next five years.
48 The forecast is largely driven by the projected increase in incineration
capacity over the forecast period. The build-up in capacity is in part a
reaction to the increasing cost of the tax on disposal via landfill. It is also a
sign that local authorities and waste management companies are beginning
to plan ahead to meet their obligations in anticipation of the ban on the
landfill of biodegradable municipal waste from 2021. The full impact of the
ban is still being assessed and may result in tax receipts being significantly
lower in the later years of our current forecast.
5 Letter from the Cabinet Secretary for Finance and Constitution to the Convener of the Finance and Constitution
Committee 22 November 2017 (link)

21
49 There have been small upward revisions to the forecast across the forecast
horizon since December 2017. These are predominantly a result of the
inclusion of the most recent published data from Revenue Scotland,
suggesting that receipts have not fallen quite as fast as we expected.
Notification of a delay to the full rate operation of the first site to increase
incineration capacity has resulted in further increases to revenue in 2017-18
and 2018-19.
Social security expenditure
50 As part of the devolution of social security powers to the Scottish Parliament,
the Commission is required to produce independent official forecasts of
devolved social security expenditure in Scotland.
51 The devolution of social security benefits is phased and the forecasts reflect
either Scottish or UK Government policy, depending on the status of each
benefit. The benefits already devolved are Discretionary Housing Payments,
the Scottish Welfare Fund and Employability Services. Our forecasts of
expenditure on these areas reflect current Scottish Government policy.
52 Until Carer’s Allowance (CA) is devolved, CA will continue to be
administered by DWP at the rate set by the UK Government. We forecast
expenditure in line with the UK Government’s policy until further plans for
devolution are announced.
53 The Scottish Government has committed to increasing the level of Carer's
Allowance to that of Jobseeker's Allowance. This increase will be paid by the
Scottish Government via the Carer’s Allowance Supplement.
54 We forecast expenditure for a number of benefits which are currently
reserved but where the Scottish Government has announced plans for
devolution. As we have not received specific policy details, or dates for
devolution, we forecast these benefits based on existing UK Government
policy. These benefits are Funeral Payments, Healthy Start Vouchers and
Sure Start Maternity Grant.6
55 As the Scottish Government announces plans for the devolution of further
benefits we will include them in our future forecasts.
6 The Scottish Government have announced that Funeral Expense Assistance will replace Funeral Expenses
Payments, Best Start Grant will replace Sure Start Maternity Grant and Best Start Foods will replace Healthy
Start Vouchers by summer 2019.
22
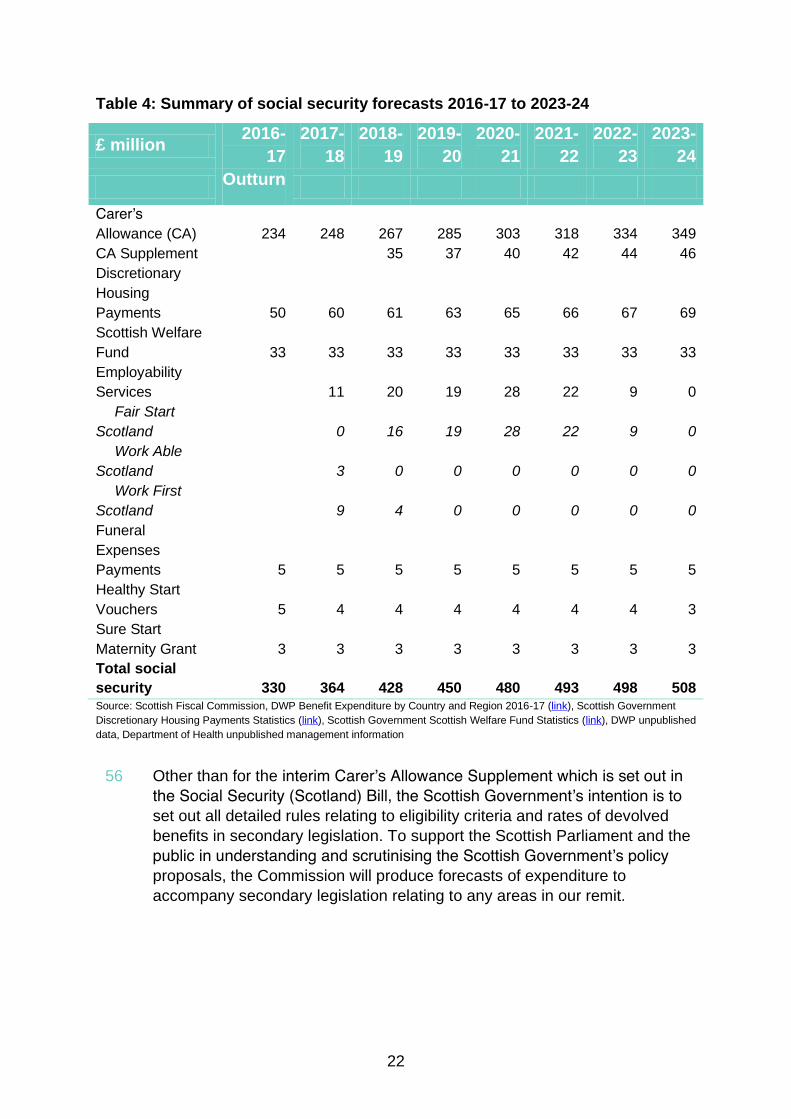
Table 4: Summary of social security forecasts 2016-17 to 2023-24
£ million 2016-
17
2017-
18
2018-
19
2019-
20
2020-
21
2021-
22
2022-
23
2023-
24
Outturn
Carer’s
Allowance (CA) 234 248 267 285 303 318 334 349
CA Supplement 35 37 40 42 44 46
Discretionary
Housing
Payments 50 60 61 63 65 66 67 69
Scottish Welfare
Fund 33 33 33 33 33 33 33 33
Employability
Services 11 20 19 28 22 9 0
Fair Start
Scotland 0 16 19 28 22 9 0
Work Able
Scotland 3 0 0 0 0 0 0
Work First
Scotland 9 4 0 0 0 0 0
Funeral
Expenses
Payments 5 5 5 5 5 5 5 5
Healthy Start
Vouchers 5 4 4 4 4 4 4 3
Sure Start
Maternity Grant 3 3 3 3 3 3 3 3
Total social
security 330 364 428 450 480 493 498 508 Source: Scottish Fiscal Commission, DWP Benefit Expenditure by Country and Region 2016-17 (link), Scottish Government
Discretionary Housing Payments Statistics (link), Scottish Government Scottish Welfare Fund Statistics (link), DWP unpublished
data, Department of Health unpublished management information
56 Other than for the interim Carer’s Allowance Supplement which is set out in
the Social Security (Scotland) Bill, the Scottish Government’s intention is to
set out all detailed rules relating to eligibility criteria and rates of devolved
benefits in secondary legislation. To support the Scottish Parliament and the
public in understanding and scrutinising the Scottish Government’s policy
proposals, the Commission will produce forecasts of expenditure to
accompany secondary legislation relating to any areas in our remit.
23
Carer’s Allowance
57 Carer’s Allowance (CA) is paid to help individuals who care for someone
who is disabled with substantial caring needs. Expenditure on CA is forecast
to increase over the forecast horizon from £248 million in 2017-18 to £349
million in 2023-24. The increase is because more people are expected to
receive CA payments and because the weekly payment will be uprated in
line with CPI inflation.
58 The Scottish Government is introducing a CA Supplement to increase CA to
match the rate of Jobseekers Allowance (JSA). The CA Supplement will be
paid as two lump sums per financial year, each worth six months (26 weeks)
of the difference between CA and the higher of: Jobseeker’s Allowance
(JSA) or the amount JSA would be if it were adjusted for inflation. The Social
Security (Scotland) Bill provides a mechanism to pay the Carer's Allowance
Supplement at the earliest opportunity, from summer 2018.7 The qualifying
dates and payment dates have not yet been set by the Scottish Government
and therefore in the absence of this information our forecast is illustrative.
59 Expenditure on the CA Supplement increases from £35 million in the year it
is introduced (2018-19) to £46 million by the end of the forecast period
(2023-24). The Social Security (Scotland) Bill was amended at Stage 3 to
place a duty on ministers to uprate the CA Supplement each year in line with
inflation and this is the key driver of the increase in expenditure over the
forecast period. The cost of the new uprating policy is £9 million by 2023-24.
Discretionary Housing Payments
60 Discretionary Housing Payments (DHPs) are grants awarded by local
authorities to people in need of extra financial assistance with housing costs.
The Scottish Government has committed to using DHPs to mitigate the
removal of the spare room subsidy (RSRS), commonly known as the
‘Bedroom Tax’. Our forecasts show the cost of mitigating the RSRS
increases over the forecast horizon, from £51 million in 2018-19 to £58
million in 2023-24. Based on Scottish Government policy, we assume other
expenditure on DHPs remains constant at £10.9 million a year over the
forecast horizon.
7 Social Security (Scotland) Bill (2018) [as passed] (link)

24
Scottish Welfare Fund
61 The Scottish Welfare Fund (SWF) was set up in April 2013 and provides
grants for people on low incomes. Expenditure on the SWF has been constant
at £33 million since 2013. Based on Scottish Government policy, our forecast
assumes this remains fixed.
Employability Services
62 The Scottish Government has introduced new voluntary services to provide
employability support to help the long-term unemployed and people with
disabilities to find sustainable employment. The Scottish Government has
contracted external providers to deliver the service. Eligible individuals are
referred mainly by Jobcentre Plus to an employability service provider.
63 Two interim services were operational in 2017-18; Work First Scotland and
Work Able Scotland. The Fair Start Scotland (FSS) service started in April
2018 and will accept referrals for three years, but contracts with, and
payments to, providers run for five years, from April 2018 to November 2023
with final outcome payments made up to 29 February 2024.
64 Forecast expenditure is based on the service design, the estimated number
of individuals supported and the probabilities of those individuals entering
into and sustaining employment. The overall forecast annual expenditure on
Employability Services is £20 million in 2018-19 and rises to £28 million in
2020-21 before declining over the rest of the forecast horizon.
65 FSS has seen downward revisions to forecast spending in the first two years
of the service, with an equal total upward revision to spending in the last
three. Peak spending on FSS (£27.7 million) is forecast for 2020-21.
66 The May 2018 forecast contains an important update to the methodology.
Service providers have now given the Scottish Government their monthly
forecasts both of how many service starts and sustained employment
outcomes they expect and when they expect these milestones to be
achieved. Previously, service providers gave forecasts only for the total
number of job outcomes they expected to realise over the full life of the
service. This change results in revisions to the expected expenditure for FSS
within each year of the forecast.

25
Other benefits
67 The Scottish Government has announced plans for the devolution of Funeral
Expenses Payment, Healthy Start Vouchers and the Sure Start Maternity
Grant. Currently there is insufficient detail for us to produce forecasts based
on the Scottish Government’s policy. We have therefore produced forecasts
of expenditure based on current UK Government policy. Since our last
publication there have been only minor revisions to these forecasts to allow
for model refinements and data updates.
68 Universal Credit (UC) is reserved to the UK Government and we do not
forecast expenditure. UC is a qualifying benefit for several of the benefits we
forecast so any delays or changes to the rollout could impact on our
forecasts.
Borrowing
Capital borrowing
69 The Scottish Government has given us projections of its capital borrowing
requirements up to 2019-20. We judge that these projections are within the
limits set out in the Fiscal Framework, and are therefore reasonable.
70 The Scottish Government borrowed the annual maximum in 2017-18 and
plans to do the same in 2018-19 and 2019-20, with borrowing to be repaid
over a 25 year time horizon. This will result in a projected debt stock of £1.87
billion by the end of 2019-20 which is 62 per cent of the total statutory limit of
£3 billion.
71 It will only be possible for the Government to continue to borrow the
maximum amount per year, with a 25 year repayment schedule until 2022-
23. Beyond this point the statutory borrowing cap would limit the annual
amount available to borrow.
Resource borrowing
72 The Scottish Government have confirmed that they have not used resource
borrowing powers to date and that there are no current plans for resource
borrowing over the period of the Medium Term Financial Strategy.
73 We have assessed whether we are forecasting a Scotland-specific economic
shock, which would trigger access to additional resource borrowing powers.
Given our forecasts, and the most recent OBR forecasts, the conditions for
this are not currently met.

26
The Scotland Reserve
74 The Scottish Government has provided information on the balance of the
Scotland Reserve and projected drawdowns in 2018-19. The reserve had a
provisional aggregate balance of £451 million at the end of 2017-18. The
Scottish Government have projected they will drawdown £68 million from the
capital reserve and £238 million from the resource reserve during 2018-19.
We have assessed that these projections are within the limits set by the
Fiscal Framework, and are therefore reasonable.
VAT
75 Regulations have been introduced in the Scottish Parliament to expand the
remit of the Commission to include VAT forecasting to support VAT
assignment. We are currently developing our forecast methodology. Our first
full VAT forecast will be published in December 2018.
27
Chapter 1 Introduction
What is in this report?
1.1 This report presents economic and fiscal forecasts to inform the Scottish
Government’s Medium Term Financial Strategy published on 31 May 2018.
This is the second set of official, independent forecasts produced by the
Scottish Fiscal Commission. Our first forecasts were produced in December
2017 to inform the Scottish Draft Budget 2018-19.8 We produced a
supplementary income tax forecast in February based on changes announced
by the Scottish Government to the Budget Bill 2018-19.9 The Commission is
required to produce at least two sets of forecasts a year, as set out in the
Scottish Fiscal Commission Act 2016.
1.2 Alongside our forecasts, the report provides a full explanation of all
assumptions and judgements made as part of the forecasting process. We
also set out what has changed since the last set of forecasts we produced in
December 2017.
1.3 The report is divided into the following sections:
Summary – a standalone, non-technical, high-level summary of the
forecasts produced by the Commission, and the main assumptions and
judgements that underpin them.
Economy Chapter – a chapter which sets out the Commission’s five-year
forecasts for the Scottish economy, including the underlying judgements
and sensitivity analysis where appropriate. This includes an assessment
of whether the Commission has forecast a ‘Scotland-specific economic
shock’ which would mean that that the Scottish Government would be
8 Scottish Fiscal Commission (2017) Scotland’s Economic and Fiscal Forecasts December 2017 (link)
9 Scottish Fiscal Commission (February 2018) Scotland’s Economic and Fiscal Forecasts Supplementary
Publication Updated Income Tax Forecasts (link)

28
able to access additional borrowing under the terms of the Fiscal
Framework.
Tax Chapter – a chapter presenting the Commission’s forecasts of
receipts from the fully and partially devolved taxes within our remit,
covering:
o Non-Savings Non-Dividend Income Tax
o Non-Domestic Rates
o Land and Buildings Transaction Tax
o Scottish Landfill Tax
o Scottish share of Air Passenger Duty
Social Security Chapter – a chapter presenting the Commission’s
forecasts for devolved social security expenditure:
o Carer’s Allowance and the Carer’s Allowance Supplement
o Discretionary Housing Payments
o Scottish Welfare Fund
o Employability Services
o Funeral Payments
o Healthy Start Vouchers
o Sure Start Maternity Grant
Borrowing Chapter – A chapter which fulfils the Commission’s duty to
assess whether the Scottish Government’s projections of borrowing are
reasonable. The Government’s capital and resource borrowing plans are
assessed against the limits set out under Scotland Act 2016 and the
associated Fiscal Framework. The position of the Scotland Reserve is
also considered.
Annex A: Policy Costings – An Annex containing detail for all the policy
costings the Commission has produced for this set of forecasts. This
shows how much any individual policy will cost or raise, and how the
Commission has arrived at that estimate.
Annex B: Policy Re-Costings – An Annex containing revised estimates of
costings for policies previously costed. Re-costings may be required
because of new outturn data or revisions to key assumptions and
judgements
Annex C: Developing our approach to forecasting VAT – An Annex setting
out how we propose to forecast VAT receipts and the planned
development work ahead of the publication of our first VAT forecasts in
December 2018.

29
Limitations of forecasting
1.4 The past is an imperfect guide to the future in a rapidly changing global
economic, social, political and technological environment. Analytical models,
based on historic data and theory, can help provide some insight into how the
economy and public sector finances may change over time, but all have
limitations. Forecasts cannot perfectly predict the future – the Commission’s
forecasts aim to present a balanced pathway through a broad range of
possible outcomes.
1.5 There will exist a range of valid approaches on each of these issues and so
the Commission is required to make judgments where appropriate. Our
forecasts will evolve over time. In each section we have set out how our
forecasts have changed since the last forecasts in December 2017 and
explained the reasons driving those changes.
1.6 Forecasting is an on-going process of intelligence gathering, learning from
previous forecasts, reflection and refinement. Judgements will be made on the
basis of the best evidence and intelligence available at the time of publication,
but may change from one forecast to the next as the economy evolves and
our understanding develops along with it.
Box 1.1: OBR Forecasting – uncertainties and challenges
The Office for Budget Responsibility (OBR) is the UK Independent Fiscal Institution
(IFI) which was established in 2010. Twice a year they provide a detailed central
forecast for the economy and the public finances. These forecasts are designed to
provide a transparent benchmark against which to judge the significance of new
economic and fiscal data, and against which to estimate and explain the likely
impact of policy decisions.
The OBR emphasises in every Economic and Fiscal Outlook10 that since the future
can never be known with precision, all such forecasts are necessarily surrounded
by uncertainty. Like many IFIs, the Commission is required to evaluate its
forecasts. Similarly the OBR produces an evaluation of their forecasts once a year
in their Forecast Evaluation Report (FER) and highlights how “the likelihood that
any given forecast will turn out to be accurate in all respects is essentially
negligible”.11
The OBR seeks to present this uncertainty at each fiscal event.12 In common with
10
OBR (2018) Economic and Fiscal Outlook, March 2018 (link)
11 OBR (2017) Forecast Evaluation Report, October 2017 (link)
12 OBR (2012) Briefing Paper 4: How we present uncertainty, June 2012 (link)

30
many forecasters the OBR publishes a ‘fan chart’ such as Figure 1.1 that illustrates
the uncertainty in their economy forecast. These charts are usually drawn using
information on historical forecast errors. As these are only the Commission’s
second forecasts we are not in a position to provide similar charts.
However, the Commission will follow the OBR and many other forecasters in giving
an insight to forecast uncertainty by discussing the sensitivity of our forecasts to
alternative assumptions and the risk factors for our forecasts.
Figure 1.1: OBR’s GDP growth forecast
Source: OBR (2018) Economic and Fiscal Outlook, March 2018 (link)
Background to the Commission
1.7 In April 2017 the Scottish Fiscal Commission became responsible for
producing independent economic and fiscal forecasts to inform the Scottish
Budget.
1.8 The Commission produces independent forecasts of:
Revenue from fully devolved taxes
Non-savings non-dividend income tax receipts
Onshore Gross Domestic Product (GDP) in Scotland
Devolved social security expenditure13
13
The Commission’s specific role in social security forecasting is defined in the Scottish Fiscal Commission
(Modification of Functions) Regulations 2017 (link)

31
1.9 Regulations to amend our functions to include VAT forecasting are currently
being considered by the Scottish Parliament.
1.10 The Commission will produce forecasts at least twice a year. We will also
produce annual Forecast Evaluation Reports, and will from time to time
publish working papers on related subjects.
1.11 The Scottish Fiscal Commission is structurally and operationally independent
of the Scottish Government. More details about the remit and history of the
Commission, including previous publications, can be found on our website:
www.fiscalcommission.scot.
1.12 The Commission was previously a non-statutory body, established in 2014 to
scrutinise Scottish Government forecasts of devolved taxes following the
Scotland Act 2012. In December 2016, the Commission found the Scottish
Government’s forecasts of non-savings non-dividend Income Tax, Land and
Buildings Transaction Tax and Scottish Landfill Tax to be reasonable. We also
had a role in scrutinising the buoyancy and inflation elements of the Non-
Domestic Rates forecast, which we also found to be reasonable.14
Box 1.2: Commission Forecasts and the Fiscal Framework
The Scottish Fiscal Commission’s forecasts are an important component in
determining the total budget that is available to the Scottish Government to spend in
each fiscal year. However, they are not the only relevant forecasts.
The diagram below is a stylised representation of the way the Scottish Budget is
determined. The forecast block grant adjustments (BGAs) are based on OBR
forecasts of UK Government receipts of corresponding taxes, they do not relate to
the OBR’s forecasts of Scottish taxes. These UK Government receipts forecasts are
then used by the UK and Scottish Governments to calculate the BGAs, in which
process the OBR and the Commission have no involvement.
Figure 1.2 How is the Scottish Budget Determined?
Source: SPICe Briefing (2017) UK Autumn Budget 2017 – impact on Scotland (link)
The Scottish Government has published estimates of the Block Grant Adjustments in
14
Scottish Fiscal Commission (2016) non-statutory Report of Draft Budget 2017-18 (link)
32
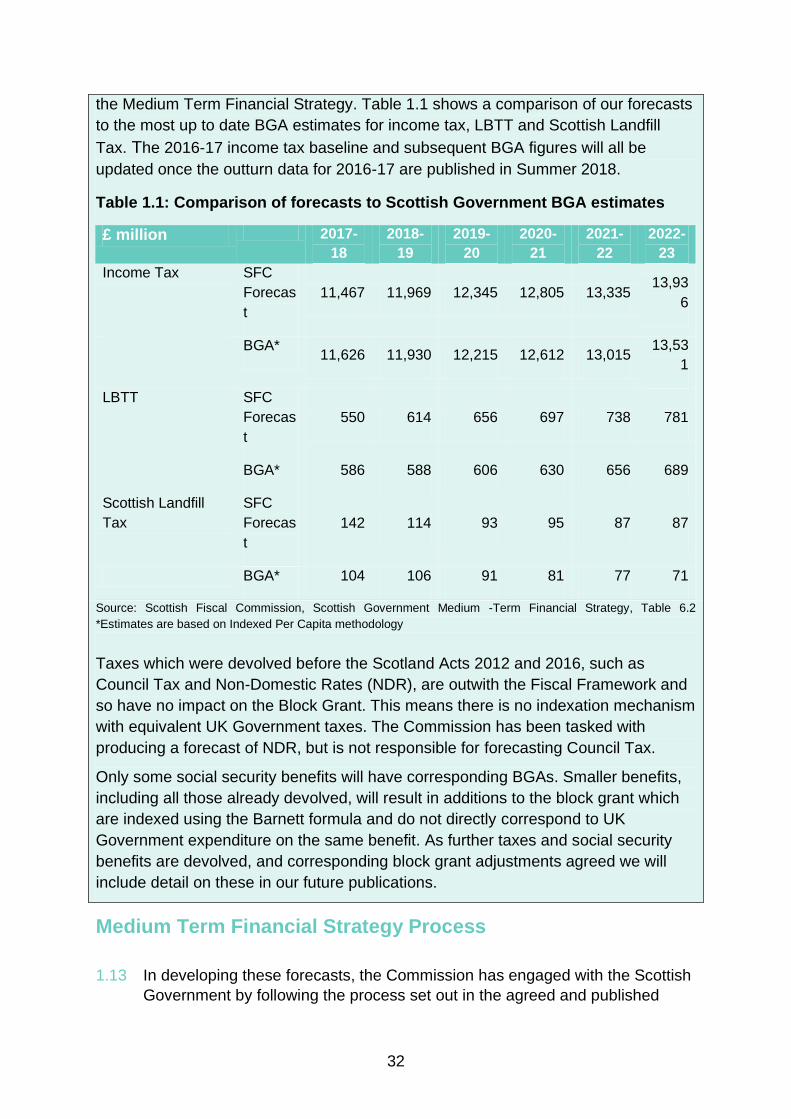
the Medium Term Financial Strategy. Table 1.1 shows a comparison of our forecasts
to the most up to date BGA estimates for income tax, LBTT and Scottish Landfill
Tax. The 2016-17 income tax baseline and subsequent BGA figures will all be
updated once the outturn data for 2016-17 are published in Summer 2018.
Table 1.1: Comparison of forecasts to Scottish Government BGA estimates
Source: Scottish Fiscal Commission, Scottish Government Medium -Term Financial Strategy, Table 6.2
*Estimates are based on Indexed Per Capita methodology
Taxes which were devolved before the Scotland Acts 2012 and 2016, such as
Council Tax and Non-Domestic Rates (NDR), are outwith the Fiscal Framework and
so have no impact on the Block Grant. This means there is no indexation mechanism
with equivalent UK Government taxes. The Commission has been tasked with
producing a forecast of NDR, but is not responsible for forecasting Council Tax.
Only some social security benefits will have corresponding BGAs. Smaller benefits,
including all those already devolved, will result in additions to the block grant which
are indexed using the Barnett formula and do not directly correspond to UK
Government expenditure on the same benefit. As further taxes and social security
benefits are devolved, and corresponding block grant adjustments agreed we will
include detail on these in our future publications.
£ million 2017-
18
2018-
19
2019-
20
2020-
21
2021-
22
2022-
23
Income Tax SFC
Forecas
t
11,467 11,969 12,345 12,805 13,335 13,93
6
BGA* 11,626 11,930 12,215 12,612 13,015
13,53
1
LBTT SFC
Forecas
t
550 614 656 697 738 781
BGA* 586 588 606 630 656 689
Scottish Landfill
Tax
SFC
Forecas
t
142 114 93 95 87 87
BGA* 104 106 91 81 77 71
Medium Term Financial Strategy Process
1.13 In developing these forecasts, the Commission has engaged with the Scottish
Government by following the process set out in the agreed and published
33
Protocol between the organisations.15
This Protocol has been revised to
reflect our experiences in our first year of statutory operation and the changes
to the budget process which have since been agreed.
1.14 We have also added arrangements for the publication of forecasts to
accompany primary or secondary legislation which affects revenue raised
from a tax or expenditure on social security payments within the
Commission’s remit. Our first forecasts to accompany secondary legislation
were published on 17 May to accompany the introduction of the Scottish
Government’s secondary legislation on Group Relief.
1.15 Since formal notification of the date of the Medium Term Financial Strategy in
March, the Commission has had several rounds of meetings to discuss our
pre-measures forecasts. These have included discussions with the Scottish
Government, Revenue Scotland, the Office for Budget Responsibility and HM
Revenue and Customs (HMRC).
1.16 Headline dates of interest are:
8 May: The Scottish Government presented the Commission with all
finalised policy measures and economy moving measures.
16 May: The Commission presented the Scottish Government with
final forecasts to allow the finalisation of the Medium Term Financial
Strategy.
24 May: The Commission’s near-final report was shared with the
Cabinet Secretary for Finance and Constitution.
30 May: Phone call between Dame Susan Rice, Chair of the
Commission and Cabinet Secretary for Finance and the Constitution.
30 May: A pre-release version of the Commission's report was
shared with the Cabinet Secretary for Finance and Constitution.
31 May: Commission report published.
1.17 In accordance with the Protocol, more detail of timings and attendees at
different rounds of meetings is published on our website.16
1.18 The Commission’s final forecasts were provided to the Scottish Government
on the 16 May. The economy forecasts were finalised on the 11 May to allow
inclusion into the fiscal forecasts. To produce all our forecasts new data and
information published after a certain date are not included in our forecasts.
Box 1.3 provides further information on the inclusion of data releases in our
forecasts.
15
Protocol for engagement between the Scottish Fiscal Commission and the Scottish Government Version 2.0
published March 2018 (link)
16 Scottish Fiscal Commission (2018) Scottish Economic and Fiscal Forecasts May 2018 (link)
34
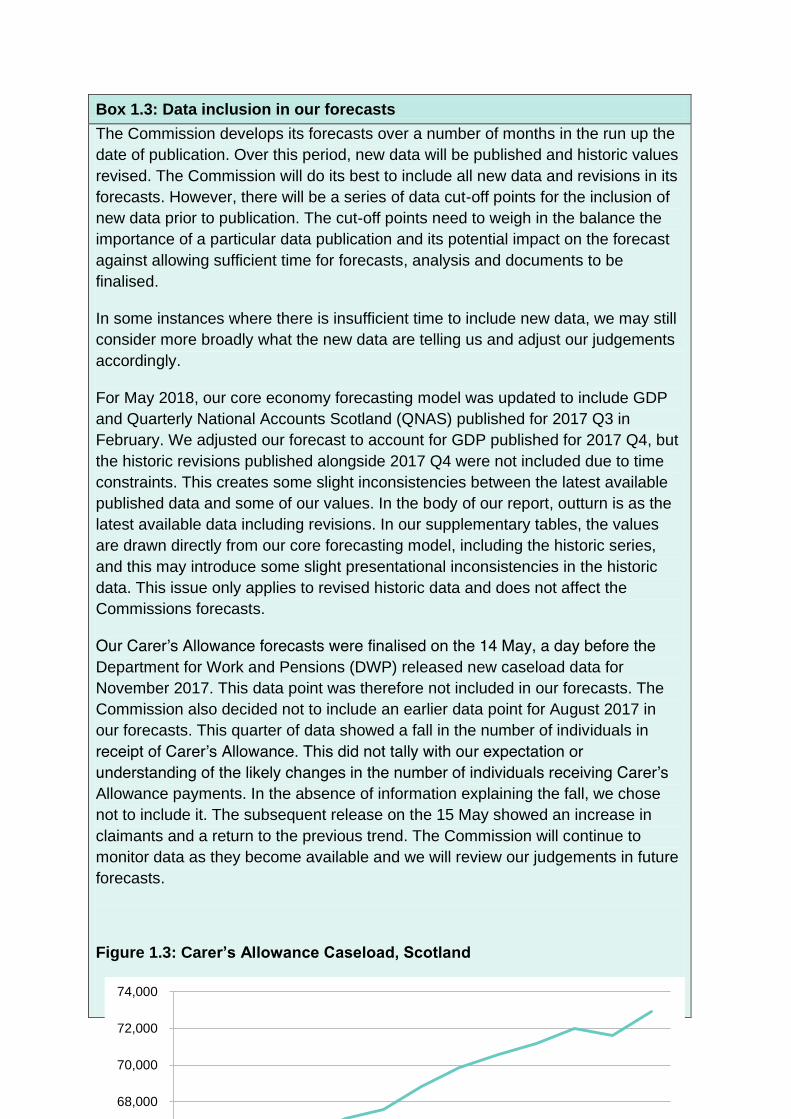
Box 1.3: Data inclusion in our forecasts
The Commission develops its forecasts over a number of months in the run up the
date of publication. Over this period, new data will be published and historic values
revised. The Commission will do its best to include all new data and revisions in its
forecasts. However, there will be a series of data cut-off points for the inclusion of
new data prior to publication. The cut-off points need to weigh in the balance the
importance of a particular data publication and its potential impact on the forecast
against allowing sufficient time for forecasts, analysis and documents to be
finalised.
In some instances where there is insufficient time to include new data, we may still
consider more broadly what the new data are telling us and adjust our judgements
accordingly.
For May 2018, our core economy forecasting model was updated to include GDP
and Quarterly National Accounts Scotland (QNAS) published for 2017 Q3 in
February. We adjusted our forecast to account for GDP published for 2017 Q4, but
the historic revisions published alongside 2017 Q4 were not included due to time
constraints. This creates some slight inconsistencies between the latest available
published data and some of our values. In the body of our report, outturn is as the
latest available data including revisions. In our supplementary tables, the values
are drawn directly from our core forecasting model, including the historic series,
and this may introduce some slight presentational inconsistencies in the historic
data. This issue only applies to revised historic data and does not affect the
Commissions forecasts.
Our Carer’s Allowance forecasts were finalised on the 14 May, a day before the
Department for Work and Pensions (DWP) released new caseload data for
November 2017. This data point was therefore not included in our forecasts. The
Commission also decided not to include an earlier data point for August 2017 in
our forecasts. This quarter of data showed a fall in the number of individuals in
receipt of Carer’s Allowance. This did not tally with our expectation or
understanding of the likely changes in the number of individuals receiving Carer’s
Allowance payments. In the absence of information explaining the fall, we chose
not to include it. The subsequent release on the 15 May showed an increase in
claimants and a return to the previous trend. The Commission will continue to
monitor data as they become available and we will review our judgements in future
forecasts.
Figure 1.3: Carer’s Allowance Caseload, Scotland
60,000
62,000
64,000
66,000
68,000
70,000
72,000
74,000

35
Source: DWP’s StatXplore (link)
Note: Caseload refers to caseload in payment.
Professional Standards
1.19 The Commission is committed to fulfilling our role as an Independent Fiscal
Institution (IFI), in line with the principles set out by the Organisation for
Economic Cooperation and Development (OECD) for these institutions.17
1.20 The Commission also seeks to adhere to the highest standards for analysis
possible. While we do not produce official statistics (as we produce forecasts),
the Commission and our work voluntarily complies as much as possible with
the principles of the Code of Practice for Official Statistics.
1.21 The Commission has published a statement on our compliance with the Code
of Practice for Official Statistics on our website.18
This sets out how the
Commission demonstrates voluntary compliance with as many parts of the code as possible.
17
OCED Recommendation on Principles for Independent Fiscal Institutions (link)
18 Scottish Fiscal Commission (2018) Compliance with the Code of Practice for Official Statistics (link)

36
Comments & Contact
1.22 This is the second set of forecasts produced by the Commission. We welcome
comments from users about the content and format of our publications. In
particular, if there are particular analyses, or disaggregations of data which
users would find useful as part of future forecast reports, please let us know.
1.23 All charts and tables in this publication have also been made available in
spreadsheet form on our website.19
If you have any feedback, or would like to
request further information about any of our analysis, please email
19
Scottish Fiscal Commission (2018) Scotland’s Economic and Fiscal Forecasts May 2018 (link)

37
Chapter 2
Economy
Introduction 2.1 This chapter outlines the Commission’s economy forecasts, set within the
wider economic context for Scotland.
2.2 The economy forecasts are created for two reasons:
To fulfil the Commission’s remit of providing quarterly onshore Gross
Domestic Product (GDP) growth forecasts for the next two years and
annual growth forecasts for the subsequent four financial years; 20
and,
To provide the economic variables that feed into the Commission’s
fiscal forecasts, for example: wages, employment and hours worked
that are used in the income tax forecast.
2.3 In constructing our forecast the Commission has considered the long-run
evolution of the economy, particularly productivity and potential output; the
short-run forecasts based on recent outturn and survey data; and, how the
short and long-run forecasts are brought together in the medium-run through
the relationship between output and the output gap. The chapter proceeds as
follows:
Forecast context and summary
Key judgements
Developments in the Scottish economy
The long-run: productivity and potential output
20
Onshore GDP is used as shorthand in referring to Scotland’s GDP excluding the value of oil, gas and other
hydrocarbons produced in the Scottish sector of the UK continental shelf as defined in the Scottish Fiscal
Commission Act 2016 (link). This is the same basis as the headline GDP figures published by the Scottish
Government (link).

38
Short-run forecasts
The medium-term outlook and the output gap
Second-round effects
Forecast sensitivities
Comparison to previous forecasts
Comparison to OBR UK forecasts
2.4 The methodology behind the Commission’s economy forecasts has been
discussed in two Occasional Papers published over the last year.21
The
Commission will continue to publish papers to help users better understand
our approach to forecasting and keep users up to date on developments in
the methodology.
2.5 The economy forecasts were finalised on 11 May 2018, with no published
data being accepted after 1 May 2018. This cut-off is to allow for a stable
forecast against which the Government can finalise its Medium Term Financial
Strategy. See Box 1.3 in the introductory chapter for further information.
Forecast context and summary
2.6 This section:
summarises developments since our previous forecasts
puts our forecasts in the context of recent economic performance
provides an overview of our economy forecasts
provides headline forecast numbers and an assessment of whether
or not access to additional borrowing powers will be triggered by a
Scotland-specific economic shock
2.7 In December 2017 we published our first set of economic forecasts.22
At the
time, we described our outlook for economic growth as subdued. We
expected growth in GDP to average 0.9 per cent over the five-year forecast
period, well below historic norms. Developments and new data published
since December have done little to change our outlook, with growth remaining
broadly in line with our subdued expectations.
2.8 Real wage growth has been weak over the last decade, with real wages lower
today than they were in 2010. Since our previous forecasts, we have
undertaken new analysis of wage growth in Scotland. As a result, we have
21
Scottish Fiscal Commission (2017) Current Approach to Forecasting (link) and Scottish Fiscal Commission
(2018) Forecasting the long-run potential of the Scottish economy March 2018 (link)
22 Scottish Fiscal Commission (2017) Scotland’s Economic & Fiscal Forecasts December 2017 (link)

39
revised down our forecast for changes in real wages over the next six years.
Real wages are expected to continue to fall in 2018-19, before gradually
starting to grow from 2019-20 onwards. Following this revision to the outlook
for wages, the income tax forecast has also been revised down. This new
analysis is discussed in the section ‘Developments in the Scottish Economy’.
2.9 In addition to slow growth in real wages over the last decade, wage growth
appears to have been particularly weak in 2016 and 2017. This is part of a
broader issue of falling productivity and weak real wage growth over the last
two years. The labour market, and in particular total hours worked, have
continued to diverge from GDP. With subdued growth in GDP and total
income, stronger growth in employment and hours worked have led to falling
real wages and productivity. While this divergence was already a puzzle for
trying to understand the Scottish economy in December 2017, the divergence
has continued to grow in scale.
2.10 We believe that falling productivity over the last two years is because of
temporary issues including declines in oil and gas supply chain activity;
contracting construction activity; and, buoyancy in the labour market. We
judge trend productivity growth to have been 0.0 per cent in Scotland over the
last two years, and expect productivity growth to increase to 0.25 per cent in
2018-19. For further detail, please see our ‘Developments in the Scottish
Economy’ section.
2.11 In our previous report, we set out a number of temporary factors which
supported GDP growth since 2010 and to some extent had masked weaker
underlying growth in the economy. For example, we highlighted the boost to
growth from the oil and gas onshore supply chain from 2010 to 2014, how
household consumption had been supported by a declining savings ratio, and
the exceptional growth in construction industry output in 2015.
2.12 Our view on this is largely unchanged since December. The discussion
provided in our December 2017 report in the section “Underlying trends in the
Scottish economy” stands as a statement of the Commission’s view on the
underlying performance of the Scottish economy since 2010.
2.13 The general slowdown in economic growth observed in recent years would,
on its own, be sufficient to warrant a forecast lower in the near term than
historic norms. We further adjust our forecasts to consider Scotland’s specific
circumstances, looking at both the upside and downside uncertainties facing
the economy. On balance, we judge that the downsides outweigh the upsides.
In the Commission’s view, the period of slower growth is unlikely to come to
an end in the near future. These downsides include the UK’s changing
relationship with the EU, weak demand from activity in the UK Continental
Shelf (UKCS), and Scotland’s industrial and demographic structure.
40
2.14 With population growth in Scotland expected to slow in the coming years, and
the labour market already at historic highs, there is limited room for population
growth or labour market participation to contribute further to economic growth.
Therefore, GDP growth will now have to be driven by productivity growth.
Productivity growth has been slowing in Scotland since 2004. The
Commission’s judgement is that this slow growth in productivity will continue
in the near term, before gradually starting to increase towards historic levels
towards the end of the five-year forecast. As a result, the Commission expects
growth in GDP to average 0.9 per cent over the five-year forecast.
2.15 An outlook of subdued growth is based on analysis of historic trends and a
judgement that these trends continue in the near future. As with all forecasts,
there is a significant degree of uncertainty, and the Scottish economy could
surprise in either direction if the underlying trends change, or the outcome of
certain contingencies is different than expected. The final section of this
chapter explores some of the key sensitivities around the core forecast.
2.16 In general, we present our economic forecasts on a financial year basis, as
this is required to fulfil our statutory duty and for our fiscal forecasts.23
To aid
comparisons with other forecasters we also provide calendar year forecasts
for the headline economy forecasts. Table 2.1 presents our headline forecasts
on a calendar year basis compared to our December 2017 forecast.
23
Financial year basis is the four quarter period Q2 – Q1. For example, financial year 2018-19 is the period from
2018 Q2 to 2019 Q1.

41
Table 2.1: Headline economy forecasts, May 2018 and December 2017,
calendar year (% growth)
2016 2017 2018 2019 2020 2021 2022 2023
GDP
December 2017 0.4 0.7 0.7 0.9 0.6 0.9 1.1
May 2018 0.2 0.8 0.7 0.8 0.9 0.9 0.9 0.9
Trend productivity
December 2017 0.2 0.2 0.5 0.6 0.7 0.8 1.0
May 2018 0.0 0.0 0.2 0.5 0.8 0.9 1.0 1.1
Nominal wage
December 2017 3.3 2.0 2.3 2.4 2.6 2.8 3.1
May 2018 3.4 1.1 1.6 1.8 2.2 2.6 2.9 3.2
Real wage
December 2017 2.1 -0.3 0.1 0.5 0.6 0.8 1.1
May 2018 2.0 -1.0 -0.5 0.0 0.2 0.6 0.9 1.2
Employment
December 2017 -0.6 1.3 0.6 0.0 0.1 0.2 0.1
May 2018 -0.6 1.2 0.4 0.0 0.1 0.2 0.1 0.1 Source: Scottish Fiscal Commission
Note: shading shows outturn as available at time of publication
2.17 The supplementary economy tables published alongside this document
provide the main economy forecasts at calendar year, financial year and
quarterly frequency.24
In the rest of this chapter, we use the financial year
basis. Another summary table is provided alongside this report containing the
determinants from the economy forecasts that are fed in to the Commission’s
fiscal forecasts.
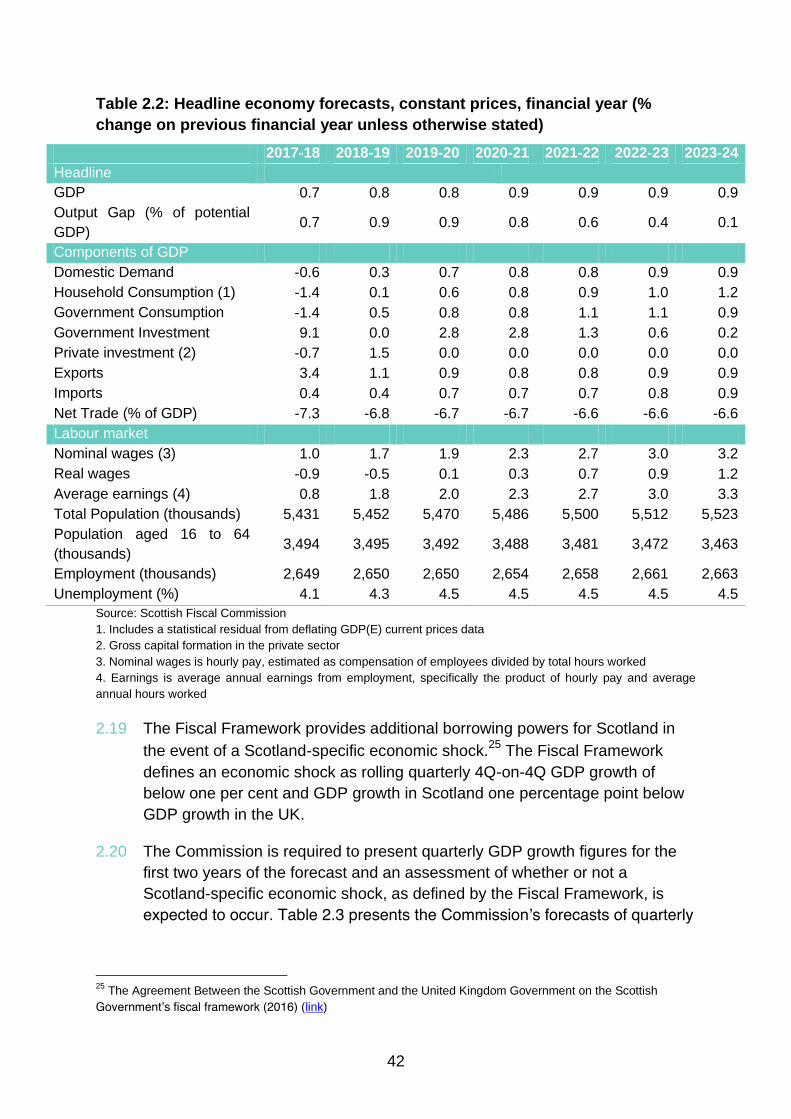
2.18 Table 2.2 presents on a financial year basis the Commission’s headline
economy forecasts including GDP, the labour market and earnings.
24
See Scottish Fiscal Commission (2018) Scotland’s Economic and Fiscal Forecasts May 2018 Supplementary
Economy Tables S2.7 (link)
42
Table 2.2: Headline economy forecasts, constant prices, financial year (%
change on previous financial year unless otherwise stated)
2017-18 2018-19 2019-20 2020-21 2021-22 2022-23 2023-24
Headline
GDP 0.7 0.8 0.8 0.9 0.9 0.9 0.9
Output Gap (% of potential
GDP) 0.7 0.9 0.9 0.8 0.6 0.4 0.1
Components of GDP
Domestic Demand -0.6 0.3 0.7 0.8 0.8 0.9 0.9
Household Consumption (1) -1.4 0.1 0.6 0.8 0.9 1.0 1.2
Government Consumption -1.4 0.5 0.8 0.8 1.1 1.1 0.9
Government Investment 9.1 0.0 2.8 2.8 1.3 0.6 0.2
Private investment (2) -0.7 1.5 0.0 0.0 0.0 0.0 0.0
Exports 3.4 1.1 0.9 0.8 0.8 0.9 0.9
Imports 0.4 0.4 0.7 0.7 0.7 0.8 0.9
Net Trade (% of GDP) -7.3 -6.8 -6.7 -6.7 -6.6 -6.6 -6.6
Labour market
Nominal wages (3) 1.0 1.7 1.9 2.3 2.7 3.0 3.2
Real wages -0.9 -0.5 0.1 0.3 0.7 0.9 1.2
Average earnings (4) 0.8 1.8 2.0 2.3 2.7 3.0 3.3
Total Population (thousands) 5,431 5,452 5,470 5,486 5,500 5,512 5,523
Population aged 16 to 64
(thousands) 3,494 3,495 3,492 3,488 3,481 3,472 3,463
Employment (thousands) 2,649 2,650 2,650 2,654 2,658 2,661 2,663
Unemployment (%) 4.1 4.3 4.5 4.5 4.5 4.5 4.5
Source: Scottish Fiscal Commission 1. Includes a statistical residual from deflating GDP(E) current prices data
2. Gross capital formation in the private sector
3. Nominal wages is hourly pay, estimated as compensation of employees divided by total hours worked
4. Earnings is average annual earnings from employment, specifically the product of hourly pay and average
annual hours worked
2.19 The Fiscal Framework provides additional borrowing powers for Scotland in
the event of a Scotland-specific economic shock.25
The Fiscal Framework
defines an economic shock as rolling quarterly 4Q-on-4Q GDP growth of
below one per cent and GDP growth in Scotland one percentage point below
GDP growth in the UK.
2.20 The Commission is required to present quarterly GDP growth figures for the
first two years of the forecast and an assessment of whether or not a
Scotland-specific economic shock, as defined by the Fiscal Framework, is
expected to occur. Table 2.3 presents the Commission’s forecasts of quarterly
25
The Agreement Between the Scottish Government and the United Kingdom Government on the Scottish
Government’s fiscal framework (2016) (link)

43
GDP growth and provides analysis of whether this would be considered a
Scotland-specific economic shock.
Criterion 1: 4Q-on-4Q growth in Scotland is below 1.0 per cent
Criterion 2: 4Q-on-4Q growth in Scotland is 1.0 percentage point below the
UK
Table 2.3: Assessment of Scotland-specific economic shock
4 Quarter Growth Periods 4Q on 4Q growth in GDP (%) Criteria
Shock
4 quarter period Compared to SFC May
2018 Scotland
OBR Mar
2018 UK
1 2
2017Q2 - 2018Q1 2016Q2 - 2017Q1 0.7 1.6 Y N N
2017Q3 - 2018Q2 2016Q3 - 2017Q2 0.8 1.6 Y N N
2017Q4 - 2018Q3 2016Q4 - 2017Q3 0.9 1.5 Y N N
2018Q1 - 2018Q4 2017Q1 - 2017Q4 0.7 1.5 Y N N
2018Q2 - 2019Q1 2017Q2 - 2018Q1 0.8 1.5 Y N N
2018Q3 - 2019Q2 2017Q3 - 2018Q2 0.7 1.4 Y N N
2018Q4 - 2019Q3 2017Q4 - 2018Q3 0.8 1.3 Y N N
2019Q1 - 2019Q4 2018Q1 - 2018Q4 0.8 1.3 Y N N
2019Q2 - 2020Q1 2018Q2 - 2019Q1 0.8 1.2 Y N N
Source: Scottish Fiscal Commission, OBR (2018) Economic and Fiscal Outlook March 2018 (link)
2.21 The Commission’s assessment is that a Scotland-specific economic shock, as
defined by the Fiscal Framework, is not expected to occur. While the
Commission forecasts growth in Scotland to be below one per cent, the
difference between the Commission’s Scottish and the OBR’s UK GDP
forecast is less than one percentage point.
Key judgements
2.22 Table 2.4 summarises the main judgements we make about the Scottish
economy over the next five years and shows how these have changed since
our previous forecast.

44
Table 2.4: Key economy forecast judgements
Issue Judgement March 2018 Change since December 2017
1. The output gap The economy is broadly on trend but
operating slightly above capacity.
That is, actual output is judged to be
above potential output, with a small
positive output gap of 0.7 per cent in
2017-18
Slight upward revision from +0.4
per cent in 2017-18
2. Trend productivity Trend productivity growth of 0.0 per
cent in 2016-17 and 2017-18.
Annual growth of 0.25 per cent in
2018-19, increasing to 1.1 per cent
by 2023-24
Annual growth in 2018-19 has
been lowered from 0.5 to 0.25 per
cent, in line with a broadly flat
productivity trend observed in
2017. The previous pathway has
been extended to 2023-24, with
productivity growth of 1.1 per cent
3. Trend
unemployment
rate
4.5 per cent over the whole forecast
period
No change
4. Population
projections
ONS 2016-based population
projections 50 per cent EU migration
variant
No change
5. Forecasts of the
UK
OBR UK Spring Statement March
2018 forecasts
Updated from OBR UK Autumn
Budget November 2017 forecasts
6. Changing UK-EU
relationship
Similar to the OBR:
The UK leaves the EU in
March 2019
New trading arrangements
with the EU and others slow
the pace of import and export
growth
The UK adopts a tighter
migration regime than that
currently in place
Slower productivity growth
No change
7. Impact of UK
Continental Shelf
Oil & Gas activity
on the onshore
economy
Limited growth in capital and
operational expenditure in the UKCS
will mean that less demand will be
generated in the onshore Scottish
economy by offshore activities than
in the period 2010 to 2014
No significant change
8. Savings ratio Broadly flat over the forecast No change
9. Second-round
effects
No second round effects are
quantified in the economy forecasts
No change
Source: Scottish Fiscal Commission

45
Developments in the Scottish economy
2.23 This section provides further information on the Commission’s view of the
main current issues in the Scottish economy:
The labour market, wages and productivity in 2016 and 2017: looking
at the apparent divergence in performance between the labour market
and the rest of the Scottish economy
The outlook for wages: taking a broader look at historic real wage
growth and how this has affected our longer-term outlook for wage
growth
Rising oil prices and oil & gas activity
Impact of the UK’s changing relationship with the EU
The labour market, wages and productivity in 2016 and 2017
2.24 Despite subdued growth in the economy over the last two years, the labour
market has been robust. As shown in Figure 2.1, between the start of 2016
and 2017 Q3, the last quarter for which comparable data are available, the
economy has grown by 1.0 per cent, while employment and hours worked
have grown by 2.4 per cent. Usually, with increasing productivity over time,
one would expect to see the economy growing faster than employment or
hours worked. There is an apparent disconnect between growth in output and
incomes on the one hand, and growth in employment and hours worked on
the other.

46
Figure 2.1: GDP, employment and total hours worked index, 2016 Q1 = 100
Source: Scottish Government (2018) Scotland’s Gross Domestic Product Quarter 4 2017 (link), ONS (2018)
Regional labour market statistics in the UK: May 2018, HI11 (link)
2.25 In itself labour market growth is a positive for Scotland. However, the
disconnect between the labour market and growth in the broader economy is
a puzzle. These data have two related implications. Firstly, that productivity
has fallen, and secondly, that average hourly wage growth has also been
weak or even negative. While this was broadly the case when we published
our previous forecasts in December 2017, the latest data have led to a further
reduction in estimates of productivity and wage growth, and sharpened the
question about the forces underlying these changes.
2.26 The Commission models both productivity and hourly wages by taking
aggregate output or earnings data and dividing it by total hours worked. In the
case of productivity, we divide GDP by total hours worked, and in the case of
hourly wages, we divide Compensation of Employees (COE) by total hours
worked. In both cases, a sharp increase in total hours worked has reduced
our estimated values for these series in 2016 and 2017. The rest of this
section looks in more depth at the available data and evidence and describes
the judgements we have made in our forecasts.
99
100
101
102
103
1 2 3 4 1 2 3 4
2016 2016 2016 2016 2017 2017 2017 2017
GDP Employment Total hours worked

47
Productivity 2.27 Data published by the Scottish Government shows productivity has fallen
between 2015 and 2017 by around 3.3 per cent.26
The Commission’s
judgement is that this period of declining average productivity is due to
temporary issues rather than part of a new trend. The reasons for this are:
Buoyancy in the labour market and above trend average hours
worked. Data on average hours worked are volatile and are currently
above the Commission’s estimated trend. We expect average hours
worked to decline back to trend in the coming quarters. This should lead
to some upwards adjustment in measured productivity. Figure 2.1
suggests this is already beginning to occur.
Falling construction industry activity in 2016 and 2017. Output in the
construction industry has fallen by 9.3 per cent over the last two years,
following strong increases in output in 2015. We did not view the strong
increases in construction sector output in 2015 as part of an underlying
trend in the economy. We similarly view the decline in construction sector
output in 2016 and 2017 as cyclical. Therefore, we exclude these
particular movements from our analysis when interpreting longer term
trends.
Weak onshore demand from UK Continental Shelf (UKCS) oil and
gas activity. Cyclical weakness over the last two years because of
developments in the onshore oil and gas support industries have
suppressed GDP growth but are not expected to have a persistent effect
on the growth rate.
2.28 In the Commission’s view, falling productivity over the last two years is
because of temporary factors in the labour market and certain industries.
Given the latest data, we think that underlying productivity growth will be
weaker than we allowed for in our December 2017 forecasts, but not as weak
as the last two years might suggest. Figure 2.2 shows our assumption for
trend productivity growth relative to the outturn data.
26
Scottish Government (2018) Labour Productivity 2017 Quarter 4 (link)
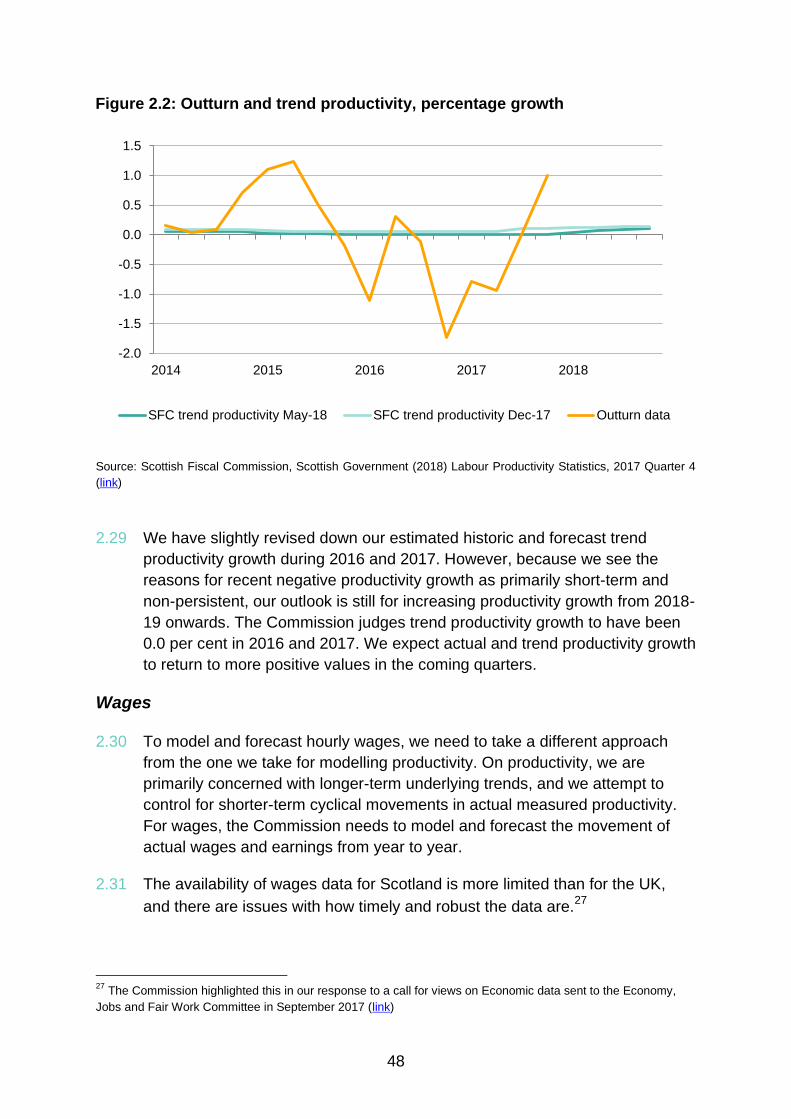
48
Figure 2.2: Outturn and trend productivity, percentage growth
Source: Scottish Fiscal Commission, Scottish Government (2018) Labour Productivity Statistics, 2017 Quarter 4
(link)
2.29 We have slightly revised down our estimated historic and forecast trend
productivity growth during 2016 and 2017. However, because we see the
reasons for recent negative productivity growth as primarily short-term and
non-persistent, our outlook is still for increasing productivity growth from 2018-
19 onwards. The Commission judges trend productivity growth to have been
0.0 per cent in 2016 and 2017. We expect actual and trend productivity growth
to return to more positive values in the coming quarters.
Wages 2.30 To model and forecast hourly wages, we need to take a different approach
from the one we take for modelling productivity. On productivity, we are
primarily concerned with longer-term underlying trends, and we attempt to
control for shorter-term cyclical movements in actual measured productivity.
For wages, the Commission needs to model and forecast the movement of
actual wages and earnings from year to year.
2.31 The availability of wages data for Scotland is more limited than for the UK,
and there are issues with how timely and robust the data are.27
27
The Commission highlighted this in our response to a call for views on Economic data sent to the Economy,
Jobs and Fair Work Committee in September 2017 (link)
-2.0
-1.5
-1.0
-0.5
0.0
0.5
1.0
1.5
2014 2015 2016 2017 2018
SFC trend productivity May-18 SFC trend productivity Dec-17 Outturn data

49
2.32 Table 2.5 provides a summary of the available wages data in Scotland. These
sources provide coverage of different time periods and populations, and
measure earnings on different bases, meaning the figures are not always
directly comparable. Even allowing for the varying comparability of each
source, the available data appear to be showing a mixed picture on wage
growth in Scotland in 2017.
2.33 The Annual Survey of Hours and Earnings (ASHE), one of the largest surveys
of earnings in Scotland, is currently only available up to April 2017, but does
show a strengthening of gross hourly pay growth from 2016 in to 2017. HMRC
has started publishing Real Time Information (RTI) data from its PAYE income
tax database, covering up to 2017 Q3. This also shows a slight strengthening
of earnings growth, but only provides information on average annual earnings
reported through PAYE, and so is limited as a source of information about
hourly wage growth. Another measure of earnings in Scotland comes from the
Labour Force Survey (LFS). This shows gross weekly earnings falling in
Scotland towards the end of 2017 on an annual quarter-on-quarter
comparison. Finally, the Commission’s primary measure of wages, which
divides growth in Compensation of Employees (COE) from quarterly national
accounts by total hours worked to get a measure of hourly wages, also shows
a significant slowing of wage growth in 2017.
Table 2.5: Sources of earnings information for Scotland, comparable annual
growth rate (%)
Source Variable Time period 2016 2017
ASHE Gross hourly pay Year to April of
reference year 2.6 3.2
RTI: PAYE Average annual
earnings
4Q on 4Q growth
up to 2017 Q3 1.7 2.0
LFS: GWE Gross weekly
earnings, FT only
4Q on 4Q growth
up to 2017 Q4 4.0 -1.5
QNAS: COE
based measure
Total COE divided
by total hours
worked
4Q on 4Q growth
up to 2017 Q3 3.6 0.8
Source: ONS (2017) ASHE access via nomisweb (link), HMRC (2018) UK Real Time Information (link) ONS
(2018) Labour Force Survey Gross weekly earnings of full-time employees by region (link), Scottish Fiscal
Commission
2.34 Table 2.5 shows there is not a clear picture on earnings in Scotland, with two
sources showing a strengthening in earnings in 2017 and two sources
suggesting a slowing.
2.35 As with productivity, buoyancy in the hours worked data will form at least part
of the explanation leading to slowing growth in the Commission’s COE based

50
measure of nominal wages in 2017. However, the LFS survey of earnings is
independent of the measurement of hours worked, lending weight to a view of
slowing wage growth in 2017.
2.36 This evidence from COE and LFS of slowing nominal wage growth in 2017
must be balanced against the two other sources of earnings information which
paint a more positive picture of strengthening earnings growth in 2017.
2.37 On balance, the Commission expects nominal hourly wage growth to have
been around 1.0 per cent in 2017-18. This is below historic norms and is a
notable downward revision to our forecast in December 2017 when we
estimated 2017-18 nominal wage growth to be 2.0 per cent. With inflation of
2.0 per cent in 2017-18, we expect that real wages fell by -0.9 per cent.
2.38 The Commission is primarily concerned with the pathway of total annual
earnings in Scotland. To an extent, slow growth in hourly wages in recent
quarters has been offset by strong growth in hours worked, leaving total
earnings less affected.
The outlook for wages
2.39 The previous section looked specifically at what the data are signalling for
wage growth in 2016-17 and 2017-18, which has led us to revise down wage
growth in 2017-18 in our modelling. This section looks more broadly at real
wage growth, discussing longer term historic trends and the implication of this
for the outlook for real wage growth.
2.40 For this forecast the Commission has looked in more depth at wage growth in
Scotland over the last ten years. Further developments in the Commission’s
analysis, as well as consideration of the latest data, have led us to also revise
down our longer term outlook for wage growth in Scotland relative to our
December 2017 forecasts.
2.41 The Commission’s judgement of 1.0 per cent nominal wage growth in 2017-18
is part of an on-going trend of weak nominal and real wage growth. We look
across a range of evidence in building up a fuller picture. Figure 2.3 shows
real wage growth in Scotland and the UK as measured by ASHE, gross
weekly earnings (GWE) and average weekly earnings (AWE).

51
Figure 2.3: Real wages, Scotland and UK, 2009 = 100
Source: Scottish Fiscal Commission
Notes: ASHE is gross mean hourly pay of all employees (link). GWE is gross weekly earnings of full-time
employees only (link). AWE is whole economy annual average weekly earnings total pay (Scottish values not
available) (link). Each series has been deflated using the CPI all items index (link).
2.42 As Figure 2.3 shows, real wage growth has been weak over the last decade in
both Scotland and the UK. Across these indicators, real wages were lower in
2017 than in 2009, and are broadly similar to levels in 2005. For real wages to
be lower than ten years earlier is exceptional. Understanding the factors
leading to this period of weak wage growth is key to making a judgement for
the likely outlook for wages.
2.43 Wage growth is affected by a number of factors. In the long-run, real wages
are expected to grow in line with productivity. In the shorter-term, real wages
can be affected by availability of labour, inflation, business profitability,
uncertainty and some underlying structural factors.
2.44 The availability of labour is expected to have an impact on wages. When
labour is in short supply, for example due to low unemployment, businesses
have to compete to hire from a shrinking pool of potential employees, and
may choose to increase wages to attract talent. To illustrate this issue, the
Commission has created a composite indicator of labour market slack. This is
shown in Figure 2.4 below.
90
92
94
96
98
100
102
104
2005 2006 2007 2008 2009 2010 2011 2012 2013 2014 2015 2016 2017
ASHE - Scotland ASHE - UK
GWE - Scotland GWE - UK
AWE - UK

52
Figure 2.4: Indicators of labour market slack and composite indicator
Source: Scottish Fiscal Commission
Notes: Labour market data taken from ONS (2018) Regional labour market statistics in the UK: May 2018, HI11
(link)
2.45 The Commission is using six different indicators of labour market slack from
three different surveys. This includes the headline unemployment rate from
the LFS, data from the Annual Population Survey (APS) on individuals who
are not in permanent, full-time work but have indicated they wish to work more
hours, and data from the CBI (Confederation of British Industry) industrial
trends survey on recruitment difficulties. Our indicator is shown in Figure 2.4.
Positive values indicate labour market slack, and negative values indicate
tightness.
2.46 Figure 2.4 shows that the labour market has tightened over the last five to
eight years. Not only is unemployment at historic lows, but the number of
individuals who are in part-time employment, temporary employment or
economically inactive and say they would like to work more hours, is also near
a historic low. Normally, such a degree of labour market tightness might be
expected to lead to higher earnings growth, but this does not appear to be
happening.
-3
-2
-1
0
1
2
3
2004 2006 2008 2010 2012 2014 2016
Unemployment % could not find a full time job
% could not find a perm job proportion inactive wants a job
weighted average
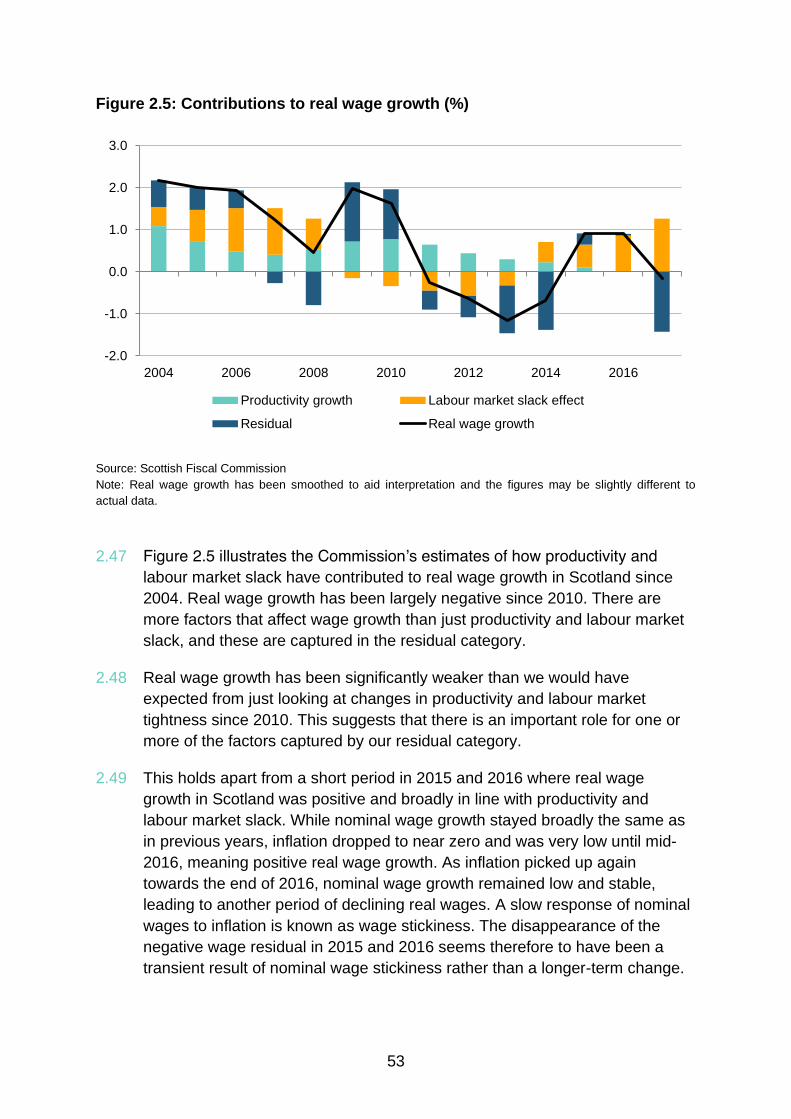
53
Figure 2.5: Contributions to real wage growth (%)
Source: Scottish Fiscal Commission
Note: Real wage growth has been smoothed to aid interpretation and the figures may be slightly different to
actual data.
2.47 Figure 2.5 illustrates the Commission’s estimates of how productivity and
labour market slack have contributed to real wage growth in Scotland since
2004. Real wage growth has been largely negative since 2010. There are
more factors that affect wage growth than just productivity and labour market
slack, and these are captured in the residual category.
2.48 Real wage growth has been significantly weaker than we would have
expected from just looking at changes in productivity and labour market
tightness since 2010. This suggests that there is an important role for one or
more of the factors captured by our residual category.
2.49 This holds apart from a short period in 2015 and 2016 where real wage
growth in Scotland was positive and broadly in line with productivity and
labour market slack. While nominal wage growth stayed broadly the same as
in previous years, inflation dropped to near zero and was very low until mid-
2016, meaning positive real wage growth. As inflation picked up again
towards the end of 2016, nominal wage growth remained low and stable,
leading to another period of declining real wages. A slow response of nominal
wages to inflation is known as wage stickiness. The disappearance of the
negative wage residual in 2015 and 2016 seems therefore to have been a
transient result of nominal wage stickiness rather than a longer-term change.
-2.0
-1.0
0.0
1.0
2.0
3.0
2004 2006 2008 2010 2012 2014 2016
Productivity growth Labour market slack effect
Residual Real wage growth

54
2.50 Taking a view of the period 2010 to 2017, real wage growth has been weak,
and weaker than would have been expected given movements in productivity
and labour market slack. This has important implications for the Commission’s
forecast. Previously we might have expected a tightening labour market to
contribute to higher real wage growth in the forecast, but the recent evidence
suggests there are other factors playing a significant role in wage growth in
Scotland at present. These factors may continue to restrict wage growth
irrespective of the degree of labour market tightness.
2.51 We think the factors acting as an additional drag on real wage growth
between 2011 and 2017 included:
Particularly in the early part of the period, the on-going impact of the
financial crisis on business confidence; increasing uncertainty; and
reducing profitability. Uncertainty and low profits will have resulted in
more limited wage settlements.
Other more recent factors affecting business confidence and certainty
such as the changing UK-EU relationship.
Rising non-wage labour costs further reducing the scope for higher pay
awards within tight budgets, including pensions auto-enrolment and the
apprenticeship levy.
A restructuring of the Scottish economy with the loss of high-skill high-
pay jobs, particularly in the oil and gas supply chain and related
industries following the fall in oil prices from 2014 and declining UKCS
expenditure.
The increasing role of automation and artificial intelligence technologies
in business processes. To some extent, this will have allowed businesses
to avoid higher non-wage labour costs and recruitment difficulties by
switching some functions towards more automated capital based
processes, thus avoiding the need to offer higher pay awards in the face
of a tight labour market. Such increasing automation may mean higher
productivity and GDP in the long-run, but this may be reflected more in
higher profits and return on capital rather than in the form of higher
wages and compensation of employees.
At the same time as a loss of medium and high-skill employment, an
increase in more insecure and lower pay forms of employment, often
described as an increase in the ‘gig-economy’.
From 2016 onwards, sharp declines in construction sector output and
activity, which is also relatively highly paid and highly skilled.

55
2.52 The outlook for real wage growth in Scotland depends on balancing the
Commission’s judgement on increasing productivity growth against the role of
labour market slack and the impact of the factors discussed above. We expect
real wage growth to be higher over the next five years than over the last five
years, with real wage growth increasing from 2018-19 onwards. Our
reasoning for this includes:
Increasing levels of productivity over the next six years should start to
feed through to real wage growth.
The link between labour market tightness and real wage growth may
appear to be weak, but we do expect on-going shortages of skilled labour
to start to lead to some higher wage growth for higher earners whose
skills are in demand.
For some lower earners, growth in the national living wage will have a
significant effect on pay.
Higher public sector pay awards will lead directly to higher wage growth
for those in the public sector. This may also spur higher wage growth in
parts of the private sector where there is direct competition for labour.
Confidence and activity is starting to return to the oil and gas supply
chain as prices have risen. We do not think this is of sufficient magnitude
to significantly alter the aggregate economic picture, but should lead to
some pay growth in the sector.
2.53 These factors are expected to lead to modest increases in real wage growth in
the coming years, but they will continue to be tempered by the drag factors
listed above.
2.54 Figure 2.6 shows the Commission’s forecast of real wages. In 2018-19, rising
inflation, low productivity growth and the factors which have reduced wage
growth since 2010 are expected to lead to real wage growth remaining
negative. From 2019-20 onwards, real wage growth is expected to start to
increase because of the factors listed above.
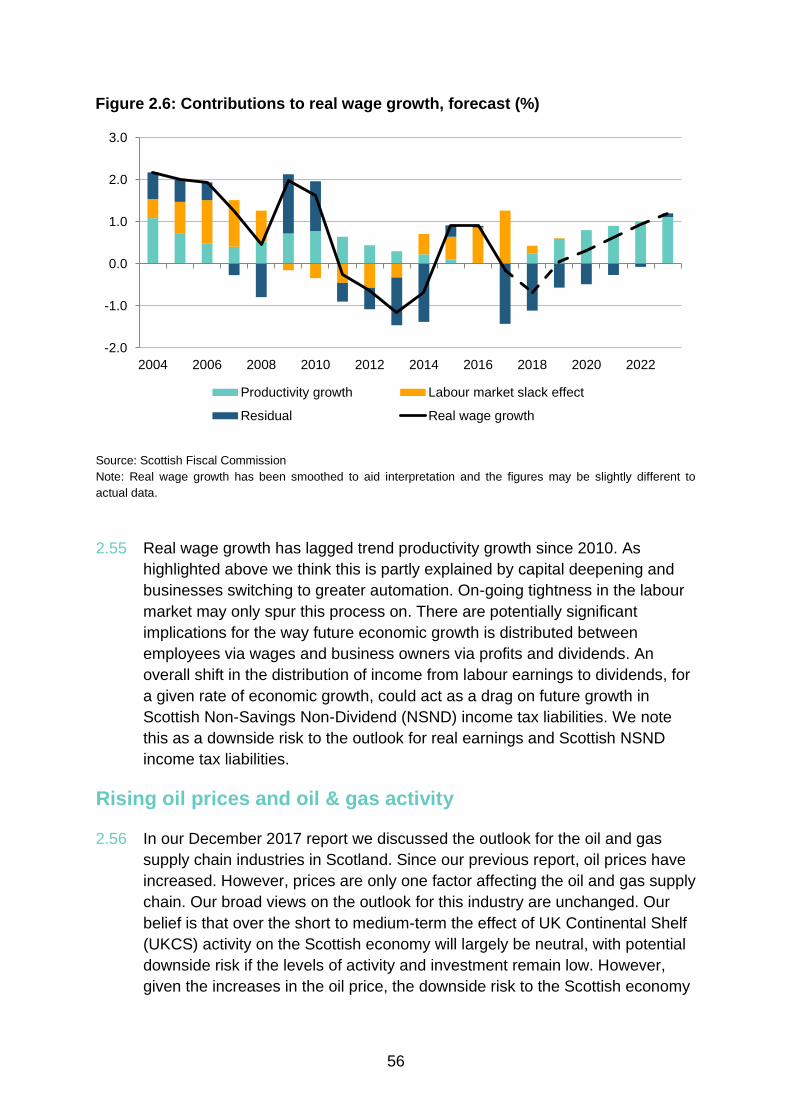
56
Figure 2.6: Contributions to real wage growth, forecast (%)
Source: Scottish Fiscal Commission
Note: Real wage growth has been smoothed to aid interpretation and the figures may be slightly different to
actual data.
2.55 Real wage growth has lagged trend productivity growth since 2010. As
highlighted above we think this is partly explained by capital deepening and
businesses switching to greater automation. On-going tightness in the labour
market may only spur this process on. There are potentially significant
implications for the way future economic growth is distributed between
employees via wages and business owners via profits and dividends. An
overall shift in the distribution of income from labour earnings to dividends, for
a given rate of economic growth, could act as a drag on future growth in
Scottish Non-Savings Non-Dividend (NSND) income tax liabilities. We note
this as a downside risk to the outlook for real earnings and Scottish NSND
income tax liabilities.
Rising oil prices and oil & gas activity
2.56 In our December 2017 report we discussed the outlook for the oil and gas
supply chain industries in Scotland. Since our previous report, oil prices have
increased. However, prices are only one factor affecting the oil and gas supply
chain. Our broad views on the outlook for this industry are unchanged. Our
belief is that over the short to medium-term the effect of UK Continental Shelf
(UKCS) activity on the Scottish economy will largely be neutral, with potential
downside risk if the levels of activity and investment remain low. However,
given the increases in the oil price, the downside risk to the Scottish economy
-2.0
-1.0
0.0
1.0
2.0
3.0
2004 2006 2008 2010 2012 2014 2016 2018 2020 2022
Productivity growth Labour market slack effect
Residual Real wage growth
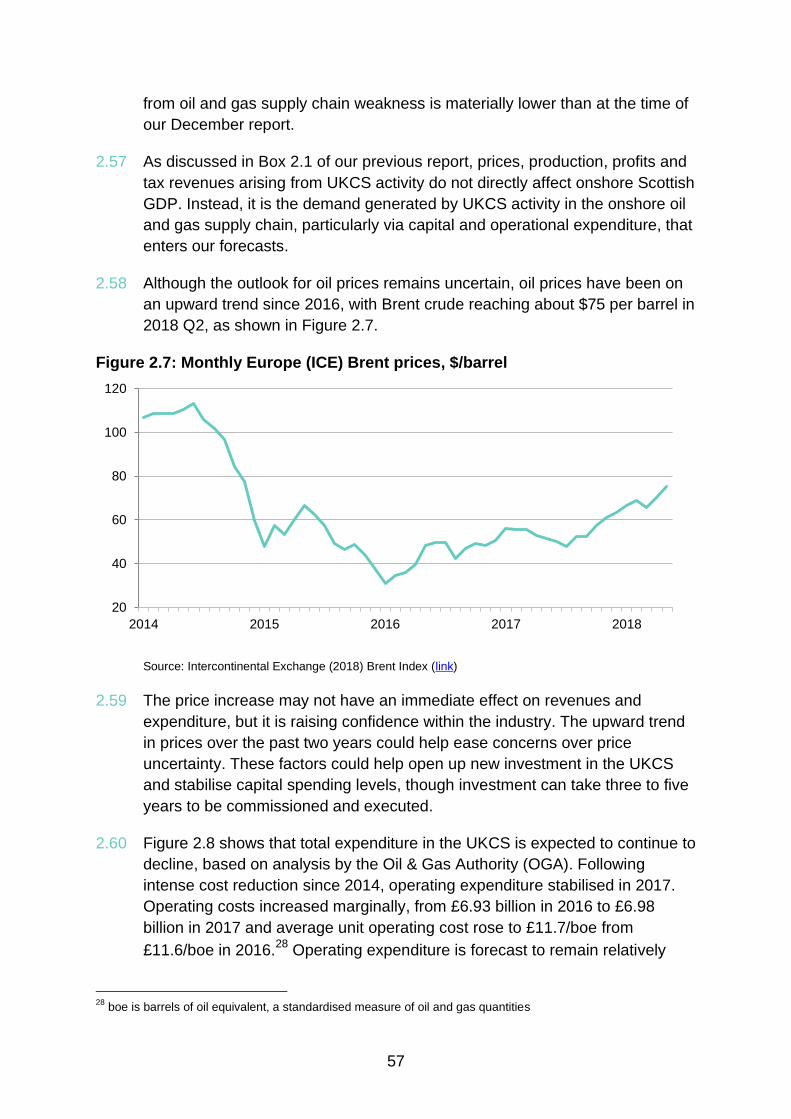
57
from oil and gas supply chain weakness is materially lower than at the time of
our December report.
2.57 As discussed in Box 2.1 of our previous report, prices, production, profits and
tax revenues arising from UKCS activity do not directly affect onshore Scottish
GDP. Instead, it is the demand generated by UKCS activity in the onshore oil
and gas supply chain, particularly via capital and operational expenditure, that
enters our forecasts.
2.58 Although the outlook for oil prices remains uncertain, oil prices have been on
an upward trend since 2016, with Brent crude reaching about $75 per barrel in
2018 Q2, as shown in Figure 2.7.
Figure 2.7: Monthly Europe (ICE) Brent prices, $/barrel
Source: Intercontinental Exchange (2018) Brent Index (link)
2.59 The price increase may not have an immediate effect on revenues and
expenditure, but it is raising confidence within the industry. The upward trend
in prices over the past two years could help ease concerns over price
uncertainty. These factors could help open up new investment in the UKCS
and stabilise capital spending levels, though investment can take three to five
years to be commissioned and executed.
2.60 Figure 2.8 shows that total expenditure in the UKCS is expected to continue to
decline, based on analysis by the Oil & Gas Authority (OGA). Following
intense cost reduction since 2014, operating expenditure stabilised in 2017.
Operating costs increased marginally, from £6.93 billion in 2016 to £6.98
billion in 2017 and average unit operating cost rose to £11.7/boe from
£11.6/boe in 2016.28
Operating expenditure is forecast to remain relatively
28
boe is barrels of oil equivalent, a standardised measure of oil and gas quantities
20
40
60
80
100
120
2014 2015 2016 2017 2018

58
stable, around £7 billion (£12/boe average unit operating cost), over the
forecast horizon.
Figure 2.8: UKCS capital and operating expenditure, £ billion, 2017 prices
Source: Oil & Gas Authority (2018) Projections of UK Oil and Gas Production and Expenditure (link)
2.61 Capital expenditure continues to decline as major projects are close to coming
on stream and the capital expenditure phase of these projects finishes.
Capital expenditure was estimated at £5.6 billion in 2017, down from £8.6
billion in 2016 and a high of £15.45 billion in 2014. The fall in capital
expenditures is being driven by low levels of new investment approvals as
well as efficiency gains implying less capital is required. The growing
confidence in the sector and upward trending prices should help unlock new
investment in the short to medium-term, slowing down the decline in capital
expenditures.
2.62 Our overall assessment is that the period of rapidly declining capital
expenditure is coming to an end. Recent increases in confidence will help
capital expenditure to start to level out over the next few years, but we do not
expect it to return to the high levels seen during 2010 to 2014.
2.63 Decommissioning activity has been growing in the last few years, and
continued in 2017, with expenditure rising to £1.8 billion from £1.2 billion in
2016. Decommissioning expenditure is forecast to remain consistent around
£2 billion per year over the next three to five years. Efficiency improvements
are extending the life of existing assets and hence mitigating the rush to
decommission.
2.64 Notwithstanding the challenges with new investment as well as closure of the
Forties Pipeline System late in December, the UKCS was able to maintain
production of petroleum and other liquid fuels at the same levels as in 2016,
0
2
4
6
8
10
12
14
16
2012 2013 2014 2015 2016 2017 2018 2019 2020
Capital Expenditure Operating Expenditure
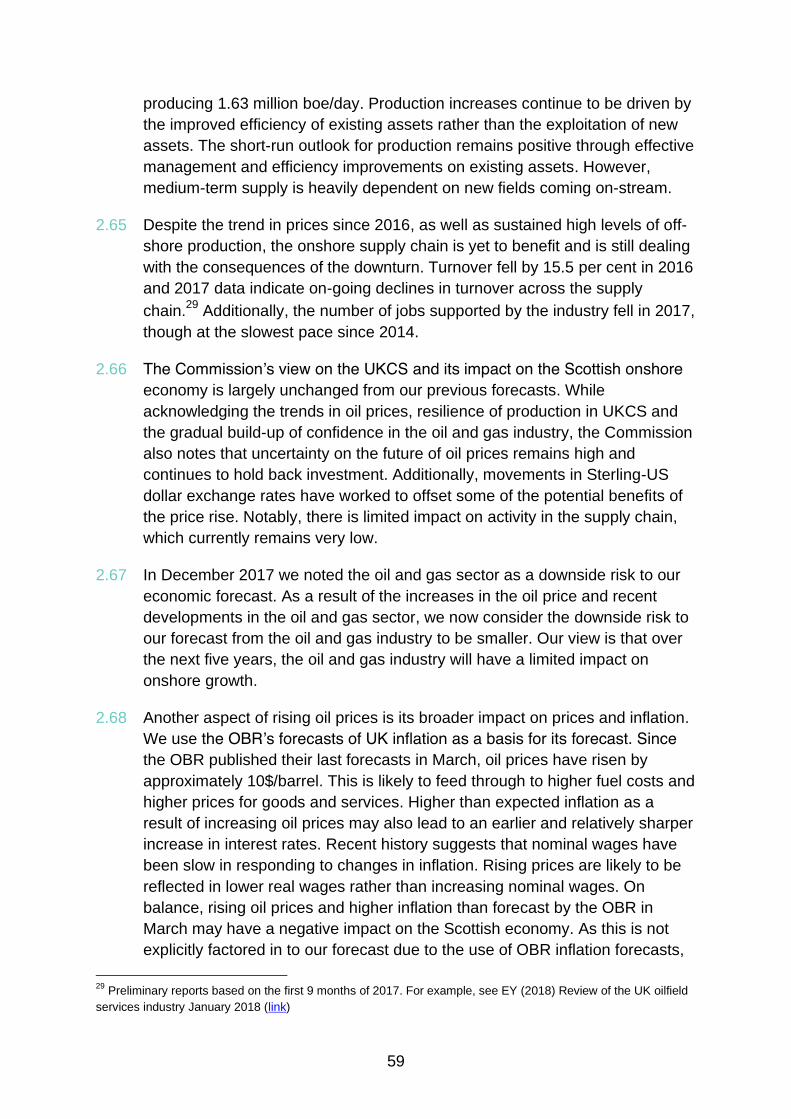
59
producing 1.63 million boe/day. Production increases continue to be driven by
the improved efficiency of existing assets rather than the exploitation of new
assets. The short-run outlook for production remains positive through effective
management and efficiency improvements on existing assets. However,
medium-term supply is heavily dependent on new fields coming on-stream.
2.65 Despite the trend in prices since 2016, as well as sustained high levels of off-
shore production, the onshore supply chain is yet to benefit and is still dealing
with the consequences of the downturn. Turnover fell by 15.5 per cent in 2016
and 2017 data indicate on-going declines in turnover across the supply
chain.29
Additionally, the number of jobs supported by the industry fell in 2017,
though at the slowest pace since 2014.
2.66 The Commission’s view on the UKCS and its impact on the Scottish onshore
economy is largely unchanged from our previous forecasts. While
acknowledging the trends in oil prices, resilience of production in UKCS and
the gradual build-up of confidence in the oil and gas industry, the Commission
also notes that uncertainty on the future of oil prices remains high and
continues to hold back investment. Additionally, movements in Sterling-US
dollar exchange rates have worked to offset some of the potential benefits of
the price rise. Notably, there is limited impact on activity in the supply chain,
which currently remains very low.
2.67 In December 2017 we noted the oil and gas sector as a downside risk to our
economic forecast. As a result of the increases in the oil price and recent
developments in the oil and gas sector, we now consider the downside risk to
our forecast from the oil and gas industry to be smaller. Our view is that over
the next five years, the oil and gas industry will have a limited impact on
onshore growth.
2.68 Another aspect of rising oil prices is its broader impact on prices and inflation.
We use the OBR’s forecasts of UK inflation as a basis for its forecast. Since
the OBR published their last forecasts in March, oil prices have risen by
approximately 10$/barrel. This is likely to feed through to higher fuel costs and
higher prices for goods and services. Higher than expected inflation as a
result of increasing oil prices may also lead to an earlier and relatively sharper
increase in interest rates. Recent history suggests that nominal wages have
been slow in responding to changes in inflation. Rising prices are likely to be
reflected in lower real wages rather than increasing nominal wages. On
balance, rising oil prices and higher inflation than forecast by the OBR in
March may have a negative impact on the Scottish economy. As this is not
explicitly factored in to our forecast due to the use of OBR inflation forecasts,
29
Preliminary reports based on the first 9 months of 2017. For example, see EY (2018) Review of the UK oilfield
services industry January 2018 (link)

60
the Commission views rising oil prices as an overall downside risk to the
forecasts.
Impact of the UK’s changing relationship with the EU
2.69 On 23 June 2016 the UK electorate voted to leave the EU. On 29 March 2017,
the British Government invoked Article 50, triggering the process for the UK to
leave the EU by March 2019. At the time of preparation of our forecasts, the
outcome of the negotiations remains unknown.
2.70 Since our previous forecasts, there have been a number of developments on
Brexit, including the UK-EU agreement over the terms of a ‘transition period’;
the British Prime Minister’s landmark speech on the future economic
partnership with the European Union; and the approval of guidelines setting
out the EU’s trade negotiating position. These are discussed below in more
detail. However the extent of uncertainty on the outcome and implications of
the withdrawal process has not changed since December, as no agreement
has yet been reached on the permanent trade, migration and other policy
arrangements between the UK and the EU after Brexit.
2.71 With negotiations still taking place, there continue to be rapid political
developments by the UK and EU authorities. It is likely that further headway in
the Brexit discussions will be made after the publication of our forecasts,
particularly following the next European Council meetings of 28-29 June and
18-19 October, with more clarity expected by December.
2.72 There is also a possibility that an EU exit agreement will be reached in
October. In response to a request by the Treasury Select Committee, the
OBR has confirmed that it could incorporate a prospective October EU exit
agreement in its December Budget forecast to inform the Parliament’s vote on
the agreement, moving beyond its current Brexit assumptions as necessary.30
The OBR have said they will consider the scope and robustness of the
additional analysis involved and will assess whether this timetable can be
delivered. In the same way, we will continue to monitor progress in the
withdrawal negotiations and to keep our Brexit assumptions under review for
future forecasts.
2.73 One of the developments since December has been the agreement of the UK
Government and the European Union over the terms of a ‘transition period’,
scheduled to last from 30 March 2019 until 31 December 2020, during which
30
Letter from Chairman of the OBR to Chairman of the Treasury Select Committee 23 April 2018 (link)

61
the UK would remain part of the single market and the customs union.
However this will only come into effect if an overall withdrawal agreement is
signed and ratified by March 2019.
2.74 The transition period would mean that there would be very little change in the
UK’s relationship with the EU before December 2020. Trade between the UK
and the EU is expected to continue on current terms during this period. The
UK will also be able, in principle, to strike future trade deals with other non-EU
countries on the basis that these do not come into force until 1 January 2021.
Freedom of movement will also be maintained. EU citizens and their families
arriving during the transition period will be allowed to live, work and study in
the UK on the same conditions as those who arrived before the referendum,
but will need to register if they choose to remain for longer than three months.
As under existing rules, they can apply to stay indefinitely by acquiring ‘settled
status’ once they have been in the UK for five years.
2.75 Currently there are no firm plans about the UK’s future immigration system
and the new rules to control the number of EU migrants coming to the UK
after the end of the transition period. Discussions about the Irish border imply
that EU citizens will continue to enjoy visa-free travel to the UK, and any
controls on employment will primarily be operated in the workplace rather than
at the border. The outcome for EU citizens will depend on further policy
development by the UK authorities and on the continuing negotiations with the
EU.
2.76 There is also on-going uncertainty over the future UK-EU economic
partnership. While more information has become available since our last
forecast about the respective trade negotiating positions, the outlook is
unclear. The British Prime Minister remains committed to leaving the single
market and the custom union, and has put forward proposals for a new kind of
trade agreement which is different from existing trade models between the EU
and other countries.31
The aim of this bespoke agreement is to maintain the
freest possible access to the single market for services and to avoid the
creation of regulatory barriers, while allowing the UK to set up its own trade
deals around the world. On the other hand, the EU guidelines approved by the
European Council of 23 March 2018 offered a close future relationship based
on a classic free trade agreement, which would maintain zero tariffs and
quotas on goods but covering limited services and with controls for rules of
origin likely to apply. Discussions on a number of key issues such as
agricultural policy and regulatory co-operation are still underway. In addition,
there are important unresolved issues concerning the Irish border and the
31
UK government (2018) Prime Minister’s Speech on the future economic partnership with the European Union,
2 March 2018 (link)

62
inclusion of the financial services sector in the future Brexit deal. It therefore
remains unclear what the new trade and regulatory arrangements will be after
Brexit and how the economic ties between the UK and the EU will be affected.
2.77 At present, there is no meaningful basis for predicting any particular end-point
of this process on which to base our economy forecast. Even given a
particular end-point of the negotiation process, the economic and fiscal
implications would remain highly uncertain.
2.78 In response to this uncertainty, the OBR uses broad-brush assumptions about
the outcome of the negotiation process and the impact on the UK economy.
These assumptions are that:
the UK leaves the EU in March 2019
new trading arrangements with the EU and others slows the pace of
import and export growth
the UK adopts a tighter migration regime than that currently in place
2.79 For our December 2017 forecasts, we adopted a similar set of assumptions
about both the potential outcome of the negotiation process and the resultant
impact on the economy. These reflect a range of potential outcomes and
impacts. We are not attempting to pinpoint the exact impact of UK-EU exit on
the Scottish economy. Nor do we consider a counter-factual case of no UK-
EU exit. Our focus is the impact on the economy over the forecast horizon of
five years. The full impacts of the UK-EU exit, both positive and negative, are
likely to play out over a much longer time horizon.
2.80 The Commission’s judgement is that the OBR’s broad-brush assumptions
continue to provide a suitable starting point for capturing the potential impacts
on Scotland. We have therefore retained the same basic assumptions about
the possible impact of Brexit that we made in our December 2017 forecasts.
2.81 Following the existing basic assumptions, the Commission captures the
impact through three channels:
1. Impact on migration – we use the ONS 50 per cent EU migration variant,
with projected lower EU migration than in the principal projection. This is
slightly different to the principal population projection used by the OBR for
the UK.
2. Impact on productivity – we are forecasting slow growth in productivity, in
part due to UK-EU exit
3. Impact on trade – Using OBR assumptions, we forecast slower growth in
Scottish international trade
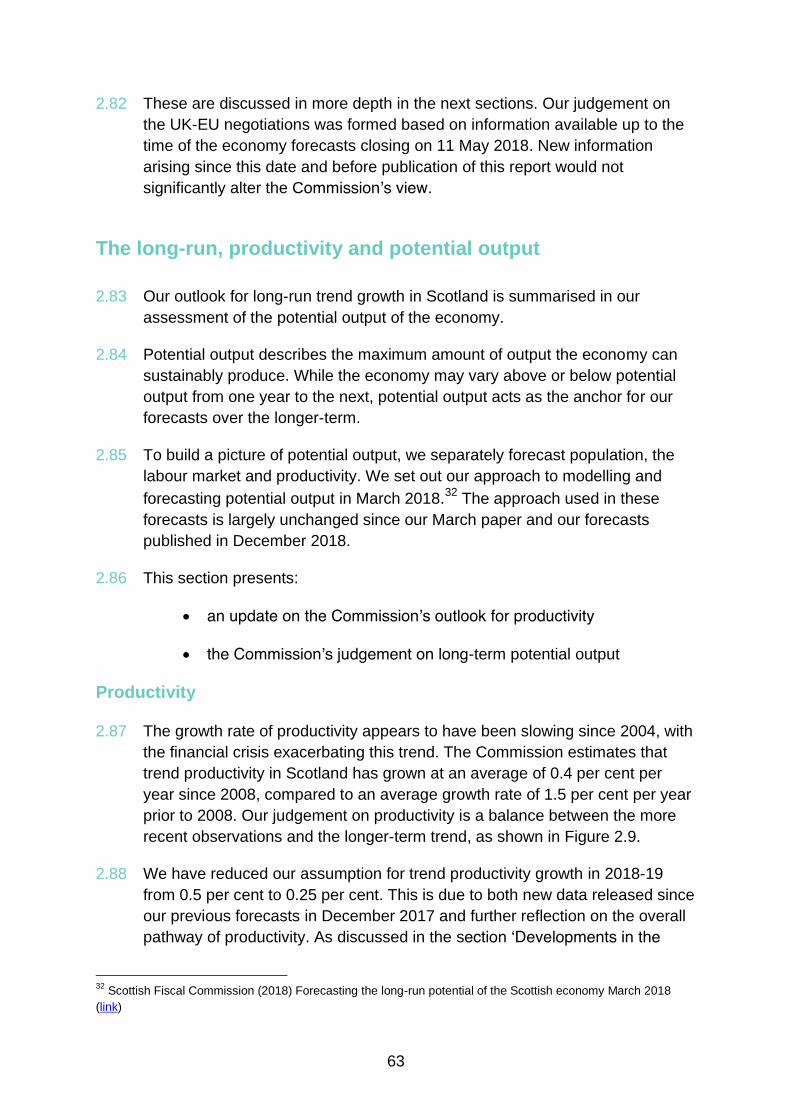
63
2.82 These are discussed in more depth in the next sections. Our judgement on
the UK-EU negotiations was formed based on information available up to the
time of the economy forecasts closing on 11 May 2018. New information
arising since this date and before publication of this report would not
significantly alter the Commission’s view.
The long-run, productivity and potential output
2.83 Our outlook for long-run trend growth in Scotland is summarised in our
assessment of the potential output of the economy.
2.84 Potential output describes the maximum amount of output the economy can
sustainably produce. While the economy may vary above or below potential
output from one year to the next, potential output acts as the anchor for our
forecasts over the longer-term.
2.85 To build a picture of potential output, we separately forecast population, the
labour market and productivity. We set out our approach to modelling and
forecasting potential output in March 2018.32
The approach used in these
forecasts is largely unchanged since our March paper and our forecasts
published in December 2018.
2.86 This section presents:
an update on the Commission’s outlook for productivity
the Commission’s judgement on long-term potential output
Productivity 2.87 The growth rate of productivity appears to have been slowing since 2004, with
the financial crisis exacerbating this trend. The Commission estimates that
trend productivity in Scotland has grown at an average of 0.4 per cent per
year since 2008, compared to an average growth rate of 1.5 per cent per year
prior to 2008. Our judgement on productivity is a balance between the more
recent observations and the longer-term trend, as shown in Figure 2.9.
2.88 We have reduced our assumption for trend productivity growth in 2018-19
from 0.5 per cent to 0.25 per cent. This is due to both new data released since
our previous forecasts in December 2017 and further reflection on the overall
pathway of productivity. As discussed in the section ‘Developments in the
32
Scottish Fiscal Commission (2018) Forecasting the long-run potential of the Scottish economy March 2018
(link)
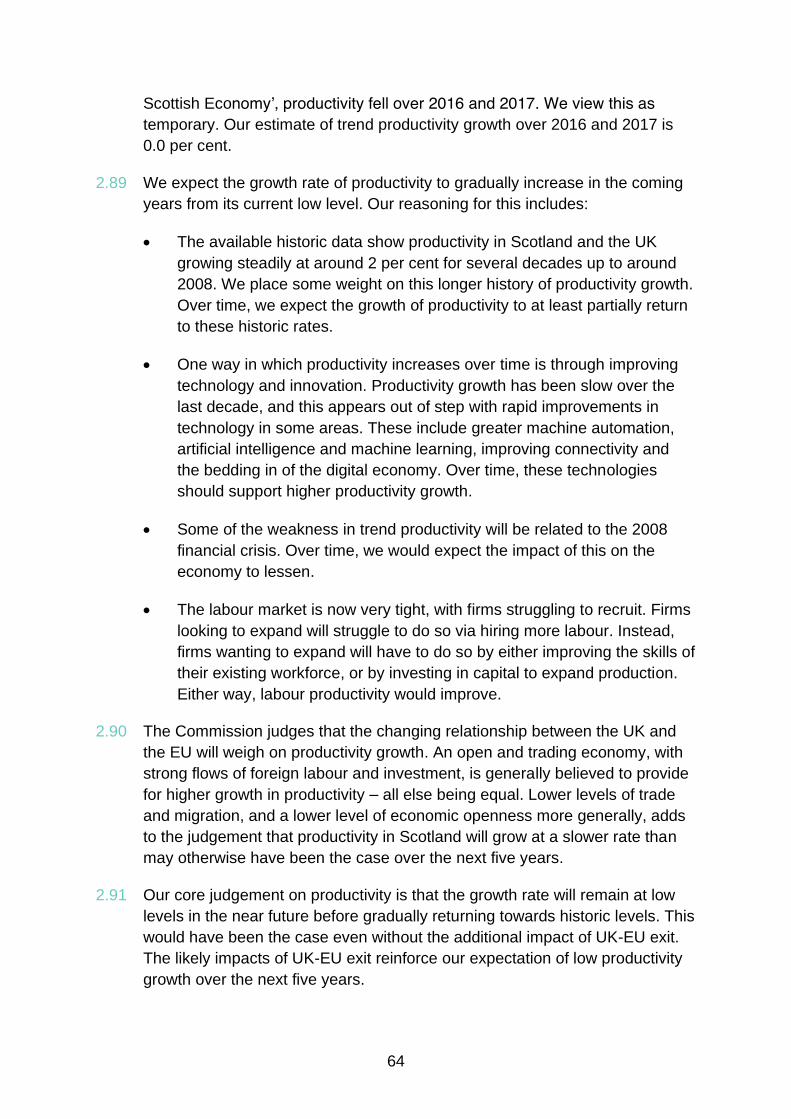
64
Scottish Economy’, productivity fell over 2016 and 2017. We view this as
temporary. Our estimate of trend productivity growth over 2016 and 2017 is
0.0 per cent.
2.89 We expect the growth rate of productivity to gradually increase in the coming
years from its current low level. Our reasoning for this includes:
The available historic data show productivity in Scotland and the UK
growing steadily at around 2 per cent for several decades up to around
2008. We place some weight on this longer history of productivity growth.
Over time, we expect the growth of productivity to at least partially return
to these historic rates.
One way in which productivity increases over time is through improving
technology and innovation. Productivity growth has been slow over the
last decade, and this appears out of step with rapid improvements in
technology in some areas. These include greater machine automation,
artificial intelligence and machine learning, improving connectivity and
the bedding in of the digital economy. Over time, these technologies
should support higher productivity growth.
Some of the weakness in trend productivity will be related to the 2008
financial crisis. Over time, we would expect the impact of this on the
economy to lessen.
The labour market is now very tight, with firms struggling to recruit. Firms
looking to expand will struggle to do so via hiring more labour. Instead,
firms wanting to expand will have to do so by either improving the skills of
their existing workforce, or by investing in capital to expand production.
Either way, labour productivity would improve.
2.90 The Commission judges that the changing relationship between the UK and
the EU will weigh on productivity growth. An open and trading economy, with
strong flows of foreign labour and investment, is generally believed to provide
for higher growth in productivity – all else being equal. Lower levels of trade
and migration, and a lower level of economic openness more generally, adds
to the judgement that productivity in Scotland will grow at a slower rate than
may otherwise have been the case over the next five years.
2.91 Our core judgement on productivity is that the growth rate will remain at low
levels in the near future before gradually returning towards historic levels. This
would have been the case even without the additional impact of UK-EU exit.
The likely impacts of UK-EU exit reinforce our expectation of low productivity
growth over the next five years.

65
2.92 Productivity growth has been slowing in Scotland since 2004, and the
Commission expects trend productivity growth to have slowed to zero over the
last two years. The factors leading to this period of exceptionally slow growth
are expected to continue to suppress productivity growth in the short term.
However, the Commission does expect productivity growth to start to
gradually recover from 2018-19 onwards.
2.93 From growth of 0.25 per cent in 2018-19, we assume trend productivity growth
reaches 1.1 per cent per year by the end of the forecast horizon. This is below
the pre-2008 average of 1.5 per cent per year. Growth in trend productivity is
a key uncertainty in our forecasts and we present sensitivity analysis in the
section ‘Forecast sensitivities’.
Figure 2.9: Historic productivity and forecast, constant prices (2014 = 100)
Source: Scottish Fiscal Commission
80
85
90
95
100
105
110
1998 2002 2006 2010 2014 2018 2022
Outturn SFC forecast
Post-2008 average growth
Pre-2008 average growth
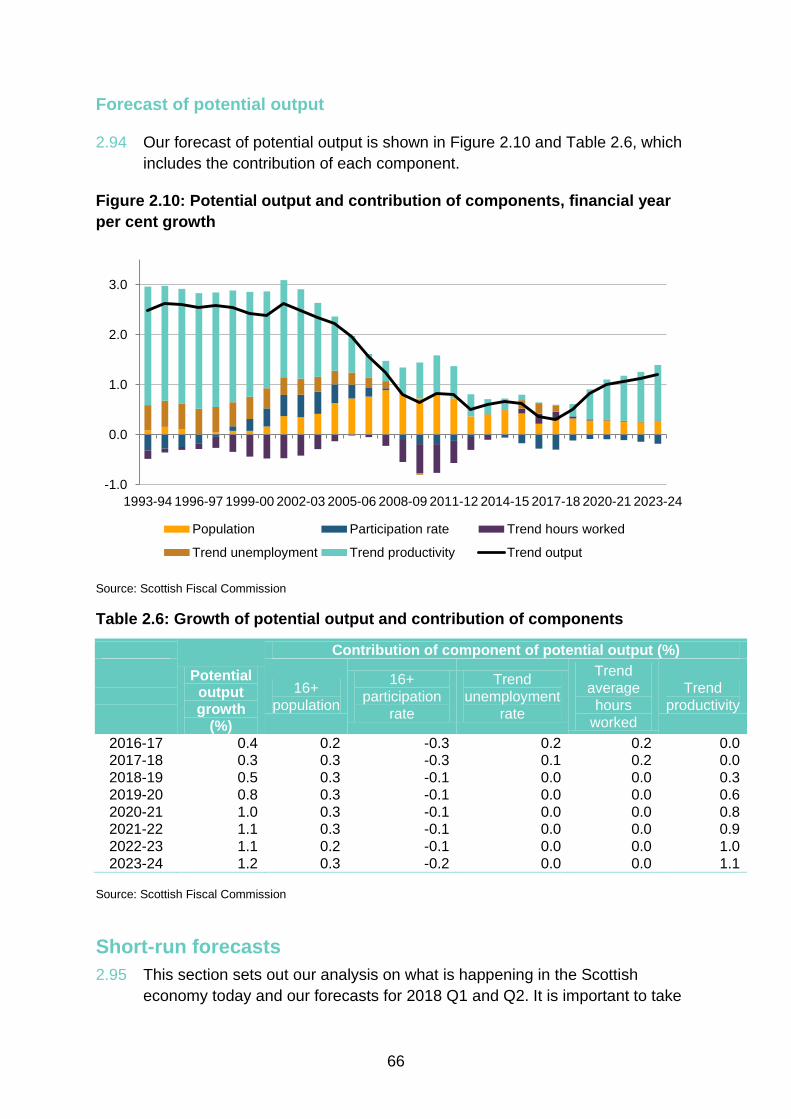
66
Forecast of potential output
2.94 Our forecast of potential output is shown in Figure 2.10 and Table 2.6, which
includes the contribution of each component.
Figure 2.10: Potential output and contribution of components, financial year
per cent growth
Source: Scottish Fiscal Commission
Table 2.6: Growth of potential output and contribution of components
Potential output growth
(%)
Contribution of component of potential output (%)
16+
population
16+
participation
rate
Trend
unemployment
rate
Trend
average
hours
worked
Trend
productivity
2016-17 0.4 0.2 -0.3 0.2 0.2 0.0
2017-18 0.3 0.3 -0.3 0.1 0.2 0.0
2018-19 0.5 0.3 -0.1 0.0 0.0 0.3
2019-20 0.8 0.3 -0.1 0.0 0.0 0.6
2020-21 1.0 0.3 -0.1 0.0 0.0 0.8
2021-22 1.1 0.3 -0.1 0.0 0.0 0.9
2022-23 1.1 0.2 -0.1 0.0 0.0 1.0
2023-24 1.2 0.3 -0.2 0.0 0.0 1.1
Source: Scottish Fiscal Commission
Short-run forecasts
2.95 This section sets out our analysis on what is happening in the Scottish
economy today and our forecasts for 2018 Q1 and Q2. It is important to take
-1.0
0.0
1.0
2.0
3.0
1993-94 1996-97 1999-00 2002-03 2005-06 2008-09 2011-12 2014-15 2017-18 2020-21 2023-24
Population Participation rate Trend hours worked
Trend unemployment Trend productivity Trend output

67
caution when analysing short-run economic performance as it is often
significantly influenced by one-off events in sectors that experience high short-
run volatility in output.
2.96 Recent data releases indicate that the economy continues to grow below
historic trends. Over the year, 2017 saw subdued economic performance with
GDP growth of 0.8 per cent - which compares to our estimate of 0.7 per cent
published in our last forecasts. This follows weak performance in 2016 when
the economy grew by 0.2 per cent. The major drag to economic growth in
2017 has been construction, which fell by 3.7 per cent compared to 2016.
2.97 On a quarterly basis, the economy picked up modestly in the final quarter of
the year, growing by 0.3 per cent in 2017 Q4 after registering 0.2 per cent
growth in 2017 Q3. The quarterly outturn data compares to our previous
forecasts of 0.1 per cent and 0.2 per cent for Q3 and Q4 respectively.
Following the performance in 2017, our expectations for Scottish economic
growth remain modest for 2018.
2.98 In spite of the subdued aggregate economic performance, the Scottish labour
market performed robustly in 2017 and going into 2018. However, on a
quarterly basis, it was slightly weaker in Q4 compared to Q3; the employment
rate fell by 0.3 percentage points in Q4 while the unemployment rate rose by
0.2 percentage points. Over the year, the employment rate in Scotland
averaged 74.7 per cent in 2017, compared to 73.7 per cent in 2016. The
unemployment rate remains very low averaging 4.2 per cent in 2017. The
increase in the employment rate has mainly been driven by a fall in economic
inactivity.
2.99 The headline CPI inflation rate in the UK increased rapidly over the last year.
Annual inflation averaged 2.7 per cent in 2017 compared to 0.7 per cent in
2016. In the last quarter of 2017 inflation peaked at 3 per cent. Depreciation of
Sterling was the primary cause of the rapid rise in inflation. The value of
Sterling seemed to stabilise in 2017 Q4 and the beginning of 2018. As a result
the impact on inflation of the depreciation will fade. Inflation has started to fall
at the beginning of 2018, with recent releases showing annual inflation of 2.5
per cent in the year to March 2018, the lowest in a year. The Commission’s
view is that inflation will continue to move towards the Bank of England’s
inflation target in 2018.
2.100 As discussed in the section ‘Developments in the Scottish Economy’ there
have been mixed signals on wage growth in 2017 from different data sources.
The Commission expects nominal wage growth to have been 1.0 per cent in
2017, weaker than the 3.0 per cent nominal wage growth in 2016. Despite
tightness in the labour market, nominal wage growth is expected to only
gradually increase in the coming year as real wages gradually rise.
68
2.101 While the fall in the value of Sterling has increased inflation, it has provided
some support to net trade in the last year. In 2017, Scotland saw stronger
growth in global exports compared to growth in global imports. This has been
supported by growth recorded in international export markets. While most of
Scotland’s trade is with the rest of the UK, and net trade has been on average
detracting from GDP growth since 2010, we expect net trade to make a
positive contribution to growth in 2018-19 on the back of the Sterling
depreciation and global export market growth.
2.102 Looking at 2018, severe weather in early March will affect economic data for
2018 Q1. Heavy snowfall meant travel was severely restricted, affecting
operations of a large number of businesses and organisations. Sectors such
as construction and retail would have been particularly hard hit. Offsetting
some of the negative impacts, a large number of people worked from home,
and some lost spending and activity will have been shifted to later in the
quarter or into the next quarter. Despite a slight pick-up in growth towards the
end of 2017, we forecast quarter on quarter growth of 0.1 per cent for 2018
Q1, with the growth rate picking up in later quarters.
2.103 The impact of the severe weather events aside, unofficial Scottish economic
indicators showed a mixed but slightly more positive picture of business
sentiment at the beginning of 2018 when compared to 2017, particularly in the
services sector. The Bank of Scotland headline Purchasing Managers Index
(PMI) indicates a marginal increase in the first three months of 2018. After a
slight contraction in February, it indicated that output began to grow again in
March, driven largely by expansion in the service sector. The Scottish
Chambers of Commerce (SCC) Quarterly Economic Indicator survey for 2018
Q1 reported strong business investment growth over the quarter and
increased optimism across most sectors, with a positive outlook for sales,
investment and job creation. However, the survey warned that construction
activity will remain fragile and recruitment difficulties will persist. In 2018 Q1
the retail sales index for Scotland showed that both retail sales volumes and
sales values grew by 0.5 per cent.
2.104 Surveys of the production industries were less positive than for the service
industries. The latest CBI Industrial Trends Survey of Scottish manufacturing
firms signalled contraction in output, total new orders and employment in the
first quarter of 2018. The Scottish Engineering Quarterly Review signalled
increasing optimism in the Engineering and Manufacturing sector, with
domestic and overseas orders, output and staffing levels all increasing in
2018 Q1.
2.105 For households in 2018 Q1, the Scottish Consumer Sentiment Indicator was
on a negative balance of -1.8. The indicator rose by 2.4 points compared to

69
the previous quarter, implying weak but improving sentiment among
households.
2.106 Table 2.7 presents the Commission’s short-run quarterly economic forecasts.
Overall, including our short-run forecasts, we estimate GDP growth to be 0.8
per cent in 2018-19.
Table 2.7: Quarter on quarter growth rates, outturn and forecast, (%)
Quarter GDP Employment Nominal wages
2017 Q1 0.6 0.1 0.4
2017 Q2 0.1 1.3 0.5
2017 Q3 0.2 0.2 -0.0
2017 Q4 0.3 -0.3 0.4
2018 Q1 0.1 0.1 0.4
2018 Q2 0.2 0.0 0.5
Source: Scottish Fiscal Commission, Scottish Government (2018) Quarterly National Accounts Scotland Quarter
4 2017 (link), ONS (2018) Labour Force Survey April 2018 (link)
Note: Shaded cells are outturn
The medium-term outlook and the output gap
2.107 This section presents further detail on forecasts of:
The current output gap
The labour market
Wages, earnings and household incomes
GDP and the components of expenditure
Pathway of the output gap over the forecast horizon
The current output gap
2.108 Potential output is the maximum amount of goods and services the economy
can sustainably produce given sufficient demand. We estimate potential
output directly by considering trends in the population, the labour market and
productivity.
2.109 The difference between the Commission’s estimates of potential and actual
output determines the output gap in the economy. Our forecasts assume that
the output gap will narrow over the forecast horizon, broadly returning actual
GDP to its estimated long-run trend.

70
2.110 As highlighted in our December 2017 forecast, the low unemployment rate,
the low savings ratio, the temporary boom in the construction industry and
slow productivity growth are all factors supporting our view that the economy
is operating above capacity. Our modelling of recent trends, which we call our
production function approach, suggests a positive output gap in 2017-18 of
0.7 per cent. This is a slight upward revision from 0.4 per cent in our previous
forecast, and reflects weaker-than-expected trend productivity and lower
potential output in 2017-18.
2.111 We compare this implied output gap against market intelligence and the
surveys of spare capacity in the economy. At present, surveys of businesses
in Scotland suggest they are operating above capacity. We aggregate the
results of these surveys together as an alternative indicator of the output gap
in Scotland. We refer to this as the cyclical indicators approach. Both of our
approaches to estimating the output gap in Scotland suggest a positive output
gap today as shown in Figure 2.11.
Figure 2.11: Scottish output gap comparison, % of trend GDP
Source: Scottish Fiscal Commission
2.112 While the production function provides our primary estimate of the output gap,
analysis of cyclical indicators gives us additional confidence in our judgement.
Figure 2.12 shows actual output and our estimates of potential output.
-5
-4
-3
-2
-1
0
1
2
3
1996 1998 2000 2002 2004 2006 2008 2010 2012 2014 2016 2018
Production function Cyclical indicators
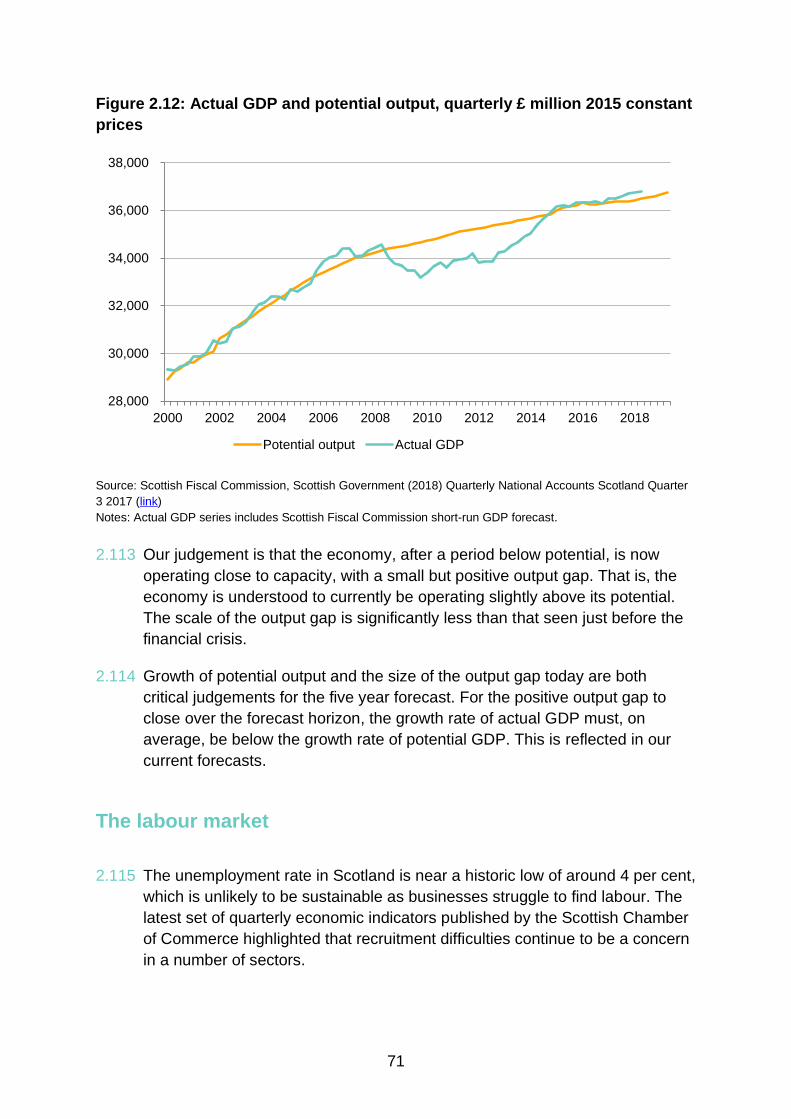
71
Figure 2.12: Actual GDP and potential output, quarterly £ million 2015 constant
prices
Source: Scottish Fiscal Commission, Scottish Government (2018) Quarterly National Accounts Scotland Quarter
3 2017 (link)
Notes: Actual GDP series includes Scottish Fiscal Commission short-run GDP forecast.
2.113 Our judgement is that the economy, after a period below potential, is now
operating close to capacity, with a small but positive output gap. That is, the
economy is understood to currently be operating slightly above its potential.
The scale of the output gap is significantly less than that seen just before the
financial crisis.
2.114 Growth of potential output and the size of the output gap today are both
critical judgements for the five year forecast. For the positive output gap to
close over the forecast horizon, the growth rate of actual GDP must, on
average, be below the growth rate of potential GDP. This is reflected in our
current forecasts.
The labour market
2.115 The unemployment rate in Scotland is near a historic low of around 4 per cent,
which is unlikely to be sustainable as businesses struggle to find labour. The
latest set of quarterly economic indicators published by the Scottish Chamber
of Commerce highlighted that recruitment difficulties continue to be a concern
in a number of sectors.
28,000
30,000
32,000
34,000
36,000
38,000
2000 2002 2004 2006 2008 2010 2012 2014 2016 2018
Potential output Actual GDP
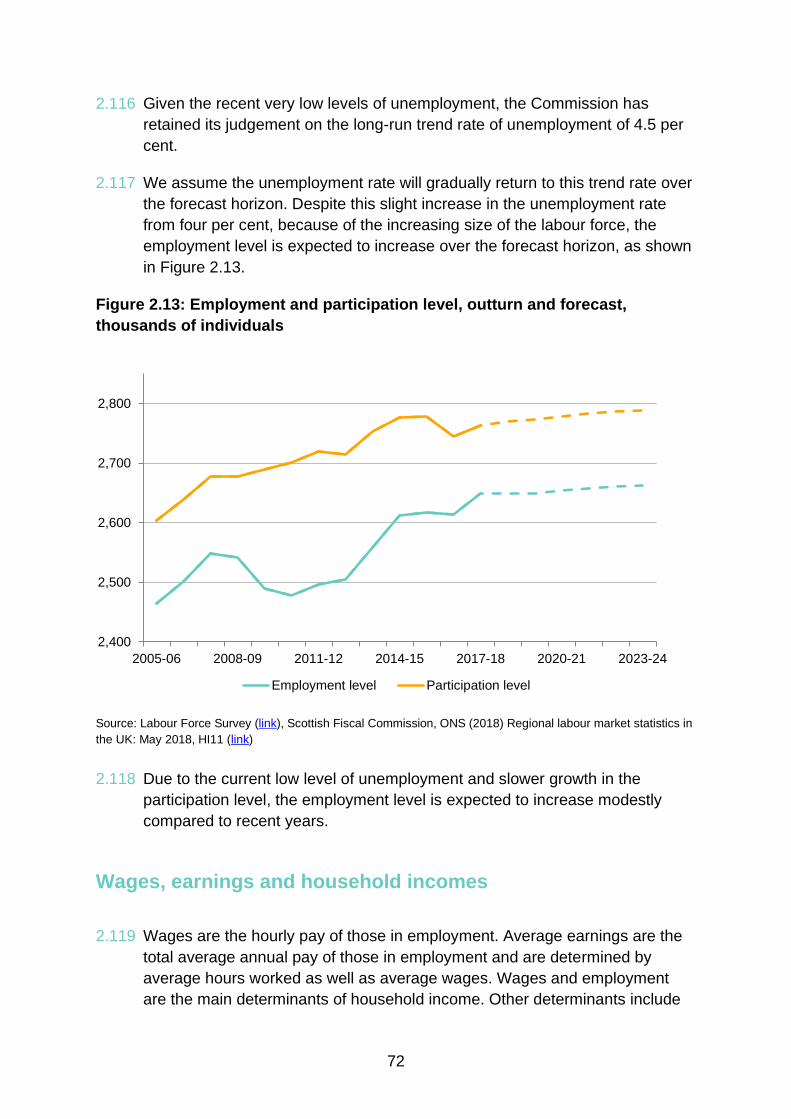
72
2.116 Given the recent very low levels of unemployment, the Commission has
retained its judgement on the long-run trend rate of unemployment of 4.5 per
cent.
2.117 We assume the unemployment rate will gradually return to this trend rate over
the forecast horizon. Despite this slight increase in the unemployment rate
from four per cent, because of the increasing size of the labour force, the
employment level is expected to increase over the forecast horizon, as shown
in Figure 2.13.
Figure 2.13: Employment and participation level, outturn and forecast,
thousands of individuals
Source: Labour Force Survey (link), Scottish Fiscal Commission, ONS (2018) Regional labour market statistics in
the UK: May 2018, HI11 (link)
2.118 Due to the current low level of unemployment and slower growth in the
participation level, the employment level is expected to increase modestly
compared to recent years.
Wages, earnings and household incomes
2.119 Wages are the hourly pay of those in employment. Average earnings are the
total average annual pay of those in employment and are determined by
average hours worked as well as average wages. Wages and employment
are the main determinants of household income. Other determinants include
2,400
2,500
2,600
2,700
2,800
2005-06 2008-09 2011-12 2014-15 2017-18 2020-21 2023-24
Employment level Participation level

73
taxes, other sources of income such as income from wealth and from social
security.
2.120 Real wage growth has been weak since 2010, with negative real wage growth
in most years. The section ‘Developments in the Scottish Economy’ set out
our view on the outlook for real wage growth in Scotland. Slow wage growth is
explained in part by slow growth in productivity. However, wage growth has
been slower still than might be expected given growth in productivity, and has
also failed to increase in recent years despite tightening labour market
conditions.
2.121 The section ‘Developments in the Scottish Economy’ sets out a number of
reasons why we expect real wage growth to start to increase over the forecast
horizon, including growth in productivity and on-going labour market tightness.
We expect real wage growth to remain negative in 2018-19 at -0.5 per cent,
gradually increasing to 1.2 per cent by 2023-24. This is stronger real wage
growth than in recent years, but still below typical levels of historic real wage
growth of around two per cent. This is shown in Figure 2.14.
Figure 2.14: Forecast real wages and productivity, annual growth (%)
Source: Scottish Fiscal Commission
2.122 With inflation broadly flat at around two per cent, we expect nominal wage
growth to pick up from 1.7 per cent in 2018-19 to 3.2 per cent in 2023-24.
2.123 Average hours worked in Scotland have been falling for some time, though
this trend is expected to flatten out over the forecast horizon. Changes in
-1.0
0.0
1.0
2017-18 2018-19 2019-20 2020-21 2021-22 2022-23 2023-24
Real wages Trend productivity

74
average hours worked are not expected to have a significant impact on total
household earnings.
2.124 Real disposable household income (RDHI) takes into account income from
employment, from other sources such as dividends and the impact of changes
in direct household taxes and social security transfers including pensions.
Limited growth in real wages and employment means limited growth in
average RDHI, shown in Figure 2.15
Figure 2.15: Real disposable household income, Scotland and OBR UK
forecasts, total and per capita, financial year growth (%)
Source: Scottish Fiscal Commission, OBR (2018) Economic and Fiscal Outlook March 2018 (link), Scottish Government (2018)
Quarterly National Accounts Scotland Quarter 3 2017 (link)
2.125 In line with the OBR, we forecast limited growth in RDHI per capita driven by
slow growth in real wages. Because of slower population growth in Scotland,
growth in total RDHI is only slightly above growth in RDHI per capita. Growth
of RDHI is the main determinant of aggregate consumption.
GDP and the components of expenditure
2.126 The Commission forecasts consumption, investment, government spending
and net trade separately. These sum to create a pathway for GDP.
-1
0
1
2
2017-18 2018-19 2019-20 2020-21 2021-22 2022-23 2023-24
Scotland - total Scotland - per capita UK - total UK - per capita
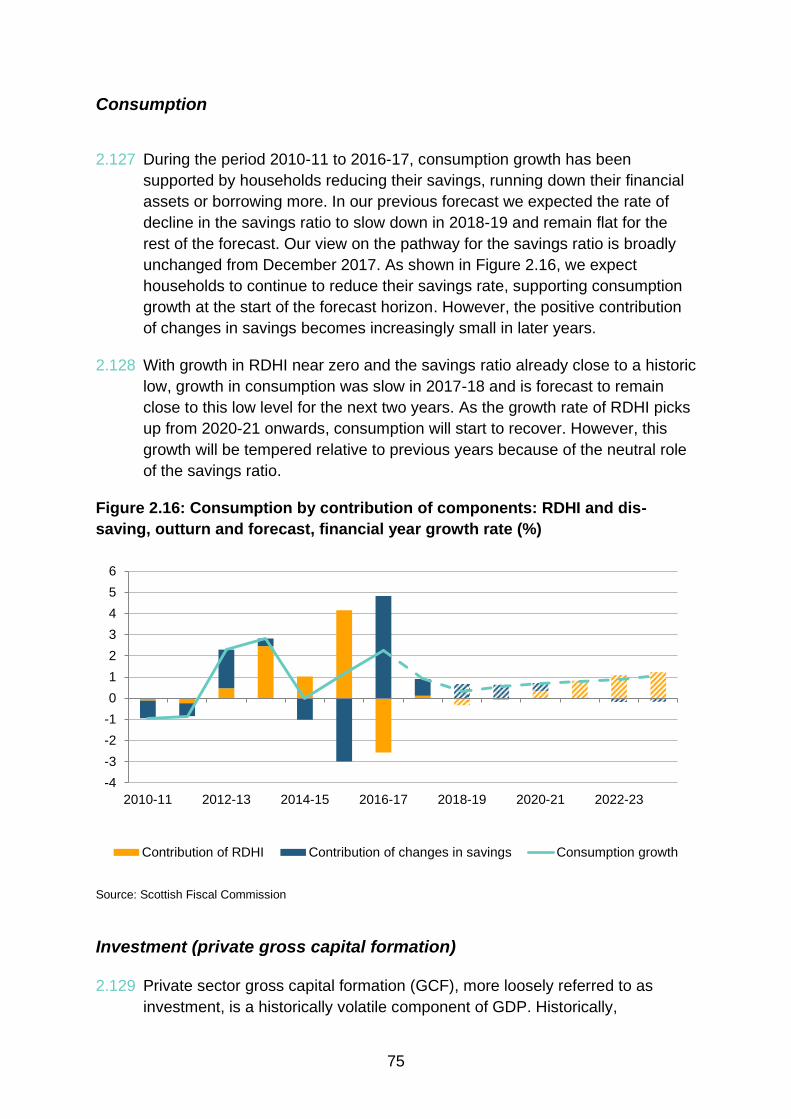
75
Consumption
2.127 During the period 2010-11 to 2016-17, consumption growth has been
supported by households reducing their savings, running down their financial
assets or borrowing more. In our previous forecast we expected the rate of
decline in the savings ratio to slow down in 2018-19 and remain flat for the
rest of the forecast. Our view on the pathway for the savings ratio is broadly
unchanged from December 2017. As shown in Figure 2.16, we expect
households to continue to reduce their savings rate, supporting consumption
growth at the start of the forecast horizon. However, the positive contribution
of changes in savings becomes increasingly small in later years.
2.128 With growth in RDHI near zero and the savings ratio already close to a historic
low, growth in consumption was slow in 2017-18 and is forecast to remain
close to this low level for the next two years. As the growth rate of RDHI picks
up from 2020-21 onwards, consumption will start to recover. However, this
growth will be tempered relative to previous years because of the neutral role
of the savings ratio.
Figure 2.16: Consumption by contribution of components: RDHI and dis-
saving, outturn and forecast, financial year growth rate (%)
Source: Scottish Fiscal Commission
Investment (private gross capital formation) 2.129 Private sector gross capital formation (GCF), more loosely referred to as
investment, is a historically volatile component of GDP. Historically,
-4
-3
-2
-1
0
1
2
3
4
5
6
2010-11 2012-13 2014-15 2016-17 2018-19 2020-21 2022-23
Contribution of RDHI Contribution of changes in savings Consumption growth

76
investment is a small component of GDP growth, contributing on average 0.2
percentage points to annual GDP growth.
2.130 Investment has been weak in Scotland in recent years, largely falling since
2015. After recent contractions we expect a small bounce-back effect in 2018-
19, with investment making a small but positive contribution to GDP growth in
this period.
2.131 For the five-year forecast horizon, on-going economic uncertainty, driven by
weakness in the UKCS and UK-EU exit, is likely to limit investment growth in
Scotland. In the later years of the forecast, investment is therefore expected to
flatten at the level achieved in 2018-19, neither contributing to or detracting
from GDP growth from 2019-20 onwards.
Government 2.132 The public sector, including consumption and investment spending, accounts
for over a quarter of the economy. Government spending is driven less by the
economic cycle, and more by UK Government and Scottish Government
policy decisions. The Commission models UK and Scottish Government
spending plans to estimate the impact on GDP. The impact of changes in
direct household taxes and social security policy is captured through its
impact on RDHI, as discussed in the previous section.
2.133 For UK Government and local authority spending in Scotland, we use the
latest OBR forecasts from March 2018.
2.134 For Scottish Government spending, the Commission asked the Scottish
Government for its five-year spending plans as would be outlined in the
Medium-Term Financial Strategy (MTFS). The baseline set of spending
projections provided by the Scottish Government, covering the period up to
2022-23, are shown in Table 2.8.
2.135 Table 2.8 also illustrates the Commission’s forecasts of general Government
consumption expenditure and general Government capital investment in
current prices. This combines the spending projections provided by the
Scottish Government with the Commission’s forecasts of UK Government and
local authority spending in Scotland.33
The constant-price forecasts of public
sector output, also reported in Table 2.8, are obtained using the OBR’s
assumption that, for any given forecast of nominal government consumption
or investment growth, around half will be reflected in real growth and half in
the implicit deflator.
33
General Government includes all levels of government spending in Scotland, that is, local authority, Scottish
Government and UK Government spending.

77
2.136 The MTFS capital spending figures include the support of capital borrowing
available under the provisions of the Scotland Act 2016. The Scottish
Government has confirmed capital borrowing and repayment plans up to
2019-20. Decisions on how much to borrow beyond this point will be taken in
future budgets. The Scottish Government borrowed the annual maximum in
2017-18 and plans to do the same in 2018-19 and 2019-20. This will result in
a projected debt stock of £1.87 billion by the end of 2019-20 which is 62 per
cent of the total statutory limit of £3 billion.
2.137 For our economy forecasts beyond 2019-20, we have assumed the Scottish
Government continues to use the maximum possible capital borrowing, in line
with its current behaviour. We also assume that annual borrowing repayments
continue to be evenly split across the current agreed repayment period of 25
years. We therefore expect that the Scottish Government will continue to
borrow the annual limit of £450 million in every year up to 2022-23, taking the
assumed repayment schedule into account, and to borrow the remaining
available amount of £144 million in 2023-24 to reach the £3 billion aggregate
cap. The reduction in capital borrowing in 2023-24 has contributed to a slightly
lower GDP growth rate forecast than would otherwise be the case.

78
Table 2.8: Scottish Government’s MTFS public sector spending plans and SFC forecasts
(£million)
2016-17
2017-18
2018-19
2019-20
2020-21
2021-22
2022-23
2023-24
MTFS18 SG
resource spending
excl. Social Security
(current prices)
26,159 26,750 27,570 27,622 27,861 28,604 29,222 29,741
SFC General Govt
Consumption
(current prices)
34,559 34,983 35,955 36,297 36,722 37,751 38,572 39,257
SFC General Govt
Consumption
(constant prices)
37,998 37,466 37,641 37,930 38,229 38,648 39,078 39,449
MTFS18 SG
capital spending
incl. borrowing
(current prices)
3,224 3,616 3,863 4,376 4,545 4,536 4,676 4,515
SFC General Govt
Investment
(current prices)
5,886 6,137 6,121 6,885 7,205 7,230 7,454 7,378
SFC General Govt
Investment
(constant prices)
9,905 10,801 10,806 11,106 11,419 11,566 11,636 11,654
Source: Scottish Government (2018) Medium Term Financial Strategy, Scottish Fiscal Commission, Scottish
Government (2018) Quarterly National Accounts Scotland Quarter 3 2017 (link)
Notes: We provided several iterations of our forecast to the Scottish Government during their process of preparing
the MTFS. In line with the protocol on economy moving measures, our final economy forecasts were prepared
using Scottish Government MTFS spending figures received before 4 May based on our penultimate economy
forecast. The MTFS projections in this table are as published by the Scottish Government in the MTFS document
based on our final economy forecasts provided to the Scottish Government on 11 May. Therefore, there is a slight
discrepancy between the Scottish Government spending projections in our final economy forecasts, based on our
penultimate economy forecasts, and those published in the MTFS document and included in this table. The
differences will have a negligible impact on the outlook for the economy, tax revenues and public spending.
Figures in italics indicate the Commission’s projections of MTFS plans into 2023-24. Resource spending in 2023-
24 is grown in line with the latest available OBR forecasts of UK Government spending which extend to 2022-23.
Capital spending in 2023-24 is based on its previous year growth rate. We also assume capital borrowing of £450
million from 2020-21, down to £144 million in 2023-24.
With regards to General Government Investment, the figure for 2016-17 in current prices is taken from the
Scottish Government’s 2017 Q3 QNAS publication. The 2016-17 figure in constant prices which provides the
starting point for our level forecasts is taken directly from our core forecasting model, therefore the constant-price
forecasts in this table can differ from deflated nominal values.

79
Net trade 2.138 Historically, trade has had a net negative impact on Scottish GDP growth, with
growth in imports exceeding growth in exports. Net trade is made up of trade
with the rest of the UK as well as international trade. Trade with the rest of the
UK is by far the largest component. These two components are considered
separately.
2.139 The changing UK-EU relationship is likely to have an impact on Scottish
international trade. The Commission uses the OBR’s forecasts of UK
international trade, reflecting the OBR’s Brexit assumptions, as a starting point
for modelling Scottish international trade. Changing trade agreements,
possibly leading to the UK and Scotland being more closed to trade, will have
a negative impact on both gross exports and gross imports, reducing the total
volume of trade, but with an ambiguous impact on net trade. In addition, an
on-going lower Sterling level is likely to support exports and limit import
growth, while weakness in household spending power will limit import growth.
In aggregate, Scotland’s net international trade is expected to be broadly
neutral for GDP growth over the forecast horizon.
2.140 Scotland has long had a negative trade balance with the rest of the UK and
this gap has been widening rapidly in recent years, with a negative effect on
growth in GDP. Households in Scotland are expected to have slower growth
in incomes than their counterparts in the rest of the UK over the next five
years. The likely effect will be to slow the growth of the negative trade balance
with the rest of the UK. We therefore forecast net trade with the rest of the UK
to flatten out over the next five years.
2.141 Overall, Scottish net trade is expected to play a minor role in GDP over the
forecast.
GDP
2.142 Figure 2.17 shows the contribution of each of these components to growth in
GDP.
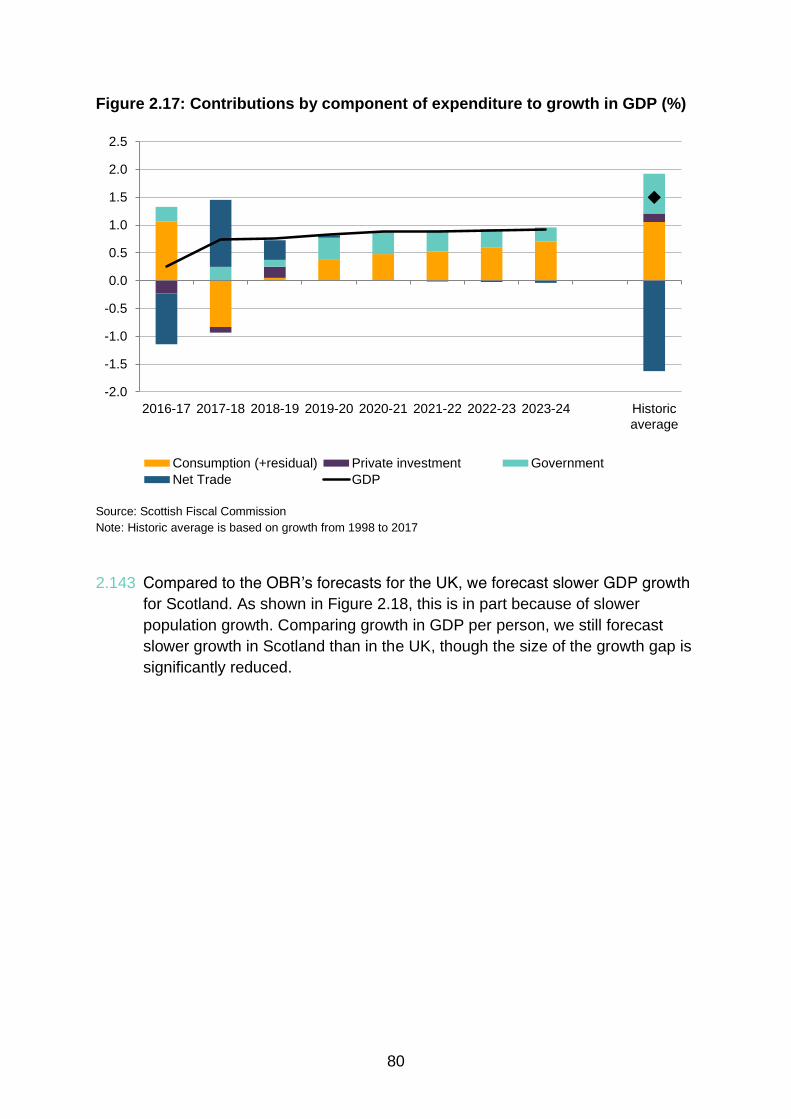
80
Figure 2.17: Contributions by component of expenditure to growth in GDP (%)
Source: Scottish Fiscal Commission
Note: Historic average is based on growth from 1998 to 2017
2.143 Compared to the OBR’s forecasts for the UK, we forecast slower GDP growth
for Scotland. As shown in Figure 2.18, this is in part because of slower
population growth. Comparing growth in GDP per person, we still forecast
slower growth in Scotland than in the UK, though the size of the growth gap is
significantly reduced.
-2.0
-1.5
-1.0
-0.5
0.0
0.5
1.0
1.5
2.0
2.5
2016-17 2017-18 2018-19 2019-20 2020-21 2021-22 2022-23 2023-24 Historic
average
Consumption (+residual) Private investment Government
Net Trade GDP
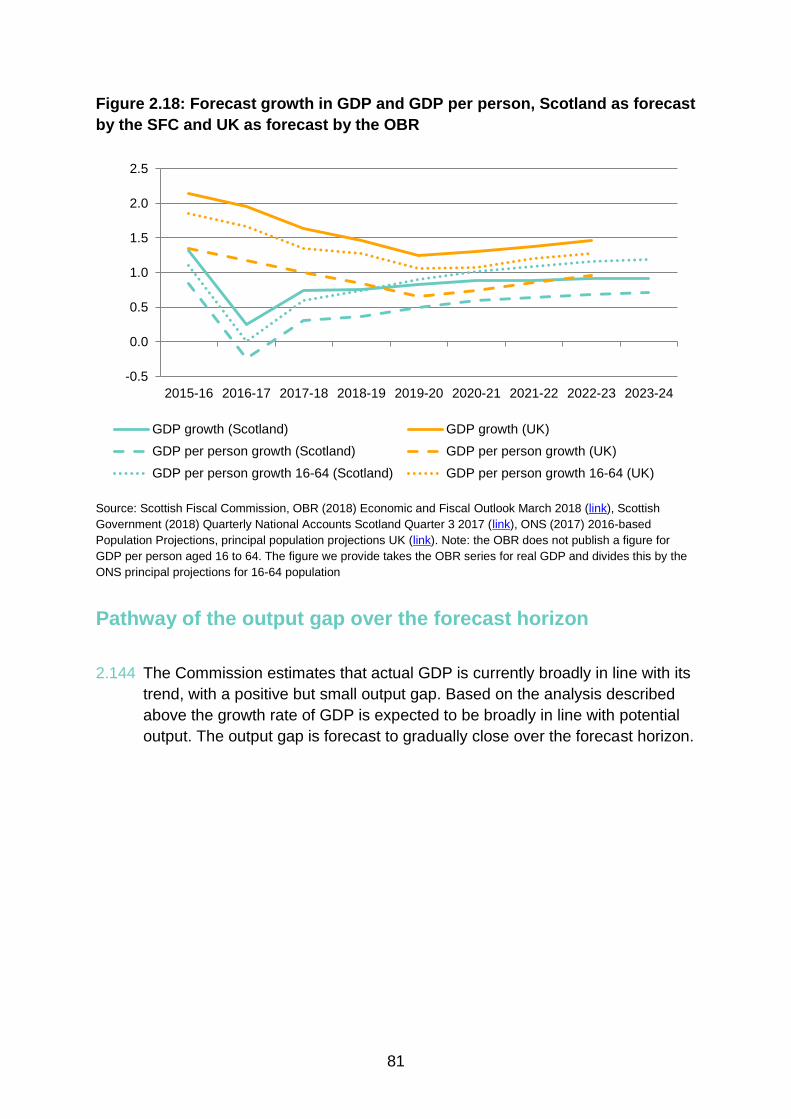
81
Figure 2.18: Forecast growth in GDP and GDP per person, Scotland as forecast
by the SFC and UK as forecast by the OBR
Source: Scottish Fiscal Commission, OBR (2018) Economic and Fiscal Outlook March 2018 (link), Scottish
Government (2018) Quarterly National Accounts Scotland Quarter 3 2017 (link), ONS (2017) 2016-based
Population Projections, principal population projections UK (link). Note: the OBR does not publish a figure for
GDP per person aged 16 to 64. The figure we provide takes the OBR series for real GDP and divides this by the
ONS principal projections for 16-64 population
Pathway of the output gap over the forecast horizon
2.144 The Commission estimates that actual GDP is currently broadly in line with its
trend, with a positive but small output gap. Based on the analysis described
above the growth rate of GDP is expected to be broadly in line with potential
output. The output gap is forecast to gradually close over the forecast horizon.
-0.5
0.0
0.5
1.0
1.5
2.0
2.5
2015-16 2016-17 2017-18 2018-19 2019-20 2020-21 2021-22 2022-23 2023-24
GDP growth (Scotland) GDP growth (UK)
GDP per person growth (Scotland) GDP per person growth (UK)
GDP per person growth 16-64 (Scotland) GDP per person growth 16-64 (UK)

82
Figure 2.19: Potential output and actual GDP, outturn and forecast, financial
year, £ million, 2015 constant prices
Source: Scottish Fiscal Commission
Second round effects
2.145 Second round effects take account of recently announced changes in Scottish
or UK Government policy that are judged to be of sufficient magnitude to
affect the economy forecasts. Second round effects primarily capture any
feedback from a change in policy on the economic determinants underlying
the tax forecasts.
2.146 The impact of fiscal policies on the macroeconomy are hard to judge, often
have long time-scales before impacts are fully realised and will only have a
secondary indirect impact on tax revenues. Therefore, the Commission will
only include such effects where we judge them to have a significant impact on
tax revenues.
2.147 In this publication we have provided costings for two new policy changes
announced by the Scottish Government. There has been a change to the
policy for uprating the Carer’s Allowance Supplement in line with inflation and
the New Start relief has been removed for Non-Domestic Rates. Please refer
to Annex A for further information on these policy costings.
2.148 In aggregate, these policies will affect the aggregate fiscal position of the
Government by less than £10 million per year. These policies are not
considered to be of sufficient magnitude to include as second round effects in
the economy forecast.
125,000
130,000
135,000
140,000
145,000
150,000
155,000
160,000
2005-06 2008-09 2011-12 2014-15 2017-18 2020-21 2023-24
Actual GDP Potential output

83
2.149 There were a number of policies announced at Budget 2018-19, particularly
on income tax and public sector pay. At the time, the Commission did not
include second round effects of these policies. The Commission judged that
the policies were not of sufficient magnitude to have a significant impact on
the outlook for the economy. These policies are now part of our baseline
economy forecast, and so there is no specific economy forecast adjustment to
account for them.
Forecast sensitivities
2.150 The Commission is required to present a single set of forecasts for the
economy, but in reality these represent a central point within a broad range of
possible outcomes. The forecasts are primarily based on assuming recent
underlying trends continue, with adjustments where evidence or judgement
dictates. It is likely that in some instances the underlying trends the
Commission has identified will change in unexpected ways in the coming
years and the outcome for the economy will be different.
2.151 We make a number of judgements about the likely future pathway of the
economy. We run additional analysis around our key judgements to illustrate
the sensitivity of the forecast to them. This sensitivity analysis does not align
with the scenarios presented in the Scottish Government’s MTFS. This
section presents the sensitivity of GDP, employment and average earnings to
variants of four key judgements: migration, trend unemployment, average
hours and productivity.
2.152 The Commission uses the 50 per cent EU migration population projection as
its population forecast. The impact of higher migration is illustrated using the
ONS principal projection and similarly the impact of lower migration is
illustrated using their low migration variant.
2.153 Trend unemployment is another uncertainty in the forecast and has a
significant impact on the long-run employment level. The variants considered
are for a trend unemployment rate of 4.0 per cent in a low scenario and 5.0
per cent in a high scenario.
2.154 Average hours worked are expected to stay flat over the forecast. The high
average hours variant assumes average hours will approximately return to
pre-crisis average hours. This represents an increase of 0.4 hours worked to
31.9 weekly hours by 2023-24. The Commission considers a symmetric fall of
0.4 hours by the end of the forecast horizon for the low hours variant.
2.155 In the forecast, the growth rate of productivity is assumed to gradually
increase from its current growth rate of around 0.25 per cent per year to reach

84
growth of 1.0 per cent per year by 2022-23. In the low productivity variant
presented here, the growth rate of productivity is assumed to grow from 0.25
per cent per year in 2018-19, remaining at the post-2008 average of 0.4 per
cent per year since this point onward. In the high productivity growth variant,
the growth rate of productivity is assumed to be close to 1.5 per cent per year
in every year of the forecast, in line with average growth rates seen prior to
2008.
2.156 The impact of these variants on GDP, employment, and average earnings are
shown in Table 2.9 and Figures 2.20 to 2.22. The impact on income tax
revenues of these variants is shown in Chapter 3.
Table 2.9: Economic forecast variants, average growth rates of GDP,
employment and average earnings from 2018-19 to 2023-24 (%)
Central
forecast
average
Sensitivity Low variant High variant
GDP
0.9 Migration 0.7 0.9
Unemployment 0.8 1.0
Average hours 0.7 1.1
Productivity 0.4 1.5
Employment
0.1 Migration -0.1 0.2
Unemployment 0.0 0.2
Average hours 0.1 0.1
Productivity 0.1 0.1
Average earnings
2.5 Migration 2.5 2.5
Unemployment 2.5 2.5
Average hours 2.3 2.7
Productivity 2.1 3.1
Source: Scottish Fiscal Commission calculations
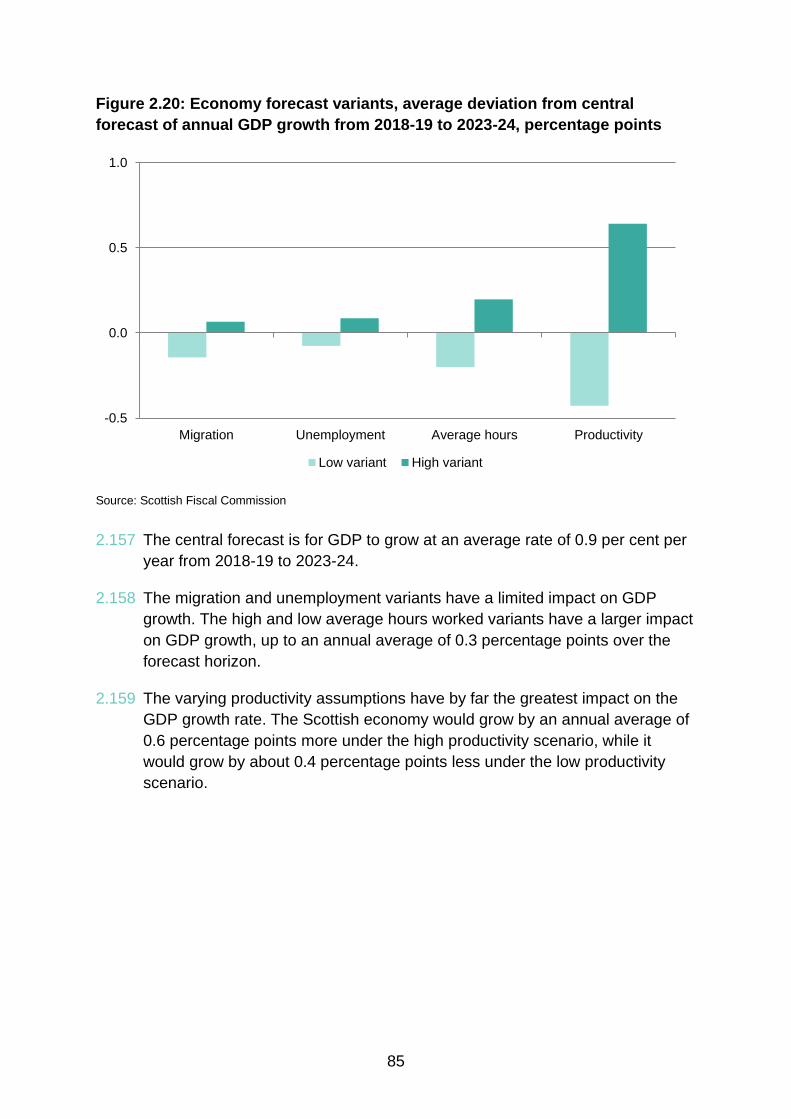
85
Figure 2.20: Economy forecast variants, average deviation from central
forecast of annual GDP growth from 2018-19 to 2023-24, percentage points
Source: Scottish Fiscal Commission
2.157 The central forecast is for GDP to grow at an average rate of 0.9 per cent per
year from 2018-19 to 2023-24.
2.158 The migration and unemployment variants have a limited impact on GDP
growth. The high and low average hours worked variants have a larger impact
on GDP growth, up to an annual average of 0.3 percentage points over the
forecast horizon.
2.159 The varying productivity assumptions have by far the greatest impact on the
GDP growth rate. The Scottish economy would grow by an annual average of
0.6 percentage points more under the high productivity scenario, while it
would grow by about 0.4 percentage points less under the low productivity
scenario.
-0.5
0.0
0.5
1.0
Migration Unemployment Average hours Productivity
Low variant High variant

86
Figure 2.21: Economy forecast variants, deviation from central forecast of
average employment growth from 2018-19 to 2023-24, (%)
Source: Scottish Fiscal Commission
2.160 The central forecast for average annual growth in employment is 0.1 per cent.
The employment level growth is affected by our migration and unemployment
variants, with productivity and average hours having no direct impact in our
model.34
2.161 The impact of migration and unemployment variants on employment is the
same as the impact on GDP growth. The impact of migration and
unemployment on GDP comes directly from their impact on employment level
growth.
34
This is unrealistic as a higher level of productivity is likely to increase wages and draw more individuals into the
labour market. Such secondary effects are not captured in these simple sensitivities; the variants only illustrate
the direct impacts on trend growth of the variants. Such considerations do not alter the broad message of the
forecast sensitivities.
-0.2
-0.1
0.0
0.1
Migration Unemployment Average hours Productivity
Low variant High variant

87
Figure 2.22: Economic forecast variants, average deviation from central
forecast of average nominal earnings growth from 2018-19 to 2023-24, (%)
Source: Scottish Fiscal Commission
2.162 The central forecast for average annual growth in nominal earnings is 2.5 per
cent over the forecast horizon.
2.163 Contrary to employment level growth, productivity and average hours variants
have a significant impact on average nominal earnings growth. The migration
and unemployment variants have no direct impact on the growth rate of
average nominal earnings.
2.164 The impact of average hours and productivity variants on average nominal
earnings is similar to their impact on GDP growth.
Comparison to previous forecasts
2.165 This is the second set of economy forecasts published by the Commission.
Our previous forecasts were published in December 2017 to inform the
Scottish Government’s Draft Budget 2018-19.35
Table 2.10 compares key
variables from the December 2017 economy forecasts and our latest
forecasts.
35
Scottish Fiscal Commission (2017) Scotland’s Economic and Fiscal Forecasts December 2017 (link)
-0.5
0.0
0.5
1.0
Migration Unemployment Average hours Productivity
Low variant High variant

88
Table 2.10: Comparison of SFC May 2018 economy forecasts with SFC
December 2017 economy forecasts, financial year, figures are % growth rates
unless otherwise stated
2017-18 2018-19 2019-20 2020-21 2021-22 2022-23 2023-24
GDP SFC Dec 17 0.7 0.8 0.9 0.6 1.0 1.2
SFC May 18 0.7 0.8 0.8 0.9 0.9 0.9 0.9
Employment
(‘000s)
SFC Dec 17 2,655 2,658 2,658 2,661 2,666 2,670
SFC May 18 2,649 2,650 2,650 2,654 2,658 2,661 2,663
Unemployment SFC Dec 17 3.9 4.2 4.4 4.5 4.5 4.5
SFC May 18 4.1 4.3 4.5 4.5 4.5 4.5 4.5
Nominal wages SFC Dec 17 2.0 2.3 2.4 2.6 2.9 3.2
SFC May 18 1.0 1.7 1.9 2.3 2.7 3.0 3.2
Inflation SFC Dec 17 2.4 2.1 1.9 2.0 2.0 2.0
SFC May 18 2.0 2.2 1.9 2.0 2.0 2.0 2.0
Real wages SFC Dec 17 -0.4 0.2 0.5 0.6 0.9 1.2
SFC May 18 -0.9 -0.5 0.1 0.3 0.7 0.9 1.2
Hours SFC Dec 17 -0.2 0.0 0.0 0.0 0.0 0.0
SFC May 18 -0.2 0.1 0.0 0.0 0.0 0.0 0.0
Average annual
earnings
SFC Dec 17 1.8 2.3 2.4 2.6 2.9 3.2
SFC May 18 0.8 1.8 2.0 2.3 2.7 3.0 3.3
Source: Scottish Fiscal Commission and Scottish Fiscal Commission (2017) Scotland’s Economic and Fiscal
Forecasts December 2017 (link)
Note: Shaded cells represent outturn as was available at the time of publication
2.166 Figure 2.23 compares GDP growth rates from the two forecasts.
Figure 2.23: Forecast comparison, GDP financial year growth rate (%)
Source: Scottish Fiscal Commission and Scottish Fiscal Commission (2017) Scotland’s Economic and Fiscal
Forecasts December 2017 (link)
0.0
0.2
0.4
0.6
0.8
1.0
1.2
1.4
2016-17 2017-18 2018-19 2019-20 2020-21 2021-22 2022-23 2023-24
SFC Dec 2017 SFC May 2018

89
2.167 The latest forecasts by the Commission show a flatter profile for GDP growth
than in the previous forecasts, reflecting a smoother pathway for the output
gap as this closes over the forecast horizon.
2.168 Growth in employment and average earnings are the most important
economic determinants in forecasting income tax. Figure 2.24 shows
comparisons of employment levels from the two forecasts.
Figure 2.24: Forecast comparison, employment level financial years
(thousands)
Source: Scottish Fiscal Commission and Scottish Fiscal Commission (2017) Scotland’s Economic and Fiscal
Forecasts December 2017 (link)
2.169 We forecast the employment level to grow at a similar rate to our previous
forecasts, though starting from a slightly lower base because of the latest
outturn data.
2.170 Figure 2.25 compares forecasts of average nominal earnings.
2,600
2,620
2,640
2,660
2,680
2016-17 2017-18 2018-19 2019-20 2020-21 2021-22 2022-23 2023-24
SFC Dec 2017 SFC May 2018

90
Figure 2.25: Forecast comparison, average nominal earnings, financial year
growth rate (%)
Source: Scottish Fiscal Commission and Scottish Fiscal Commission (2017) Scotland’s Economic and Fiscal
Forecasts December 2017 (link)
2.171 The Commission has revised down growth in average nominal earnings over
the forecast period to reflect our view on the outlook for nominal and real
wage growth as described in the Section ‘Developments in the Scottish
Economy’. This has led to a weaker forecast of income tax revenues. The
impact of these changes on the fiscal forecasts are set out in Chapter 3.
Comparison to OBR UK forecasts
2.172 This section compares our economic forecasts for Scotland with the OBR’s
forecasts for the UK.
2.173 We are forecasting a weaker economic outlook for Scotland compared to the
OBR’s forecast for the UK. This is primarily because of slower growth in
population and productivity than the UK.
2.174 Table 2.11 summarises the forecasts for Scotland and the UK by the
Commission and the OBR for five of the main economic determinants: GDP
growth, GDP per capita growth, employment level, real hourly wage growth
and nominal annual average earnings growth.
0.0
1.0
2.0
3.0
4.0
2016-17 2017-18 2018-19 2019-20 2020-21 2021-22 2022-23 2023-24
SFC Dec 2017 SFC May 2018
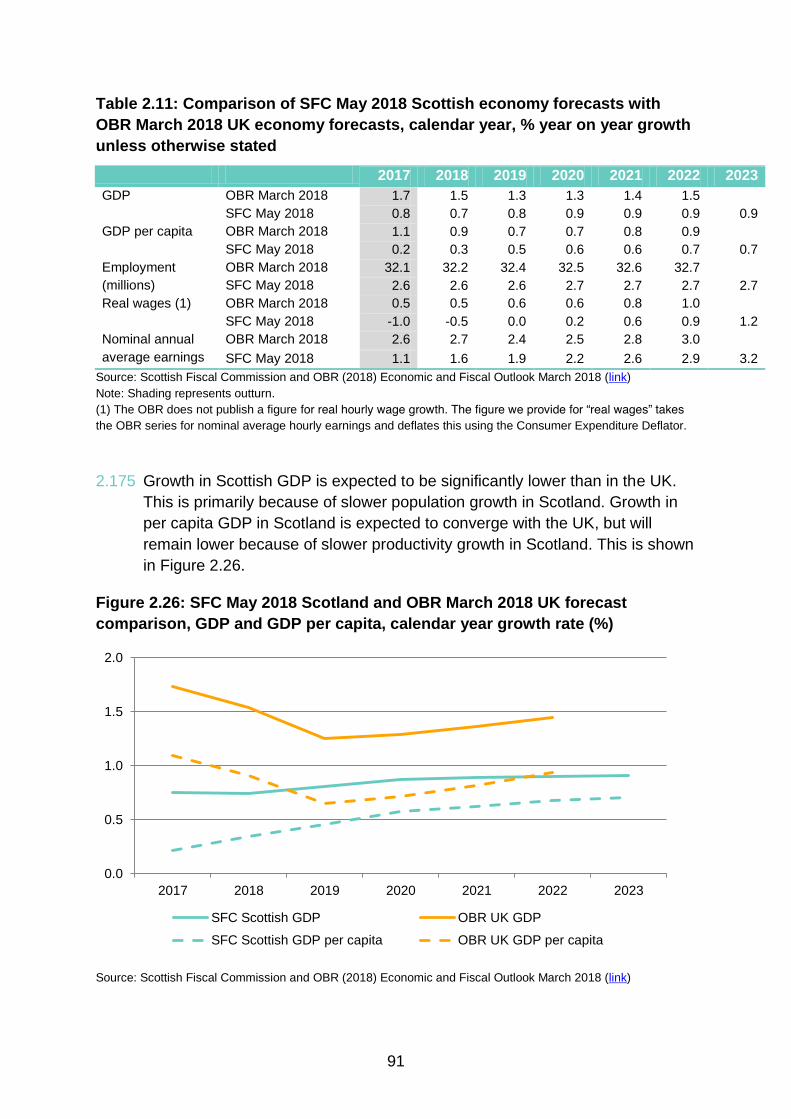
91
Table 2.11: Comparison of SFC May 2018 Scottish economy forecasts with
OBR March 2018 UK economy forecasts, calendar year, % year on year growth
unless otherwise stated
2017 2018 2019 2020 2021 2022 2023
GDP OBR March 2018 1.7 1.5 1.3 1.3 1.4 1.5
SFC May 2018 0.8 0.7 0.8 0.9 0.9 0.9 0.9
GDP per capita OBR March 2018 1.1 0.9 0.7 0.7 0.8 0.9
SFC May 2018 0.2 0.3 0.5 0.6 0.6 0.7 0.7
Employment
(millions)
OBR March 2018 32.1 32.2 32.4 32.5 32.6 32.7
SFC May 2018 2.6 2.6 2.6 2.7 2.7 2.7 2.7
Real wages (1) OBR March 2018 0.5 0.5 0.6 0.6 0.8 1.0
SFC May 2018 -1.0 -0.5 0.0 0.2 0.6 0.9 1.2
Nominal annual
average earnings
OBR March 2018 2.6 2.7 2.4 2.5 2.8 3.0
SFC May 2018 1.1 1.6 1.9 2.2 2.6 2.9 3.2
Source: Scottish Fiscal Commission and OBR (2018) Economic and Fiscal Outlook March 2018 (link)
Note: Shading represents outturn.
(1) The OBR does not publish a figure for real hourly wage growth. The figure we provide for “real wages” takes
the OBR series for nominal average hourly earnings and deflates this using the Consumer Expenditure Deflator.
2.175 Growth in Scottish GDP is expected to be significantly lower than in the UK.
This is primarily because of slower population growth in Scotland. Growth in
per capita GDP in Scotland is expected to converge with the UK, but will
remain lower because of slower productivity growth in Scotland. This is shown
in Figure 2.26.
Figure 2.26: SFC May 2018 Scotland and OBR March 2018 UK forecast
comparison, GDP and GDP per capita, calendar year growth rate (%)
Source: Scottish Fiscal Commission and OBR (2018) Economic and Fiscal Outlook March 2018 (link)
0.0
0.5
1.0
1.5
2.0
2017 2018 2019 2020 2021 2022 2023
SFC Scottish GDP OBR UK GDP
SFC Scottish GDP per capita OBR UK GDP per capita

92
2.176 As shown in Figure 2.27, the Commission forecasts employment growth in
Scotland below the OBR’s forecast for the UK. Again, this is mainly because
population is forecast to grow faster in the UK.
Figure 2.27: SFC May 2018 Scotland and OBR March 2018 UK forecast
comparison, employment level, calendar year growth rate (%)
Source: Scottish Fiscal Commission and OBR (2018) Economic and Fiscal Outlook March 2018 (link)
2.177 Real wage growth in Scotland was negative in 2017, reflecting weak growth in
productivity and nominal wages. It is expected to turn positive in 2019 and to
grow in a similar manner as in the UK for the rest of the forecast period. This
is shown in Figure 2.28.
-0.5
0.0
0.5
1.0
1.5
2017 2018 2019 2020 2021 2022 2023
SFC Scotland OBR UK
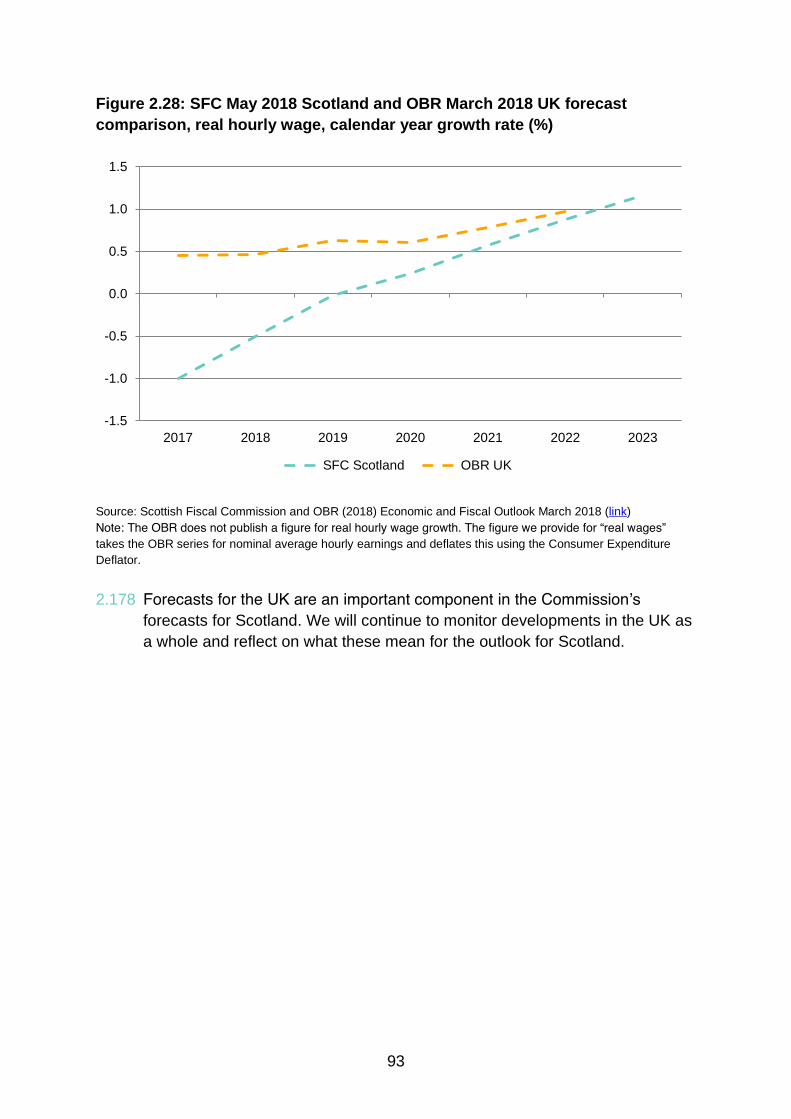
93
Figure 2.28: SFC May 2018 Scotland and OBR March 2018 UK forecast
comparison, real hourly wage, calendar year growth rate (%)
Source: Scottish Fiscal Commission and OBR (2018) Economic and Fiscal Outlook March 2018 (link)
Note: The OBR does not publish a figure for real hourly wage growth. The figure we provide for “real wages”
takes the OBR series for nominal average hourly earnings and deflates this using the Consumer Expenditure
Deflator.
2.178 Forecasts for the UK are an important component in the Commission’s
forecasts for Scotland. We will continue to monitor developments in the UK as
a whole and reflect on what these mean for the outlook for Scotland.
-1.5
-1.0
-0.5
0.0
0.5
1.0
1.5
2017 2018 2019 2020 2021 2022 2023
SFC Scotland OBR UK

94

95
Chapter 3
Tax
Introduction
3.1 This chapter presents the Scottish Fiscal Commission’s tax forecasts. A
summary of the forecasts is shown in Table 3.1 below. The sections in this
chapter will explain the methods used to produce the forecasts, any
differences from earlier forecasts, the impacts of new policy measures, and
comparisons to OBR forecasts. The Income Tax, Land and Buildings
Transaction tax and Scottish Landfill Tax sections include a comparison
between our forecasts of receipts and the Scottish Government’s block grant
adjustment forecasts.
Table 3.1: Summary of tax forecasts
£ million 2016-17 2017-18 2018-19 2019-20 2020-21 2021-22 2022-23 2023-24
Outturn*
Income Tax 11,267 11,467 11,969 12,345 12,805 13,335 13,936 14,547
Non-Domestic Rates 2,731 2,774 2,788 2,859 2,931 3,110 3,307 3,339
Land & Buildings Transaction
Tax 484 550 614 656 697 738 781 827
of which, Residential 214 259 312 342 373 405 438 473
ADS 93 91 97 100 104 108 112 116
Non-Residential 177 201 206 214 220 226 231 238
Air Passenger Duty 257 277 285 292 301 311 322 335
Scottish Landfill Tax 148 142 114 93 95 87 87 88
Total Tax 14,887 15,209 15,770 16,244 16,829 17,581 18,432 19,137
Source: Scottish Fiscal Commission. *Figure for Income Tax is not outturn data, as liabilities data in 2016-17 are not yet
available. Figure for Air Passenger Duty is not classed as outturn data. It is an estimate of the Scottish share of tax
receipts. Figures may not sum to totals because of rounding

96
3.2 Table 3.2 summarises all changes since our previous forecasts.
Table 3.2: Change from previous tax forecasts 2016-17 to 2022-23
£ million 2016-17 2017-18 2018-19 2019-20 2020-21 2021-22 2022-23
Income Tax 53 -118 -209 -302 -347 -398 -437
Non-Domestic Rates 0 -36 -24 -8 -8 -8 -23
Land & Buildings Transaction
Tax 0 -6 26 28 29 31 33
of which, Residential 0 -12 7 6 7 9 12
ADS 0 -2 4 2 2 2 2
Non-Residential 0 7 15 20 20 19 19
Air Passenger Duty -7 -15 -21 -22 -23 -25 -26
Scottish Landfill Tax 0 5 8 4 5 5 5
Total change in tax forecasts 45 -170 -220 -300 -344 -395 -449
Source: Scottish Fiscal Commission. Figures may not sum to totals because of rounding
Box 3.1: OBR forecasts of devolved taxes
Box 1.2 explains the operation of the Fiscal Framework, and the respective roles of
the Scottish Fiscal Commission and the OBR. The OBR also produces forecasts of
receipts from devolved taxes, not because this is a requirement of the Fiscal
Framework but rather because their role as the UK-level fiscal forecaster requires
them to produce forecasts of all revenue streams raised in the UK, whether they
are set and administered by the UK Government, devolved administrations, or local
government.
All forecasts of devolved taxes are set out in detail in their Devolved Tax and
Spending publication, which is produced alongside each UK fiscal event. The OBR
published a forecast of Carer’s Allowance expenditure in Scotland in their March
2018 publication. As further social security benefits are devolved to the Scottish
Parliament the OBR may expand their work into other social security expenditures.
In each tax section, differences to the OBR forecasts are discussed and explained.
Such differences may be because of modelling approaches, timing, data used or
differences in judgements made. As set out in Box 1.2, the OBR revenue forecasts
of devolved taxes are not used as part of the block grant adjustment calculations.
These are based on the OBR forecasts of UK Government receipts of
corresponding UK taxes.36
36
Please see Box 3.2 of our December 2017 forecast publication for an explanation of how the BGA works for
Income Tax (link)

97
Income Tax
Forecast
Table 3.3: Non-Savings Non-Dividends income tax outturn and forecast
£ million 2015-16 2016-17 2017-18 2018-19 2019-20 2020-21 2021-22 2022-23 2023-24
Outturn*
10,948 11,267 11,467 11,969 12,345 12,805 13,335 13,936 14,547
Source: Scottish Fiscal Commission *Outturn in this context for income tax refers to our analysis of the 2015-16
Survey of Personal Incomes (SPI) data.
Background
3.3 The Scotland Act 2016 transferred new tax powers to the Scottish Parliament.
From 2017-18, the Scottish Parliament took full responsibility for non-savings
and non-dividend (NSND) income tax rates and thresholds, with the exception
of the personal allowance.37 Since April 2017, the Scottish Government
receives all revenue from income tax on the NSND income of Scottish
taxpayers.
3.4 The responsibility for defining the income tax base, including setting or
changing income tax reliefs and the personal allowance continues to rest with
the UK Government. HMRC remains responsible for the collection and
management of Scottish income tax. It is HMRC’s responsibility to decide who
is a Scottish taxpayer as defined in legislation. The Scotland Act 2012 defines
a Scottish taxpayer as someone who is a UK taxpayer and has their main
place of residence in Scotland.38
3.5 The Scottish Government has implemented policy changes to income tax for
both the 2017-18 and 2018-19 tax years. For 2017-18, most rates and bands
were set at the same level as the UK. The only difference was the higher rate
threshold, which was unchanged in cash terms from 2016-17 at £43,000. In
2018-19, a new five band income tax policy was introduced. We updated our
income tax forecast in February 2018 to reflect the final agreed policy, and
published the figures in a supplementary publication.39 The final policy is set
out in Table 3.4 below.
37
This is primarily income from employment, pensions and property.
38 Scotland Act 2012, Section 25, 80D (link)
39 Scottish Fiscal Commission (2018) Scotland’s Economic and Fiscal Forecasts Supplementary Publication
Updated Income Tax Forecasts (link)
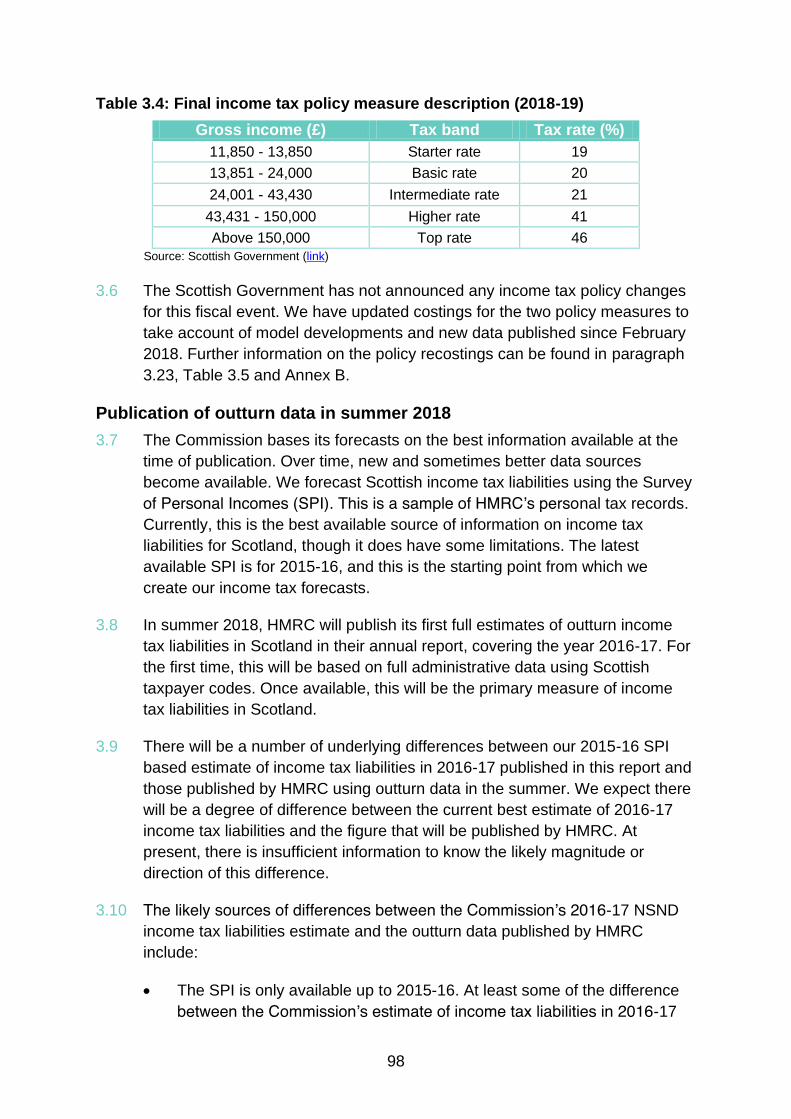
98
Table 3.4: Final income tax policy measure description (2018-19)
Gross income (£) Tax band Tax rate (%)
11,850 - 13,850 Starter rate 19
13,851 - 24,000 Basic rate 20
24,001 - 43,430 Intermediate rate 21
43,431 - 150,000 Higher rate 41
Above 150,000 Top rate 46
Source: Scottish Government (link)
3.6 The Scottish Government has not announced any income tax policy changes
for this fiscal event. We have updated costings for the two policy measures to
take account of model developments and new data published since February
2018. Further information on the policy recostings can be found in paragraph
3.23, Table 3.5 and Annex B.
Publication of outturn data in summer 2018
3.7 The Commission bases its forecasts on the best information available at the
time of publication. Over time, new and sometimes better data sources
become available. We forecast Scottish income tax liabilities using the Survey
of Personal Incomes (SPI). This is a sample of HMRC’s personal tax records.
Currently, this is the best available source of information on income tax
liabilities for Scotland, though it does have some limitations. The latest
available SPI is for 2015-16, and this is the starting point from which we
create our income tax forecasts.
3.8 In summer 2018, HMRC will publish its first full estimates of outturn income
tax liabilities in Scotland in their annual report, covering the year 2016-17. For
the first time, this will be based on full administrative data using Scottish
taxpayer codes. Once available, this will be the primary measure of income
tax liabilities in Scotland.
3.9 There will be a number of underlying differences between our 2015-16 SPI
based estimate of income tax liabilities in 2016-17 published in this report and
those published by HMRC using outturn data in the summer. We expect there
will be a degree of difference between the current best estimate of 2016-17
income tax liabilities and the figure that will be published by HMRC. At
present, there is insufficient information to know the likely magnitude or
direction of this difference.
3.10 The likely sources of differences between the Commission’s 2016-17 NSND
income tax liabilities estimate and the outturn data published by HMRC
include:
The SPI is only available up to 2015-16. At least some of the difference
between the Commission’s estimate of income tax liabilities in 2016-17
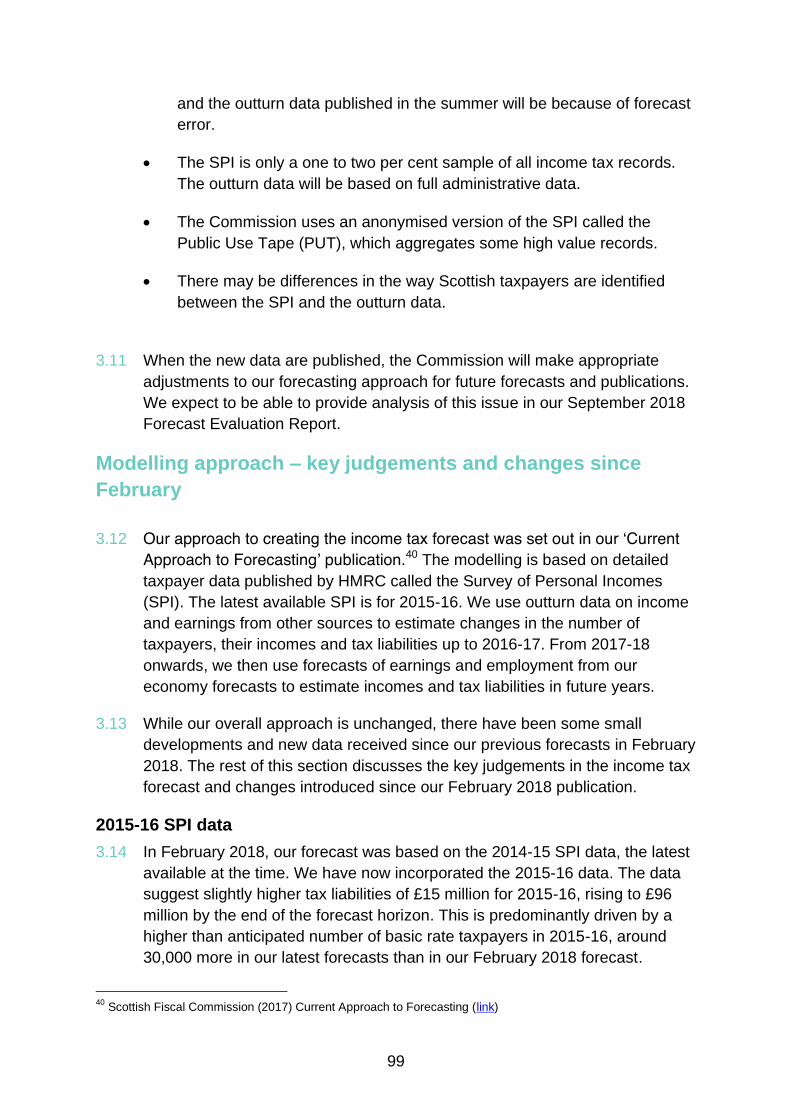
99
and the outturn data published in the summer will be because of forecast
error.
The SPI is only a one to two per cent sample of all income tax records.
The outturn data will be based on full administrative data.
The Commission uses an anonymised version of the SPI called the
Public Use Tape (PUT), which aggregates some high value records.
There may be differences in the way Scottish taxpayers are identified
between the SPI and the outturn data.
3.11 When the new data are published, the Commission will make appropriate
adjustments to our forecasting approach for future forecasts and publications.
We expect to be able to provide analysis of this issue in our September 2018
Forecast Evaluation Report.
Modelling approach – key judgements and changes since
February
3.12 Our approach to creating the income tax forecast was set out in our ‘Current
Approach to Forecasting’ publication.40 The modelling is based on detailed
taxpayer data published by HMRC called the Survey of Personal Incomes
(SPI). The latest available SPI is for 2015-16. We use outturn data on income
and earnings from other sources to estimate changes in the number of
taxpayers, their incomes and tax liabilities up to 2016-17. From 2017-18
onwards, we then use forecasts of earnings and employment from our
economy forecasts to estimate incomes and tax liabilities in future years.
3.13 While our overall approach is unchanged, there have been some small
developments and new data received since our previous forecasts in February
2018. The rest of this section discusses the key judgements in the income tax
forecast and changes introduced since our February 2018 publication.
2015-16 SPI data
3.14 In February 2018, our forecast was based on the 2014-15 SPI data, the latest
available at the time. We have now incorporated the 2015-16 data. The data
suggest slightly higher tax liabilities of £15 million for 2015-16, rising to £96
million by the end of the forecast horizon. This is predominantly driven by a
higher than anticipated number of basic rate taxpayers in 2015-16, around
30,000 more in our latest forecasts than in our February 2018 forecast.
40
Scottish Fiscal Commission (2017) Current Approach to Forecasting (link)

100
Latest employment and earnings outturn data
3.15 As we are using base SPI data from 2015-16, our modelling uses outturn
employment and earnings data covering 2016-17. The most significant
change to this has been the inclusion of the latest Annual Population Survey
(APS) employment data for 2016-17. This resulted in a small upward revision
to the number of taxpayers which is persistent across the forecast horizon –
increasing the forecast of tax liabilities by £30 million in 2015-16 and by £92
million in 2022-23.
Economy forecast
3.16 The income tax forecasts published in February 2018 were based on our
economy forecasts published in December 2017. The income tax forecasts
have been updated to include the latest economy forecasts detailed in
Chapter 2 of this report.
Tax Motivated Incorporations (TMI)
3.17 Throughout the UK there has been a steady rise in the proportion of people
working for themselves, rather than as employees. Individuals who choose to
work for themselves may be self-employed or have the option to incorporate
and manage their business as directors of a limited company. For individuals
who choose to incorporate, this changes their tax liabilities from NSND
income tax to corporation tax and dividends income tax.
3.18 We received updated TMI modelling outputs from HMRC to estimate the
reduction in tax liabilities across the forecast horizon. This adjustment is
calculated and applied to our baseline forecast – excluding the impact of
recent policy changes. The modelling from HMRC is based on the latest OBR
economy determinants which means changes are expected following UK
fiscal events. We have a separate approach for estimating additional TMI as a
result of a change in policy.41 This is consistent with our approach in
December 2017.
3.19 Further information on TMI can be found in the OBR’s 2017 Fiscal Risks
report, and in our December 2017 publication. 42,43
UK tax policies
3.20 We undertake additional modelling for certain policy measures introduced by
the UK Government which will affect Scottish NSND income tax liabilities. One
example is the pension flexibility measure announced by the UK Government
41
Scottish Fiscal Commission (2018) How we forecast behavioural responses to income tax policy (link)
42 OBR (2017) Fiscal Risks Report (link)
43 Scottish Fiscal Commission (2017) Scotland’s Economic and Fiscal Forecasts December 2017 (link)

101
at the Spring Budget 2014. Using the OBR’s policy measure database, our
approach calculates the relevant adjustments needed to the Scottish NSND
income tax forecast to account for previous UK Government policy measures
that have affected income tax revenues since 2015-16, the latest year of our
base SPI data.44
Public sector pay
3.21 The Scottish Government announced basic pay awards for 2018-19 that were
above previous years and higher than our previous baseline expectations for
growth in public sector pay. This included a three per cent basic pay award for
those in scope earning less than £36,500 per year, a limit of up to two per
cent on the increase in baseline paybill for those earning above £36,500 and
below £80,000 and a limit on the maximum pay increase for those earning
£80,000 or more to £1,600. The Commission set out its approach to capturing
the impact of these higher basic pay awards in its December and February
publications.
3.22 The Scottish Government confirmed to the Commission on 8 May 2018 that it
did not anticipate making any further changes to public sector pay policy at
this time.45
We have therefore left our assumptions about future public sector
pay awards unchanged since February. The December 2018 Scottish Budget
will set out the Public Sector Pay Policy for 2019-20.
Recosting previous policies
3.23 We have previously published estimates of the additional revenue raised from
the two recent changes in income tax policy in Scotland – the 2017-18 higher
rate threshold freeze, and the new 2018-19 five band income tax. Our policy
costings include both the ‘static costing’ (the amount of revenue raised
assuming no taxpayer behavioural change) and the ‘post-behavioural costing’
(the final revenue raised including the effects of taxpayer behaviour).
3.24 We provide updated costings with this report. There have been small changes
in our policy costings as a result of other changes, such as inclusion of the
latest economic forecast and moving to the latest 2015-16 SPI data.
3.25 In March 2018, we published an occasional paper ‘How we forecast
behavioural responses to income tax policy’ which provides more detail on our
income tax behavioural approach.46
We have made no changes to our
assumptions or underlying judgements on taxpayer behaviour.
44
OBR policy costings database (link)
45 The Scottish Government presented the Commission with all finalised policy measures on 8 May 2018. See
Chapter 1 for further information.
46 Scottish Fiscal Commission (2018) How we forecast behavioural responses to income tax policy (link)

102
HMRC RTI data
3.26 HMRC have been developing more timely estimates of Scottish income tax
liabilities than currently available from the SPI. In January 2018, HMRC
published its first experimental quarterly Real Time Information (RTI)
statistics.47
This includes estimates of numbers receiving pay and their pay
from HMRC’s RTI administrative data, covering April 2014 to September 2017
inclusive. In addition, HMRC have also been regularly providing the
Commission and the Scottish Government provisional RTI tax receipt
estimates, covering April 2016 to March 2018.
3.27 RTI data offer a potentially valuable source of real time information on income
growth from employed taxpayers in Scotland. However, RTI is a new source
of data and has some drawbacks. For example, RTI only covers the PAYE
population (excluding the self-employed). We have some reservations about
using these data to adjust our forecast at this time, and so we make no direct
adjustments to our forecast using the RTI data.
3.28 We will continue to monitor RTI data and may choose to introduce changes in
the future to our approach to forecasting income tax as a result. More should
be known about the utility of the RTI data once the outturn data is published.
47
HM Revenue and Customs (2018) UK Real Time Information, Experimental Statistics (link)

103
Forecast
3.29 Since February 2018 the Commission has revised its forecasts of NSND
income tax liabilities. Table 3.5 presents in detail the differences between our
February 2018 forecast and the latest forecast.
Table 3.5: Comparison with February 2018 forecast
Source: Scottish Fiscal Commission (February 2018) Scotland’s Economic and Fiscal Forecasts Supplementary
Publication Updated Income Tax Forecasts (link), Scottish Fiscal Commission. Figures may not sum to totals
because of rounding
*Outturn in this context for income tax refers to our analysis of the 2015-16 Survey of Personal Incomes (SPI)
data
3.30 The table shows a range of factors and developments, since our forecast in
February, that have led to a small upward revision in 2015-16 and 2016-17 tax
years, with downwards revision for subsequent years. The latest economy
forecasts have reduced future tax liabilities, but other factors such as strong
employment outturn data in 2016-17 have had some impact on the forecast.
Figure 3.1 presents the relative scale of these factors for 2018-19.
48
Includes revisions to OBR triple lock and CPI forecasts, HMRC Gift Aid estimates, inclusion of 2017 mid-year
population estimates and model developments.
£ million 2015-16
Outturn*
2016-17 2017-18 2018-19 2019-20 2020-21 2021-22 2022-23
February 2018 10,932 11,214 11,584 12,177 12,647 13,152 13,733 14,372
2016-17 outturn data 0 30 53 78 80 84 87 92
Economy forecast 0 6 -198 -317 -405 -474 -545 -614
2015-16 SPI data 15 -5 -21 5 7 25 66 96
Tax-Motivated Incorporations 0 21 43 26 31 35 10 13
Other48 1 0 7 8 -1 0 1 -3
2017-18 policy recosting 0 0 -2 -2 -7 -7 -7 -8
2018-19 policy recosting 0 0 0 -6 -8 -9 -11 -12
May 2018 10,948 11,267 11,467 11,969 12,345 12,805 13,335 13,936
Change from February 2018 16 53 -118 -209 -302 -347 -398 -437

104
Figure 3.1: February 2018 compared to May 2018 forecast by factor, 2018-19
Source: Scottish Fiscal Commission (February 2018) Scotland’s Economic and Fiscal Forecasts Supplementary
Publication Updated Income Tax Forecasts (link), Scottish Fiscal Commission
3.31 Changes since February 2018 have led to a net downwards revision for 2018-
19 of £209 million. The chart clearly shows that changes to the economy
forecast are the most significant of these factors.
3.32 Changes to the economy forecast in isolation have reduced our forecast of
income tax liabilities in 2018-19 by £317 million. The developments to the
economy forecasts are discussed in Chapter 2. The main reasons for these
changes are:
New analysis by the Commission on wage growth in Scotland has led
the Commission to revise down its outlook for wages
One-off factors such as adjustments in the oil and gas supply chain to
lower oil prices and declines in the construction industry leading to
weaker than expected wage growth in 2017 and 2018
A downwards revision to productivity growth in 2018-19, following a
weaker than expected performance over the last two years, has also
marginally reduced the outlook for earnings
11,700 11,800 11,900 12,000 12,100 12,200 12,300
May 2018
2018-19 policy recosting
2017-18 policy recosting
Other
Tax-Motivated Incorporations
2015-16 SPI data
Economy forecast
2016-17 outturn data
February 2018
£ million

105
Uncertainty
3.33 In this section, we assess the sensitivity of our income tax forecast to the
alternative economy scenarios considered in Chapter 2, Table 2.9. The
analysis are shown in Figure 3.2 below.
Figure 3.2: Income Tax sensitivity analysis
Source: Scottish Fiscal Commission
3.34 Changes in income tax receipts are most sensitive to changes in our
assumption about productivity growth. In the high productivity scenario,
income tax revenues are on average estimated to be around £200 million
higher in 2018-19, rising to around £950 million by 2023-24. Across the
forecast horizon this amounts to a cumulative increase of £3.5 billion. In the
low productivity scenario we estimate a cumulative decrease of around £1.4
billion. Productivity is one of the most significant risks to our NSND income tax
forecast.
Comparison to OBR forecast
3.35 As part of their role as UK-level fiscal forecaster, the OBR also produce a
forecast of income tax receipts. Table 3.6 below compares the latest OBR
forecast as presented in their March 2018 devolved tax and spending
publication and our latest forecast.
-600
-400
-200
0
200
400
600
800
1000
2018-19 2019-20 2020-21 2021-22 2022-23 2023-24
Inco
me T
ax f
ore
cast
ch
an
ge (
£ m
illio
n)
Low productivity High productivity High hours Low hours
High migration Low migration High employment Low employment

106
Table 3.6: Commission and OBR Scottish NSND income tax forecasts
£ million 2015-16 2016-17 2017-18 2018-19 2019-20 2020-21 2021-22 2022-23
SFC May 18 10,948 11,267 11,467 11,969 12,345 12,805 13,335 13,936
OBR March 18 10,957 11,415 11,873 12,403 12,712 13,139 13,575 14,116
Difference -9 -148 -407 -434 -367 -334 -240 -181
Source: OBR (2018) Devolved Tax and Spending Forecasts March 2018 (link), Scottish Fiscal Commission
Figures may not sum to totals because of rounding
3.36 Our forecast is consistently lower than OBR’s forecast. There are a few
reasons why our forecasts are different.
Modelling differences: In our forecasts we use a ‘bottom-up’ micro
simulation forecast based on our SPI model. This allows the Commission to
develop an income tax model which is suitable for Scottish demographics
and the distribution of taxpayers. The OBR (or HMRC on their behalf)
utilises a ‘top-down’ approach by first producing a forecast of the NSND
income tax for the whole UK and then estimating a Scottish share which is
applied to this forecast.
Data: Our forecasts are based on the 2015-16 SPI, and are projected
forward using Scottish specific economic determinants which we produce
as part of our economy forecasts. The OBR forecast of future earnings
growth is based on UK economic determinants. In addition, the UK income
tax forecast is partly adjusted based on the available 2016-17 and 2017-18
outturn receipts data for the UK. This approach will also be reflected in their
Scottish NSND income tax forecast.
Policy costing: The policy costing for the Scottish Government’s 2018-19
five band income tax system is included in both forecasts. Table 3.7 below
compares the OBR’s costing with our latest estimate. The two costings are
broadly similar – there are small differences in our static costings because
of differences in our base forecast. On the behaviour element, the OBR
have disaggregated the policy effect of TMI and migration, where as our
behavioural approach includes this as part of our Taxable Income
Elasticities (TIE). The OBR’s costing has an increasingly higher behavioural
reduction percentage because of the accumulation of additional TMI
behaviour. Further information on our approach can be found in our March

107
2018 paper ‘How we forecast behavioural responses to income tax
policy’.49
Table 3.7: Comparison between Commission and OBR costing of the Scottish
Government’s 2018-19 income tax band policy
£ million 2018-19 2019-20 2020-21 2021-22 2022-23
OBR Costing
Static Costing 274 281 290 302 317
Behavioural response -49 -58 -64 -70 -77
Post-behavioural Costing 225 223 226 232 240
Reduction due to behaviour (%) -18 -21 -22 -23 -24
SFC Costing
Static Costing 266 274 288 303 321
Behavioural response -53 -55 -58 -61 -66
Post-behavioural Costing 213 219 230 242 255
Reduction due to behaviour (%) -20 -20 -20 -20 -20
Source: OBR (2018) Devolved Tax and Spending Forecasts March 2018 (link), Scottish Fiscal Commission
Figures may not sum to totals because of rounding
Comparison to Block Grant Adjustment
3.37 The OBR published updated economy and fiscal forecasts at the Spring
Statement on 13 March 2018. These forecasts have been used by the
Scottish Government to produce indicative updates of the Scottish
Government’s block grant adjustments in the Medium Term Financial
Strategy. For illustrative purposes, a comparison between our income tax
forecasts and these block grant adjustment estimates is shown in the table
below.
49
Scottish Fiscal Commission (2018) How we forecast behavioural responses to income tax policy (link)

108
Table 3.8: Comparison between Commission forecast and Spring Statement 2018 Block Grant Adjustment forecast estimates
£ million 2017-18 2018-19 2019-20 2020-21 2021-22 2022-23
SFC May 2018 11,467 11,969 12,345 12,805 13,335 13,936
Block Grant Adjustment Estimates* 11,626 11,930 12,215 12,612 13,015 13,531
Difference -159 39 130 193 320 405
Source: Scottish Fiscal Commission, Scottish Government Medium -Term Financial Strategy, Table 6.2
* Estimates are based on Indexed Per Capita methodology
3.38 The income tax BGA for the next year is set at the UK Autumn Budget and is
only reconciled once the final outturn data are available, typically within 15
months of the end of the financial year. For this reason these updated BGA
figures presented will have no immediate bearing on the Scottish
Government’s budget.
3.39 The income tax BGA figures will all be updated at the UK Autumn Budget
following publication of the 2016-17 outturn data in HMRC’s annual report in
July 2018.

109
Non-Domestic Rates
Forecast
Table 3.9: Forecast of Non-Domestic Rates
£ million 2016-17
Outturn 2017-18 2018-19 2019-20 2020-21 2021-22 2022-23 2023-24
2,731 2,774 2,788 2,859 2,931 3,110 3,307 3,339
Source: Scottish Fiscal Commission
Background
3.40 Non-Domestic Rates (NDR) are paid by the owner, tenant or occupier of non-
domestic properties. The amount of tax paid is dependent on the rateable
value (RV) of the property, the tax rate (also known as poundage) and any
reliefs or exemptions that the property is eligible to claim. While NDR are
collected and ultimately spent by local authorities, the Scottish Government
retains control over the administration of the tax. This includes control over
decisions such as the poundage, the system of reliefs available to ratepayers,
and the date at which a revaluation of properties will take effect.
3.41 Independent Assessors assign RV to every non-domestic property in Scotland
(with some exemptions). The total rateable value of non-domestic properties
in Scotland is the tax base for NDR. While the method used to assess RV
depends on the type of property being valued, the RV can be thought of as
being broadly equivalent to the annual rental value of the property in
question.50
Rateable values are reassessed on a regular basis, with every five
years historically being the most common period in between revaluations.
3.42 Ratepayers have the right to appeal the RV of their property if they believe it
should be lower than valued by the Assessor. In Scotland the two main types
of appeal are revaluation appeals, which can only be lodged within six months
of a revaluation taking place, and running roll appeals which can be lodged at
any point during the revaluation cycle.51 Currently an appeal submitted by a
ratepayer can only result in the rateable value of their property either being
reduced or staying the same.
50
Details of the methods used to value properties is available on the Scottish Assessors Association website
(link). Rateable value is defined in the Valuation and Rating (Scotland) Act 1956 (link).
51 Running roll appeals are lodged on the grounds of error, new interest, or a material change in circumstances
(MCC). Appeals on the grounds of error must be lodged whilst the roll is in force. Appeals for MCC must be
lodged no later than six months after the roll ceases to be in force.

110
3.43 The most recent revaluation of the tax base took effect in 2017 and saw total
RV increase by eight per cent on 1 April 2017 when the new valuations came
into effect. Similar to previous revaluations, this rise in RV was not uniform
across the tax base. Designated Utilities – which are valued nationally by a
single Assessor – saw their RV increase by 33 per cent on average compared
to six per cent for the rest of the tax base as a whole.52
In total, the 31
Designated Utilities entries on the valuation roll accounted for 36 per cent of
the total growth in the tax base seen at the 2017 revaluation.
Figure 3.3: Changes in Rateable Value (RV) at 2017 revaluation by sector
Source: Scottish Government (2017) Revaluation 2017 in Scotland (link)
3.44 This concentration of growth in the tax base in a small number of high value
entries on the valuation roll has important consequences for our forecast. The
potential for a handful of successful revaluation appeals to significantly reduce
the amount of income collected is greater than a scenario where RV growth is
distributed across a larger number of entries on the tax base.
3.45 The Barclay Review report, published in August 2017, continues to have a
significant impact on our forecast.53 The review group made a total of 30
recommendations to the Scottish Government to reform the system of NDR in
Scotland. Several of the recommendations relating to reliefs have been
implemented from April 2018 and were included in our December 2017
forecast as policy costings.
52
Legislation requires certain Utilities (Electricity, Gas, Fixed-Line Telecommunications, Docks and Harbours,
Railways and Scottish Water) be valued at a national level by a designated assessor. See NDR (Valuation of
Utilities)(Scotland) Order 2005 (link).
53 Report of the Barclay Review of Non-Domestic Rates 2017 (link).
-10%
0%
10%
20%
30%
40%
Offices Shops Health and
Medical
Industrial Other Designated
Utilities
% C
ha
ng
e i
n R
ate
ab
le V
alu
e

111
3.46 The Scottish Government published an implementation plan covering the
recommendations of the Barclay Review group in December 2017 alongside
the Draft Budget 2018-19.54
Once information regarding the detail and timing
of any further changes to the rates system is available, these will be included
in our forecasts.
Description of modelling approach
3.47 The approach taken to forecast NDR has previously been set out in detail
both in our September 2017 paper and our December 2017 forecast
publication.55 Data from the Scottish Assessors Association (SAA) on the tax
base is used to estimate the amount of Gross NDR Income to be collected,
taking account of growth in the tax base and losses from revaluation appeals.
3.48 Various deductions to this forecast of Gross Income are then made to account
for the factors that reduce the amount of NDR income collected by local
authorities. This includes factors such as expenditure on mandatory reliefs,
write-offs and refunds resulting from overpayments in previous years.
3.49 The final step in the model accounts for the effect of a revaluation on NDR
income. To do this, it is assumed that the Government will set the poundage
following a revaluation in order to maintain revenue neutrality.56 With a
revenue neutral poundage, the only effect of a revaluation on NDR income is
through the resolution of appeals, which cause revenues to be high early in
the cycle before declining as increasing numbers of appeals are resolved. The
table below demonstrates the magnitude of this effect, with revenue in year
one of a revaluation cycle four per cent higher than a scenario where no
revaluation takes place.
54
See Scottish Government (2017) Implementation plan in response to the Barclay review (link)
55 See Scottish Fiscal Commission (2017) Current Approach to Forecasting (link) and Scottish Fiscal Commission
(2017) Scotland’s Economic and Fiscal Forecasts December 2017 (link)
56 Policy around revaluations in Scotland has often focused on maintaining revenue-neutrality, though this was
foregone at the last revaluation in favor of matching the English poundage. The formula used to calculate
revenue neutral poundage is defined in legislation covering England and Wales, Local Government Finance Act
1988, Schedule 7 Part 1 (link)

112
Table 3.10: Impact of a revaluation on NDR Income
Year 1 Year 2 Year 3 Year 4 Year 5
Percentage difference compared with no
revaluation scenario 4% 1% -2% -2% 0%
Source: Scottish Fiscal Commission
3.50 By incorporating the effect of a revaluation on NDR income in this way, our
forecast should reflect the expected revenues collected in the absence of any
policy changes by the Scottish Government at the next revaluation.
Forecast
3.51 The Commission’s forecast of NDR income is presented in the table below.
The forecast has developed since December as a result of the inclusion of
new data, and to a lesser extent because of modelling changes. Several of
the policy costings produced for our last forecast have also been updated to
include the latest available data on the tax base. The estimated net NDR
income raised through the addition of shootings to the valuation roll has also
been revised now that the remainder of these entries have been made by
Assessors.57
Table 3.11: Change in NDR forecast
£ million 2016-17
Outturn 2017-18 2018-19 2019-20 2020-21 2021-22 2022-23 2023-24
Dec 2017 2,731 2,810 2,812 2,867 2,939 3,117 3,331
Data updates -33 -19 0 -1 -3 -3
Modelling changes 0 -3 -8 -6 -4 -19
Land reform costing -3 -3 -3 -3 -3 -3
Other58 0 1 2 3 2 2
May 2018 2,731 2,774 2,788 2,859 2,931 3,110 3,307 3,339
Total change 0 -36 -24 -8 -8 -8 -23
Source: Scottish Government, Scottish Fiscal Commission. Figures may not sum because of rounding.
3.52 Data updates have reduced the early years of our forecast and are mainly
because of higher than expected appeals losses relating to the 2010
revaluation cycle. While losses to appeal from the 2017 cycle have also been
higher than forecast, this has had a much smaller impact on our forecast. We
continue to assume five per cent of RV from the 2017 revaluation will be lost
57
Shootings were added to the valuation roll as a consequence of the Land Reform Act 2016 (link)
58 Includes impact of policy changes since Draft Budget and recostings of previously published policy costings.

113
to appeal, but have re-calculated the profile of these losses over five years to
account for the slightly higher than expected amount in year one of the cycle.
3.53 Initial estimates of growth in the tax base are weaker for 2017-18 than we
forecast in December 2017. Our approach relies on projecting forward the
long-run average of growth in the tax base, which is affected by several high
observations in early years of the series. We now base our projections on the
average growth post-2006-07, resulting in a slight downward revision to our
projections for growth in the tax base. This lowers our forecast for the amount
of NDR income collected from 2018-19 onwards by between £6 million and
£10 million. The effect of revaluation on NDR income has also been
recalculated to better capture the effect of a revenue neutral revaluation on
NDR income, which lowers the forecast for 2022-23. Other modelling updates
have a smaller impact on the forecast.
3.54 Our December 2017 forecast contained an estimate of the NDR income that
would be raised as a result of the addition of shooting rights to the valuation
roll.59
At the time there was uncertainty around the net NDR that would be
raised, with an additional 2,000 entries for shootings still to be made by
Assessors. Our estimate assumed these entries were large with an average
RV equal to the average RV for the 1,000 largest shootings already added to
the roll. Now that Assessors have entered all shootings on the valuation roll,
we have updated our costing and the additional NDR income generated is
less than anticipated. The average RV of all shootings on the roll is currently
calculated at £1,520 compared to the £2,865 assumed in December 2017.
Net NDR income raised from shootings is estimated to be £3 million per year
lower than we estimated in December 2017.60
3.55 Several of the policy announcements from the Draft Budget 2018-19 have
been re-costed to account for new data. The impact of these changes is
included in Table 3.11 in the ‘Other’ line. Our costing for the Business Growth
Accelerator has been reduced to account for our revised projections of growth
in the tax base. Additionally, the cost of New Start relief has been removed, to
reflect legislation passed after the Draft Budget that will discontinue this relief.
This also has a small impact on our costing for the policy introduced at Draft
Budget to delay entry on the valuation roll for unoccupied new builds. The
overall impact of these updates raises NDR income over the forecast. A full
breakdown of the impact of these changes on NDR income is shown in Table
3.12 below.
59
Shootings are defined as the right to occupy the land for the purpose of shooting wild animals and birds hunted
for sport. See Scottish Assessor Association Practice Note 35 Valuation of shooting rights and deer forests (link)
60 For more detail on how the net NDR income raised by shootings was estimated in December, see Scottish
Fiscal Commission Land Reform Costing for NDR: FOI release 002/2017 (link)

114
Table 3.12: Impact of Policy recostings and changes on NDR income
£ million 2018-19 2019-20 2020-21 2021-22 2022-23 2023-24
Business Growth Accelerator 1.5 2.9 2.9 2.1 2.1 2.1
Day Nurseries -0.2 -0.2 -0.2 -0.2 -0.2 -0.1
Hydro -0.5 -0.5 -0.5 -0.5 -0.5 -0.5
New Start 0.1 0.1 0.4 0.4 0.4 0.4
Delaying entry on the roll -0.1 -0.1 -0.1 -0.1 -0.1 -0.1
Total impact of changes 0.9 2.2 2.6 1.7 1.6 1.8
Source: Scottish Fiscal Commission. Figures may not sum to totals because of rounding
3.56 As noted in our December 2017 publication, both Hydro and Day Nurseries
relief may change over the course of our forecast. Day Nurseries relief is due
to be evaluated after three years, while Hydro relief will be considered once
the review of the valuation of Hydro schemes recommended by the Barclay
Review has reported. While this introduces uncertainty around the longer term
cost of these policies, in the absence of firm detail we continue to assume
they remain in place unchanged over the duration of our forecast. This
approach is similar to that taken on other reliefs, such as the Small Business
Bonus Scheme, which must be renewed via secondary legislation each year.
Box 3.2: Contributable vs. Distributable Amount
The Commission forecasts what is known as the ‘contributable amount’ for NDR,
which can be thought of as being the amount collected by local authorities that
subsequently flows to the Scottish Government. The contributable amount collected
by local authorities is pooled at a national level, before being redistributed by the
Scottish Government as part of the Local Government Finance Settlement. The
amount of NDR income redistributed to local authorities as part of this settlement is
known as the ‘distributable amount’.
In any given year the contributable and distributable amounts will not be the same.
Contributions from local authorities to the national pool are estimated by the local
authorities themselves and are not known until after the start of the financial year.
However, the distributable amount is set prior to the start of the financial year,
meaning the Scottish Government must rely on our forecast of the contributable
amount to inform this decision. In setting the distributable amount, the Government
must also take account of any differences between the estimated and actual
contributions to the pool by local authorities from the year before.
To manage the difference between the contributable and distributable amounts, and
demonstrate that NDR income pooled nationally is being redistributed to local
authorities, the Government is required to publish what is known as the ‘NDR Rating
Account’ or ‘White Paper Account’. This account shows the annual and cumulative

115
balance of the contributable and distributable amounts.
The figure below shows that while prior to 2014-15 the pool was typically in surplus,
in recent years a cumulative deficit has been carried forward, totalling £297 million in
2016-17. Between 2013-14 and 2016-17, the Government distributed more NDR
income to local authorities than was collected in each year.
Figure 3.4: Balance of NDR Rating Account at Year End, £ million
Source: NDR Rating Account 2008-09 to 2015-16 (link), NDR Rating Account 2016-17 (link), Scottish Fiscal
Commission
The Commission only forecasts the contributable amount of NDR income. While
decisions regarding the distributable amount are ultimately a policy choice for
Government, in December 2017 this amount was set using our forecast with the aim
of bringing the account to balance by the end of 2018-19.61
The final position of the pool cannot be known until the audit of the NDR rating
account is published. However, using our current forecast of the contributable
amount along with the distributable amount set for 2018-19, we estimate the pool will
remain in deficit by £59 million at the end of this financial year. This projected deficit
results from a weaker forecast of NDR income collected in both 2017-18 and 2018-
19 compared to our December 2017 forecast. The final audited position of the
account will likely differ from this projection, as it is determined by data returns from
local authorities on their estimated and actual contributions to the pool. As the
distributable amount is set before the start of the financial year, a projected deficit
cannot be addressed in-year, and so will be carried forward into the calculation of the
amount to be distributed at the Scottish Budget later this year.
61
See Scottish Government (2017) Draft Budget 2018-19, Table 10.18 Calculation of 2018-19 NDR Distributable
Amount (link)
-£400
-£300
-£200
-£100
£0
£100
£200
Audited Figures Projected Position

116
Description of Scottish and UK Government policy changes
3.57 A wide range of policy measures on NDR were announced at the Draft Budget
2018-19. These resulted, in part, from the Barclay Review of NDR published
in August 2017. In our December 2017 publication we estimated the
combined impact of these policy announcements would reduce the amount of
NDR income collected by local authorities by £96 million in 2018-19.
3.58 We have re-estimated the cost of several of these policies to reflect the latest
information on the tax base as of April 2018. This has resulted in revisions to
our estimates of the cost of Day Nurseries, Hydro relief, and the Business
Growth Accelerator. Our overall estimate of the cost of the policy changes
announced at the Draft Budget in December 2017 is £1 million lower in 2018-
19.
3.59 The Scottish Government published an implementation plan covering the
recommendations of the Barclay Review in December 2017. Additional
measures the Government has committed to implementing in future include
introduction of three-year revaluation cycles after 2022-23, general anti-
avoidance measures, and reforms to the system of appeals. Once detail is
available along with timescales for the implementation of these measures, we
will consider them in future forecasts.
3.60 The UK Government announced at the Spring Statement 2018 that the next
revaluation of the tax base in England will be moved forward a year to 2021-
22. The Scottish Government has since stated that it has no plans to move
the date of the next revaluation, and so our forecast continues to assume this
will take place in 2022-23.62
62
See Question S5W-15289: Bill Bowman, Date Lodged: 15/03/2018 (link)

117
Land and Buildings Transactions Tax
3.61 Land and Buildings Transactions Tax (LBTT) is payable upon purchase of a
residential property, or purchase or lease of a non-residential property. There
are three components of LBTT: residential LBTT, which is charged on the
purchase of a residential property; Additional Dwelling Supplement (ADS),
which is charged on the purchase of an additional property, such as a buy-to-
let or a second home; and, non-residential LBTT, which is charged on the
purchase or lease of non-residential land or property, for example factories,
offices and farms.
Table 3.13: LBTT forecasts
£ million 2016-17
Outturn*
2017-18** 2018-19 2019-20 2020-21 2021-22 2022-23 2023-24
Total LBTT revenue raised 484 550 614 656 697 738 781 827
of which:
Residential (excluding ADS) 214 259 312 342 373 405 438 473
Additional Dwelling
Supplement (ADS) 93 91 97 100 104 108 112 116
Non-residential 177 201 206 214 220 226 231 238
Source: Scottish Fiscal Commission, Revenue Scotland (2017) 2016-17 Annual Report (link) *Accruals basis ** In-year forecast is on an accruals basis and will not exactly match the figure for total LBTT of £569 million
published by Revenue Scotland in its LBTT statistical release March 2018 edition (link). See Box 3.3 for further
discussion. Figures may not sum to totals because of rounding
3.62 We forecast LBTT revenues on a basis consistent with the audited figures
published in Revenue Scotland’s Annual Reports. These statistics will not
exactly match those published monthly on Revenue Scotland’s website, which
are published based on the date the tax returns are received to allow for
timely publication of data (see Box 3.3 for further detail).

118
Box 3.3: The accounting treatment of tax revenue
Tax revenue can be measured on the basis of when the tax is declared due (cash
basis) or on the basis of when the liability arose (accruals basis).
Revenue Scotland publishes monthly statistics on tax declared due. These data
are based on the date when Revenue Scotland receive the LBTT tax return from
the buyer.63 This differs from the date of completion, when the buyer takes legal
ownership of the property, as buyers have up to 30 days after the date of
completion to submit the tax return. In this report we will refer to the latter as the
accruals basis, as it is the interpretation of accruals accounting on which our
forecasts are based.
There are two situations in which the choice of accounting basis can lead to a
significant difference in the financial year figures for tax revenue raised. First, when
there is a policy change that causes some transactions either to be brought
forward or pushed back into another financial year. Table 3.14 shows how this
affected reported residential LBTT revenue raised in 2015-16. Second, Revenue
Scotland’s monthly statistics report ADS repayments against the month and year of
the original additional dwelling purchase. In our forecast and in Revenue
Scotland’s Annual Report, repayments are accounted for in the year in which they
were claimed. This is the reason why our 2017-18 forecast of £32 million for ADS
repayments is considerably higher than Revenue Scotland’s reported figure in its
March publication of £17.6 million. The latter figure will change as future
repayments tied to additional dwelling purchases that took place in 2017-18 are
claimed.
We forecast revenue raised on an accruals basis, consistent with what is published
in Revenue Scotland’s Annual Reports.64
Table 3.14: Tax receipts for residential LBTT excluding ADS
£ millions 2015-16 2016-17
Receipts on basis of date tax return received 202 214
Receipts on basis of date property transaction
completed
208 214
Source: Revenue Scotland LBTT statistics (link), Revenue Scotland (2017) 2016-17 Annual Report (link
63
Revenue Scotland Statistics (link)
64 The Office for Budget Responsibility (OBR) uses the accruals accounting convention defined by the Office for
National Statistics (ONS). While similar to the one we use, the two concepts are not exact matches. This is only a
minor source of difference across all or our LBTT forecasts.

119
Residential LBTT
Forecast
Table 3.15: Residential LBTT forecast (excluding ADS)
Source: Scottish Fiscal Commission, Revenue Scotland (2017) 2016-17 Annual Report (link) * In-year forecast is on an accruals basis and may not exactly match the figure of £260 million published by
Revenue Scotland in its March 2018 LBTT statistical release (link). See Box 3.3 for further discussion.
Background
3.63 Residential LBTT is paid on a residential property or land purchase over
£145,000. LBTT was introduced on 1 April 2015 and replaced Stamp Duty
Land Tax (SDLT) in Scotland.65
3.64 Before December 2014, SDLT tax rates were applied to the entire purchase
price of the home.66 Residential LBTT tax rates are applied only to the portion
of the home purchase price that falls into each tax band. For example for a
£150,000 home, the first £145,000 is taxed at zero per cent and the final
£5,000 is taxed at two per cent.
3.65 The rates and bands for residential LBTT are:
zero per cent on transactions up to £145,000
two per cent on the portion above £145,000 up to £250,000
five per cent on the portion above £250,000 up to £325,000
10 per cent on the portion above £325,000 up to £750,000
12 per cent on the portion above £750,000
65
For further information about residential LBTT, please visit the Revenue Scotland website (link)
66 Previous Commission reports have discussed the changes to the tax system in 2014 and 2015. Scottish Fiscal
Commission (2017) Forecast Evaluation Report 2017 (link)
£ million 2016-17
Outturn
2017-18* 2018-19 2019-20 2020-21 2021-22 2022-23 2023-24
214 259 312 342 373 405 438 473

120
The Scottish Housing Market
3.66 Since December 2017, average Scottish house prices have continued to
increase. Growth in the second half of 2017-18 has been higher than
expected, in particular in the first quarter of 2018, during which average prices
rose by 7.6 per cent compared with the same period of 2017.67
The main
reason was a change in the composition of transactions, with a fall in the
number of lower value transactions occurring at the same time as an increase
in the number of very high value transactions.
3.67 The number of purchases valued below £250,000 fell 3.8 per cent in the
second half of 2017-18, compared with the same period in 2016-17. These
transactions accounted for 81 per cent of total transactions in the second half
of the financial year. This meant that despite an increase in transactions
valued above £250,000, the total number of market transactions fell, in
contrast to our expectation of a rise in December 2017.
3.68 Residential LBTT cash receipts in 2017-18 have been £260 million, £46
million more than in 2016-17.68
If this figure is an exact reflection of the final
audited figure published as part of Revenue Scotland’s Annual Report later
this year, it will mean that our December 2017 forecast for 2017-18 of £271
million will have proved too high. This is mainly down to a lower number of
transactions than previously anticipated.
Modelling approach
3.69 Our approach to forecasting residential LBTT is unchanged since December
2017. We use mean and median house price and transactions forecasts to
calculate a distribution of residential transactions in the Scottish housing
market. Revenues are calculated from the forecasts of the average tax
payable in each band and the total number of transactions falling into each
band. Our forecasts include an explicit calculation of behavioural response to
67
Registers of Scotland Quarterly house price statistics; Quarter 1: January – March 2018 (link). Note that as
these data are not mix-adjusted, average prices can be affected by the composition of property types transacted
in a given period.
68 Revenue Scotland Monthly Statistics: March 2018 publication (link). In-year forecast is on an accruals basis
and may not exactly match the figure of £260 million published by Revenue Scotland in its March 2018 LBTT
statistical release (link). See Box 3.3 for further discussion.

121
fiscal drag, which occurs as house prices rise thus increasing the tax
payable.69
Forecast
3.70 The forecast for residential LBTT is shown in Table 3.16 below, along with
how the forecast has developed since December 2017. There is a downward
revision to 2017-18 and upward revisions to our revenue forecast thereafter.
Table 3.16: Residential LBTT receipts forecasts (excluding ADS)
Source: Scottish Fiscal Commission, Scottish Fiscal Commission (2017) Scotland's Economic and Fiscal
Forecasts December 2017 (link), Revenue Scotland (2017) 2016-17 Annual Report (link) * In-year forecast is on an accruals basis and may not exactly match the £260 million figure published by
Revenue Scotland in its March 2018 LBTT statistical release (link). See Box 3.3 for further discussion.
Figures may not sum to totals because of rounding
3.71 House price growth in the last two quarters of 2017-18 was higher than we
forecast in December 2017. As a result, we have revised up our short-term
forecast for average house price growth. We have also made a small upward
revision to our estimate of medium-term growth. These increase our revenue
forecast.
3.72 Our forecast for the median house price has also been revised upwards. This
has the effect of lowering our forecast for revenue. The reason lies in the way
that we estimate the distribution of transactions. All else equal, raising the
69
Further detail on our modelling approach can be found in our September 2017 Current Approach to
Forecasting paper (link)
£ million 2016-17
Outturn
2017-
18*
2018-
19
2019-
20
2020-
21
2021-
22
2022-
23
2023-
24
December 2017
214 271 305 336 366 395 426
Prices -1 16 19 23 28 33
Transactions -8 -9 -12 -14 -16 -19
Fiscal Drag 0 0 -1 -1 -1 -1
Other -3 0 -1 -1 -1 -2
May 2018 214 259 312 342 373 405 438 473
Total change 0 -12 7 6 7 9 12

122
median price has the effect of apportioning a greater share of transactions
towards the lower tax brackets, thus reducing tax receipts.
3.73 From 2018-19, the effect of the higher mean price outweighs that of the higher
median, leading to an overall upward revision to the revenue forecast from
prices.
3.74 Our forecast for transactions has been revised down, in part because of fewer
than previously forecast transactions in 2017-18 and in part because of a
slightly slower rate of growth over the forecast horizon. The effect is to lower
our revenue forecast.
3.75 As in December 2017, the current methodology accounts for the behavioural
response to fiscal drag in the forecast.70
Fiscal drag occurs when the tax paid
on a transaction increases over time as a result of growth in prices, pushing
the transaction up the tax schedule. This may cause some home buyers to
offer a lower price for the house than they otherwise would, to offset, in part,
the increased tax due.
3.76 We use the same behavioural elasticities as the OBR to assess the response
of prices paid. As our price growth forecasts have increased, the effect of
fiscal drag is greater than the estimates presented in December 2017. This
reduces our revenue forecast by an additional £1 million in each year,
compared to a situation in which our price growth forecasts had remained
unchanged.
3.77 The Scottish Government has introduced legislation for a relief for First Time
Buyers, which raises their zero tax threshold from £145,000 to £175,000. We
have estimated that this policy will reduce LBTT revenue by an average of £7
million per year over the forecast horizon. Our costing has been updated
slightly to reflect revisions to our price and transactions forecasts and to
capture the fact that the relief will apply from 30 June 2018 rather than 1 June
2018 as assumed in our December 2017 forecast. The updated figures are
set out in Annex B.
Scottish Government policy
3.78 The Scottish Government announced that the Help to Buy (Scotland) scheme
will be extended until the end of March 2021 and that £100 million will be
made available over the additional two years. Help to Buy is a shared equity
scheme that supplements prospective home buyers’ deposits. The
Government takes up to a 15 per cent equity stake in a property for which the
70
Scottish Fiscal Commission (2017) Scotland’s Economic and Fiscal Forecasts December 2017 (link)

123
purchaser has a minimum five per cent deposit. While there is no set deadline
for home buyers to repay the Scottish Government, the equity support must
be repaid upon the occurrence of certain events, the most common one being
when the buyer decides to sell their home. The scheme applies to new build
purchases with a maximum price of £200,000.
3.79 Our forecast incorporates the existing Help to Buy policy into current market
trends. The expiry of the scheme in March 2021 could lead to a decrease of
around 2,000 transactions in 2021-22. It could also affect average prices,
given that increased deposits may have enabled buyers to increase offered
prices. The impact on tax revenue raised is likely to be less than £1 million,
given the fact that prices are capped at £200,000 and that two thirds of
participants in 2017-18 were first time buyers who would be eligible for relief
from LBTT. Therefore we have not included any adjustments for this in our
forecast.
Forecast uncertainty
3.80 The Commission’s residential LBTT forecasts are sensitive to variations in any
of the key determinants: mean prices, median prices and transactions. The
major area of forecast uncertainty is the forecast for house price growth. As
outlined in the Commission’s 2017 Forecast Evaluation Report this was the
largest source of forecast error for revenue in the Scottish Government’s
December 2015 and 2016 forecasts.71
Residential LBTT is a progressive tax,
so small changes in the forecast for house price growth can to large lead
changes in the forecast for LBTT revenues. Our December 2017 forecast
included an illustrative analysis of the sensitivity of LBTT forecast to the the
house price growth forecast.72
71
Scottish Fiscal Commission (2017) Forecast Evaluation Report 2017 (link)
72 Scottish Fiscal Commission (2017) Scotland’s Economic and Fiscal Forecasts December 2017 (link)

124
Comparison with OBR forecasts
Table 3.17: Commission and OBR Residential LBTT forecasts (excluding ADS)
£ million 2016-17
Outturn
2017-18 2018-19 2019-20 2020-21 2021-22 2022-23
SFC May 2018 214 259* 312 342 373 405 438
OBR March 2018 214 257 278 300 323 351 386
Difference 1 34 42 50 54 52
Source: Scottish Fiscal Commission, OBR (2018) Devolved Tax and Spending Forecast March 2018 (link),
Revenue Scotland (2017) 2016-17 Annual Report (link) * In-year forecast is on an accruals basis and may not exactly match the £260 million figure published by
Revenue Scotland in its March 2018 LBTT statistical release (link). See Box 3.3 for further discussion.
3.81 The Commission’s forecasts are higher than those made by the OBR. The
principal areas of difference in forecasting approach are:
the OBR’s use of UK price and transactions growth rates
different modelling approaches and judgements for house prices and
transactions
the OBR’s use of 2015 as the base year for its forecast as opposed to the
Commission’s starting point of 2017-18
3.82 Table 3.17 shows that our forecast for 2018-19 is £34 million higher than that
of the OBR. This is driven by the combined effect of the OBR downgrading its
in-year forecast for 2017-18 by £19 million and the respective revisions to
house price growth forecasts in 2018-19. By 2022-23, the LBTT revenue
difference is £52 million.

125
Additional Dwelling Supplement
Table 3.18: Additional Dwelling Supplement (ADS) forecast
£ million 2016-17
Outturn*
2017-18** 2018-19 2019-20 2020-21 2021-22 2022-23 2023-24
93 91 97 100 104 108 112 116
Source: Scottish Fiscal Commission, Revenue Scotland (2017) 2016-17 Annual Report (link) *Accrual basis
outturn net ADS (link). **In-year forecast is on an accruals basis and will differ from the £107 million net ADS figure published by
Revenue Scotland in its March 2018 LBTT statistical release (link). See Box 3.3 for further discussion.
Background
3.83 The Additional Dwelling Supplement (ADS) was introduced on 1 April 2016
and applies to purchases of additional residential properties worth £40,000 or
more. The rate is set at three per cent on the full value of the property
purchase.
3.84 ADS can be reclaimed if the purchaser sells their previous main residence
within 18 months of purchasing the new property. The Commission forecasts
net revenue – total ADS received less ADS repayments. Our forecast
accounts for ADS payments when the original transaction takes place and
repayments when the transfer of main residence occurs.
3.85 The accounting convention ensures our forecasts are aligned with Revenue
Scotland’s Annual Report figures for the devolved taxes, which makes
evaluation of the forecasts clearer.
Modelling approach
3.86 The ADS model is unchanged since our December 2017 forecast. We use the
forecasts for average house prices and transactions generated by the
residential LBTT model.
3.87 Since the introduction of ADS in April 2016, around 23 per cent of all
residential transactions have been liable for ADS. Gross revenues are
calculated based on the assumption that the share of transactions liable for
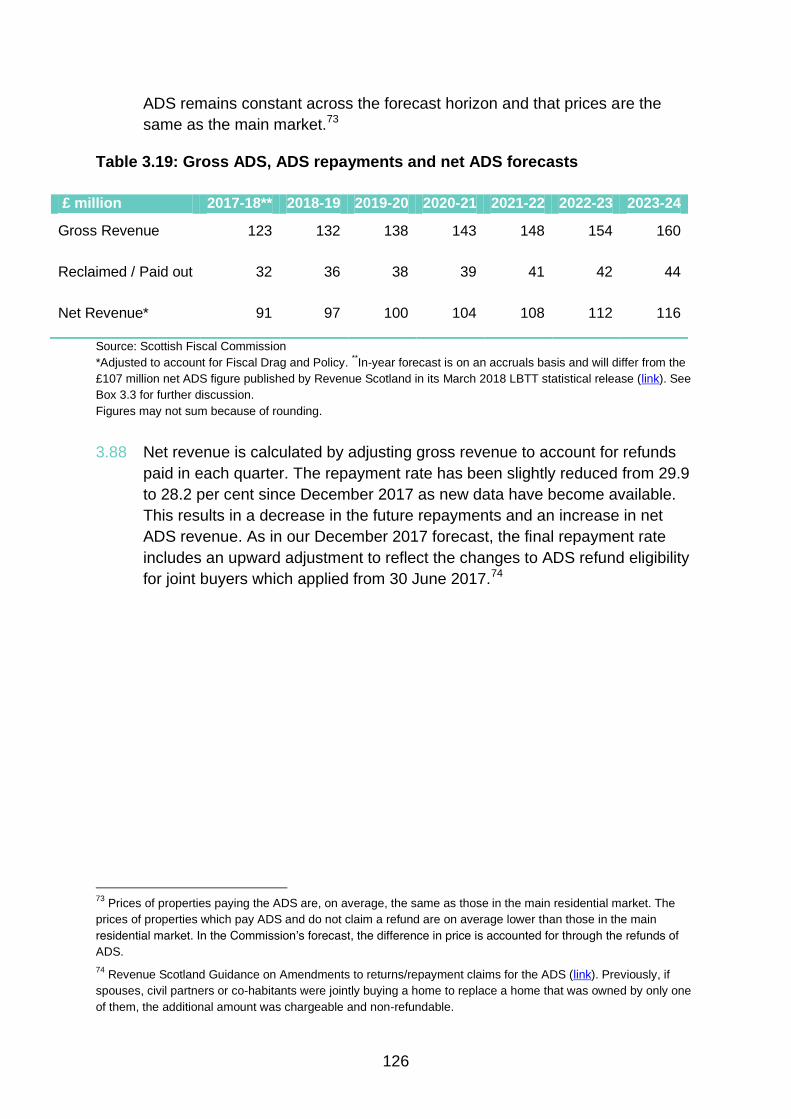
126
ADS remains constant across the forecast horizon and that prices are the
same as the main market.73
Table 3.19: Gross ADS, ADS repayments and net ADS forecasts
(
£ million 2017-18** 2018-19 2019-20 2020-21 2021-22 2022-23 2023-24
Gross Revenue 123 132 138 143 148 154 160
Reclaimed / Paid out 32 36 38 39 41 42 44
Net Revenue* 91 97 100 104 108 112 116
Source: Scottish Fiscal Commission
*Adjusted to account for Fiscal Drag and Policy. **In-year forecast is on an accruals basis and will differ from the
£107 million net ADS figure published by Revenue Scotland in its March 2018 LBTT statistical release (link). See
Box 3.3 for further discussion.
Figures may not sum because of rounding.
3.88 Net revenue is calculated by adjusting gross revenue to account for refunds
paid in each quarter. The repayment rate has been slightly reduced from 29.9
to 28.2 per cent since December 2017 as new data have become available.
This results in a decrease in the future repayments and an increase in net
ADS revenue. As in our December 2017 forecast, the final repayment rate
includes an upward adjustment to reflect the changes to ADS refund eligibility
for joint buyers which applied from 30 June 2017.74
73
Prices of properties paying the ADS are, on average, the same as those in the main residential market. The
prices of properties which pay ADS and do not claim a refund are on average lower than those in the main
residential market. In the Commission’s forecast, the difference in price is accounted for through the refunds of
ADS.
74 Revenue Scotland Guidance on Amendments to returns/repayment claims for the ADS (link). Previously, if
spouses, civil partners or co-habitants were jointly buying a home to replace a home that was owned by only one
of them, the additional amount was chargeable and non-refundable.

127
Figure 3.5: Assumed ADS repayment rate
Source: Revenue Scotland (link), Scottish Fiscal Commission (2017) Scotland’s Economic and Fiscal Forecasts
December 2017 (link)
Note: Repayment rates include an upward adjustment because of the policy change for joint buyer repayment
claims
Forecast
3.89 The Commission’s forecast of net ADS is shown in Table 3.20 along with how
the forecast has developed since the December 2017 forecast. Overall, the
May 2018 forecast entails a small upward revision to the previous forecast
from 2018-19 onwards.
Table 3.20: ADS forecasts £ million 2016-17
Outturn*
2017-18** 2018-19 2019-20 2020-21 2021-22 2022-23 2023-24
December 2017 93 93 93 98 102 106 110
House prices 2 3 3 3 4 4
Transactions -5 -3 -4 -5 -5 -5
Repayment
Rate 3 4 3 4 4 4
Other -2 0 0 0 -1 -1
May 2018 93 91 97 100 104 108 112 116
Total change 0 -2 4 2 2 2 2
Source: Scottish Fiscal Commission, Scottish Fiscal Commission (2017) Scotland's Economic and Fiscal
Forecasts December 2017 (link), Revenue Scotland (2017) 2016-17 Annual Report (link)
*Accrual basis outturn net ADS (link)
Note: Figures may not sum because of rounding.
0%
5%
10%
15%
20%
25%
30%
1 2 3 4 5 6 7 8 9 10 11 12 13 14 15 16 17 18
Rep
aym
en
t ra
te
Number of months after initial payment (Cohorts)
May 2018 December 2017

128
** In-year forecast is on an accruals basis and will differ from the £107 million Net ADS figure published by
Revenue Scotland in its March 2018 LBTT statistical release (link). See Box 3.3 for further discussion.
3.90 The main upward revision to the forecast comes from a higher house price
forecast, which adds £4 million to our 2022-23 forecast relative to December
2017. Changes to the repayment rate also result in an upward adjustment to
revenue. As in the residential LBTT forecast, lower forecast transactions
growth has reduced the ADS forecast. We have included the impact of
changes to our forecast in response to fiscal drag, new data and variations in
the percentage of transactions initially liable for ADS under ‘Other’ in Table
3.20.
3.91 A small adjustment is included in the forecast to account for the retrospective
application of the Land and Buildings Transaction Tax (Relief from Additional
Amount) (Scotland) Bill.75
This lowers revenue by £1 million in 2018-19.
Forecast uncertainty
3.92 As with the residential forecast, the main sensitivities are the forecasts of
house prices and transactions. The ADS forecast is also dependent on the
estimate of the proportion of revenue that will be reclaimed.
UK Government policy
3.93 The UK Government introduced changes to mortgage interest relief (MIR) for
buy-to-let landlords in its 2015 Summer Budget. These changes are being
phased in between April 2017 and April 2020. In 2018-19, landlords will able
to offset 50 per cent of their mortgage interest payments from their rental
income before being taxed, rather than 100 per cent as under the old rules.
The remaining 50 per cent could be deducted from their income at the 20 per
cent basic income tax rate. The percentage of mortgage interest payments
that landlords can deduct is decreasing over time and, by 2020, landlords will
no longer be able to deduct any mortgage interest payments from their
taxable profits. All landlords will pay tax on the full amount less a relief limited
to 20 per cent of their mortgage interest payments.
3.94 Our assessment of the impact of this policy remains unchanged. Our forecast
assumes that landlords are already aware of these changes and that there are
no additional market level reactions over and above those captured in existing
market trends and the Commission’s forecast.
75
The Land and Buildings Transaction Tax (Relief from Additional Amount) (Scotland) Bill allows couples who
jointly purchased a property as a main residence to replace a main residence previously owned by one partner
prior to 30 June 2017 to reclaim the ADS paid (link)

129
Comparison with OBR forecasts
3.95 Table 3.21 below shows that the OBR net revenue forecasts are marginally
higher than those made by the Commission. This is primarily driven by
differing forecasts for house price and transactions growth. There is a
difference in the repayments rate, with the Commission’s set higher as a
result of different modelling assumptions. We include an upward adjustment to
reflect the impact of changes for joint buyers not included in the OBR’s
forecasts.
Table 3.21: Commission and OBR forecasts for net ADS revenues
£ million 2016-17
Outturn*
2017-18 2018-19 2019-20 2020-21 2021-22 2022-23
SFC May 2018 93 91** 97 100 104 108 112
OBR March 2018 90 96 99 103 108 113 119
Difference 3 -5 -2 -3 -4 -5 -7
Source: Scottish Fiscal Commission, OBR (2018) Devolved Tax and Spending Forecasts March 2018 (link),
Revenue Scotland (2017) 2016-17 Annual Report (link)
*Accrual basis outturn net ADS (link). ** In-year forecast is on an accruals basis and will differ from the £107 million net ADS figure published by
Revenue Scotland in its March 2018 LBTT statistical release (link). See Box 3.3 for further discussion.
Figures may not sum because of rounding.

130
Non-residential LBTT
Table 3.22: Non-residential LBTT forecasts
Source: Scottish Fiscal Commission, Revenue Scotland (2017) 2016-17 Annual Report (link) * In-year forecast is on an accruals basis and may not exactly match the £201 million figure published by
Revenue Scotland in its March 2018 LBTT statistical release (link). See Box 3.3 for further discussion.
3.96 Non-residential LBTT applies to purchases or leases of commercial land and
properties such as shops or offices, agricultural land, forests or any other
transaction where the main subject matter of transaction consists of, or
includes, an interest on land that is non-residential. Similar to residential
LBTT, tax rates apply to the portion of the purchase price falling into the
respective tax band.
3.97 The relevant rates and bands for non-residential LBTT transactions are:
zero per cent on transactions up to £150,000
three per cent on the portion above £150,000 up to £350,000
4.5 per cent on the portion above £350,000
3.98 Lease transactions, which account for 12 per cent of the total non-residential
tax revenues, are taxed based on the net present value (NPV) of future rental
payments.
3.99 The relevant rates and bands for non-residential LBTT leases are:
zero per cent on transactions NPV up to £150,000
one per cent on the NPV portion above £150,000
3.100 LBTT may also be payable on chargeable consideration other than rent, such
as premium payments at the start of a lease. After taking into account the
rental element of the lease, the tax rates and bands for non-residential
property transactions apply to any such payments under a lease.76
76
Tax on the premium is calculated by applying the amount payable to the tax rates and bands. The premium
would normally fall within the nil rate band, but as the average annual rent is at least £1,000 the nil rate band
does not apply. Because of this, all of the premium is taxed at the tax rate of the next band – three per cent.
£ million 2016-17 Outturn
2017-18 2018-19 2019-20 2020-21 2021-22 2022-23 2023-24
177 201* 206 214 220 226 231 238

131
Modelling approach
3.101 We have revised our methodology for forecasting non-residential LBTT
receipts. The new approach is based on data from Revenue Scotland and
Registers of Scotland and our own economic forecasts. This means that our
forecasts are now fully based on Scotland-specific determinants.
3.102 We estimate a base-year distribution which is a weighted average of the
distributions of prices and transactions from 2015-16 and 2016-17. Averaging
over two years helps reduce the impact of volatile non-residential revenue
from year-to-year. Previously we constructed the base-year forecast using a
weighted average of the in-year forecast and the previous two years of
revenues.
3.103 Statistical models drive short-term price and transactions growth forecasts.77
The growth forecasts for prices from 2019-20 onwards are the same as the
Commission’s forecasts for the GDP deflator and the transactions growth
forecast is the same as our real GDP growth projection for the Scottish
economy from 2018-19 onwards. In December 2017, we used the OBR’s UK
commercial property price and transactions growth forecasts.
3.104 An estimate of 2017-18 revenues is constructed by estimating receipts for the
remainder of the financial year, based on the proportion of revenues that have
historically fallen into this period.78
3.105 In order to produce the forecast, we apply our price and transactions growth
forecasts to our base year estimate. This provides a more granular approach
than previously used, and allows for the estimation of fiscal drag and the
production of costings in the event of a policy change.
3.106 This approach shares some similarities with the December 2017
methodology. Both approaches construct a baseline year which is grown by a
set of price and transactions growth forecasts. The main difference is that our
new model conducts the analysis at a more granular level and uses Scotland-
specific forecasts for prices and transactions.
77
The ARIMA (Auto-Regressive Integrated Moving Average) models we use are a basic type of statistical
forecasting model. For further information on ARIMA models see Box 2.1 in Scottish Fiscal Commission (2017)
Current Approach to Forecasting (link)
78 At the time of publication, the Commission has data from Revenue Scotland on an effective date basis up to
February 2017.

132
Forecast
3.107 The difference between the December 2017 forecast and the latest forecasts
results from our revised price and transaction growth forecasts, incorporating
new outturn data and methodology.
Table 3.23: Non-residential LBTT forecasts
£ million 2016-17 Outturn
2017-18 2018-19 2019-20 2020-21 2021-22 2022-23 2023-24
December 2017 177 193 190 194 200 206 212
Prices 13 18 19 19 20
Transactions -1 -2 -3 -4 -6
Modelling & base year 1 2 2 3 3
Other 2 2 2 2 1
In-year revision 7
May 2018 177 201 206 214 220 226 231 238
Total change 0 7 15 20 20 19 19
Source: Scottish Fiscal Commission, Scottish Fiscal Commission (2017) Scotland's Economic and Fiscal
Forecasts December 2017 (link), Revenue Scotland (2017) 2016-17 Annual Report (link) * In-year forecast is on an accruals basis and may not exactly match the £201 million figure published by
Revenue Scotland in its March 2018 LBTT statistical release (link). See Box 3.3 for further discussion.
Note: Numbers may not sum to totals because of rounding.
3.108 The forecast for 2017-18 receipts has increased by £7 million as a result of
higher than previously expected revenue in the second half of 2017-18. The
monthly revenue profile can be seen in Figure 3.6 below.
3.109 The main change since the December 2017 forecast stems from increased
price growth forecasts in the short-term and the introduction of a new
forecasting approach. This increase in revenues has been only partially offset
by lower forecasts for transactions.
3.110 Our forecasts from 2019-20 for transactions and 2020-21 for prices use the
Commission’s economic forecasts, rather than the UK economy forecasts
from the OBR, as in December 2017. While non-residential price growth
forecast remains constant at 1.8 per cent, the forecast for growth in real
economic activity, and hence non-residential transactions, is lower. This
reflects the downward revisions to the real GDP growth forecasts for Scotland
since December 2017.

133
Scottish Government policy
3.111 The Scottish Government has brought forward secondary legislation to allow
for Group Relief to be available where there is a transfer of properties within a
corporate group structure and there is an existing ‘Share Pledge’ relating to
the buyer. This brings the rules under LBTT in line with the rules under SDLT.
The change will apply only to future transactions. We expect this to come into
effect at the end of June, subject to parliamentary approval. We estimate that
the change could reduce LBTT revenue by £0.6 million per year. We attach a
high degree of uncertainty to the point estimate for this costing. We published
a costing note to accompany the introduction of the secondary legislation on
18 May.79
UK Government policy
3.112 The UK Government announced a change to the capital gains tax (CGT)
regime for non-UK residents selling commercial and residential property in
November 2017. As of April 2019, non-UK resident sellers of property, which
includes individuals, trusts and companies, will be liable for CGT. In line with
the OBR, we assume that the main impact is on non-residential property and
leads to a small decrease in non-residential LBTT revenues as of 2019-20.
Forecast uncertainty
3.113 The major uncertainty in forecasting non-residential LBTT revenues is the
influence of a very small number of high value transactions. The top tax band
for purchases accounted for 17 per cent of all transactions (both leases and
purchases) but 85 per cent of total non-residential LBTT raised in 2016-17.80
3.114 Figure 3.6 below highlights the monthly profile of receipts from April 2015
onwards. The difference in revenue between 2015-16 and 2016-17 is entirely
because of the absence of very high value transactions at the corporate and
financial year ends in December and March in 2016-17. As with previous
years, the second half of 2017-18 has seen the majority of revenue raised,
with 61 per cent raised between October and March. This period includes
calendar and financial year ends, which has been where the hard to predict
very high value transactions have tended to fall.
79
Scottish Fiscal Commission (2018) Supplementary Costings Non-Residential Land and Buildings Transaction
Tax Group Relief – May 2018 (link)
80 Revenue Scotland LBTT Statistics, March 2018 (link)

134
3.115 There is also uncertainty to the forecast as a result of the forthcoming change
to Group Relief. A number of submissions to the Scottish Government's
recent consultation highlighted that there was initially an industry-wide
assumption that transactions where a share pledge arrangement was in place
were eligible for Group Relief under LBTT, as they would have been under
SDLT.81
The Scottish Government is currently exploring whether the change
could be applied retrospectively. We will continue to monitor developments
and revisit our forecast as appropriate.
3.116 April 2018 was the first month for tax returns received for three year lease
reviews.82
Unless a lease has been terminated, a further LBTT return must be
submitted by the tenant at every third anniversary of the effective date of a
lease and any additional LBTT must be paid or overpaid LBTT can be
reclaimed. We will monitor data as it becomes available and revisit our
forecasts again in December accordingly.
Figure 3.6: Non-residential LBTT receipts
Source: Revenue Scotland. *Accruals-based data available up to February 2018.
81
Published responses to consultation on an amendment to Land and Buildings Transactions Tax Group Relief
(link)
82 See Revenue Scotland Guidance LBTT6014 – Three yearly review of the tax chargeable (link)
-
5
10
15
20
25
30
35
40
Apr-15 Aug-15 Dec-15 Apr-16 Aug-16 Dec-16 Apr-17 Aug-17 Dec-17
£ M
illi
on
s
2015-16 2016-17 2017-18*

135
Comparison with OBR forecasts
3.117 Our forecast for non-residential LBTT is lower than that of the OBR. The
primary reason for this is that our calculation of our base year is lower than
the respective figure estimated by the OBR. The difference comes as a result
of differing methods for calculating this figure, with the OBR using an in-year
forecast for 2017-18, while the Commission uses an uplifted average of
distributional data from 2015-16 and 2016-17.
Table 3.24: Comparison of OBR and Commission forecasts
Source: Scottish Fiscal Commission, OBR (2018) Devolved Tax and Spending Forecasts March 2018 (link).
*Accrual basis outturn (link) ** 2017-18 in-year forecast is on an accruals basis and may not exactly match the £201 million figure published by
Revenue Scotland in its March 2018 LBTT statistical release (link). See Box 3.3 for further discussion.
Figures may not sum because of rounding.
3.118 There is also a difference in forecasts stemming from our higher short-term
non-residential property price growth forecast. This is in part down to the fact
that we project Scotland-specific prices, as opposed to the OBR using a
forecast for the UK as a whole. Further, we use a statistical model to produce
our short-term forecast, whereas the OBR does not. Our transactions growth
forecasts are lower relative to the OBR’s, owing to differences in the
respective forecasts for the Scottish and UK economies.
Comparison with BGA forecasts
3.119 The OBR published updated forecasts of UK Government receipts at the UK
Government’s Spring Statement 2018. These forecasts have been used to
produce indicative updates of the Scottish Government’s block grant
adjustments. The adjustments are updated and applied to the Scottish
Government’s block grant at the Autumn Budget 2017.
£ million 2016-17
Outturn*
2017-18 2018-19 2019-20 2020-21 2021-22 2022-23
SFC May 2018** 177 201 206 214 220 226 231
OBR March 2018 177 208 210 216 222 229 230
Difference -8 -4 -2 -2 -3 1
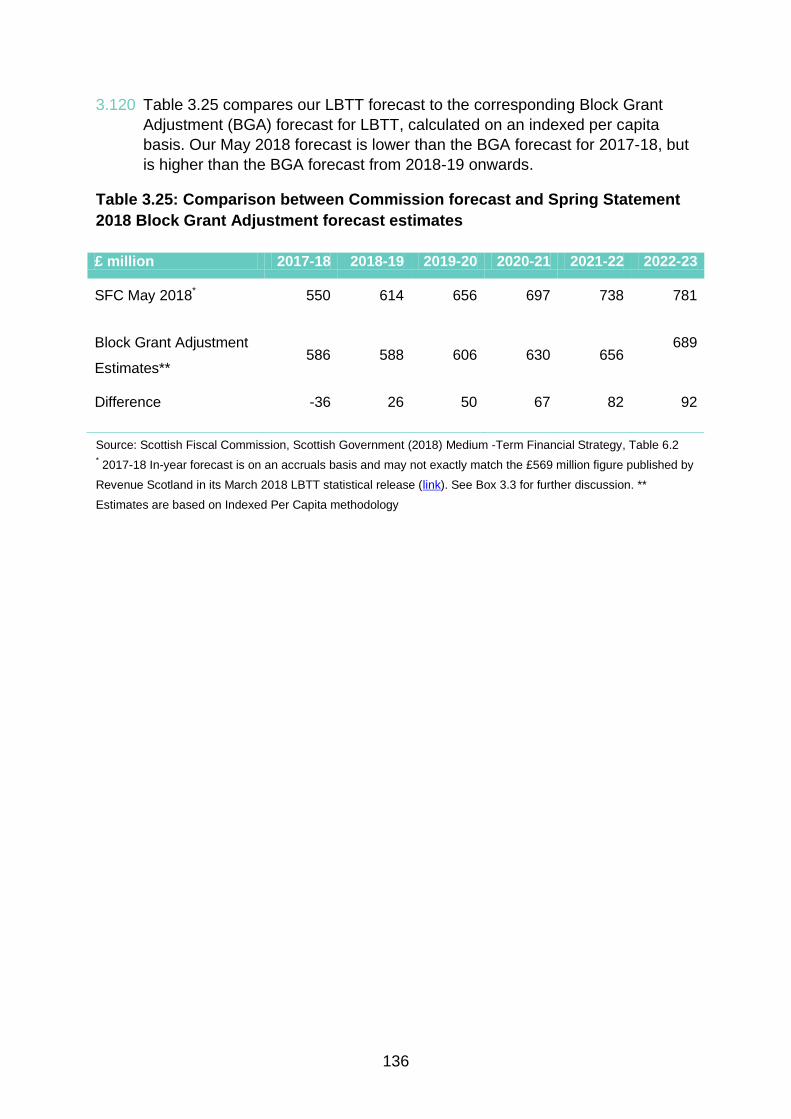
136
3.120 Table 3.25 compares our LBTT forecast to the corresponding Block Grant
Adjustment (BGA) forecast for LBTT, calculated on an indexed per capita
basis. Our May 2018 forecast is lower than the BGA forecast for 2017-18, but
is higher than the BGA forecast from 2018-19 onwards.
Table 3.25: Comparison between Commission forecast and Spring Statement
2018 Block Grant Adjustment forecast estimates
Source: Scottish Fiscal Commission, Scottish Government (2018) Medium -Term Financial Strategy, Table 6.2
* 2017-18 In-year forecast is on an accruals basis and may not exactly match the £569 million figure published by
Revenue Scotland in its March 2018 LBTT statistical release (link). See Box 3.3 for further discussion. **
Estimates are based on Indexed Per Capita methodology
£ million 2017-18 2018-19 2019-20 2020-21 2021-22 2022-23
SFC May 2018* 550 614 656 697 738 781
Block Grant Adjustment
Estimates** 586 588 606 630 656
689
Difference -36 26 50 67 82 92

137
Air Passenger Duty
Table 3.26: Forecast of Scottish APD
£ million 2016-17* 2017-18 2018-19 2019-20 2020-21 2021-22 2022-23 2023-24
257 277 285 292 301 311 322 335
Source: Scottish Fiscal Commission
Figure for Air Passenger Duty is not classed as outturn data. It is an estimate of the Scottish share of tax receipts.
3.121 Air Departure Tax (ADT) was due to replace UK Air Passenger Duty (APD) in
Scotland from April 2018. The introduction of ADT in Scotland has been
deferred until the issue raised in relation to the Highlands and Islands
exemption has been resolved.83
We have therefore forecast APD paid in
Scotland.
3.122 APD is a tax paid on passengers departing from UK airports. Passengers
departing the Highlands and Islands airports are exempt.84
The amount of tax
paid depends on the passenger’s class of travel and their final destination.
Under APD, destinations fall into two bands based on flight distance from
London. The higher band applies to countries whose capital city is further than
2,000 miles from London. As APD applies to the final destination, connecting
flights are exempt. There are a number of other exemptions to APD, such as
passengers under the age of 16 travelling in the lowest class.
3.123 The class of travel determines the rate of APD paid. The reduced rate applies
where passengers are travelling in the lowest class available. The standard
rate applies to passengers travelling in any other class of travel and the higher
rate applies to private jets.
Forecast of Scottish APD
3.124 APD tax forms are returned on a company-by-company basis, with one tax
return for all their business in the UK. There are therefore no historic data on
APD receipts or passengers paying APD in Scotland. The Civil Aviation
Authority (CAA) airport data provide total passenger numbers for all Scottish
airports on a monthly basis from January 1997 onwards.85
3.125 The data represent all passengers travelling and not all passengers paying
APD. It does not provide information on the band or class of travel. The CAA
83
Letter from Cabinet Secretary for Finance and Constitution to the Convener of the Finance and Constitution
committee 22 November 2017 (link)
84 HMRC (2017) Excise Notice 550: Air Passenger Duty (link)
85 Civil Aviation Authority (2017) UK Airport Data (link)

138
departing passenger survey is used to estimate the number of passengers
exempt from the tax and to calculate the tax paid by the remaining
passengers. The survey runs every year interviewing passengers departing
certain UK airports. The survey covered Scottish airports in 2005, 2009, 2013
and 2015-16. The next survey of Scottish airports is taking place in 2018.
3.126 Our approach to estimating the Scottish share of APD is consistent with the
methodology used by the Scottish Government in Government Expenditure
and Revenue Scotland (GERS) publication.86
Methodology
3.127 Scottish APD revenue forecasts are based on the relationship between total
passenger numbers departing the major Scottish airports and UK GDP.87
Our
model uses the OBR forecast of percentage growth in UK GDP to estimate
the percentage growth in passenger numbers.88
We estimate a one per cent
increase in UK GDP increases Scottish passengers by 1.5 per cent.
3.128 The forecast of total passenger numbers is then allocated into bands and
class of travel using the CAA departing passenger survey.89
This is then
multiplied by the appropriate tax rate to produce a forecast for Scottish APD.90
3.129 The historic data and statistical evaluations suggest UK GDP explains
movements in Scottish passenger numbers better than Scottish GDP. A
reason for UK GDP performing better could be that a significant proportion of
ADT taxpayers will not be resident in Scotland. Analysis on the 2013 CAA
survey shows that approximately 40 per cent of passengers departing Scottish
airports are not resident in Scotland. This means that their decision to fly
would be largely unaffected by Scottish economic conditions and could to a
greater extent depend on UK-wide economic conditions.
3.130 The past four years have seen strong growth in Scottish passenger numbers
at a time when Scottish GDP growth has been relatively low. This could
explain why UK GDP appears to be better correlated with Scottish passenger
growth. In the future, we will continue to monitor the appropriateness of this
86
Scottish Government (2017) Government Expenditure & Revenue Scotland 2016-17 (link)
87 The airports covered are Aberdeen, Edinburgh Glasgow and Prestwick. Dundee is not included, as it has a low
volume of flights for primarily non-APD liable routes.
88 Real (inflation adjusted) GDP
89 The CAA Surveys used are the 2009, 2013 and 2015-16 surveys, Prestwick is only surveyed in 2009 and
2015-16 survey only covers Edinburgh and Glasgow.
90 For further information, see Scottish Fiscal Commission (2017) Current Approach to Forecasting (link)

139
method and explore whether the relationship between passenger numbers
and Scottish/UK GDP growth is changing over time.
Forecast
3.131 Table 3.27 shows how our forecast of Scottish APD has changed since
December 2017. This forecast includes the UK Government policy announced
at Autumn Budget 2017 to freeze the Band B reduced rate and increase the
Band B standard rate in 2019-20.91
Table 3.27: Changes in APD forecasts
Source: Scottish Fiscal Commission. Note: Figures may not sum to totals because of rounding
3.132 The methodology updates include the slight changing of our forecasting
approach to model total departing passengers from Scotland rather than
estimated APD liable passengers. It also includes a correction to how the Q3
data from 2017 was incorporated by the model.92
91
HM Treasury (2017) Autumn Budget 2017: policy costings (link)
92 Our forecast model in December contained an error in the incorporation of Q3 2017 data. This did not
significantly affect our forecast and did not have budgetary implications. The response aligns with the
categorisation of such an error as described by the Commission’s voluntary compliance with best practice set out
in the Office for Statistics Regulation’s Code of Practice for Statistics (link)
£ million 2016-17 2017-18 2018-19 2019-20 2020-21 2021-22 2022-23 2023-24
December 2017 264 292 306 314 324 336 348
Methodology
changes
0 -3 -8 -9 -9 -10 -11
Data updates 0 -4 -5 -5 -5 -6 -6
Updated child
exemption
-7 -8 -8 -8 -8 -9 -9
May 2018 257 277 285 292 301 311 322 335
Total change -7 -15 -21 -22 -23 -25 -26

140
3.133 The data updates include passenger number data up to March 2018 and OBR
determinants for GDP growth and inflation from Spring Statement 2018.93
3.134 We have also updated the estimate for the child exemption because of
recently published data from HMRC.94
This information was not available in
December 2017 and the new estimate revised up the cost of the exemption
from two per cent of APD revenues to five per cent.
Uncertainties
3.135 There are a number of uncertainties around the forecast of Scottish APD. One
of the major uncertainties is the lack of historic data on APD receipts in
Scotland. The estimate is based on a combination of administrative and
survey data. The Commission has undertaken a significant programme of
work to explore available data and determine the most appropriate method for
estimating Scottish APD. The accuracy of the estimate will only be known
once the tax is devolved and separately collected for Scotland.
3.136 Another uncertainty is the use of UK GDP to forecast Scottish passenger
numbers. If the effect of GDP growth on passenger numbers is different in
future years compared to the historical data, this will affect the accuracy of the
forecast. Any difference between the OBR’s GDP forecast and outturn GDP
could lead to an error in the forecast. Thirdly, changes in the OBR’s forecast
of RPI could change the tax rates for Band B flights affecting our forecast.
This uncertainty is reduced as the APD bands up to 2019-20 are already set.
3.137 Finally, the Scottish Government has committed to cutting the overall burden
of APD by 50 per cent.95 The introduction of ADT has been delayed as a
result of complications around the Highlands and Islands exemption. We will
include Scottish Government policy in the forecast when sufficient detail on
the introduction of ADT and any changes to tax rates is made available.
93
Growth in passenger numbers over the year to the end of the first calendar quarter of 2018 was weaker than in
recent years. This may have been because of the poor weather experienced in Scotland at the start of March. We
have excluded this quarter from the forecast model at present and will continue to monitor trends in outturn data
over the summer.
94 HMRC (2018) Principal tax reliefs (link)
95 Scottish Government (2017) Programme for Scotland 2017-18 (link)

141
Comparison to OBR forecast
Table 3.28: Comparison with OBR forecasts of Scottish APD
Source: Scottish Fiscal Commission; OBR (2018) Devolved Tax and Spending Forecast March 2018 (link)
Figures may not sum to totals because of rounding
3.138 The differences in the estimate of receipts in 2016-17 as the baseline for the
forecasts remains the main case of differences between the OBR and
Commission forecasts. Furthermore as a result of the downwards revision to
the Commission’s APD forecast, the annual differences between Commission
and OBR forecasts have increased. The percentage growth over the forecast
horizon (2016-17 to 2022-23) for the two sources is very similar
(approximately 25 per cent). This is because both methodologies use the
OBR’s forecasts of UK GDP growth to project passenger numbers.
3.139 The OBR takes the share of APD revenue raised in Scotland as the mid-point
between 2015-16 and 2016-17 average estimates presented by HMRC (8.9
and 9.6 per cent) and the Scottish Government (8.0 and 8.3 per cent). This
gives a figure of 8.7 per cent; the share is then applied to the UK forecast. Our
forecast uses the 2016-17 estimate of Scottish APD receipts produced by the
Scottish Government with an adjustment for revised data on the child
exemption, as it is consistent with our approach.
3.140 The main difference in methodologies is the survey used to allocate
passengers into bands of travel. HMRC use the International Passenger
Survey (IPS), which may underestimate the share of Band A passengers in
Scotland and the rest of the UK. The Commission uses the CAA Passenger
Survey, which includes domestic travel and is therefore less likely to
overestimate the share of Band B passengers. However, the CAA surveys are
less timely than the IPS.96
The CAA are undertaking a survey of Scottish
airports throughout 2018 and we will work closely with the OBR to review our
methodology, with a view to making further improvements to our estimates of
the Scottish share of APD.
96
Most recent CAA surveys by airport: Glasgow and Edinburgh 2015-16, Aberdeen 2013 & Prestwick 2009.
Travel trends 2016 using IPS data covering Scottish Airports was last released by ONS in May 2017 (link)
£ million 2016-17 2017-18 2018-19 2019-20 2020-21 2021-22 2022-23
SFC May
2018 257 277 285 292 301 311 322
OBR March
2018 282 295 307 319 331 342 355
Difference -25 -18 -22 -27 -29 -31 -33
142
3.141 There are other smaller differences in the approaches such as, how exempt
passengers are calculated and the proportion of passengers travelling in the
reduced rate and standard rate of travel.

143
Scottish Landfill Tax
Table 3.29: Forecast of Scottish Landfill Tax
£ million 2016-17
Outturn
2017-18 2018-19 2019-20 2020-21 2021-22 2022-23 2023-24
148 142 114 93 95 87 87 88
Source: Scottish Fiscal Commission
Background
3.142 Scottish Landfill Tax (SLfT) is a tax on the disposal of waste to landfill, with
the amount of tax payable determined by the weight of waste being disposed
of on the basis of two rates. In 2018-19 the standard rate of tax has been set
at £88.95 per tonne, with a lower rate of £2.80 per tonne for certain inert
materials such as rocks and soils.
3.143 SLfT is an environmental tax, aimed at reducing the amount of waste
landfilled and the associated environmental damage. Since 2005 landfill
volumes have fallen consistently, although recently there is evidence that this
reduction has begun to stall in Scotland.
Figure 3.7: Mixed Waste Landfilled in Scotland
Source: SEPA Waste Landfilled in Scotland 2016 (link)
Note: Mixed waste constitutes two SEPA reporting categories: ‘household and similar wastes’ and ‘sorting
residues’, and is used here as a proxy for standard rated waste.
3.144 Despite the apparent slowing of this trend, the Commission is forecasting
significant reductions in the amount of waste landfilled over the next five
years, with planned increases in the capacity of incineration facilities expected
0
500,000
1,000,000
1,500,000
2,000,000
2,500,000
3,000,000
3,500,000
4,000,000
2005 2006 2007 2008 2009 2010 2011 2012 2013 2014 2015 2016
To
nn
es

144
to divert waste away from landfill. This alternative treatment to landfill across
Scotland is in part a reaction to the increasing cost of the tax on disposal via
landfill. It also indicates that local authorities and waste management
companies are beginning to plan ahead in response to the changing
regulatory landscape and the ban on the landfill of biodegradable municipal
waste from 2021.97
Description of modelling approach
3.145 Our model uses available outturn data from Revenue Scotland for 2017-18 on
the amount of standard and lower rate waste being landfilled. Data from the
first three quarters are scaled up to the full year using the average proportion
of annual landfilled waste that has historically been in these quarters. This is
then projected forward over the entire forecast period, with adjustments made
to reflect anticipated changes to waste generation and household recycling
rates. Our current forecast assumes that waste generation remains largely flat
over the forecast because of the current weak economic outlook, with
household recycling continuing to grow in line with the trend rate of growth
observed since 2009 of roughly one per cent annually.
3.146 Final adjustments are then made to this baseline to account for anticipated
increases in the capacity of incineration facilities across Scotland that can be
expected to divert standard rate waste away from landfill. The Commission
has worked with experts within the Scottish Environment Protection Agency
(SEPA) to ensure these projections of future incinerator capacity are up-to-
date and as far as possible reflect the likely timescales for these facilities
coming on line. This aspect of the forecast will continue to be reviewed and
updated regularly, given the uncertainties involved with the precise start dates
for these facilities.
Table 3.30: Impact of increasing incineration capacity on SLfT revenue
£ million 2017-18 2018-19 2019-20 2020-21 2021-22 2022-23 2023-24
Reduction in SLfT
revenue 0 -32 -56 -58 -69 -73 -75
Source: Scottish Fiscal Commission
3.147 After accounting for changes to waste generation, recycling and incineration in
the baseline, a forecast of revenue is made by applying the relevant tax rate
to the forecasted amount of landfilled waste. The current policy assumption is
that the tax rates are matched to those announced by the UK Government,
and then in subsequent years uprated in line with the latest OBR forecast of
97
See, The Waste (Scotland) Regulations 2012, Regulation 4 (link)

145
RPI.98
The maximum contributions allowed to the Scottish Landfill
Communities Fund are then netted off this total to arrive at a final forecast of
revenue.
Description of Scottish policy changes
3.148 The Scottish Government has legislated for a ban on the landfilling of
biodegradable municipal waste (BMW) from 2021 onwards, with the ban being
written into permits issued by SEPA to landfill sites allowing them to operate.99
This will require significant volumes of waste to be diverted to alternative
management options, which will particularly affect local authorities who
manage large amounts of biodegradable municipal waste through the kerb-
side collection of black-bag waste.
3.149 Exactly how and when this diversion away from landfill will be achieved is still
subject to some uncertainty. The projected rise in incineration capacity will
significantly reduce the amount of waste landfilled in the future, but there is
still a shortfall between our current projection of incinerator capacity and our
best estimate of the amount of waste needing to be diverted from landfill as a
result of the ban. Other management options such as increased recycling,
exporting waste to Europe as refuse derived fuel, or landfilling in England may
contribute to this diversion but there is currently little evidence as to how and
when additional waste will start to be diverted to these in the lead up to the
ban.
3.150 The Commission will continue to work with the Scottish Government and
SEPA to establish the evidence base for how and when waste can be
expected to be diverted from landfill in the lead up to 2021, and the profile of
waste landfilled after the ban is implemented. Once a suitable evidence base
has been established this will then be included in our future forecasts of SLfT
revenue.
Forecast
3.151 The Commission’s forecast of SLfT is shown in the table below, along with
how the forecast has developed since our December 2017 forecast.
Table 3.31: Changes in Scottish Landfill Tax forecasts
98
OBR (2018) Economic and Fiscal Outlook March 2018 (link)
99 SEPA published guidance (May 2018) on the BMW ban to help stakeholders understand what BMW is, why it
will be banned and how the ban will be implemented (link)

146
£ million 2016-17
Outturn
2017-18 2018-19 2019-20 2020-21 2021-22 2022-23 2023-24
December 2017 148 137 106 88 90 82 82
Data updates 4 4 4 5 5 5
Incinerator capacity
update
1 4 0 0 0 0
May 2018 148 142 114 93 95 87 87 88
Total change 5 8 4 5 5 5
Source: Scottish Fiscal Commission. Figures may not sum to totals because of rounding.
3.152 The main change to the forecast has been the inclusion of the most recent
published data from Revenue Scotland (2017-18 Q2 and 2017-18 Q3). This
has raised the forecast by approximately £4 million in each year. An update to
economic determinants which affect the level of waste generated in our model
account for the remainder of the data updates. Notification of a delay to the
full rate operation of the first site to increase incineration capacity has resulted
in a further increase to revenue in 2017-18 of £0.9 million and in 2018-19 of
£3.7 million.
Forecast Uncertainty
3.153 The largest factor driving the forecast is the timing and size of additional
incineration capacity. While we have engaged with SEPA to ensure
projections of capacity reflect intelligence available at the time, these are large
complex construction projects that can encounter significant delays for a
variety of reasons. Delays in the construction of the first site due for
completion in our model has already resulted in diversion from landfill being
lower in 2017-18 and 2018-19 than would have otherwise been the case. The
table below demonstrates the potential impact on the forecast of a twelve
month delay to each of the incineration facilities included in our model coming
on-line.

147
Table 3.32: Impact of delays on forecast
£ million 2017-18 2018-19 2019-20 2020-21 2021-22 2022-23 2023-24
Central Revenue 142 114 93 95 87 87 88
Twelve Month
Delay 142 145 114 95 97 89 91
Difference 0 31 21 0 9 3 3
Source: Scottish Fiscal Commission. Figures may not sum to totals because of rounding
3.154 Other factors that could divert waste from landfill but are not currently
incorporated in the forecast, such as the export of refuse derived fuel (RDF),
represent another source of uncertainty. While evidence currently available
suggests this market has a significantly smaller effect in diverting waste from
landfill than incineration, it has grown in recent years and may have the
potential to grow or decline rapidly in response to short-term market
conditions. For local authorities without access to an incineration facility, it
represents one option to meet their obligations under the biodegradable
municipal waste landfill ban, suggesting it may experience further growth. In
future forecasts the Commission will look to build the evidence base for the
current RDF market in Scotland and potentially include a projection of RDF
exports within the forecast.
3.155 Restrictions placed upon imported recyclable materials by the Chinese
Government may also have an impact on our forecast. The recycling industry
has been forced to respond to this by identifying new international markets to
manage waste currently exported to China. While landfilling and incineration
of separately collected recyclable material is currently banned in Scotland, if
the decision by the Chinese Government results in certain recycling
collections no longer being profitable it could result in greater volumes of
mixed waste being landfilled.100
Our current forecast makes no adjustment for
the potential impact of this on tax revenues, but we will continue to monitor
this situation as the response from industry to this development becomes
clearer.
3.156 We know from HMRC tax gap estimates that there can be a difference
between the amount of tax that should, in theory, be collected by HMRC, and
what is actually collected.101
Such gaps can arise for a number of reasons
including simple errors and compliance issues such as avoidance and
100
A ban on material collected separately for recycling being landfilled or incinerated was introduced from 2014
as a consequence of the Waste (Scotland) Regulations 2012 (link)
101 HMRC (2017) Measuring tax gaps: Tax gap estimates for 2015-16 (link)
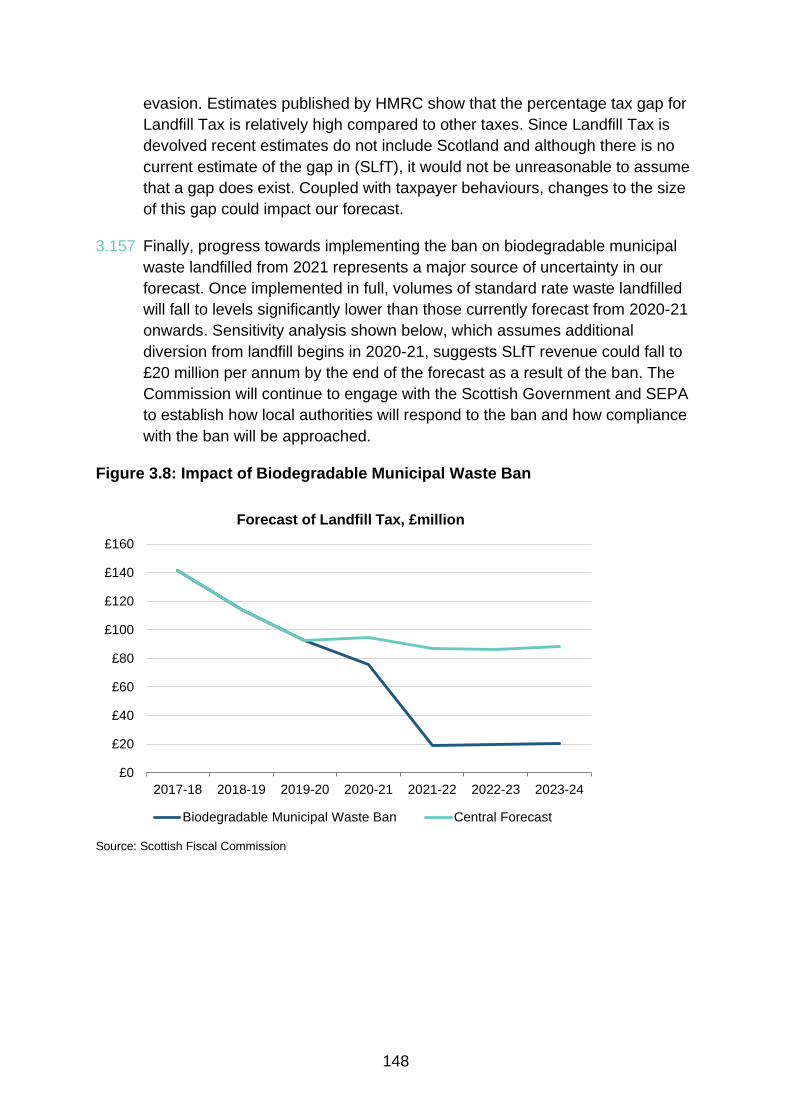
148
evasion. Estimates published by HMRC show that the percentage tax gap for
Landfill Tax is relatively high compared to other taxes. Since Landfill Tax is
devolved recent estimates do not include Scotland and although there is no
current estimate of the gap in (SLfT), it would not be unreasonable to assume
that a gap does exist. Coupled with taxpayer behaviours, changes to the size
of this gap could impact our forecast.
3.157 Finally, progress towards implementing the ban on biodegradable municipal
waste landfilled from 2021 represents a major source of uncertainty in our
forecast. Once implemented in full, volumes of standard rate waste landfilled
will fall to levels significantly lower than those currently forecast from 2020-21
onwards. Sensitivity analysis shown below, which assumes additional
diversion from landfill begins in 2020-21, suggests SLfT revenue could fall to
£20 million per annum by the end of the forecast as a result of the ban. The
Commission will continue to engage with the Scottish Government and SEPA
to establish how local authorities will respond to the ban and how compliance
with the ban will be approached.
Figure 3.8: Impact of Biodegradable Municipal Waste Ban
Source: Scottish Fiscal Commission
£0
£20
£40
£60
£80
£100
£120
£140
£160
2017-18 2018-19 2019-20 2020-21 2021-22 2022-23 2023-24
Forecast of Landfill Tax, £million
Biodegradable Municipal Waste Ban Central Forecast
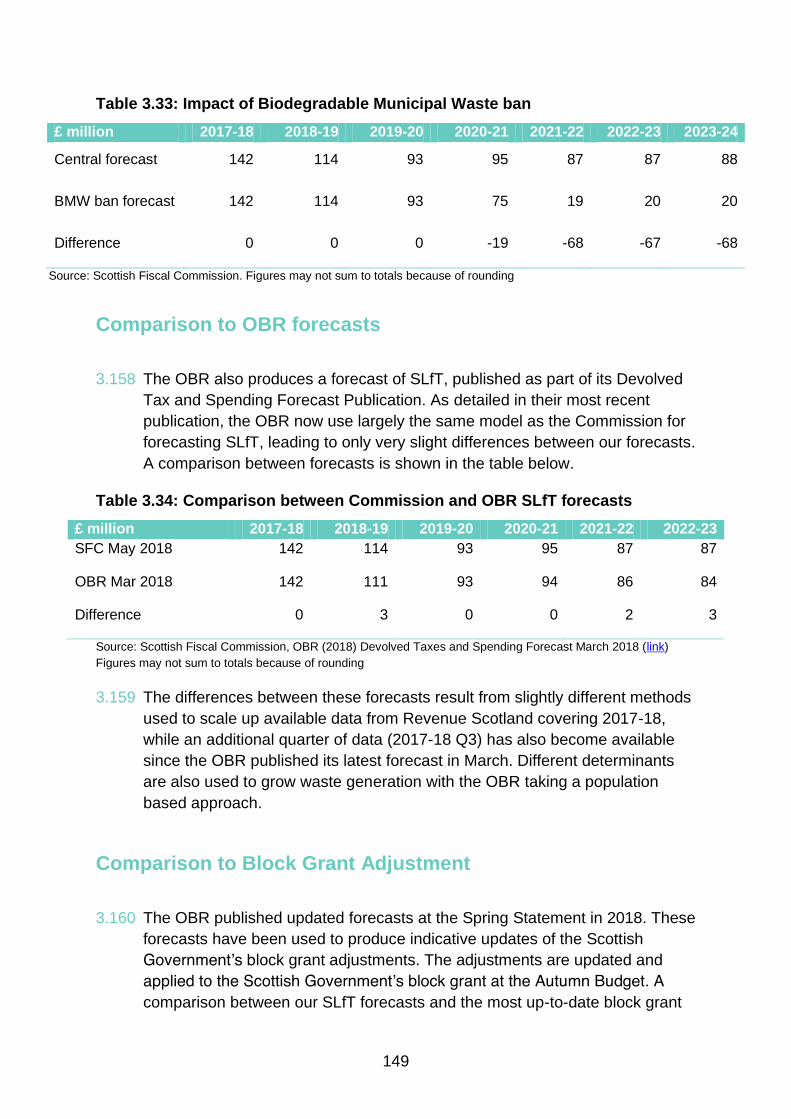
149
Table 3.33: Impact of Biodegradable Municipal Waste ban
£ million 2017-18 2018-19 2019-20 2020-21 2021-22 2022-23 2023-24
Central forecast 142 114 93 95 87 87 88
BMW ban forecast 142 114 93 75 19 20 20
Difference 0 0 0 -19 -68 -67 -68
Source: Scottish Fiscal Commission. Figures may not sum to totals because of rounding
Comparison to OBR forecasts
3.158 The OBR also produces a forecast of SLfT, published as part of its Devolved
Tax and Spending Forecast Publication. As detailed in their most recent
publication, the OBR now use largely the same model as the Commission for
forecasting SLfT, leading to only very slight differences between our forecasts.
A comparison between forecasts is shown in the table below.
Table 3.34: Comparison between Commission and OBR SLfT forecasts
£ million 2017-18 2018-19 2019-20 2020-21 2021-22 2022-23
SFC May 2018 142 114 93 95 87 87
OBR Mar 2018 142 111 93 94 86 84
Difference 0 3 0 0 2 3
Source: Scottish Fiscal Commission, OBR (2018) Devolved Taxes and Spending Forecast March 2018 (link)
Figures may not sum to totals because of rounding
3.159 The differences between these forecasts result from slightly different methods
used to scale up available data from Revenue Scotland covering 2017-18,
while an additional quarter of data (2017-18 Q3) has also become available
since the OBR published its latest forecast in March. Different determinants
are also used to grow waste generation with the OBR taking a population
based approach.
Comparison to Block Grant Adjustment
3.160 The OBR published updated forecasts at the Spring Statement in 2018. These
forecasts have been used to produce indicative updates of the Scottish
Government’s block grant adjustments. The adjustments are updated and
applied to the Scottish Government’s block grant at the Autumn Budget. A
comparison between our SLfT forecasts and the most up-to-date block grant

150
adjustment estimates following the UK Government Spring Statement (13
March 2018) is shown in the table below.
Table 3.35: Comparison between Commission forecast and Spring
Statement 2018 Block Grant Adjustment forecast estimates
£ million 2017-18 2018-19 2019-20 2020-21 2021-22 2022-23
SFC May 2018 142 114 93 95 87 87
Block Grant Adjustment
Estimates*
104 106 91 81 77 71
Difference 38 8 2 14 10 16
Source: Scottish Fiscal Commission, Scottish Government (2018) Medium Term Financial Strategy, Table 6.2
* Estimates are based on Indexed Per Capita methodology.

151
Chapter 4 Social Security
Introduction
4.1 The Commission is responsible for producing forecasts of devolved social
security expenditure in Scotland. In accordance with our regulations, we have
produced forecasts for a variety of areas including the main benefits devolved
under the Scotland Act 2016, the Scottish Welfare Fund and the new
employability services. The Social Security (Scotland) Bill provides for the
devolution of benefits covered by the Scotland Act 2016.102
The dates for
devolution are still to be agreed between the Scottish and UK Governments.
As further benefits are devolved in the future, we will produce independent
forecasts of expenditure on these areas.
4.2 The Scottish Government’s intention is to use secondary legislation to set out
detailed rules relating to eligibility criteria and rates of payment for the
devolved benefits. To support the Scottish Parliament and the public in
understanding and scrutinising the Scottish Government’s policy, we may
choose to produce a forecast of expenditure when secondary legislation for
social security benefits is published in the Scottish Parliament. We have
updated our protocol with the Scottish Government to provide further detail of
the process we would follow if we choose to produce forecasts to accompany
secondary legislation.103 Over the next year, we expect secondary legislation
to be published for Funeral Expense Assistance, Best Start Foods and Best
Start Grant.
4.3 Our expenditure forecasts are summarised in Table 4.1. These cover benefits
already devolved and a number of benefits the Scottish Government has
committed to devolving by summer 2019. Box 4.1 sets out the areas we are
forecasting and the basis for our forecasts.
102
Social Security (Scotland) Bill (2018) [as passed] (link)
103 Protocol for engagement between the Scottish Fiscal Commission and the Scottish Government (link)

152
Table 4.1: Summary of social security forecasts
£ million 2016-17 2017-18 2018-19 2019-20 2020-21 2021-22 2022-23 2023-24
Outturn
Carer’s Allowance
(CA) 234 248 267 285 303 318 334 349
CA Supplement
35 37 40 42 44 46
Discretionary
Housing Payments 50 60 61 63 65 66 67 69
Scottish Welfare
Fund 33 33 33 33 33 33 33 33
Employability
Services
11 20 19 28 22 9 0
Fair Start Scotland
0 16 19 28 22 9 0
Work Able Scotland
3 0 0 0 0 0 0
Work First Scotland
9 4 0 0 0 0 0
Funeral Expenses
Payment 5 5 5 5 5 5 5 5
Healthy Start
Vouchers 5 4 4 4 4 4 4 3
Sure Start Maternity
Grant 3 3 3 3 3 3 3 3
Total social security 330 364 428 450 480 493 498 508 Source: Scottish Fiscal Commission, DWP Benefit Expenditure by Country and Region 2016-17 (link), Scottish
Government Discretionary Housing Payments Statistics (link), Scottish Government Scottish Welfare Fund
Statistics (link), DWP unpublished data, Department of Health unpublished management information. Figures
may not sum to totals because of rounding.
4.4 Our forecast for total social security expenditure has increased in most years
compared to our December 2017 publication. The increase in expenditure is
largely driven by changes to the model used to forecast Carer’s Allowance
(CA) expenditure and a policy change to uprate the CA Supplement in line
with inflation. We have also redistributed the spending for Fair Start Scotland
(FSS) towards the later forecast years, although total FSS expenditure over
the five year period is unchanged.
4.5 Table 4.2 details the change in total forecast expenditure for social security
since our December 2017 publication. We provide a breakdown of the change
in forecast expenditure for each of the benefits, where applicable, in the
relevant sections of this chapter.

153
Table 4.2: Change in total social security forecast expenditure
£ million 2017-18 2018-19 2019-20 2020-21 2021-22 2022-23 2023-24
December 2017 362 430 448 465 471 470
Total Change 2 -3 3 15 22 28
May 2018 364 428 450 480 493 498 508
Source: Scottish Fiscal Commission, Scottish Fiscal Commission (2017) Scotland's Economic and Fiscal
Forecasts December 2017 (link). Figures may not sum because of rounding.
Box 4.1: Devolved social security expenditure
We are required to forecast devolved social security expenditure and we also
forecast expenditure for some benefits not yet devolved which we consider
relevant to the Scottish Government’s Budget. Our forecasts cover:
social security expenditure already devolved to the Scottish Parliament
reserved benefits where the Scottish Government has announced plans for
devolution
newly created benefits
Our forecasts cover expenditure on the benefits or programmes but do not cover
the associated administrative costs, which are determined by the Scottish
Government.
Devolved social security: This is expenditure devolved to Scotland and included
in the Scottish Government’s 2018-19 Budget. Since this expenditure is already
devolved, we only consider Scottish Government policy in our forecasts. The
devolved expenditure we forecast and the dates of devolution are as follows:
Scottish Welfare Fund (April 2013)
Employability Services (April 2017)
Discretionary Housing Payments (April 2017)
Reserved social security: We forecast expenditure for a number of benefits which
are currently reserved but where the Scottish Government has announced plans
for devolution. As we have not received specific policy details, or dates for
devolution, we forecast these benefits based on existing UK Government policy.
These include:
Carer’s Allowance (by summer 2018, to be initially administered by DWP)
Funeral Expenses Payment (by summer 2019)

154
Sure Start Maternity Grant (by summer 2019)
Healthy Start Vouchers104
(by summer 2019)
As the Scottish Government announces plans for devolution of other benefits we
will incorporate these into our forecasts.105
Newly created benefits: These are benefits created by the Scottish Parliament
under the powers in the Scotland Act 2016. When producing these forecasts, we
only consider Scottish Government policy. Currently the only newly created benefit
we forecast is the Carer’s Allowance Supplement. The Social Security (Scotland)
Bill includes a temporary provision to pay a Carer’s Allowance Supplement to
qualifying individuals on a twice yearly basis.106 The Scottish Government’s
intention is that the supplement will start being delivered at the earliest opportunity
and payments will be backdated to April 2018.107
We will provide policy costings for new benefits such as the Young Carer Grant
(from autumn 2019) when secondary legislation is published in the Scottish
Parliament.108
4.6 The approach taken to forecast expenditure varies by benefit and has
developed since our December 2017 forecasts. We have largely brought the
production of forecasts in house and the Commission has reviewed and
developed the models initially created by analysts in the Scottish Government.
Our forecasts of expenditure on the employability programmes remain the one
area where we rely on Scottish Government analysts to produce the forecasts
under the guidance of the Commissioners and our staff. This will be brought
into the Commission over the summer.
4.7 We have made relatively minor adjustments to the majority of our models. The
one area of significant development work has been our Carer’s Allowance
(CA) model. We now forecast the total number of individuals expected to
receive CA payments, this is often referred to as a 'stock' model. Previously
we forecasted the number of new claimants flowing on to the benefit (inflow)
and the number of claimants leaving the benefit (outflow) and then
104
Despite Healthy Start Vouchers being reserved, they are currently funded from the Scottish Government
budget. This structure is an anomaly and not replicated in any other benefits.
105 The benefits to be devolved are: Attendance Allowance, Disability Living Allowance, Personal Independence
Payment, Industrial Injuries Disablement Benefit, Severe Disablement Allowance, Cold Weather Payment and
Winter Fuel Payment.
106 Social Security (Scotland) Bill (2018) [as passed] (link)
107 Scottish Government (2017) Support for carers: social security position paper (link)
108 Scottish Government (2017) Support for carers: social security position paper (link)

155
aggregated the flows to produce our forecast. This is often referred to as a
'flow' model. Our new approach better aligns to the data publically available
from DWP as flow data are not currently available. We will continue to review
and monitor all our forecast models, refining them as more information
become available.
4.8 In the following sections, each area of social security will be examined in turn.
The sections will describe our approach to forecasting, impacts of any policy
changes, forecast uncertainties and for Carer’s Allowance, provide a
comparison to the OBR’s expenditure forecast published in March 2018.
4.9 For future publications, we will also look to include comparisons of our
forecast expenditure against the block grant adjustments (BGA) for devolved
social security payments. There will be an initial baseline addition to the block
grant for devolved social security payments when the reserved benefit is
devolved. This will be equivalent to forecast expenditure in Scotland the year
prior to devolution, and then reconciled to actual spend in the following
financial year. This amount will then be indexed in future years based on the
OBR’s forecasts and final expenditure by the UK Government in the rest of
the UK. The approach is set out in the fiscal framework agreement between
the Scottish Government and the UK Government.109
4.10 Information on the BGA for devolved social security payments is not currently
available as the dates for devolution for the benefits which will have an
associated BGA have not been finalised. As this information becomes
available, we will compare the block grant adjustments with our forecasts of
expenditure. For further information on how the Scottish Budget is
determined, please refer to Box 1.2.
4.11 Forecasts of social security expenditure face a number of uncertainties. While
the specific risks to each forecast are discussed in the relevant section, we set
out some of the common areas of uncertainty for our social security forecasts
in Box 4.2.
109
The Agreement Between the Scottish Government and the United Kingdom Government on the Scottish
Government's fiscal framework (link). Note there is a different approach for Cold Weather Payments where the
baseline addition will be an average value over a time period rather than solely the year prior to devolution.
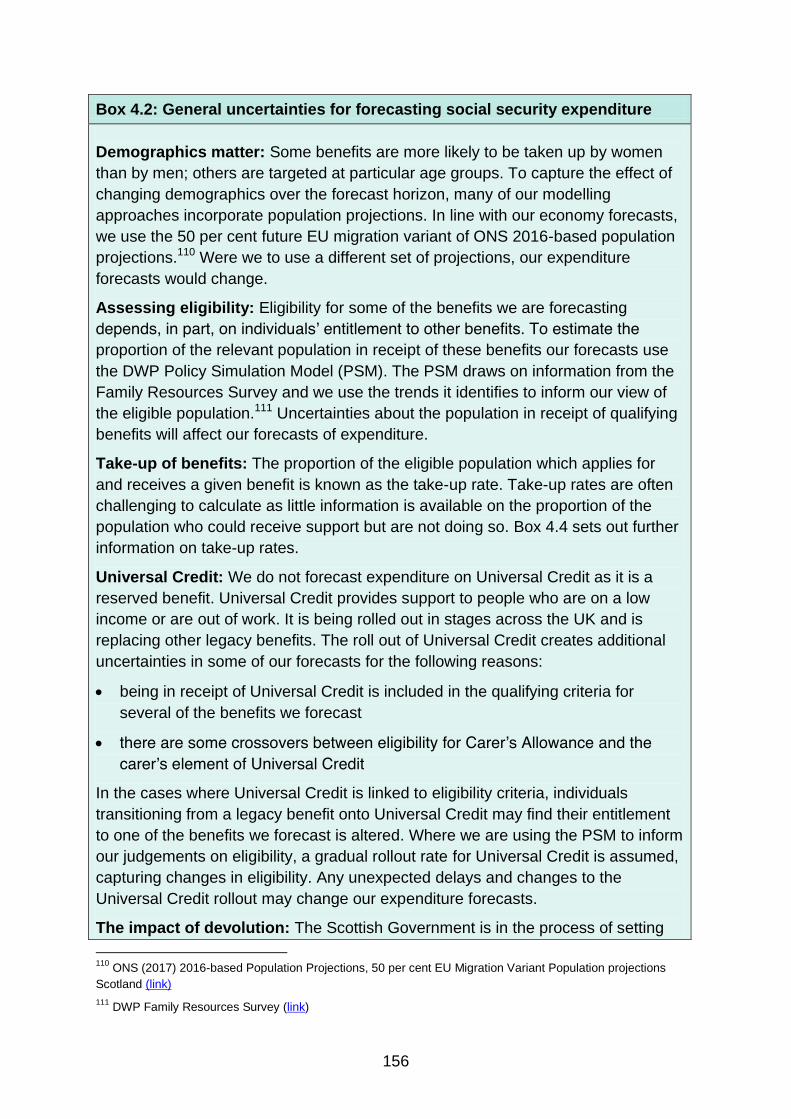
156
Box 4.2: General uncertainties for forecasting social security expenditure
Demographics matter: Some benefits are more likely to be taken up by women
than by men; others are targeted at particular age groups. To capture the effect of
changing demographics over the forecast horizon, many of our modelling
approaches incorporate population projections. In line with our economy forecasts,
we use the 50 per cent future EU migration variant of ONS 2016-based population
projections.110
Were we to use a different set of projections, our expenditure
forecasts would change.
Assessing eligibility: Eligibility for some of the benefits we are forecasting
depends, in part, on individuals’ entitlement to other benefits. To estimate the
proportion of the relevant population in receipt of these benefits our forecasts use
the DWP Policy Simulation Model (PSM). The PSM draws on information from the
Family Resources Survey and we use the trends it identifies to inform our view of
the eligible population.111
Uncertainties about the population in receipt of qualifying
benefits will affect our forecasts of expenditure.
Take-up of benefits: The proportion of the eligible population which applies for
and receives a given benefit is known as the take-up rate. Take-up rates are often
challenging to calculate as little information is available on the proportion of the
population who could receive support but are not doing so. Box 4.4 sets out further
information on take-up rates.
Universal Credit: We do not forecast expenditure on Universal Credit as it is a
reserved benefit. Universal Credit provides support to people who are on a low
income or are out of work. It is being rolled out in stages across the UK and is
replacing other legacy benefits. The roll out of Universal Credit creates additional
uncertainties in some of our forecasts for the following reasons:
being in receipt of Universal Credit is included in the qualifying criteria for
several of the benefits we forecast
there are some crossovers between eligibility for Carer’s Allowance and the
carer’s element of Universal Credit
In the cases where Universal Credit is linked to eligibility criteria, individuals
transitioning from a legacy benefit onto Universal Credit may find their entitlement
to one of the benefits we forecast is altered. Where we are using the PSM to inform
our judgements on eligibility, a gradual rollout rate for Universal Credit is assumed,
capturing changes in eligibility. Any unexpected delays and changes to the
Universal Credit rollout may change our expenditure forecasts.
The impact of devolution: The Scottish Government is in the process of setting
110
ONS (2017) 2016-based Population Projections, 50 per cent EU Migration Variant Population projections
Scotland (link)
111 DWP Family Resources Survey (link)

157
up Social Security Scotland; the executive agency that will deliver social security
benefits. Changes to the design and delivery of the benefits once devolved are
likely to impact on future levels of expenditure. As the Social Security (Scotland)
Bill has progressed through the Scottish Parliament we have noted changes in
respect of a commitment to uprate certain benefits in line with inflation and a duty
on Scottish Ministers to promote the take-up of devolved assistance.112
The set-up of the agency is in its early stages and at this time it is not possible to
quantify the impact of any changes. As further information becomes available
regarding policy and administrative changes the Scottish Government plans to
make we will update our forecasts.
112
Social Security (Scotland) Bill (2018) [as passed] (link)

158
Carer’s Allowance
Forecast
Table 4.3: Forecast expenditure on Carer’s Allowance and Carer’s Allowance
Supplement
£ million 2016-17
Outturn
2017-18 2018-19 2019-20 2020-21 2021-22 2022-23 2023-24
Carer’s Allowance (CA) 234 248 267 285 303 318 334 349
CA Supplement 35 37 40 42 44 46
Total expenditure 234 248 302 323 342 360 377 395
Source: Scottish Fiscal Commission, DWP Benefit Expenditure by Country and Region 2016-17 (link),
Background
4.12 Carer’s Allowance (CA) is paid to people who care for someone who is
disabled. Since 2011, CA has been uprated for each financial year in line with
CPI. The payment amount (known as the rate) for 2018-19 is £64.60 per week
and is set by the UK Government.113
4.13 To be eligible for CA, both the carer and care recipient must meet qualifying
criteria. The key criteria are that the care provider must be over 16, providing
care for at least 35 hours per week and earn no more than £120 per week in
2018-19.114 The care recipient must also be in receipt of a qualifying
benefit.115
4.14 CA is subject to overlapping benefit rules, which state that individuals should
not receive more than one income replacement benefit at one time.116 This is
particularly relevant for people reaching state pension age as claimants are
not able to receive their full state pension and CA simultaneously. Over our
forecast period, the UK Government is increasing the state pension age from
65 to 66 in 2019-2020.117 Increasing the state pension age will increase the
number of individuals expected to receive CA payments (caseload) as
113
UK Government’s proposed benefit and pension rates for 2018-2019 (link)
114 These are some of the eligibility criteria for 2018-19. The earnings limit is typically increased on an annual
basis.
115 The CA qualifying benefits are: Attendance Allowance (AA), the highest or middle rate of Disability Living
Allowance (DLA) care component, the daily living component of Personal Independence Payment (PIP), Armed
Forces Independence Payment or Constant Attendance Allowance in respect of an industrial or war disablement.
Full eligibility criteria can be found on the UK Government’s page on CA eligibility (link)
116 More information on overlapping benefit rules can be found in DWP staff Decision maker’s guide: Vol 3
Chapter 17 (link)
117 DWP State Pension Age timetables (link)

159
individuals will remain eligible for a longer period until they reach state
pension age.
Approach to forecasting
4.15 Since December 2017, we have undertaken work to develop the CA forecast
model. This development will continue over the summer as we further expand
our work on social security. The revised approach for forecasting CA
expenditure is detailed below.
4.16 We estimate the number of individuals expected to receive CA payments
(caseload) over the forecast horizon and multiply the caseload by the
annualised payment amount, resulting in an expenditure forecast. DWP
publish historic caseload figures and these form the basis for our forecast.118
4.17 Higher numbers of females claim CA and there are fewer young people
claiming. To account for these demographic differences, we forecast the
caseload separately by gender and age groups. The age groupings are: 16 to
35, 36 to 50, over 50 for claimants of working-age and then an additional
group for pension age claimants. This is a change from the previous model
which grouped claimants in five year age bands. Our model includes
adjustments for changes to the state pension age as CA cannot be claimed by
individuals in receipt of the state pension.
4.18 The historic claimant data are converted into claimant rates by dividing the
number of claimants by their corresponding population estimate. Our model
includes an update for the 2017 Scotland population estimates published by
the National Records of Scotland.119
We use statistical models to forecast
these rates.120
The forecast rates can then be combined with population
projections to give an estimate of future caseload that takes account of
projected population size and demographics. We use the 50 per cent future
EU migration variant of ONS 2016-based population projections, in line with
our other forecasts.121
4.19 This approach differs from the model used in December 2017 as we are
forecasting the total caseload for these age and gender groups. This is often
referred to as a ‘stock’ model. Previously, we forecasted the number of new
118
DWP Stat Xplore (link)
119 National Records of Scotland (2018) Mid-2017 population estimates Scotland (link)
120 The ARIMA (Auto-Regressive Integrated Moving Average) models we use are a basic type of statistical
forecasting model. For further information on ARIMA models see Box 2.1 in Scottish Fiscal Commission (2017)
Current Approach to Forecasting (link)
121 ONS (2017) 2016-based Population Projections, 50 per cent EU Migration Variant Population projections
Scotland (link)

160
claimants flowing on to the benefit (inflow) and the number of claimants
leaving the benefit (outflow). This is often referred to as a ‘flow’ model.
4.20 In line with the UK Government’s current policy, the weekly CA payment rate
is projected over the forecast horizon by uprating the payment amount at the
start of each financial year in line with the OBR’s CPI forecast from the third
quarter of the previous financial year.122
4.21 Expenditure is calculated by multiplying the forecast caseload by the forecast
payment amount. We make a final adjustment to reflect known differences
between the DWP claimant and expenditure data. The DWP claimant data are
taken as a snapshot each quarter whereas the expenditure figures cover the
total cost in a financial year and are slightly higher.
4.22 We are continuing to develop and refine our model to forecast CA expenditure
over the course of 2018. We will provide an update on any further model
changes in our next forecast publication.
4.23 There have been two releases of claimant data from DWP since our last
publication. The second release (in respect of November 2017) was too late
for inclusion in our forecasts. We chose not to update our forecast for the
earlier release (in respect of August 2017) as this shows a fall in the number
of individuals in receipt of Carer’s Allowance compared to the previous
quarter. The August 2017 data point is an outlier compared to historic data
and there is not sufficient information available to explain why the number of
claimants would have fallen. We discuss this further in Box 1.3 and also in the
forecast uncertainty section below.
122
See Scottish Fiscal Commission (2018) Scotland’s Economic and Fiscal Forecasts May 2018 Supplementary
Economy Tables S2.7 (link)
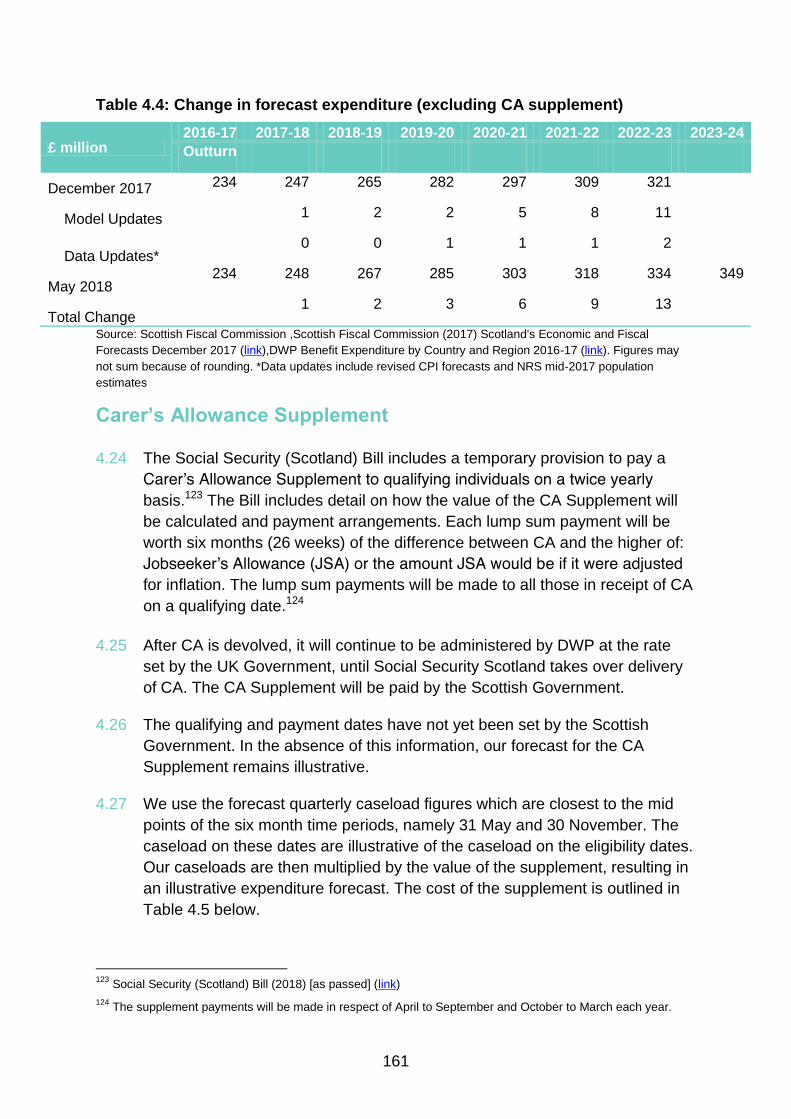
161
Table 4.4: Change in forecast expenditure (excluding CA supplement)
£ million 2016-17 2017-18 2018-19 2019-20 2020-21 2021-22 2022-23 2023-24
Outturn
December 2017 234 247 265 282 297 309 321
Model Updates 1 2 2 5 8 11
Data Updates* 0 0 1 1 1 2
May 2018 234 248 267 285 303 318 334 349
Total Change 1 2 3 6 9 13
Source: Scottish Fiscal Commission ,Scottish Fiscal Commission (2017) Scotland's Economic and Fiscal
Forecasts December 2017 (link),DWP Benefit Expenditure by Country and Region 2016-17 (link). Figures may
not sum because of rounding. *Data updates include revised CPI forecasts and NRS mid-2017 population
estimates
Carer’s Allowance Supplement
4.24 The Social Security (Scotland) Bill includes a temporary provision to pay a
Carer’s Allowance Supplement to qualifying individuals on a twice yearly
basis.123 The Bill includes detail on how the value of the CA Supplement will
be calculated and payment arrangements. Each lump sum payment will be
worth six months (26 weeks) of the difference between CA and the higher of:
Jobseeker’s Allowance (JSA) or the amount JSA would be if it were adjusted
for inflation. The lump sum payments will be made to all those in receipt of CA
on a qualifying date.124
4.25 After CA is devolved, it will continue to be administered by DWP at the rate
set by the UK Government, until Social Security Scotland takes over delivery
of CA. The CA Supplement will be paid by the Scottish Government.
4.26 The qualifying and payment dates have not yet been set by the Scottish
Government. In the absence of this information, our forecast for the CA
Supplement remains illustrative.
4.27 We use the forecast quarterly caseload figures which are closest to the mid
points of the six month time periods, namely 31 May and 30 November. The
caseload on these dates are illustrative of the caseload on the eligibility dates.
Our caseloads are then multiplied by the value of the supplement, resulting in
an illustrative expenditure forecast. The cost of the supplement is outlined in
Table 4.5 below.
123
Social Security (Scotland) Bill (2018) [as passed] (link)
124 The supplement payments will be made in respect of April to September and October to March each year.
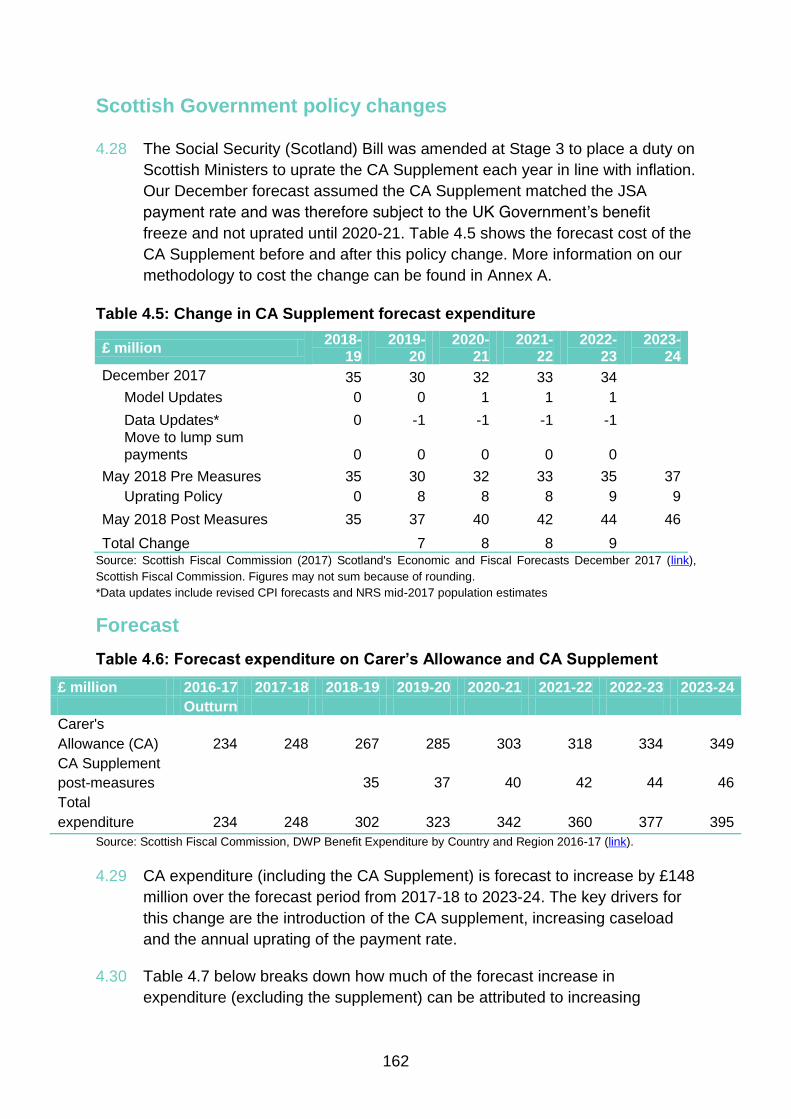
162
Scottish Government policy changes
4.28 The Social Security (Scotland) Bill was amended at Stage 3 to place a duty on
Scottish Ministers to uprate the CA Supplement each year in line with inflation.
Our December forecast assumed the CA Supplement matched the JSA
payment rate and was therefore subject to the UK Government’s benefit
freeze and not uprated until 2020-21. Table 4.5 shows the forecast cost of the
CA Supplement before and after this policy change. More information on our
methodology to cost the change can be found in Annex A.
Table 4.5: Change in CA Supplement forecast expenditure
£ million 2018-
19 2019-
20 2020-
21 2021-
22 2022-
23 2023-
24
December 2017 35 30 32 33 34
Model Updates 0 0 1 1 1
Data Updates* 0 -1 -1 -1 -1
Move to lump sum
payments 0 0 0 0 0
May 2018 Pre Measures 35 30 32 33 35 37
Uprating Policy 0 8 8 8 9 9
May 2018 Post Measures 35 37 40 42 44 46
Total Change
7 8 8 9
Source: Scottish Fiscal Commission (2017) Scotland's Economic and Fiscal Forecasts December 2017 (link),
Scottish Fiscal Commission. Figures may not sum because of rounding.
*Data updates include revised CPI forecasts and NRS mid-2017 population estimates
Forecast
Table 4.6: Forecast expenditure on Carer’s Allowance and CA Supplement
£ million 2016-17 2017-18 2018-19 2019-20 2020-21 2021-22 2022-23 2023-24
Outturn
Carer's
Allowance (CA) 234 248 267 285 303 318 334 349
CA Supplement
post-measures
35 37 40 42 44 46
Total
expenditure 234 248 302 323 342 360 377 395
Source: Scottish Fiscal Commission, DWP Benefit Expenditure by Country and Region 2016-17 (link).
4.29 CA expenditure (including the CA Supplement) is forecast to increase by £148
million over the forecast period from 2017-18 to 2023-24. The key drivers for
this change are the introduction of the CA supplement, increasing caseload
and the annual uprating of the payment rate.
4.30 Table 4.7 below breaks down how much of the forecast increase in
expenditure (excluding the supplement) can be attributed to increasing

163
caseload and how much can be attributed to the annual uprating of the
payment rate.
Table 4.7: Breakdown of CA forecast (excluding supplement) into driving
components
£ million 2016-17
Outturn
2017-18 2018-19 2019-20 2020-21 2021-22 2022-23 2023-24
Expenditure 234 248 267 285 303 318 334 349
Yearly
increase
13 19 19 18 16 15 16
Of which is
due to ...
Increasing
caseload
11 11 12 12 9 9 9
Uprating 2 8 7 5 6 6 7
Source: DWP Benefit Expenditure by Country and Region 2016-17 (link), Scottish Fiscal Commission. Figures
may not sum because of rounding.
Increasing caseload
4.31 The caseload for Carer’s Allowance has been increasing in recent years as
shown in Table 4.8 below. The key drivers are:
Increases in the female state pension age over this period
An increase in the number of individuals caring and taking up Carer’s
Allowance support
An increase in the number of people in receipt of eligible disability benefits
requiring care
Table 4.8: Outturn Carer’s Allowance average in-payment caseload
Thousands 2010-11 2011-12 2012-13 2013-14 2014-15 2015-16 2016-17
50 53 56 59 64 69 73
Source: DWP Stat Xplore (link), Scottish Fiscal Commission
4.32 We discussed the impact of the increase in the female state pension age in
our last publication. There has also been an increase in the number of
individuals in receipt of eligible disability benefits over this period. This
increase is observed in both Scotland and the UK. As the caseloads for
disability benefits such as Disability Living Allowance (DLA), Personal
Independence Payment (PIP) and Attendance Allowance (AA) increase, the
number of individuals requiring care and support also increases. As a result,

164
0
100
200
300
400
500
August 2012 August 2017
Caselo
ad
(T
ho
us
an
ds)
PIP DLA AA
we expect the number of individuals eligible and claiming CA to increase.
Figure 4.1 illustrates how the caseload for DLA, PIP and AA has changed
over the past five years.
Figure 4.1: Number of people receiving a disability benefit in Scotland (DLA,
PIP or AA)
Source: DWP Stat Xplore (link)
4.33 We expect the CA caseload to continue to increase over the forecast horizon,
as displayed in Table 4.9 below.
Table 4.9: Forecast Carer’s Allowance average in-payment caseload
Thousands 2017-18 2018-19 2019-20 2020-21 2021-22 2022-23 2023-24
76 79 83 86 89 92 94
Source: Scottish Fiscal Commission
Forecast uncertainty 4.34 Many of the uncertainties outlined in Box 4.2 apply to CA. Additionally,
expenditure on CA depends on the value of the weekly payment and any
changes in inflation or policy will have an impact on our expenditure forecast.
Disability benefits
4.35 A further uncertainty for CA is the change in the underlying disability benefits.
The care recipient must be in receipt of a qualifying benefit, of which the most
common are Attendance Allowance (AA), Disability Living Allowance (DLA)
and Personal Independence Payment (PIP). Further information on these
benefits and recent changes are outlined in Box 4.3 below.
DLA to PIP
migration
commences

165
Box 4.3: Disability benefits
DLA supports children and adults who need help with personal care or mobility.
DLA is made up of two components, the ‘care component’ and the ‘mobility
component’. To get DLA you must be eligible for at least one of the components.125
AA provides support for those aged 65 and over that need care support due to
disability.126
The Welfare Reform Act 2012 introduced PIP as a replacement for DLA, for adults
aged 16 to 64.127
PIP is made up of two components, the ‘daily living’ component
and the ‘mobility’ component.128
Entitlement to DLA is based on an individual’s
condition and their needs arising from this, whereas entitlement to the two
components of PIP is assessed on an individual’s ability to complete a number of
key everyday activities. The roll out of PIP commenced in April 2013.
The OBR produce expenditure forecasts for DLA, PIP and AA in Great Britain. We
have not produced forecasts for these benefits as they are not yet devolved to
Scotland. The OBR’s welfare trends report highlights challenges in forecasting
expenditure for disability benefits.129 They note that the major structural reform to
the disability benefits systems (moving from DLA to PIP) has proceeded more
slowly than expected and has saved less than initially predicted. There has also
been a rising prevalence of mental health conditions, particularly at younger ages,
that has increased expenditure.
The UK Government’s welfare reforms have been subject to a number of legal
challenges, and it is possible that there could be further challenges in the future to
existing or new policy changes. In December 2017, the High Court ruled that
certain changes to the PIP regulations on how mental health conditions should be
treated in calculating PIP awards were unlawful. The UK Government confirmed
they will not challenge the ruling and will instead review the cases of all affected
claimants.130 The OBR has estimated that complying with this ruling at a UK level
could increase the PIP caseload by 25,000 claimants and 165,000 individuals
could receive a higher award by 2022-23.131
125
More information on DLA and its rates can be found on the UK Government’s website (link)
126 More information on AA and its rates can be found on the UK Government’s website (link)
127 Welfare Reform Act 2012 Part 4 (link)
128 More information on PIP and its rates can be found on the UK Government’s website (link)
129 OBR (2016) Welfare trends report (link)
130 Welfare reform: written statement by the Secretary of State for Work and Pensions January 2018 (link)
131 OBR (2018) Economic and Fiscal Outlook March 2018 (link)

166
The Social Security (Scotland) Bill provides for the devolution of benefits covered
by the Scotland Act 2016 which includes DLA, PIP and AA.132
As the Scottish
Government announces plans for devolution of DLA, PIP and AA, we will
incorporate these into our forecasts.
4.36 Recent increases in the caseload for DLA, PIP and AA is one of the key
drivers for increases in the CA caseload. If the caseload for DLA, PIP and AA
increases at a faster or slower rate compared to what we have observed
historically then we expect this to impact forecast CA caseloads.
4.37 To be eligible for CA, the person receiving care needs to be in receipt of AA,
the middle or highest rate of the DLA care component or the daily living
component of PIP. Figure 4.2 shows the proportion of PIP claimants who are
in receipt of a component that would make their carer eligible for CA is higher
than the corresponding figure for DLA. The transfer of individuals from DLA to
PIP may increase Carer’s Allowance expenditure as a result of this difference
in eligibility criteria. We will continue to monitor this as more data become
available.
Figure 4.2: Proportion of DLA and PIP claimants in Scotland who are in receipt
of a component that would make their carer eligible for CA in November 2017
Source: DWP Stat Xplore (link)
Note: This comparison is for adults (aged 16 and over) only as children are unable to claim PIP.
4.38 There is limited information on the impact of the DLA to PIP migration on
Carer’s Allowance. In advance of our next publication, we will consider if any
adjustments should be made to forecast expenditure to reflect the change in
disability benefits over the forecast period.
132
Social Security (Scotland) Bill (2018) [as passed] (link)
0% 20% 40% 60% 80% 100%
PIP
DLA
CA Eligible Not CA Eligible

167
Universal Credit
4.39 As discussed in our December publication, Universal Credit contains a carer’s
element with similar qualifying criteria and therefore the rollout may impact CA
expenditure. We will continue to monitor the outturn data for CA to consider if
the rollout of Universal Credit is affecting the CA caseload.
Comparison to OBR forecast
4.40 The OBR published a forecast of CA expenditure in Scotland in their March
2018 devolved tax and spending publication.133
4.41 The OBR base their forecast on the Scottish share of CA expenditure in Great
Britain and adjust for slower growth in Scotland’s working-age population
relative to Great Britain as a whole. Differences in expenditure will arise
because of the different approaches taken. We will work with the OBR to
explore the reasons for these differences and whether there is relevant
information that we can allow for in our next forecast. In particular, we will
consider information on the forecast number of people claiming disability
benefits (Disability Living Allowance, Personal Independence Payments and
Attendance Allowance) which qualify their carer to claim CA.
Table 4.10: Forecast comparison (excluding CA supplement)
Source: OBR (March 2018) Devolved Tax and spending forecasts: charts and tables. Table 5.4: Scottish carer’s
allowance spending (excluding Scottish Government Supplement) (link), Scottish Fiscal Commission. Figures
may not sum because of rounding.
133
OBR (March 2018) Devolved tax and spending forecasts publication; Chapter 5 (link)
£ million 2017-18 2018-19 2019-20 2020-21 2021-22 2022-23
SFC May 2018 248 267 285 303 318 334
OBR March 2018 251 282 301 316 331 347
Difference -3 -15 -16 -13 -12 -13
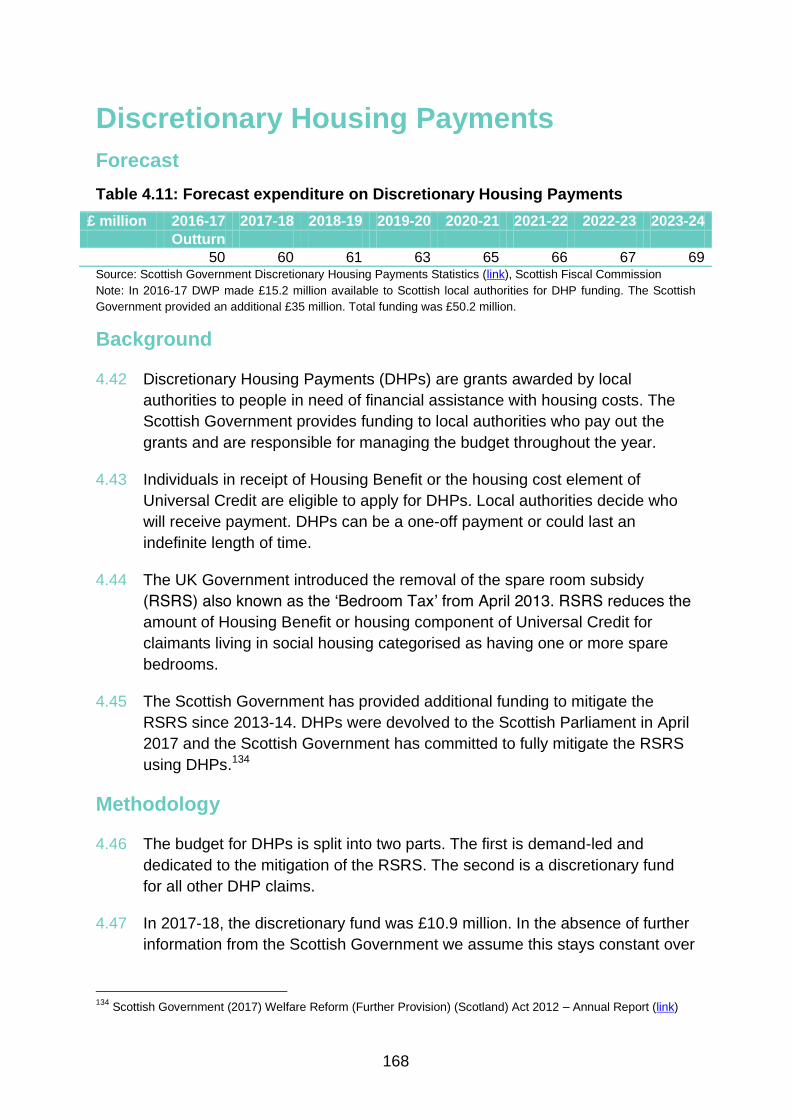
168
Discretionary Housing Payments
Forecast
Table 4.11: Forecast expenditure on Discretionary Housing Payments
£ million 2016-17 2017-18 2018-19 2019-20 2020-21 2021-22 2022-23 2023-24
Outturn
50 60 61 63 65 66 67 69 Source: Scottish Government Discretionary Housing Payments Statistics (link), Scottish Fiscal Commission
Note: In 2016-17 DWP made £15.2 million available to Scottish local authorities for DHP funding. The Scottish
Government provided an additional £35 million. Total funding was £50.2 million.
Background
4.42 Discretionary Housing Payments (DHPs) are grants awarded by local
authorities to people in need of financial assistance with housing costs. The
Scottish Government provides funding to local authorities who pay out the
grants and are responsible for managing the budget throughout the year.
4.43 Individuals in receipt of Housing Benefit or the housing cost element of
Universal Credit are eligible to apply for DHPs. Local authorities decide who
will receive payment. DHPs can be a one-off payment or could last an
indefinite length of time.
4.44 The UK Government introduced the removal of the spare room subsidy
(RSRS) also known as the ‘Bedroom Tax’ from April 2013. RSRS reduces the
amount of Housing Benefit or housing component of Universal Credit for
claimants living in social housing categorised as having one or more spare
bedrooms.
4.45 The Scottish Government has provided additional funding to mitigate the
RSRS since 2013-14. DHPs were devolved to the Scottish Parliament in April
2017 and the Scottish Government has committed to fully mitigate the RSRS
using DHPs.134
Methodology
4.46 The budget for DHPs is split into two parts. The first is demand-led and
dedicated to the mitigation of the RSRS. The second is a discretionary fund
for all other DHP claims.
4.47 In 2017-18, the discretionary fund was £10.9 million. In the absence of further
information from the Scottish Government we assume this stays constant over
134
Scottish Government (2017) Welfare Reform (Further Provision) (Scotland) Act 2012 – Annual Report (link)

169
the forecast horizon. This assumption is unchanged from our previous
forecast.
4.48 The methodology for forecasting expenditure to mitigate RSRS has not
changed significantly from our December forecast.135
We estimate the
reduction in payments of Housing Benefit and the housing component of
Universal Credit resulting from the RSRS in 2017-18 based on data from
DWP. We then allow for expected changes in social sector rent and the stock
of social housing over the forecast period to determine forecast expenditure.
4.49 There have been a number of minor updates to the forecast model. In our
previous forecast, we assumed the stock of social housing remained constant.
We have adjusted the forecast to take into account Scottish Government’s
commitment to increase the stock of social housing in Scotland. Based on a
report commissioned by Shelter Scotland, Scottish Federation of Housing
Associations and the Equality and Human Rights Commission Scotland, the
number of social housing units is expected to increase from 595,000 in 2017
to 618,000-620,000 in 2021.136 We assume a constant relationship between
number of social housing units and the number of households affected by
RSRS.
4.50 We have changed the data source used to inform our social housing rent
assumption. Previously we used unpublished data from the Scottish Housing
Regulator. Now we use outturn social sector rent data from the Social Tenants
in Scotland report published by the Scottish Government.137 We have also
updated our methodology to use a two year average value instead of a three
year average value. The rent increases in 2014-2015 are higher than the
values observed more recently and we have decided to exclude this value,
noting the risks associated with this assumption in the uncertainties section
below.
4.51 Using the most recent data from DWP Stat-Xplore, we have updated our
estimate of the reduction in payments of Housing Benefit and the housing
component of Universal Credit resulting from the RSRS in 2017-18.
4.52 Finally there has been minor model refinement since our forecast in
December 2017. We have performed our calculations at a more aggregated
level in order to simplify the model. This increases our forecast expenditure by
less than £0.1 million from 2018-19 onwards.
135
See Scotland's Economic and Fiscal Forecasts December 2017 (link)
136 Shelter Scotland (2018) Review of Strategic Investment Plans for Affordable Housing (link)
137 Scottish Government (2018) Social Tenants in Scotland 2016 (link)
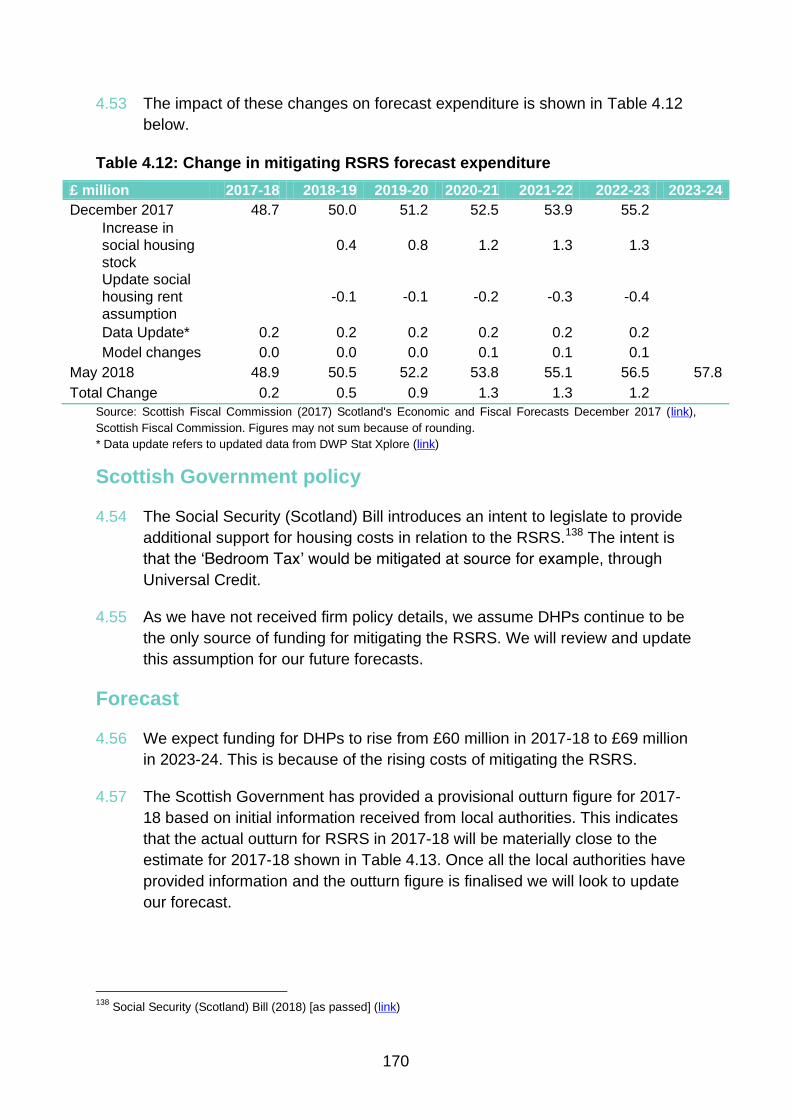
170
4.53 The impact of these changes on forecast expenditure is shown in Table 4.12
below.
Table 4.12: Change in mitigating RSRS forecast expenditure
£ million 2017-18 2018-19 2019-20 2020-21 2021-22 2022-23 2023-24
December 2017 48.7 50.0 51.2 52.5 53.9 55.2
Increase in
social housing
stock
0.4 0.8 1.2 1.3 1.3
Update social
housing rent
assumption
-0.1 -0.1 -0.2 -0.3 -0.4
Data Update* 0.2 0.2 0.2 0.2 0.2 0.2
Model changes 0.0 0.0 0.0 0.1 0.1 0.1
May 2018 48.9 50.5 52.2 53.8 55.1 56.5 57.8
Total Change 0.2 0.5 0.9 1.3 1.3 1.2
Source: Scottish Fiscal Commission (2017) Scotland's Economic and Fiscal Forecasts December 2017 (link),
Scottish Fiscal Commission. Figures may not sum because of rounding.
* Data update refers to updated data from DWP Stat Xplore (link)
Scottish Government policy
4.54 The Social Security (Scotland) Bill introduces an intent to legislate to provide
additional support for housing costs in relation to the RSRS.138
The intent is
that the ‘Bedroom Tax’ would be mitigated at source for example, through
Universal Credit.
4.55 As we have not received firm policy details, we assume DHPs continue to be
the only source of funding for mitigating the RSRS. We will review and update
this assumption for our future forecasts.
Forecast
4.56 We expect funding for DHPs to rise from £60 million in 2017-18 to £69 million
in 2023-24. This is because of the rising costs of mitigating the RSRS.
4.57 The Scottish Government has provided a provisional outturn figure for 2017-
18 based on initial information received from local authorities. This indicates
that the actual outturn for RSRS in 2017-18 will be materially close to the
estimate for 2017-18 shown in Table 4.13. Once all the local authorities have
provided information and the outturn figure is finalised we will look to update
our forecast.
138
Social Security (Scotland) Bill (2018) [as passed] (link)

171
Table 4.13: Forecast expenditure on Discretionary Housing Payments
£ million 2016-17 2017-18 2018-19 2019-20 2020-21 2021-22 2022-23 2023-24
Outturn
Mitigation of
RSRS 49 51 52 54 55 56 58
Other DHPs
11 11 11 11 11 11 11
Total
expenditure 50 60 61 63 65 66 67 69
Source: Scottish Government Discretionary Housing Payments Statistics (link), Scottish Fiscal Commission.
Figures may not sum because of rounding.
Forecast uncertainty
4.58 Aside from the uncertainties mentioned in Box 4.2 there are specific risks
relating to the forecast of expenditure to mitigate RSRS.
4.59 We assume that the cost of mitigating the RSRS grows by the average
increase in social housing rent over the last two years (2.4 per cent). If social
housing rent changes by a different amount then expenditure may deviate
from our forecast.
4.60 We assume a constant relationship between the number of social housing
units and the number of households affected by RSRS. There is limited data
available on the tenants who will move into the new social housing units. As a
result, we do not know if new tenants will be equally likely to be under
occupying the property and in receipt of housing benefit or the housing
component of Universal Credit as current tenants. We will review this
assumption when we receive outturn data on the number of claimants
receiving support for the RSRS.

172
Scottish Welfare Fund
Forecast
Table 4.14: Forecast expenditure on the Scottish Welfare Fund
£ million 2016-17
Outturn
2017-18 2018-19 2019-20 2020-21 2021-22 2022-23 2023-24
33 33 33 33 33 33 33 33
Source: Scottish Government Scottish Welfare Fund Statistics (link), Scottish Fiscal Commission
Background
4.61 The Scottish Welfare Fund (SWF) was set up in April 2013 to provide grants
for people on low incomes, following the devolution of parts of the Social
Fund.139 Similar to DHPs, Scottish Government provides funding to local
authorities who then deliver the discretionary grants.
4.62 Our forecasts in December 2017 included the cost of mitigating the removal of
support for housing costs for some 18-21 year olds in receipt of Universal
Credit.140
In March 2018, the UK Government announced it would not
continue with the policy.141
Therefore, our forecast no longer includes this
component.
Methodology
4.63 The Scottish Government has set the 2018-19 budget for the SWF at £33
million. The fund has stayed constant at £33 million since 2013-14. We have
included expenditure for the Family Reunion Grant in our forecast from 2018-
19 onwards. This helps refugees with increased living costs after being
reunited with their family. It is a discretionary fund of £100,000 paid through
the SWF.142
4.64 In the absence of information from the Scottish Government about future
changes to the SWF, we have assumed the fund remains constant at £33
million over the forecast period.
139
Scottish Government and COSLA (2012) Welfare Reform in Scotland (link)
140 Scottish fiscal Commission (2017) Scotland's Economic and Fiscal Forecasts December 2017 (link)
141 Welfare reform: written statement by the Secretary of State for Work and Pensions March 2018 (link)
142 Minister for Social Security - Letter to Social Security Committee December 2017 (link)

173
Forecast
4.65 Table 4.15 shows our forecast of SWF compared to our forecast in December 2017. The key change is the removal of the cost of mitigating the 18 to 21 year old reduction in eligibility for the housing component of Universal Credit
Table 4.15: Change in Scottish Welfare Fund forecast expenditure
£ million 2016-
17 2017-18 2018-19 2019-20 2020-21 2021-22 2022-23
2023-24
Outturn
December 2017 33.0 33.3 34.2 34.5 34.6 34.6 34.6
Removal of 18-21 UC -0.3 -1.2 -1.5 -1.6 -1.6 -1.6
Family Reunion
Grant 0.1 0.1 0.1 0.1 0.1
May 2018 33.0 33.0 33.1 33.1 33.1 33.1 33.1 33.1
Total Change -0.3 -1.1 -1.4 -1.5 -1.5 -1.5
Source: Scottish Government Scottish Welfare Fund Statistics (link), Scottish Fiscal Commission (2017)
Scotland's Economic and Fiscal Forecasts December 2017 (link), Scottish Fiscal Commission. Figures may not
sum because of rounding.
Forecast uncertainty
4.66 The removal of the costs to mitigate the cut in eligibility for the housing
component has removed a large amount of uncertainty in our forecast. The
remaining uncertainty is if the Scottish Government changes the funding
amount for SWF.
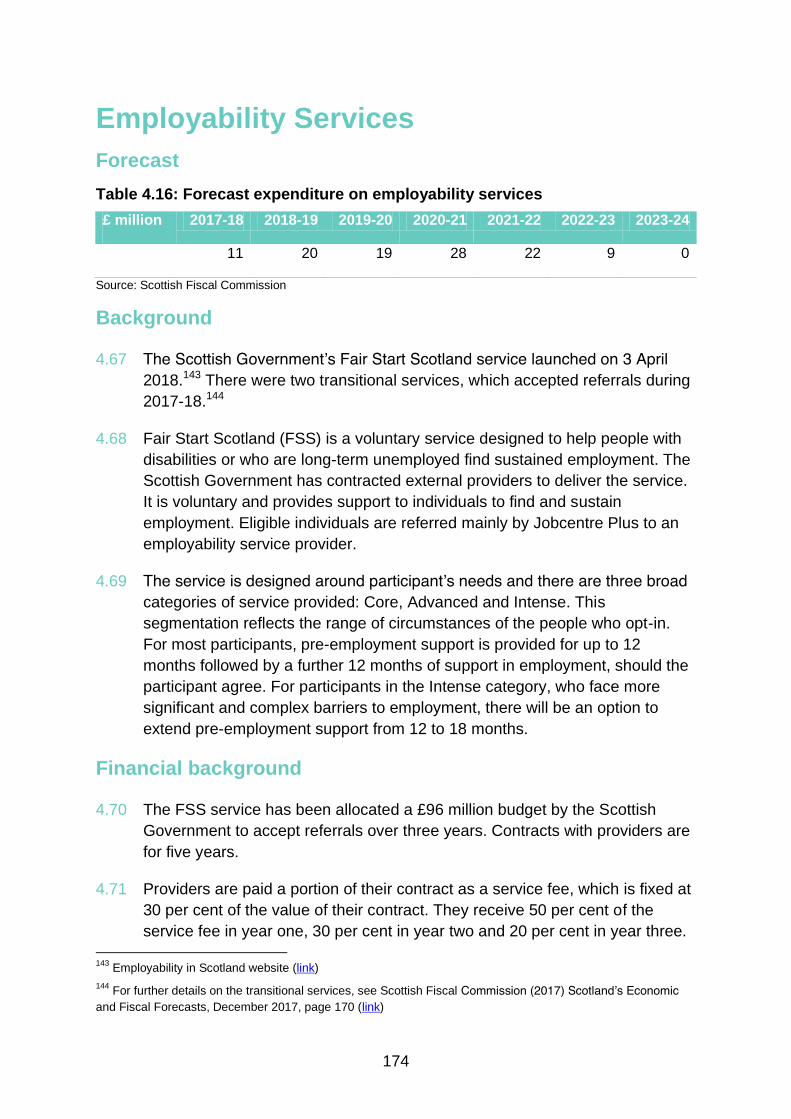
174
Employability Services
Forecast
Table 4.16: Forecast expenditure on employability services
£ million 2017-18 2018-19 2019-20 2020-21 2021-22 2022-23 2023-24
11 20 19 28 22 9 0
Source: Scottish Fiscal Commission
Background
4.67 The Scottish Government’s Fair Start Scotland service launched on 3 April
2018.143
There were two transitional services, which accepted referrals during
2017-18.144
4.68 Fair Start Scotland (FSS) is a voluntary service designed to help people with
disabilities or who are long-term unemployed find sustained employment. The
Scottish Government has contracted external providers to deliver the service.
It is voluntary and provides support to individuals to find and sustain
employment. Eligible individuals are referred mainly by Jobcentre Plus to an
employability service provider.
4.69 The service is designed around participant’s needs and there are three broad
categories of service provided: Core, Advanced and Intense. This
segmentation reflects the range of circumstances of the people who opt-in.
For most participants, pre-employment support is provided for up to 12
months followed by a further 12 months of support in employment, should the
participant agree. For participants in the Intense category, who face more
significant and complex barriers to employment, there will be an option to
extend pre-employment support from 12 to 18 months.
Financial background
4.70 The FSS service has been allocated a £96 million budget by the Scottish
Government to accept referrals over three years. Contracts with providers are
for five years.
4.71 Providers are paid a portion of their contract as a service fee, which is fixed at
30 per cent of the value of their contract. They receive 50 per cent of the
service fee in year one, 30 per cent in year two and 20 per cent in year three.
143
Employability in Scotland website (link)
144 For further details on the transitional services, see Scottish Fiscal Commission (2017) Scotland’s Economic
and Fiscal Forecasts, December 2017, page 170 (link)

175
Fees are fixed and spread evenly over each month. Providers were able to
ask for a portion of the service fee up front during 2017-18 to support
preparation for delivery from April 2018. In the forecast this up-front element
amounts to £300,000 in total.
4.72 The remaining 70 per cent of the contract value is set aside for performance-
related fees. This is to incentivise a high rate of starts and conversions to
sustained employment outcomes. Payments are higher for groups which are
more challenging to support. Providers are paid according to the number of
people who move into employment and the length of time they’re employed.
The key milestones are 13 weeks (15 per cent of the maximum fee), 26 weeks
(35 per cent of the maximum fee) and 52 weeks (50 per cent of the maximum
fee) of sustained employment.145
The average maximum fees per person vary
by service group. The fee for the Intense group is more than double that of the
Core group. This is referred to as a part payment by results model and it
means payments to providers will be made over a five-year period.
4.73 The service contains financial penalties in the event that a provider fails to
achieve any one or more of 16 contracted key delivery indicators.146 The
Scottish Government plan to apply these with discretion but based on clearly
set out guidelines. Should the Scottish Government decide that a failure has
occurred and should it be established this did not occur for reasons beyond
the provider’s control, the provider will be subject to a penalty.
Modelling approach
4.74 The forecast model for FSS starts from an estimate of the eligible
population.147 The estimated size of this population is 76,000 people of which
38,000 are expected to start the service. Based on Scottish Government
planning assumptions, it is expected that 14 per cent of referrals will fall into
the Core group, 50 per cent will be in the Advanced group and 36 per cent will
be in the Intense group.
4.75 As part of the tendering process, service providers were asked to give their
forecasts for the numbers of people they expected to help into sustained
employment in each support group. They also gave information about the
145
The definition of sustained employment allows for a period out of employment. For the 13 week milestone to
be met 13 weeks of employment are required in a 16 week period, for the 26 week milestone the corresponding
period is 30 weeks and for the 52 week milestone it is 60 weeks.
146 The Scottish Government set standard delivery outcomes, detailing a list of key delivery indicators they expect
the contractors to meet. Delivery indicators include the provision of induction programs for participants, setting
work support plans and procedures for dealing with complaints all delivered within a specific time.
147 As with the December 2017 forecast, the Commission is using the Scottish Government’s forecast model,
which we will be reviewing ahead of the Scottish Budget 2019-20.

176
costs of supporting people in each group through the full service to the 12
month employment outcome and how many people in each group would
sustain employment for the 13, 26 and 52 weeks. All of the above judgements
remain unchanged from the December 2017 forecast.
4.76 The May 2018 forecast contains an important update to the methodology.
Service providers have now provided the Scottish Government their monthly
forecasts, both of how many service starts and sustained employment
outcomes they expect and when they expect these milestones to be achieved.
Previously, service providers gave forecasts only for the total number of job
outcomes they expected to realise over the full life of the service.
4.77 The information from the Scottish Government and service providers is
combined and used to calculate how much money will be spent per person
referred to the service.
Scottish Government policy 4.78 The transitional services referral period ended on 9 March 2018. FSS will take
referrals for three years, but contracts with and payments to providers run for
five years, from April 2018 to November 2023 with final outcome payments
made up to 29 February 2024.
Forecast
Table 4.17: Forecast expenditure on employability services
£ million 2017-18 2018-19 2019-20 2020-21 2021-22 2022-23 2023-24
Fair Start Scotland 0.3 15.7 19.2 27.7 21.9 8.5 0
Work Able Scotland 2.5 0.4 0 0 0 0 0
Work First Scotland 8.5 3.5 0 0 0 0 0
Total expenditure 11.3 19.6 19.2 27.7 21.9 8.5 0
Source: Scottish Fiscal Commission. Figures may not sum because of rounding.
4.79 Table 4.17 details the forecast of spending for Fair Start Scotland, Work Able
Scotland and Work First Scotland. There are three main points to note. First,
the forecast spend for Fair Start Scotland is £93 million, slightly under the
announced £96 million budget.148 This stems from the service provider
estimates of expected caseloads and sustained job conversions. Second,
payments peak in the middle of the forecast horizon. This reflects individuals
148
Employability in Scotland webpage “About Fair Start Scotland” (link)

177
entering services at a different point as well as the time necessary to enter
into employment, and to achieve the key milestones when performance fees
are disbursed. Third, payments continue into 2021-22 and 2022-23, which is
after the referral period ends. This is because there will be a number of cases
in which participants are referred to the service during the latter part of 2020-
21 and then achieve the milestones.
4.80 There have been revisions made to the expected expenditure for Fair Start
Scotland (FSS) within each year of the forecast. FSS has seen downward
revisions to forecast spending in the first two years of the service, with an
equal total upward revision to spending in the last three years.
Table 4.18: Change in Fair Start Scotland forecast expenditure
£ million 2017-18 2018-19 2019-20 2020-21 2021-22 2022-23 2023-24
December 2017 0.2 17.6 26.9 27.2 18.0 3.3
Updated service provider forecasts
for sustained job outcomes 0.1 -1.9 -7.7 0.5 3.9 5.2
May 2018 0.3 15.7 19.2 27.7 21.9 8.5 0
Total Change 0.1 -1.9 -7.7 0.5 3.9 5.2
Source: Scottish Fiscal Commission (2017) Scotland's Economic and Fiscal Forecasts December 2017 (link),
Scottish Fiscal Commission. Figures may not sum because of rounding.
4.81 Providers were able to ask for a portion of the service fee up front during
2017-18 to support preparation for delivery from April 2018. After discussions
with service providers this up-front element was revised up from £200,000 to
£300,000.
4.82 The reason for FSS revisions from 2018-19 onwards is entirely down to the
change in the way the forecast was constructed, as described in the Modelling
Approach. Previously, providers estimated overall numbers of job outcomes
realised and the profile across years was based on judgement. The new
forecasts are based on the providers own estimates of the number and profile
of the job outcomes being realised. This has resulted in job outcomes being
assumed to be achieved later than in the forecasts made in December 2017,
with expenditure therefore increased in later years.
4.83 For the transitional services, there has been a £2.2 million downward revision
to forecast expenditure in 2018-19 on Work First Scotland. This is principally
as a result of a lower than expected achievement of sustained job outcomes.
This has meant lower performance-related fees for providers and lower
spending overall. There has been only a very a minor revision to the forecast
for Work Able Scotland expenditure, with a reduction in spending of £0.2
million in 2017-18 and an increase of £0.1 million in 2018-19.

178
Forecast uncertainty
4.84 The voluntary nature of the service may lead the eventual number of people
being referred and then agreeing to participate being lower than expected.
Assumptions about take-up have been based on previous DWP schemes, in
particular the New Deal for Disabled People. Despite this, the evidence base
underpinning this assumption is limited, owing to few comparable previous
voluntary schemes. Therefore there is a high degree of uncertainty
surrounding estimates of the take-up rate.
4.85 The second source of sensitivity for the forecasts is the effectiveness of the
service providers at supporting participants into sustained employment. The
£2.2 million downward revision to the forecast for spending on Work First
Scotland came as a result of the crystallisation of this risk. For Fair Start
Scotland this forecast risk may be mitigated by a longer service period and the
monthly performance monitoring system put in place by the Scottish
Government. We anticipate that this risk will more likely affect the profile of
spending rather than the total amount spent. That said, the fact that the
forecast revisions push expected job outcomes into the latter years of the
service increases the risk of overall spending coming in lower than expected
4.86 A third risk is the effectiveness of the Scottish Government’s channels for
affecting the performance of the service. This will only be known several
months after the intervention takes place. For example, should the number of
people opting into the service be much higher than anticipated, it may be
several months before the Scottish Government is able to know whether its
intervention to slow the number of referrals has worked. This raises a risk of
spending more than anticipated. Similarly if the numbers opting in are lower
than anticipated there is a risk spending could be lower than anticipated.
4.87 An important feature of the service is that the budget is allocated across the
nine regions. This means that should referrals or provider performance differ
from expectations in any single region, the Scottish Government will manage
the overall service budget at a national level to help mitigate risks of over or
undershooting the overall £93 million expected spend.
4.88 We will continue to monitor expenditure on the service, in particular the
assumptions around the risks identified above. These will be reviewed for
future forecasts. We will also be reviewing our overall forecasting approach for
FSS ahead of the Scottish Budget 2019-20.
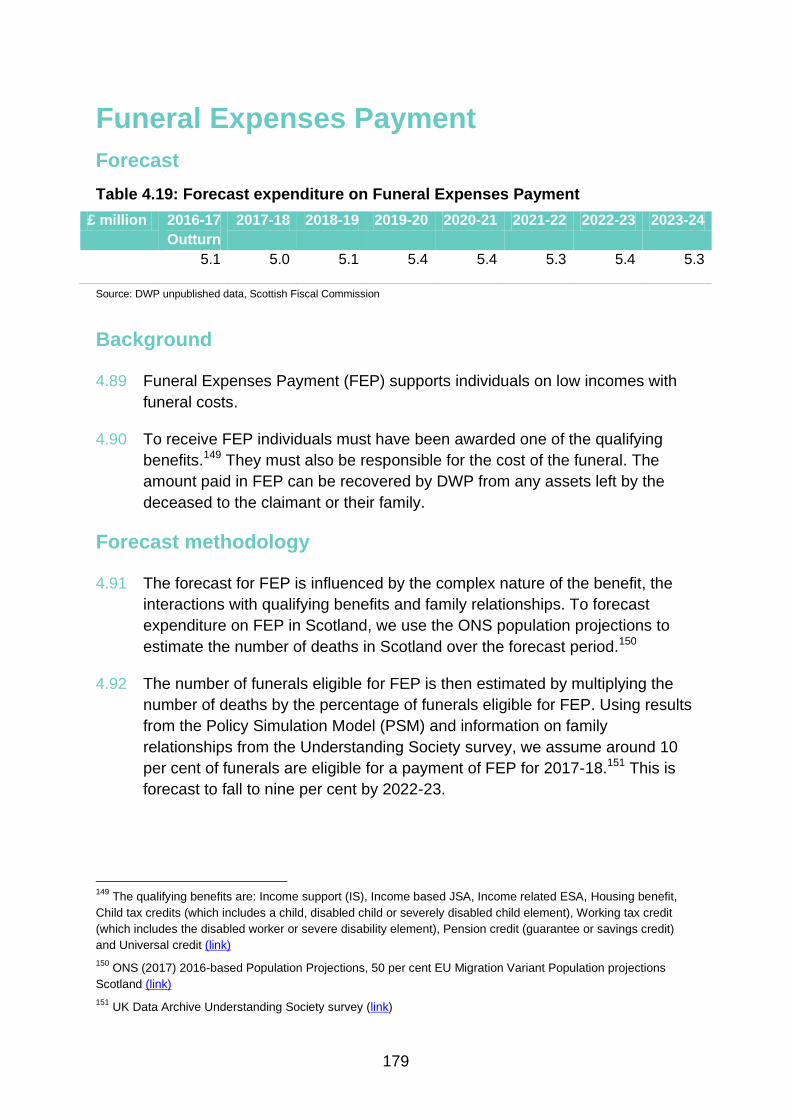
179
Funeral Expenses Payment
Forecast
Table 4.19: Forecast expenditure on Funeral Expenses Payment
£ million 2016-17
Outturn
2017-18 2018-19 2019-20 2020-21 2021-22 2022-23 2023-24
5.1 5.0 5.1 5.4 5.4 5.3 5.4 5.3
Source: DWP unpublished data, Scottish Fiscal Commission
Background
4.89 Funeral Expenses Payment (FEP) supports individuals on low incomes with
funeral costs.
4.90 To receive FEP individuals must have been awarded one of the qualifying
benefits.149 They must also be responsible for the cost of the funeral. The
amount paid in FEP can be recovered by DWP from any assets left by the
deceased to the claimant or their family.
Forecast methodology
4.91 The forecast for FEP is influenced by the complex nature of the benefit, the
interactions with qualifying benefits and family relationships. To forecast
expenditure on FEP in Scotland, we use the ONS population projections to
estimate the number of deaths in Scotland over the forecast period.150
4.92 The number of funerals eligible for FEP is then estimated by multiplying the
number of deaths by the percentage of funerals eligible for FEP. Using results
from the Policy Simulation Model (PSM) and information on family
relationships from the Understanding Society survey, we assume around 10
per cent of funerals are eligible for a payment of FEP for 2017-18.151 This is
forecast to fall to nine per cent by 2022-23.
149
The qualifying benefits are: Income support (IS), Income based JSA, Income related ESA, Housing benefit,
Child tax credits (which includes a child, disabled child or severely disabled child element), Working tax credit
(which includes the disabled worker or severe disability element), Pension credit (guarantee or savings credit)
and Universal credit (link)
150 ONS (2017) 2016-based Population Projections, 50 per cent EU Migration Variant Population projections
Scotland (link)
151 UK Data Archive Understanding Society survey (link)

180
Box 4.4: Take-up rate
As well as meeting the eligibility criteria for a benefit or tax relief, in many cases the
individual must also apply in order to receive payment. The proportion of the
eligible population who receive the benefit is referred to as the take-up rate.
The take-up rate is measured by the percentage of people who claim the benefit or
tax relief they are eligible for:
Take-up rates are challenging to calculate as there is limited information available
on the population who are eligible but not claiming. This is particularly complex for
benefits where eligibility depends on being in receipt of another benefit. For new
benefits or reliefs, the number of claimants is also unknown and must be
estimated. Therefore, take-up rates reflect uncertainties in the size of the eligible
population as well as the likelihood that eligible individuals claim.
Take-up rates vary across different benefits and reliefs, these differences may be
explained by:
Financial gain: The larger the potential gains, the higher the take-up rate.
The eligible population would be more willing to spend time/effort to apply
for a benefit or tax relief.
Awareness: A lack of awareness about the benefit or relief could lower the
take-up rate.
Ease of application: The lower the time, effort and cost of applying, the
higher the take-up rate is likely to be.
Social barriers: Any stigmas associated with claiming a benefit or tax relief
could negatively affect the take-up rate.
The Social Security (Scotland) Bill includes a requirement for Scottish Ministers to
prepare a strategy to promote take-up of assistance through the Scottish social
security system.152 The strategy will be publicly available and will set out the steps
that Scottish Ministers intend to take to promote take-up. These steps may impact
future expenditure. We will review the take-up strategy once it becomes available
and consider if our take-up rate assumptions should be revised accordingly.
152
Social Security (Scotland) Bill (2018) [as passed] (link)
Estimated eligible population
Number of claimants Take-up rate

181
4.93 The take-up rate (see Box 4.4) is estimated at 61 per cent based on historical
estimates of the eligible population and DWP outturn statistics on expenditure
in Scotland. We assume the take-up rate does not change over the forecast
period. Multiplying the take-up rate by the number of eligible deaths provides
a forecast of the number of individuals expected to receive FEP.
4.94 Finally, we assume the average award increases at two per cent per year.
This reflects the increase in the average award for FEP over the last ten
years.
4.95 There has only been minor model refinement since our forecast in December
2017. We have performed our calculations at a more aggregated level given
the small sample sizes available from the Understanding Society survey and
PSM. This increases our forecast expenditure by an average of £0.4 million
from 2019-20 onwards.
UK Government and Scottish Government policy
4.96 Since our previous forecast, the UK Government has announced changes to
Funeral Expenses Payment that will mean recipients can receive contributions
from others without them being deducted from the payment, as well as
introducing other changes to make the system simpler.153 These changes
came into effect on 2 April 2018. We do not expect these changes to have an
impact on forecast expenditure but there is risk associated with this
assumption which is outlined in the uncertainties section below.
4.97 The Scottish Government has announced that they plan to replace FEP in
Scotland with Funeral Expense Assistance (FEA) by summer 2019.
4.98 Since our previous forecast, the Scottish Government has released a
consultation for the draft regulations for FEA.154 The consultation provides
further details on the Scottish Government’s proposals for FEA. The key
proposal that will impact expenditure is the change in approach to determine
whether the applicant is an appropriate person to take responsibility for the
funeral. Some of the restrictions in the current DWP FEP process would be
removed under these proposals and this would result in increased eligibility
and therefore increased forecast expenditure.
4.99 The forecast below covers expenditure in Scotland under current UK
Government policy. Our intention to produce forecasts for devolved benefits at
the time secondary legislation is introduced in Parliament is discussed in
paragraph 4.2. When secondary legislation for FEA is introduced in
153
UK Government (2018) Press release (link)
154 Scottish Government consultation on the Funeral Expense Assistance Regulations (link)

182
Parliament we will provide a forecast under the new Scottish Government
policy.
4.100 At Stage 3 of the Social Security Bill, an amendment was introduced that
would mean relevant figures prescribed in FEA regulations would be uprated
with inflation.155
This change will be reflected when we forecast FEA.
Forecast
4.101 Expenditure on FEP is forecast to remain around £5 million per year over the
forecast horizon. Pension Credit is a key qualifying benefit for FEP. As the
number of Pension Credit claimants falls the proportion of eligible deaths
decreases in our forecast. This is offset by an increase in average payments
and an increase in the total number of deaths.
Table 4.20: Forecast expenditure on Funeral Expenses Payment
£ million 2016-17 2017-18 2018-19 2019-20 2020-21 2021-22 2022-23 2023-24
Outturn
December 2017 5.1 5.0 5.1 5.1 5.0 5.0 5.1
Model Updates 0.0 0.0 0.3 0.4 0.3 0.3
May 2018 5.1 5.0 5.1 5.4 5.4 5.3 5.4 5.3
Total Change
0.0 0.0 0.3 0.4 0.3 0.3
Source: DWP unpublished outturn data, Scottish Fiscal Commission (2017) Scotland's Economic and Fiscal
Forecasts December 2017 (link), Scottish Fiscal Commission. Figures may not sum because of rounding.
Forecast uncertainty
4.102 There are a number of uncertainties around the forecast of FEP. The risks
around Universal Credit and the estimated proportion of individuals in receipt
of qualifying benefits are mentioned in Box 4.2. Additional uncertainties for the
forecast are the increase in average award and the recent changes
announced by the UK Government.
4.103 The average amount paid in FEP in Scotland has changed year on year by
between minus one per cent and plus eight per cent. If the average payment
was to grow at a different rate to our estimate (two per cent) this would impact
expenditure.
4.104 There is also uncertainty regarding the recent changes announced by the UK
Government.156 Many of these changes are not expected to impact
expenditure as they are focused on improvements to make the whole system
155
Social Security (Scotland) Bill (2018) [as passed] (link)
156 UK Government (2018) Press release: Claiming Funeral Expenses Payment to be made easier (link)

183
simpler. We note the following two changes which could potentially impact
expenditure.
4.105 Allowing recipients of a FEP to receive contributions from relatives, friends or
charities without them being deducted from the payment. We do not expect
this to have a material impact on expenditure. From DWP data we know that
the reported amount of Funeral Expenses Payment recovered in the UK is low
(approximately 0.26 per cent of total expenditure in 2016-17).157 We also
expect fewer deductions before awards are finalised which should increase
the average award paid out to individuals. Again we do not expect this to be
significant and we will review outturn data on the average award made to
claimants once this becomes available.
4.106 Extending the claim period from three to six months from the date of the
funeral. This could impact expenditure if a significant number of potential
claimants did not have time to submit an application within three months of the
funeral and they would now be able to apply as the window is extended.
There is currently no data available to be able to assess the impact this
change may have on take-up rates. Due to the large upfront costs of paying
for a funeral we do not expect many claimants to be claiming after the three
month period and we have assumed take-up rates are unchanged. We
recognise the potential upside risk to our forecast of this change and we will
continue to monitor as outturn data becomes available.
157
Annual Report by the Secretary of State for Work and Pensions on the Social Fund 2016-17 – Annex 1 (link)

184
Healthy Start Vouchers
Forecast
Table 4.21: Forecast expenditure on Healthy Start Vouchers
£ million 2016-17
Outturn
2017-18 2018-19 2019-20 2020-21 2021-22 2022-23 2023-24
4.6 4.4 4.2 4.0 3.9 3.7 3.6 3.4
Source: Department of Health unpublished management information, Scottish Fiscal Commission
Background
4.107 The Healthy Start Scheme provides vouchers to purchase healthy foods for all pregnant teenagers under the age of 18 plus pregnant women and families with children under the age of four who are in receipt of a qualifying benefit.
158
4.108 Those who qualify for Healthy Start Vouchers (HSV) receive weekly vouchers
worth £3.10 each that can be exchanged for milk, fruit and vegetables.
Forecast methodology
4.109 We have made minor refinements to our forecast model since our forecast in December 2017. We have updated for more recent population estimates from
National Records of Scotland (NRS) and Department of Health caseload and take-up rate statistics. These changes result in a marginally higher forecast as
shown in the forecast section below.
4.110 The forecast for HSV is based on a forecast of the number of successful
applicants (caseload) multiplied by voucher value, adjusted to create a yearly
figure.
4.111 The caseload is determined by forecasting the eligible population and
applying a take-up rate (see Box 4.4 on take-up rates) to this group. The
eligible population is forecast by applying eligibility rates to population (birth
and maternity) statistics and projections from NRS and ONS. The proportion
of the population estimated to be eligible to receive HSV is forecast to fall from
14 to 10 per cent over the forecast horizon, based on historic data and outputs
from the PSM. A key driver for falling eligibility rates is that the income
thresholds in the eligibility criteria are frozen in nominal terms, while
household incomes are expected to increase.
158
The qualifying benefits are: income support, income-based JSA, income-related ESA, child tax credit (with a
family income of £16,190 or less per year) or universal credit (with family take home pay of £408 or less per
month) (link)
185
4.112 We then apply a take-up rate of 70 per cent to the forecast eligible population.
The take-up rate is based on unpublished information from the Department of
Health and refers to the proportion of the eligible population who both apply
for and use their vouchers.
Scottish and UK policy changes
4.113 The powers over Welfare Foods (which includes HSV and also the Nursery Milk Scheme) are being devolved to Scotland through provisions in the Scotland Act 2016.
4.114 In 2018-19, HSV remains reserved and our current forecast assumes HSV
continues in line with current UK policy for the forecast horizon. HSV are
currently administered by the Department of Health but paid for from the
Scottish Budget.
4.115 Since our last publication, the Scottish Government has launched a
consultation on Welfare Foods.159 The consultation provides further details on
the Scottish Government’s proposals for Best Start Foods which will replace
the existing Healthy Start Scheme.
4.116 It is expected that Best Start Foods will commence by summer 2019 and be
delivered by the new Social Security Agency. The key changes proposed on
devolution are:
An increase in the weekly payment from £3.10 to £4.25
Support will be provided for families with children up to the age of three,
instead of up to the age of four under the Healthy Start Scheme
The introduction of a smartcard rather than paper vouchers
An expansion in the eligible foods to include eggs, tinned fruits,
vegetables, pulses and dried pulses
4.117 Our intention to produce forecasts for devolved benefits at the time secondary
legislation is introduced in Parliament is discussed in paragraph 4.2. When
secondary legislation for Best Start Foods is introduced in Parliament we will
provide a forecast under the new Scottish Government policy.
Forecast
4.118 The forecast for HSV is slightly higher than the forecast published in December 2017. This can be attributed to refinements to our forecast model and updated data from Department of Health and NRS.
159
Scottish Government Welfare Foods consultation (link)

186
4.119 Forecast expenditure is decreasing over the forecast horizon because of
decreasing eligibility rates. Other key components of the forecast model such
as number of children, number of pregnant women and take-up rates do not
change significantly over the period.
Table 4.22: Change in Healthy Start Vouchers forecast expenditure
£ million 2016-17
Outturn
2017-18 2018-19 2019-20 2020-21 2021-22 2022-23 2023-24
December
2017
4.6 4.3 4.0 3.8 3.8 3.5 3.5
Model updates 0.0 0.2 0.2 0.1 0.2 0.1
Data updates 0.0 0.0 0.0 0.0 0.0 0.0
May 2018 4.6 4.4 4.2 4.0 3.9 3.7 3.6 3.4
Total Change 0.1 0.2 0.3 0.1 0.2 0.1
Source: Department of Health unpublished management information, Scottish Fiscal Commission (2017)
Scotland's Economic and Fiscal Forecasts December 2017 (link), Scottish Fiscal Commission. Figures may not
sum because of rounding.
Forecast uncertainty
4.120 Many of the uncertainties around this forecast, such as population projections,
take-up rates, devolution and the number of individuals on qualifying benefits
are common to all social security forecasts and have been discussed in Box
4.2.

187
Sure Start Maternity Grant
Forecast
Table 4.23: Forecast expenditure on Sure Start Maternity Grant
£
million
2016-17
Outturn
2017-18 2018-19 2019-20 2020-21 2021-22 2022-23 2023-24
2.5 2.6 2.6 2.6 2.5 2.6 2.6 2.6
Source: DWP unpublished data, Scottish Fiscal Commission
Note: In our December 2017 publication the 2016-17 outturn value was shown as £2.0 million. This figure was
rounded and has been corrected above.
Background
4.121 Sure Start Maternity Grant (SSMG) is a one-off payment of £500 to help low
income households with the costs associated with having a first child.160
To
qualify, families must have been awarded at least one of the qualifying
benefits.161
4.122 An allowance was introduced in April 2011 for families who have multiple
children in one birth (referred to in this document as ‘multiple births’), where
they may be eligible to receive additional payments.
Approach to forecasting
4.123 The approach to forecast SSMG is unchanged since our forecast in
December 2017. There have only been minor refinements to our forecast
model which have not impacted forecast expenditure. The eligible population
is forecast by applying eligibility rates to birth data and population projections
from NHS and ONS respectively. The number of claimants is determined by
applying a take-up rate to the eligible population. We then multiply by the
award amount to determine forecast expenditure.
Scottish and UK Government policy changes
4.124 SSMG will be devolved to the Scottish Parliament and the Scottish
Government has announced plans to replace SSMG with the Best Start Grant
by summer 2019.
160
In some circumstances, such as for kinship carers or multiple births, a SSMG may be awarded for second or
subsequent children.
161 The qualifying benefits are: income support, income based JSA, income related ESA, child tax credit (which
includes a child, disabled child or severely disabled child element), pension credit (guarantee or savings credit),
working tax credit including the disabled worker or severe disability element or Universal Credit. Individuals may
also qualify if they are receiving a support for mortgage interest loan (link)

188
4.125 Since our previous forecast, the Scottish Government has released a
consultation for the draft regulations for Best Start Grant.162
The consultation
provides further details on the Scottish Government’s proposals for Best Start
Grant. The key changes proposed after devolution that will impact expenditure
are:
An increase in the maternity and new baby payment to £600 for a first
child and £300 for a subsequent child
The introduction of a nursery/early learning payment of £250 to help with
costs during nursery and early learning years
The introduction of a school payment of £250 to help with the costs of
preparing for primary school
4.126 The forecast below covers expenditure in Scotland under current UK
Government policy. Our intention to produce forecasts for devolved benefits at
the time secondary legislation is introduced in Parliament is discussed in
paragraph 4.2. When secondary legislation for Best Start Grant is introduced
in Parliament we will provide a forecast under the new Scottish Government
policy.
Forecast
4.127 The forecast has been extended to include 2023-24 but otherwise remains unchanged from our last publication.
Table 4.24: Forecast expenditure on Sure Start Maternity Grant
£
million
2016-17
Outturn
2017-18 2018-19 2019-20 2020-21 2021-22 2022-23 2023-24
2.5 2.6 2.6 2.6 2.5 2.6 2.6 2.6
Source: DWP unpublished data, Scottish Fiscal Commission.
Note: In our December 2017 publication the 2016-17 outturn value was shown as £2.0 million. This figure was
rounded and has been corrected above.
Forecast uncertainty
4.128 The uncertainties which are likely to affect the SSMG forecast are common
across all the social security forecasts. For more information on these, please
see Box 4.2.
162
Scottish Government consultation on the Best Start Grant Regulations (link)

189
Chapter 5 Borrowing
Background
5.1 The Commission is required to assess the reasonableness of the Scottish
Government’s projections of their borrowing.163
5.2 We fulfil this role by assessing any borrowing which Ministers can project in
advance. In our economy chapter, we assess if there is a Scottish specific
economic shock that would allow the Scottish Government increased
borrowing powers. This is discussed further in paragraph 5.6.
5.3 Our assessment of reasonableness will consider the level of borrowing
relative to the statutory caps set out in the Scotland Act 2016 and the
associated Fiscal Framework. The caps are detailed in Table 5.1.
5.4 Where appropriate, we will also consider how broader fiscal factors may affect
the resources available to the Scottish Government.164
For example, in this
report we examine the payments into, and drawdown of funds from, the
Scotland Reserve. We will review the scope of this assessment and our work
on borrowing over the summer.
Borrowing limits
5.5 Capital borrowing allows the Scottish Government to fund capital projects, for
example to invest in schools, roads and hospitals. The Scotland Act 2012
gave the Scottish Government power to borrow from the National Loans Fund,
through the issue of bonds, or through commercial loans (directly from a bank
or other lender). Resource borrowing can only be funded from the National
Loans Fund (NLF), whereas capital borrowing can be funded from the NLF,
commercial loans or the issue of bonds subject to a statutory aggregate cap
and an annual limit.165
These limits were increased with the Scotland Act
163
Scottish Fiscal Commission Act 2016 section 2(2)(b) (link)
164 Fiscal factors are defined in the Scottish Fiscal Commission Act 2016 (link) as: “anything which the Scottish
Ministers use to ascertain the amount of resources likely to be available for the purposes of sections 1 to 3 of the
Public Finance and Accountability (Scotland) Act 2000 (link)
165 Scotland Act 2012, Part 3 Borrowing (link)
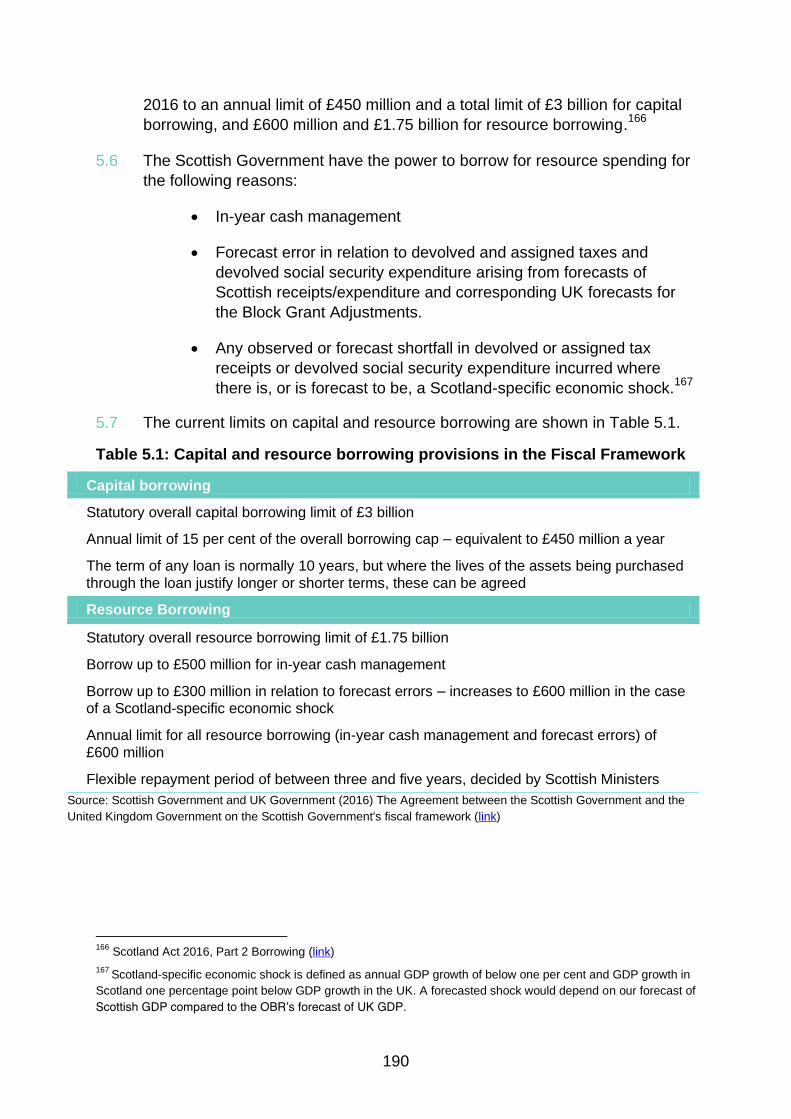
190
2016 to an annual limit of £450 million and a total limit of £3 billion for capital
borrowing, and £600 million and £1.75 billion for resource borrowing.166
5.6 The Scottish Government have the power to borrow for resource spending for
the following reasons:
In-year cash management
Forecast error in relation to devolved and assigned taxes and
devolved social security expenditure arising from forecasts of
Scottish receipts/expenditure and corresponding UK forecasts for
the Block Grant Adjustments.
Any observed or forecast shortfall in devolved or assigned tax
receipts or devolved social security expenditure incurred where
there is, or is forecast to be, a Scotland-specific economic shock.167
5.7 The current limits on capital and resource borrowing are shown in Table 5.1.
Table 5.1: Capital and resource borrowing provisions in the Fiscal Framework
Capital borrowing
Statutory overall capital borrowing limit of £3 billion
Annual limit of 15 per cent of the overall borrowing cap – equivalent to £450 million a year
The term of any loan is normally 10 years, but where the lives of the assets being purchased
through the loan justify longer or shorter terms, these can be agreed
Resource Borrowing
Statutory overall resource borrowing limit of £1.75 billion
Borrow up to £500 million for in-year cash management
Borrow up to £300 million in relation to forecast errors – increases to £600 million in the case
of a Scotland-specific economic shock
Annual limit for all resource borrowing (in-year cash management and forecast errors) of
£600 million
Flexible repayment period of between three and five years, decided by Scottish Ministers
Source: Scottish Government and UK Government (2016) The Agreement between the Scottish Government and the
United Kingdom Government on the Scottish Government's fiscal framework (link)
166
Scotland Act 2016, Part 2 Borrowing (link)
167 Scotland-specific economic shock is defined as annual GDP growth of below one per cent and GDP growth in
Scotland one percentage point below GDP growth in the UK. A forecasted shock would depend on our forecast of
Scottish GDP compared to the OBR’s forecast of UK GDP.

191
Capital borrowing assessment
5.8 The Scottish Government’s historic borrowing and borrowing plans, along with
repayment schedules and cumulative stock of debt are shown in Table 5.2.
This shows the repayment of the debt, not any interest payments.
5.9 The information on the borrowing plans up to 2023-24 has been provided to
the Commission by the Scottish Government, in addition to the following
information on repayment schedules:
Borrowing in 2018-19 and beyond is expected to be repaid over a
25 year time horizon, linked to the life of the assets that are likely to
be built. This flexibility on repayment period is built in to the Fiscal
Framework.
The 2018-19 Budget makes full use of the £450 million capital
borrowing powers available. Final decisions on the specific
borrowing arrangements for 2018-19 will be taken over the course
of the current financial year.
The Scottish Government expects to make full use of its borrowing
powers in 2019-20, but will take final decisions on whether to
borrow and how much to borrow in 2019-20 as part of the Scottish
Budget 2019-20.
Decisions on borrowing beyond 2019-20 will be considered as part
of the 2019 Spending Review process.
Borrowing undertaken in 2015-16 and 2016-17 was agreed to be
paid back over 30 years. This borrowing is different to borrowing
from 2017-18 onwards as it is notional.168
168
Scottish Ministers agreed a notional borrowing arrangement with HM Treasury in 2015-16 and 2016-17 as
part of managing the budgetary impact of ONS classification decisions on a number of Non-Profit Distributing
(NPD) projects, including the Aberdeen Western Peripheral Route. As a result, the amounts shown were
recorded against borrowing limits to be notionally repaid over 30 years (linked to the life of the underlying NPD
contracts). Notional borrowing counts towards the overall capital borrowing cap, but does not have a cash impact
on the Scottish Governments budget.
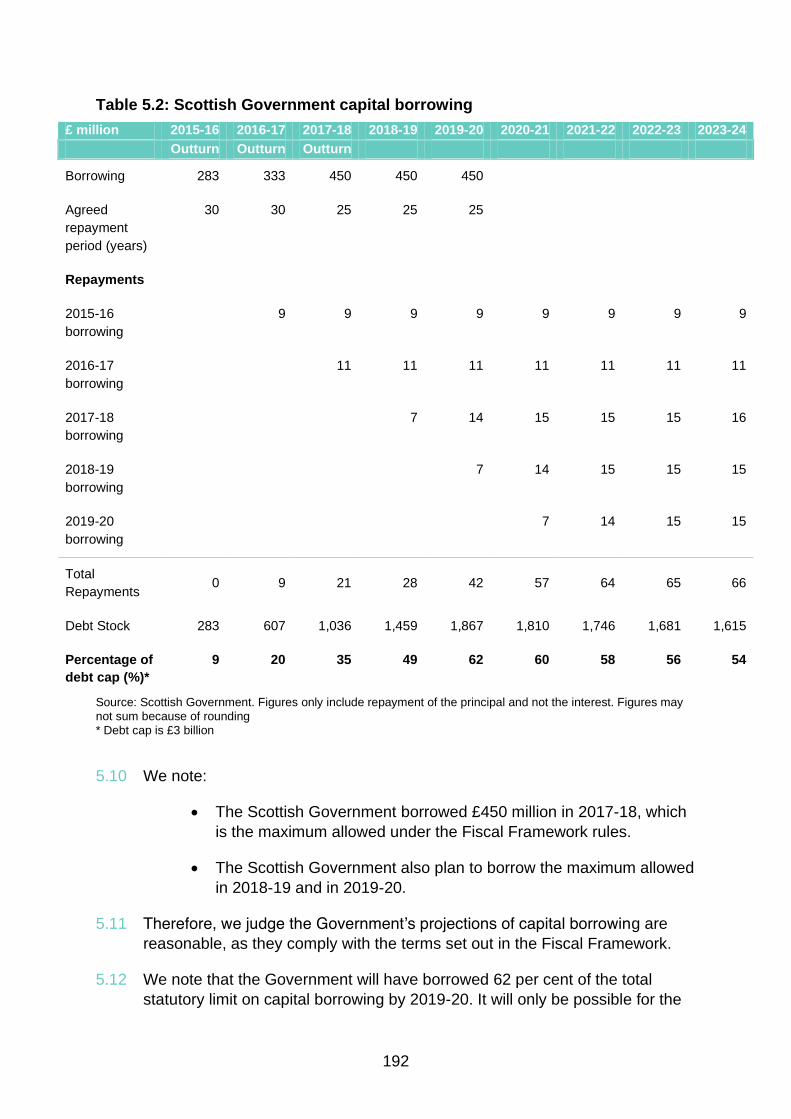
192
Table 5.2: Scottish Government capital borrowing
£ million 2015-16 2016-17 2017-18 2018-19 2019-20 2020-21 2021-22 2022-23 2023-24
Outturn Outturn Outturn
Borrowing 283 333 450 450 450
Agreed
repayment
period (years)
30 30 25 25 25
Repayments
2015-16
borrowing
9 9 9 9 9 9 9 9
2016-17
borrowing
11 11 11 11 11 11 11
2017-18
borrowing
7 14 15 15 15 16
2018-19
borrowing
7 14 15 15 15
2019-20
borrowing
7 14 15 15
Total
Repayments 0 9 21 28 42 57 64 65 66
Debt Stock 283 607 1,036 1,459 1,867 1,810 1,746 1,681 1,615
Percentage of
debt cap (%)*
9 20 35 49 62 60 58 56 54
Source: Scottish Government. Figures only include repayment of the principal and not the interest. Figures may
not sum because of rounding
* Debt cap is £3 billion
5.10 We note:
The Scottish Government borrowed £450 million in 2017-18, which
is the maximum allowed under the Fiscal Framework rules.
The Scottish Government also plan to borrow the maximum allowed
in 2018-19 and in 2019-20.
5.11 Therefore, we judge the Government’s projections of capital borrowing are
reasonable, as they comply with the terms set out in the Fiscal Framework.
5.12 We note that the Government will have borrowed 62 per cent of the total
statutory limit on capital borrowing by 2019-20. It will only be possible for the

193
Government to continue to borrow the maximum amount per year with a 25
year repayment horizon until 2022-23. Beyond this point, the statutory
borrowing cap of £3 billion would limit the annual amount available to
borrow.169
5.13 Our economy forecasts assume the Scottish Government borrows the
maximum amount in each year, until 2023-24 when capital borrowing is £144
million. This lower borrowing in 2023-24 has contributed to lower GDP growth
forecasts than would otherwise have been the case. See Chapter 2 for further
details.
Resource borrowing assessment
5.14 The Scottish Government have confirmed they have not used resource
borrowing powers to date and that there are no plans for resource borrowing
over the period of the MTFS.
5.15 We do not forecast an economic shock to allow access to the additional
resource borrowing set out in Table 5.1. The definition of a Scottish specific
economic shock discussed in paragraph 5.6. We are therefore not making any
assessment of resource borrowing.
The Scotland Reserve
5.16 The Scotland Act 2012 enabled the Scottish Government to make
discretionary payments into a cash reserve in advance of new powers being
devolved. Until 2017-18 the Scottish Government was able to carry forward
underspends, up to an agreed cap. This process is described as the Budget
Exchange Mechanism. The maximum resource budget which could be carried
forward was 0.6 per cent of resource spending by the Scottish Government.
The maximum capital budget was 1.5 per cent of Scottish Government capital
spending.170
5.17 Table 5.3 shows the historic transfer of funds using the Budget Exchange
Mechanism from 2013-14 to 2016-17.
169
If the government borrowed £450 million every year up to 2022-23, with a 25 year repayment schedule, the
debt stock would be £2,977 million at the end of 2022-23. This would represent 99 per cent of the £3 billion debt
cap. In 2023-24 they would be able to borrow £144 million. This would consist of the £23 million remaining of the
£3 billion cap, plus £120 million freed up by repayments during the year. Numbers may not sum perfectly
because of rounding.
170 HM Treasury (2015) Statement of funding policy: funding the Scottish Parliament, National Assembly for
Wales and Northern Ireland Assembly (link)

194
Table 5.3: Historic data on the use of the Budget Exchange Mechanism
£ million 2013-14 2014-15 2015-16 2016-17
Capital 4 45 35 35
Financial transactions* 31 14 40 52
Resource 142 153 91 110
Balance of Budget Exchange 177 212 166 197
Source: Scottish Government. Figures may not sum because of rounding
*Financial Transactions are separate to capital borrowing as they can only be used for the provision of loans or
equity investment beyond the public sector. Financial transactions have to be repaid to HMT in future years.
5.18 The Scotland Reserve came into effect in 2017-18 and replaced both the
Scotland Act 2012 cash reserve and the Budget Exchange Mechanism. The
Scotland Reserve provides the Scottish Government with a cash reserve to
build up funds when devolved revenues are higher than forecast and
drawdown funds when devolved revenues are lower than forecast. It also
allows the Scottish Government to carry forward any underspends in both
resource and capital budgets.
5.19 The Scotland Reserve is held within the UK Government’s Exchequer and is
separated between resource and capital.
5.20 Payments may be made into the resource reserve from the resource budget,
which includes tax receipts. Funds can be drawn down to fund resource or
capital spending. Similarly, payments may be made into the capital reserve
from the capital budget but can only be drawn down to fund capital spending.
5.21 The current limits on payments into and drawdowns from the Scotland
Reserve are show in Table 5.4.
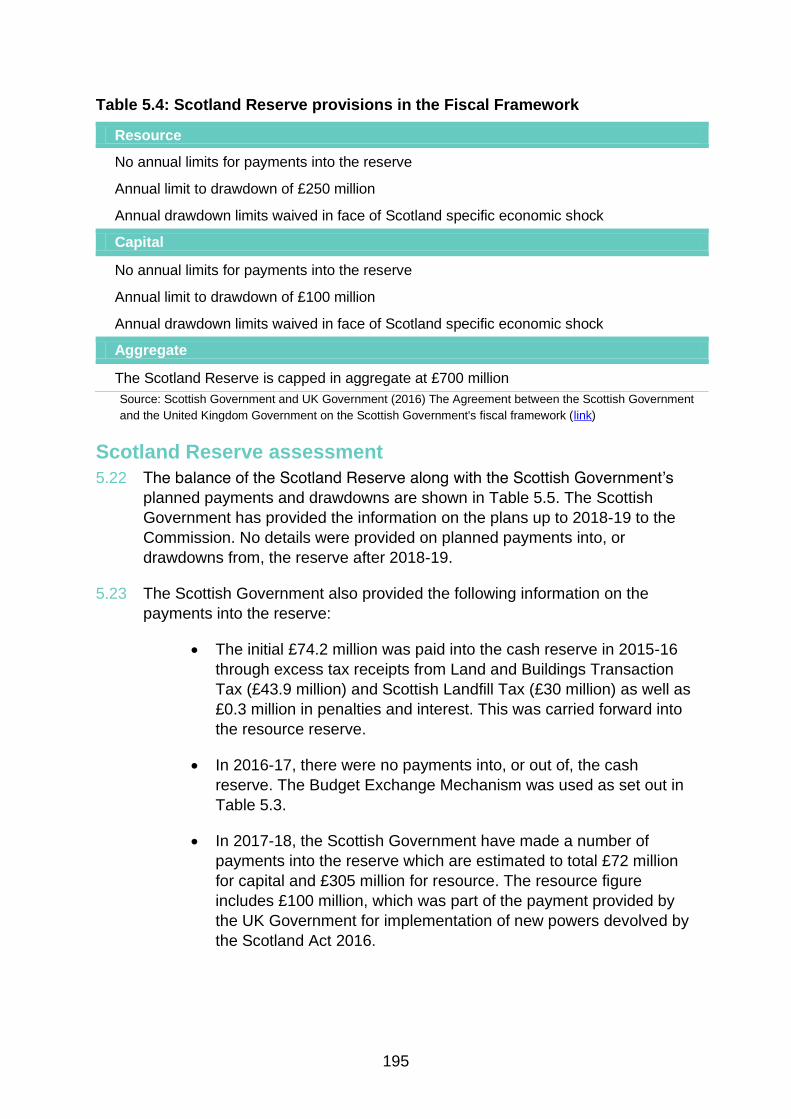
195
Table 5.4: Scotland Reserve provisions in the Fiscal Framework
Resource
No annual limits for payments into the reserve
Annual limit to drawdown of £250 million
Annual drawdown limits waived in face of Scotland specific economic shock
Capital
No annual limits for payments into the reserve
Annual limit to drawdown of £100 million
Annual drawdown limits waived in face of Scotland specific economic shock
Aggregate
The Scotland Reserve is capped in aggregate at £700 million
Source: Scottish Government and UK Government (2016) The Agreement between the Scottish Government
and the United Kingdom Government on the Scottish Government's fiscal framework (link)
Scotland Reserve assessment
5.22 The balance of the Scotland Reserve along with the Scottish Government’s
planned payments and drawdowns are shown in Table 5.5. The Scottish
Government has provided the information on the plans up to 2018-19 to the
Commission. No details were provided on planned payments into, or
drawdowns from, the reserve after 2018-19.
5.23 The Scottish Government also provided the following information on the
payments into the reserve:
The initial £74.2 million was paid into the cash reserve in 2015-16
through excess tax receipts from Land and Buildings Transaction
Tax (£43.9 million) and Scottish Landfill Tax (£30 million) as well as
£0.3 million in penalties and interest. This was carried forward into
the resource reserve.
In 2016-17, there were no payments into, or out of, the cash
reserve. The Budget Exchange Mechanism was used as set out in
Table 5.3.
In 2017-18, the Scottish Government have made a number of
payments into the reserve which are estimated to total £72 million
for capital and £305 million for resource. The resource figure
includes £100 million, which was part of the payment provided by
the UK Government for implementation of new powers devolved by
the Scotland Act 2016.

196
5.24 This resulted in the reserve having a provisional aggregate balance of £451
million at the start of 2018-19.171
5.25 Beyond the planned drawdown in 2018-19, the Scottish Government have no
current plans to drawdown further resources from the reserve.
Table 5.5: Scotland reserve
£ million 2017-18 2018-19
Outturn
Capital
Balance at start of year 0 72
Change in-year - Capital funds 60 -57
Change in-year - Financial transactions 12 -12
Balance at end of year 72 3
Resource
Balance at start of year 74 379
Change in-year 305 -238
Balance at end of year 379 141
Aggregate balance
Start of year 74 451
Change in-year 377 -306
End of year 451 144
Source: Scottish Government. The figures for 2017-18 and the plans for 2018-19 are provisional and are
expected to be confirmed by the Cabinet Secretary for Finance and the Constitution to the Scottish Parliament in
June 2018. Figures may not sum because of rounding
5.26 We note that:
The planned £68 million drawdown from the capital reserve
(including financial transactions) in 2018-19 is within the £100
million limit set by the Fiscal Framework.
The planned £238 million drawdown from the resource reserve in
2018-19 is within the £250 million limit set by the Fiscal Framework.
5.27 The Scotland Reserve replaced both the cash reserve and the Budget
Exchange Mechanism. Therefore, it is expected that the Scotland Reserve will
be used to transfer funds between financial years.
5.28 Given historic use of the Budget Exchange Mechanism, capital payments into
the reserve (including financial transactions) in 2017-18 are within the range
expected. The Government plan to drawdown capital payments in 2018-19.
171
Figures for 2017-18 represent the latest estimates provided by the Scottish Government. These may change,
both as year-end income and expenditure forecasts are confirmed over the coming weeks in the lead up to the
publication of the annual accounts. Figures will be confirmed by the Cabinet Secretary for Finance and the
Constitution to the Scottish Parliament in June.
197
5.29 The Scottish Government plan to drawdown £238 million from the resource
reserve in 2018-19. The Commission understands the planned drawdown
from the resource reserve in 2018-19 includes £100 million, which was part of
the payment provided to support the implementation of new powers as laid out
in the Fiscal Framework.172 This amount was paid as a one-off transfer in
2017-18. Adjusting for this would bring the planned resource drawdown into
line with historic use of the Budget Exchange Mechanism where an average
of £124 million in resource funding was transferred between years in the four
years prior to 2017-18.
5.30 Beyond 2018-19 drawdown, the Scottish Government have not outlined any
plans to drawdown further resources from the reserve. We expect that normal
budget management processes as per the historic use of the Budget
Exchange Mechanism will result in continued inflow into and outflow from the
reserve. We will continue to monitor the Scottish Government’s use of the
reserve and will comment further in our future publications.
172
Scottish Government and UK Government (2016) The agreement between the Scottish Government and the
United Kingdom Government on the Scottish Government’s fiscal framework (link)

198
199
Annex A Policy Costings
Introduction A.1 This Annex sets out the methodology underpinning new policy costings
included in the forecasts produced by the Commission for this report. The
material will show the different steps and judgments taken to arrive at our
costings of new Government policy proposals.
A.2 Our December 2017 publication included costings for policies announced by
the Scottish Government at the Draft Budget 2018-19. Since then, we have
costed two policies in supplementary publications: one on income tax and the
other on Land and Buildings Transaction Tax.
A.3 On 31 January 2018, the Scottish Government announced changes to income
tax during Stage 1 of the budget debate.173 To support Parliamentary scrutiny,
we provided updated income tax forecasts with policy costings for these
changes.174
A.4 On 18 May 2018, the Scottish Government published secondary legislation for
proposed changes to Group Relief for Non-Residential Land and Buildings
Transaction Tax.175 On the same day, we published a supplementary policy
costing of the tax revenue forgone as a result of the proposed change to
accompany the secondary legislation.176
A.5 Where we have previously provided a policy costing, any further changes will
be captured in Annex B on policy recostings. This section only provides
costings for policy changes where we have not previously provided a policy
costing.
173
Scottish Government (2018) Budget Bill 2018-19 stage 1 – news release (link)
174 Scotland’s Economic and Fiscal Forecasts Supplementary Publication – Updated Income Tax Forecasts –
February 2018 (link)
175 The Land and Buildings Transaction Tax (Group Relief Modification) (Scotland) Order 2018 (link)
176 Supplementary Costings Non-Residential Land and Buildings Transaction Tax Group Relief – May 2018 (link)

200
A.6 Table A.1 provides a summary of new policy costings included in our
forecasts.
Table A.1: Policy costings to accompany the Medium Term Financial Strategy
£ million 2018-19 2019-20 2020-21 2021-22 2022-23 2023-24
Social Security:
Carer’s Allowance
Supplement
0.0 -7.5 -8.1 -8.3 -8.8 -9.3
Non Domestic Rates:
Removal of New Start
relief
0.1 0.1 0.4 0.4 0.4 0.4
Overall impact of policy
proposals
0.1 -7.4 -7.7 -7.9 -8.4 -8.8
Source: Scottish Fiscal Commission.
Note: Negative figures indicate costs to the Scottish Budget, whilst positive figures indicate gains.
Figures may not add up to totals because of rounding.

201
Social Security
Title of measure
Change to the method of uprating the Carer’s Allowance Supplement
Measure description
A.7 The Social Security (Scotland) Bill has been amended to require the Carer’s
Allowance (CA) Supplement to be increased each year in line with inflation.
The CA supplement will be increased to the higher of: Jobseeker’s Allowance
(JSA) or the amount that JSA would be if it were adjusted for inflation.177
A.8 In December 2017, we assumed CA was increased to match the UK
Government’s JSA rate. The UK Government’s benefit freeze affects JSA and
it is not due to be uprated until the freeze ends in 2020-21. The introduction of
the uprating policy has increased our forecast of expenditure on the CA
Supplement.
The cost base
A.9 Expenditure for the CA Supplement is based on the number of individuals in
Scotland who are in receipt of CA on the eligibility dates defined by the
Scottish Government. The Scottish Government is yet to announce the
eligibility dates. Chapter 4 contains our forecast of the number of individuals
expected to receive CA payments over the forecast horizon used in the
costing.
The costing
A.10 While forecasting expenditure on the main CA, the CA rate (weekly amount
paid to individuals) was uprated each year in line with the CPI forecast. To
calculate the value of the CA Supplement we uprated the 2018-19 JSA rate in
line with CPI forecasts each subsequent year to create an illustrative JSA
rate.178 Table A.2 details the forecast JSA and CA rates.
177
Social Security (Scotland) Bill (2018) [as passed] (link)
178 Scottish Fiscal Commission (2018) Scotland’s Economic and Fiscal Forecasts May 2018 Supplementary
Economy Tables S2.7 (link)
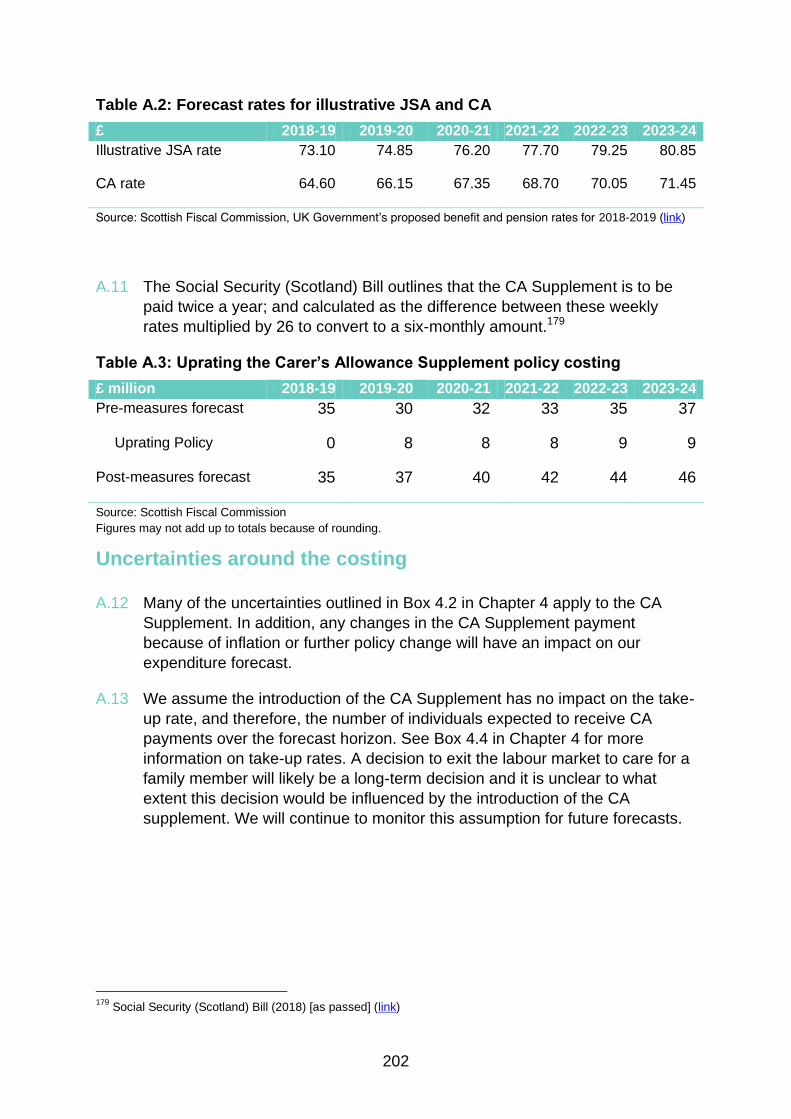
202
Table A.2: Forecast rates for illustrative JSA and CA
£ 2018-19 2019-20 2020-21 2021-22 2022-23 2023-24
Illustrative JSA rate 73.10 74.85 76.20 77.70 79.25 80.85
CA rate 64.60 66.15 67.35 68.70 70.05 71.45
Source: Scottish Fiscal Commission, UK Government’s proposed benefit and pension rates for 2018-2019 (link)
A.11 The Social Security (Scotland) Bill outlines that the CA Supplement is to be
paid twice a year; and calculated as the difference between these weekly
rates multiplied by 26 to convert to a six-monthly amount.179
Table A.3: Uprating the Carer’s Allowance Supplement policy costing
£ million 2018-19 2019-20 2020-21 2021-22 2022-23 2023-24
Pre-measures forecast 35 30 32 33 35 37
Uprating Policy 0 8 8 8 9 9
Post-measures forecast 35 37 40 42 44 46
Source: Scottish Fiscal Commission
Figures may not add up to totals because of rounding.
Uncertainties around the costing
A.12 Many of the uncertainties outlined in Box 4.2 in Chapter 4 apply to the CA
Supplement. In addition, any changes in the CA Supplement payment
because of inflation or further policy change will have an impact on our
expenditure forecast.
A.13 We assume the introduction of the CA Supplement has no impact on the take-
up rate, and therefore, the number of individuals expected to receive CA
payments over the forecast horizon. See Box 4.4 in Chapter 4 for more
information on take-up rates. A decision to exit the labour market to care for a
family member will likely be a long-term decision and it is unclear to what
extent this decision would be influenced by the introduction of the CA
supplement. We will continue to monitor this assumption for future forecasts.
179
Social Security (Scotland) Bill (2018) [as passed] (link)

203
Non-Domestic Rates
Title of Measure Removal of New Start relief
Measure Description A.14 New Start currently provides rates relief of up to 100 per cent for certain
empty new build properties.180
The relief is available for unoccupied properties
for a maximum 15 month period, which does not need to be continuous.
A.15 Following legislation passed in February 2018 New Start relief will not be
extended to properties entered on the roll after 1 April 2018. Properties
entered on the roll before this date will continue to be eligible for the relief until
the end of 2019-20.181
The cost base
A.16 The cost base for the removal of this policy is current forecast expenditure on
New Start relief for properties already on the roll.
The costing
A.17 Mid-year estimates for local authority relief expenditure are available. The
latest estimate for expenditure on New Start in 2017-18 is £0.35 million.
Expenditure to 2019-20 is projected forward by uprating latest estimates by
the annual growth in gross NDR income. To account for the removal of the
relief, the cost of New Start has been eliminated in our model from 2020-21
onwards.
A.18 An adjustment is also made to account for the interaction with the new relief
announced at the Draft Budget 2018-19 to delay entry on the roll for
unoccupied new builds. We assume that from April 2018, new builds that
previously may have claimed New Start will now be able to claim this relief.
Based on information from the 2016 Billing system, costs of New Start
attributable to new build properties from 2018 are removed from the forecast
cost of New Start. An equivalent increase is made to our costing for delaying
entry on the roll relief.
180
New Start is only available if the new entry is not a result of a combination or division of a building already on
the roll, and not a result of refurbishment or change of use of an existing building (including domestic property or
other property exempt from rating.
181 The Non-Domestic Rating (Unoccupied Property) (Scotland) Regulations 2018 (link)

204
A.19 Forecast NDR income is increased by just under £0.4 million in each year of
our forecast post 2020-21 as a result of this change.
Table A.4: Removal of New Start
£ million 2018-19 2019-20 2020-21 2021-22 2022-23 2023-24
Final Costing 0.1 0.1 0.4 0.4 0.4 0.4
Source: Scottish Fiscal Commission
Uncertainties around the costing
A.20 The main uncertainty for this costing is the projected cost of New Start, which
given the small number of properties may be volatile from year to year.
Additionally, the interaction between the removal of New Start and the
introduction of a new relief for unoccupied new builds is difficult to assess,
even when data from local authorities becomes available.

205
Annex B Policy Recostings
Introduction
B.1 A policy recosting is a revised estimate of a policy that has previously been
costed. There are two main reasons why we may recost previously
announced or implemented measures:
Changes or additional administrative outturn data available since the
introduction of the policy (or previous forecast). For example, we will
not receive outturn data on the 2017-18 Higher Rate threshold policy
until summer 2019.
We revise key judgements or assumptions relating to our previous
policy costing – particularly in response to new evidence.
B.2 This Annex sets out the latest policy recosting estimates and how they have
changed from the previous costing. All of the policy recostings contained in
this Annex fall under the first category (administrative outturn data not yet
available). We intend to publish this Annex twice a year as part of our
Scotland’s Economic Fiscal Forecast (SEFF) series.
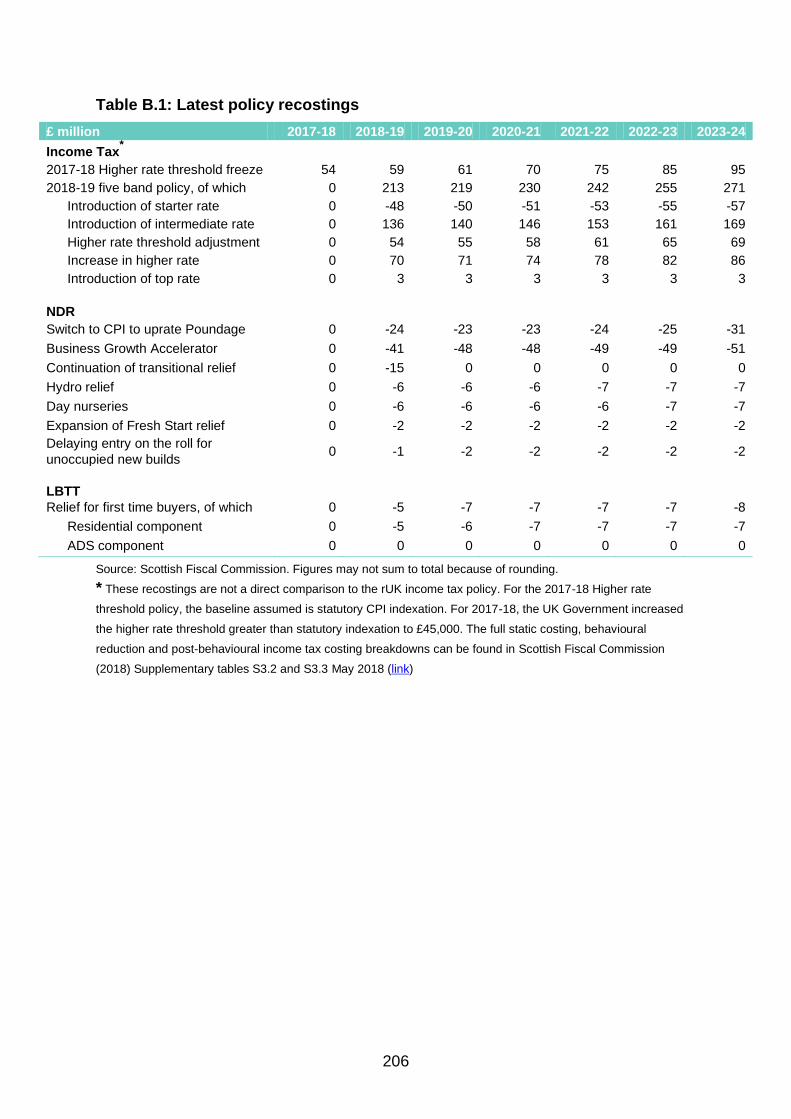
206
Table B.1: Latest policy recostings
£ million 2017-18 2018-19 2019-20 2020-21 2021-22 2022-23 2023-24
Income Tax*
2017-18 Higher rate threshold freeze 54 59 61 70 75 85 95
2018-19 five band policy, of which 0 213 219 230 242 255 271
Introduction of starter rate 0 -48 -50 -51 -53 -55 -57
Introduction of intermediate rate 0 136 140 146 153 161 169
Higher rate threshold adjustment 0 54 55 58 61 65 69
Increase in higher rate 0 70 71 74 78 82 86
Introduction of top rate 0 3 3 3 3 3 3
NDR
Switch to CPI to uprate Poundage 0 -24 -23 -23 -24 -25 -31
Business Growth Accelerator 0 -41 -48 -48 -49 -49 -51
Continuation of transitional relief 0 -15 0 0 0 0 0
Hydro relief 0 -6 -6 -6 -7 -7 -7
Day nurseries 0 -6 -6 -6 -6 -7 -7
Expansion of Fresh Start relief 0 -2 -2 -2 -2 -2 -2
Delaying entry on the roll for
unoccupied new builds 0 -1 -2 -2 -2 -2 -2
LBTT
Relief for first time buyers, of which 0 -5 -7 -7 -7 -7 -8
Residential component 0 -5 -6 -7 -7 -7 -7
ADS component 0 0 0 0 0 0 0
Source: Scottish Fiscal Commission. Figures may not sum to total because of rounding.
* These recostings are not a direct comparison to the rUK income tax policy. For the 2017-18 Higher rate
threshold policy, the baseline assumed is statutory CPI indexation. For 2017-18, the UK Government increased
the higher rate threshold greater than statutory indexation to £45,000. The full static costing, behavioural
reduction and post-behavioural income tax costing breakdowns can be found in Scottish Fiscal Commission
(2018) Supplementary tables S3.2 and S3.3 May 2018 (link)
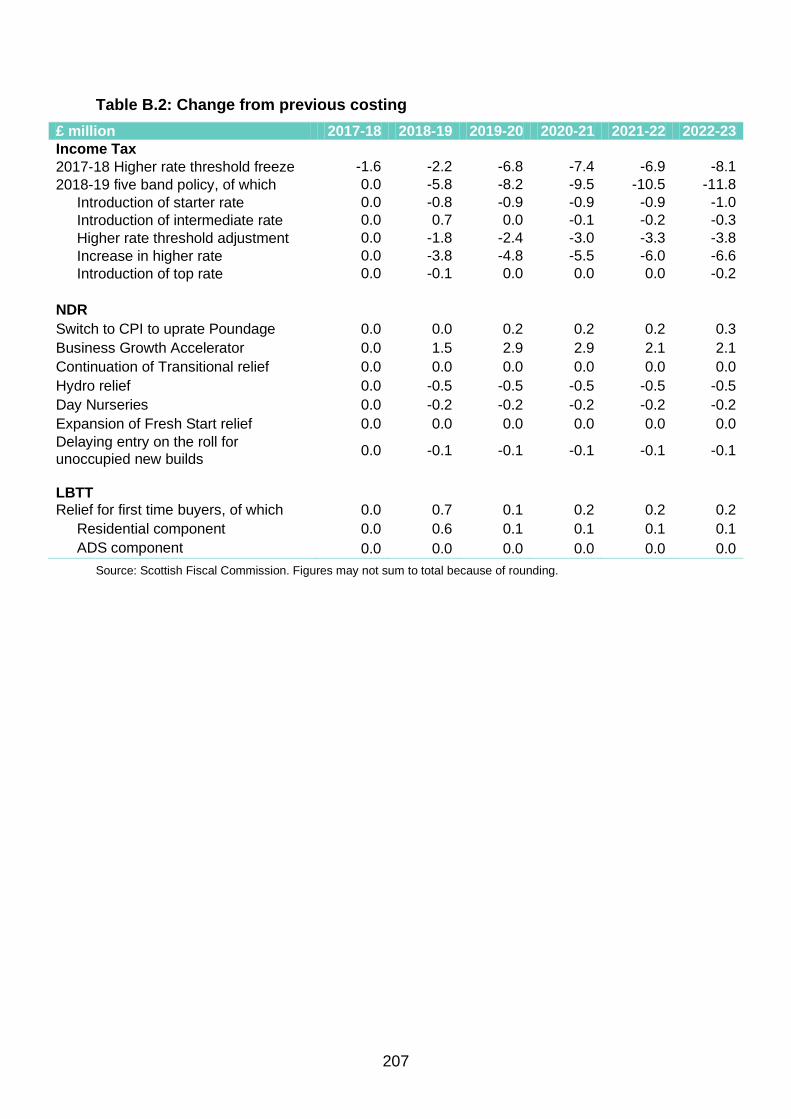
207
Table B.2: Change from previous costing
£ million 2017-18 2018-19 2019-20 2020-21 2021-22 2022-23
Income Tax
2017-18 Higher rate threshold freeze -1.6 -2.2 -6.8 -7.4 -6.9 -8.1
2018-19 five band policy, of which 0.0 -5.8 -8.2 -9.5 -10.5 -11.8
Introduction of starter rate 0.0 -0.8 -0.9 -0.9 -0.9 -1.0
Introduction of intermediate rate 0.0 0.7 0.0 -0.1 -0.2 -0.3
Higher rate threshold adjustment 0.0 -1.8 -2.4 -3.0 -3.3 -3.8
Increase in higher rate 0.0 -3.8 -4.8 -5.5 -6.0 -6.6
Introduction of top rate 0.0 -0.1 0.0 0.0 0.0 -0.2
NDR
Switch to CPI to uprate Poundage 0.0 0.0 0.2 0.2 0.2 0.3
Business Growth Accelerator 0.0 1.5 2.9 2.9 2.1 2.1
Continuation of Transitional relief 0.0 0.0 0.0 0.0 0.0 0.0
Hydro relief 0.0 -0.5 -0.5 -0.5 -0.5 -0.5
Day Nurseries 0.0 -0.2 -0.2 -0.2 -0.2 -0.2
Expansion of Fresh Start relief 0.0 0.0 0.0 0.0 0.0 0.0
Delaying entry on the roll for
unoccupied new builds 0.0 -0.1 -0.1 -0.1 -0.1 -0.1
LBTT
Relief for first time buyers, of which 0.0 0.7 0.1 0.2 0.2 0.2
Residential component 0.0 0.6 0.1 0.1 0.1 0.1
ADS component 0.0 0.0 0.0 0.0 0.0 0.0
Source: Scottish Fiscal Commission. Figures may not sum to total because of rounding.

208

209
Annex C Developing our
approach to forecasting VAT
Introduction C.1 The Commission is currently developing an approach to forecast revenue
from Value Added Tax (VAT) assigned to Scotland. Regulations have been
introduced in the Scottish Parliament to expand the remit of the Commission
to include VAT forecasting.182
This Annex sets out, at a high level, our
planned approach and the areas of uncertainty which will require careful
judgement.
C.2 This Annex is a starting point for discussion and will be followed by
stakeholder engagement and a more detailed methodology paper in
September 2018 in advance of our first full VAT forecast in our next
publication of Scotland’s Economic and Fiscal forecasts.
Background C.3 VAT is levied on the purchase of many goods and services. It is reflected in
the price paid when items are bought and is collected from traders. Unlike a
simple sales tax, it is levied on the amount of value added at each stage of
the production chain. For example, a retailer would be able to reclaim VAT
paid on the goods they bought from a wholesaler. Therefore the net VAT paid
to the Government would be on the price (value) added by the retailer. VAT
can either be charged at 20 per cent (standard rate), five per cent (reduced
rate) or zero per cent (either zero rated or exempt).183
C.4 The Fiscal Framework agreement between the Scottish and the UK
Governments states that receipts from the first 10p of standard rate of VAT
182
Draft amendments to the Scottish Fiscal Commission Act 2016 (2018) (link)
183 For more detail on goods that fall under the different rates see HMRC’s guidance (link)
210
and the first 2.5p of reduced rate of VAT in Scotland will be assigned to the
Scottish Government.184
C.5 VAT being assigned rather than devolved means the Scottish Government will
not have any policy control over VAT. For example, the Scottish Government
will not have the ability to change the rates of VAT in Scotland or change
which goods or services fall under the different rates.
C.6 Outturn receipts data for VAT raised in Scotland are not available. This will
still be the case when VAT is assigned to Scotland, as VAT is collected by
HMRC at a UK level. In a VAT return, there is no information on where the
sales of goods and services took place. Therefore, it is not possible to
calculate VAT raised in Scotland from tax returns.
C.7 Due to lack of outturn Scottish receipts, the amount of VAT assigned to
Scotland must be estimated using a statistical model. The methodology for
VAT assignment is currently under development by HMRC, HM Treasury and
Scottish Government officials prior to ministerial sign-off by the Joint
Exchequer Committee. The assignment model will use a range of sources to
estimate the proportion of UK expenditure across the different sectors that
occurs in Scotland. This method will be used to estimate an outturn figure,
which we will evaluate the accuracy of our forecasts against.
C.8 VAT assignment will be implemented in 2019-20 as part of a transitional
period where VAT raised in Scotland will be calculated but there will not be an
impact on the Scottish Government’s budget.
C.9 The National Statistics publication ‘Government Expenditure and Revenue
Scotland’ estimates that VAT revenue assigned to Scotland would have been
£5,097 million in 2016-17.185 186
Proposed approach to forecasting C.10 The Commission has considered a range of approaches to forecasting VAT
assigned to Scotland. Our approach will use components of our economy
forecasts, such as projections of household and government spending.
184
Scottish Government and UK Government (2016) The agreement between the Scottish Government and the
United Kingdom Government on the Scottish Government’s fiscal framework (link)
185 This figure represents 50 per cent of the assigned VAT receipts. Note the GERS methodology is not the same
approach discussed in paragraph C.7
186 Scottish Government (2017) Government Expenditure and Revenue Scotland 2016-17 (link)

211
C.11 The OBR commissions a UK VAT forecast from HMRC for each of their fiscal
events.187
We are currently reviewing these models and forecasts before
developing and refining our forecast approach for Scotland.
C.12 The UK forecast of VAT is based on the concept of a ‘VAT total theoretical
liability’ (VTTL). The VTTL is the total value of VAT that could theoretically be
collected from the tax base. The VTTL does not include any adjustments for
error, fraud, evasion, avoidance and debt to HMRC and therefore will always
be higher than outturn VAT receipts. The percentage difference between the
VTTL and the actual receipts represents an estimated VAT tax gap.188
C.13 The estimate for the historic Scottish share of VAT is likely to be based upon
a VTTL approach, although this is still to be finalised. We expect to use the
assignment model mentioned in paragraph C.7 as our baseline. We will grow
total expenditure in each sector in line with appropriate determinants from our
economic forecasts to generate a forecast of VAT revenue assigned to
Scotland. As there will not be outturn data available for Scotland, the tax gap
will be assumed to be consistent with the tax gap across the UK.
C.14 Figure C.1 sketches out in further detail of how this forecast may work in
practice.
187
The OBR’s website has a page dedicated to information on their UK VAT forecast (link)
188 HM Revenue & Customs (2017) Measuring tax gaps: Tax gap estimates for 2015-16. (link)

212
Figure C.1: Schematic representation of our likely approach to forecasting VAT
revenue assigned to Scotland
C.15 The key steps in this process will be:
4. The Commission will use historic estimates of assigned VAT revenue
as agreed by the Joint Exchequer Committee. The Scottish
Government, HM Treasury and HMRC are currently in the process of
agreeing a methodology for estimating the Scottish share of VAT
revenue. Our forecast in our next publication of Scotland’s Economic
and Fiscal Forecasts will use the figures calculated using this agreed
methodology as the baseline for the forecast.
Household
Estimated baseline for VAT revenue assigned to Scotland
Appropriate determinant used for each sector to grow total expenditure
Spending shares of each sector (standard, reduced, zero & exempt) are
projected over the forecast period
Adjust for corrections/certain refunds
Forecast of VAT revenue assigned to Scotland
1
2
3
4
5
6
Government Exempt Housing

213
5. We will split our forecast into these four main sectors as each are
driven by different determinants.189 The Household sector is the
largest, accounting for a majority of VAT revenue assigned in
Scotland.
6. The choice of determinant for each sector will be a judgement.
Where possible we will look to use Scottish specific determinants.
For instance, for the household sector we are likely to use Scottish
nominal household consumption.
7. We will forecast the share of spending subject to the different rates of
VAT that reflects changes in spending patterns within each sector.
Typically, consumer durables, such as televisions, are charged at the
standard rate of VAT (20 per cent). Necessities, such as food, are
more likely to be exempt from VAT. If consumers were to shift their
spending from durables to necessities then VAT revenue would
decline.
8. In the VAT assignment methodology there are a number of
corrections made. For instance, if a trader is below the registration
threshold then they do not charge VAT on their goods and
services.190 Similarly, various schemes and reliefs will allow
businesses to reclaim VAT. Other adjustments are made to account
for domestic and foreign tourism in the model. We will consider
whether any of these factors are likely to change over the forecast
period and therefore will need to be accounted for in our model.
9. This will produce our forecast of VTTL for Scotland. As discussed in
paragraph C.13 we will use the UK tax gap estimates to move from
VTTL to VAT receipts.
Key drivers
C.16 Household expenditure accounts for the majority of VAT revenue assigned in
Scotland. We will likely use the Scottish nominal household consumption
forecast, which is generated as part of our economy forecast to grow
household expenditure.
C.17 Table C.1 shows the forecast for growth in household consumption in
Scotland compared to the UK as a whole. Household consumption is a major
component of VAT revenue and we note that growth in household
consumption is forecast to be slower in Scotland than the UK. Other
determinants will affect our forecast of the Scottish share of VAT assignment.
189
We anticipate that Non Profit Institutions Serving Households (NPISH) will be included within the household
sector for the purposes of our forecast.NPISH are non-government institutions that provide their goods and
services below the market price. Most charities fall under this sector
190 For more details on the VAT registration see the UK Government’s guidance (link)

214
Any impact for the Scottish Government’s budget will depend on the Block
Grant Adjustment.191
Slower growth in nominal household consumption would
lead to a reduction in the Scottish share of total UK VAT revenue assigned to
Scotland over the forecast period.
Table C.1: Nominal Household consumption forecasts for Scotland and for the
UK
Percentage
change on
previous year
2016-17
Outturn
2017-
18
2018-
19
2019-
20
2020-
21
2021-
22
2022-
23
2023-
24
Scotland 4.3 2.9 2.5 2.4 2.7 2.8 2.9 3.1
UK 4.6 3.3 2.9 2.9 3.2 3.5 3.5
Source: Scottish Fiscal Commission; UK growth rates calculated using OBR March 2018 Economic and fiscal
outlook - supplementary economy tables, tab 1.2 Private Consumption (link).
Note: Scottish household consumption in nominal terms is derived by applying the Consumer Expenditure
Deflator to real-terms household consumption.
C.18 The Commission will make judgements in order to create forecasts where
there is uncertainty or limited evidence. In addition to expenditure in each
sector, the key drivers in our forecast which will require further investigation
and judgement include:
Standard, reduced and exempt spending shares. Our judgement
will be informed by the evidence on changes at the UK level, the
historical estimates of the share and any other factors in our broader
economy forecasts that we consider relevant.
Feedback between our forecast of VAT assignment and our
economy forecast. Assignment of VAT will be the second largest
revenue source to affect the Scottish Government’s budget after
income tax. Government spending is a significant component of
GDP. Therefore, there will be interdependence between our VAT and
economy forecasts.
Timeline for engagement and forecast development
C.19 The Commission will develop a methodology for forecasting assignment of
VAT revenue to Scotland over the summer. We will present the results of this
development work along with an illustrative forecast in September 2018, using
economic determinants taken from our forecasts in this publication.
C.20 We will publish our first full VAT forecast in our next publication of Scotland’s
Economic and Fiscal Forecasts.
191
During 2019-20 VAT assignment will be calculated but there will be no impact on the Scottish Government’s
budget due to a corresponding adjustment to the block grant. Beyond this point the BGA is yet to be decided.

215
Abbreviations
AA Attendance Allowance
ADS Additional Dwelling Supplement ALEOs Arm’s length external organisations APD Air Passengers Duty
APS Annual Population Survey
ARIMA Autoregressive Integrated Moving Average ASHE Annual Survey of Hours and Earnings AWE Average Weekly Earnings
BGA Block Grant Adjustment BMW Biodegradable Municipal Waste
BOE Barrels of Oil Equivalent CA Carer’s Allowance CAA Civil Aviation Authority
CBI Confederation of British Industry
CGT Capital Gains Tax COE Compensation of Employees COSLA Convention of Scottish Local Authorities
CPI Consumer Price Index DHP Discretionary Housing Payment
DLA Disability Living Allowance DWP Department for Work and Pensions
ESA Employment and Support Allowance EU European Union FEA Funeral Expense Assistance FEP Funeral Expenses Payment FOI Freedom of Information
FSS Fair Start Scotland FT Full Time
FTB First Time Buyers GCF Gross Capital Formation GDP Gross Domestic Product GERS Government Expenditure & Revenue Scotland GWE Gross Weekly Earnings
HMRC Her Majesty’s Revenue and Customs HR Higher Rate HSV Healthy Start Vouchers

216
ICE Intercontinental Exchange
IFI Independent Fiscal Institution IPS International Passenger Survey JSA Jobseeker’s Allowance LBTT Land and Buildings Transaction Tax
LHA Local Housing Allowance LFS Labour Force Survey MCC Material Change of Circumstances MTFS Medium Term Financial Strategy NDR Non-Domestic Rates
NDRi Non-Domestic Rates Income NHS National Health Service NLF National Loans Fund NPD Non-Profit Distributing NPISH Non-Profit Institutions Serving Households
NPV Net Present Value NRS National Records of Scotland
NSND Non-Savings and Non-Dividends OBR Office for Budget Responsibility OECD Organisation for Economic Co-operation and Development ONS Office for National Statistics
PAYE Pay As You Earn PIP Personal Independence Payment
PMI Purchasing Managers’ Index PSM Policy Simulation Model PUT Public Use Tape
QNAS Quarterly National Accounts Scotland RDF Refuse Derived Fuel
RHDI Real Household Disposable Income
RPI Retail Price Index
RTI Real Time Information RV Rateable Value RSRS Removal of the Spare Room Subsidy
SAA Scottish Assessors Association SCC Scottish Chambers of Commerce
SDLT Stamp Duty Land Tax SEFF Scotland’s Economic and Fiscal Forecasts SEPA Scottish Environmental Protection Agency
SFC Scottish Fiscal Commission SG The Scottish Government SLfT Scottish Landfill Tax SPA State Pension Age
SPI Survey of Personal Incomes SSMG Sure Start Maternity Grant SWF Scottish Welfare Fund
TIE Taxable Income Elasticity TMI Tax Motivated Incorporations UC Universal Credit UKCS UK Continental Shelf UKF UK Finance

217
VAT Value Added Tax
VTTL VAT Total Theoretical Liability A full glossary of terms is available on our website:
http://www.fiscalcommission.scot/about-us/glossary-of-terms/

© Crown copyright 2018
This publication is available at www.fiscalcommission.scot
Any enquiries regarding this publication should be sent to us at: Scottish Fiscal
Commission, Governor’s House, Regent Road, Edinburgh EH1 3DE or
ISBN: 978-1-9998487-8-1
Published by the Scottish Fiscal Commission, May 2018