Embed Size (px)
Citation preview

Economic and Political Challenges for Scotland’s Top Businesses
Professor David Bell
University of Stirling
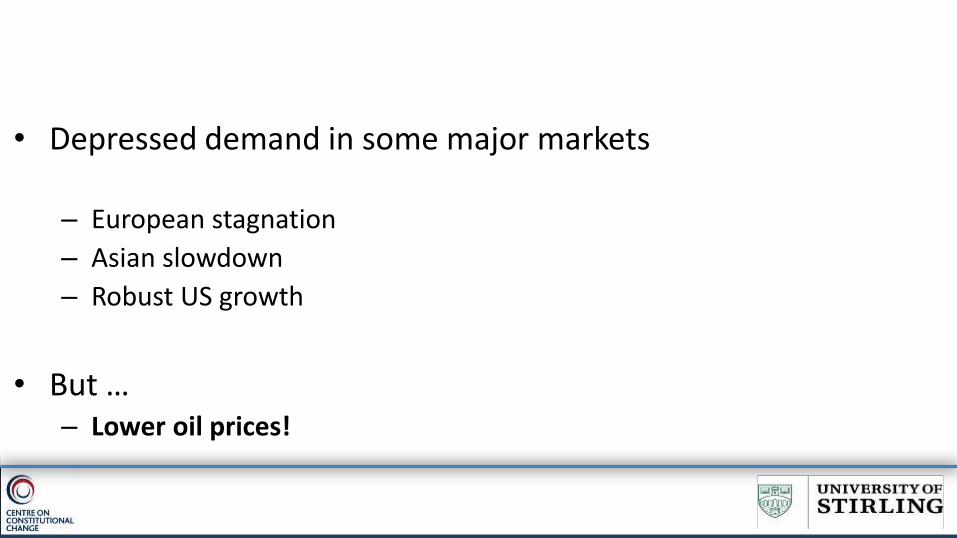
• Depressed demand in some major markets
– European stagnation
– Asian slowdown
– Robust US growth
• But … – Lower oil prices!
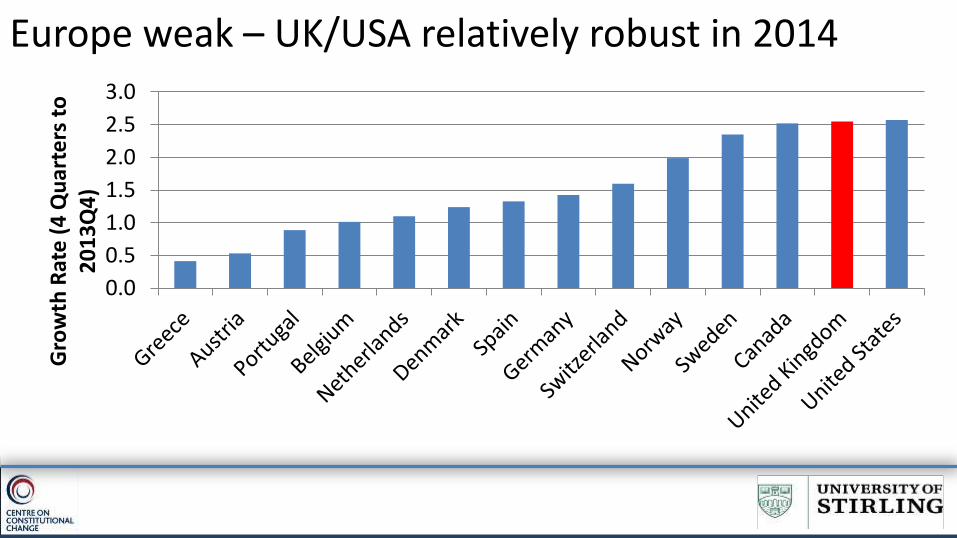
Europe weak – UK/USA relatively robust in 2014
0.0
0.5
1.0
1.5
2.0
2.5
3.0
Gro
wth
Rat
e (
4 Q
uar
ters
to
2
01
3Q
4)
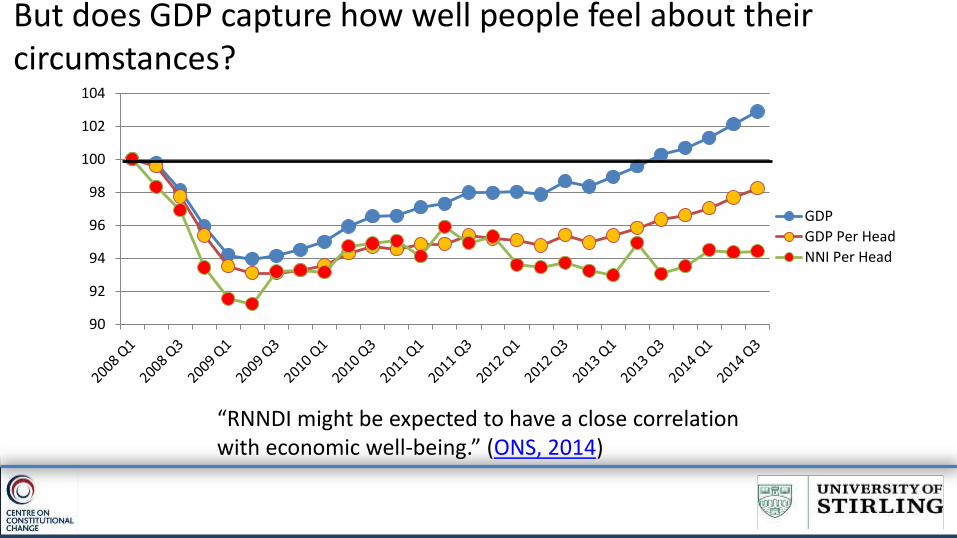
But does GDP capture how well people feel about their circumstances?
90
92
94
96
98
100
102
104
GDP
GDP Per Head
NNI Per Head
“RNNDI might be expected to have a close correlation with economic well-being.” (ONS, 2014)
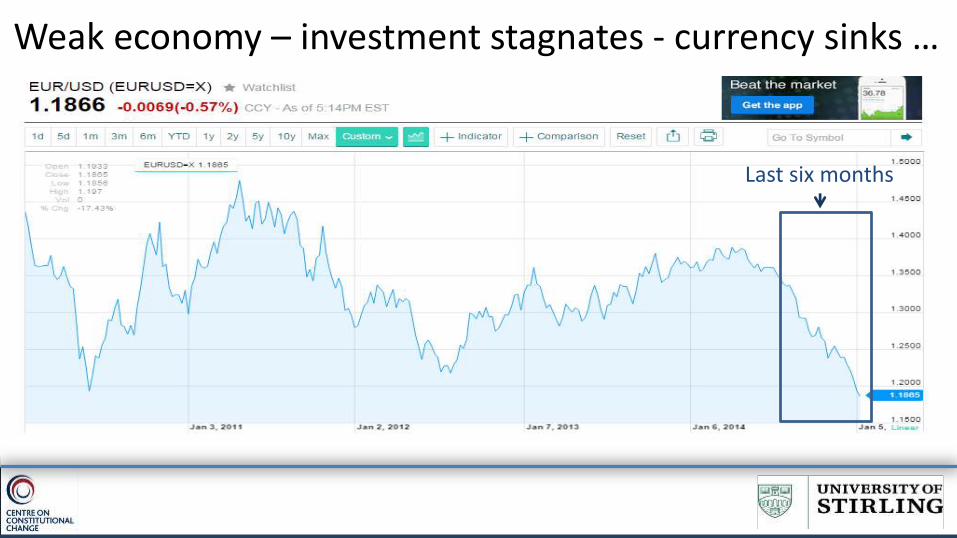
Weak economy – investment stagnates - currency sinks …
Last six months
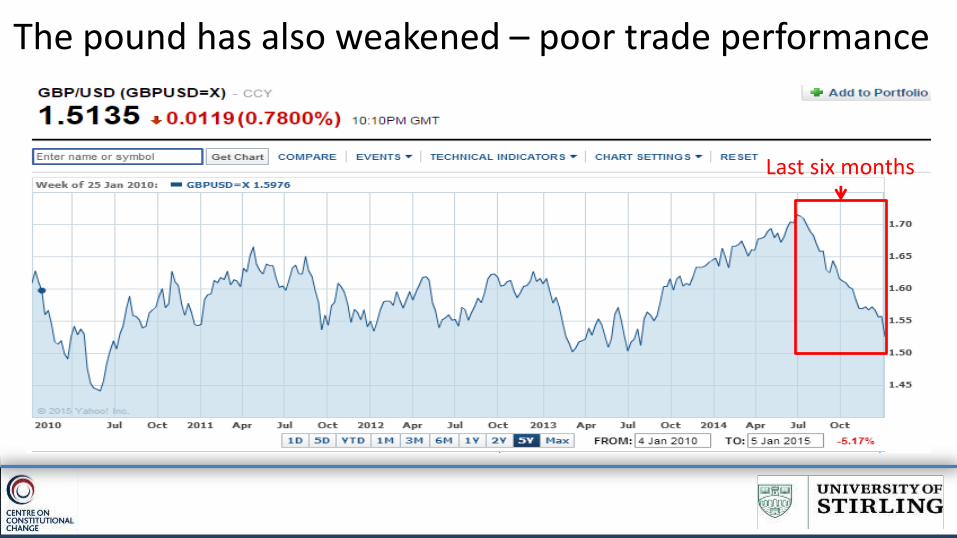
The pound has also weakened – poor trade performance
Last six months
• Countries with weak growth likely to have poor investment prospects
• Investors may shift in government debt to earn a stable return• Countries with fast growth have better investment returns.
Governments have to compete with industry for investment funds.
• Countries with high debt and concerns about default are unlikely to have high demand for their debt. Their debt loses value because investors don’t want to hold
• Yields increase.
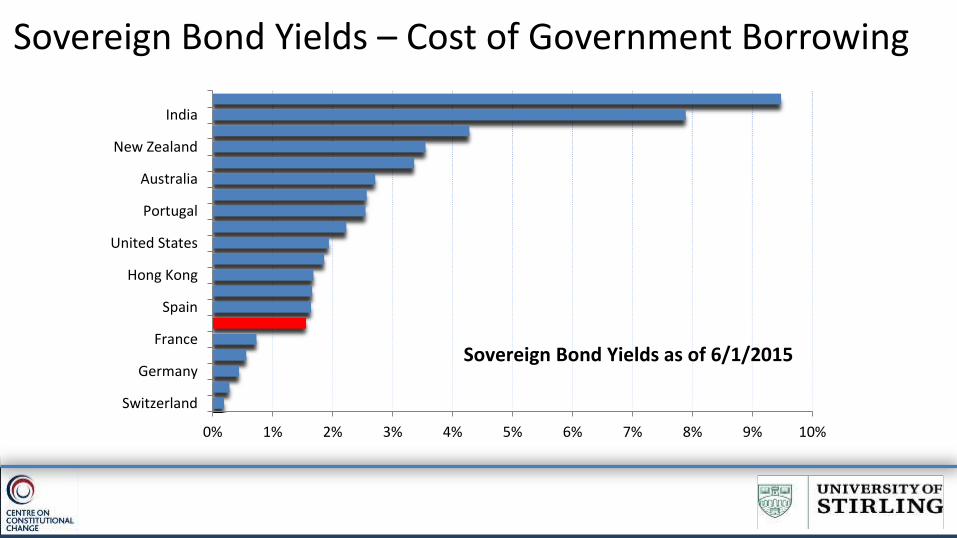
Sovereign Bond Yields – Cost of Government Borrowing
0% 1% 2% 3% 4% 5% 6% 7% 8% 9% 10%
Switzerland
Germany
France
Spain
Hong Kong
United States
Portugal
Australia
New Zealand
India
Sovereign Bond Yields as of 6/1/2015
The Oil Issue
• Lower prices good for:– Countries/regions that import oil
– Companies that use hydrocarbons for energy/manufacturing
• Lower prices bad for:– Oil exporting countries/regions
– Oil industry
• Oil price is highly volatile – difficult to hedge in the long-term
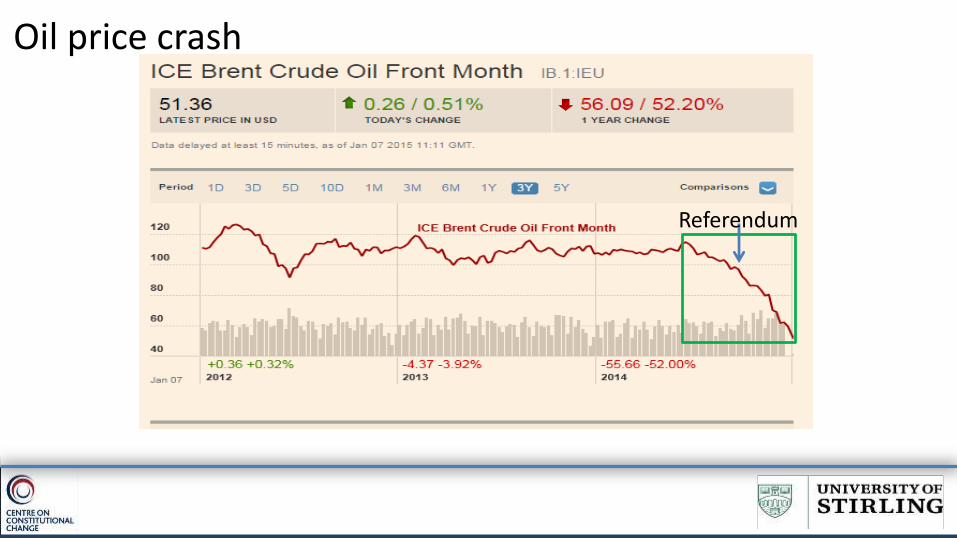
Oil price crash
Referendum
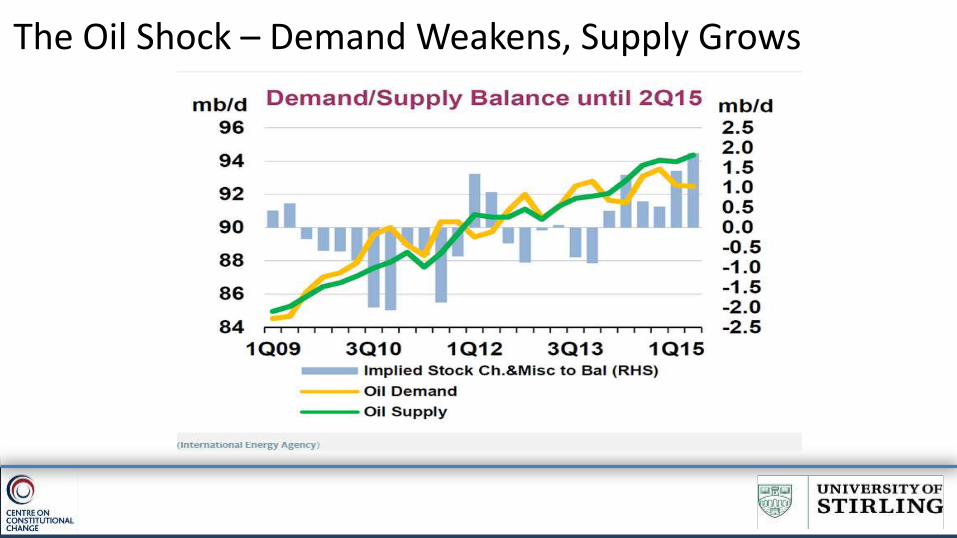
The Oil Shock – Demand Weakens, Supply Grows
The UK Perspective
• Strong growth performance in 2014, but slower growth from 2015 onward
• Price inflation undershooting its target– No scope for conventional monetary policy to increase prices– Unlikely that there will be any interest rate rise
• Weak nominal wage growth– Living standards for poorer households static or declining– Offset by increasing population
• Uncertainty over course of government deficit = taxes – government spending
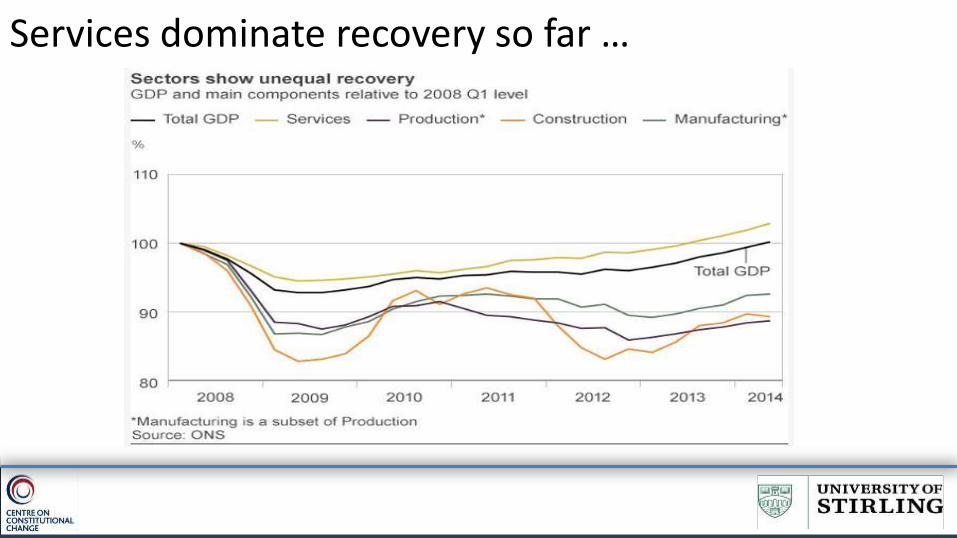
Services dominate recovery so far …
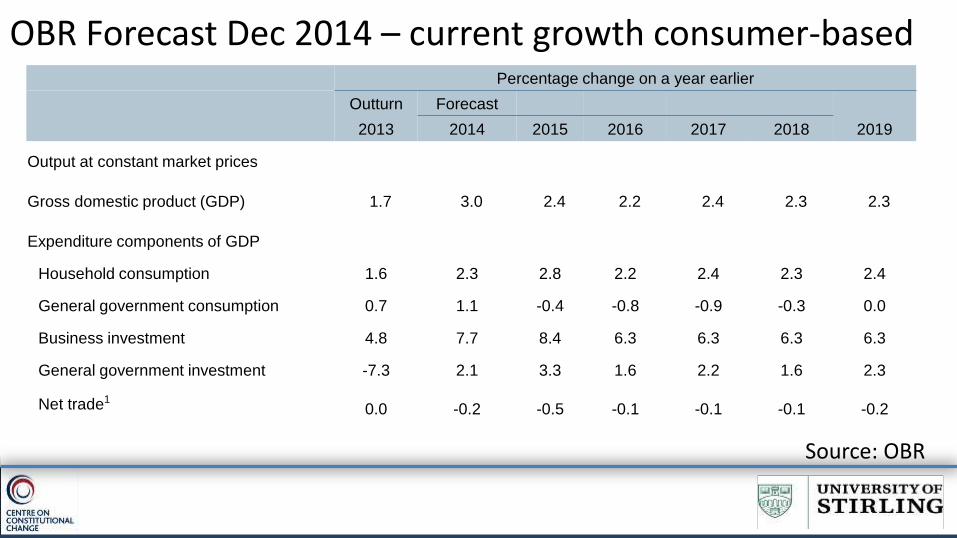
OBR Forecast Dec 2014 – current growth consumer-basedPercentage change on a year earlier
Outturn Forecast
2013 2014 2015 2016 2017 2018 2019
Output at constant market prices
Gross domestic product (GDP) 1.7 3.0 2.4 2.2 2.4 2.3 2.3
Expenditure components of GDP
Household consumption 1.6 2.3 2.8 2.2 2.4 2.3 2.4
General government consumption 0.7 1.1 -0.4 -0.8 -0.9 -0.3 0.0
Business investment 4.8 7.7 8.4 6.3 6.3 6.3 6.3
General government investment -7.3 2.1 3.3 1.6 2.2 1.6 2.3
Net trade10.0 -0.2 -0.5 -0.1 -0.1 -0.1 -0.2
Source: OBR

The Next Five Months
PA/BBC
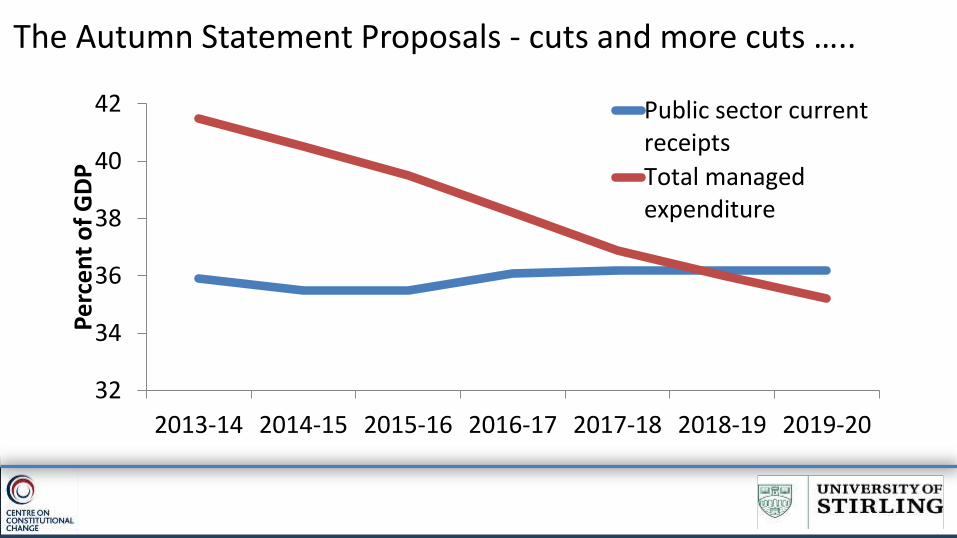
The Autumn Statement Proposals - cuts and more cuts …..
32
34
36
38
40
42
2013-14 2014-15 2015-16 2016-17 2017-18 2018-19 2019-20
Pe
rce
nt
of
GD
PPublic sector currentreceipts
Total managedexpenditure
Key Political Arguments Over Tax and Spending
• How quickly to reduce deficit?
• What level of borrowing is acceptable?
• Focus on spending cuts or introduce some tax increases?
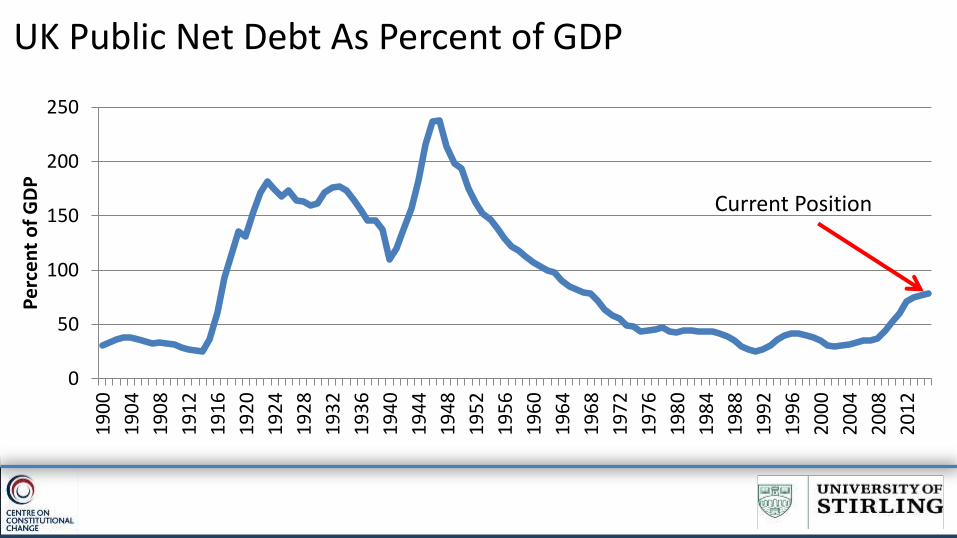
UK Public Net Debt As Percent of GDP
0
50
100
150
200
2501
90
0
19
04
19
08
19
12
19
16
19
20
19
24
19
28
19
32
19
36
19
40
19
44
19
48
19
52
19
56
19
60
19
64
19
68
19
72
19
76
19
80
19
84
19
88
19
92
19
96
20
00
20
04
20
08
20
12
Pe
rce
nt
of
GD
P
Current Position
More or Less Debt?
• Debt should be reduced in the good times, so that in the bad times it can be increased in order to help individuals and firms adjust to shocks.
• Governments should only commit future generations to pay for spending that those future generations will benefit from themselves.
• There should be some limit to how much we pre-commit future taxpayers to, not only on fiscal sustainability grounds but also because it involves making a choice on behalf of people who have no power to resist.
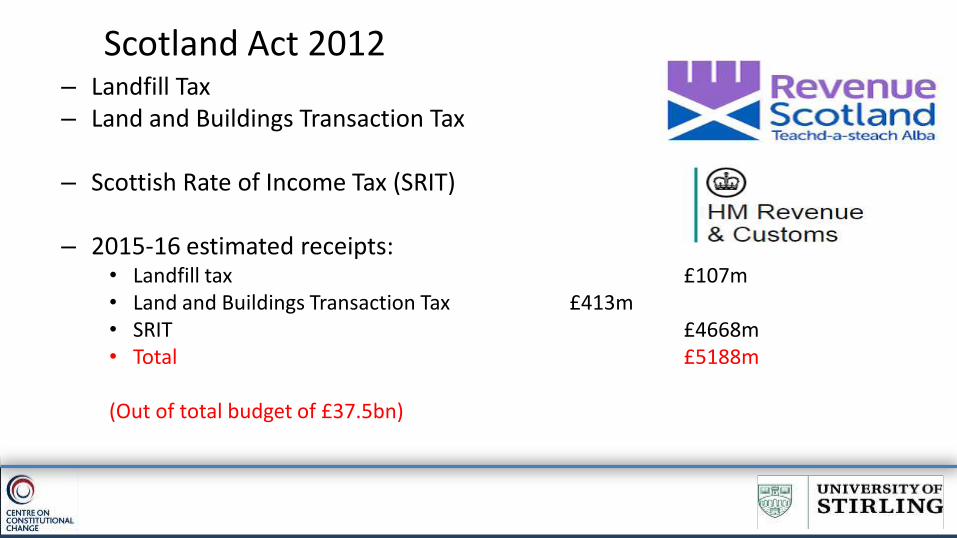
Scotland Act 2012– Landfill Tax– Land and Buildings Transaction Tax
– Scottish Rate of Income Tax (SRIT)
– 2015-16 estimated receipts: • Landfill tax £107m • Land and Buildings Transaction Tax £413m• SRIT £4668m• Total £5188m
(Out of total budget of £37.5bn)
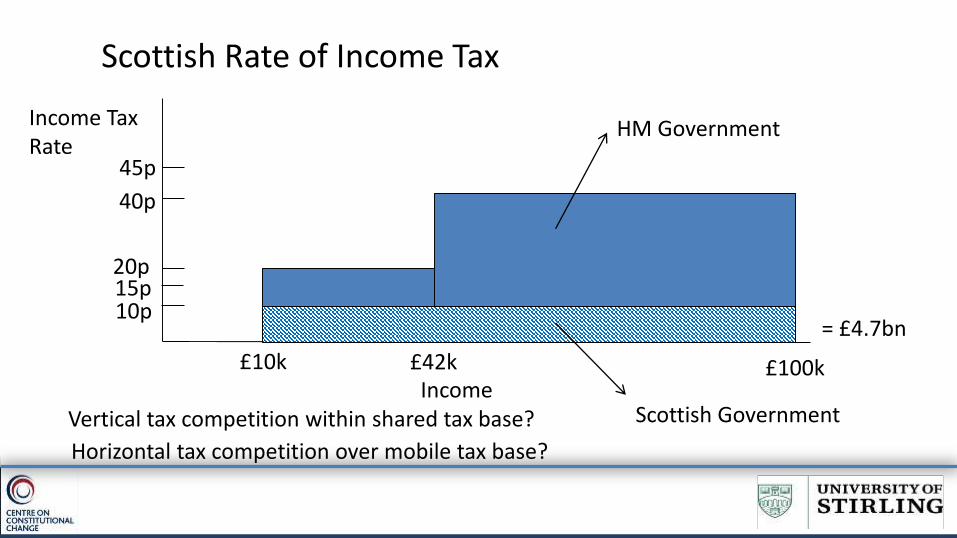
Scottish Rate of Income Tax
Income
Income TaxRate
£10k £42k £100k
20p
40p
45p
10p
Scottish Government
HM Government
= £4.7bn
Vertical tax competition within shared tax base?
Horizontal tax competition over mobile tax base?
15p
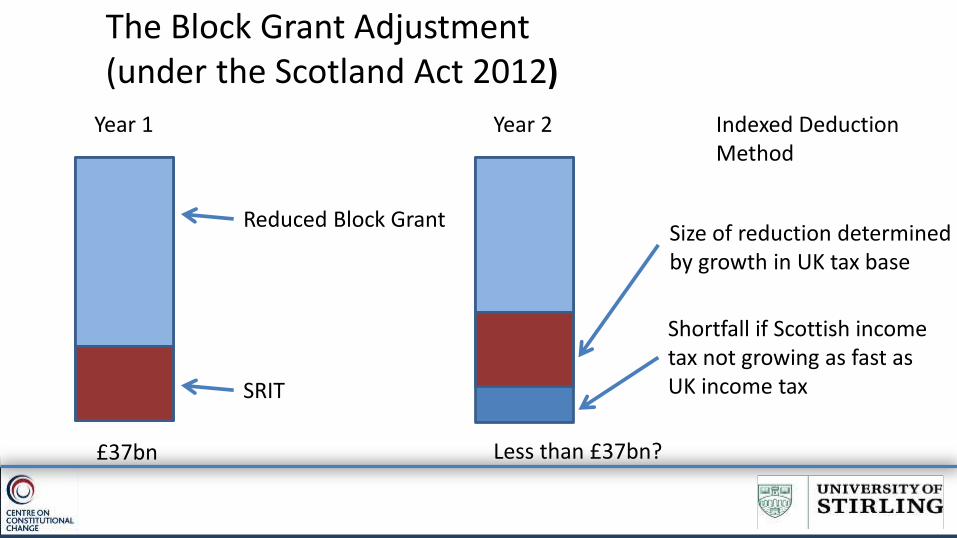
The Block Grant Adjustment (under the Scotland Act 2012)
Year 1
Less than £37bn?
SRIT
Reduced Block Grant
Year 2
£37bn
Size of reduction determinedby growth in UK tax base
Shortfall if Scottish incometax not growing as fast asUK income tax
Indexed DeductionMethod
The Smith Commission – Fiscal Powers
• Scottish Parliament gains control over all of income tax except the personal allowance
• Scottish Parliament to receive the first 10 percentage points of VAT raised in Scotland, but cannot influence the UK’s overall UK rate
• Air Passenger Duty
• Some welfare powers
• Can supplement existing welfare benefits
• More borrowing power to cover forecasting errors
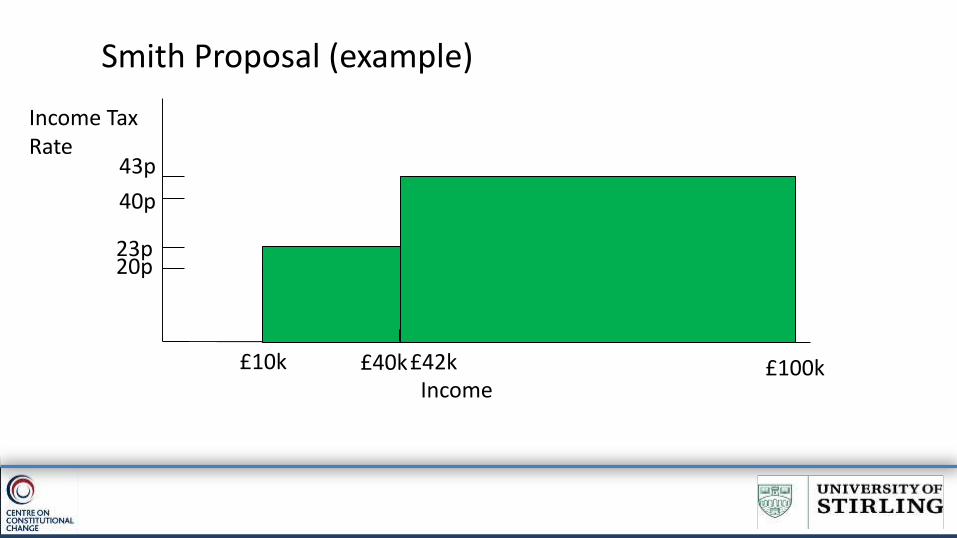
Smith Proposal (example)
Income
Income TaxRate
£10k £42k £100k
20p
40p
23p
£40k
43p
Conclusion – Some Key Questions
• Will the powers be used?
• How will their use be influenced by business?
• How effective could the powers be in stimulating business?
• What other business-friendly policies could the Scottish Parliament introduce?