Embed Size (px)
Citation preview
1 © Crown Copyright 2015 National Records of Scotland
Scotland’s Census 2011: Gaelic report (part 1)
30 September 2015
An Official Statistics publication for Scotland. Official Statistics are produced to high professional standards set out in the Code of Practice for Official Statistics.
2 © Crown Copyright 2015 National Records of Scotland
Contents
1. Introduction .............................................................................................. 3
2. Gaelic language skills .............................................................................. 6
3. Characteristics of Gaelic speakers in 2011 .......................................... 13
4. Gaelic home language use .................................................................... 17
Background Notes ....................................................................................... 19
Appendices ................................................................................................... 22
Acknowledgement
National Records of Scotland is grateful to Dr Fiona O’Hanlon and Professor Lindsay Paterson, University of Edinburgh, for their work in helping prepare this report. Their work was partly funded by the Gaelic research network, Soillse.
3 © Crown Copyright 2015 National Records of Scotland
1. Introduction
This report provides data pertaining to the questions about Scottish Gaelic in Scotland’s
Census 2011, and provides comparisons with data from the 2001 Census. The censuses
were held on 27 March 2011 and 29 April 2001, and collected information from people
‘usually resident’ in Scotland on these dates (please see background notes for further
details).
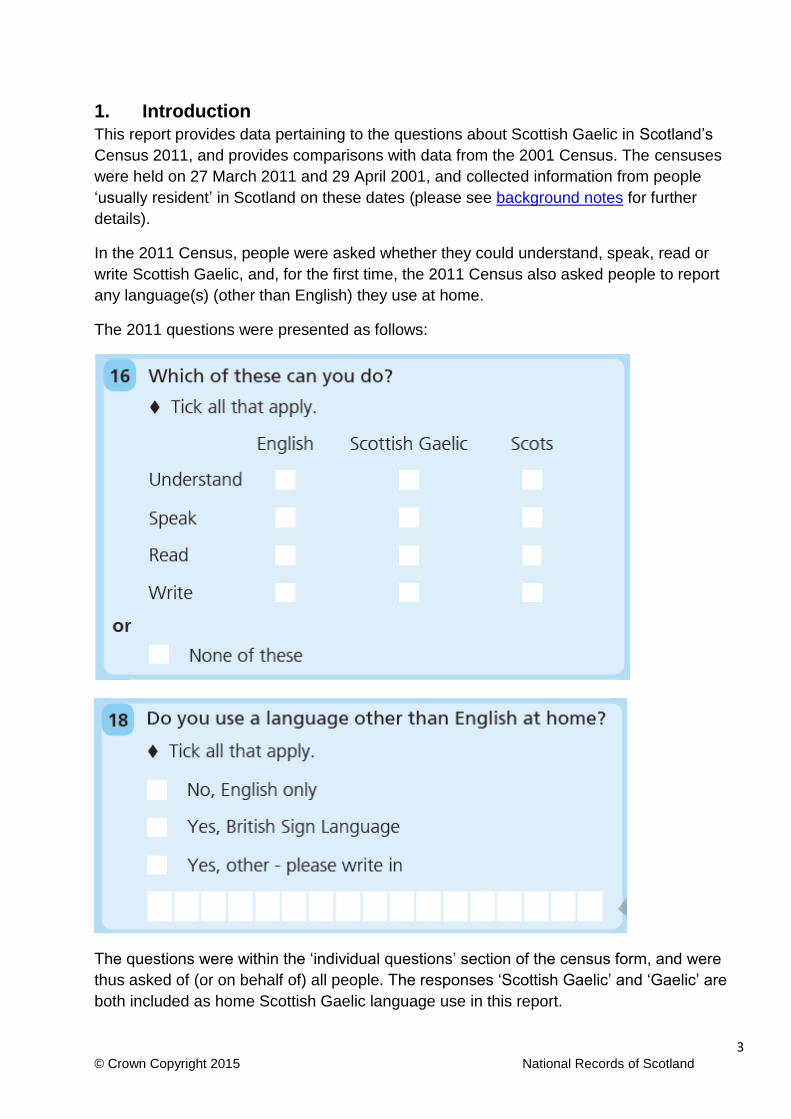
In the 2011 Census, people were asked whether they could understand, speak, read or
write Scottish Gaelic, and, for the first time, the 2011 Census also asked people to report
any language(s) (other than English) they use at home.
The 2011 questions were presented as follows:
The questions were within the ‘individual questions’ section of the census form, and were
thus asked of (or on behalf of) all people. The responses ‘Scottish Gaelic’ and ‘Gaelic’ are
both included as home Scottish Gaelic language use in this report.
4 © Crown Copyright 2015 National Records of Scotland
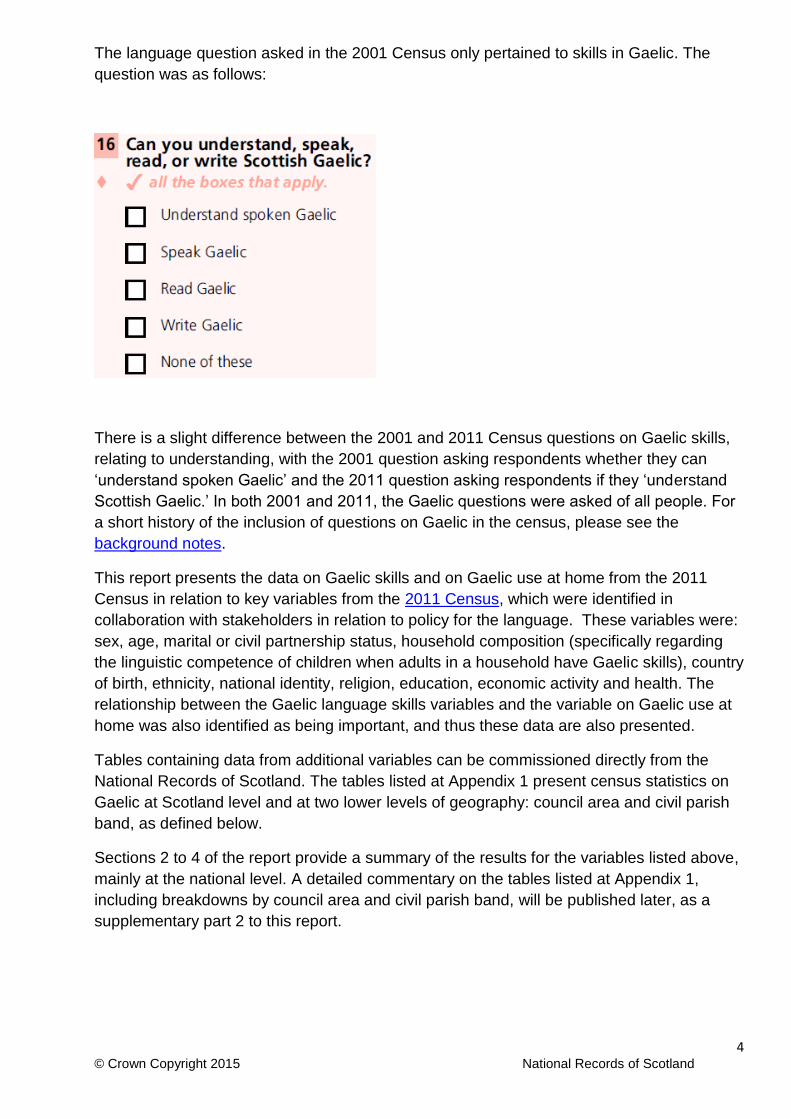
The language question asked in the 2001 Census only pertained to skills in Gaelic. The
question was as follows:
There is a slight difference between the 2001 and 2011 Census questions on Gaelic skills,
relating to understanding, with the 2001 question asking respondents whether they can
‘understand spoken Gaelic’ and the 2011 question asking respondents if they ‘understand
Scottish Gaelic.’ In both 2001 and 2011, the Gaelic questions were asked of all people. For
a short history of the inclusion of questions on Gaelic in the census, please see the
background notes.
This report presents the data on Gaelic skills and on Gaelic use at home from the 2011
Census in relation to key variables from the 2011 Census, which were identified in
collaboration with stakeholders in relation to policy for the language. These variables were:
sex, age, marital or civil partnership status, household composition (specifically regarding
the linguistic competence of children when adults in a household have Gaelic skills), country
of birth, ethnicity, national identity, religion, education, economic activity and health. The
relationship between the Gaelic language skills variables and the variable on Gaelic use at
home was also identified as being important, and thus these data are also presented.
Tables containing data from additional variables can be commissioned directly from the
National Records of Scotland. The tables listed at Appendix 1 present census statistics on
Gaelic at Scotland level and at two lower levels of geography: council area and civil parish
band, as defined below.
Sections 2 to 4 of the report provide a summary of the results for the variables listed above,
mainly at the national level. A detailed commentary on the tables listed at Appendix 1,
including breakdowns by council area and civil parish band, will be published later, as a
supplementary part 2 to this report.
5 © Crown Copyright 2015 National Records of Scotland
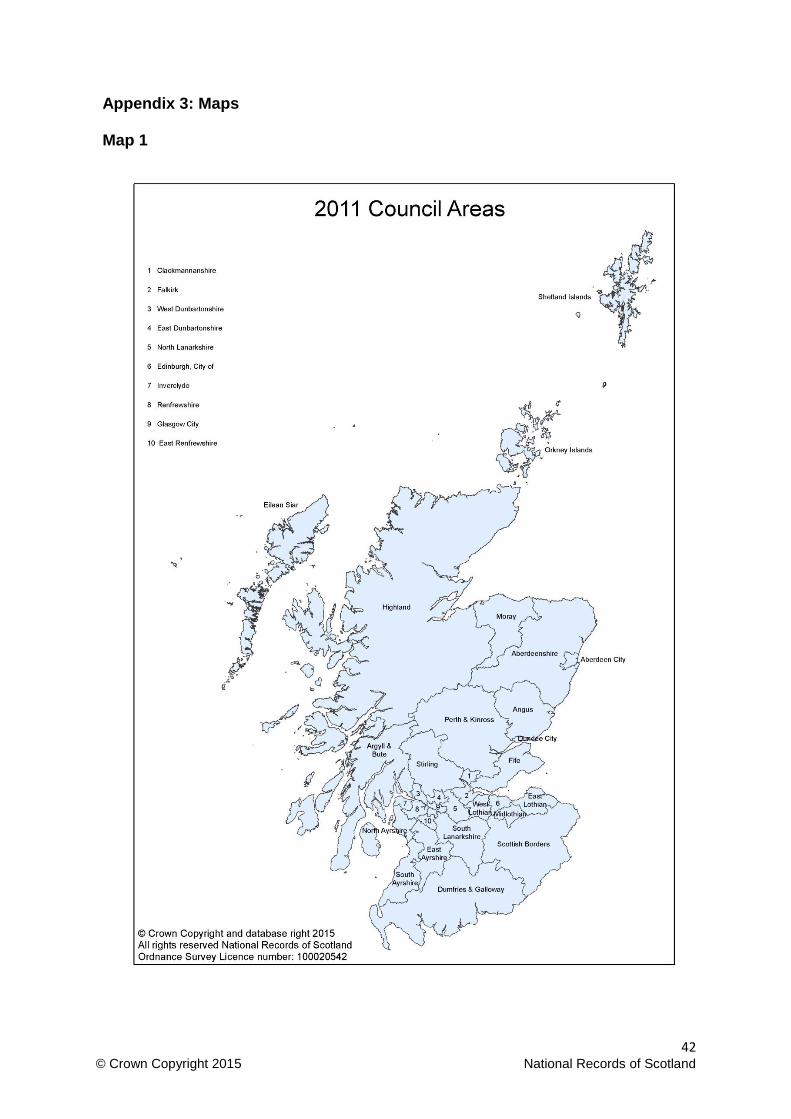
1. Council area
These are the geographical areas of the 32 council areas established in 1996 by the
Local Government (Scotland) Act 1994. Their councils form the single tier of local
government in Scotland. The geographical areas of these councils are shown in Map 1.
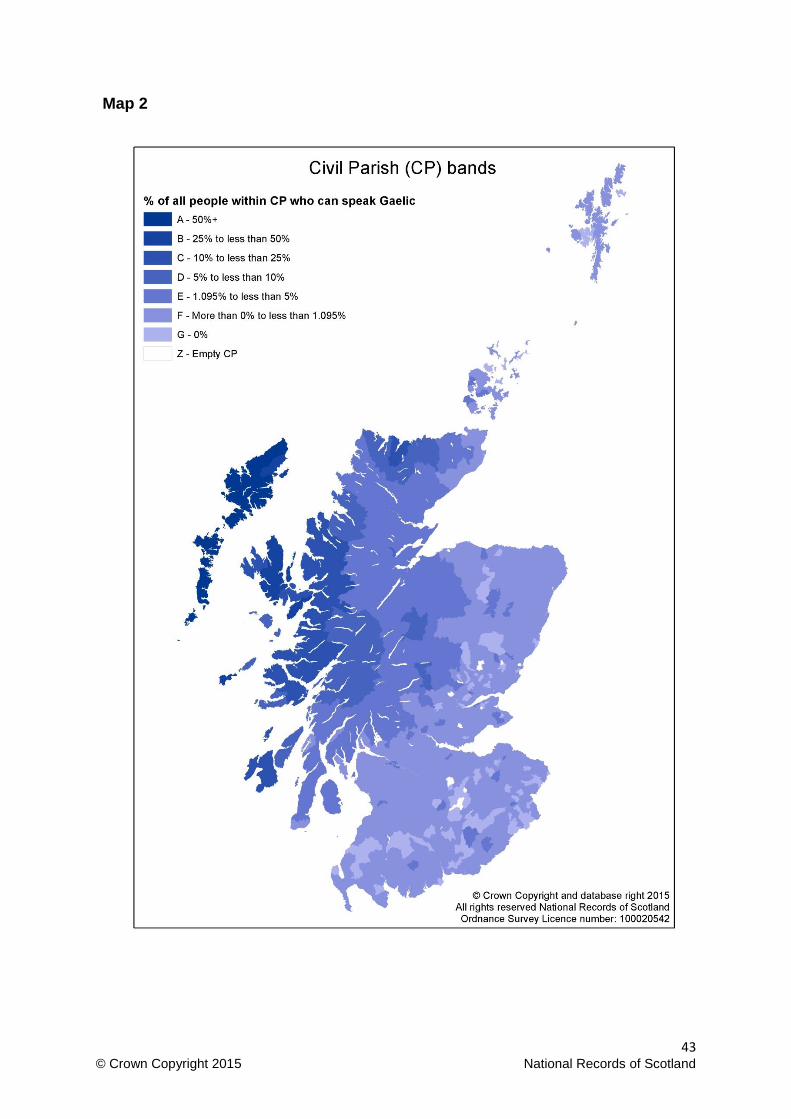
2. Civil parish bands
These are based on classification of the 871 civil parishes in Scotland according to the
incidence of Gaelic-speaking skills within them, as measured by the 2011 Census.1 The
parishes are grouped into seven bands, defined as follows:
A. Civil parishes where 50.0% or more of the population speak Gaelic
B. Civil parishes where 25% to less than 50% of the population speak Gaelic
C. Civil parishes where 10% to less than 25% of the population speak
Gaelic
D. Civil parishes where 5% to less than 10% of the population speak
Gaelic
E. Civil parishes where more than 1.095% to less than 5% of the
population speak Gaelic
F. Civil parishes where more than 0% to 1.095% of the population speak Gaelic
G. Civil parishes where 0% of the population speak Gaelic
The lower threshold of band E (greater than 1.095%) corresponds to civil parishes where
the incidence of Gaelic speaking skills across all people resident in the parish is greater
than the incidence of Gaelic speaking skills across all people resident in Scotland
(1.095%). The thresholds of the other civil parish band categories were determined by a
wish to provide a detailed picture of the distribution of Gaelic speakers across a range of
Gaelic linguistic communities, and to compare the social and economic characteristics of
Gaelic speakers living in such different linguistic contexts. The geographical areas of
these civil parish bands in 2011 are shown in Map 2. The number and list of civil parishes
in each civil parish band for 2011 are given in Appendix 2.2
1) In both the 2011 and 2001 Censuses, parishes were a “best fit” aggregation of Census output areas. As a
result, there were a small number (10 in 2011) of civil parishes which had no output areas (and therefore no people) in them. These civil parishes were excluded from the ‘Civil Parish Band’ classification, and in Map 2 such parishes are presented in grayscale.
2) Civil parish band was selected as the unit of analysis as census information has been analysed at this level of geography since 1891, and with the present boundaries since 1931, thus offering opportunities for historical comparison. Information about other geographical areas for which census data are available can be found on the Supporting information page of the Scotland's Census website.
6 © Crown Copyright 2015 National Records of Scotland
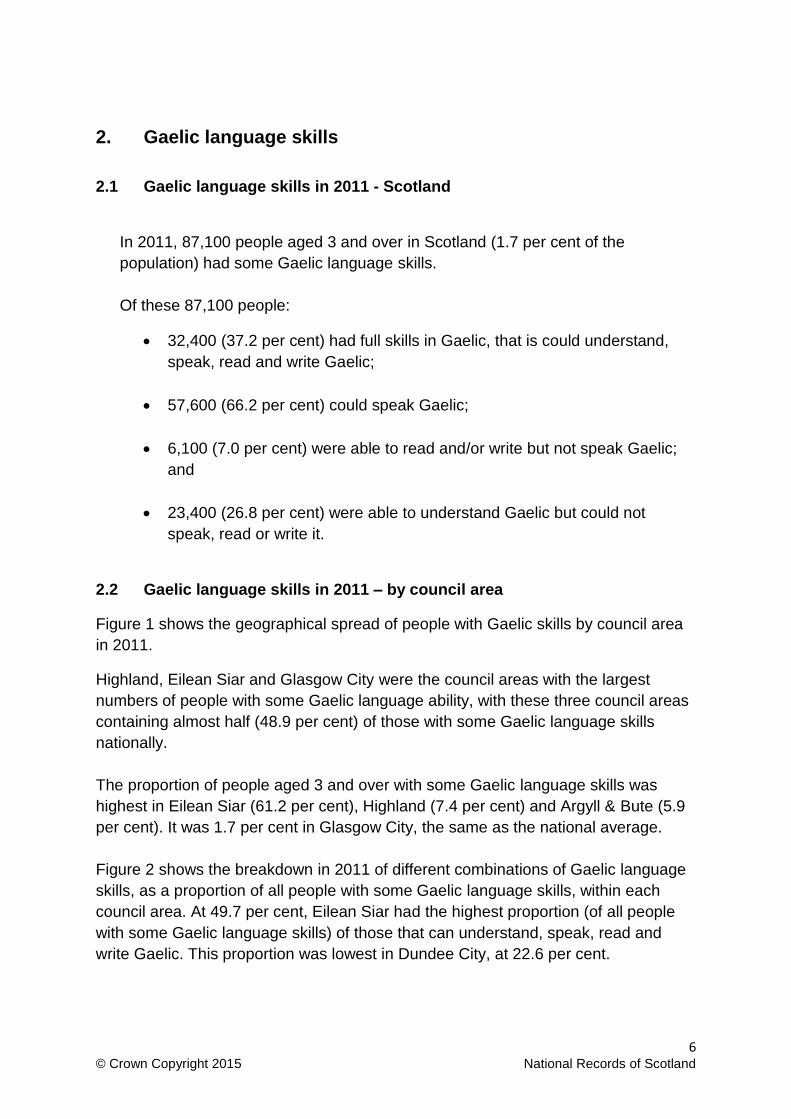
2. Gaelic language skills
2.1 Gaelic language skills in 2011 - Scotland
In 2011, 87,100 people aged 3 and over in Scotland (1.7 per cent of the
population) had some Gaelic language skills.
Of these 87,100 people:
32,400 (37.2 per cent) had full skills in Gaelic, that is could understand,
speak, read and write Gaelic;
57,600 (66.2 per cent) could speak Gaelic;
6,100 (7.0 per cent) were able to read and/or write but not speak Gaelic;
and
23,400 (26.8 per cent) were able to understand Gaelic but could not
speak, read or write it.
2.2 Gaelic language skills in 2011 – by council area
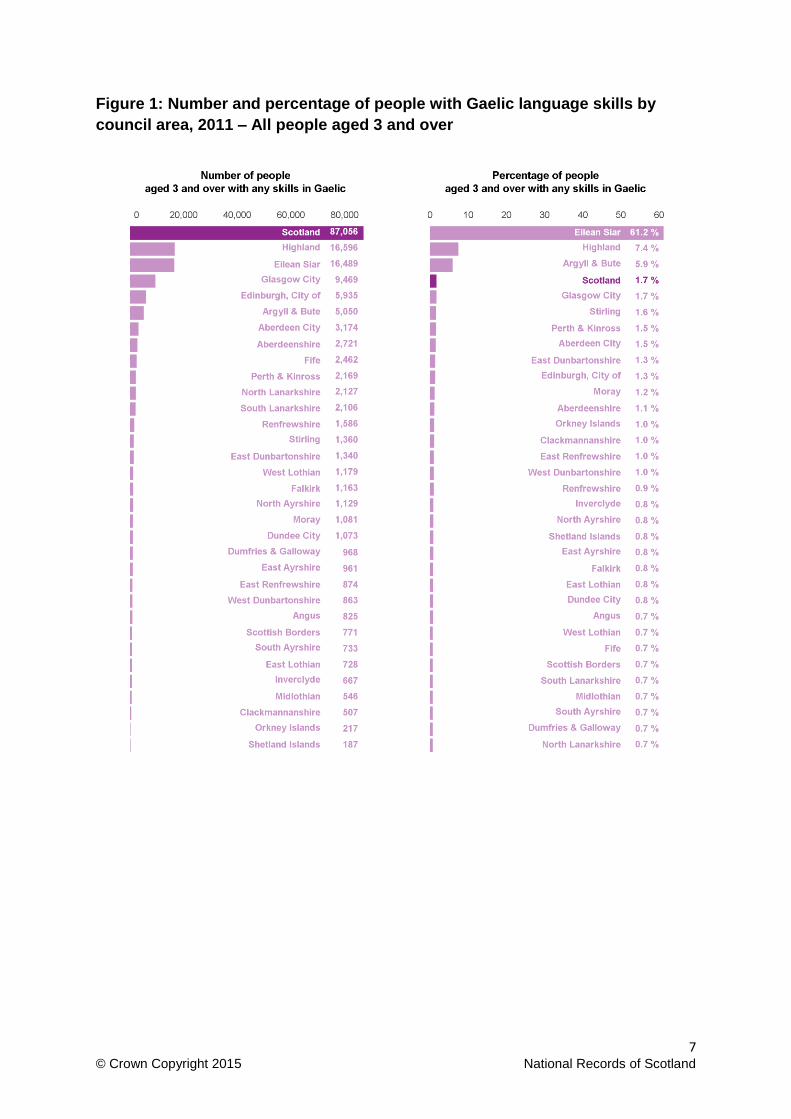
Figure 1 shows the geographical spread of people with Gaelic skills by council area
in 2011.
Highland, Eilean Siar and Glasgow City were the council areas with the largest
numbers of people with some Gaelic language ability, with these three council areas
containing almost half (48.9 per cent) of those with some Gaelic language skills
nationally.
The proportion of people aged 3 and over with some Gaelic language skills was
highest in Eilean Siar (61.2 per cent), Highland (7.4 per cent) and Argyll & Bute (5.9
per cent). It was 1.7 per cent in Glasgow City, the same as the national average.
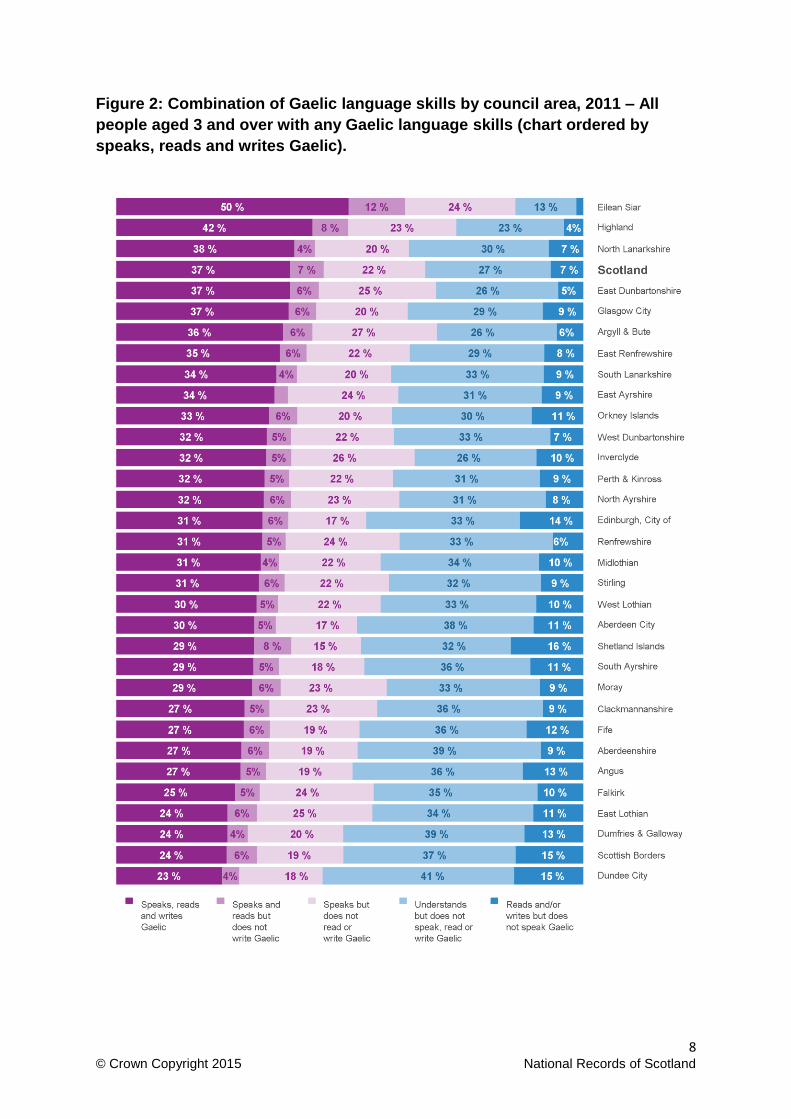
Figure 2 shows the breakdown in 2011 of different combinations of Gaelic language
skills, as a proportion of all people with some Gaelic language skills, within each
council area. At 49.7 per cent, Eilean Siar had the highest proportion (of all people
with some Gaelic language skills) of those that can understand, speak, read and
write Gaelic. This proportion was lowest in Dundee City, at 22.6 per cent.
7 © Crown Copyright 2015 National Records of Scotland
Figure 1: Number and percentage of people with Gaelic language skills by
council area, 2011 – All people aged 3 and over
8 © Crown Copyright 2015 National Records of Scotland
Figure 2: Combination of Gaelic language skills by council area, 2011 – All
people aged 3 and over with any Gaelic language skills (chart ordered by
speaks, reads and writes Gaelic).
9 © Crown Copyright 2015 National Records of Scotland
2.3 Gaelic language skills - change between 2001 and 2011
The number of people aged 3 and over with some Gaelic language skills declined by
5.8 per cent between 2001 and 2011, from 92,400 in 2001 to 87,100 in 2011.
Consequently, the proportion of the Scottish population with some Gaelic language
skills fell slightly, from 1.89 per cent in 2001 to 1.70 per cent in 2011.
The number of people aged 3 and over with all skills in Gaelic (that is, could
understand, speak, read and write Gaelic) rose from 31,500 in 2001 to 32,400 in
2011, an increase of 2.8 per cent.
The number of people aged 3 and over able to speak Gaelic declined by 1.8 per cent
between 2001 and 2011, from 59,000 in 2001 to 58,000 in 2011. The proportion of
population aged 3 and over who can speak Gaelic fell from 1.20 per cent in 2001 to
1.13 per cent in 2011.
The number of people aged 3 and over with literacy skills in Gaelic (reading or
writing) but not able to speak Gaelic fell from 7,000 in 2001 to 6,100 in 2011, a
decrease of 13.2 per cent. The proportion of the population aged 3 and over with
literacy only skills in Gaelic was 0.12 per cent in 2011 compared with 0.14 per cent in
2001.
The number of people aged 3 and over able to understand Gaelic (but not speak,
read or write it) declined by 12.6 per cent between 2001 and 2011, from 26,700 in
2001 to 23,400 in 2011. As a proportion of the population, this represented a slight
fall, from 0.55 per cent in 2001 to 0.46 per cent in 2011.
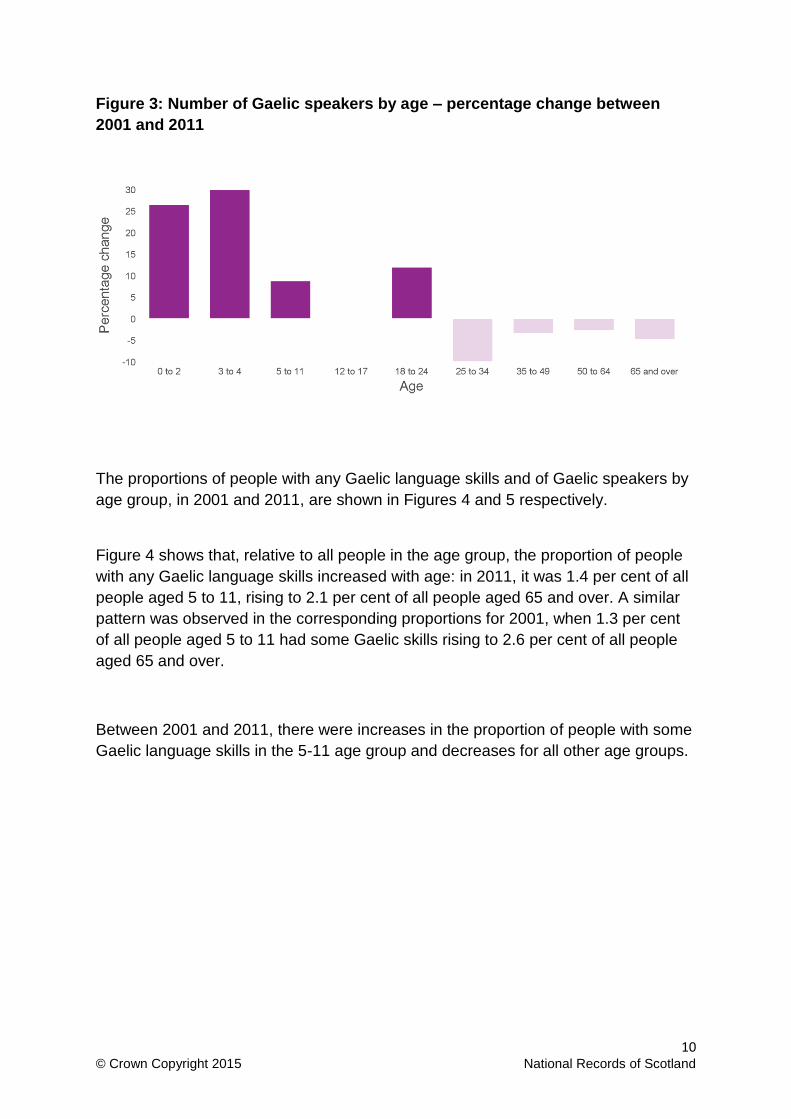
Figure 3 looks at the percentage change between 2001 and 2011 in the number of
people that speak Gaelic by age group.
Between 2001 and 2011, there was an 8.6 per cent increase in the number of Gaelic
speakers aged under 25, including increases for the 5-11 (8.8 per cent) and 18-24
(12.0 per cent) age groups; the number of Gaelic speakers aged 12-17 was
unchanged.
In contrast, there was a 4.6 per cent decrease between 2001 and 2011 in the
number of Gaelic speakers aged 25 and over, with decreases in each of the age
groups 25-34 (10.0 per cent), 35-49 (3.4 per cent), 50-64 (2.7 per cent) and 65 and
over (4.8 per cent).
10 © Crown Copyright 2015 National Records of Scotland
Figure 3: Number of Gaelic speakers by age – percentage change between
2001 and 2011
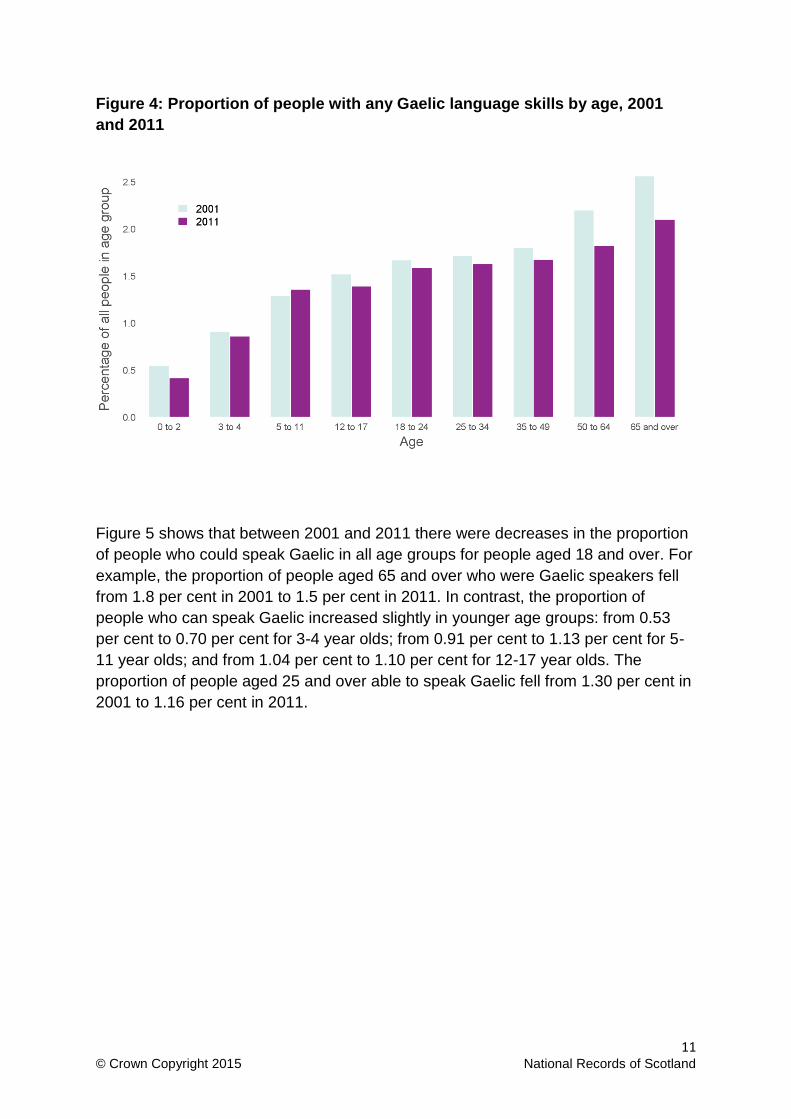
The proportions of people with any Gaelic language skills and of Gaelic speakers by
age group, in 2001 and 2011, are shown in Figures 4 and 5 respectively.
Figure 4 shows that, relative to all people in the age group, the proportion of people
with any Gaelic language skills increased with age: in 2011, it was 1.4 per cent of all
people aged 5 to 11, rising to 2.1 per cent of all people aged 65 and over. A similar
pattern was observed in the corresponding proportions for 2001, when 1.3 per cent
of all people aged 5 to 11 had some Gaelic skills rising to 2.6 per cent of all people
aged 65 and over.
Between 2001 and 2011, there were increases in the proportion of people with some
Gaelic language skills in the 5-11 age group and decreases for all other age groups.
11 © Crown Copyright 2015 National Records of Scotland
Figure 4: Proportion of people with any Gaelic language skills by age, 2001
and 2011
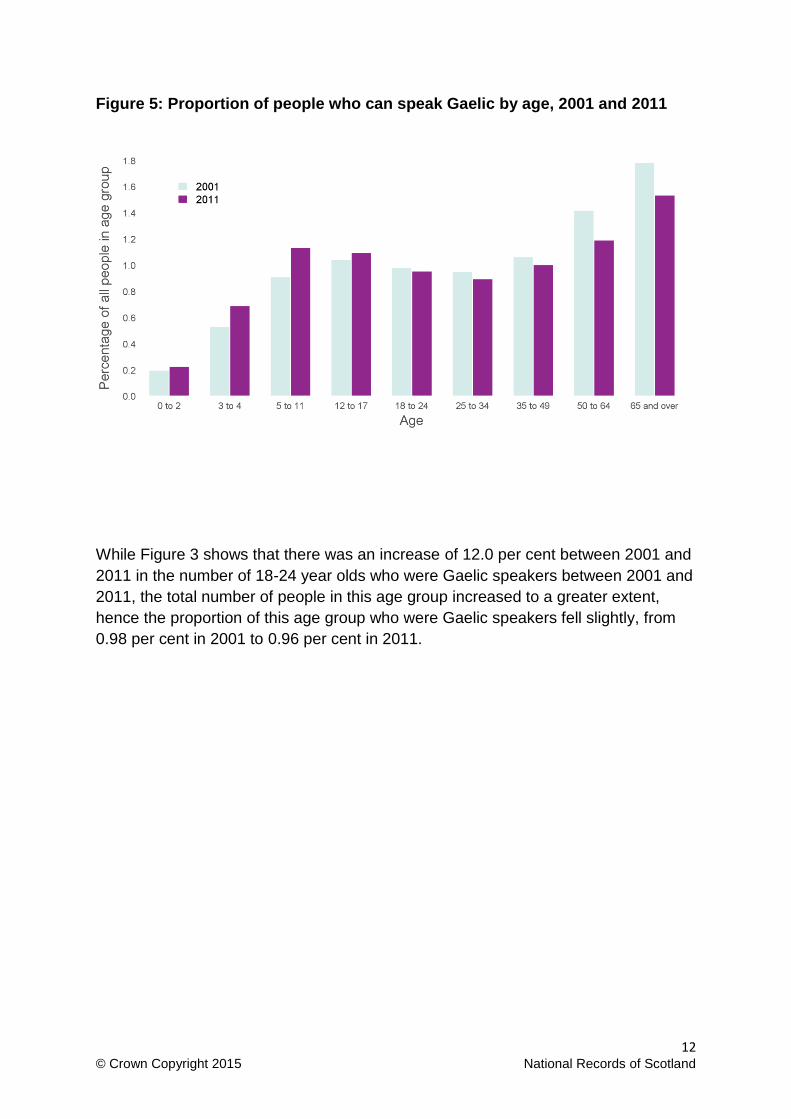
Figure 5 shows that between 2001 and 2011 there were decreases in the proportion
of people who could speak Gaelic in all age groups for people aged 18 and over. For
example, the proportion of people aged 65 and over who were Gaelic speakers fell
from 1.8 per cent in 2001 to 1.5 per cent in 2011. In contrast, the proportion of
people who can speak Gaelic increased slightly in younger age groups: from 0.53
per cent to 0.70 per cent for 3-4 year olds; from 0.91 per cent to 1.13 per cent for 5-
11 year olds; and from 1.04 per cent to 1.10 per cent for 12-17 year olds. The
proportion of people aged 25 and over able to speak Gaelic fell from 1.30 per cent in
2001 to 1.16 per cent in 2011.
12 © Crown Copyright 2015 National Records of Scotland
Figure 5: Proportion of people who can speak Gaelic by age, 2001 and 2011
While Figure 3 shows that there was an increase of 12.0 per cent between 2001 and
2011 in the number of 18-24 year olds who were Gaelic speakers between 2001 and
2011, the total number of people in this age group increased to a greater extent,
hence the proportion of this age group who were Gaelic speakers fell slightly, from
0.98 per cent in 2001 to 0.96 per cent in 2011.
13 © Crown Copyright 2015 National Records of Scotland
3. Characteristics of Gaelic speakers in 2011
Age
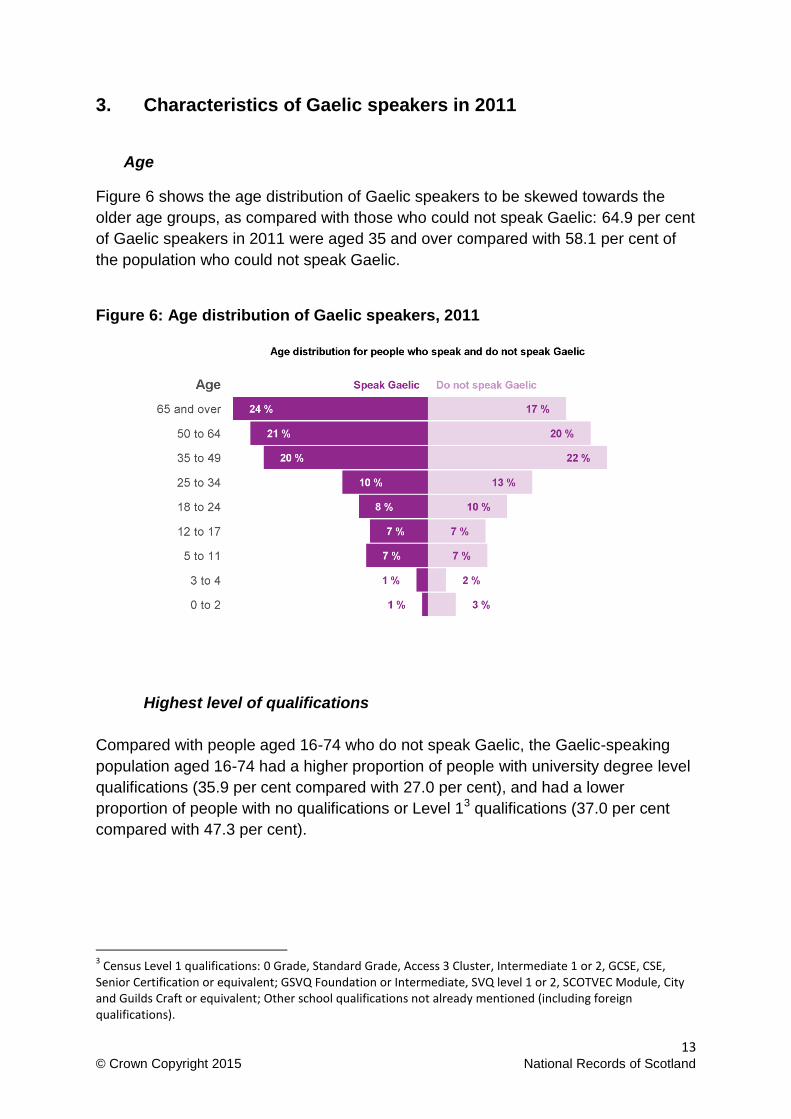
Figure 6 shows the age distribution of Gaelic speakers to be skewed towards the
older age groups, as compared with those who could not speak Gaelic: 64.9 per cent
of Gaelic speakers in 2011 were aged 35 and over compared with 58.1 per cent of
the population who could not speak Gaelic.
Figure 6: Age distribution of Gaelic speakers, 2011
Highest level of qualifications
Compared with people aged 16-74 who do not speak Gaelic, the Gaelic-speaking
population aged 16-74 had a higher proportion of people with university degree level
qualifications (35.9 per cent compared with 27.0 per cent), and had a lower
proportion of people with no qualifications or Level 13 qualifications (37.0 per cent
compared with 47.3 per cent).
3 Census Level 1 qualifications: 0 Grade, Standard Grade, Access 3 Cluster, Intermediate 1 or 2, GCSE, CSE,
Senior Certification or equivalent; GSVQ Foundation or Intermediate, SVQ level 1 or 2, SCOTVEC Module, City and Guilds Craft or equivalent; Other school qualifications not already mentioned (including foreign qualifications).
14 © Crown Copyright 2015 National Records of Scotland
Employment
Between 2001 and 2011, there was a 5.9 per cent increase in the number of Gaelic
speakers aged 16 to 74 in employment (excluding full-time students), from 24,300 in
2001 to 25,700 in 2011.
National Statistics Socio-economic Classification (NS-SeC)
Compared with the non-Gaelic speaking population, a higher proportion of Gaelic
speakers aged 3 and over lived in households where the household reference
person4 is in a professional occupation as defined by the NS-SeC (36.9 per cent
compared with 33.7 per cent) and a lower proportion of Gaelic speakers were in
semi-routine or routine occupations (25.5 per cent compared with 28.6 per cent).
Religion
Compared with the non-Gaelic speaking population, a higher proportion of Gaelic
speakers belonged to the religious categories ‘Church of Scotland’ (40.1 per cent
compared with 33.0 per cent) and ‘other Christian’ [not Church of Scotland, not
Roman Catholic] (14.5 per cent compared with 5.5 per cent). A lower proportion of
Gaelic speakers than non-Gaelic speakers reported having no religion (22.0 per cent
compared with 36.2 per cent).
Health
A higher proportion of people aged 3 and over who speak Gaelic had at least one
long-term (lasting at least 12 months) health condition (33.4 per cent) than of people
who cannot speak Gaelic (30.8 per cent). However, among people aged 3-17, the
position is reversed: 10.3 per cent of people who could speak Gaelic had a long-term
health condition, compared with 11.6 per cent of people who could not speak Gaelic.
Ethnic group
A higher proportion of people aged 3 and over who could speak Gaelic was white
than of people who could not speak Gaelic (98.2 per cent compared with 96.1 per
cent). The gap was slightly less at ages 3-17 (96.1 per cent compared with 94.8 per
cent, a difference of 1.3 percentage points) than at ages 18 and over (98.5 per cent
compared with 96.4 per cent, a difference of 2.2 percentage points).
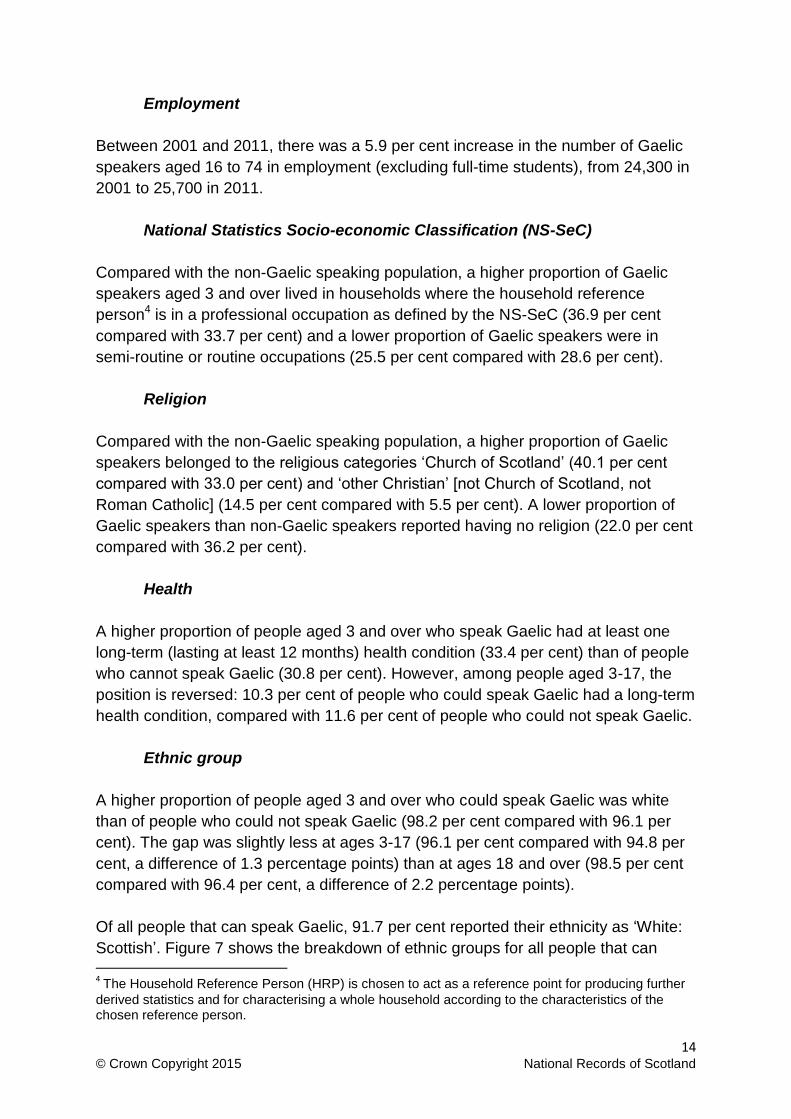
Of all people that can speak Gaelic, 91.7 per cent reported their ethnicity as ‘White:
Scottish’. Figure 7 shows the breakdown of ethnic groups for all people that can 4 The Household Reference Person (HRP) is chosen to act as a reference point for producing further
derived statistics and for characterising a whole household according to the characteristics of the chosen reference person.
15 © Crown Copyright 2015 National Records of Scotland
speak Gaelic, not including ‘White: Scottish’. Over three quarters (77.8 per cent) of
this latter group of people were in the ‘White: Other British’, ‘Other White’ or ‘White:
Irish’ categories. A further 12.5 per cent were in the ‘Asian’ category and 9.7 per cent
in all other ethnic minority groups.
Figure 7: Gaelic speakers by ethnic group, 2011
– All people aged 3 and over in ethnic groups other than White: Scottish
Household linguistic context
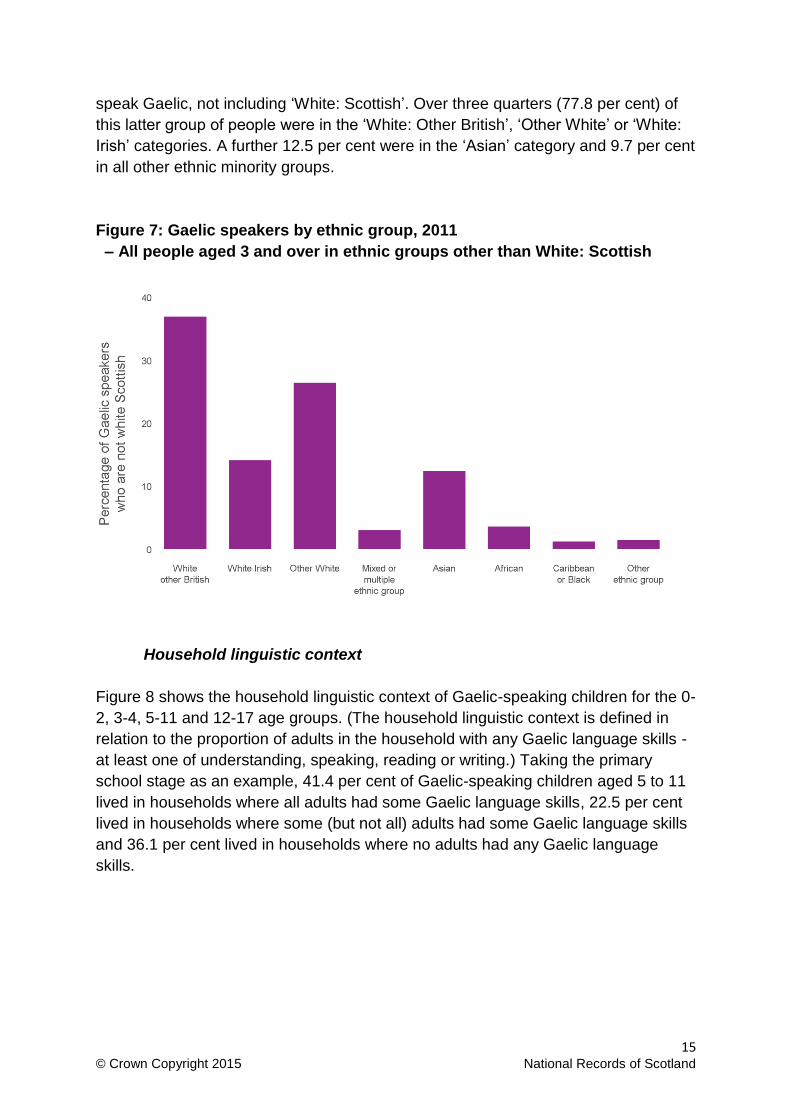
Figure 8 shows the household linguistic context of Gaelic-speaking children for the 0-
2, 3-4, 5-11 and 12-17 age groups. (The household linguistic context is defined in
relation to the proportion of adults in the household with any Gaelic language skills -
at least one of understanding, speaking, reading or writing.) Taking the primary
school stage as an example, 41.4 per cent of Gaelic-speaking children aged 5 to 11
lived in households where all adults had some Gaelic language skills, 22.5 per cent
lived in households where some (but not all) adults had some Gaelic language skills
and 36.1 per cent lived in households where no adults had any Gaelic language
skills.
16 © Crown Copyright 2015 National Records of Scotland
Figure 8: Gaelic-speaking children by age by proportion of adults in household
with some Gaelic language skills, 2011
17 © Crown Copyright 2015 National Records of Scotland
4. Gaelic home language use
Nationally, 25,000 people aged 3 and over (0.49 per cent of the population) reported using Gaelic at home. Of those who reported using Gaelic at home, 63.3 per cent had all skills in Gaelic (understanding, speaking, reading and writing), 10.9 per cent had oracy (understands and speaks) and reading skills, 18.2 per cent had oracy skills only, 3.4 per cent could understand Gaelic only, 0.7 per cent had literacy skills only, and 3.4 per cent had no skills in Gaelic (see Appendix 1, note 5). Nationally, 40.2 per cent of all Gaelic speakers (including children aged under 3) reported using Gaelic at home. This proportion was 73.7 per cent in Eilean Siar, 41.5 per cent in Highland, 33.4 per cent in Argyll & Bute and 23.6 per cent in the other 29 council areas combined.
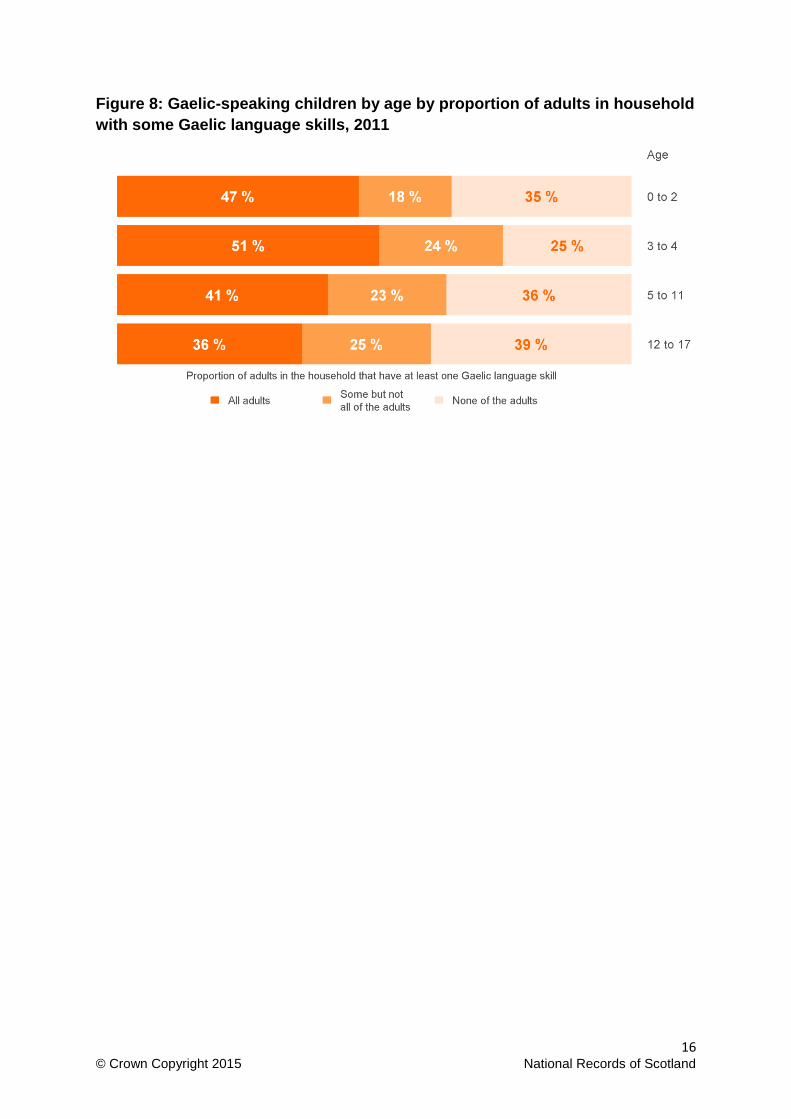
Figure 9: Percentage of Gaelic speakers that use Gaelic at home by age group,
2011
Figure 9 shows the percentage of Gaelic speakers who used Gaelic at home by age group. A little under two thirds (63 per cent) of Gaelic speakers aged 3 to 4 were reported as using Gaelic at home, with 51 per cent of those aged 5 to 11 and 46 per cent of those aged 65 and over were reported to do so. The lowest proportion of Gaelic speakers using Gaelic at home was for 18-24 year olds, at 29 per cent.
18 © Crown Copyright 2015 National Records of Scotland
In relation to Gaelic language use at home and socio-economic status (as defined by the National Statistics Socio-economic Classification of the household reference person), in high-status social groups children had the highest incidence of Gaelic use at home, and in low-status social groups older people (aged 65 and over) had the highest incidence. Middle-status social groups had relatively high incidence of home Gaelic use among both children and also older people (aged 65 and over). For example, for the higher professional group, the peak incidence of using Gaelic at home was at ages 5 to 11 (0.78 per cent). For the routine-occupation group, the peak incidence was at ages 65 and over (0.73 per cent). For the intermediate group, the peak incidence was at ages 5 to 11 (0.53 per cent) and 65 and over (0.51 per cent).
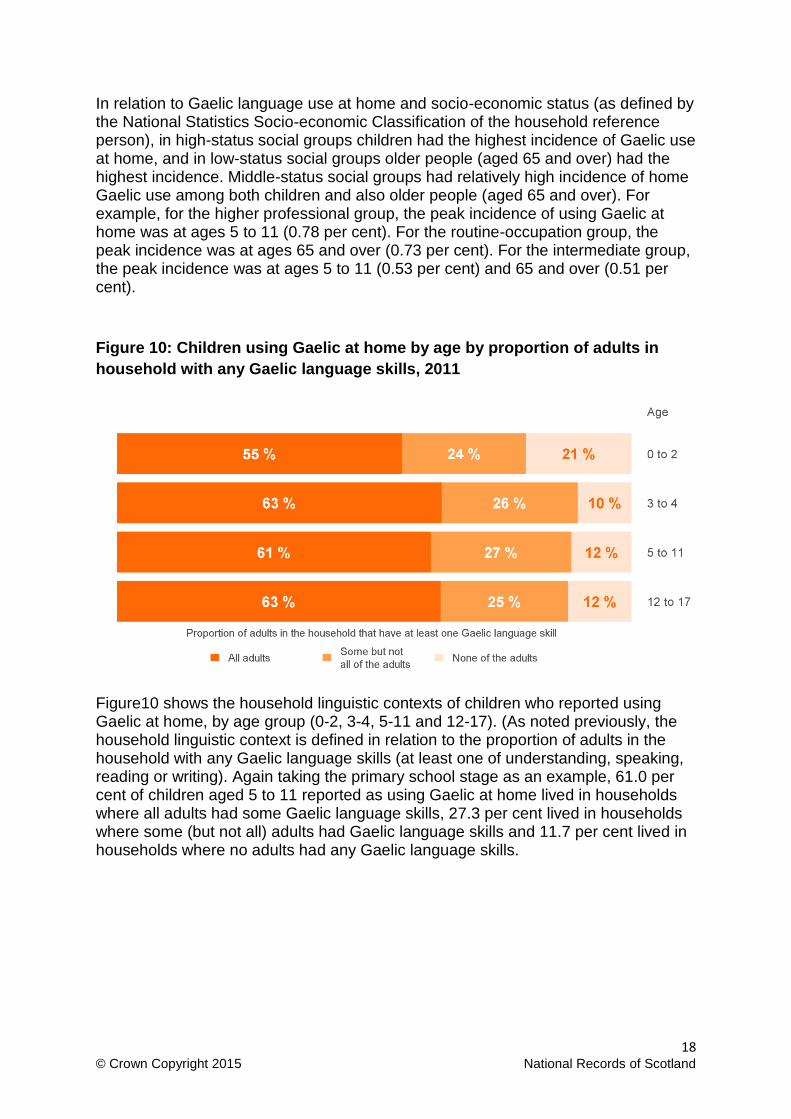
Figure 10: Children using Gaelic at home by age by proportion of adults in
household with any Gaelic language skills, 2011
Figure10 shows the household linguistic contexts of children who reported using Gaelic at home, by age group (0-2, 3-4, 5-11 and 12-17). (As noted previously, the household linguistic context is defined in relation to the proportion of adults in the household with any Gaelic language skills (at least one of understanding, speaking, reading or writing). Again taking the primary school stage as an example, 61.0 per cent of children aged 5 to 11 reported as using Gaelic at home lived in households where all adults had some Gaelic language skills, 27.3 per cent lived in households where some (but not all) adults had Gaelic language skills and 11.7 per cent lived in households where no adults had any Gaelic language skills.
19 © Crown Copyright 2015 National Records of Scotland
Background Notes
Gaelic
1. Questions on Gaelic have been included in Scottish censuses going back to
1881. In 1881, people were asked to report if they spoke Gaelic ‘habitually’. In
censuses from 1891 up to and including 1961, questions were asked about whether
people could speak Gaelic only, or could speak both Gaelic and English. The 1971
Census expanded on this by asking, for the first time, whether people could read
Gaelic and also whether they could write it. In 1981 and 1991, the reference to
speaking ‘Gaelic and English’ was removed, with respondents only being asked to
indicate whether they could speak, read or write Gaelic (or any combination of
these). In the 2001 Census, people were also asked whether they could understand
spoken Gaelic. In the 2011 Census, people were asked whether they could
understand, speak, read or write Gaelic, and, for the first time, the 2011 Census also
asked people to report their home language(s). In terms of age, questions on Gaelic
were asked for people of all ages in 1881 and 1891, but between 1901 and 1991
(inclusive), they were asked for those aged 3 and over. In 2001 and 2011, the
questions on Gaelic were again asked for people of all ages.
2. This report follows on from similar publications produced for previous census
years. The two most recent such publications are entitled ‘Scotland’s Census 2001:
Gaelic Report’ (ISBN 1-874451-74-5 and ‘1991 Census, Gaelic Language, Scotland’
(ISBN 0-11-495255-8).
General
3. National Records of Scotland5 (NRS) is responsible for carrying out the 2011
Census in Scotland. Simultaneous but separate censuses took place in England &
Wales and Northern Ireland. These were run by the Office for National Statistics
(ONS) and the Northern Ireland Statistics and Research Agency (NISRA)
respectively.
4. The census provides estimates of the characteristics of all people and
households in Scotland on census day, 27 March 2011. The term “people” is used
in this report, and in other tables and data visualisations covered by this report, to
mean usual residents as defined below in background note 5.
5 National Records of Scotland (NRS) was created by the amalgamation in April 2011 of the
General Register Office for Scotland (GROS) and the National Archives of Scotland (NAS).
20 © Crown Copyright 2015 National Records of Scotland
5. In Scotland, the aim of the 2001 and 2011 Censuses was to achieve a full
census return for all people who were usually resident in Scotland for six months or
more. In 2011, a full census return was therefore required for people from outside the
UK who had stayed or intended to stay in the UK for a total of six months or more.
Anyone with a permanent UK address who was outside the UK on census day was
also to be included in the census questionnaire for their UK address, if they intended
to be outside the UK for less than 12 months. This is defined as the population
base for enumeration. The main outputs population base for the 2011 Census
statistics is defined to be usual residents of the UK, that is anyone who, on census
day, was in the UK and had stayed or intended to stay in the UK for a period of 12
months or more, or had a permanent UK address and was outside the UK and
intended to be outside the UK for less than 12 months. (NRS made no specific
adjustment for the presence of 6-12 months migrants among the persons counted in
the census – link for further details.)
6. The coverage of the population in an area is those who are usually resident
there. A person’s place of usual residence is in most cases the address at which
they stay the majority of the time. For many people this will be their permanent or
family home. Students are treated as being resident at their term-time address.
Members of the armed forces were largely recorded at their permanent or family
address rather than their base address; determining where they are considered
usually resident is not straightforward.
7. As in 2001, adjustments for census under- and over-enumeration were built
into the census process and as such the 2011 Census statistics represent the full
population. Similar adjustments were not made in the censuses prior to 2001. Further
information on the quality assurance processes for Scotland’s Census 2011 are
available here.
8. Key terms used in this publication are explained in the 2011 Census glossary
and the Variables page.
Designation as National Statistics
9. The United Kingdom Statistics Authority has designated these statistics as
National Statistics. This means they are produced to the high professional standards
set out in the Code of Practice for Official Statistics. They are produced free from any
political interference.
21 © Crown Copyright 2015 National Records of Scotland
Protecting personal census information
10. Personal census information is kept confidential by NRS, and is protected by
law. Census records are not released for 100 years.
11. The census results are provided in aggregate format; no attributes of
individuals can be identified from the information published.
12. Information on the measures taken to protect the confidentiality of personal
census information is published on the Scotla nd ’s Cen su s we b site.
Further information
Please contact our Customer Services if you need any further
information. Email: [email protected]
If you have comments or suggestions that would help us improve our
outputs or our standards of service, please contact:
Kirsty Maclachlan Senior Statistician National Records of Scotland Room 1/2/3
Ladywell House Ladywell Road Edinburgh EH12 7TF Phone: 0131 314 4242
Email: [email protected]
© Crown Copyright 2015. You may reproduce brief extracts from the material in this publication as long as you fully acknowledge the source.
22 © Crown Copyright 2015 National Records of Scotland
Appendices
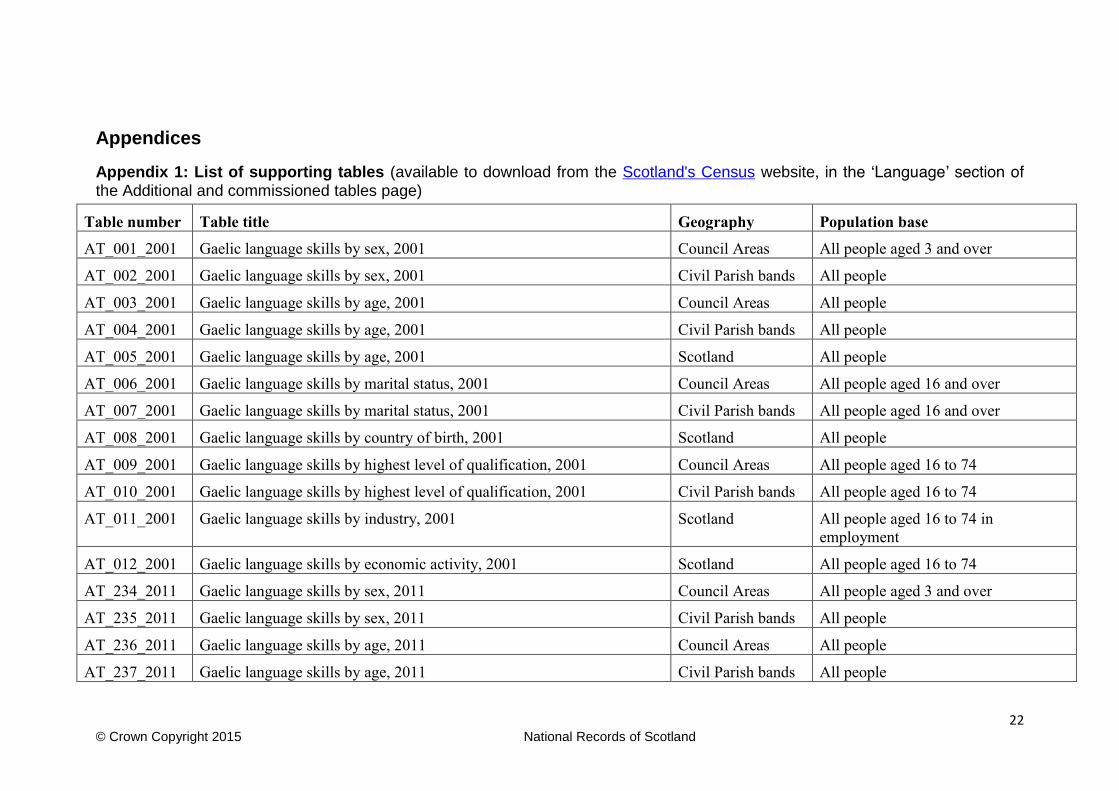
Appendix 1: List of supporting tables (available to download from the Scotland's Census website, in the ‘Language’ section of
the Additional and commissioned tables page)
Table number Table title Geography Population base
AT_001_2001 Gaelic language skills by sex, 2001 Council Areas All people aged 3 and over
AT_002_2001 Gaelic language skills by sex, 2001 Civil Parish bands All people
AT_003_2001 Gaelic language skills by age, 2001 Council Areas All people
AT_004_2001 Gaelic language skills by age, 2001 Civil Parish bands All people
AT_005_2001 Gaelic language skills by age, 2001 Scotland All people
AT_006_2001 Gaelic language skills by marital status, 2001 Council Areas All people aged 16 and over
AT_007_2001 Gaelic language skills by marital status, 2001 Civil Parish bands All people aged 16 and over
AT_008_2001 Gaelic language skills by country of birth, 2001 Scotland All people
AT_009_2001 Gaelic language skills by highest level of qualification, 2001 Council Areas All people aged 16 to 74
AT_010_2001 Gaelic language skills by highest level of qualification, 2001 Civil Parish bands All people aged 16 to 74
AT_011_2001 Gaelic language skills by industry, 2001 Scotland All people aged 16 to 74 in
employment
AT_012_2001 Gaelic language skills by economic activity, 2001 Scotland All people aged 16 to 74
AT_234_2011 Gaelic language skills by sex, 2011 Council Areas All people aged 3 and over
AT_235_2011 Gaelic language skills by sex, 2011 Civil Parish bands All people
AT_236_2011 Gaelic language skills by age, 2011 Council Areas All people
AT_237_2011 Gaelic language skills by age, 2011 Civil Parish bands All people
23 © Crown Copyright 2015 National Records of Scotland
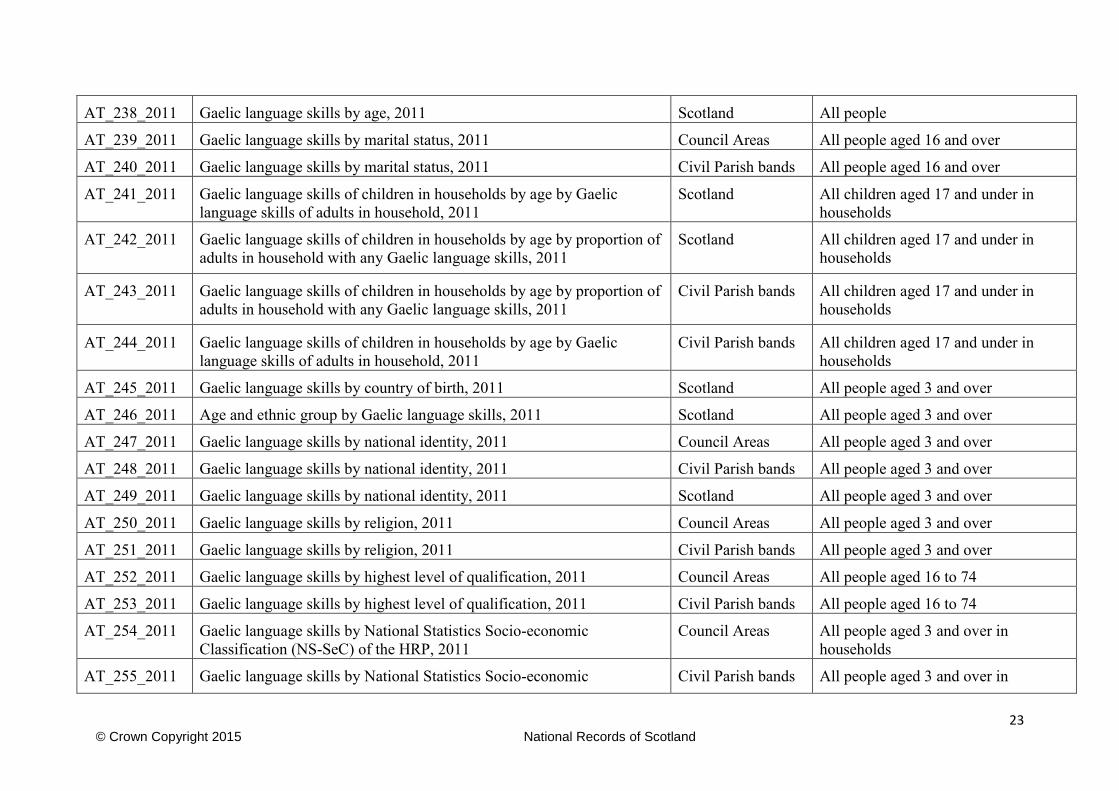
AT_238_2011 Gaelic language skills by age, 2011 Scotland All people
AT_239_2011 Gaelic language skills by marital status, 2011 Council Areas All people aged 16 and over
AT_240_2011 Gaelic language skills by marital status, 2011 Civil Parish bands All people aged 16 and over
AT_241_2011 Gaelic language skills of children in households by age by Gaelic
language skills of adults in household, 2011
Scotland All children aged 17 and under in
households
AT_242_2011 Gaelic language skills of children in households by age by proportion of
adults in household with any Gaelic language skills, 2011
Scotland All children aged 17 and under in
households
AT_243_2011 Gaelic language skills of children in households by age by proportion of
adults in household with any Gaelic language skills, 2011
Civil Parish bands All children aged 17 and under in
households
AT_244_2011 Gaelic language skills of children in households by age by Gaelic
language skills of adults in household, 2011
Civil Parish bands All children aged 17 and under in
households
AT_245_2011 Gaelic language skills by country of birth, 2011 Scotland All people aged 3 and over
AT_246_2011 Age and ethnic group by Gaelic language skills, 2011 Scotland All people aged 3 and over
AT_247_2011 Gaelic language skills by national identity, 2011 Council Areas All people aged 3 and over
AT_248_2011 Gaelic language skills by national identity, 2011 Civil Parish bands All people aged 3 and over
AT_249_2011 Gaelic language skills by national identity, 2011 Scotland All people aged 3 and over
AT_250_2011 Gaelic language skills by religion, 2011 Council Areas All people aged 3 and over
AT_251_2011 Gaelic language skills by religion, 2011 Civil Parish bands All people aged 3 and over
AT_252_2011 Gaelic language skills by highest level of qualification, 2011 Council Areas All people aged 16 to 74
AT_253_2011 Gaelic language skills by highest level of qualification, 2011 Civil Parish bands All people aged 16 to 74
AT_254_2011 Gaelic language skills by National Statistics Socio-economic
Classification (NS-SeC) of the HRP, 2011
Council Areas All people aged 3 and over in
households
AT_255_2011 Gaelic language skills by National Statistics Socio-economic Civil Parish bands All people aged 3 and over in
24 © Crown Copyright 2015 National Records of Scotland
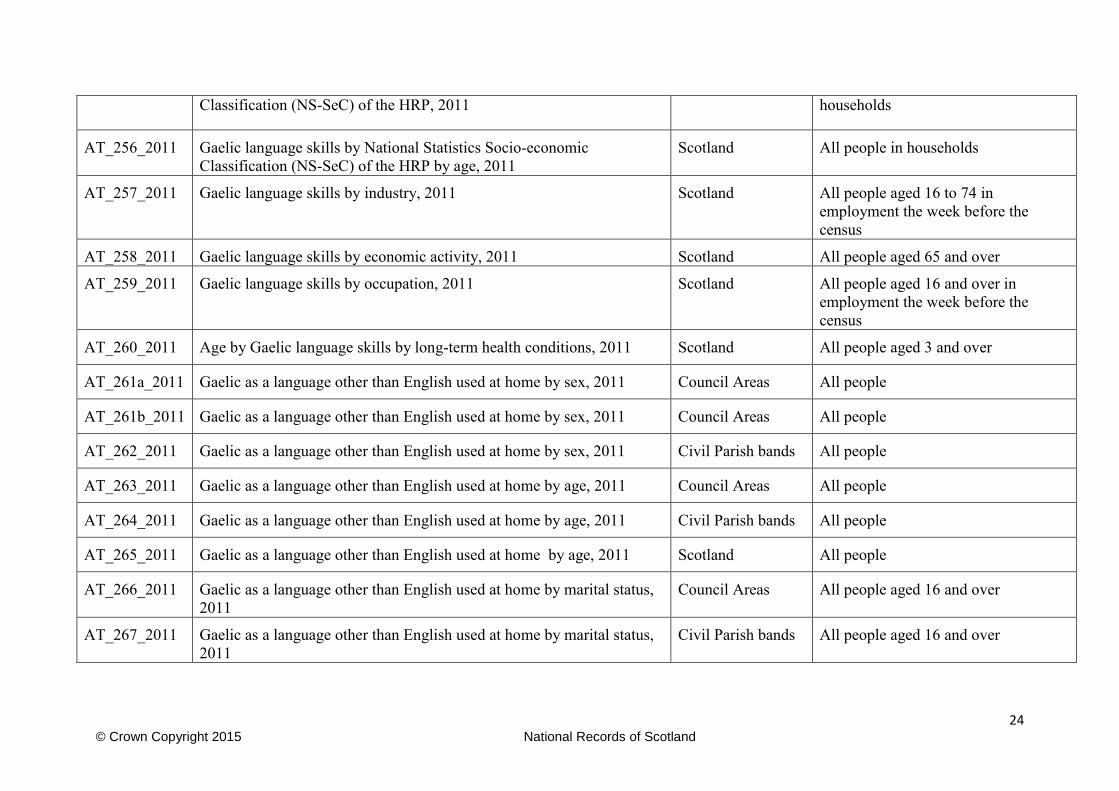
Classification (NS-SeC) of the HRP, 2011 households
AT_256_2011 Gaelic language skills by National Statistics Socio-economic
Classification (NS-SeC) of the HRP by age, 2011
Scotland All people in households
AT_257_2011 Gaelic language skills by industry, 2011 Scotland All people aged 16 to 74 in
employment the week before the
census
AT_258_2011 Gaelic language skills by economic activity, 2011 Scotland All people aged 65 and over
AT_259_2011 Gaelic language skills by occupation, 2011 Scotland All people aged 16 and over in
employment the week before the
census
AT_260_2011 Age by Gaelic language skills by long-term health conditions, 2011 Scotland All people aged 3 and over
AT_261a_2011 Gaelic as a language other than English used at home by sex, 2011 Council Areas All people
AT_261b_2011 Gaelic as a language other than English used at home by sex, 2011 Council Areas All people
AT_262_2011 Gaelic as a language other than English used at home by sex, 2011 Civil Parish bands All people
AT_263_2011 Gaelic as a language other than English used at home by age, 2011 Council Areas All people
AT_264_2011 Gaelic as a language other than English used at home by age, 2011 Civil Parish bands All people
AT_265_2011 Gaelic as a language other than English used at home by age, 2011 Scotland All people
AT_266_2011 Gaelic as a language other than English used at home by marital status,
2011
Council Areas All people aged 16 and over
AT_267_2011 Gaelic as a language other than English used at home by marital status,
2011
Civil Parish bands All people aged 16 and over
25 © Crown Copyright 2015 National Records of Scotland
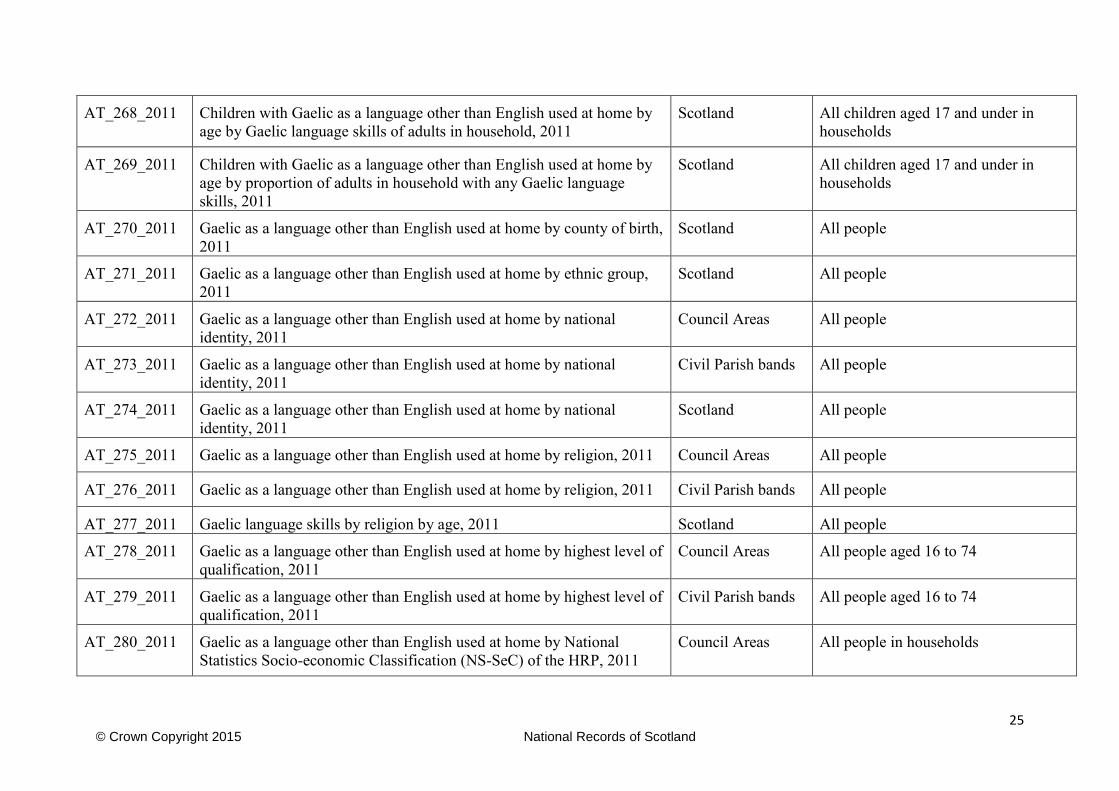
AT_268_2011 Children with Gaelic as a language other than English used at home by
age by Gaelic language skills of adults in household, 2011
Scotland All children aged 17 and under in
households
AT_269_2011 Children with Gaelic as a language other than English used at home by
age by proportion of adults in household with any Gaelic language
skills, 2011
Scotland All children aged 17 and under in
households
AT_270_2011 Gaelic as a language other than English used at home by county of birth,
2011
Scotland All people
AT_271_2011 Gaelic as a language other than English used at home by ethnic group,
2011
Scotland All people
AT_272_2011 Gaelic as a language other than English used at home by national
identity, 2011
Council Areas All people
AT_273_2011 Gaelic as a language other than English used at home by national
identity, 2011
Civil Parish bands All people
AT_274_2011 Gaelic as a language other than English used at home by national
identity, 2011
Scotland All people
AT_275_2011 Gaelic as a language other than English used at home by religion, 2011 Council Areas All people
AT_276_2011 Gaelic as a language other than English used at home by religion, 2011 Civil Parish bands All people
AT_277_2011 Gaelic language skills by religion by age, 2011 Scotland All people
AT_278_2011 Gaelic as a language other than English used at home by highest level of
qualification, 2011
Council Areas All people aged 16 to 74
AT_279_2011 Gaelic as a language other than English used at home by highest level of
qualification, 2011
Civil Parish bands All people aged 16 to 74
AT_280_2011 Gaelic as a language other than English used at home by National
Statistics Socio-economic Classification (NS-SeC) of the HRP, 2011
Council Areas All people in households
26 © Crown Copyright 2015 National Records of Scotland
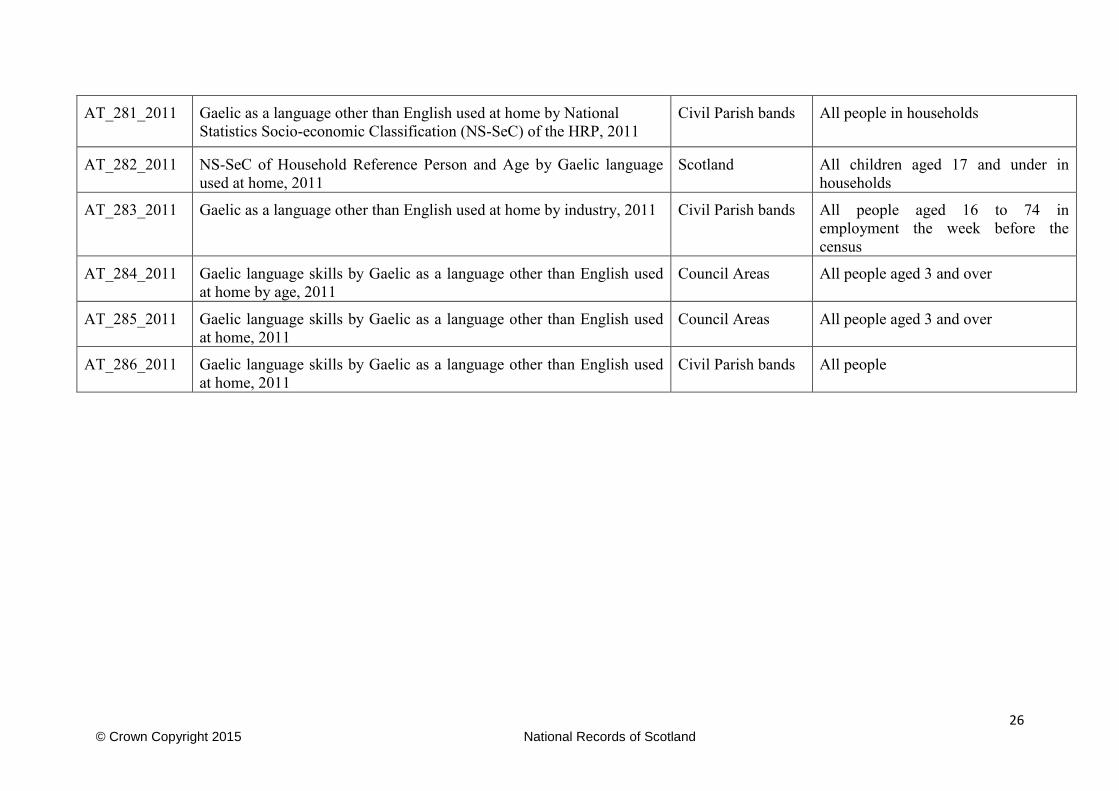
AT_281_2011 Gaelic as a language other than English used at home by National
Statistics Socio-economic Classification (NS-SeC) of the HRP, 2011
Civil Parish bands All people in households
AT_282_2011 NS-SeC of Household Reference Person and Age by Gaelic language
used at home, 2011
Scotland All children aged 17 and under in
households
AT_283_2011 Gaelic as a language other than English used at home by industry, 2011 Civil Parish bands All people aged 16 to 74 in
employment the week before the
census
AT_284_2011 Gaelic language skills by Gaelic as a language other than English used
at home by age, 2011
Council Areas All people aged 3 and over
AT_285_2011 Gaelic language skills by Gaelic as a language other than English used
at home, 2011
Council Areas All people aged 3 and over
AT_286_2011 Gaelic language skills by Gaelic as a language other than English used
at home, 2011
Civil Parish bands All people
27 © Crown Copyright 2015 National Records of Scotland
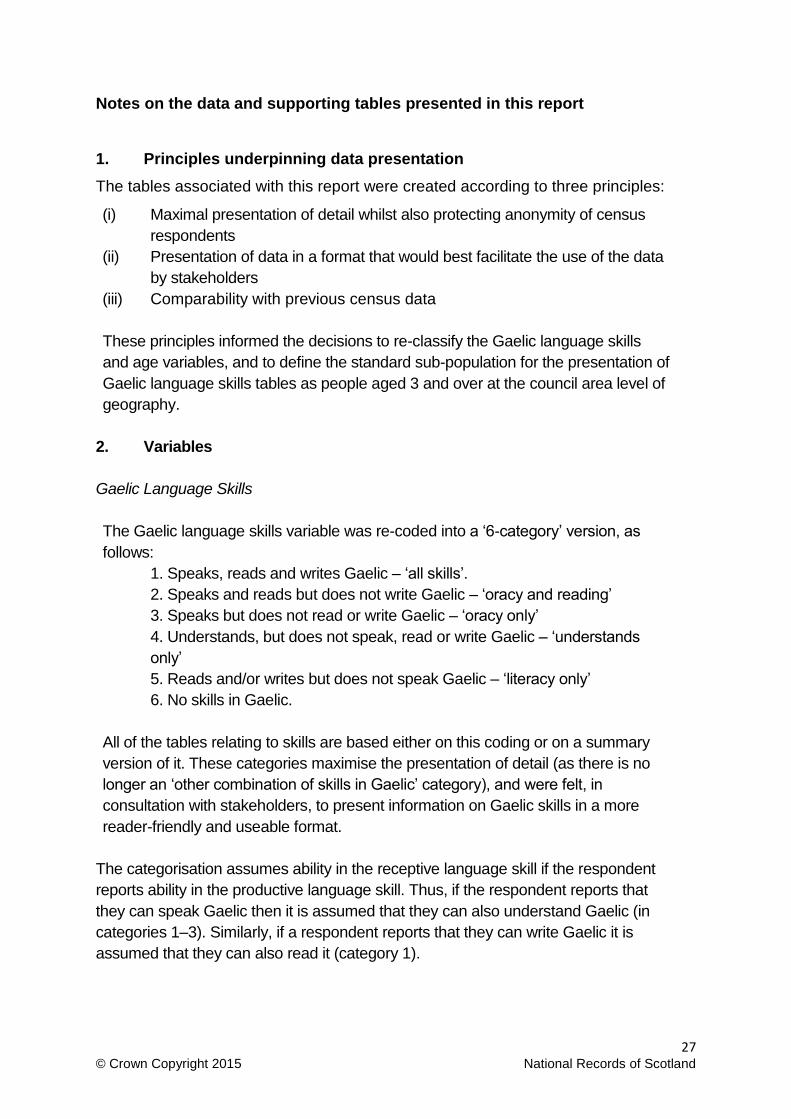
Notes on the data and supporting tables presented in this report
1. Principles underpinning data presentation
The tables associated with this report were created according to three principles:
(i) Maximal presentation of detail whilst also protecting anonymity of census
respondents
(ii) Presentation of data in a format that would best facilitate the use of the data
by stakeholders
(iii) Comparability with previous census data
These principles informed the decisions to re-classify the Gaelic language skills
and age variables, and to define the standard sub-population for the presentation of
Gaelic language skills tables as people aged 3 and over at the council area level of
geography.
2. Variables
Gaelic Language Skills
The Gaelic language skills variable was re-coded into a ‘6-category’ version, as
follows:
1. Speaks, reads and writes Gaelic – ‘all skills’.
2. Speaks and reads but does not write Gaelic – ‘oracy and reading’
3. Speaks but does not read or write Gaelic – ‘oracy only’
4. Understands, but does not speak, read or write Gaelic – ‘understands
only’
5. Reads and/or writes but does not speak Gaelic – ‘literacy only’
6. No skills in Gaelic.
All of the tables relating to skills are based either on this coding or on a summary
version of it. These categories maximise the presentation of detail (as there is no
longer an ‘other combination of skills in Gaelic’ category), and were felt, in
consultation with stakeholders, to present information on Gaelic skills in a more
reader-friendly and useable format.
The categorisation assumes ability in the receptive language skill if the respondent
reports ability in the productive language skill. Thus, if the respondent reports that
they can speak Gaelic then it is assumed that they can also understand Gaelic (in
categories 1–3). Similarly, if a respondent reports that they can write Gaelic it is
assumed that they can also read it (category 1).
28 © Crown Copyright 2015 National Records of Scotland
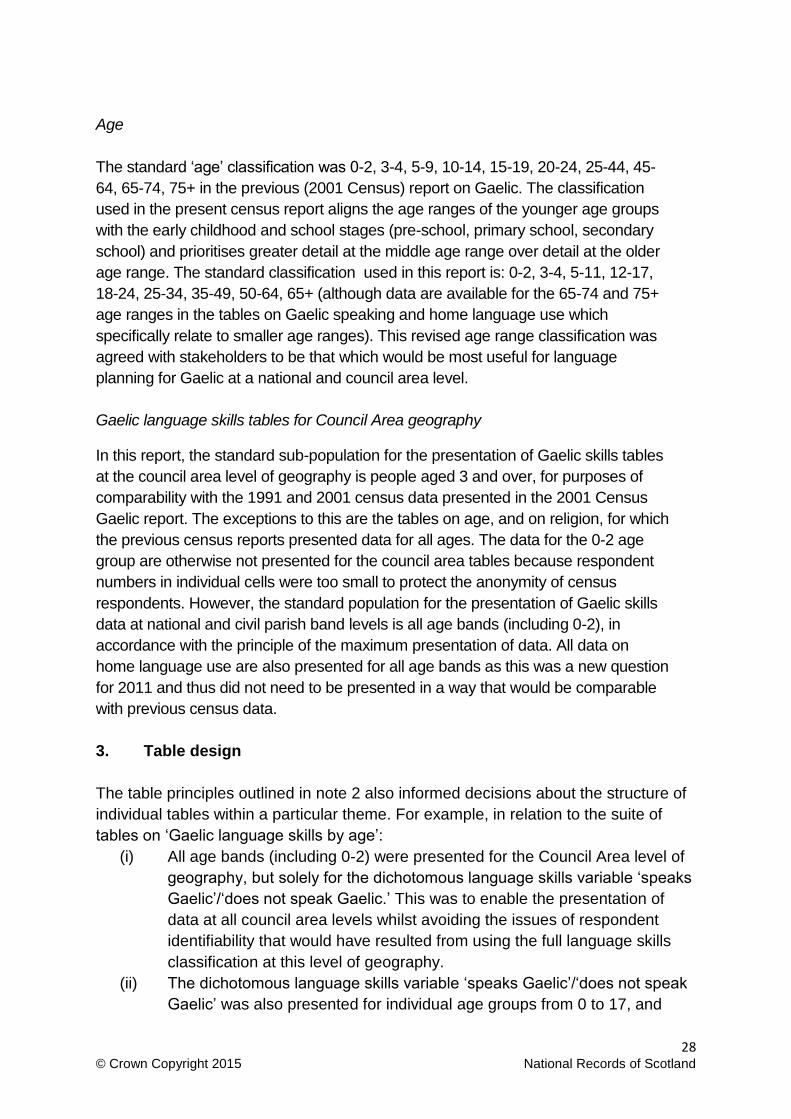
Age
The standard ‘age’ classification was 0-2, 3-4, 5-9, 10-14, 15-19, 20-24, 25-44, 45-
64, 65-74, 75+ in the previous (2001 Census) report on Gaelic. The classification
used in the present census report aligns the age ranges of the younger age groups
with the early childhood and school stages (pre-school, primary school, secondary
school) and prioritises greater detail at the middle age range over detail at the older
age range. The standard classification used in this report is: 0-2, 3-4, 5-11, 12-17,
18-24, 25-34, 35-49, 50-64, 65+ (although data are available for the 65-74 and 75+
age ranges in the tables on Gaelic speaking and home language use which
specifically relate to smaller age ranges). This revised age range classification was
agreed with stakeholders to be that which would be most useful for language
planning for Gaelic at a national and council area level.
Gaelic language skills tables for Council Area geography
In this report, the standard sub-population for the presentation of Gaelic skills tables
at the council area level of geography is people aged 3 and over, for purposes of
comparability with the 1991 and 2001 census data presented in the 2001 Census
Gaelic report. The exceptions to this are the tables on age, and on religion, for which
the previous census reports presented data for all ages. The data for the 0-2 age
group are otherwise not presented for the council area tables because respondent
numbers in individual cells were too small to protect the anonymity of census
respondents. However, the standard population for the presentation of Gaelic skills
data at national and civil parish band levels is all age bands (including 0-2), in
accordance with the principle of the maximum presentation of data. All data on
home language use are also presented for all age bands as this was a new question
for 2011 and thus did not need to be presented in a way that would be comparable
with previous census data.
3. Table design
The table principles outlined in note 2 also informed decisions about the structure of
individual tables within a particular theme. For example, in relation to the suite of
tables on ‘Gaelic language skills by age’:
(i) All age bands (including 0-2) were presented for the Council Area level of
geography, but solely for the dichotomous language skills variable ‘speaks
Gaelic’/‘does not speak Gaelic.’ This was to enable the presentation of
data at all council area levels whilst avoiding the issues of respondent
identifiability that would have resulted from using the full language skills
classification at this level of geography.
(ii) The dichotomous language skills variable ‘speaks Gaelic’/‘does not speak
Gaelic’ was also presented for individual age groups from 0 to 17, and
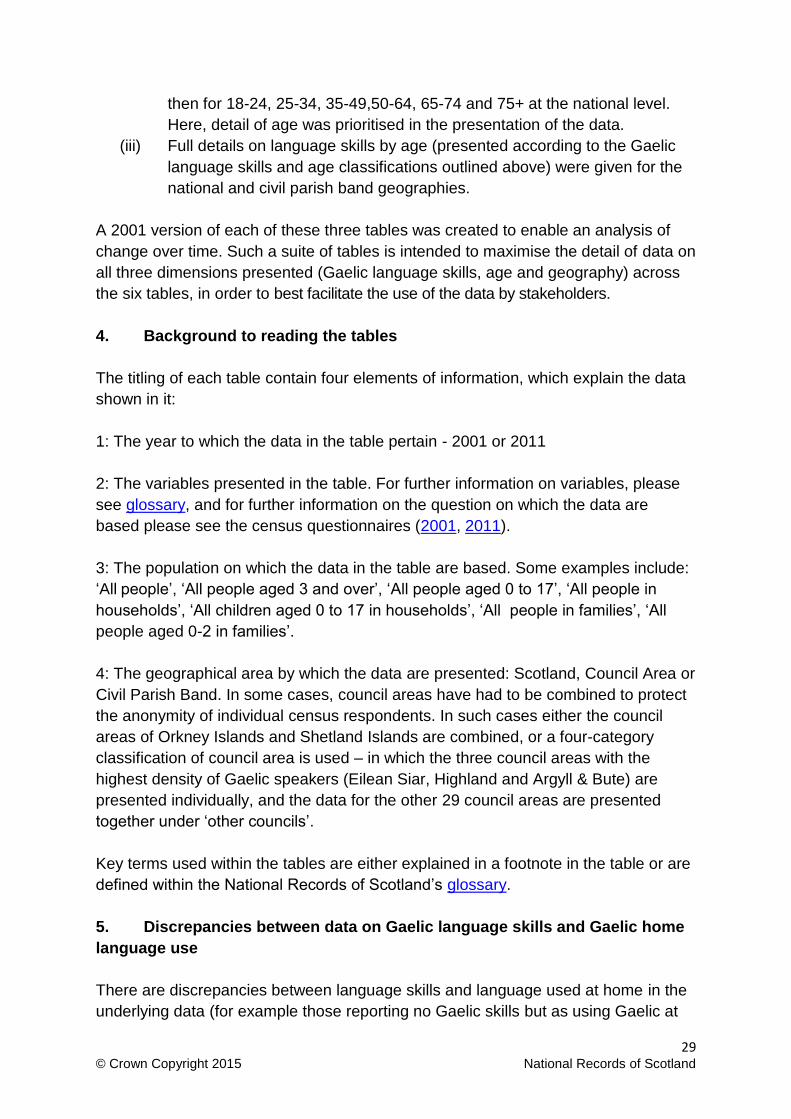
29 © Crown Copyright 2015 National Records of Scotland
then for 18-24, 25-34, 35-49,50-64, 65-74 and 75+ at the national level.
Here, detail of age was prioritised in the presentation of the data.
(iii) Full details on language skills by age (presented according to the Gaelic
language skills and age classifications outlined above) were given for the
national and civil parish band geographies.
A 2001 version of each of these three tables was created to enable an analysis of
change over time. Such a suite of tables is intended to maximise the detail of data on
all three dimensions presented (Gaelic language skills, age and geography) across
the six tables, in order to best facilitate the use of the data by stakeholders.
4. Background to reading the tables
The titling of each table contain four elements of information, which explain the data
shown in it:
1: The year to which the data in the table pertain - 2001 or 2011
2: The variables presented in the table. For further information on variables, please
see glossary, and for further information on the question on which the data are
based please see the census questionnaires (2001, 2011).
3: The population on which the data in the table are based. Some examples include:
‘All people’, ‘All people aged 3 and over’, ‘All people aged 0 to 17’, ‘All people in
households’, ‘All children aged 0 to 17 in households’, ‘All people in families’, ‘All
people aged 0-2 in families’.
4: The geographical area by which the data are presented: Scotland, Council Area or
Civil Parish Band. In some cases, council areas have had to be combined to protect
the anonymity of individual census respondents. In such cases either the council
areas of Orkney Islands and Shetland Islands are combined, or a four-category
classification of council area is used – in which the three council areas with the
highest density of Gaelic speakers (Eilean Siar, Highland and Argyll & Bute) are
presented individually, and the data for the other 29 council areas are presented
together under ‘other councils’.
Key terms used within the tables are either explained in a footnote in the table or are
defined within the National Records of Scotland’s glossary.
5. Discrepancies between data on Gaelic language skills and Gaelic home
language use
There are discrepancies between language skills and language used at home in the
underlying data (for example those reporting no Gaelic skills but as using Gaelic at
30 © Crown Copyright 2015 National Records of Scotland
home). These are likely to be due to different interpretations of the questions. For
instance, someone who had completed the questionnaire on behalf of their young
child may have said their child did not have any Gaelic skills, yet reported that Gaelic
is used at home, as this is the language used by the rest of those living in the
household in which the child was brought up. Also, people may consider the use of
Gaelic media (for example, watching Gaelic TV channels) as using the Gaelic
language at home, despite not reporting any Gaelic language skills.
31 © Crown Copyright 2015 National Records of Scotland
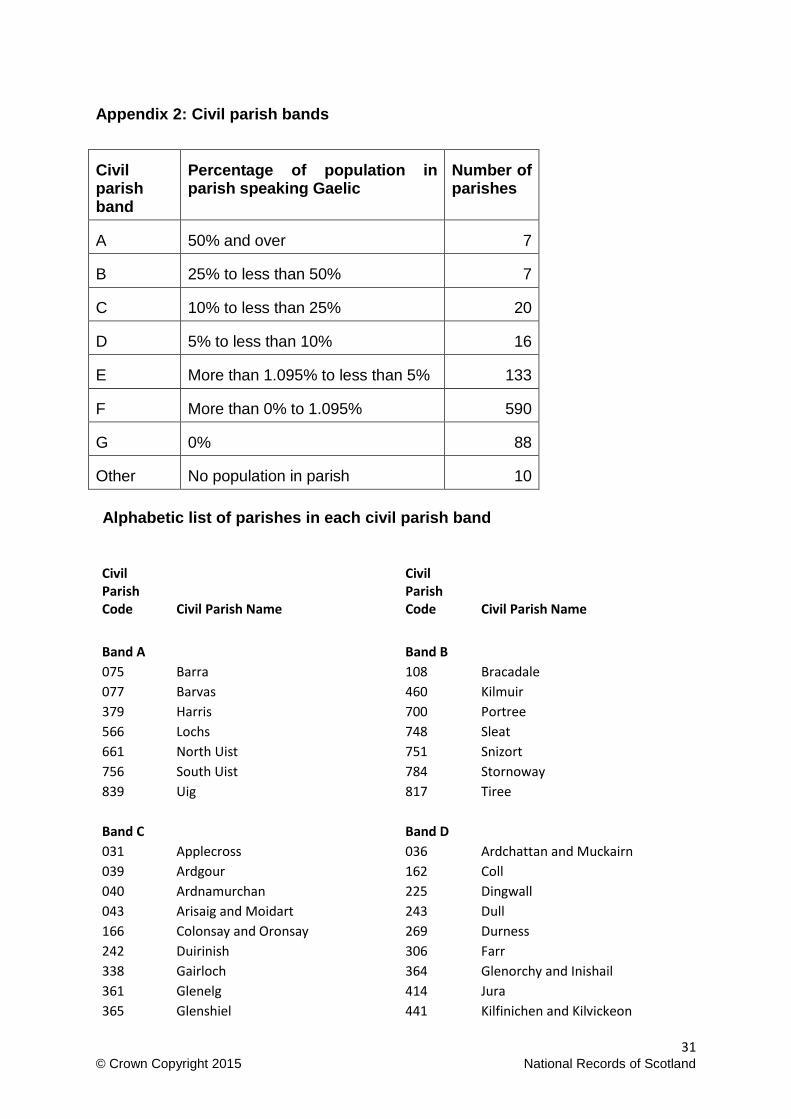
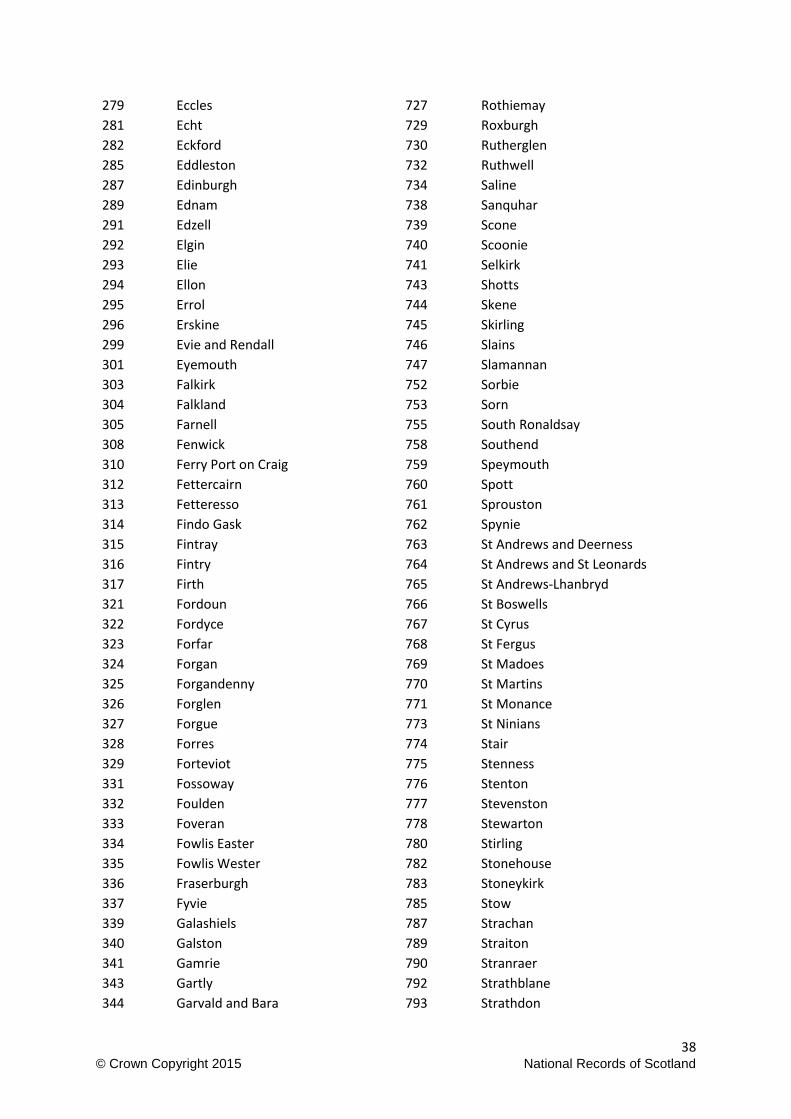
Appendix 2: Civil parish bands
Civil parish band
Percentage of population in parish speaking Gaelic
Number of parishes
A 50% and over 7
B 25% to less than 50% 7
C 10% to less than 25% 20
D 5% to less than 10% 16
E More than 1.095% to less than 5% 133
F More than 0% to 1.095% 590
G 0% 88
Other No population in parish 10
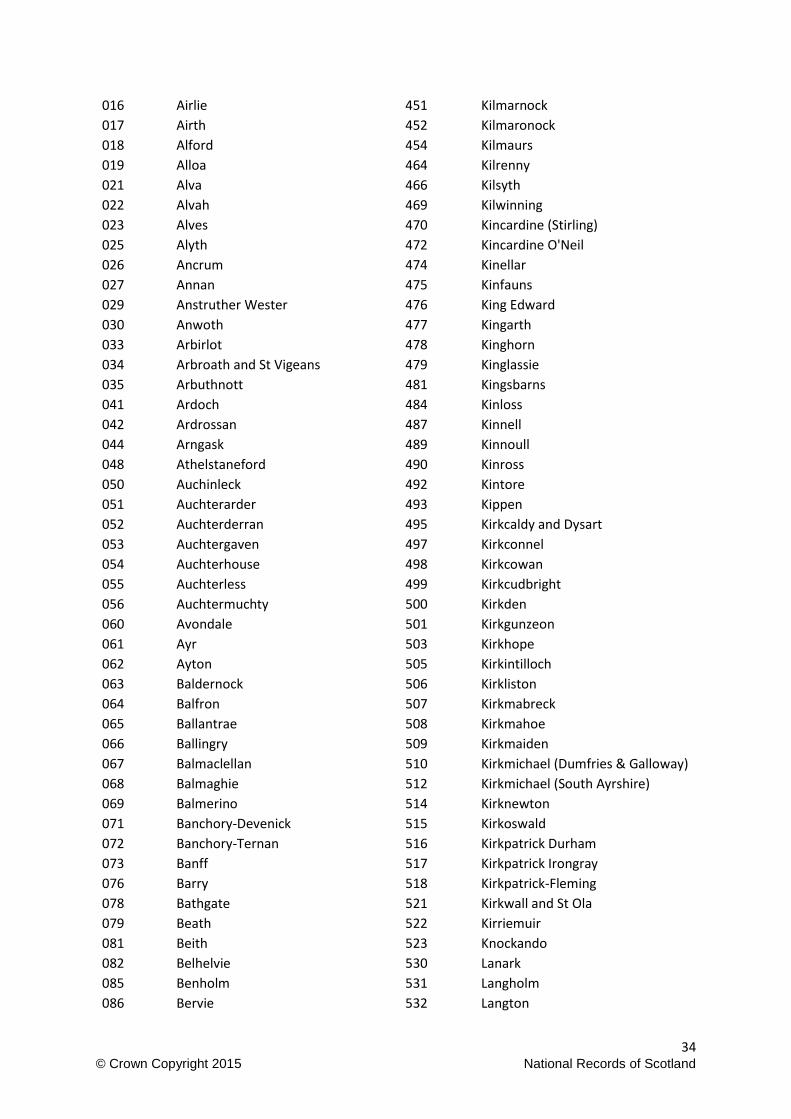
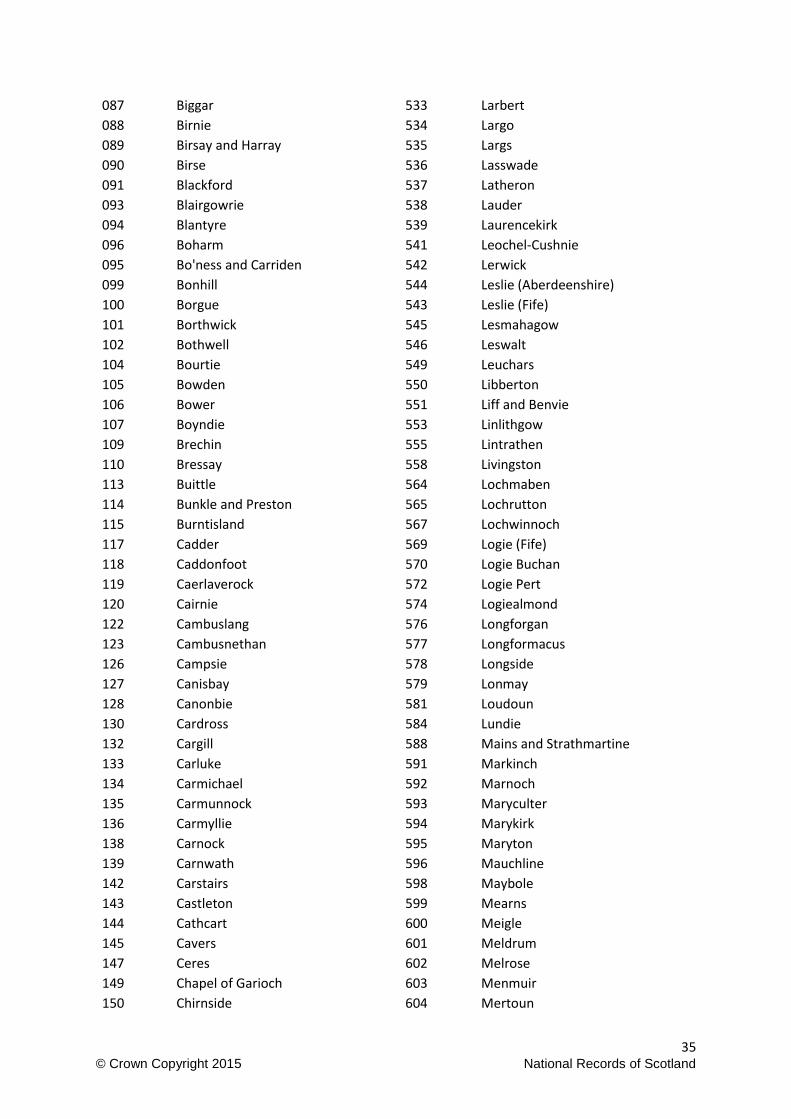
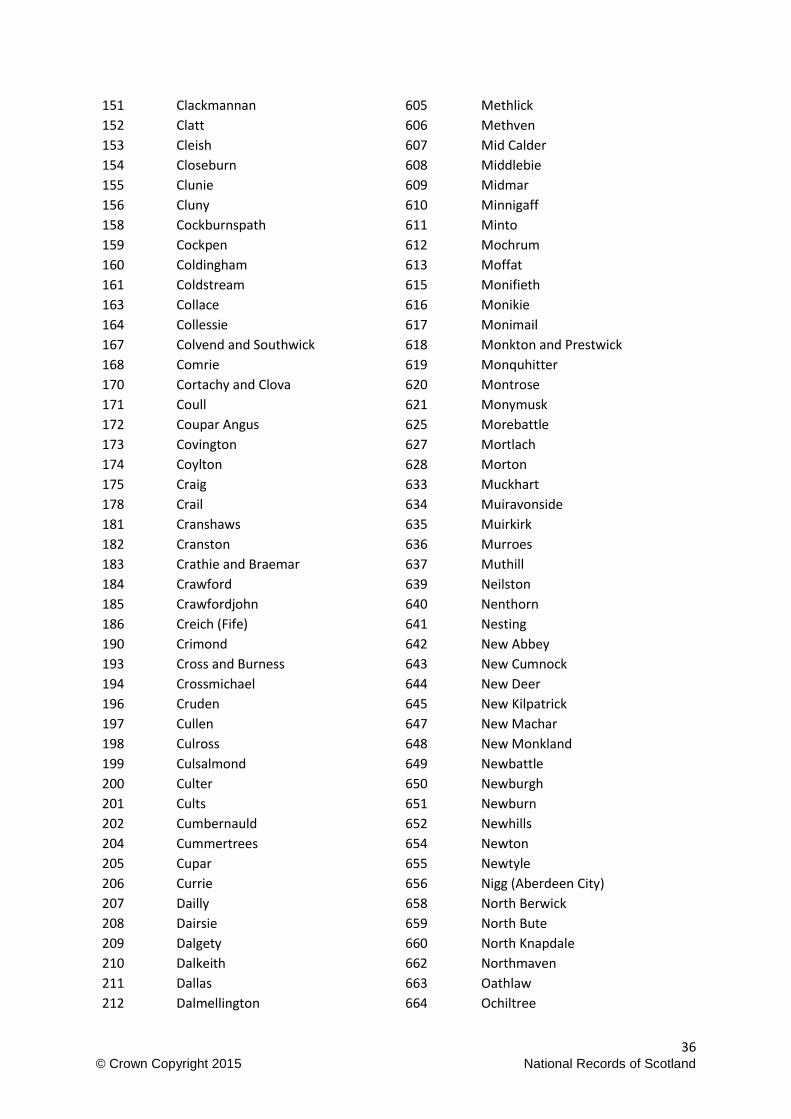
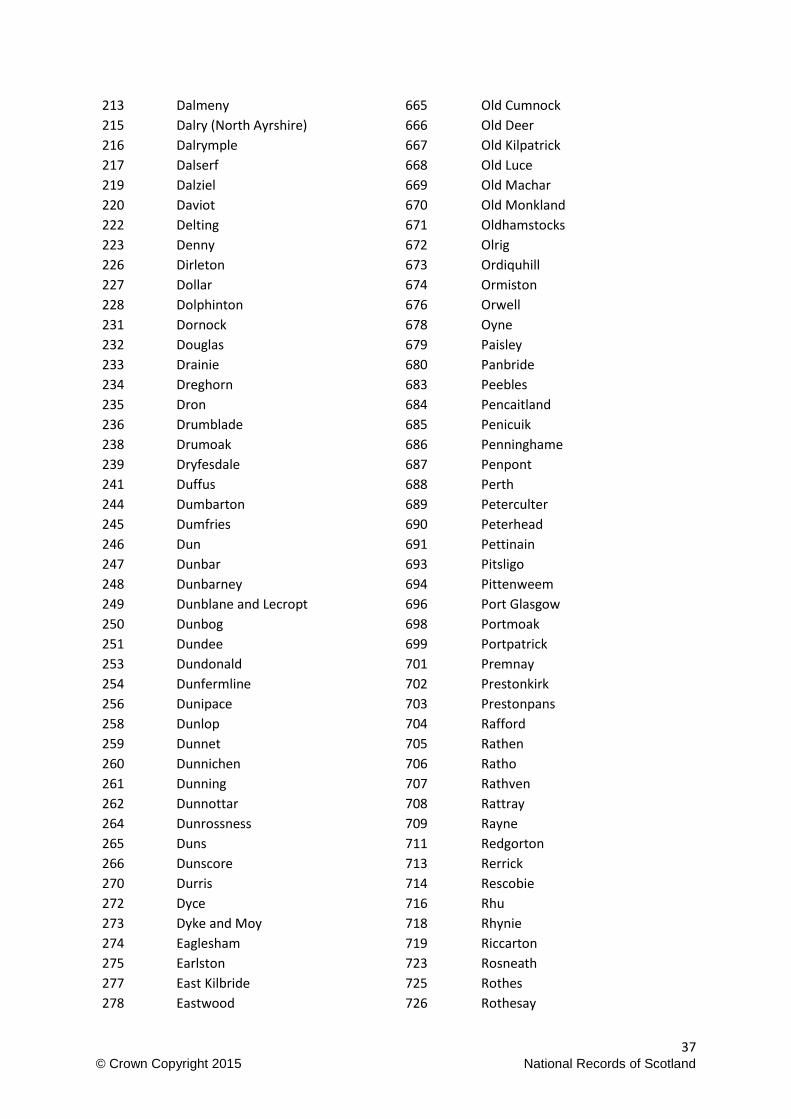
Alphabetic list of parishes in each civil parish band
Civil Parish Code Civil Parish Name
Civil Parish Code Civil Parish Name
Band A
Band B 075 Barra 108 Bracadale
077 Barvas 460 Kilmuir
379 Harris 700 Portree
566 Lochs 748 Sleat
661 North Uist 751 Snizort
756 South Uist 784 Stornoway
839 Uig 817 Tiree
Band C
Band D 031 Applecross 036 Ardchattan and Muckairn
039 Ardgour 162 Coll
040 Ardnamurchan 225 Dingwall
043 Arisaig and Moidart 243 Dull
166 Colonsay and Oronsay 269 Durness
242 Duirinish 306 Farr
338 Gairloch 364 Glenorchy and Inishail
361 Glenelg 414 Jura
365 Glenshiel 441 Kilfinichen and Kilvickeon
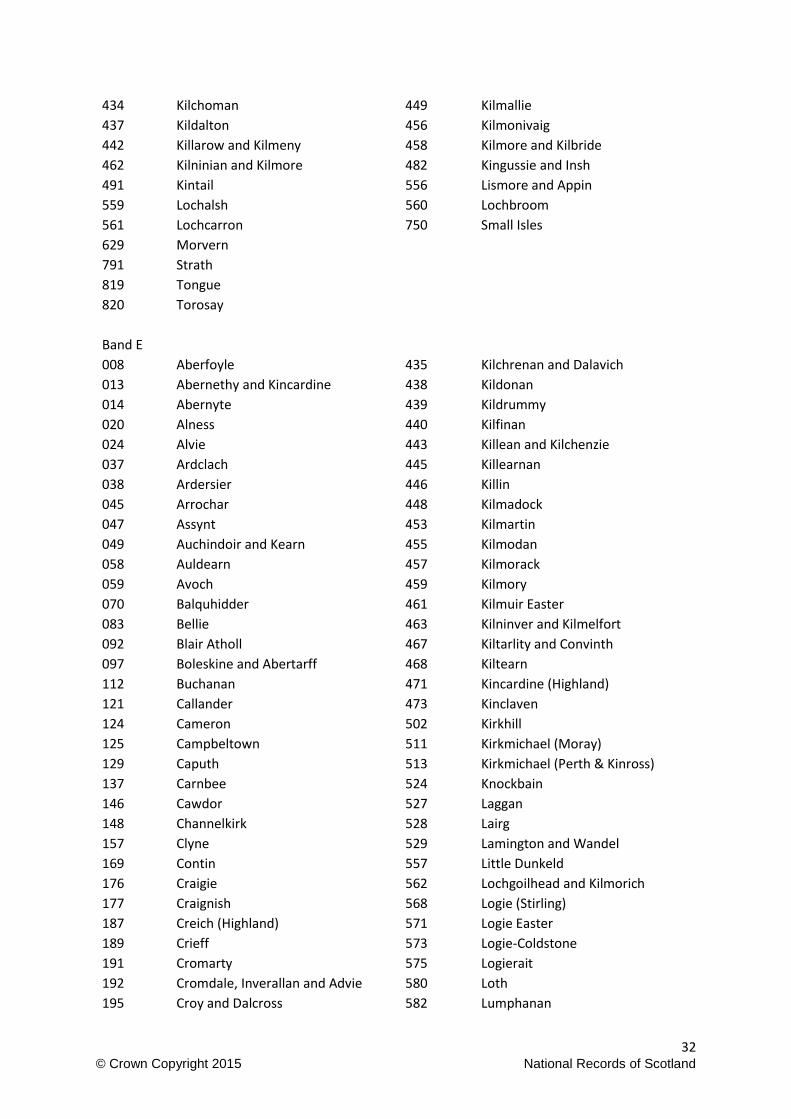
32 © Crown Copyright 2015 National Records of Scotland
434 Kilchoman 449 Kilmallie
437 Kildalton 456 Kilmonivaig
442 Killarow and Kilmeny 458 Kilmore and Kilbride
462 Kilninian and Kilmore 482 Kingussie and Insh
491 Kintail 556 Lismore and Appin
559 Lochalsh 560 Lochbroom
561 Lochcarron 750 Small Isles
629 Morvern 791 Strath 819 Tongue 820 Torosay
Band E 008 Aberfoyle 435 Kilchrenan and Dalavich
013 Abernethy and Kincardine 438 Kildonan
014 Abernyte 439 Kildrummy
020 Alness 440 Kilfinan
024 Alvie 443 Killean and Kilchenzie
037 Ardclach 445 Killearnan
038 Ardersier 446 Killin
045 Arrochar 448 Kilmadock
047 Assynt 453 Kilmartin
049 Auchindoir and Kearn 455 Kilmodan
058 Auldearn 457 Kilmorack
059 Avoch 459 Kilmory
070 Balquhidder 461 Kilmuir Easter
083 Bellie 463 Kilninver and Kilmelfort
092 Blair Atholl 467 Kiltarlity and Convinth
097 Boleskine and Abertarff 468 Kiltearn
112 Buchanan 471 Kincardine (Highland)
121 Callander 473 Kinclaven
124 Cameron 502 Kirkhill
125 Campbeltown 511 Kirkmichael (Moray)
129 Caputh 513 Kirkmichael (Perth & Kinross)
137 Carnbee 524 Knockbain
146 Cawdor 527 Laggan
148 Channelkirk 528 Lairg
157 Clyne 529 Lamington and Wandel
169 Contin 557 Little Dunkeld
176 Craigie 562 Lochgoilhead and Kilmorich
177 Craignish 568 Logie (Stirling)
187 Creich (Highland) 571 Logie Easter
189 Crieff 573 Logie-Coldstone
191 Cromarty 575 Logierait
192 Cromdale, Inverallan and Advie 580 Loth
195 Croy and Dalcross 582 Lumphanan
33 © Crown Copyright 2015 National Records of Scotland
203 Cumbrae 585 Luss
221 Daviot and Dunlichity 597 Maxton
229 Dores 622 Monzievaird and Strowan
230 Dornoch 626 Morham
240 Drymen 630 Moulin
257 Dunkeld and Dowally 632 Moy and Dalarossie
263 Dunoon and Kilmun 638 Nairn
271 Duthil and Rothiemurchus 657 Nigg (Highland)
280 Ecclesmachan 675 Orphir
284 Edderton 682 Parton
286 Eddrachillis 692 Petty
288 Edinkillie 697 Port Of Menteith
297 Eskdalemuir 710 Reay
300 Ewes 712 Renfrew
307 Fearn 715 Resolis
309 Fern 721 Rogart
318 Flisk 722 Rosemarkie
319 Fodderty 724 Rosskeen
330 Fortingall 733 Saddell and Skipness
342 Gargunnock 737 Sandwick
346 Gigha and Cara 754 South Knapdale
353 Glassary 786 Stracathro
360 Glendevon 788 Strachur
366 Golspie 802 Tain
368 Govan 804 Tarbat
377 Halkirk 812 Thurso
388 Hoy and Graemsay 824 Tough
400 Inveraray 825 Towie
403 Inverchaolain 843 Urquhart and Glenmoriston
409 Inverness and Bona 844 Urquhart and Logie Wester
424 Kenmore 846 Urray
431 Kilbrandon and Kilchattan 851 Watten
432 Kilbride 852 Weem
433 Kilcalmonell
Band F 002 Abdie 422 Kemback
003 Abercorn 423 Kemnay
004 Aberdalgie 425 Kennethmont
005 Aberdeen 426 Kennoway
007 Aberdour (Aberdeenshire) 428 Kettle
006 Aberdour (Fife) 429 Kilbarchan
009 Aberlady 430 Kilbirnie
011 Aberlour 436 Kilconquhar
012 Abernethy 444 Killearn
015 Aboyne and Glen Tanar 447 Kilmacolm
34 © Crown Copyright 2015 National Records of Scotland
016 Airlie 451 Kilmarnock
017 Airth 452 Kilmaronock
018 Alford 454 Kilmaurs
019 Alloa 464 Kilrenny
021 Alva 466 Kilsyth
022 Alvah 469 Kilwinning
023 Alves 470 Kincardine (Stirling)
025 Alyth 472 Kincardine O'Neil
026 Ancrum 474 Kinellar
027 Annan 475 Kinfauns
029 Anstruther Wester 476 King Edward
030 Anwoth 477 Kingarth
033 Arbirlot 478 Kinghorn
034 Arbroath and St Vigeans 479 Kinglassie
035 Arbuthnott 481 Kingsbarns
041 Ardoch 484 Kinloss
042 Ardrossan 487 Kinnell
044 Arngask 489 Kinnoull
048 Athelstaneford 490 Kinross
050 Auchinleck 492 Kintore
051 Auchterarder 493 Kippen
052 Auchterderran 495 Kirkcaldy and Dysart
053 Auchtergaven 497 Kirkconnel
054 Auchterhouse 498 Kirkcowan
055 Auchterless 499 Kirkcudbright
056 Auchtermuchty 500 Kirkden
060 Avondale 501 Kirkgunzeon
061 Ayr 503 Kirkhope
062 Ayton 505 Kirkintilloch
063 Baldernock 506 Kirkliston
064 Balfron 507 Kirkmabreck
065 Ballantrae 508 Kirkmahoe
066 Ballingry 509 Kirkmaiden
067 Balmaclellan 510 Kirkmichael (Dumfries & Galloway)
068 Balmaghie 512 Kirkmichael (South Ayrshire)
069 Balmerino 514 Kirknewton
071 Banchory-Devenick 515 Kirkoswald
072 Banchory-Ternan 516 Kirkpatrick Durham
073 Banff 517 Kirkpatrick Irongray
076 Barry 518 Kirkpatrick-Fleming
078 Bathgate 521 Kirkwall and St Ola
079 Beath 522 Kirriemuir
081 Beith 523 Knockando
082 Belhelvie 530 Lanark
085 Benholm 531 Langholm
086 Bervie 532 Langton
35 © Crown Copyright 2015 National Records of Scotland
087 Biggar 533 Larbert
088 Birnie 534 Largo
089 Birsay and Harray 535 Largs
090 Birse 536 Lasswade
091 Blackford 537 Latheron
093 Blairgowrie 538 Lauder
094 Blantyre 539 Laurencekirk
096 Boharm 541 Leochel-Cushnie
095 Bo'ness and Carriden 542 Lerwick
099 Bonhill 544 Leslie (Aberdeenshire)
100 Borgue 543 Leslie (Fife)
101 Borthwick 545 Lesmahagow
102 Bothwell 546 Leswalt
104 Bourtie 549 Leuchars
105 Bowden 550 Libberton
106 Bower 551 Liff and Benvie
107 Boyndie 553 Linlithgow
109 Brechin 555 Lintrathen
110 Bressay 558 Livingston
113 Buittle 564 Lochmaben
114 Bunkle and Preston 565 Lochrutton
115 Burntisland 567 Lochwinnoch
117 Cadder 569 Logie (Fife)
118 Caddonfoot 570 Logie Buchan
119 Caerlaverock 572 Logie Pert
120 Cairnie 574 Logiealmond
122 Cambuslang 576 Longforgan
123 Cambusnethan 577 Longformacus
126 Campsie 578 Longside
127 Canisbay 579 Lonmay
128 Canonbie 581 Loudoun
130 Cardross 584 Lundie
132 Cargill 588 Mains and Strathmartine
133 Carluke 591 Markinch
134 Carmichael 592 Marnoch
135 Carmunnock 593 Maryculter
136 Carmyllie 594 Marykirk
138 Carnock 595 Maryton
139 Carnwath 596 Mauchline
142 Carstairs 598 Maybole
143 Castleton 599 Mearns
144 Cathcart 600 Meigle
145 Cavers 601 Meldrum
147 Ceres 602 Melrose
149 Chapel of Garioch 603 Menmuir
150 Chirnside 604 Mertoun
36 © Crown Copyright 2015 National Records of Scotland
151 Clackmannan 605 Methlick
152 Clatt 606 Methven
153 Cleish 607 Mid Calder
154 Closeburn 608 Middlebie
155 Clunie 609 Midmar
156 Cluny 610 Minnigaff
158 Cockburnspath 611 Minto
159 Cockpen 612 Mochrum
160 Coldingham 613 Moffat
161 Coldstream 615 Monifieth
163 Collace 616 Monikie
164 Collessie 617 Monimail
167 Colvend and Southwick 618 Monkton and Prestwick
168 Comrie 619 Monquhitter
170 Cortachy and Clova 620 Montrose
171 Coull 621 Monymusk
172 Coupar Angus 625 Morebattle
173 Covington 627 Mortlach
174 Coylton 628 Morton
175 Craig 633 Muckhart
178 Crail 634 Muiravonside
181 Cranshaws 635 Muirkirk
182 Cranston 636 Murroes
183 Crathie and Braemar 637 Muthill
184 Crawford 639 Neilston
185 Crawfordjohn 640 Nenthorn
186 Creich (Fife) 641 Nesting
190 Crimond 642 New Abbey
193 Cross and Burness 643 New Cumnock
194 Crossmichael 644 New Deer
196 Cruden 645 New Kilpatrick
197 Cullen 647 New Machar
198 Culross 648 New Monkland
199 Culsalmond 649 Newbattle
200 Culter 650 Newburgh
201 Cults 651 Newburn
202 Cumbernauld 652 Newhills
204 Cummertrees 654 Newton
205 Cupar 655 Newtyle
206 Currie 656 Nigg (Aberdeen City)
207 Dailly 658 North Berwick
208 Dairsie 659 North Bute
209 Dalgety 660 North Knapdale
210 Dalkeith 662 Northmaven
211 Dallas 663 Oathlaw
212 Dalmellington 664 Ochiltree
37 © Crown Copyright 2015 National Records of Scotland
213 Dalmeny 665 Old Cumnock
215 Dalry (North Ayrshire) 666 Old Deer
216 Dalrymple 667 Old Kilpatrick
217 Dalserf 668 Old Luce
219 Dalziel 669 Old Machar
220 Daviot 670 Old Monkland
222 Delting 671 Oldhamstocks
223 Denny 672 Olrig
226 Dirleton 673 Ordiquhill
227 Dollar 674 Ormiston
228 Dolphinton 676 Orwell
231 Dornock 678 Oyne
232 Douglas 679 Paisley
233 Drainie 680 Panbride
234 Dreghorn 683 Peebles
235 Dron 684 Pencaitland
236 Drumblade 685 Penicuik
238 Drumoak 686 Penninghame
239 Dryfesdale 687 Penpont
241 Duffus 688 Perth
244 Dumbarton 689 Peterculter
245 Dumfries 690 Peterhead
246 Dun 691 Pettinain
247 Dunbar 693 Pitsligo
248 Dunbarney 694 Pittenweem
249 Dunblane and Lecropt 696 Port Glasgow
250 Dunbog 698 Portmoak
251 Dundee 699 Portpatrick
253 Dundonald 701 Premnay
254 Dunfermline 702 Prestonkirk
256 Dunipace 703 Prestonpans
258 Dunlop 704 Rafford
259 Dunnet 705 Rathen
260 Dunnichen 706 Ratho
261 Dunning 707 Rathven
262 Dunnottar 708 Rattray
264 Dunrossness 709 Rayne
265 Duns 711 Redgorton
266 Dunscore 713 Rerrick
270 Durris 714 Rescobie
272 Dyce 716 Rhu
273 Dyke and Moy 718 Rhynie
274 Eaglesham 719 Riccarton
275 Earlston 723 Rosneath
277 East Kilbride 725 Rothes
278 Eastwood 726 Rothesay
38 © Crown Copyright 2015 National Records of Scotland
279 Eccles 727 Rothiemay
281 Echt 729 Roxburgh
282 Eckford 730 Rutherglen
285 Eddleston 732 Ruthwell
287 Edinburgh 734 Saline
289 Ednam 738 Sanquhar
291 Edzell 739 Scone
292 Elgin 740 Scoonie
293 Elie 741 Selkirk
294 Ellon 743 Shotts
295 Errol 744 Skene
296 Erskine 745 Skirling
299 Evie and Rendall 746 Slains
301 Eyemouth 747 Slamannan
303 Falkirk 752 Sorbie
304 Falkland 753 Sorn
305 Farnell 755 South Ronaldsay
308 Fenwick 758 Southend
310 Ferry Port on Craig 759 Speymouth
312 Fettercairn 760 Spott
313 Fetteresso 761 Sprouston
314 Findo Gask 762 Spynie
315 Fintray 763 St Andrews and Deerness
316 Fintry 764 St Andrews and St Leonards
317 Firth 765 St Andrews-Lhanbryd
321 Fordoun 766 St Boswells
322 Fordyce 767 St Cyrus
323 Forfar 768 St Fergus
324 Forgan 769 St Madoes
325 Forgandenny 770 St Martins
326 Forglen 771 St Monance
327 Forgue 773 St Ninians
328 Forres 774 Stair
329 Forteviot 775 Stenness
331 Fossoway 776 Stenton
332 Foulden 777 Stevenston
333 Foveran 778 Stewarton
334 Fowlis Easter 780 Stirling
335 Fowlis Wester 782 Stonehouse
336 Fraserburgh 783 Stoneykirk
337 Fyvie 785 Stow
339 Galashiels 787 Strachan
340 Galston 789 Straiton
341 Gamrie 790 Stranraer
343 Gartly 792 Strathblane
344 Garvald and Bara 793 Strathdon
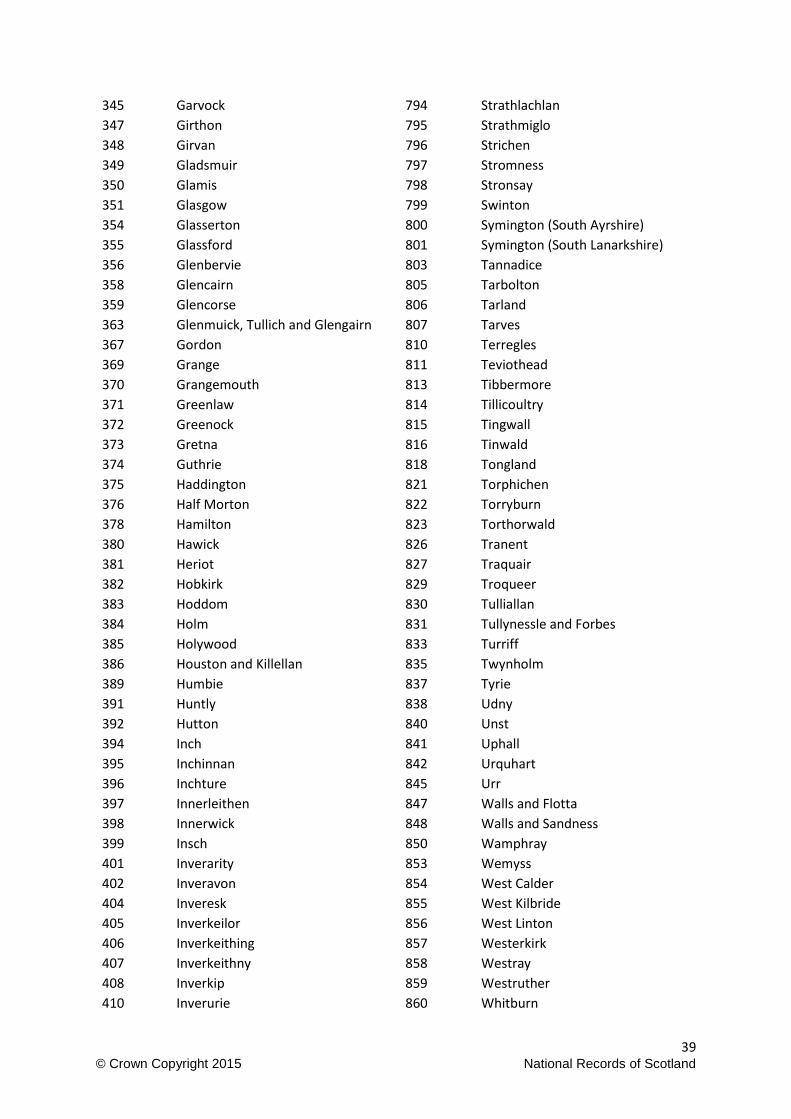
39 © Crown Copyright 2015 National Records of Scotland
345 Garvock 794 Strathlachlan
347 Girthon 795 Strathmiglo
348 Girvan 796 Strichen
349 Gladsmuir 797 Stromness
350 Glamis 798 Stronsay
351 Glasgow 799 Swinton
354 Glasserton 800 Symington (South Ayrshire)
355 Glassford 801 Symington (South Lanarkshire)
356 Glenbervie 803 Tannadice
358 Glencairn 805 Tarbolton
359 Glencorse 806 Tarland
363 Glenmuick, Tullich and Glengairn 807 Tarves
367 Gordon 810 Terregles
369 Grange 811 Teviothead
370 Grangemouth 813 Tibbermore
371 Greenlaw 814 Tillicoultry
372 Greenock 815 Tingwall
373 Gretna 816 Tinwald
374 Guthrie 818 Tongland
375 Haddington 821 Torphichen
376 Half Morton 822 Torryburn
378 Hamilton 823 Torthorwald
380 Hawick 826 Tranent
381 Heriot 827 Traquair
382 Hobkirk 829 Troqueer
383 Hoddom 830 Tulliallan
384 Holm 831 Tullynessle and Forbes
385 Holywood 833 Turriff
386 Houston and Killellan 835 Twynholm
389 Humbie 837 Tyrie
391 Huntly 838 Udny
392 Hutton 840 Unst
394 Inch 841 Uphall
395 Inchinnan 842 Urquhart
396 Inchture 845 Urr
397 Innerleithen 847 Walls and Flotta
398 Innerwick 848 Walls and Sandness
399 Insch 850 Wamphray
401 Inverarity 853 Wemyss
402 Inveravon 854 West Calder
404 Inveresk 855 West Kilbride
405 Inverkeilor 856 West Linton
406 Inverkeithing 857 Westerkirk
407 Inverkeithny 858 Westray
408 Inverkip 859 Westruther
410 Inverurie 860 Whitburn
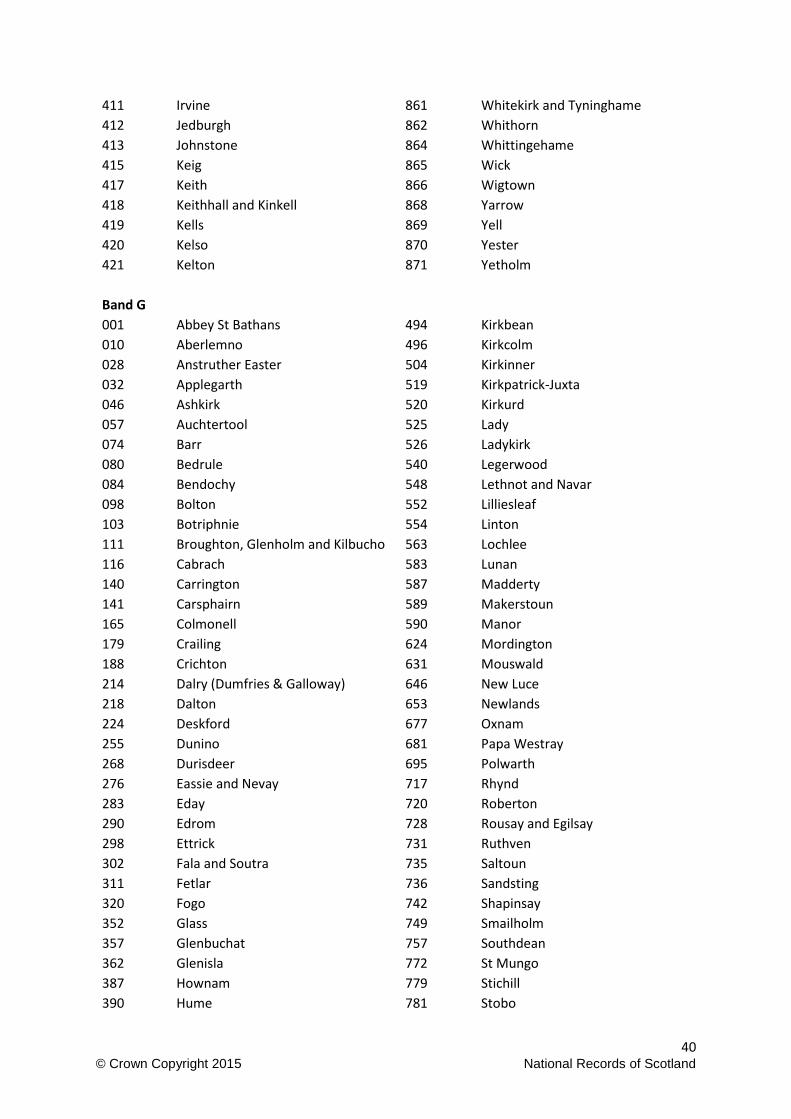
40 © Crown Copyright 2015 National Records of Scotland
411 Irvine 861 Whitekirk and Tyninghame
412 Jedburgh 862 Whithorn
413 Johnstone 864 Whittingehame
415 Keig 865 Wick
417 Keith 866 Wigtown
418 Keithhall and Kinkell 868 Yarrow
419 Kells 869 Yell
420 Kelso 870 Yester
421 Kelton 871 Yetholm
Band G 001 Abbey St Bathans 494 Kirkbean
010 Aberlemno 496 Kirkcolm
028 Anstruther Easter 504 Kirkinner
032 Applegarth 519 Kirkpatrick-Juxta
046 Ashkirk 520 Kirkurd
057 Auchtertool 525 Lady
074 Barr 526 Ladykirk
080 Bedrule 540 Legerwood
084 Bendochy 548 Lethnot and Navar
098 Bolton 552 Lilliesleaf
103 Botriphnie 554 Linton
111 Broughton, Glenholm and Kilbucho 563 Lochlee
116 Cabrach 583 Lunan
140 Carrington 587 Madderty
141 Carsphairn 589 Makerstoun
165 Colmonell 590 Manor
179 Crailing 624 Mordington
188 Crichton 631 Mouswald
214 Dalry (Dumfries & Galloway) 646 New Luce
218 Dalton 653 Newlands
224 Deskford 677 Oxnam
255 Dunino 681 Papa Westray
268 Durisdeer 695 Polwarth
276 Eassie and Nevay 717 Rhynd
283 Eday 720 Roberton
290 Edrom 728 Rousay and Egilsay
298 Ettrick 731 Ruthven
302 Fala and Soutra 735 Saltoun
311 Fetlar 736 Sandsting
320 Fogo 742 Shapinsay
352 Glass 749 Smailholm
357 Glenbuchat 757 Southdean
362 Glenisla 772 St Mungo
387 Hownam 779 Stichill
390 Hume 781 Stobo
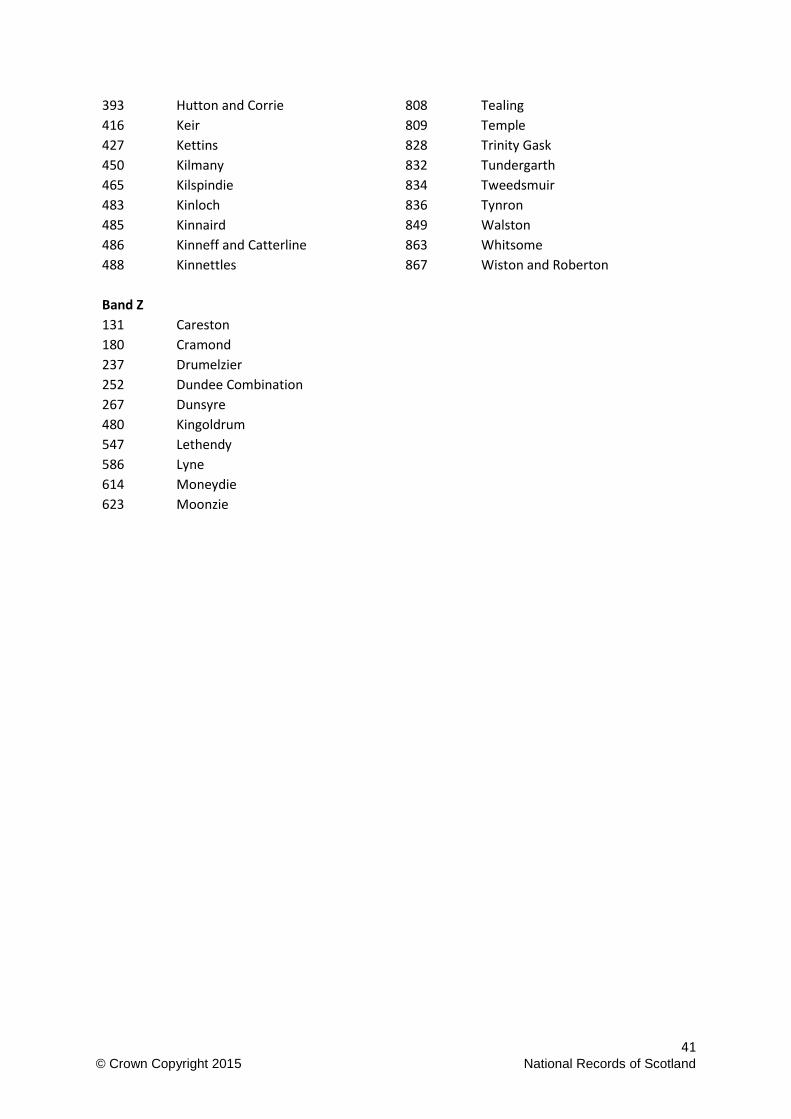
41 © Crown Copyright 2015 National Records of Scotland
393 Hutton and Corrie 808 Tealing
416 Keir 809 Temple
427 Kettins 828 Trinity Gask
450 Kilmany 832 Tundergarth
465 Kilspindie 834 Tweedsmuir
483 Kinloch 836 Tynron
485 Kinnaird 849 Walston
486 Kinneff and Catterline 863 Whitsome
488 Kinnettles 867 Wiston and Roberton
Band Z 131 Careston
180 Cramond 237 Drumelzier 252 Dundee Combination 267 Dunsyre 480 Kingoldrum 547 Lethendy 586 Lyne 614 Moneydie 623 Moonzie
42 © Crown Copyright 2015 National Records of Scotland
Appendix 3: Maps Map 1
43 © Crown Copyright 2015 National Records of Scotland
Map 2