Embed Size (px)
Citation preview
Scotland’s Balance Sheet April 2013
Contents
Executive Summary ................................................................................................... 1
Introduction and Overview .......................................................................................... 2
Public Spending ......................................................................................................... 5
Scottish Tax Revenue .............................................................................................. 12
Overall Fiscal Position and Public Sector Debt ........................................................ 18
Conclusion ............................................................................................................... 26
1
Executive Summary
This report provides detailed analysis of Scotland’s public finances under the current fiscal
framework. The analysis encompasses total public spending, public sector receipts, the net
fiscal balance and an implied share of UK public sector net debt. It does not consider wider
assets and liabilities.
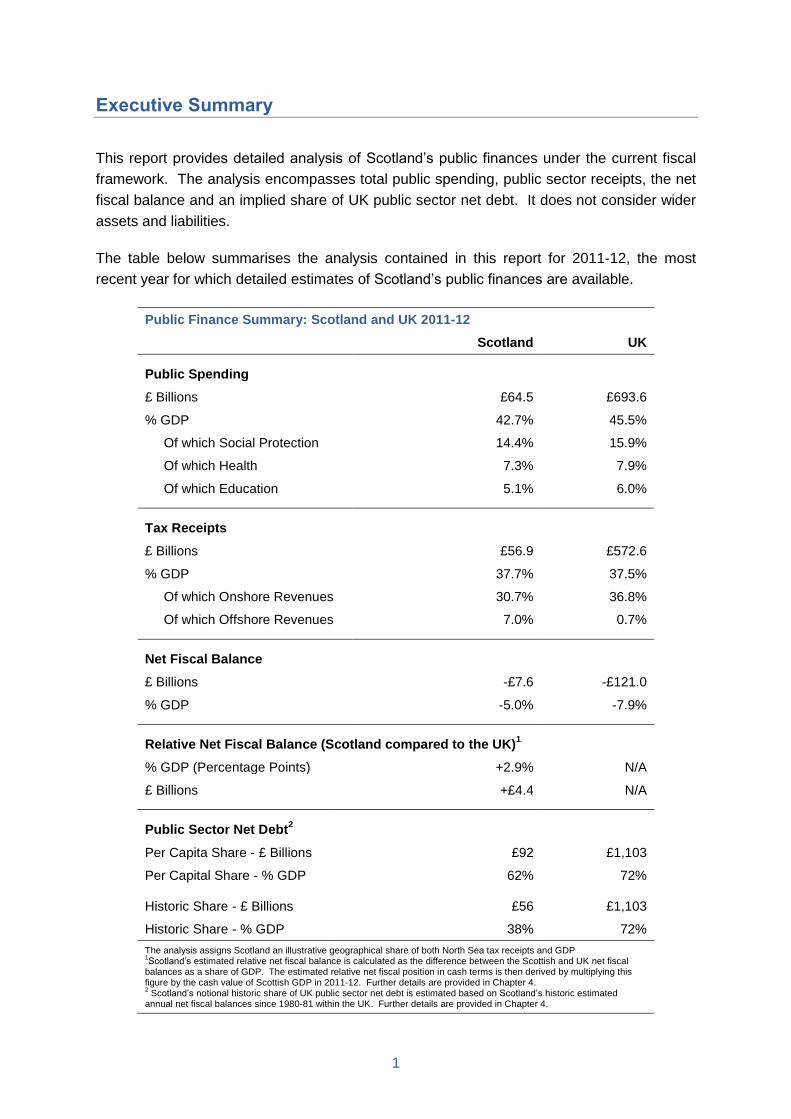
The table below summarises the analysis contained in this report for 2011-12, the most
recent year for which detailed estimates of Scotland’s public finances are available.
Public Finance Summary: Scotland and UK 2011-12
Scotland UK
Public Spending
£ Billions £64.5 £693.6
% GDP 42.7% 45.5%
Of which Social Protection 14.4% 15.9%
Of which Health 7.3% 7.9%
Of which Education 5.1% 6.0%
Tax Receipts
£ Billions £56.9 £572.6
% GDP 37.7% 37.5%
Of which Onshore Revenues 30.7% 36.8%
Of which Offshore Revenues 7.0% 0.7%
Net Fiscal Balance
£ Billions -£7.6 -£121.0
% GDP -5.0% -7.9%
Relative Net Fiscal Balance (Scotland compared to the UK)1
% GDP (Percentage Points) +2.9% N/A
£ Billions +£4.4 N/A
Public Sector Net Debt2
Per Capita Share - £ Billions £92 £1,103
Per Capital Share - % GDP 62% 72%
Historic Share - £ Billions £56 £1,103
Historic Share - % GDP 38% 72%
The analysis assigns Scotland an illustrative geographical share of both North Sea tax receipts and GDP 1Scotland’s estimated relative net fiscal balance is calculated as the difference between the Scottish and UK net fiscal
balances as a share of GDP. The estimated relative net fiscal position in cash terms is then derived by multiplying this figure by the cash value of Scottish GDP in 2011-12. Further details are provided in Chapter 4. 2 Scotland’s notional historic share of UK public sector net debt is estimated based on Scotland’s historic estimated
annual net fiscal balances since 1980-81 within the UK. Further details are provided in Chapter 4.
2
1. Introduction and Overview
1.1 This report provides a detailed assessment of Scotland’s public finances under the
current constitutional framework.
1.2 The report is structured as follows. Chapter 2 sets out both the overall size and
structure of public spending for Scotland. Chapter 3 then outlines the estimated composition
of public sector revenues in Scotland. Specific focus is given to the contribution that tax
receipts from oil and gas production make to Scotland’s public finances. Chapter 4
discusses Scotland’s estimated overall fiscal balance, the difference between public sector
revenue and expenditure, and provides illustrative estimates of Scotland’s share of UK
public sector net debt.
1.3 Unless otherwise noted, the analysis in this report is undertaken in the context of
Scotland’s current fiscal framework. It therefore does not consider, for example, the options
for taxation and public expenditure under independence.
Key Points
1.4 The key points made in the report are summarised below. In producing the analysis,
Scotland is assigned an illustrative geographical share of both offshore oil and gas tax
receipts and GDP.
Scottish Public Spending
1.5 Public spending for Scotland was estimated to be £64.5 billion in 2011-12.
Responsibility for approximately 60% of the public spending undertaken for Scotland is
devolved to the Scottish Government and Scottish local authorities.
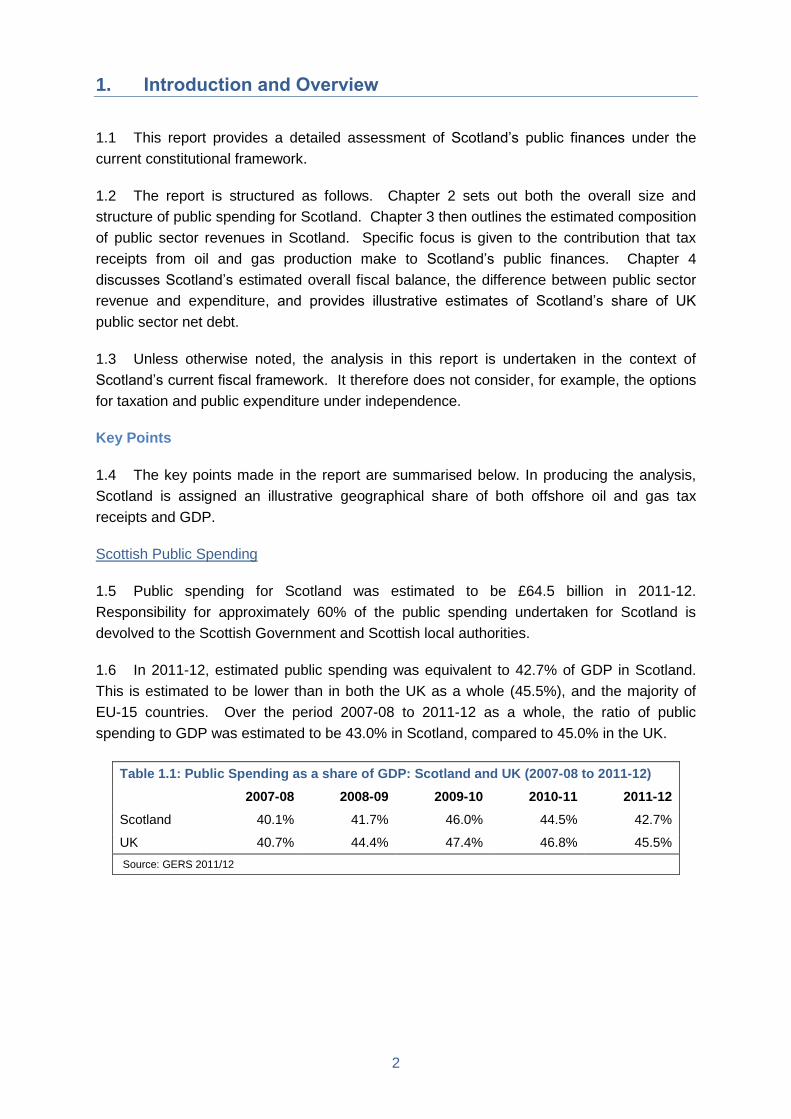
1.6 In 2011-12, estimated public spending was equivalent to 42.7% of GDP in Scotland.
This is estimated to be lower than in both the UK as a whole (45.5%), and the majority of
EU-15 countries. Over the period 2007-08 to 2011-12 as a whole, the ratio of public
spending to GDP was estimated to be 43.0% in Scotland, compared to 45.0% in the UK.
Table 1.1: Public Spending as a share of GDP: Scotland and UK (2007-08 to 2011-12)
2007-08 2008-09 2009-10 2010-11 2011-12
Scotland 40.1% 41.7% 46.0% 44.5% 42.7%
UK 40.7% 44.4% 47.4% 46.8% 45.5%
Source: GERS 2011/12
3
Scottish Tax Receipts
1.7 Total tax revenue in Scotland was estimated to be £56.9 billion in 2011-12. This
includes an illustrative geographical share of North Sea tax revenue, equivalent to £10.6
billion.
1.8 It is estimated that 7% of current total Scottish tax receipts are devolved. Most tax
powers, such as corporation tax and national insurance, are reserved to the UK Government
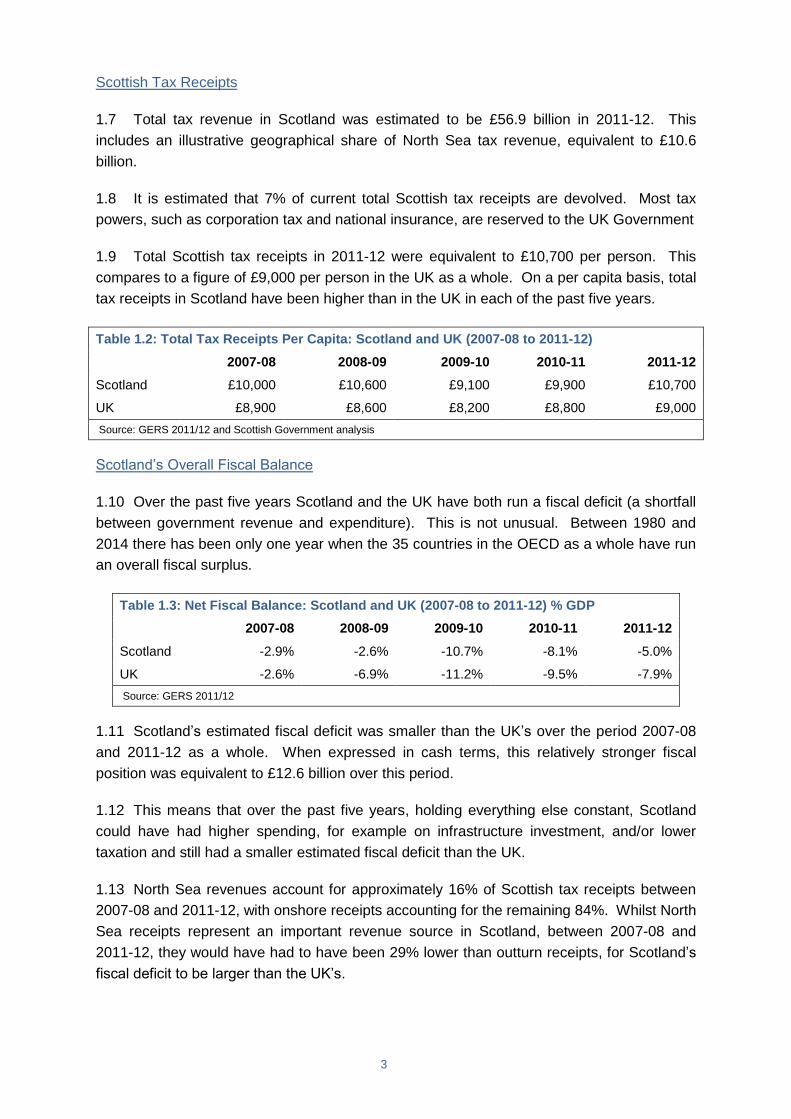
1.9 Total Scottish tax receipts in 2011-12 were equivalent to £10,700 per person. This
compares to a figure of £9,000 per person in the UK as a whole. On a per capita basis, total
tax receipts in Scotland have been higher than in the UK in each of the past five years.
Table 1.2: Total Tax Receipts Per Capita: Scotland and UK (2007-08 to 2011-12)
2007-08 2008-09 2009-10 2010-11 2011-12
Scotland £10,000 £10,600 £9,100 £9,900 £10,700
UK £8,900 £8,600 £8,200 £8,800 £9,000
Source: GERS 2011/12 and Scottish Government analysis
Scotland’s Overall Fiscal Balance
1.10 Over the past five years Scotland and the UK have both run a fiscal deficit (a shortfall
between government revenue and expenditure). This is not unusual. Between 1980 and
2014 there has been only one year when the 35 countries in the OECD as a whole have run
an overall fiscal surplus.
Table 1.3: Net Fiscal Balance: Scotland and UK (2007-08 to 2011-12) % GDP
2007-08 2008-09 2009-10 2010-11 2011-12
Scotland -2.9% -2.6% -10.7% -8.1% -5.0%
UK -2.6% -6.9% -11.2% -9.5% -7.9%
Source: GERS 2011/12
1.11 Scotland’s estimated fiscal deficit was smaller than the UK’s over the period 2007-08
and 2011-12 as a whole. When expressed in cash terms, this relatively stronger fiscal
position was equivalent to £12.6 billion over this period.
1.12 This means that over the past five years, holding everything else constant, Scotland
could have had higher spending, for example on infrastructure investment, and/or lower
taxation and still had a smaller estimated fiscal deficit than the UK.
1.13 North Sea revenues account for approximately 16% of Scottish tax receipts between
2007-08 and 2011-12, with onshore receipts accounting for the remaining 84%. Whilst North
Sea receipts represent an important revenue source in Scotland, between 2007-08 and
2011-12, they would have had to have been 29% lower than outturn receipts, for Scotland’s
fiscal deficit to be larger than the UK’s.
4
Scotland’s Share of UK Public Sector Net Debt
1.14 UK public sector net borrowing is not incurred for any one country or region in the UK.
Therefore, there are no specific outturn figures for Scotland’s share of UK public sector debt
(i.e. the cumulative stock of public sector net borrowing). Chapter 4 provides two methods of
estimating Scotland’s notional share of UK public sector net debt, a per capita share and a
share based on Scotland’s historic fiscal position.
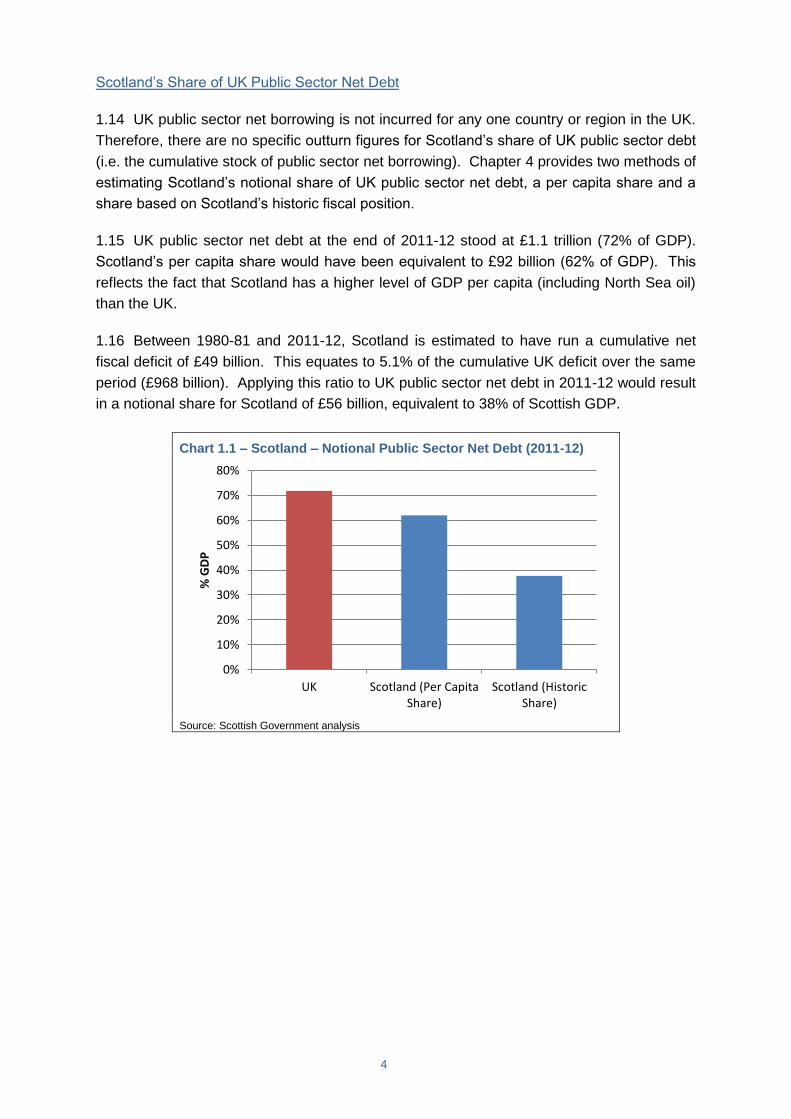
1.15 UK public sector net debt at the end of 2011-12 stood at £1.1 trillion (72% of GDP).
Scotland’s per capita share would have been equivalent to £92 billion (62% of GDP). This
reflects the fact that Scotland has a higher level of GDP per capita (including North Sea oil)
than the UK.
1.16 Between 1980-81 and 2011-12, Scotland is estimated to have run a cumulative net
fiscal deficit of £49 billion. This equates to 5.1% of the cumulative UK deficit over the same
period (£968 billion). Applying this ratio to UK public sector net debt in 2011-12 would result
in a notional share for Scotland of £56 billion, equivalent to 38% of Scottish GDP.
Chart 1.1 – Scotland – Notional Public Sector Net Debt (2011-12)
Source: Scottish Government analysis
0%
10%
20%
30%
40%
50%
60%
70%
80%
UK Scotland (Per CapitaShare)
Scotland (HistoricShare)
% G
DP
5
2. Public Spending
2.1 This chapter analyses the overall level and composition of public spending in Scotland.
The analysis also places the level of public spending in Scotland in the context of other EU
countries. Specific focus is given to the aspects of public spending which are reserved to
the UK Government. This includes the social security system, defence and debt interest
payments.
Public Spending for Scotland
2.2 For 2011-12, the latest year for which detailed statistics are available, total public
spending for Scotland by all parts of the public sector (Scottish Government, UK
Government and local authorities) was estimated to be £64.5 billion. This includes all
spending undertaken by the UK Government on behalf of Scotland, including a share of UK
wide public spending such as defence and debt interest. The manner in which total public
spending is estimated for Scotland is discussed further in Box 2.1.
2.3 The Scottish Government and Scottish local authorities are responsible for allocating
over half (£38.6 billion) of estimated public spending undertaken for Scotland. The UK
Government is responsible for the remaining expenditure. Whilst responsibility for allocating
over half of public expenditure is devolved, responsibility for setting the overall budget for the
Scottish Government is largely reserved to the UK Government and is determined by the
Barnett Formula.
Box 2.1 – Quantifying Scottish Public Spending
This report uses data published in the annual Government Expenditure and Revenue
Scotland (GERS) report, and adopts the same approach to measuring Scottish public
spending.
When quantifying public spending for Scotland, all spending undertaken directly for Scottish
residents and businesses by every tier of government, including the UK Government, the
Scottish Government and Scottish Local Authorities is included.
This includes a share of UK wide public spending which cannot be easily identified as
benefiting any one specific part of the country. For example, Scotland is allocated a
population share of UK defence expenditure, on the basis that all areas of the UK benefit
equally from the provision of a national defence service. Likewise, Scotland is assigned a
population share of UK debt interest payments and the net cost of the UK Government’s
financial sector interventions in 2008.
The estimates therefore provide a complete picture of the public spending undertaken for
Scotland under the current fiscal framework.
6
2.4 The chart below details the key categories of public spending for Scotland and the split
between devolved and reserved spending. The key areas of public spending which are
reserved are aspects of welfare, including the social security system, defence and debt
interest payments. Further discussion of each of these areas is provided below.
Responsibility for the majority of other areas of public spending is devolved.
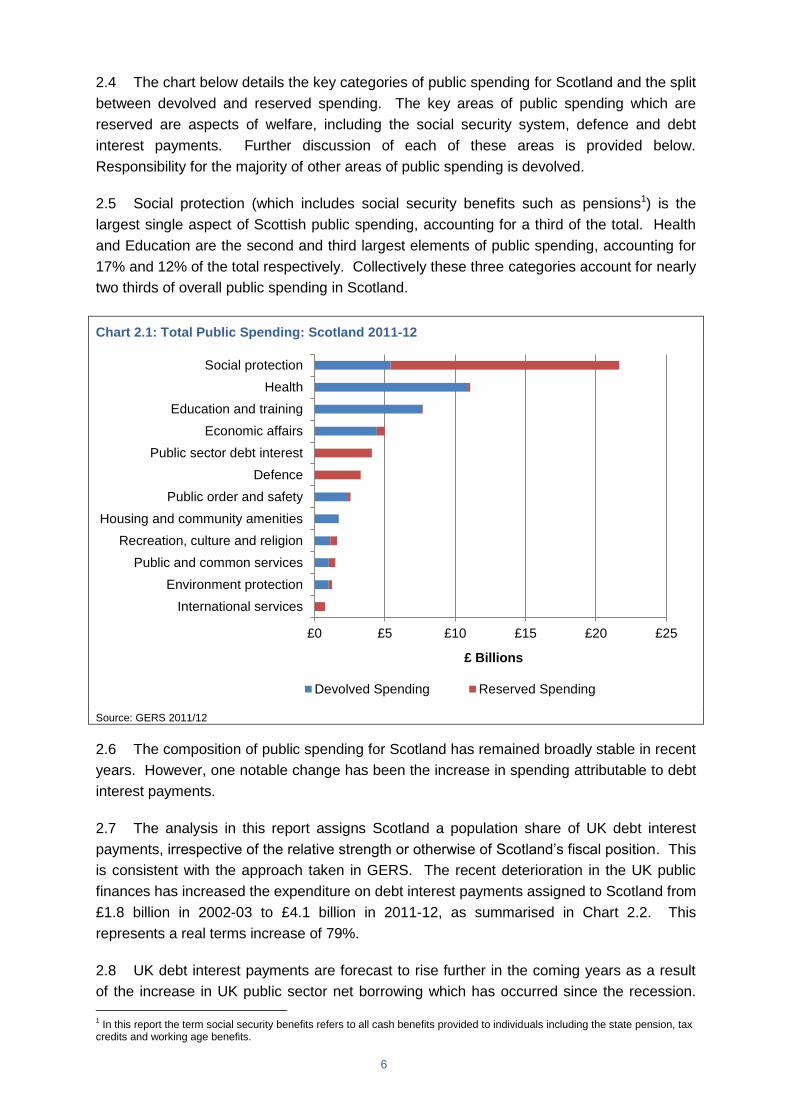
2.5 Social protection (which includes social security benefits such as pensions1) is the
largest single aspect of Scottish public spending, accounting for a third of the total. Health
and Education are the second and third largest elements of public spending, accounting for
17% and 12% of the total respectively. Collectively these three categories account for nearly
two thirds of overall public spending in Scotland.
Chart 2.1: Total Public Spending: Scotland 2011-12
Source: GERS 2011/12
2.6 The composition of public spending for Scotland has remained broadly stable in recent
years. However, one notable change has been the increase in spending attributable to debt
interest payments.
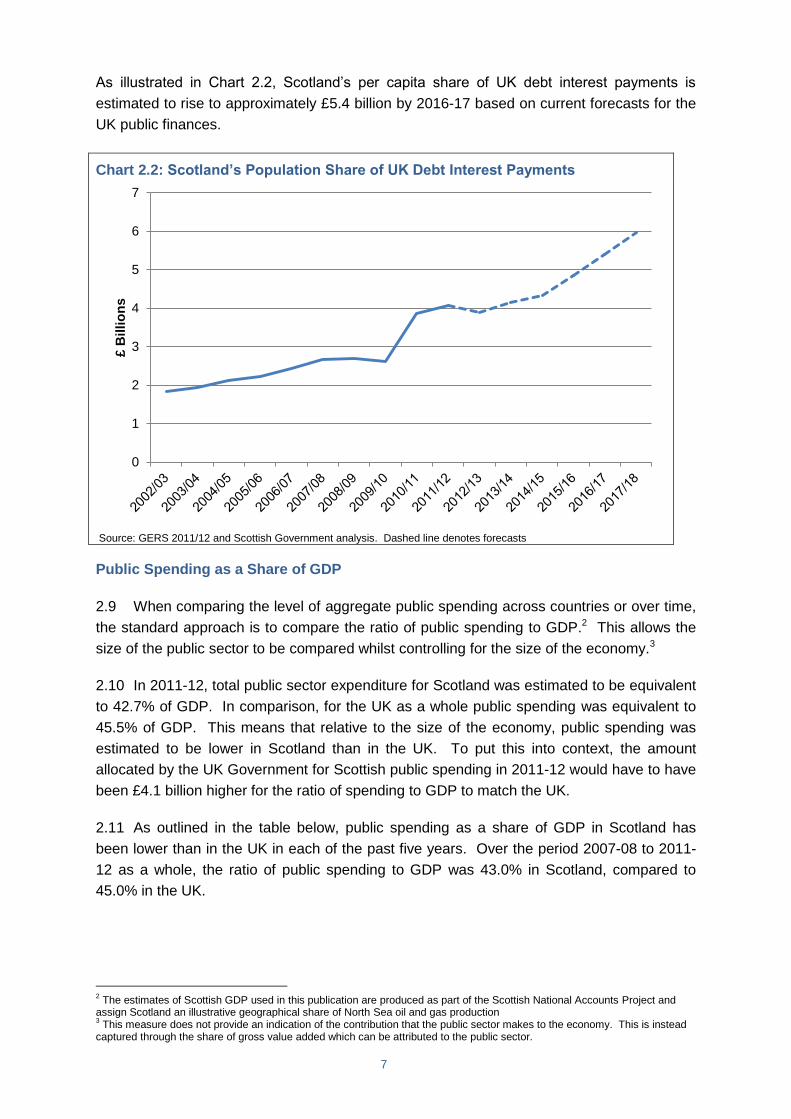
2.7 The analysis in this report assigns Scotland a population share of UK debt interest
payments, irrespective of the relative strength or otherwise of Scotland’s fiscal position. This
is consistent with the approach taken in GERS. The recent deterioration in the UK public
finances has increased the expenditure on debt interest payments assigned to Scotland from
£1.8 billion in 2002-03 to £4.1 billion in 2011-12, as summarised in Chart 2.2. This
represents a real terms increase of 79%.
2.8 UK debt interest payments are forecast to rise further in the coming years as a result
of the increase in UK public sector net borrowing which has occurred since the recession.
1 In this report the term social security benefits refers to all cash benefits provided to individuals including the state pension, tax
credits and working age benefits.
£0 £5 £10 £15 £20 £25
International services
Environment protection
Public and common services
Recreation, culture and religion
Housing and community amenities
Public order and safety
Defence
Public sector debt interest
Economic affairs
Education and training
Health
Social protection
£ Billions
Devolved Spending Reserved Spending
7
As illustrated in Chart 2.2, Scotland’s per capita share of UK debt interest payments is
estimated to rise to approximately £5.4 billion by 2016-17 based on current forecasts for the
UK public finances.
Chart 2.2: Scotland’s Population Share of UK Debt Interest Payments
Source: GERS 2011/12 and Scottish Government analysis. Dashed line denotes forecasts
Public Spending as a Share of GDP
2.9 When comparing the level of aggregate public spending across countries or over time,
the standard approach is to compare the ratio of public spending to GDP.2 This allows the
size of the public sector to be compared whilst controlling for the size of the economy.3
2.10 In 2011-12, total public sector expenditure for Scotland was estimated to be equivalent
to 42.7% of GDP. In comparison, for the UK as a whole public spending was equivalent to
45.5% of GDP. This means that relative to the size of the economy, public spending was
estimated to be lower in Scotland than in the UK. To put this into context, the amount
allocated by the UK Government for Scottish public spending in 2011-12 would have to have
been £4.1 billion higher for the ratio of spending to GDP to match the UK.
2.11 As outlined in the table below, public spending as a share of GDP in Scotland has
been lower than in the UK in each of the past five years. Over the period 2007-08 to 2011-
12 as a whole, the ratio of public spending to GDP was 43.0% in Scotland, compared to
45.0% in the UK.
2 The estimates of Scottish GDP used in this publication are produced as part of the Scottish National Accounts Project and
assign Scotland an illustrative geographical share of North Sea oil and gas production 3 This measure does not provide an indication of the contribution that the public sector makes to the economy. This is instead
captured through the share of gross value added which can be attributed to the public sector.
0
1
2
3
4
5
6
7
£ B
illio
ns
8
Table 2.1: Public Spending as a share of GDP: Scotland and UK (2007-08 to 2011-12)
2007-08 2008-09 2009-10 2010-11 2011-12
Scotland 40.1% 41.7% 46.0% 44.5% 42.7%
UK 40.7% 44.4% 47.4% 46.8% 45.5%
Source: GERS 2011-12 and Scottish Government analysis
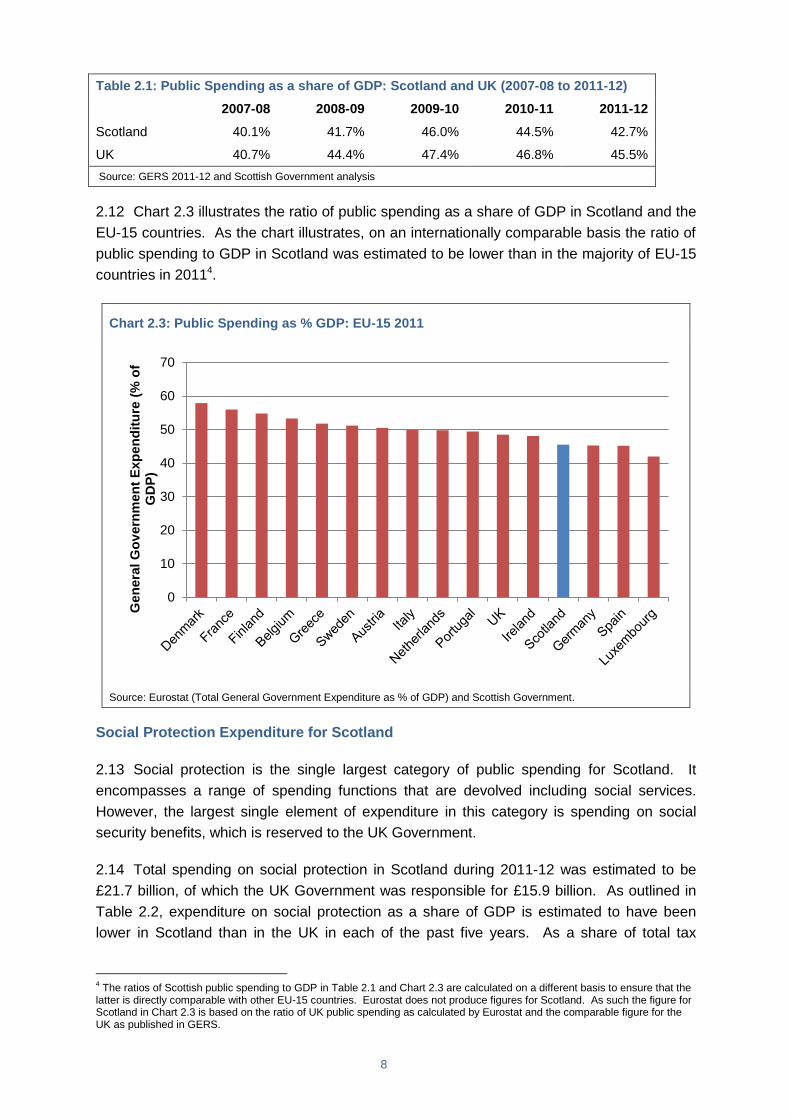
2.12 Chart 2.3 illustrates the ratio of public spending as a share of GDP in Scotland and the
EU-15 countries. As the chart illustrates, on an internationally comparable basis the ratio of
public spending to GDP in Scotland was estimated to be lower than in the majority of EU-15
countries in 20114.
Chart 2.3: Public Spending as % GDP: EU-15 2011
Source: Eurostat (Total General Government Expenditure as % of GDP) and Scottish Government.
Social Protection Expenditure for Scotland
2.13 Social protection is the single largest category of public spending for Scotland. It
encompasses a range of spending functions that are devolved including social services.
However, the largest single element of expenditure in this category is spending on social
security benefits, which is reserved to the UK Government.
2.14 Total spending on social protection in Scotland during 2011-12 was estimated to be
£21.7 billion, of which the UK Government was responsible for £15.9 billion. As outlined in
Table 2.2, expenditure on social protection as a share of GDP is estimated to have been
lower in Scotland than in the UK in each of the past five years. As a share of total tax
4 The ratios of Scottish public spending to GDP in Table 2.1 and Chart 2.3 are calculated on a different basis to ensure that the
latter is directly comparable with other EU-15 countries. Eurostat does not produce figures for Scotland. As such the figure for Scotland in Chart 2.3 is based on the ratio of UK public spending as calculated by Eurostat and the comparable figure for the UK as published in GERS.
0
10
20
30
40
50
60
70
Gen
era
l G
ov
ern
men
t E
xp
en
dit
ure
(%
of
GD
P)
9
revenue, spending on social protection in Scotland was also lower than the UK average in
each year between 2007-08 and 2011-12.
Table 2.2: Social Protection Spending as a Share of GDP (2007-08 to 2011-12)
2007-08 2008-09 2009-10 2010-11 2011-12
Scotland 12.4% 13.2% 15.0% 14.5% 14.4%
UK 13.2% 14.4% 15.9% 15.7% 15.9%
Source: GERS 2011/12 and Scottish Government analysis
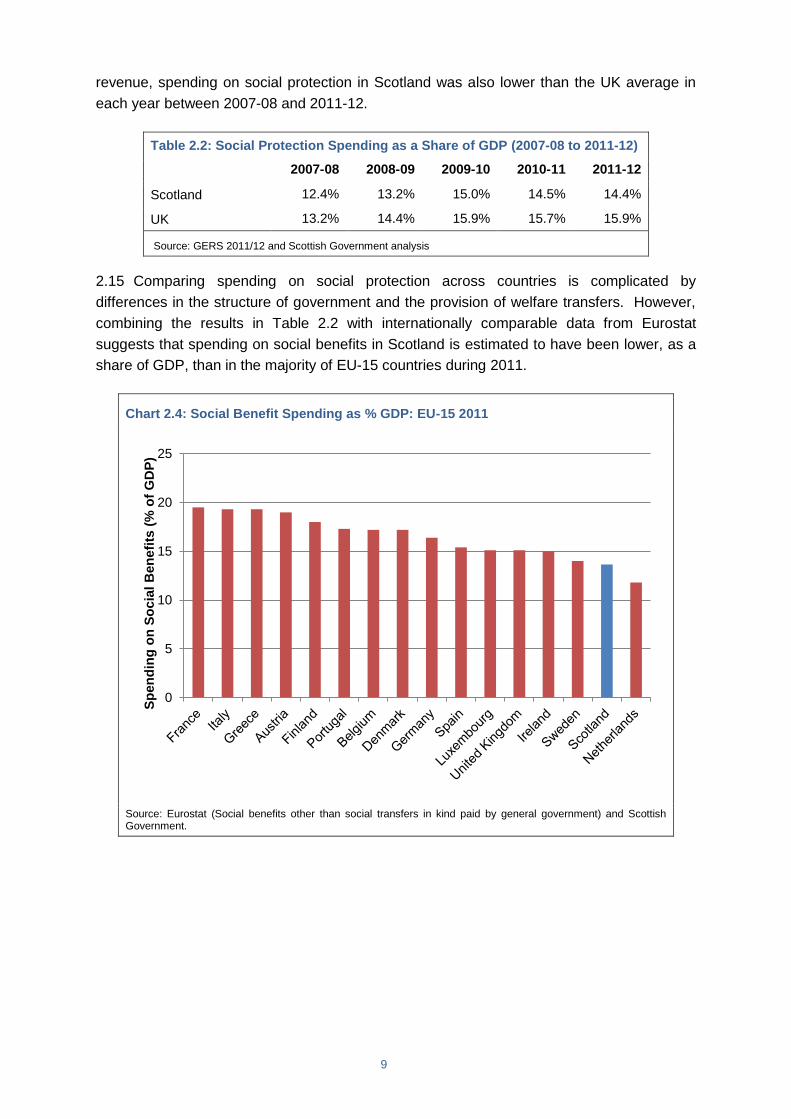
2.15 Comparing spending on social protection across countries is complicated by
differences in the structure of government and the provision of welfare transfers. However,
combining the results in Table 2.2 with internationally comparable data from Eurostat
suggests that spending on social benefits in Scotland is estimated to have been lower, as a
share of GDP, than in the majority of EU-15 countries during 2011.
Chart 2.4: Social Benefit Spending as % GDP: EU-15 2011
Source: Eurostat (Social benefits other than social transfers in kind paid by general government) and Scottish Government.
0
5
10
15
20
25
Sp
en
din
g o
n S
ocia
l B
en
efi
ts (
% o
f G
DP
)
10
Scotland’s share of UK Defence Expenditure
2.16 Defence is the second major aspect of Scottish public spending which is reserved to
the UK Government. GERS assigns Scotland a population share of UK wide expenditure on
defence on the basis that spending on UK defence facilities benefits all residents of the UK
equally, regardless of where the expenditure actually occurs. For consistency the same
approach is taken in this report.
2.17 Scotland’s population share of UK defence expenditure is equal to £3.3 billion in 2011-
12. This is higher than the estimated level of defence expenditure which occurs directly in
Scotland5. When measured as a share of GDP, it is also high by international standards.
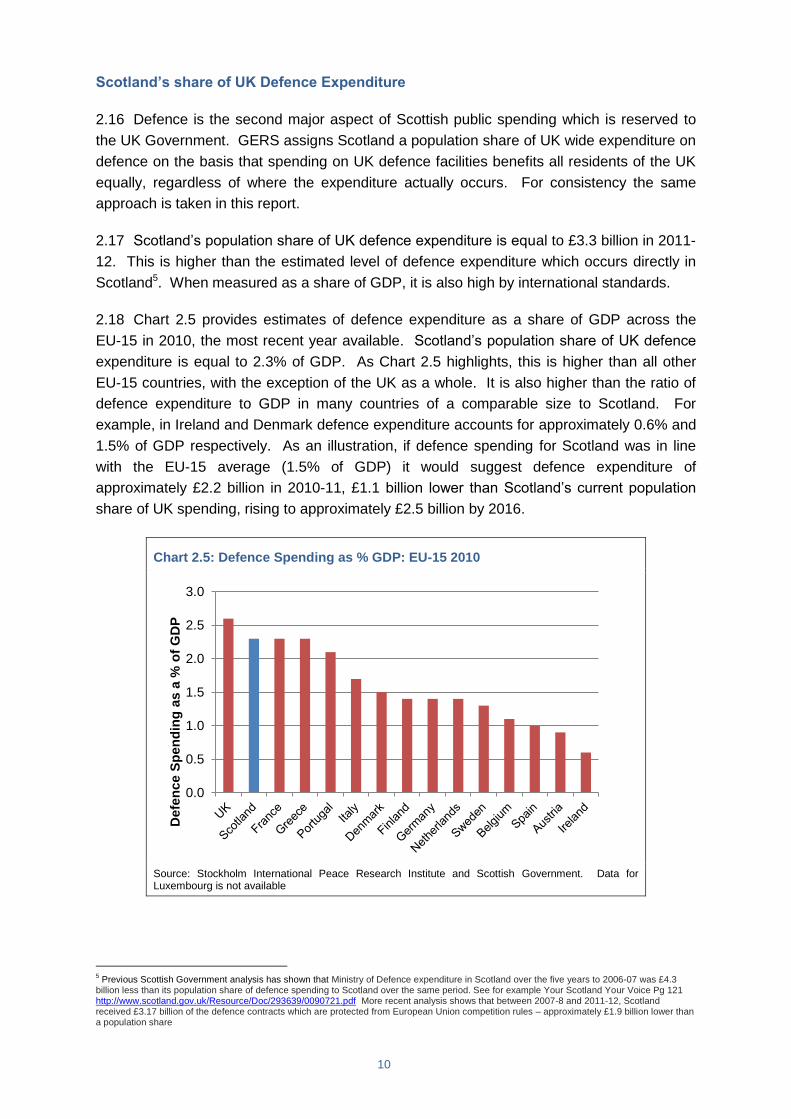
2.18 Chart 2.5 provides estimates of defence expenditure as a share of GDP across the
EU-15 in 2010, the most recent year available. Scotland’s population share of UK defence
expenditure is equal to 2.3% of GDP. As Chart 2.5 highlights, this is higher than all other
EU-15 countries, with the exception of the UK as a whole. It is also higher than the ratio of
defence expenditure to GDP in many countries of a comparable size to Scotland. For
example, in Ireland and Denmark defence expenditure accounts for approximately 0.6% and
1.5% of GDP respectively. As an illustration, if defence spending for Scotland was in line
with the EU-15 average (1.5% of GDP) it would suggest defence expenditure of
approximately £2.2 billion in 2010-11, £1.1 billion lower than Scotland’s current population
share of UK spending, rising to approximately £2.5 billion by 2016.
Chart 2.5: Defence Spending as % GDP: EU-15 2010
Source: Stockholm International Peace Research Institute and Scottish Government. Data for Luxembourg is not available
5 Previous Scottish Government analysis has shown that Ministry of Defence expenditure in Scotland over the five years to 2006-07 was £4.3
billion less than its population share of defence spending to Scotland over the same period. See for example Your Scotland Your Voice Pg 121 http://www.scotland.gov.uk/Resource/Doc/293639/0090721.pdf More recent analysis shows that between 2007-8 and 2011-12, Scotland received £3.17 billion of the defence contracts which are protected from European Union competition rules – approximately £1.9 billion lower than a population share
0.0
0.5
1.0
1.5
2.0
2.5
3.0
Defe
nce S
pen
din
g a
s a
% o
f G
DP
11
Conclusion
2.19 Total public spending for Scotland was £64.5 billion in 2011-12. This includes all
spending by the Scottish Government, Scottish Local Authorities and the UK Government
undertaken on behalf of Scotland, including a share of spending on public services for the
benefit of the UK as a whole, such as defence.
2.20 As a share of GDP, public spending is estimated to be lower in Scotland than in the
UK as a whole, and in many other EU-15 countries. Social protection, which includes
spending on the benefit system, is also lower, as a share of GDP, in Scotland than in the
UK, and most other EU-15 countries.
2.21 The analysis in this chapter assigns Scotland a population share of UK spending on
defence. The UK has the largest defence budget in the EU-15, as a share of GDP.
Scotland’s population share is equivalent to £3.3 billion. If defence spending in Scotland
was aligned to the EU-15 average, it would be approximately £2.2 billion.
12
3. Scottish Tax Revenue
3.1 This chapter assesses the composition of tax receipts in Scotland. Particular focus is
given to the contribution made by tax receipts from oil and gas production. As outlined in
Chapter 1, the analysis assigns Scotland an estimated geographical share of North Sea
revenues.
Scottish Tax Receipts
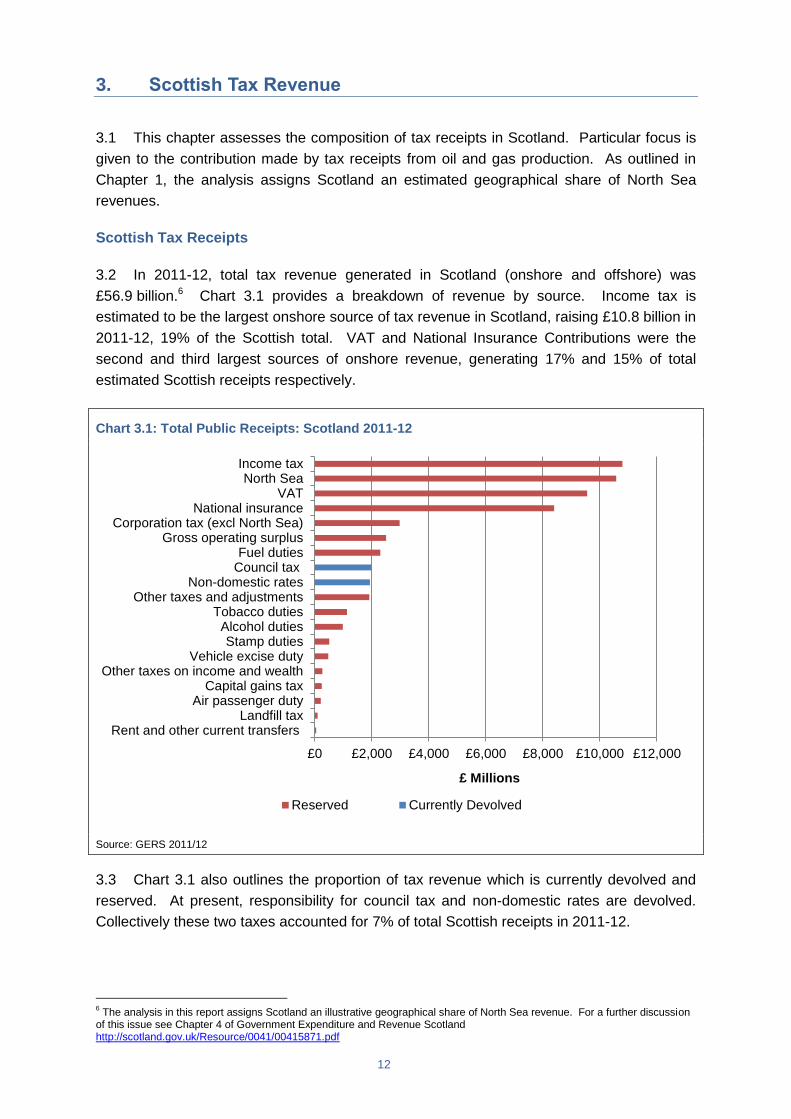
3.2 In 2011-12, total tax revenue generated in Scotland (onshore and offshore) was
£56.9 billion.6 Chart 3.1 provides a breakdown of revenue by source. Income tax is
estimated to be the largest onshore source of tax revenue in Scotland, raising £10.8 billion in
2011-12, 19% of the Scottish total. VAT and National Insurance Contributions were the
second and third largest sources of onshore revenue, generating 17% and 15% of total
estimated Scottish receipts respectively.
Chart 3.1: Total Public Receipts: Scotland 2011-12
Source: GERS 2011/12
3.3 Chart 3.1 also outlines the proportion of tax revenue which is currently devolved and
reserved. At present, responsibility for council tax and non-domestic rates are devolved.
Collectively these two taxes accounted for 7% of total Scottish receipts in 2011-12.
6 The analysis in this report assigns Scotland an illustrative geographical share of North Sea revenue. For a further discussion
of this issue see Chapter 4 of Government Expenditure and Revenue Scotland http://scotland.gov.uk/Resource/0041/00415871.pdf
£0 £2,000 £4,000 £6,000 £8,000 £10,000 £12,000
Rent and other current transfersLandfill tax
Air passenger dutyCapital gains tax
Other taxes on income and wealthVehicle excise duty
Stamp dutiesAlcohol duties
Tobacco dutiesOther taxes and adjustments
Non-domestic ratesCouncil taxFuel duties
Gross operating surplusCorporation tax (excl North Sea)
National insuranceVAT
North SeaIncome tax
£ Millions
Reserved Currently Devolved
13
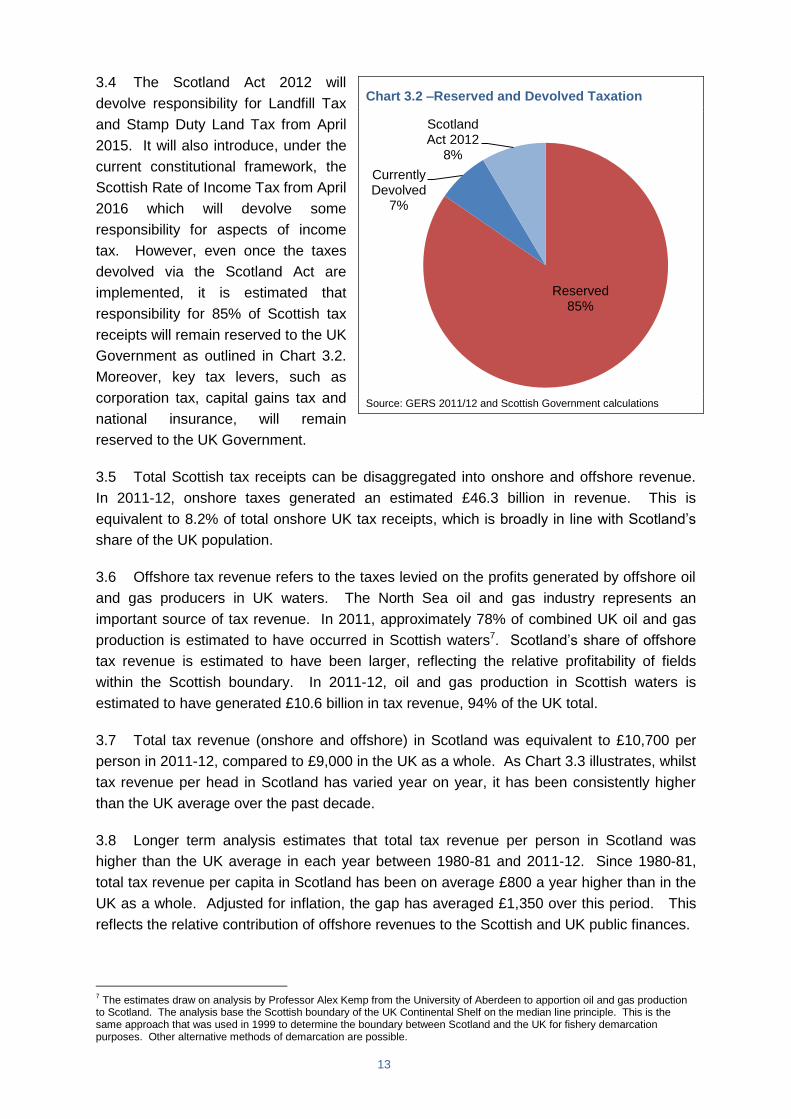
3.4 The Scotland Act 2012 will
devolve responsibility for Landfill Tax
and Stamp Duty Land Tax from April
2015. It will also introduce, under the
current constitutional framework, the
Scottish Rate of Income Tax from April
2016 which will devolve some
responsibility for aspects of income
tax. However, even once the taxes
devolved via the Scotland Act are
implemented, it is estimated that
responsibility for 85% of Scottish tax
receipts will remain reserved to the UK
Government as outlined in Chart 3.2.
Moreover, key tax levers, such as
corporation tax, capital gains tax and
national insurance, will remain
reserved to the UK Government.
3.5 Total Scottish tax receipts can be disaggregated into onshore and offshore revenue.
In 2011-12, onshore taxes generated an estimated £46.3 billion in revenue. This is
equivalent to 8.2% of total onshore UK tax receipts, which is broadly in line with Scotland’s
share of the UK population.
3.6 Offshore tax revenue refers to the taxes levied on the profits generated by offshore oil
and gas producers in UK waters. The North Sea oil and gas industry represents an
important source of tax revenue. In 2011, approximately 78% of combined UK oil and gas
production is estimated to have occurred in Scottish waters7. Scotland’s share of offshore
tax revenue is estimated to have been larger, reflecting the relative profitability of fields
within the Scottish boundary. In 2011-12, oil and gas production in Scottish waters is
estimated to have generated £10.6 billion in tax revenue, 94% of the UK total.
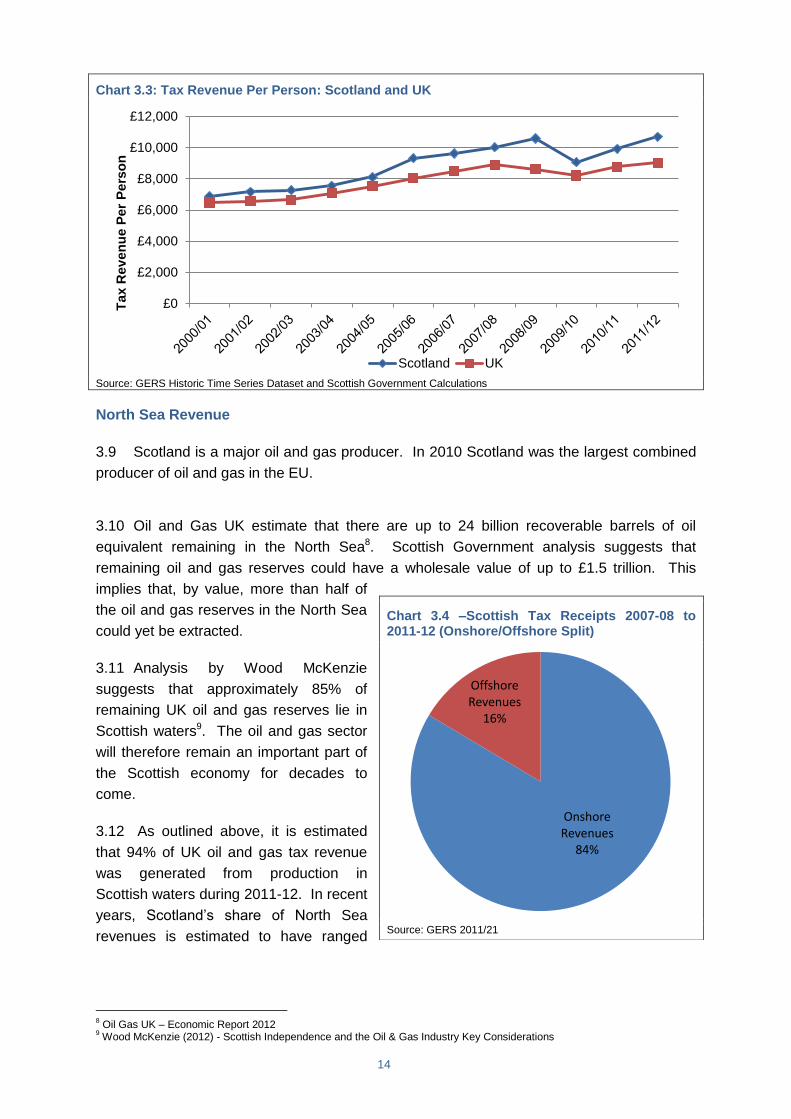
3.7 Total tax revenue (onshore and offshore) in Scotland was equivalent to £10,700 per
person in 2011-12, compared to £9,000 in the UK as a whole. As Chart 3.3 illustrates, whilst
tax revenue per head in Scotland has varied year on year, it has been consistently higher
than the UK average over the past decade.
3.8 Longer term analysis estimates that total tax revenue per person in Scotland was
higher than the UK average in each year between 1980-81 and 2011-12. Since 1980-81,
total tax revenue per capita in Scotland has been on average £800 a year higher than in the
UK as a whole. Adjusted for inflation, the gap has averaged £1,350 over this period. This
reflects the relative contribution of offshore revenues to the Scottish and UK public finances.
7 The estimates draw on analysis by Professor Alex Kemp from the University of Aberdeen to apportion oil and gas production
to Scotland. The analysis base the Scottish boundary of the UK Continental Shelf on the median line principle. This is the same approach that was used in 1999 to determine the boundary between Scotland and the UK for fishery demarcation purposes. Other alternative methods of demarcation are possible.
Chart 3.2 –Reserved and Devolved Taxation
Source: GERS 2011/12 and Scottish Government calculations
Reserved 85%
Currently Devolved
7%
Scotland Act 2012
8%
14
Chart 3.3: Tax Revenue Per Person: Scotland and UK
Source: GERS Historic Time Series Dataset and Scottish Government Calculations
North Sea Revenue
3.9 Scotland is a major oil and gas producer. In 2010 Scotland was the largest combined
producer of oil and gas in the EU.
3.10 Oil and Gas UK estimate that there are up to 24 billion recoverable barrels of oil
equivalent remaining in the North Sea8. Scottish Government analysis suggests that
remaining oil and gas reserves could have a wholesale value of up to £1.5 trillion. This
implies that, by value, more than half of
the oil and gas reserves in the North Sea
could yet be extracted.
3.11 Analysis by Wood McKenzie
suggests that approximately 85% of
remaining UK oil and gas reserves lie in
Scottish waters9. The oil and gas sector
will therefore remain an important part of
the Scottish economy for decades to
come.
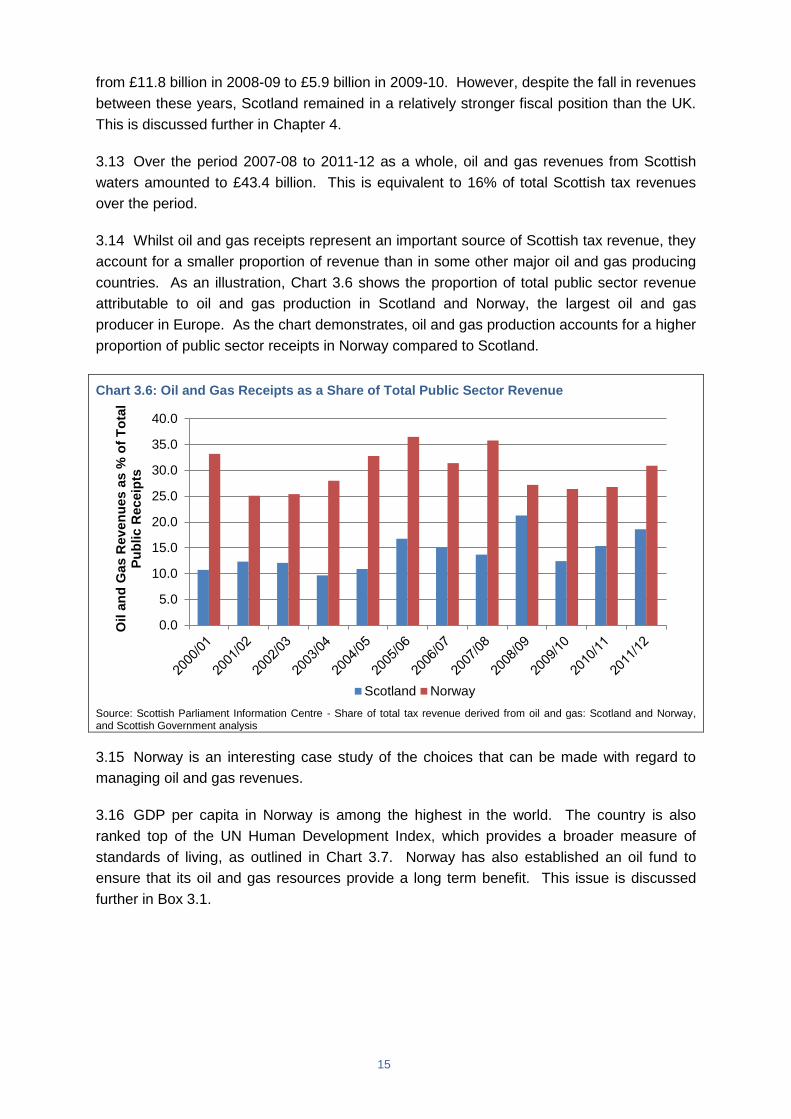
3.12 As outlined above, it is estimated
that 94% of UK oil and gas tax revenue
was generated from production in
Scottish waters during 2011-12. In recent
years, Scotland’s share of North Sea
revenues is estimated to have ranged
8 Oil Gas UK – Economic Report 2012
9 Wood McKenzie (2012) - Scottish Independence and the Oil & Gas Industry Key Considerations
£0
£2,000
£4,000
£6,000
£8,000
£10,000
£12,000T
ax R
ev
en
ue P
er
Pers
on
Scotland UK
Chart 3.4 –Scottish Tax Receipts 2007-08 to 2011-12 (Onshore/Offshore Split)
Source: GERS 2011/21
Onshore Revenues
84%
Offshore Revenues
16%
15
from £11.8 billion in 2008-09 to £5.9 billion in 2009-10. However, despite the fall in revenues
between these years, Scotland remained in a relatively stronger fiscal position than the UK.
This is discussed further in Chapter 4.
3.13 Over the period 2007-08 to 2011-12 as a whole, oil and gas revenues from Scottish
waters amounted to £43.4 billion. This is equivalent to 16% of total Scottish tax revenues
over the period.
3.14 Whilst oil and gas receipts represent an important source of Scottish tax revenue, they
account for a smaller proportion of revenue than in some other major oil and gas producing
countries. As an illustration, Chart 3.6 shows the proportion of total public sector revenue
attributable to oil and gas production in Scotland and Norway, the largest oil and gas
producer in Europe. As the chart demonstrates, oil and gas production accounts for a higher
proportion of public sector receipts in Norway compared to Scotland.
Chart 3.6: Oil and Gas Receipts as a Share of Total Public Sector Revenue
Source: Scottish Parliament Information Centre - Share of total tax revenue derived from oil and gas: Scotland and Norway, and Scottish Government analysis
3.15 Norway is an interesting case study of the choices that can be made with regard to
managing oil and gas revenues.
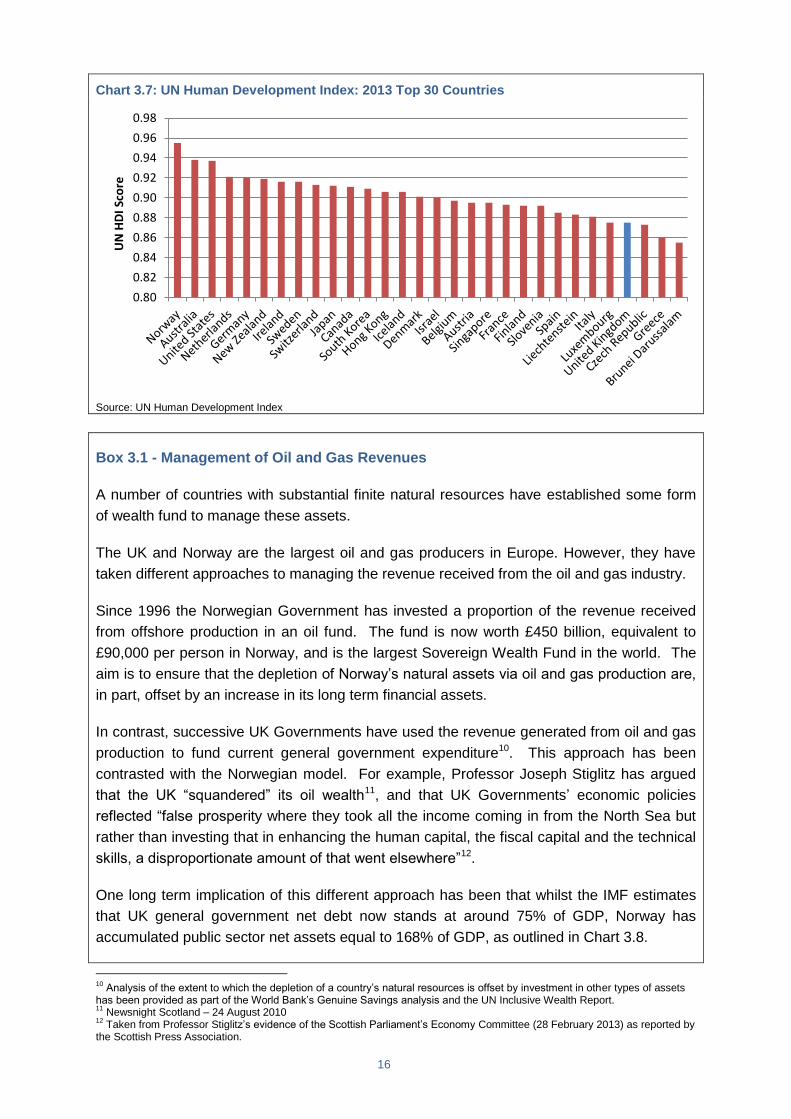
3.16 GDP per capita in Norway is among the highest in the world. The country is also
ranked top of the UN Human Development Index, which provides a broader measure of
standards of living, as outlined in Chart 3.7. Norway has also established an oil fund to
ensure that its oil and gas resources provide a long term benefit. This issue is discussed
further in Box 3.1.
0.0
5.0
10.0
15.0
20.0
25.0
30.0
35.0
40.0
Oil
an
d G
as R
ev
en
ues a
s %
of
To
tal
Pu
bli
c R
eceip
ts
Scotland Norway
16
Chart 3.7: UN Human Development Index: 2013 Top 30 Countries
Source: UN Human Development Index
Box 3.1 - Management of Oil and Gas Revenues
A number of countries with substantial finite natural resources have established some form
of wealth fund to manage these assets.
The UK and Norway are the largest oil and gas producers in Europe. However, they have
taken different approaches to managing the revenue received from the oil and gas industry.
Since 1996 the Norwegian Government has invested a proportion of the revenue received
from offshore production in an oil fund. The fund is now worth £450 billion, equivalent to
£90,000 per person in Norway, and is the largest Sovereign Wealth Fund in the world. The
aim is to ensure that the depletion of Norway’s natural assets via oil and gas production are,
in part, offset by an increase in its long term financial assets.
In contrast, successive UK Governments have used the revenue generated from oil and gas
production to fund current general government expenditure10. This approach has been
contrasted with the Norwegian model. For example, Professor Joseph Stiglitz has argued
that the UK “squandered” its oil wealth11, and that UK Governments’ economic policies
reflected “false prosperity where they took all the income coming in from the North Sea but
rather than investing that in enhancing the human capital, the fiscal capital and the technical
skills, a disproportionate amount of that went elsewhere”12.
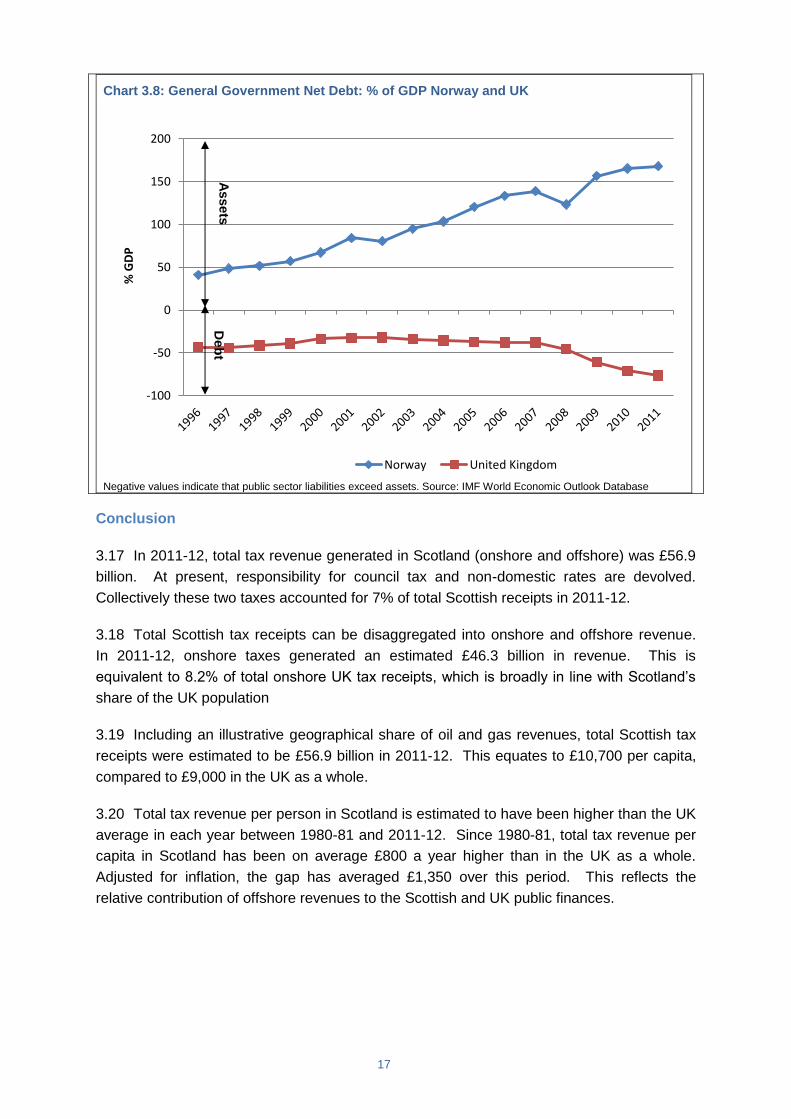
One long term implication of this different approach has been that whilst the IMF estimates
that UK general government net debt now stands at around 75% of GDP, Norway has
accumulated public sector net assets equal to 168% of GDP, as outlined in Chart 3.8.
10
Analysis of the extent to which the depletion of a country’s natural resources is offset by investment in other types of assets has been provided as part of the World Bank’s Genuine Savings analysis and the UN Inclusive Wealth Report. 11
Newsnight Scotland – 24 August 2010 12
Taken from Professor Stiglitz’s evidence of the Scottish Parliament’s Economy Committee (28 February 2013) as reported by the Scottish Press Association.
0.80
0.82
0.84
0.86
0.88
0.90
0.92
0.94
0.96
0.98U
N H
DI
Sco
re
17
Chart 3.8: General Government Net Debt: % of GDP Norway and UK
Negative values indicate that public sector liabilities exceed assets. Source: IMF World Economic Outlook Database
Conclusion
3.17 In 2011-12, total tax revenue generated in Scotland (onshore and offshore) was £56.9
billion. At present, responsibility for council tax and non-domestic rates are devolved.
Collectively these two taxes accounted for 7% of total Scottish receipts in 2011-12.
3.18 Total Scottish tax receipts can be disaggregated into onshore and offshore revenue.
In 2011-12, onshore taxes generated an estimated £46.3 billion in revenue. This is
equivalent to 8.2% of total onshore UK tax receipts, which is broadly in line with Scotland’s
share of the UK population
3.19 Including an illustrative geographical share of oil and gas revenues, total Scottish tax
receipts were estimated to be £56.9 billion in 2011-12. This equates to £10,700 per capita,
compared to £9,000 in the UK as a whole.
3.20 Total tax revenue per person in Scotland is estimated to have been higher than the UK
average in each year between 1980-81 and 2011-12. Since 1980-81, total tax revenue per
capita in Scotland has been on average £800 a year higher than in the UK as a whole.
Adjusted for inflation, the gap has averaged £1,350 over this period. This reflects the
relative contribution of offshore revenues to the Scottish and UK public finances.
-100
-50
0
50
100
150
200%
GD
P
Norway United Kingdom
As
se
tsD
eb
t
18
4. Overall Fiscal Position and Public Sector Debt
4.1 This chapter assesses Scotland’s overall fiscal position. The focus of the chapter is on
Scotland’s estimated net fiscal balance (the difference between tax revenue and government
expenditure) and Scotland’s notional share of UK public sector net debt.
Assessing the Sustainability of the Public Finances
4.2 There are two primary indicators of the sustainability of a country’s public finances, the
annual budget balance and the overall stock of public sector debt.
4.3 The budget balance measures the difference between public spending and tax
revenue in a given year. It therefore determines the government’s annual borrowing
requirement. The stock of public sector debt is the cumulative value of all outstanding debts
owed by the government. It is also a factor in determining the amount that a government
has to pay each year in interest payments. Both indicators are generally measured as a
share of GDP to provide an indication of the scale of debt or deficit relative to the size of the
economy.
4.4 It is possible for a government to run an annual budget deficit (a shortfall between
income and expenditure) in a manner which is sustainable. This is because if the economy
is growing quicker than the rate of debt accumulation, the debt to GDP ratio will still fall. As
such, the burden of the debt will be reduced, relative to the country’s ability to service it.
4.5 The sustainability of a country’s public sector debt therefore depends on the rate at
which the stock of debt is increasing relative to the growth of the economy. If debt is stable
or falling as a share of GDP it is generally sustainable. However, if debt is increasing as a
share of GDP this is unsustainable in the long run.
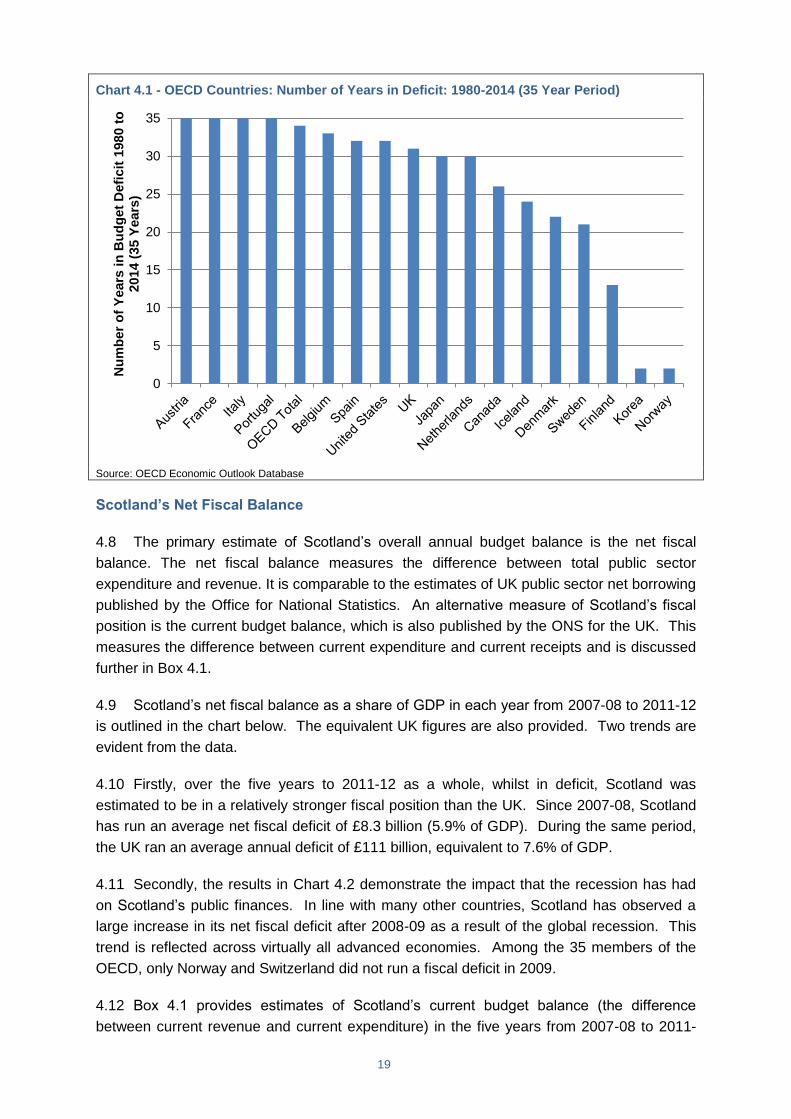
4.6 The prevalence for countries to run net fiscal deficits is reflected in the public finance
data collected by the OECD. The OECD provides estimates of the annual budget balances
for seventeen of its members for each year between 1980 and 2014. This shows that a
number of countries, including France and Austria, are estimated to have run a fiscal deficit
in every year during this period. Likewise, the USA and UK have only run budget surpluses
on three and four occasions respectively during this period. South Korea and Norway were
in deficit for the fewest number of years. In the case of Norway this reflects, in part, their
effective use of the tax revenues received from oil and gas production.
4.7 Looking at the aggregate public finances of all OECD countries shows that over the 35
year period between 1980 and 2014 there has been only one year when the group as a
whole has not run an overall budget deficit.
19
Chart 4.1 - OECD Countries: Number of Years in Deficit: 1980-2014 (35 Year Period)
Source: OECD Economic Outlook Database
Scotland’s Net Fiscal Balance
4.8 The primary estimate of Scotland’s overall annual budget balance is the net fiscal
balance. The net fiscal balance measures the difference between total public sector
expenditure and revenue. It is comparable to the estimates of UK public sector net borrowing
published by the Office for National Statistics. An alternative measure of Scotland’s fiscal
position is the current budget balance, which is also published by the ONS for the UK. This
measures the difference between current expenditure and current receipts and is discussed
further in Box 4.1.
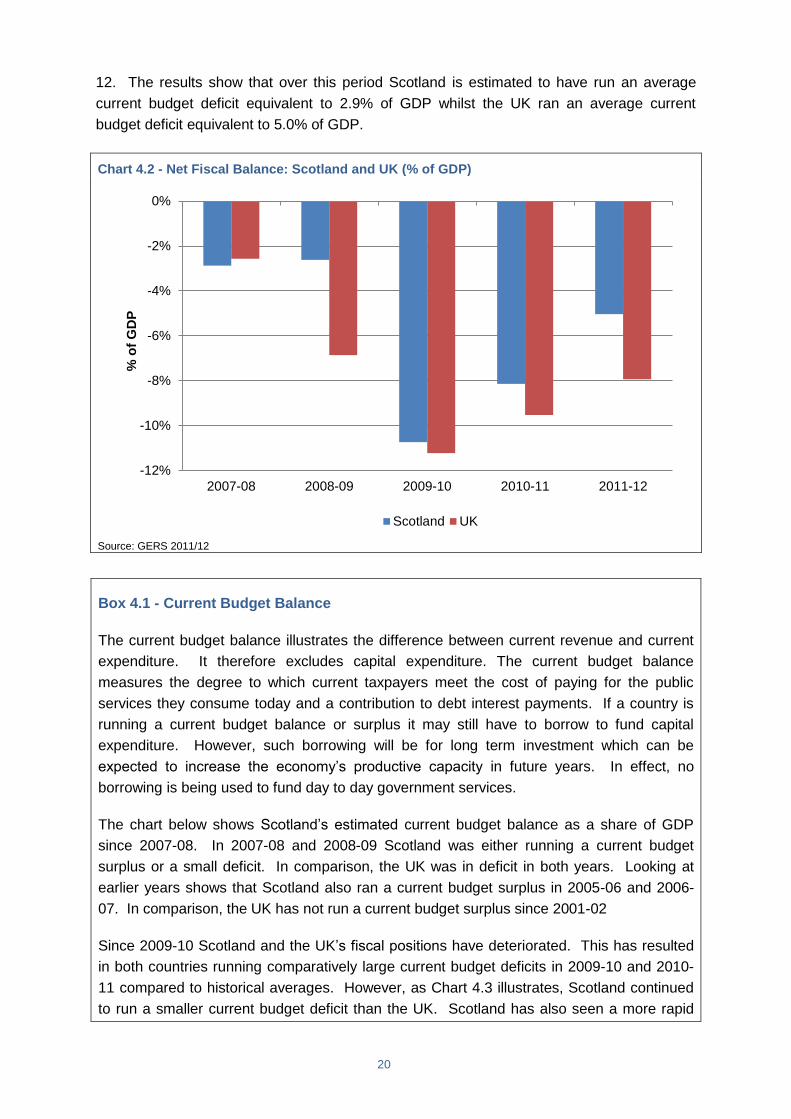
4.9 Scotland’s net fiscal balance as a share of GDP in each year from 2007-08 to 2011-12
is outlined in the chart below. The equivalent UK figures are also provided. Two trends are
evident from the data.
4.10 Firstly, over the five years to 2011-12 as a whole, whilst in deficit, Scotland was
estimated to be in a relatively stronger fiscal position than the UK. Since 2007-08, Scotland
has run an average net fiscal deficit of £8.3 billion (5.9% of GDP). During the same period,
the UK ran an average annual deficit of £111 billion, equivalent to 7.6% of GDP.
4.11 Secondly, the results in Chart 4.2 demonstrate the impact that the recession has had
on Scotland’s public finances. In line with many other countries, Scotland has observed a
large increase in its net fiscal deficit after 2008-09 as a result of the global recession. This
trend is reflected across virtually all advanced economies. Among the 35 members of the
OECD, only Norway and Switzerland did not run a fiscal deficit in 2009.
4.12 Box 4.1 provides estimates of Scotland’s current budget balance (the difference
between current revenue and current expenditure) in the five years from 2007-08 to 2011-
0
5
10
15
20
25
30
35N
um
ber
of
Years
in
Bu
dg
et
Defi
cit
1980 t
o
2014 (
35 Y
ears
)
20
12. The results show that over this period Scotland is estimated to have run an average
current budget deficit equivalent to 2.9% of GDP whilst the UK ran an average current
budget deficit equivalent to 5.0% of GDP.
Chart 4.2 - Net Fiscal Balance: Scotland and UK (% of GDP)
Source: GERS 2011/12
Box 4.1 - Current Budget Balance
The current budget balance illustrates the difference between current revenue and current
expenditure. It therefore excludes capital expenditure. The current budget balance
measures the degree to which current taxpayers meet the cost of paying for the public
services they consume today and a contribution to debt interest payments. If a country is
running a current budget balance or surplus it may still have to borrow to fund capital
expenditure. However, such borrowing will be for long term investment which can be
expected to increase the economy’s productive capacity in future years. In effect, no
borrowing is being used to fund day to day government services.
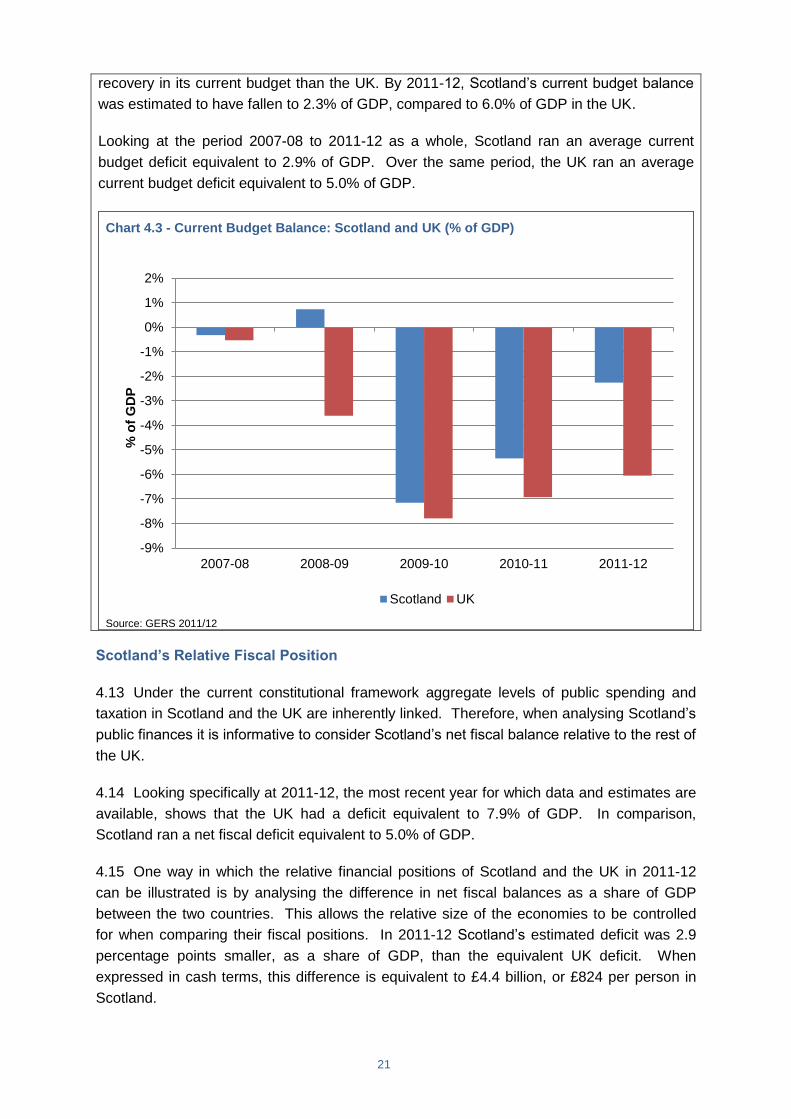
The chart below shows Scotland’s estimated current budget balance as a share of GDP
since 2007-08. In 2007-08 and 2008-09 Scotland was either running a current budget
surplus or a small deficit. In comparison, the UK was in deficit in both years. Looking at
earlier years shows that Scotland also ran a current budget surplus in 2005-06 and 2006-
07. In comparison, the UK has not run a current budget surplus since 2001-02
Since 2009-10 Scotland and the UK’s fiscal positions have deteriorated. This has resulted
in both countries running comparatively large current budget deficits in 2009-10 and 2010-
11 compared to historical averages. However, as Chart 4.3 illustrates, Scotland continued
to run a smaller current budget deficit than the UK. Scotland has also seen a more rapid
-12%
-10%
-8%
-6%
-4%
-2%
0%
2007-08 2008-09 2009-10 2010-11 2011-12
% o
f G
DP
Scotland UK
21
recovery in its current budget than the UK. By 2011-12, Scotland’s current budget balance
was estimated to have fallen to 2.3% of GDP, compared to 6.0% of GDP in the UK.
Looking at the period 2007-08 to 2011-12 as a whole, Scotland ran an average current
budget deficit equivalent to 2.9% of GDP. Over the same period, the UK ran an average
current budget deficit equivalent to 5.0% of GDP.
Chart 4.3 - Current Budget Balance: Scotland and UK (% of GDP)
Source: GERS 2011/12
Scotland’s Relative Fiscal Position
4.13 Under the current constitutional framework aggregate levels of public spending and
taxation in Scotland and the UK are inherently linked. Therefore, when analysing Scotland’s
public finances it is informative to consider Scotland’s net fiscal balance relative to the rest of
the UK.
4.14 Looking specifically at 2011-12, the most recent year for which data and estimates are
available, shows that the UK had a deficit equivalent to 7.9% of GDP. In comparison,
Scotland ran a net fiscal deficit equivalent to 5.0% of GDP.
4.15 One way in which the relative financial positions of Scotland and the UK in 2011-12
can be illustrated is by analysing the difference in net fiscal balances as a share of GDP
between the two countries. This allows the relative size of the economies to be controlled
for when comparing their fiscal positions. In 2011-12 Scotland’s estimated deficit was 2.9
percentage points smaller, as a share of GDP, than the equivalent UK deficit. When
expressed in cash terms, this difference is equivalent to £4.4 billion, or £824 per person in
Scotland.
-9%
-8%
-7%
-6%
-5%
-4%
-3%
-2%
-1%
0%
1%
2%
2007-08 2008-09 2009-10 2010-11 2011-12
% o
f G
DP
Scotland UK
22
4.16 Extending this analysis over the past five years shows that Scotland has been in a
relatively stronger fiscal position than the UK over this period. When expressed in cash
terms, Scotland’s relatively stronger fiscal position over this period as a whole is equivalent
to £12.6 billion. This equates to £2,375 per person. This means that over the period 2007-
08 to 2011-12 as a whole, Scotland could have had higher spending, for example on
infrastructure investment, and/or lower taxation and still had a smaller estimated fiscal deficit
than the UK.
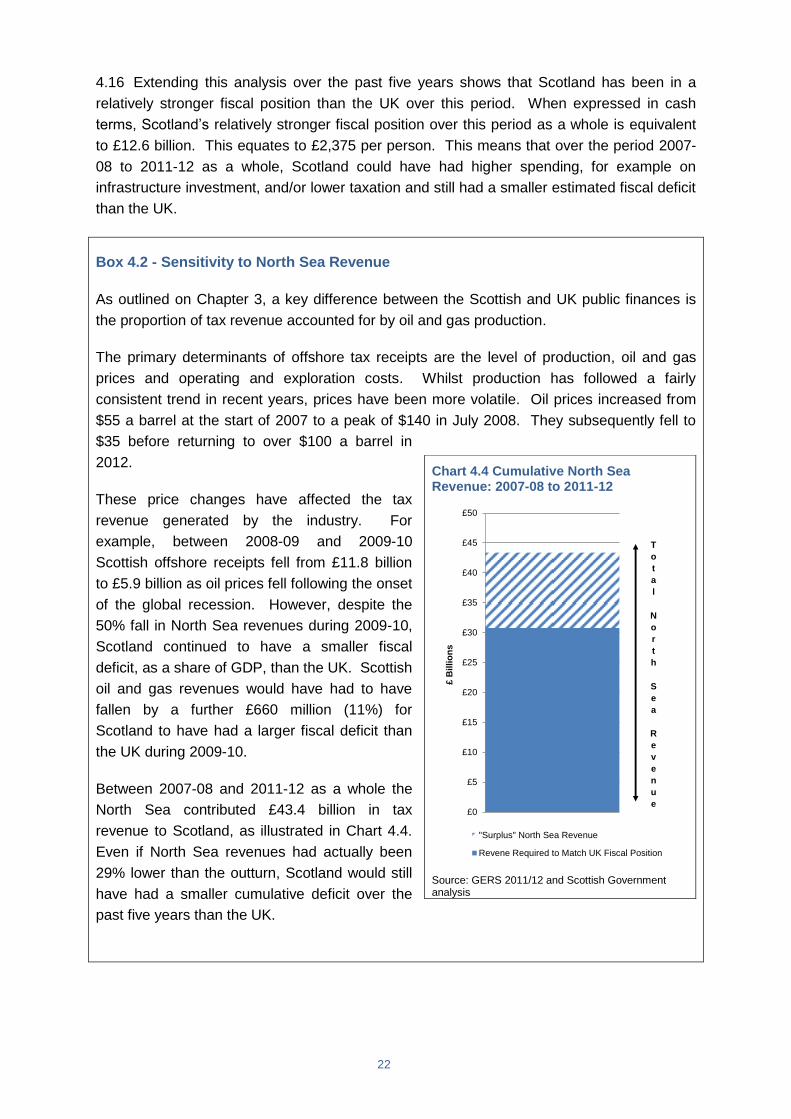
Box 4.2 - Sensitivity to North Sea Revenue
As outlined on Chapter 3, a key difference between the Scottish and UK public finances is
the proportion of tax revenue accounted for by oil and gas production.
The primary determinants of offshore tax receipts are the level of production, oil and gas
prices and operating and exploration costs. Whilst production has followed a fairly
consistent trend in recent years, prices have been more volatile. Oil prices increased from
$55 a barrel at the start of 2007 to a peak of $140 in July 2008. They subsequently fell to
$35 before returning to over $100 a barrel in
2012.
These price changes have affected the tax
revenue generated by the industry. For
example, between 2008-09 and 2009-10
Scottish offshore receipts fell from £11.8 billion
to £5.9 billion as oil prices fell following the onset
of the global recession. However, despite the
50% fall in North Sea revenues during 2009-10,
Scotland continued to have a smaller fiscal
deficit, as a share of GDP, than the UK. Scottish
oil and gas revenues would have had to have
fallen by a further £660 million (11%) for
Scotland to have had a larger fiscal deficit than
the UK during 2009-10.
Between 2007-08 and 2011-12 as a whole the
North Sea contributed £43.4 billion in tax
revenue to Scotland, as illustrated in Chart 4.4.
Even if North Sea revenues had actually been
29% lower than the outturn, Scotland would still
have had a smaller cumulative deficit over the
past five years than the UK.
Chart 4.4 Cumulative North Sea Revenue: 2007-08 to 2011-12
Source: GERS 2011/12 and Scottish Government analysis
£0
£5
£10
£15
£20
£25
£30
£35
£40
£45
£50
£ B
illi
on
s
"Surplus" North Sea Revenue
Revene Required to Match UK Fiscal Position
T
o
t
a
l
N
o
r
t
h
S
e
a
R
e
v
e
n
u
e
23
Public Sector Net Debt
4.17 When considering the sustainability of a country’s public finances, it is important to
consider the overall stock of debt, as well as the level of borrowing in a specific period.
4.18 Under the current fiscal framework, UK public sector net debt is incurred for the
country as a whole, and not directly for Scotland or any other part of the UK. As such, there
are no outturn figures for Scotland’s share of UK net debt. Two approaches which can be
used to allocate a notional share of UK net debt to Scotland are presented below.
Population Share
4.19 GERS allocates Scotland a per capita share of UK debt interest payments. The same
approach could therefore be used to allocate Scotland a share of the corresponding debt.
4.20 UK public sector net debt at the end of 2011-12 stood at £1.1 trillion. Scotland’s per
capita share would have been equivalent to £92 billion (62% of GDP). This would represent
a lower debt to GDP ratio than for the UK as a whole (72%), reflecting the fact that Scotland
has a higher level of GDP per capita (including North Sea oil) than the UK.
4.21 Scotland’s notional public sector net debt in 2011-12 would have to have been £15
billion higher than its per capita share for Scotland to have the same debt to GDP ratio as
the UK.
Historic Share
4.22 A country’s public sector net debt can be viewed as the sum of its historic annual
borrowing, minus any debt repayment. Therefore, an alternative way to calculate Scotland’s
notional share of UK public sector debt is to base it on Scotland’s historical fiscal position.
4.23 Information on aggregate Scottish public spending and tax receipts from 1980-81
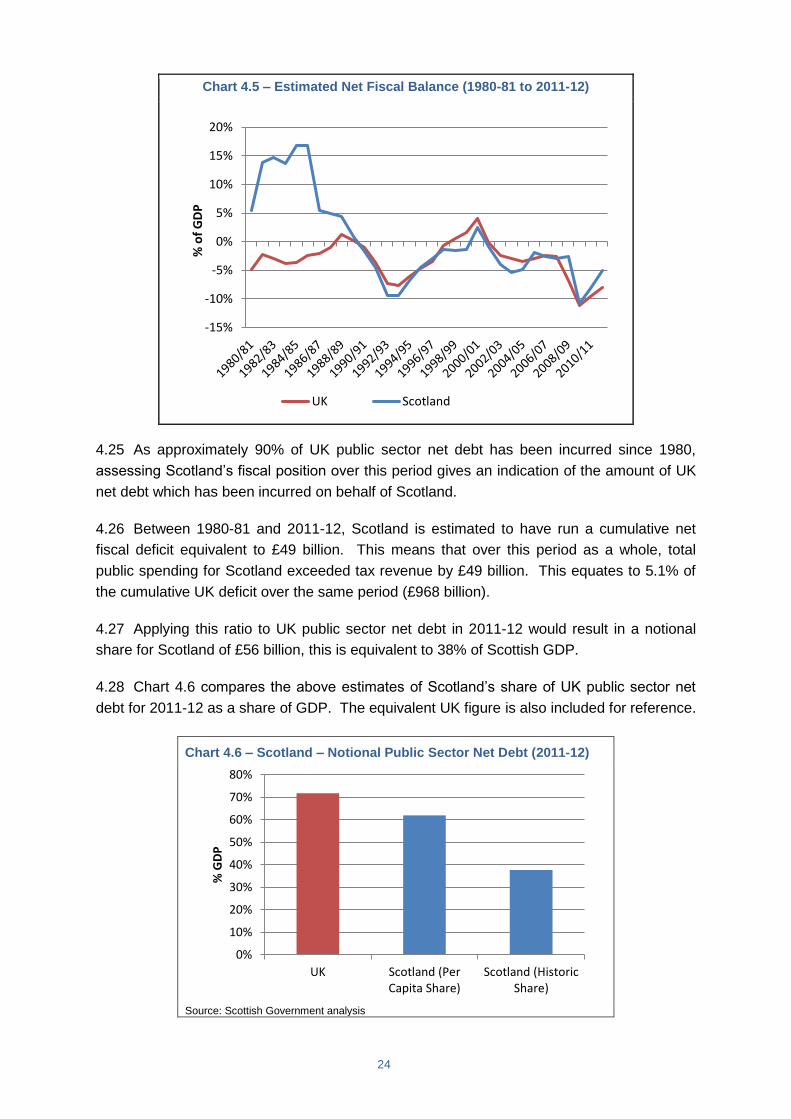
onwards on a consistent basis is published on the Scottish Government website13. Chart 4.5
provides estimates of Scotland’s overall net fiscal balance as a percentage of GDP from
1980-81 onwards using this data. The results show that during the early 1980s, Scotland
ran a substantial net fiscal surplus, driven by the significant growth in North Sea revenues.
Scotland's fiscal position weakened through the 1990s but since 2001-02 has been broadly
in line with that of the UK.
4.24 Over the period 1980-81 to 2011-12 as a whole, Scotland is estimated to have run an
average annual net fiscal surplus equivalent to 0.2% of GDP. The UK is estimated to have
run an average annual net fiscal deficit worth 3.2% of GDP.
13
The dataset is available from http://www.scotland.gov.uk/Topics/Statistics/Browse/Economy/GERS/RelatedAreas/LongRunGERS201011 The dataset is classified as experimental
24
Chart 4.5 – Estimated Net Fiscal Balance (1980-81 to 2011-12)
4.25 As approximately 90% of UK public sector net debt has been incurred since 1980,
assessing Scotland’s fiscal position over this period gives an indication of the amount of UK
net debt which has been incurred on behalf of Scotland.
4.26 Between 1980-81 and 2011-12, Scotland is estimated to have run a cumulative net
fiscal deficit equivalent to £49 billion. This means that over this period as a whole, total
public spending for Scotland exceeded tax revenue by £49 billion. This equates to 5.1% of
the cumulative UK deficit over the same period (£968 billion).
4.27 Applying this ratio to UK public sector net debt in 2011-12 would result in a notional
share for Scotland of £56 billion, this is equivalent to 38% of Scottish GDP.
4.28 Chart 4.6 compares the above estimates of Scotland’s share of UK public sector net
debt for 2011-12 as a share of GDP. The equivalent UK figure is also included for reference.
Chart 4.6 – Scotland – Notional Public Sector Net Debt (2011-12)
Source: Scottish Government analysis
-15%
-10%
-5%
0%
5%
10%
15%
20%
% o
f G
DP
UK Scotland
0%
10%
20%
30%
40%
50%
60%
70%
80%
UK Scotland (PerCapita Share)
Scotland (HistoricShare)
% G
DP
25
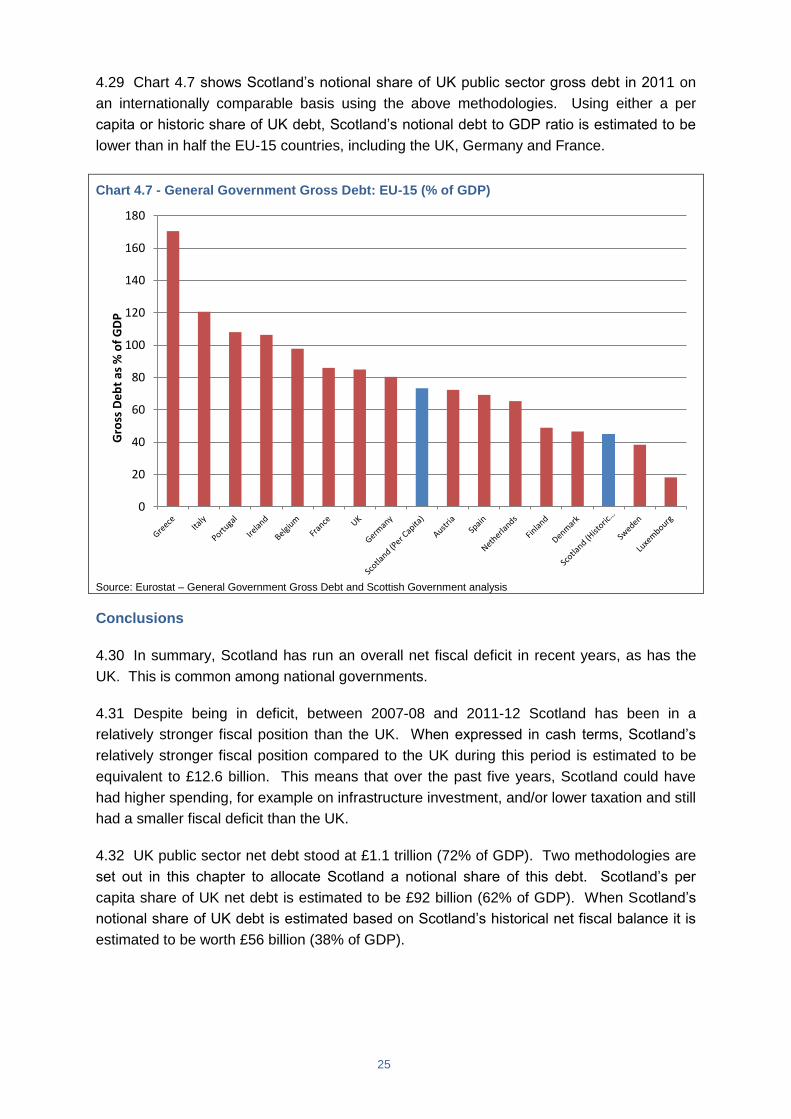
4.29 Chart 4.7 shows Scotland’s notional share of UK public sector gross debt in 2011 on
an internationally comparable basis using the above methodologies. Using either a per
capita or historic share of UK debt, Scotland’s notional debt to GDP ratio is estimated to be
lower than in half the EU-15 countries, including the UK, Germany and France.
Chart 4.7 - General Government Gross Debt: EU-15 (% of GDP)
Source: Eurostat – General Government Gross Debt and Scottish Government analysis
Conclusions
4.30 In summary, Scotland has run an overall net fiscal deficit in recent years, as has the
UK. This is common among national governments.
4.31 Despite being in deficit, between 2007-08 and 2011-12 Scotland has been in a
relatively stronger fiscal position than the UK. When expressed in cash terms, Scotland’s
relatively stronger fiscal position compared to the UK during this period is estimated to be
equivalent to £12.6 billion. This means that over the past five years, Scotland could have
had higher spending, for example on infrastructure investment, and/or lower taxation and still
had a smaller fiscal deficit than the UK.
4.32 UK public sector net debt stood at £1.1 trillion (72% of GDP). Two methodologies are
set out in this chapter to allocate Scotland a notional share of this debt. Scotland’s per
capita share of UK net debt is estimated to be £92 billion (62% of GDP). When Scotland’s
notional share of UK debt is estimated based on Scotland’s historical net fiscal balance it is
estimated to be worth £56 billion (38% of GDP).
0
20
40
60
80
100
120
140
160
180
Gro
ss D
eb
t as
% o
f G
DP
26
5. Conclusion
5.1 This report has provided a detailed assessment of Scotland’s public finances under the
current constitutional framework. The key points made in the report are summarised below.
Public spending for Scotland was estimated to be £64.5 billion in 2011-12, equivalent to
42.7% of GDP in Scotland. This is estimated to be lower than in both the UK as a whole
(45.5%), and the majority of EU-15 countries.
Social protection is the single largest category of public spending for Scotland, and
includes spending on social security benefits. Expenditure on social protection as a
share of GDP is estimated to have been lower in Scotland than in the UK in each of the
past five years
Total tax revenue in Scotland was estimated to be £56.9 billion in 2011-12. This
includes an illustrative geographical share of North Sea tax revenue, equivalent to
£10.6 billion. Total Scottish tax receipts in 2011-12 were equivalent to £10,700 per
person. This compares to a figure of £9,000 per person in the UK as a whole. On a per
capita basis, total tax receipts in Scotland have been higher than in the UK in each year
since 1980-81.
Scotland’s ran a net fiscal deficit worth 5% of GDP in 2011-12, lower than the equivalent
UK deficit of 7.9% of GDP. Over the five years to 2011-12, Scotland is estimated to
have run a smaller overall fiscal deficit than the UK. When expressed in cash terms, this
relatively stronger fiscal position was equivalent to £12.6 billion over this period.
North Sea revenues accounted for approximately 16% of Scottish tax receipts between
2007-08 and 2011-12, with onshore receipts accounting for the remaining 84%. North
Sea receipts represent an important revenue source in Scotland. However, between
2007-08 and 2011-12, they would have had to have been 29% lower than outturn
receipts, for Scotland’s fiscal deficit to be larger than the UK’s.
UK public sector net debt at the end of 2011-12 stood at £1.1 trillion (72% of GDP). Two
methods of assigning a notional share of this debt to Scotland are provided in this report.
Scotland’s per capita share would have been equivalent to £92 billion (62% of GDP).
When Scotland’s notional share of UK debt is estimated based on Scotland’s historical
net fiscal balance it is estimated to be worth £56 billion (38% of GDP).