Embed Size (px)
Citation preview
SCORECARD SURVEY Annual Business/Balanced Scorecard Survey - 2013
January 2014
Annual Business Scorecard Survey - 2013 Page 1
Table of Contents
Table of Contents ....................................................................................................................... 1
Executive Summary .................................................................................................................... 2
Introduction ................................................................................................................................ 3
Demographics ............................................................................................................................. 4
Question 1: How big is your company? (Number of people) ............................................. 4
Question 2: Which sector best represents your company? ............................................... 4
Question 3: Which role best represents your job? ............................................................ 5
Results ........................................................................................................................................ 6
Understanding and Business Commitment ............................................................................ 6
Question 4: What best describes your organisation's understanding of a business
scorecard? .......................................................................................................................... 6
Question 5: How would you characterise your organisation's commitment to a business
scorecard? .......................................................................................................................... 6
Areas and Frequency .............................................................................................................. 8
Question 6: What areas of activity do you use your scorecard for? .................................. 8
Question 7: How often do you use your scorecard as part of your reporting? ................. 8
Key Performance Indicators (KPIs) ......................................................................................... 9
Question 8: Do you have a formal set of Key Performance Indicators (KPIs)? .................. 9
Question 9: Approximately how many KPIs do you have on your scorecard? ................... 9
Software Used ...................................................................................................................... 10
Question 10: What type of software do you use to manage your scorecard? ................ 10
Overall Satisfaction ............................................................................................................... 11
Question 11: How would you rate your business scorecard? .......................................... 11
Question 12: Overall, how satisfied are you with the way you measure your
organisation? .................................................................................................................... 11
Final Comments ........................................................................................................................ 12
About Intrafocus ....................................................................................................................... 12
Annual Business Scorecard Survey - 2013 Page 2
Executive Summary Now is the time for businesses and organisations of all sizes to step up to the challenge of a
greater competitive marketplace and create effective strategies for growth.
Using a balanced or business scorecard will not provide the whole solution, but with it there
is clear evidence that strategic management will be much more effective.
This survey was designed to examine business scorecard usage within companies and
organisations to provide an insight into where and how they are used. The respondents
were told this was not a survey specific to balanced scorecard usage. All scorecard types
were considered valid.
However, it has become clear from the results and through working with many of the
respondents direct, that the methodology behind the ‘Balanced Scorecard’ as defined by
Kaplan and Norton and organisations like the Balanced Scorecard Institute has become a
driving force to align businesses and organisations to their strategies.
The following key points can be gleaned from this survey:
The vast majority of scorecards are still spreadsheet based.
The use of dedicated technology to manage strategy, objectives, metrics and initiatives
appears to be growing.
Businesses and organisations seem to prefer to utilise methodologies as defined by
Balanced Scorecard institutes to help orchestrate change in their organisations.
The number of businesses and organisations that see scorecard usage as a means to
make improvements (rather than record progress) is growing.
A large number of businesses and organisations believe that the scorecard process is an
instrument for strategic change.
Only a few businesses and organisations are ‘highly satisfied’ with their scorecard
approach, many believe there is much room for improvement.
The results of this survey and the same survey conducted last year suggest that the use of
scorecards and specifically Balanced Scorecards is seen as a positive thing. Although some
respondents were frustrated with the time taken to build a scorecard regime, they all
wanted the approach to succeed and saw enough benefits to persist.
Annual Business Scorecard Survey - 2013 Page 3
Introduction This survey is called the ‘Annual Business Scorecard Survey’. The title has significance as it
has captured information about the variety of scorecards used within business. It has not
concentrated on more traditional ‘Balanced Scorecards’ and has not restricted itself to an
investigation of Balanced Scorecard usage. The questions were purposefully open to
interpretation about the type of scorecard used.
However, as mentioned in the highlights, over the past year and during the three months the
survey was in place, it has come to our notice that our respondent group have tended to
favour a structured Balanced Scorecard approach.
The Balanced Scorecard provides both a methodology and a structure by which a scorecard
can be developed for a commercial or non-commercial organisation. To call it a scorecard in
this context is actually a misnomer. The Balanced Scorecard is a means to align all parts of a
business or organisation to its strategy. One of the foremost proponents of the Balanced
Scorecard, the Balanced Scorecard Institute say:
“The balanced scorecard is a strategic planning and management system that is used
extensively in business and industry, government, and non-profit organizations worldwide to
align business activities to the vision and strategy of the organization, improve internal and
external communications, and monitor organization performance against strategic goals”.
It is in this context, and due to the responses and comments to this survey, that future
surveys will concentrate on Balanced Scorecard usage only.
This survey was conducted between the months of October and December 2013. Survey
participants were determined through a pre-selection process to ensure a high quality
response. Contact was made through approximately 8,000 personalised e-mails, private
invitation from Intrafocus consultants and further invitation via affiliated consultants. The
objective was to survey senior executives, those people directly involved in formulating
company/organisation strategy and a selection of senior practitioners. It was also important
to ensure responses came from a variety of sectors.
In all a total of 154 responses were gained, all of which answered all of the questions. The
following analysis therefore represents the views of a medium sized pool of highly qualified
executives and practitioners and is therefore deemed as ‘representative’. The data has been
evaluated using frequency, cross-table and correlational analysis to provide additional
narrative.
Annual Business Scorecard Survey - 2013 Page 4
Demographics
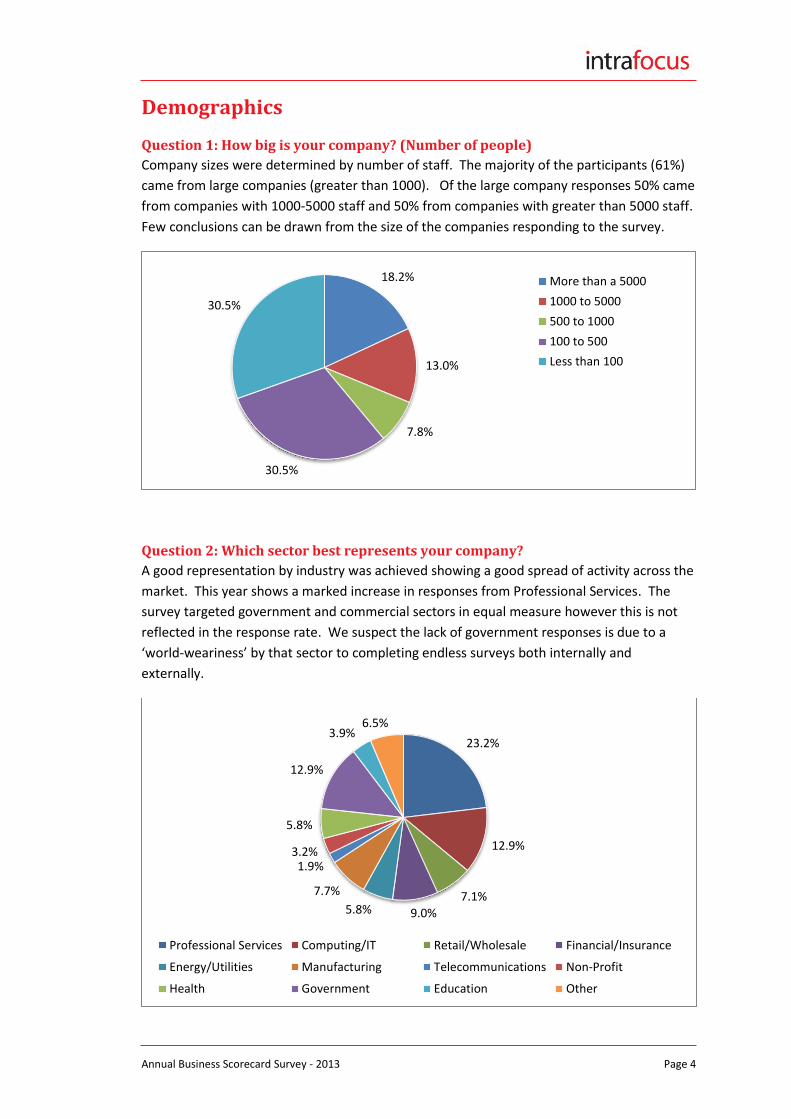
Question 1: How big is your company? (Number of people)
Company sizes were determined by number of staff. The majority of the participants (61%)
came from large companies (greater than 1000). Of the large company responses 50% came
from companies with 1000-5000 staff and 50% from companies with greater than 5000 staff.
Few conclusions can be drawn from the size of the companies responding to the survey.
Question 2: Which sector best represents your company?
A good representation by industry was achieved showing a good spread of activity across the
market. This year shows a marked increase in responses from Professional Services. The
survey targeted government and commercial sectors in equal measure however this is not
reflected in the response rate. We suspect the lack of government responses is due to a
‘world-weariness’ by that sector to completing endless surveys both internally and
externally.
18.2%
13.0%
7.8%
30.5%
30.5%
More than a 5000
1000 to 5000
500 to 1000
100 to 500
Less than 100
23.2%
12.9%
7.1%
9.0% 5.8%
7.7%
1.9% 3.2%
5.8%
12.9%
3.9% 6.5%
Professional Services Computing/IT Retail/Wholesale Financial/Insurance
Energy/Utilities Manufacturing Telecommunications Non-Profit
Health Government Education Other

Annual Business Scorecard Survey - 2013 Page 5
Question 3: Which role best represents your job?
The survey generally targeted Executive Management and Strategy Directors so not
surprisingly the majority of the responses have come from individuals within those roles.
However, the survey was open to anyone and so we can see responses from other roles that
were interested in the subject. The ‘Other’ category is very small indicating that the focus
for the survey participants was well judged.
Analyst Comment: In comparison to last year the number of people in a Strategy
Director/Manager role has grown significantly from 14.2% to 28.6% whereas the Executive
Management role has remained the same. This is most likely reflects better targeting on the
part of the survey producers. This is probably a good thing bearing in mind that the use of
business/balanced scorecards in the business environment tends to be an activity related to
these roles. It suggests that the answers to the following questions will bear more weight.
31.8%
28.6%
9.1%
14.9%
8.4%
5.8% 1.3%
Executive Management
Strategy Director/Manager
Divisional Director/Manager
Operational Director/Manager
Business Analyst
Process Practitioner
Other
Annual Business Scorecard Survey - 2013 Page 6
Results
Understanding and Business Commitment
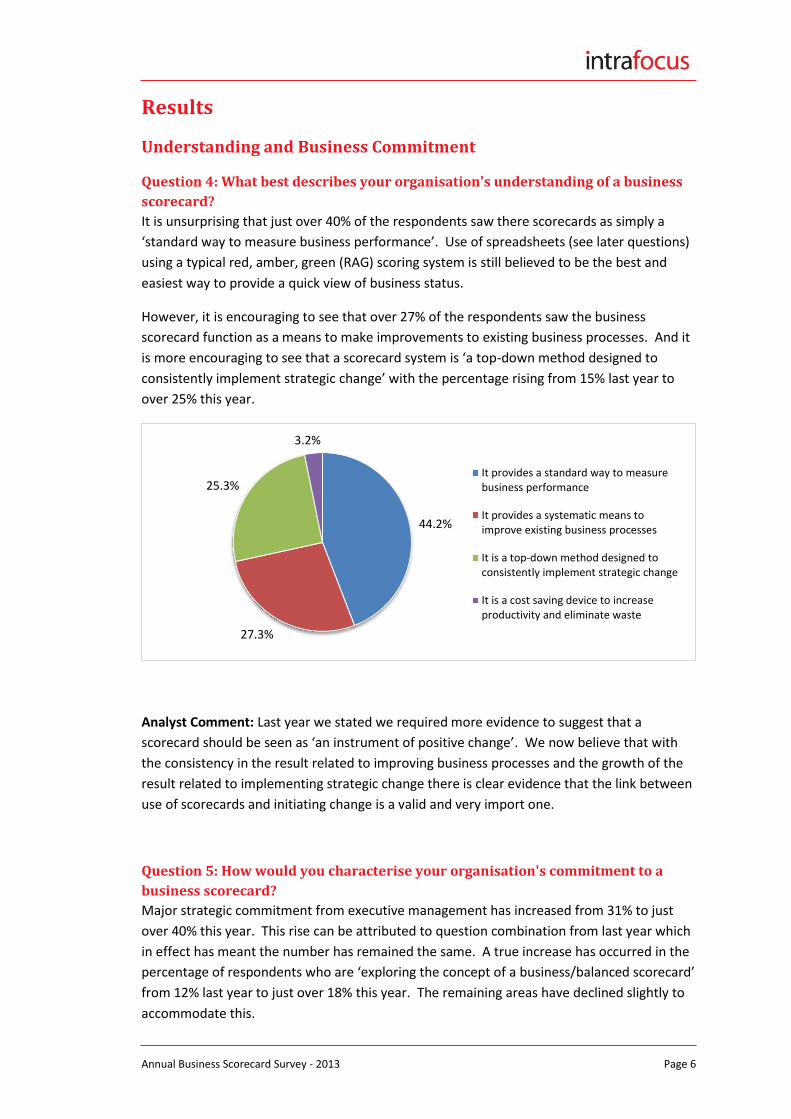
Question 4: What best describes your organisation's understanding of a business
scorecard?
It is unsurprising that just over 40% of the respondents saw there scorecards as simply a
‘standard way to measure business performance’. Use of spreadsheets (see later questions)
using a typical red, amber, green (RAG) scoring system is still believed to be the best and
easiest way to provide a quick view of business status.
However, it is encouraging to see that over 27% of the respondents saw the business
scorecard function as a means to make improvements to existing business processes. And it
is more encouraging to see that a scorecard system is ‘a top-down method designed to
consistently implement strategic change’ with the percentage rising from 15% last year to
over 25% this year.
Analyst Comment: Last year we stated we required more evidence to suggest that a
scorecard should be seen as ‘an instrument of positive change’. We now believe that with
the consistency in the result related to improving business processes and the growth of the
result related to implementing strategic change there is clear evidence that the link between
use of scorecards and initiating change is a valid and very import one.
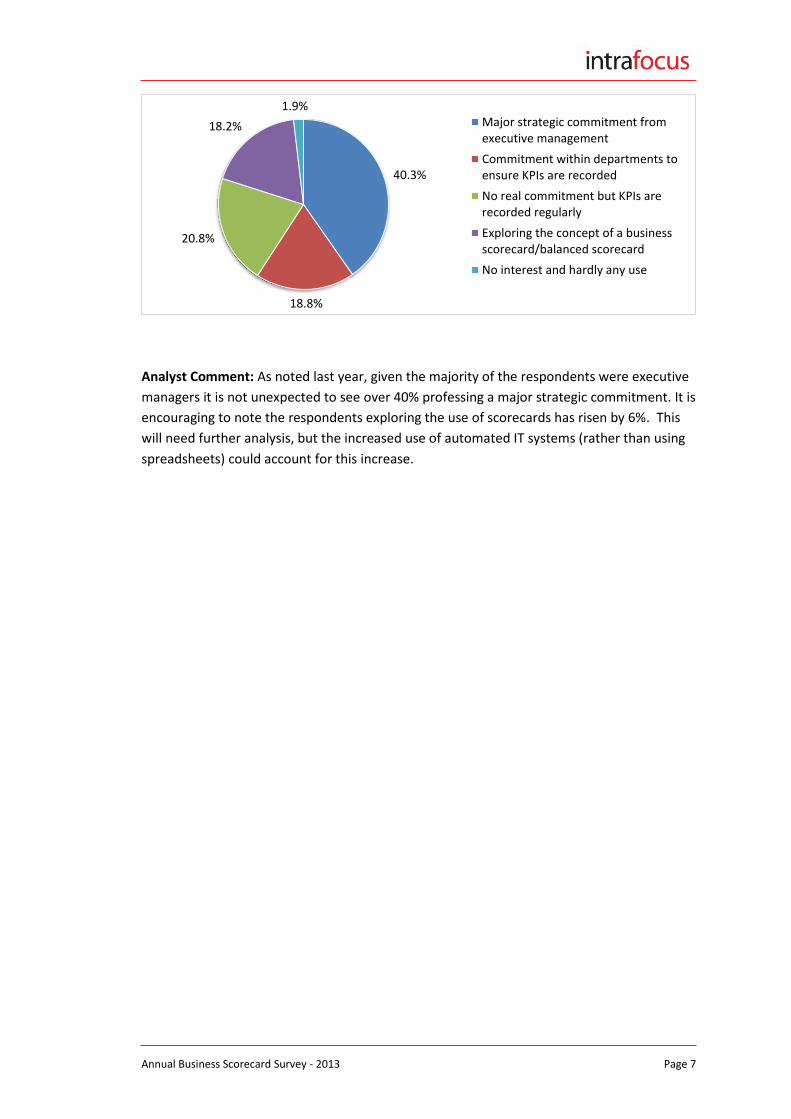
Question 5: How would you characterise your organisation's commitment to a
business scorecard?
Major strategic commitment from executive management has increased from 31% to just
over 40% this year. This rise can be attributed to question combination from last year which
in effect has meant the number has remained the same. A true increase has occurred in the
percentage of respondents who are ‘exploring the concept of a business/balanced scorecard’
from 12% last year to just over 18% this year. The remaining areas have declined slightly to
accommodate this.
44.2%
27.3%
25.3%
3.2%
It provides a standard way to measurebusiness performance
It provides a systematic means toimprove existing business processes
It is a top-down method designed toconsistently implement strategic change
It is a cost saving device to increaseproductivity and eliminate waste
Annual Business Scorecard Survey - 2013 Page 7
Analyst Comment: As noted last year, given the majority of the respondents were executive
managers it is not unexpected to see over 40% professing a major strategic commitment. It is
encouraging to note the respondents exploring the use of scorecards has risen by 6%. This
will need further analysis, but the increased use of automated IT systems (rather than using
spreadsheets) could account for this increase.
40.3%
18.8%
20.8%
18.2%
1.9% Major strategic commitment fromexecutive management
Commitment within departments toensure KPIs are recorded
No real commitment but KPIs arerecorded regularly
Exploring the concept of a businessscorecard/balanced scorecard
No interest and hardly any use
Annual Business Scorecard Survey - 2013 Page 8
Areas and Frequency
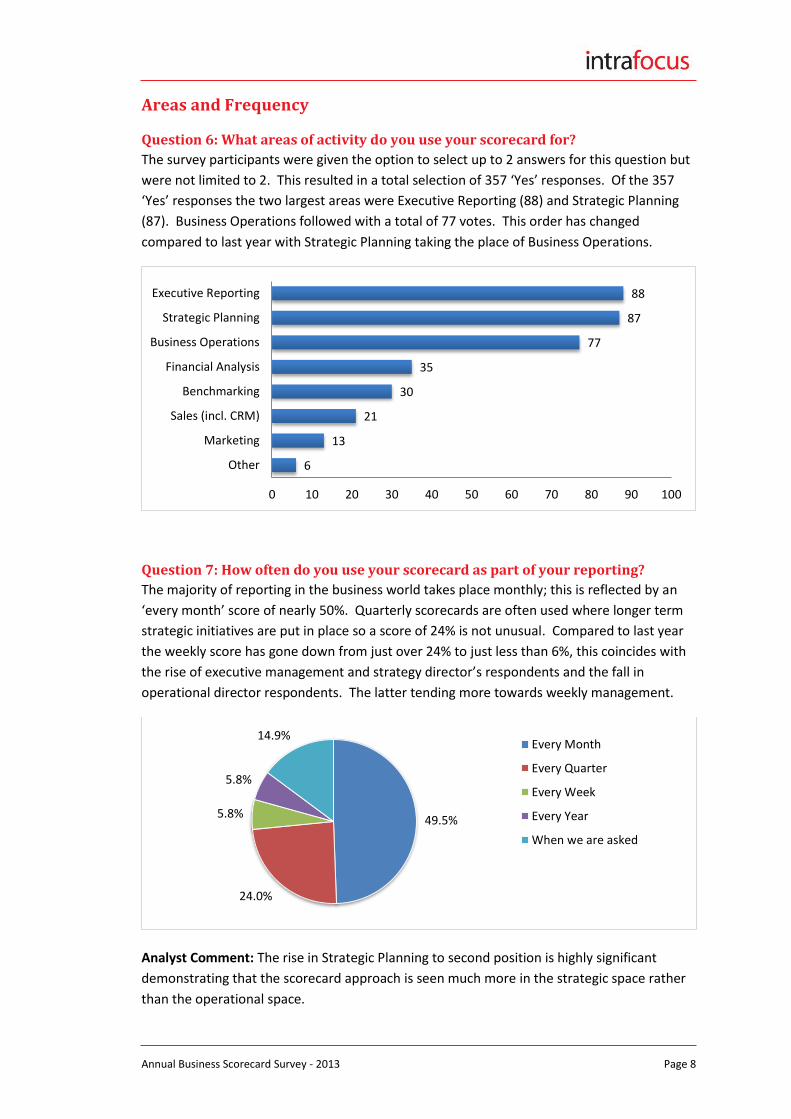
Question 6: What areas of activity do you use your scorecard for?
The survey participants were given the option to select up to 2 answers for this question but
were not limited to 2. This resulted in a total selection of 357 ‘Yes’ responses. Of the 357
‘Yes’ responses the two largest areas were Executive Reporting (88) and Strategic Planning
(87). Business Operations followed with a total of 77 votes. This order has changed
compared to last year with Strategic Planning taking the place of Business Operations.
Question 7: How often do you use your scorecard as part of your reporting?
The majority of reporting in the business world takes place monthly; this is reflected by an
‘every month’ score of nearly 50%. Quarterly scorecards are often used where longer term
strategic initiatives are put in place so a score of 24% is not unusual. Compared to last year
the weekly score has gone down from just over 24% to just less than 6%, this coincides with
the rise of executive management and strategy director’s respondents and the fall in
operational director respondents. The latter tending more towards weekly management.
Analyst Comment: The rise in Strategic Planning to second position is highly significant
demonstrating that the scorecard approach is seen much more in the strategic space rather
than the operational space.
6
13
21
30
35
77
87
88
0 10 20 30 40 50 60 70 80 90 100
Other
Marketing
Sales (incl. CRM)
Benchmarking
Financial Analysis
Business Operations
Strategic Planning
Executive Reporting
49.5%
24.0%
5.8%
5.8%
14.9% Every Month
Every Quarter
Every Week
Every Year
When we are asked
Annual Business Scorecard Survey - 2013 Page 9
Key Performance Indicators (KPIs)
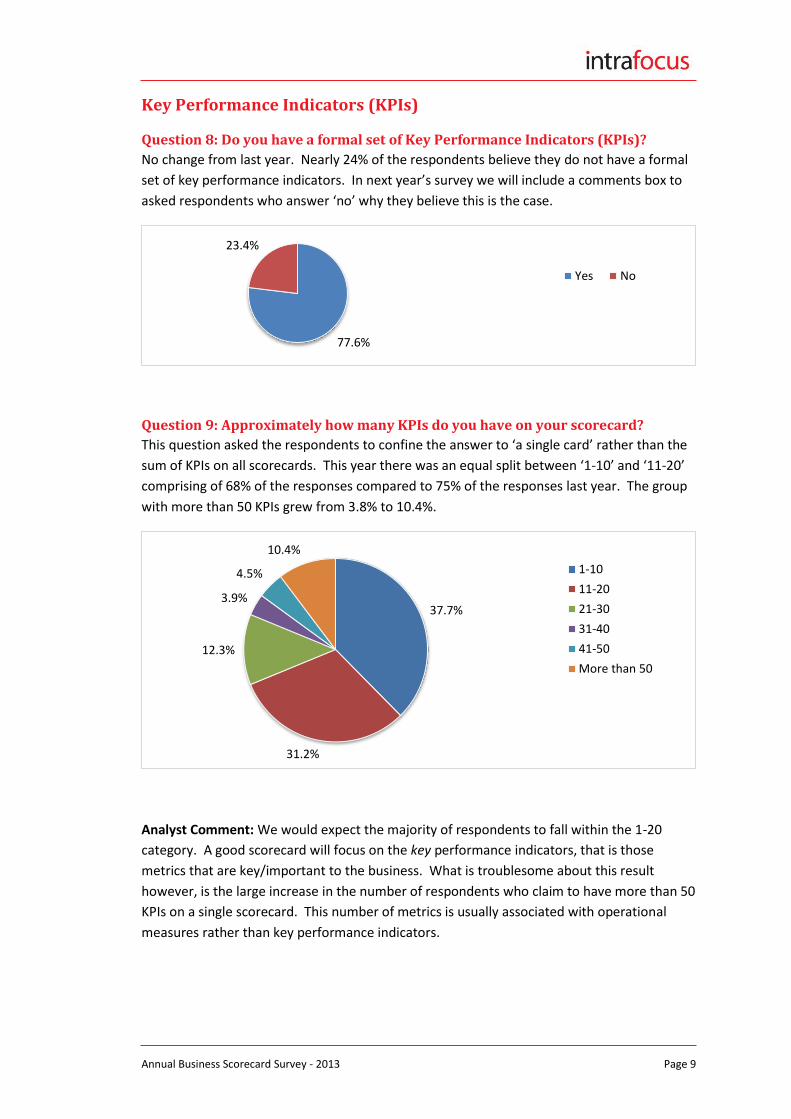
Question 8: Do you have a formal set of Key Performance Indicators (KPIs)?
No change from last year. Nearly 24% of the respondents believe they do not have a formal
set of key performance indicators. In next year’s survey we will include a comments box to
asked respondents who answer ‘no’ why they believe this is the case.
Question 9: Approximately how many KPIs do you have on your scorecard?
This question asked the respondents to confine the answer to ‘a single card’ rather than the
sum of KPIs on all scorecards. This year there was an equal split between ‘1-10’ and ‘11-20’
comprising of 68% of the responses compared to 75% of the responses last year. The group
with more than 50 KPIs grew from 3.8% to 10.4%.
Analyst Comment: We would expect the majority of respondents to fall within the 1-20
category. A good scorecard will focus on the key performance indicators, that is those
metrics that are key/important to the business. What is troublesome about this result
however, is the large increase in the number of respondents who claim to have more than 50
KPIs on a single scorecard. This number of metrics is usually associated with operational
measures rather than key performance indicators.
77.6%
23.4%
Yes No
37.7%
31.2%
12.3%
3.9%
4.5%
10.4%
1-10
11-20
21-30
31-40
41-50
More than 50
Annual Business Scorecard Survey - 2013 Page 10
Software Used
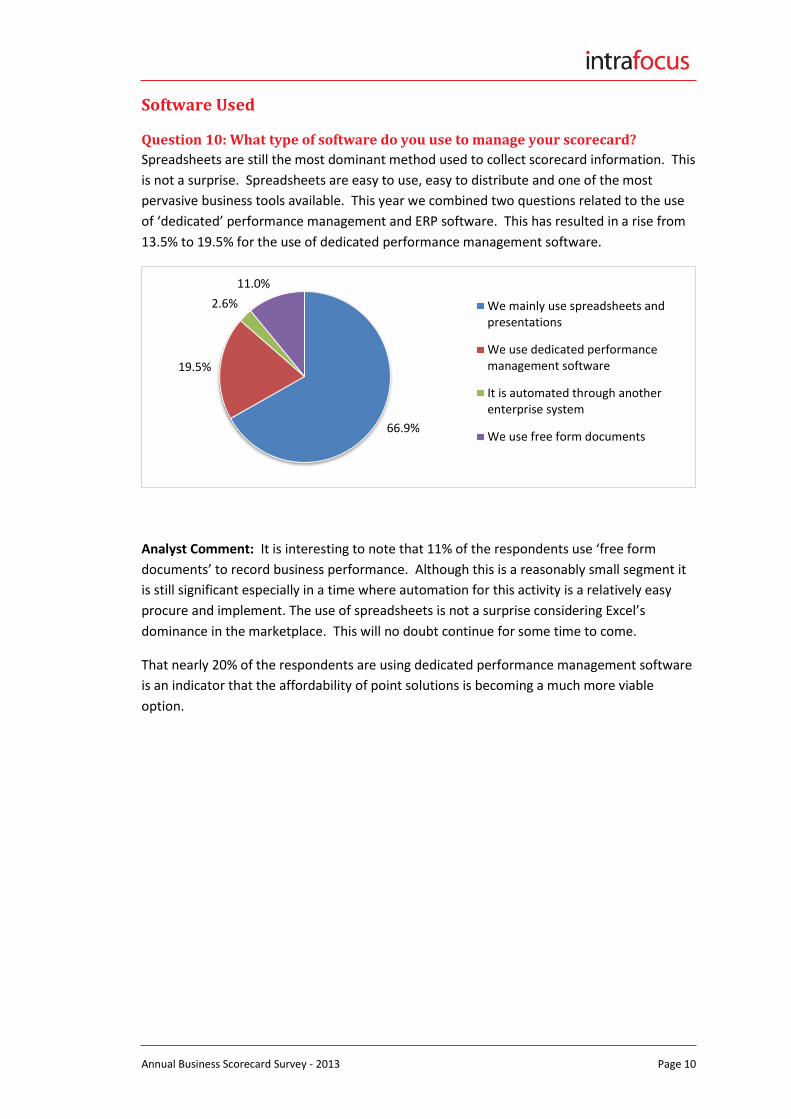
Question 10: What type of software do you use to manage your scorecard?
Spreadsheets are still the most dominant method used to collect scorecard information. This
is not a surprise. Spreadsheets are easy to use, easy to distribute and one of the most
pervasive business tools available. This year we combined two questions related to the use
of ‘dedicated’ performance management and ERP software. This has resulted in a rise from
13.5% to 19.5% for the use of dedicated performance management software.
Analyst Comment: It is interesting to note that 11% of the respondents use ‘free form
documents’ to record business performance. Although this is a reasonably small segment it
is still significant especially in a time where automation for this activity is a relatively easy
procure and implement. The use of spreadsheets is not a surprise considering Excel’s
dominance in the marketplace. This will no doubt continue for some time to come.
That nearly 20% of the respondents are using dedicated performance management software
is an indicator that the affordability of point solutions is becoming a much more viable
option.
66.9%
19.5%
2.6%
11.0%
We mainly use spreadsheets andpresentations
We use dedicated performancemanagement software
It is automated through anotherenterprise system
We use free form documents
Annual Business Scorecard Survey - 2013 Page 11
Overall Satisfaction
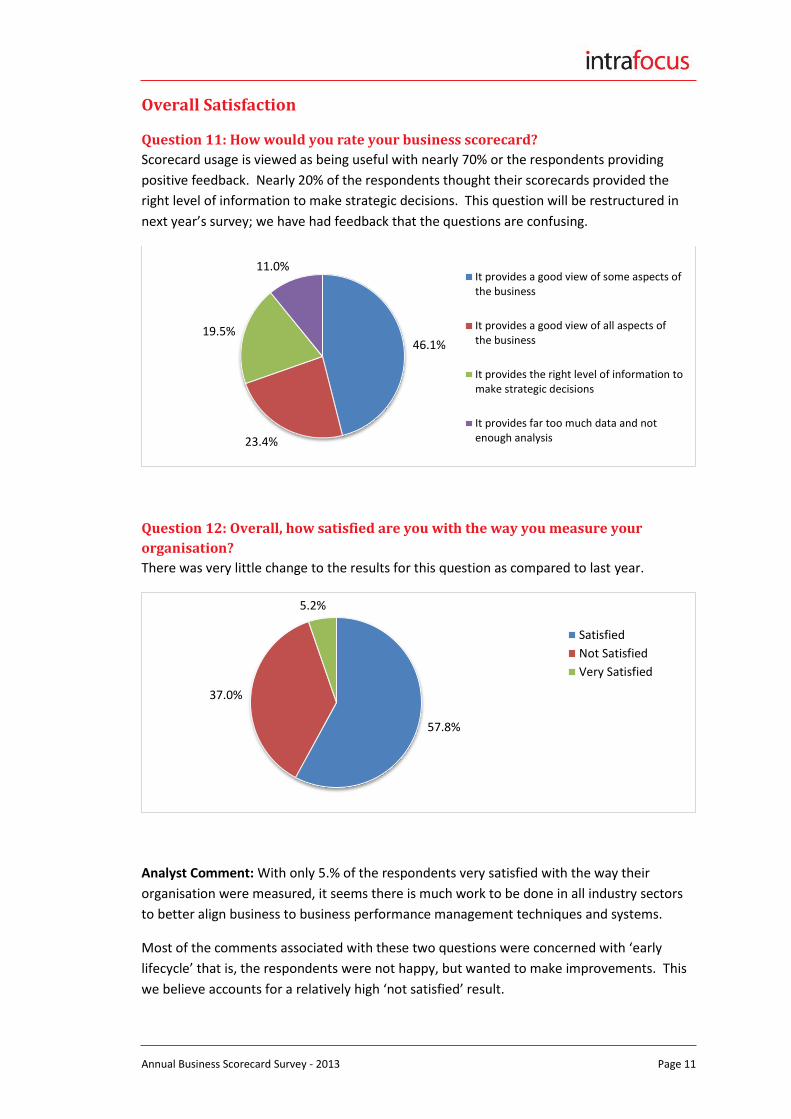
Question 11: How would you rate your business scorecard?
Scorecard usage is viewed as being useful with nearly 70% or the respondents providing
positive feedback. Nearly 20% of the respondents thought their scorecards provided the
right level of information to make strategic decisions. This question will be restructured in
next year’s survey; we have had feedback that the questions are confusing.
Question 12: Overall, how satisfied are you with the way you measure your
organisation?
There was very little change to the results for this question as compared to last year.
Analyst Comment: With only 5.% of the respondents very satisfied with the way their
organisation were measured, it seems there is much work to be done in all industry sectors
to better align business to business performance management techniques and systems.
Most of the comments associated with these two questions were concerned with ‘early
lifecycle’ that is, the respondents were not happy, but wanted to make improvements. This
we believe accounts for a relatively high ‘not satisfied’ result.
46.1%
23.4%
19.5%
11.0% It provides a good view of some aspects ofthe business
It provides a good view of all aspects ofthe business
It provides the right level of information tomake strategic decisions
It provides far too much data and notenough analysis
57.8%
37.0%
5.2%
Satisfied
Not Satisfied
Very Satisfied
Annual Business Scorecard Survey - 2013 Page 12
Final Comments This survey is the second annual survey conducted by Intrafocus and its affiliates. It takes
place in the last three months of the calendar year. With a respondent list of 154 people it
can be considered as highly representative in the niche area of business scorecards.
This year we gave the opportunity for people to provide comments and have discovered that
many of the respondents felt the questions were too complicated or confusing. This,
combined with a new tool has allowed us to see that there was a significant drop-out (that is,
people would start the survey and not complete it). We have therefore concluded, next year
the survey will be re-written and presented in a more ‘user-friendly’ way.
We would like to thank all of the respondents for their participation in this survey, if you
have any comments or suggestions, please forward them to [email protected]
About Intrafocus Intrafocus is a corporate performance management software reseller and consultancy.
Whether you use standard strategic planning tools like strategy maps, balanced scorecards
or business scorecards, or use your own internal strategic planning and management
processes, our software can help. With it you can achieve strategic alignment through the
creation of meaningful strategic objectives, the development key performance indicators
and linkage to strategic initiatives.
Intrafocus is based in Winchester, England and provides software and services to the United
Kingdom and Central Europe. Through its partners, Intrafocus also provides software and
services the Middle East and Africa.
Please take a moment to visit our website: www.intrafocus.com