Embed Size (px)
Citation preview
TMS Performance Scorecard D fi i iDefinitions
TMS Performance Scorecard••What isWhat is a Scorecarda Scorecard??
•TMS’ scorecard is a performance management system that focuses on Key Performance Indicators.
•It is an analysis technique designed to translate our mission and overall organizational strategy into specific, quantifiable measures.
•It is a tool to monitor our performance each week in terms of achieving our goals.
2© 2009 APQC. ALL RIGHTS RESERVED. Nov‐10

TMS Performance Scorecard••What isWhat is a Scorecarda Scorecard??
•Aligns all staff members around common goals and strategies.
•Increases commitment and builds accountability.
3© 2009 APQC. ALL RIGHTS RESERVED. Nov‐10
TMS Key Performance Indicators
••What are TMS’ KPIs?What are TMS’ KPIs?
•KPIs are how TMS defines and measures progress toward goals.
•TMS’ Performance Excellence is based on Key Performance Indicators.
•KPIs are quantifiable measurements, agreed to beforehand with set targets, that reflect critical g ,success factors for TMS.
4© 2009 APQC. ALL RIGHTS RESERVED. Nov‐10
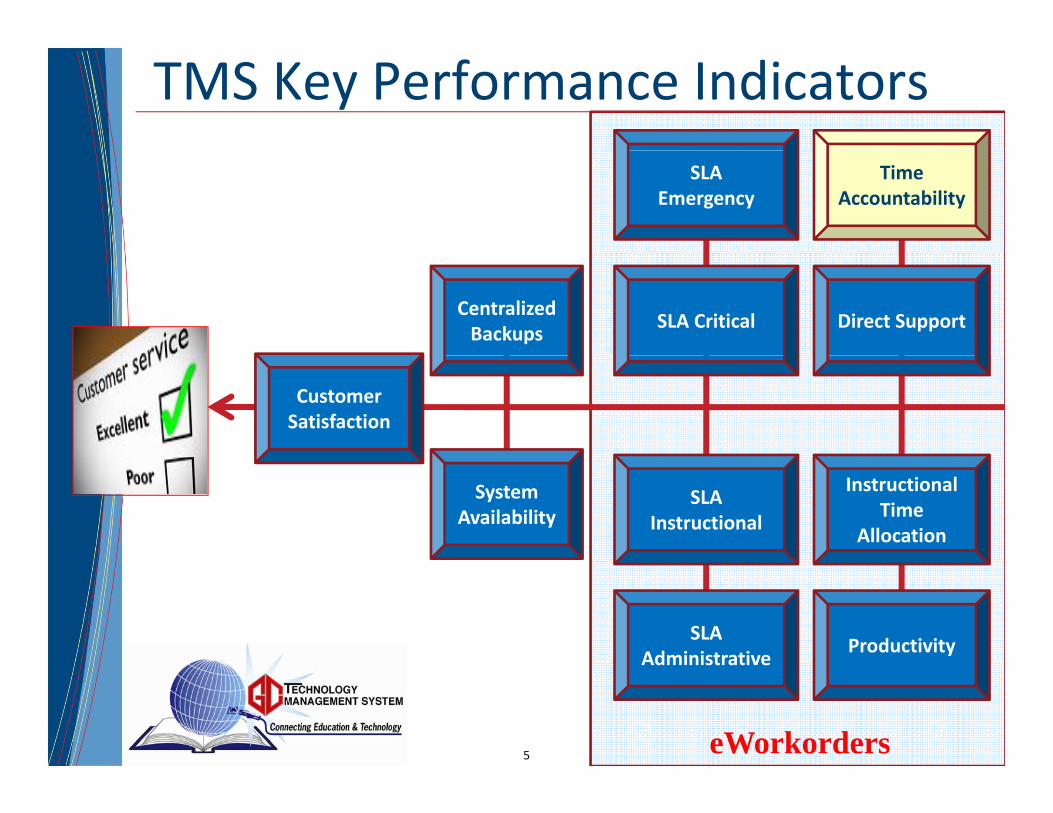
TMS Key Performance IndicatorsTime
AccountabilitySLA
Emergency
Centralized Backups
Direct SupportSLA Critical
Customer Satisfaction
System Availability
Instructional Time
Allocation
SLA Instructional
ProductivitySLA
Administrative
5© 2009 APQC. ALL RIGHTS RESERVED.
Administrative
eWorkorders
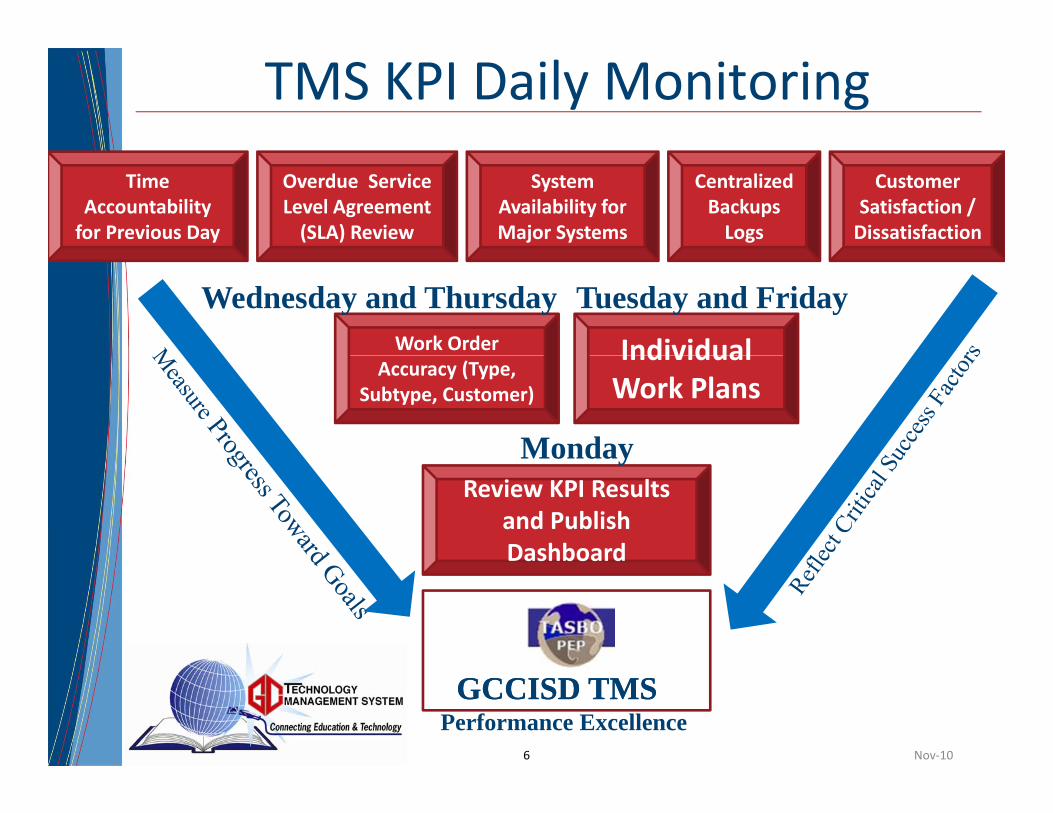
TMS KPI Daily Monitoring
Time Accountability for Previous Day
Overdue Service Level Agreement (SLA) Review
System Availability for Major Systems
Centralized Backups Logs
Customer Satisfaction / Dissatisfaction
Work Order Individual
Wednesday and Thursday Tuesday and Friday
Accuracy (Type, Subtype, Customer)
Individual Work Plans
MondayReview KPI Results
and Publish Dashboard
Monday
Dashboard
6© 2009 APQC. ALL RIGHTS RESERVED. Nov‐10
GCCISD TMSGCCISD TMSPerformance Excellence
KPI Goal Definition
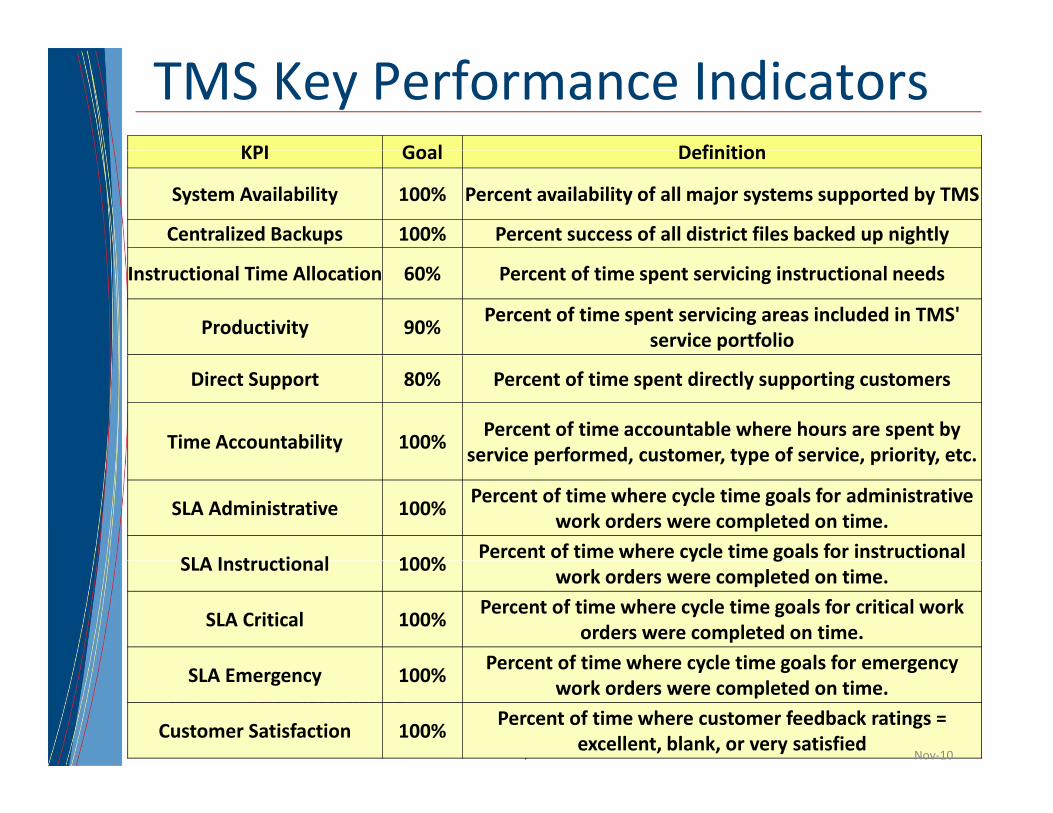
TMS Key Performance IndicatorsKPI Goal Definition
System Availability 100% Percent availability of all major systems supported by TMS
Centralized Backups 100% Percent success of all district files backed up nightly
Instructional Time Allocation 60% Percent of time spent servicing instructional needs
Productivity 90%Percent of time spent servicing areas included in TMS'
service portfolio
Direct Support 80% Percent of time spent directly supporting customers
Time Accountability 100%Percent of time accountable where hours are spent by
service performed customer type of service priority etcservice performed, customer, type of service, priority, etc.
SLA Administrative 100%Percent of time where cycle time goals for administrative
work orders were completed on time.
SLA Instr ctional 100%Percent of time where cycle time goals for instructional
SLA Instructional 100%y g
work orders were completed on time.
SLA Critical 100%Percent of time where cycle time goals for critical work
orders were completed on time.Percent of time where cycle time goals for emergency
7© 2009 APQC. ALL RIGHTS RESERVED.
SLA Emergency 100%Percent of time where cycle time goals for emergency
work orders were completed on time.
Customer Satisfaction 100%Percent of time where customer feedback ratings =
excellent, blank, or very satisfiedNov‐10
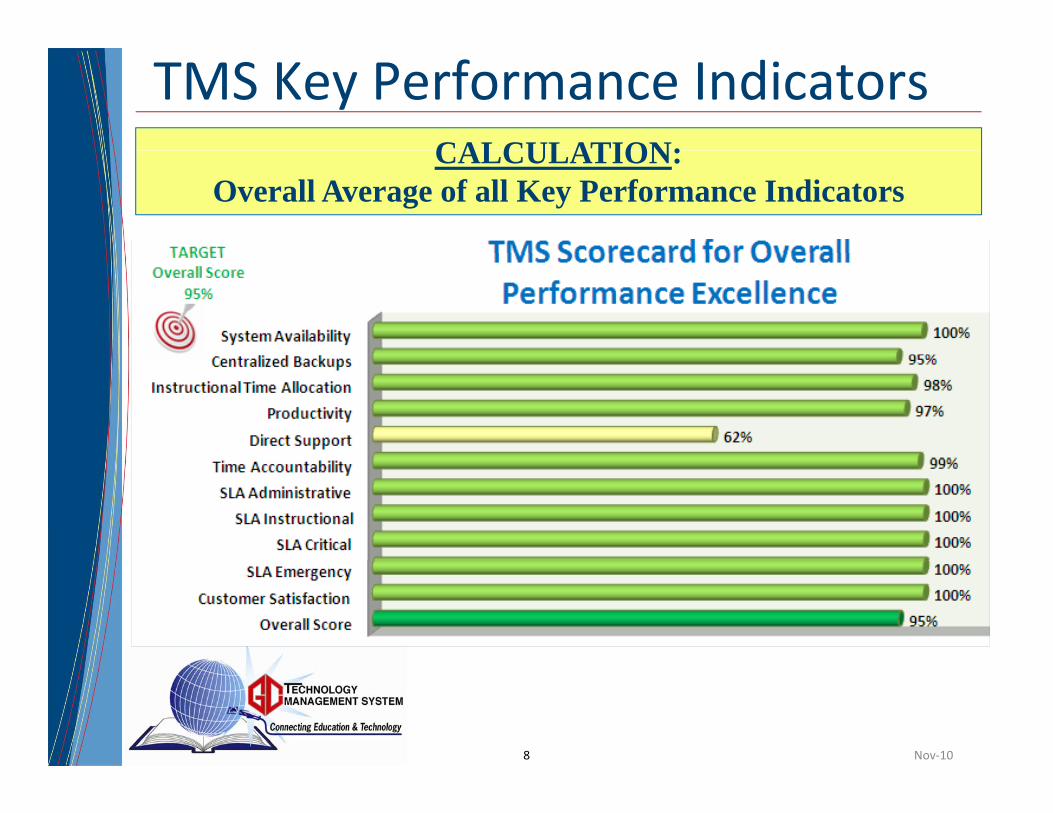
TMS Key Performance IndicatorsCALCULATION:CALCULATION:
Overall Average of all Key Performance Indicators
8© 2009 APQC. ALL RIGHTS RESERVED. Nov‐10
TMS Key Performance IndicatorsKPI Calculation Source of Data
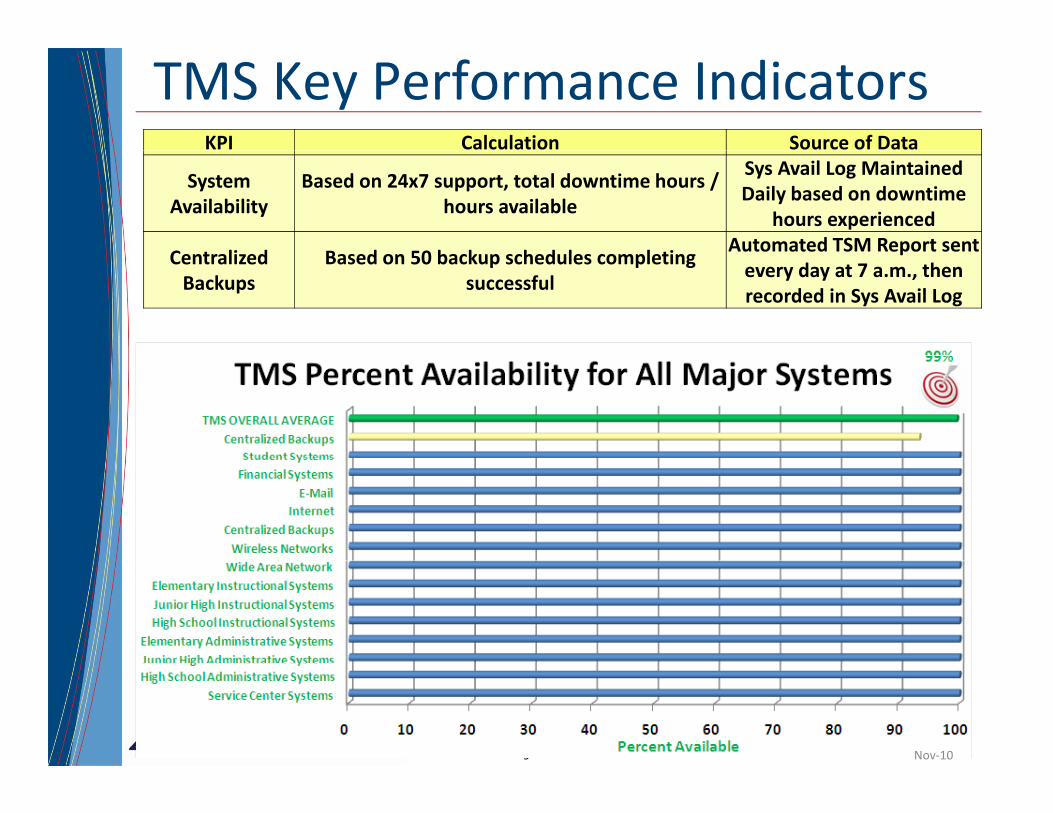
System Availability
Based on 24x7 support, total downtime hours / hours available
Sys Avail Log Maintained Daily based on downtime
hours experienced
C t li d B d 50 b k h d l l tiAutomated TSM Report sent
Centralized Backups
Based on 50 backup schedules completing successful
pevery day at 7 a.m., then recorded in Sys Avail Log
9© 2009 APQC. ALL RIGHTS RESERVED. Nov‐10
TMS Key Performance IndicatorsKPI Calculation Source of Data
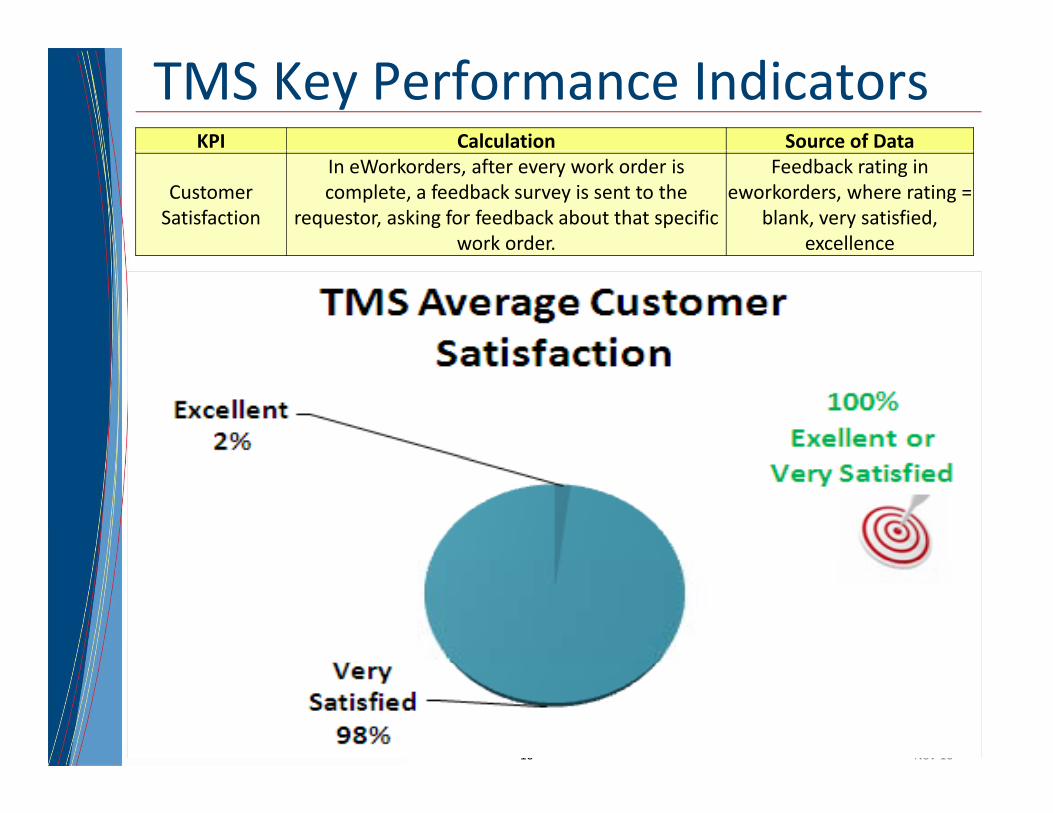
Customer Satisfaction
In eWorkorders, after every work order is complete, a feedback survey is sent to the
requestor, asking for feedback about that specific work order.
Feedback rating in eworkorders, where rating =
blank, very satisfied, excellence
10© 2009 APQC. ALL RIGHTS RESERVED. Nov‐10
TMS Key Performance IndicatorsKPI Calculation Source of Data
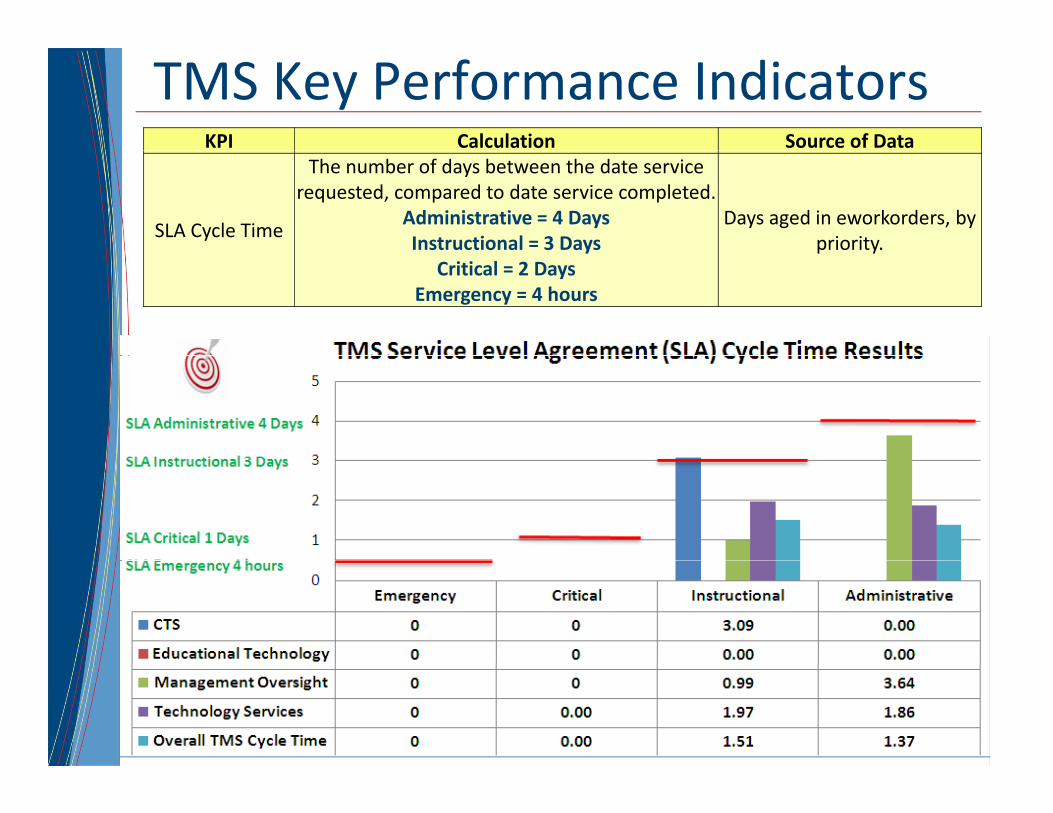
SLA Cycle Time
The number of days between the date service requested, compared to date service completed.
Administrative = 4 DaysInstructional = 3 Days
Days aged in eworkorders, by priority.y
Critical = 2 DaysEmergency = 4 hours
p y
11© 2009 APQC. ALL RIGHTS RESERVED. Nov‐10
TMS Key Performance IndicatorsKPI Calculation Source of Data
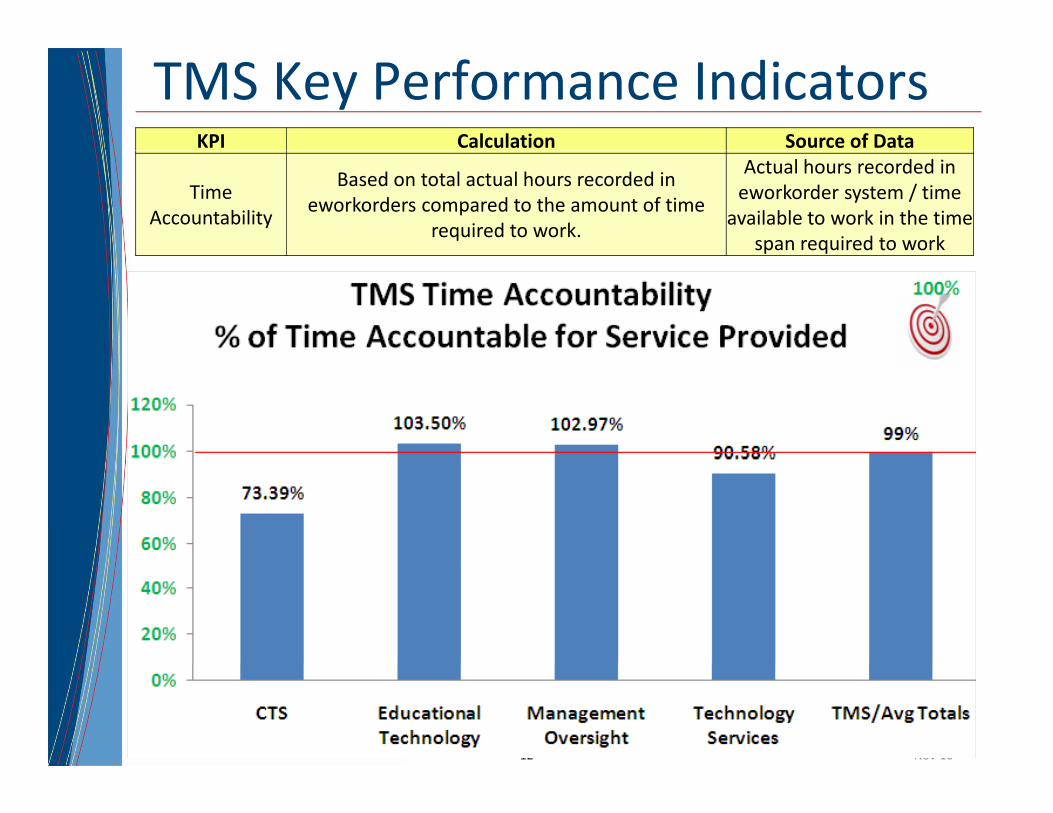
Time Accountability
Based on total actual hours recorded in eworkorders compared to the amount of time
required to work.
Actual hours recorded in eworkorder system / time
available to work in the time span required to workp q
12© 2009 APQC. ALL RIGHTS RESERVED. Nov‐10
TMS Key Performance IndicatorsKPI C l l i S f DKPI Calculation Source of Data
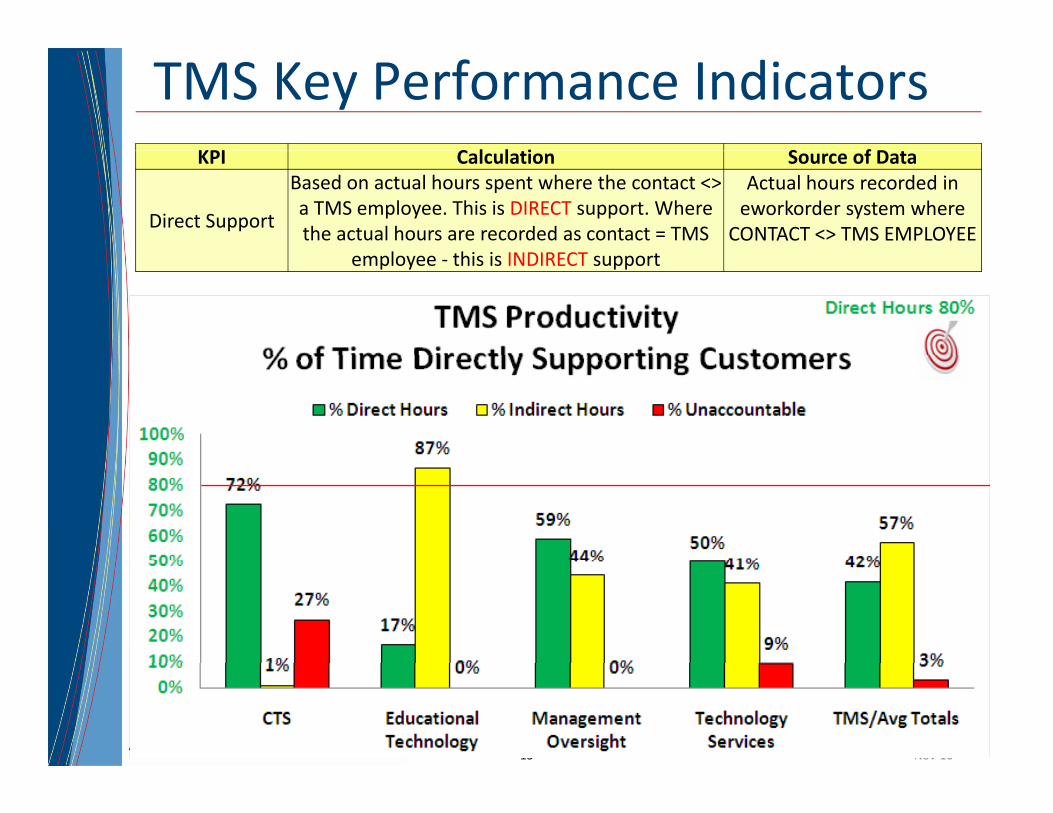
Direct Support
Based on actual hours spent where the contact <> a TMS employee. This is DIRECT support. Where the actual hours are recorded as contact = TMS
l hi i INDIRECT
Actual hours recorded in eworkorder system where
CONTACT <> TMS EMPLOYEEemployee ‐ this is INDIRECT support
13© 2009 APQC. ALL RIGHTS RESERVED. Nov‐10
TMS Key Performance IndicatorsKPI Calculation Source of Data
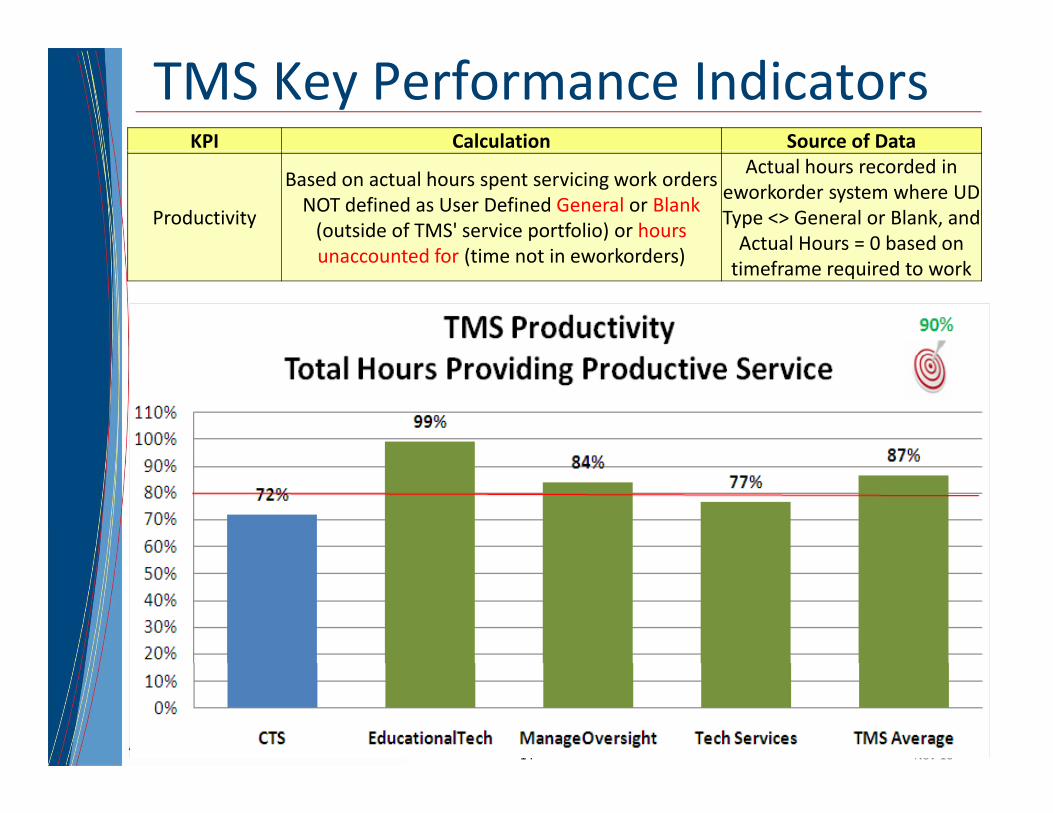
Productivity
Based on actual hours spent servicing work orders NOT defined as User Defined General or Blank(outside of TMS' service portfolio) or hours unaccounted for (time not in eworkorders)
Actual hours recorded in eworkorder system where UD Type <> General or Blank, and Actual Hours = 0 based on
unaccounted for (time not in eworkorders)timeframe required to work
14© 2009 APQC. ALL RIGHTS RESERVED. Nov‐10
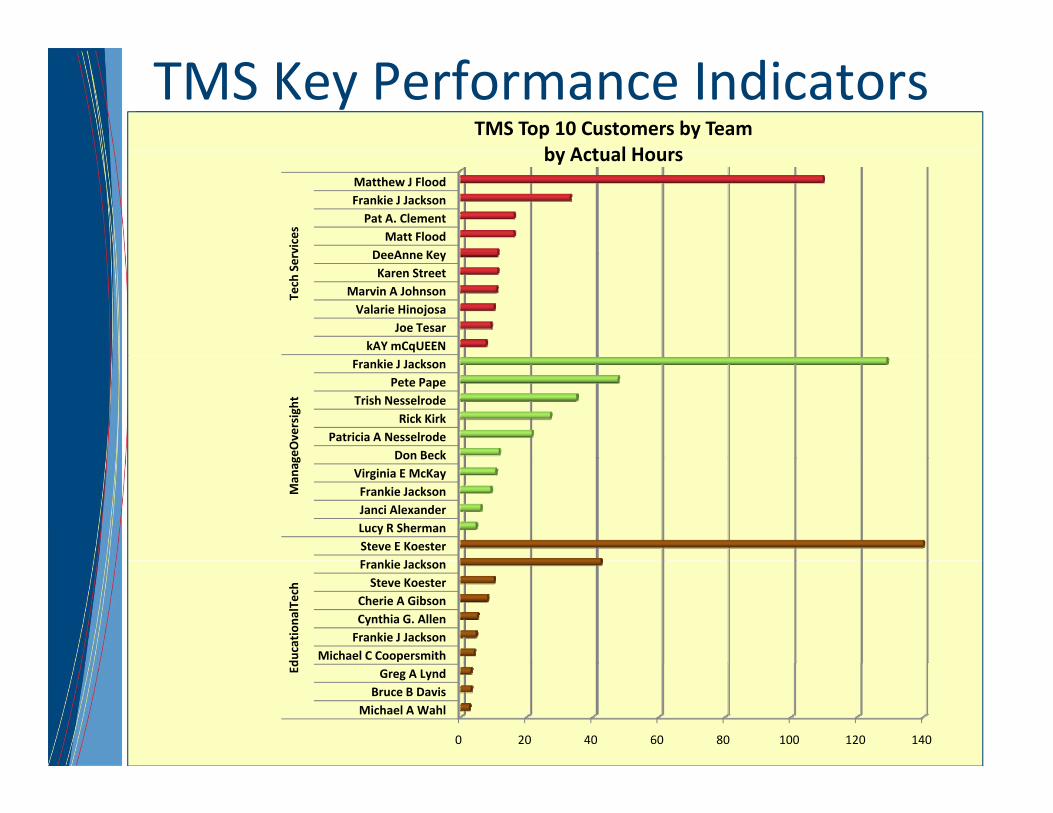
TMS Key Performance IndicatorsTMS Top 10 Customers by Team
b A t l H
DeeAnne KeyMatt Flood
Pat A. ClementFrankie J JacksonMatthew J Flood
vices
by Actual Hours
kAY mCqUEENJoe Tesar
Valarie HinojosaMarvin A Johnson
Karen StreetDeeAnne Key
Tech Serv
Don BeckPatricia A Nesselrode
Rick KirkTrish Nesselrode
Pete PapeFrankie J Jackson
geOversight
F ki J kSteve E KoesterLucy R ShermanJanci AlexanderFrankie JacksonVirginia E McKay
Don Beck
Man
ag
Michael C CoopersmithFrankie J JacksonCynthia G. AllenCherie A GibsonSteve Koester
Frankie Jackson
ducation
alTech
15© 2009 APQC. ALL RIGHTS RESERVED. Nov‐100 20 40 60 80 100 120 140
Michael A WahlBruce B DavisGreg A LyndEd
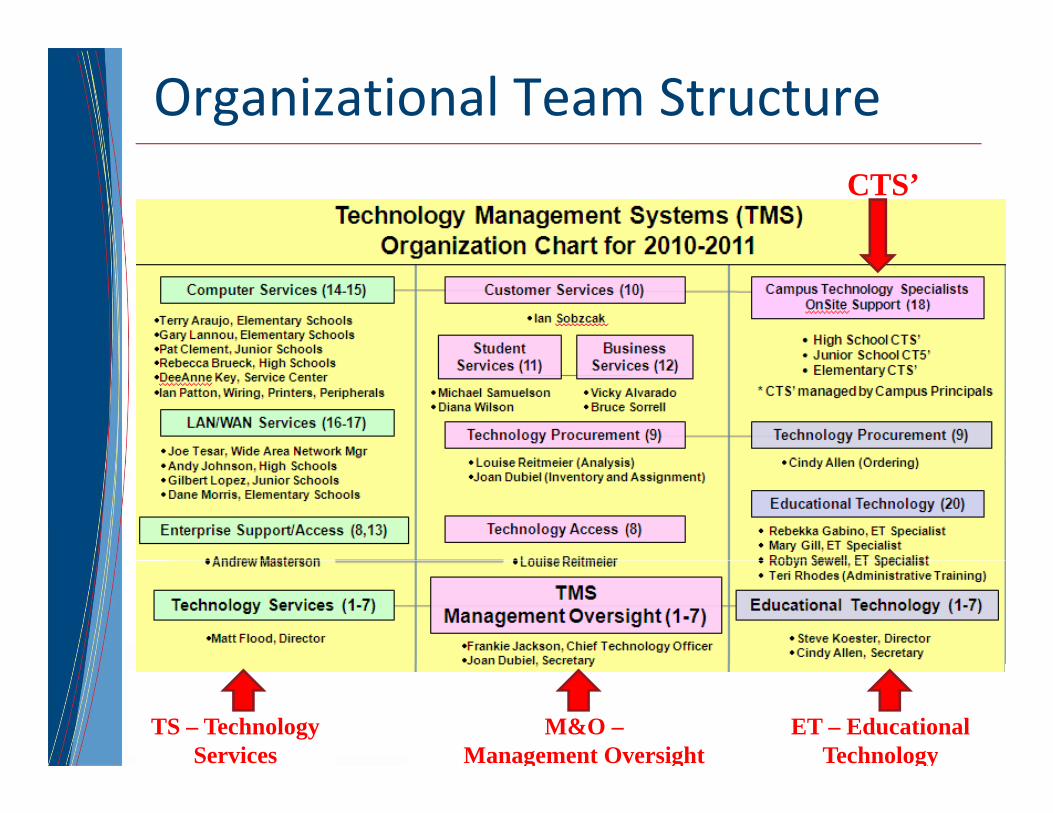
Organizational Team StructureCTS’
16© 2009 APQC. ALL RIGHTS RESERVED. Nov‐10
TS – Technology Services
M&O –Management Oversight
ET – Educational Technology