Embed Size (px)
Citation preview

Score-P
A Joint Performance
Measurement Run-Time
Infrastructure for Periscope,
Scalasca, TAU, and Vampir
Bernd Mohr1), Frank Winkler2), André Grötzsch2) 1)FZ Jülich, 2)ZIH TU Dresden

Tools Workshop in Moscow 27-30 November 2012 2
Fragmentation of Tools Landscape
• Several performance tools co-exist
• Separate measurement systems and output formats
• Complementary features and overlapping functionality
• Redundant effort for development and maintenance
• Limited or expensive interoperability
• Complications for user experience, support, training
Vampir
VampirTrace
OTF
Scalasca
EPILOG /
CUBE
TAU
TAU native
formats
Periscope
Online
measurement

Tools Workshop in Moscow 27-30 November 2012 3
SILC Project Idea
• Start a community effort for a common infrastructure
Score-P instrumentation and measurement system
Common data formats OTF2 and CUBE4
• Developer perspective:
Save manpower by sharing development resources
Invest in new analysis functionality and scalability
Save efforts for maintenance, testing, porting, support, training
• User perspective:
Single learning curve
Single installation, fewer version updates
Interoperability and data exchange
• SILC project funded by BMBF
• Close collaboration PRIMA project
funded by DOE

Tools Workshop in Moscow 27-30 November 2012 4
Partners
• Forschungszentrum Jülich, Germany
• German Research School for Simulation Sciences,
Aachen, Germany
• Gesellschaft für numerische Simulation mbH
Braunschweig, Germany
• RWTH Aachen, Germany
• Technische Universität Dresden, Germany
• Technische Universität München, Germany
• University of Oregon, Eugene, USA

Tools Workshop in Moscow 27-30 November 2012 5
Score-P Functionality
• Provide typical functionality for HPC performance tools
• Support all fundamental concepts of partner’s tools
• Instrumentation (various methods)
• Flexible measurement without re-compilation:
Basic and advanced profile generation
Event trace recording
Online access to profiling data
• MPI, OpenMP, and hybrid parallelism (and serial)
• Enhanced functionality (OpenMP 3.0, CUDA,
highly scalable I/O)

Tools Workshop in Moscow 27-30 November 2012 6
Design Goals
• Functional requirements
Generation of call-path profiles and event traces
Using direct instrumentation, later also sampling
Recording time, visits, communication data, hardware counters
Access and reconfiguration also at runtime
Support for MPI, OpenMP, basic CUDA, and all combinations
Later also OpenCL/HMPP/PTHREAD/…
• Non-functional requirements
Portability: all major HPC platforms
Scalability: petascale
Low measurement overhead
Easy and uniform installation through UNITE framework
Robustness
Open Source: New BSD License

Tools Workshop in Moscow 27-30 November 2012 7
Score-P Architecture
Instrumentation wrapper
Application (MPI×OpenMP×CUDA)
Vampir Scalasca Periscope TAU
Compiler
Compiler
OPARI 2
POMP2
CUDA
CUDA
User
User
PDT
TAU
Score-P measurement infrastructure
Event traces (OTF2) Call-path profiles
(CUBE4, TAU)
Online interface
Hardware counter (PAPI, rusage)
PMPI
MPI
Tools Workshop in Moscow 27-30 November 2012 8
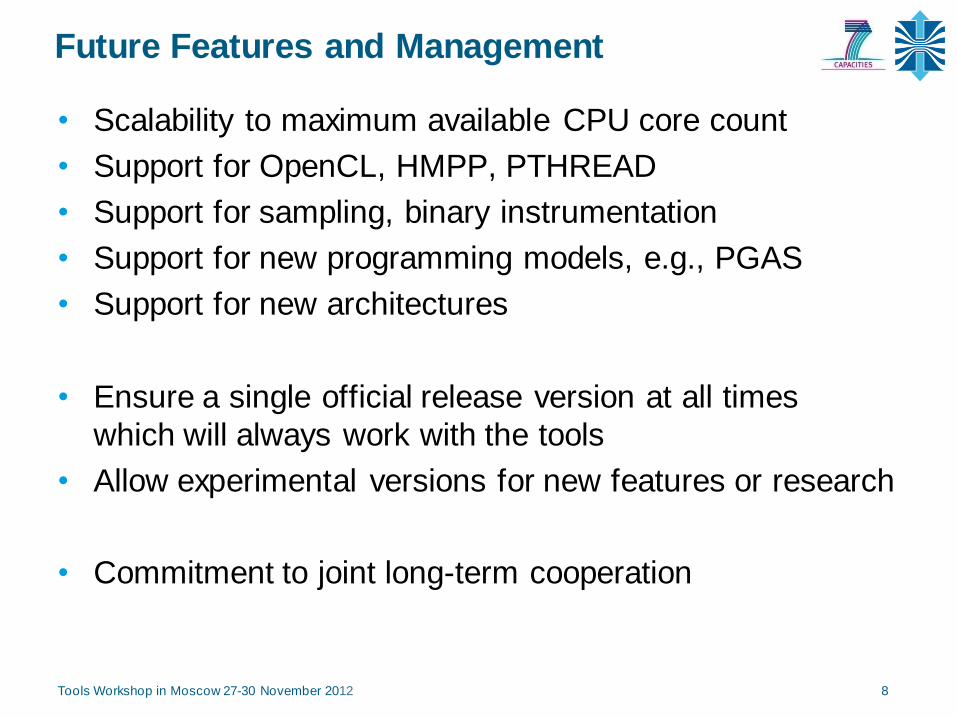
Future Features and Management
• Scalability to maximum available CPU core count
• Support for OpenCL, HMPP, PTHREAD
• Support for sampling, binary instrumentation
• Support for new programming models, e.g., PGAS
• Support for new architectures
• Ensure a single official release version at all times
which will always work with the tools
• Allow experimental versions for new features or research
• Commitment to joint long-term cooperation

Score-P Hands-on:
NPB-MZ-MPI / BT
Bernd Mohr1), Frank Winkler2), André Grötzsch2) 1)FZ Jülich, 2)ZIH TU Dresden

Tools Workshop in Moscow 27-30 November 2012 10
NPB-MZ-MPI / Setup Environment
• Load modules:
• Copy tutorial sources to your home directory:
% module load UNITE
UNITE loaded
% module load scorep
scorep/1.1-cuda loaded
% module load cube4
cube4/4.1.2-gnu loaded
% module load tau
tau/2.21.3p1-openmpi-gnu-papi loaded
% module load vampir
vampir/8.1-dev loaded
% cp /export/hopsa/tools_workshop/NPB3.3-MZ-MPI.tar.gz .
% tar xzvf NPB3.3-MZ-MPI.tar.gz
% cd NPB3.3-MZ-MPI

Tools Workshop in Moscow 27-30 November 2012 11
NPB-MZ-MPI Suite
• The NAS Parallel Benchmark suite (MPI+OpenMP version)
Available from
http://www.nas.nasa.gov/Software/NPB
3 benchmarks in Fortran77
Configurable for various sizes & classes
• Move into the NPB3.3-MZ-MPI root directory
• Subdirectories contain source code for each benchmark
plus additional configuration and common code
• The provided distribution has already been configured for
the tutorial, such that it's ready to “make” one or more of
the benchmarks and install them into a (tool-specific) “bin”
subdirectory
% ls
bin/ common/ jobscript/ Makefile README.install SP-MZ/
BT-MZ/ config/ LU-MZ/ README README.tutorial sys/

Tools Workshop in Moscow 27-30 November 2012 12
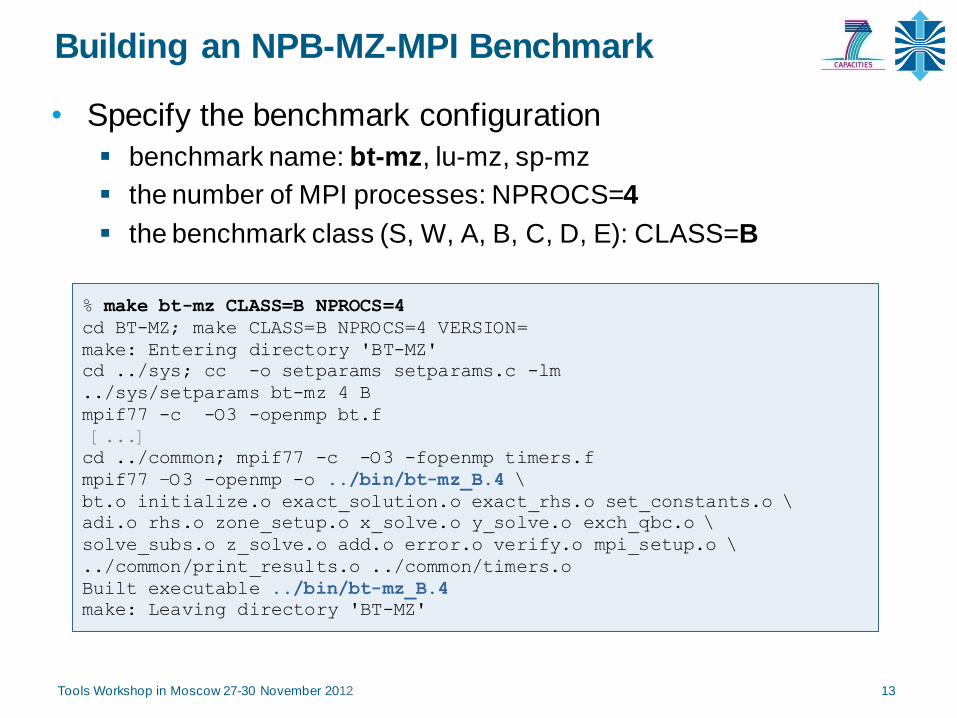
Building an NPB-MZ-MPI Benchmark
• Type “make” for instructions
% make ===========================================
= NAS PARALLEL BENCHMARKS 3.3 =
= MPI+OpenMP Multi-Zone Versions =
= F77 =
===========================================
To make a NAS multi-zone benchmark type
make <benchmark-name> CLASS=<class> NPROCS=<nprocs>
where <benchmark-name> is “bt-mz”, “lu-mz”, or “sp-mz”
<class> is “S”, “W”, “A” through “F”
<nprocs> is number of processes
[...]
***************************************************************
* Custom build configuration is specified in config/make.def *
* Suggested tutorial exercise configuration for HPC systems: *
* make bt-mz CLASS=B NPROCS=4 *
***************************************************************
Tools Workshop in Moscow 27-30 November 2012 13
Building an NPB-MZ-MPI Benchmark
• Specify the benchmark configuration
benchmark name: bt-mz, lu-mz, sp-mz
the number of MPI processes: NPROCS=4
the benchmark class (S, W, A, B, C, D, E): CLASS=B
% make bt-mz CLASS=B NPROCS=4
cd BT-MZ; make CLASS=B NPROCS=4 VERSION=
make: Entering directory 'BT-MZ'
cd ../sys; cc -o setparams setparams.c -lm
../sys/setparams bt-mz 4 B
mpif77 -c -O3 -openmp bt.f
[...]
cd ../common; mpif77 -c -O3 -fopenmp timers.f
mpif77 –O3 -openmp -o ../bin/bt-mz_B.4 \
bt.o initialize.o exact_solution.o exact_rhs.o set_constants.o \
adi.o rhs.o zone_setup.o x_solve.o y_solve.o exch_qbc.o \
solve_subs.o z_solve.o add.o error.o verify.o mpi_setup.o \
../common/print_results.o ../common/timers.o
Built executable ../bin/bt-mz_B.4
make: Leaving directory 'BT-MZ'

Tools Workshop in Moscow 27-30 November 2012 14
NPB-MZ-MPI / BT (Block Tridiagonal Solver)
• What does it do?
Solves a discretized version of unsteady, compressible Navier-
Stokes equations in three spatial dimensions
Performs 200 time-steps on a regular 3-dimensional grid
• Implemented in 20 or so Fortran77 source modules
• Uses MPI & OpenMP in combination
4 processes with 4 threads each should be reasonable
bt-mz_B.4 should run in around 20 seconds
bt-mz_C.4 should take around 3-4x longer

Tools Workshop in Moscow 27-30 November 2012 15
NPB-MZ-MPI / BT Reference Execution
• Copy jobscript and launch as a hybrid MPI+OpenMP
application
% cd bin
% cp../jobscript/graphit/run.sh .
% cleo-submit -np 4 ./run.sh
% cat run.sh.out-<task-id>
NAS Parallel Benchmarks (NPB3.3-MZ-MPI) - BT-MZ MPI+OpenMP Benchmark
Number of zones: 8 x 8
Iterations: 200 dt: 0.000300
Number of active processes: 4
Use the default load factors with threads
Total number of threads: 16 ( 4.0 threads/process)
Calculated speedup = 15.96
Time step 1
[... More application output ...]
BT-MZ Benchmark Completed.
Time in seconds = 18.01
Hint: save the
benchmark output
(or note the run
time) to be able to
refer to it later

Tools Workshop in Moscow 27-30 November 2012 16
Performance Analysis Steps
1. Reference preparation for validation
2. Program instrumentation
3. Summary measurement collection
4. Summary analysis report examination
5. Summary experiment scoring
6. Summary measurement collection with filtering
7. Filtered summary analysis report examination
8. Event trace collection
9. Event trace examination & analysis

Tools Workshop in Moscow 27-30 November 2012 17
NPB-MZ-MPI / BT Instrumentation
• Edit config/make.def to adjust build configuration
Modify specification of compiler/linker: MPIF77
# SITE- AND/OR PLATFORM-SPECIFIC DEFINITIONS
#---------------------------------------------------------------------
# Items in this file may need to be changed for each platform.
#---------------------------------------------------------------------
...
#---------------------------------------------------------------------
# The Fortran compiler used for MPI programs
#---------------------------------------------------------------------
#MPIF77 = mpif77
# Alternative variants to perform instrumentation
...
MPIF77 = scorep --user mpif77
# This links MPI Fortran programs; usually the same as ${MPIF77}
FLINK = $(MPIF77)
...
Uncomment the
Score-P compiler
wrapper specification

Tools Workshop in Moscow 27-30 November 2012 18
NPB-MZ-MPI / BT Instrumented Build
• Return to root directory and clean-up
• Re-build executable using Score-P compiler wrapper
% make clean
% make suite
cd BT-MZ; make CLASS=B NPROCS=4 VERSION=
make: Entering directory 'BT-MZ'
cd ../sys; cc -o setparams setparams.c -lm
../sys/setparams bt-mz 4 B
scorep --user mpif77 -c -O3 -openmp bt.f
[...]
cd ../common; scorep --user mpif77 -c -O3 -fopenmp timers.f
scorep --user mpif77 –O3 -openmp -o ../bin.scorep/bt-mz_B.4 \
bt.o initialize.o exact_solution.o exact_rhs.o set_constants.o \
adi.o rhs.o zone_setup.o x_solve.o y_solve.o exch_qbc.o \
solve_subs.o z_solve.o add.o error.o verify.o mpi_setup.o \
../common/print_results.o ../common/timers.o
Built executable ../bin.scorep/bt-mz_B.4
make: Leaving directory 'BT-MZ'

Tools Workshop in Moscow 27-30 November 2012 19
Measurement Configuration: scorep-info
• Score-P measurements are configured via environmental
variables: % scorep-info config-vars --full SCOREP_ENABLE_PROFILING
Description: Enable profiling
[...]
SCOREP_ENABLE_TRACING
Description: Enable tracing
[...]
SCOREP_TOTAL_MEMORY
Description: Total memory in bytes for the measurement system
[...]
SCOREP_EXPERIMENT_DIRECTORY
Description: Name of the experiment directory
[...]
SCOREP_FILTERING_FILE
Description: A file name which contain the filter rules
[...]
SCOREP_METRIC_PAPI
Description: PAPI metric names to measure
[...]
SCOREP_METRIC_RUSAGE
Description: Resource usage metric names to measure
[... More configuration variables ...]

Tools Workshop in Moscow 27-30 November 2012 20
Summary Measurement Collection
• Change to the directory containing the new executable
before running it with the desired configuration
% cd bin.scorep
% cp../jobscript/graphit/run.sh .
% cat run.sh
export OMP_NUM_THREADS=4
export SCOREP_EXPERIMENT_DIRECTORY=scorep_bt-mz_B_4x4_sum
% cleo-submit -np 4 ./run.sh
% cat run.sh.out-<task-id>
NAS Parallel Benchmarks (NPB3.3-MZ-MPI) - BT-MZ MPI+OpenMP Benchmark
Number of zones: 8 x 8
Iterations: 200 dt: 0.000300
Number of active processes: 4
Use the default load factors with threads
Total number of threads: 16 ( 4.0 threads/process)
Calculated speedup = 15.96
Time step 1
[... More application output ...]

Tools Workshop in Moscow 27-30 November 2012 21
• Creates experiment directory ./scorep_bt-mz_B_4x4_sum
containing
a record of the measurement configuration (scorep.cfg)
the analysis report that was collated after measurement
(profile.cubex)
^
Interactive exploration with CUBE4
BT-MZ Summary Analysis Report Examination
% ls
bt-mz_B.4 scorep_bt-mz_B_4x4_sum
% ls scorep_bt-mz_B_4x4_sum
profile.cubex scorep.cfg
% cube scorep_bt-mz_B_4x4_sum/profile.cubex
[CUBE GUI showing summary analysis report]

Tools Workshop in Moscow 27-30 November 2012 22
Congratulations!?
• If you made it this far, you successfully used Score-P to
instrument the application
analyze its execution with a summary measurement, and
examine it with one of the interactive analysis report explorer GUIs
• ... revealing the call-path profile annotated with
the “Time” metric
Visit counts
MPI message statistics (bytes sent/received)
• ... but how good was the measurement?
The measured execution produced the desired valid result
however, the execution took rather longer than expected!
– even when ignoring measurement start-up/completion, therefore
– it was probably dilated by instrumentation/measurement overhead

Tools Workshop in Moscow 27-30 November 2012 23
BT-MZ Summary Analysis Result Scoring
• Report scoring as textual output
• Region/callpath classification
MPI (pure MPI library functions)
OMP (pure OpenMP functions/regions)
USR (user-level source local computation)
COM (“combined” USR + OpenMP/MPI)
ANY/ALL (aggregate of all region types)
% scorep-score scorep_bt-mz_B_4x4_sum/profile.cubex
Estimated aggregate size of event trace (total_tbc): 39223255064 bytes
Estimated requirements for largest trace buffer (max_tbc): 9865345520 bytes
(hint: When tracing set SCOREP_TOTAL_MEMORY > max_tbc to avoid intermediate flushes
or reduce requirements using file listing names of USR regions to be filtered.)
flt type max_tbc time % region
ALL 9865345520 3051.65 100.0 ALL
USR 9846360168 969.25 31.8 USR
OMP 17803776 2026.84 66.4 OMP
COM 1087800 13.32 0.4 COM
MPI 93776 42.24 1.4 MPI
USR
USR
COM
COM USR
OMP MPI
36.5 GB total memory
9.2 GB per rank!

Tools Workshop in Moscow 27-30 November 2012 24
BT-MZ Summary Analysis Report Breakdown
• Score report breakdown by region
% scorep-score -r scorep_bt-mz_B_4x4_sum/profile.cubex
[...]
flt type max_tbc time % region
ALL 9865345520 3051.65 100.0 ALL
USR 9846360168 969.25 31.8 USR
OMP 17803776 2026.84 66.4 OMP
COM 1087800 13.32 0.4 COM
MPI 93776 42.24 1.4 MPI
USR 3158128080 222.74 7.3 matvec_sub_
USR 3158128080 286.41 9.4 matmul_sub_
USR 3158128080 422.11 13.8 binvcrhs_
USR 139326768 10.94 0.4 binvrhs_
USR 139326768 15.78 0.5 lhsinit_
USR 103563840 11.25 0.4 exact_solution_
OMP 823296 0.10 0.0 !$omp parallel @exch_qbc..
OMP 823296 0.09 0.0 !$omp parallel @exch_qbc..
OMP 823296 0.10 0.0 !$omp parallel @exch_qbc..
[...]
USR
USR
COM
COM USR
OMP MPI
More than
6.3 GB just for
these 6 regions

Tools Workshop in Moscow 27-30 November 2012 25
BT-MZ Summary Analysis Score
• Summary measurement analysis score reveals
Total size of event trace would be ~36 GB
Maximum trace buffer size would be ~9 GB per rank
smaller buffer would require flushes to disk during measurement
resulting in substantial perturbation
99.8% of the trace requirements are for USR regions
purely computational routines never found on COM call-paths
common to communication routines or OpenMP parallel regions
These USR regions contribute around 32% of total time
however, much of that is very likely to be measurement overhead
for frequently-executed small routines
• Advisable to tune measurement configuration
Specify an adequate trace buffer size
Specify a filter file listing (USR) regions not to be measured
Tools Workshop in Moscow 27-30 November 2012 26
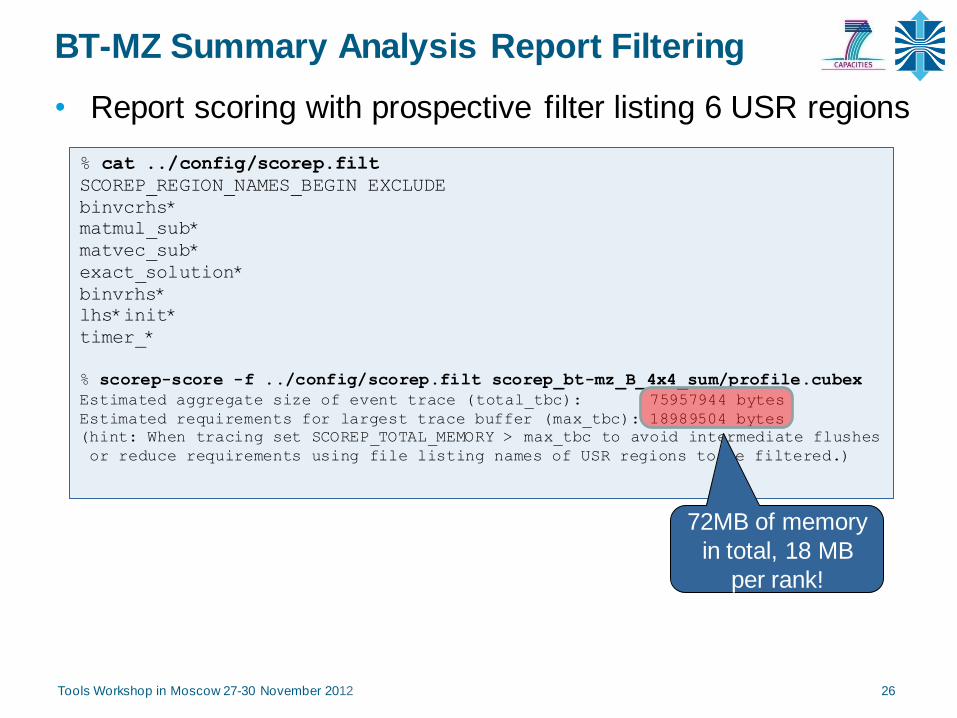
BT-MZ Summary Analysis Report Filtering
• Report scoring with prospective filter listing 6 USR regions
% cat ../config/scorep.filt
SCOREP_REGION_NAMES_BEGIN EXCLUDE
binvcrhs*
matmul_sub*
matvec_sub*
exact_solution*
binvrhs*
lhs*init*
timer_*
% scorep-score -f ../config/scorep.filt scorep_bt-mz_B_4x4_sum/profile.cubex
Estimated aggregate size of event trace (total_tbc): 75957944 bytes
Estimated requirements for largest trace buffer (max_tbc): 18989504 bytes
(hint: When tracing set SCOREP_TOTAL_MEMORY > max_tbc to avoid intermediate flushes
or reduce requirements using file listing names of USR regions to be filtered.)
72MB of memory
in total, 18 MB
per rank!

Tools Workshop in Moscow 27-30 November 2012 27
BT-MZ Summary Analysis Report Filtering
• Score report breakdown by region % scorep-score -r –f ../config/scorep.filt \
> scorep_bt-mz_B_4x4_sum/profile.cubex
flt type max_tbc time % region
* ALL 18989504 2082.40 68.2 ALL-FLT
+ FLT 9846356040 969.25 31.8 FLT
- OMP 17803776 2026.84 66.4 OMP-FLT
* COM 1087800 13.32 0.4 COM-FLT
- MPI 93776 42.24 1.4 MPI-FLT
* USR 4152 0.00 0.0 USR-FLT
+ USR 3158128080 222.74 7.3 matvec_sub_
+ USR 3158128080 286.41 9.4 matmul_sub_
+ USR 3158128080 422.11 13.8 binvcrhs_
+ USR 139326768 10.94 0.4 binvrhs_
+ USR 139326768 15.78 0.5 lhsinit_
+ USR 103563840 11.25 0.4 exact_solution_
- OMP 823296 0.10 0.0 !$omp parallel @exch_qbc.f
- OMP 823296 0.09 0.0 !$omp parallel @exch_qbc.f
- OMP 823296 0.10 0.0 !$omp parallel @exch_qbc.f
[...]

Tools Workshop in Moscow 27-30 November 2012 28
BT-MZ Filtered Summary Measurement
• Set new experiment directory and re-run measurement
with new filter configuration % vim run.sh
% export SCOREP_EXPERIMENT_DIRECTORY=scorep_bt-mz_B_4x4_sum_with_filter
% export SCOREP_FILTERING_FILE=../config/scorep.filt
% cleo-submit –np 4 ./run.sh
NAS Parallel Benchmarks (NPB3.3-MZ-MPI) - BT-MZ MPI+OpenMP Benchmark
Number of zones: 8 x 8
Iterations: 200 dt: 0.000300
Number of active processes: 4
Use the default load factors with threads
Total number of threads: 16 ( 4.0 threads/process)
Calculated speedup = 15.96
Time step 1
[... More application output ...]

Tools Workshop in Moscow 27-30 November 2012 29
BT-MZ Tuned Summary Analysis Report Score
• Scoring of new analysis report as textual output
• Significant reduction in runtime (measurement overhead)
Not only reduced time for USR regions, but MPI/OMP reduced too!
• Further measurement tuning (filtering) may be appropriate
e.g., use “timer_*” to filter timer_start_, timer_read_, etc.
% scorep-score scorep_bt-mz_B_4x4_sum_with_filter/profile.cubex
Estimated aggregate size of event trace (total_tbc): 75957944 bytes
Estimated requirements for largest trace buffer (max_tbc): 18989504 bytes
(hint: When tracing set SCOREP_TOTAL_MEMORY > max_tbc to avoid intermediate flushes
or reduce requirements using file listing names of USR regions to be filtered.)
flt type max_tbc time % region
ALL 18989504 968.60 100.0 ALL OMP 17803776 950.62 98.1 OMP
COM 1087800 10.42 1.1 COM
MPI 93776 7.56 0.8 MPI
USR 4152 0.00 0.0 USR

Tools Workshop in Moscow 27-30 November 2012 30
Advanced Measurement Configuration: Metrics
• Recording hardware counters via PAPI
• Also possible to record them only per rank
• Recording operating system resource usage
% export SCOREP_METRIC_PAPI=PAPI_TOT_INS,PAPI_FP_INS
% cleo-submit –np 4 ./run.sh
NAS Parallel Benchmarks (NPB3.3-MZ-MPI) - BT-MZ MPI+OpenMP Benchmark
[... More application output ...]
% export SCOREP_METRIC_PAPI_PER_PROCESS=PAPI_L2_DCM
% cleo-submit –np 4 ./run.sh
NAS Parallel Benchmarks (NPB3.3-MZ-MPI) - BT-MZ MPI+OpenMP Benchmark
[... More application output ...]
% export SCOREP_METRIC_RUSAGE=ru_maxrss,ru_stime
% cleo-submit –np 4 ./run.sh
NAS Parallel Benchmarks (NPB3.3-MZ-MPI) - BT-MZ MPI+OpenMP Benchmark
[... More application output ...]

Tools Workshop in Moscow 27-30 November 2012 31
Advanced Measurement Configuration: Metrics
• Available PAPI metrics
Preset events: common set of events deemed relevant and
useful for application performance tuning
Abstraction from specific hardware performance counters,
mapping onto available events done by PAPI internally
• Native events: set of all events that are available on the
CPU (platform dependent)
% papi_avail
% papi_native_avail

Tools Workshop in Moscow 27-30 November 2012 32
Advanced Measurement Configuration: Metrics
• Available resource usage metrics
% man getrusage [... Output ...]
struct rusage {
struct timeval ru_utime; /* user CPU time used */
struct timeval ru_stime; /* system CPU time used */
long ru_maxrss; /* maximum resident set size */
long ru_ixrss; /* integral shared memory size */
long ru_idrss; /* integral unshared data size */
long ru_isrss; /* integral unshared stack size */
long ru_minflt; /* page reclaims (soft page faults) */
long ru_majflt; /* page faults (hard page faults) */
long ru_nswap; /* swaps */
long ru_inblock; /* block input operations */
long ru_oublock; /* block output operations */
long ru_msgsnd; /* IPC messages sent */
long ru_msgrcv; /* IPC messages received */
long ru_nsignals; /* signals received */
long ru_nvcsw; /* voluntary context switches */
long ru_nivcsw; /* involuntary context switches */
};
[... More output ...]

Tools Workshop in Moscow 27-30 November 2012 33
Advanced Measurement Configuration: Metrics
• Edit run.sh to adjust configuration
Modify specification of metrics
• Interactive exploration with CUBE4
• Interactive exploration with ParaProf
% vim run.sh
export OMP_NUM_THREADS=4
export SCOREP_EXPERIMENT_DIRECTORY=scorep_bt-mz_B_4x4_sum_with_metrics
export SCOREP_FILTERING_FILE=../config/scorep.filt
export SCOREP_METRIC_RUSAGE=ru_maxrss,ru_stime
export SCOREP_METRIC_PAPI=PAPI_TOT_CYC,PAPI_TOT_INS,PAPI_FP_INS
% cleo-submit –np 4 ./run.sh
Uncomment the Score-P
metric specifications
% cube scorep_bt-mz_B_4x4_sum_with_metrics/profile.cubex
% paraprof scorep_bt-mz_B_4x4_sum_with_metrics/profile.cubex

Tools Workshop in Moscow 27-30 November 2012 34
Performance Analysis Steps
1. Reference preparation for validation
2. Program instrumentation
3. Summary measurement collection
4. Summary analysis report examination
5. Summary experiment scoring
6. Summary measurement collection with filtering
7. Filtered summary analysis report examination
8. Event trace collection
9. Event trace examination & analysis

Tools Workshop in Moscow 27-30 November 2012 35
Warnings and Tips Regarding Tracing
• Traces can become extremely large and unwieldy
Size is proportional to number of processes/threads (width),
duration (length) and detail (depth) of measurement
• Traces containing intermediate flushes are of little value
• Uncoordinated flushes result in cascades of distortion
Reduce size of trace
Increase available buffer space
• Traces should be written to a parallel file system
/work or /scratch are typically provided for this purpose
• Moving large traces between file systems is often
impractical
However, systems with more memory can analyze larger traces
Alternatively, run trace analyzers with undersubscribed nodes

Tools Workshop in Moscow 27-30 November 2012 36
BT-MZ Trace Measurement Collection...
• Re-run the application using the tracing mode of Score-P
• Separate trace file per thread written straight into new
experiment directory ./scorep_bt-mz_B_4x4_trace
• Interactive trace exploration with Vampir
% vim run.sh
% export SCOREP_EXPERIMENT_DIRECTORY=scorep_bt-mz_B_4x4_trace
% export SCOREP_FILTERING_FILE=../config/scorep.filt
% export SCOREP_METRIC_RUSAGE=ru_maxrss,ru_stime
% export SCOREP_METRIC_PAPI=PAPI_TOT_CYC,PAPI_TOT_INS,PAPI_FP_INS
% export SCOREP_ENABLE_TRACING=true
% export SCOREP_ENABLE_PROFILING=false
% export SCOREP_TOTAL_MEMORY=100M
% cleo-submit –np 4 ./run.sh
NAS Parallel Benchmarks (NPB3.3-MZ-MPI) - BT-MZ MPI+OpenMP Benchmark
[... More application output ...]
% vampir scorep_bt-mz_B_4x4_trace/traces.otf2
[Vampir GUI showing trace]

Tools Workshop in Moscow 27-30 November 2012 37
BT-MZ Trace Measurement Collection
• Switch modules and rebuild
• Re-run the application with Emetrics
% vim run.sh
% export SCOREP_EXPERIMENT_DIRECTORY=scorep_bt-mz_B_4x4_trace
% export SCOREP_FILTERING_FILE=../config/scorep.filt
% export SCOREP_METRIC_RUSAGE=ru_maxrss,ru_stime
% export SCOREP_METRIC_PAPI=PAPI_TOT_CYC,PAPI_TOT_INS,PAPI_FP_INS
% export SCOREP_ENABLE_TRACING=true
% export SCOREP_ENABLE_PROFILING=false
% export SCOREP_TOTAL_MEMORY=100M
% export SCOREP_EMETRIC_ENABLE=true
% export SCOREP_EMETRIC_SERVER=10.55.0.106
% export SCOREP_EMETRIC_SENSORS=1050,1052
% cleo-submit –np 4 ./run.sh
NAS Parallel Benchmarks (NPB3.3-MZ-MPI) - BT-MZ MPI+OpenMP Benchmark
[... More application output ...]
% module switch scorep scorep/1.2-branch-emetrics
% cd ..
% make clean
% make suite
% cd bin.scorep

Tools Workshop in Moscow 27-30 November 2012 38
Advanced Measurement Configuration: MPI
• Record only for subset of the MPI functions events
• All possible sub-groups cg Communicator and group management coll Collective functions
env Environmental management err MPI Error handling ext External interface functions
io MPI file I/O misc Miscellaneous
perf PControl P2p Peer-to-peer communication rma One sided communication
spawn Process management topo Topology
type MPI datatype functions xnonblock Extended non-blocking events xreqtest Test events for uncompleted requests
% export SCOREP_MPI_ENABLE_GROUPS=cg,coll,p2p,xnonblock
% cleo-submit –np 4 ./run.sh
NAS Parallel Benchmarks (NPB3.3-MZ-MPI) - BT-MZ MPI+OpenMP Benchmark
[... More application output ...]

Tools Workshop in Moscow 27-30 November 2012 39
Advanced Measurement Configuration: CUDA
• Record CUDA events with the CUPTI interface
• All possible recording types
runtime CUDA runtime API
driver CUDA driver API
gpu GPU activities
kernel CUDA kernels
idle GPU compute idle time
memcpy CUDA memory copies (not available yet)
% export SCOREP_CUDA_ENABLE=runtime,gpu,kernel

Tools Workshop in Moscow 27-30 November 2012 40
Score-P User Instrumentation API
• Can be used to mark initialization, solver & other phases
Annotation macros ignored by default
Enabled with [--user] flag
• Appear as additional regions in analyses
Distinguishes performance of important phase from rest
• Can be of various type
E.g., function, loop, phase
See user manual for details
• Available for Fortran / C / C++

Tools Workshop in Moscow 27-30 November 2012 41
Score-P User Instrumentation API (Fortran)
• Requires processing by the C preprocessor
#include "scorep/SCOREP_User.inc"
subroutine foo(…)
! Declarations
SCOREP_USER_REGION_DEFINE( solve )
! Some code…
SCOREP_USER_REGION_BEGIN( solve, “<solver>", \
SCOREP_USER_REGION_TYPE_LOOP )
do i=1,100
[...]
end do
SCOREP_USER_REGION_END( solve )
! Some more code…
end subroutine

Tools Workshop in Moscow 27-30 November 2012 42
Score-P User Instrumentation API (C/C++)
#include "scorep/SCOREP_User.h"
void foo()
{
/* Declarations */
SCOREP_USER_REGION_DEFINE( solve )
/* Some code… */
SCOREP_USER_REGION_BEGIN( solve, “<solver>", \
SCOREP_USER_REGION_TYPE_LOOP )
for (i = 0; i < 100; i++)
{
[...]
}
SCOREP_USER_REGION_END( solve )
/* Some more code… */
}

Tools Workshop in Moscow 27-30 November 2012 43
Score-P User Instrumentation API (C++)
#include "scorep/SCOREP_User.h"
void foo()
{
// Declarations
// Some code…
{
SCOREP_USER_REGION( “<solver>", SCOREP_USER_REGION_TYPE_LOOP )
for (i = 0; i < 100; i++)
{
[...]
}
}
// Some more code…
}

Tools Workshop in Moscow 27-30 November 2012 44
Score-P Measurement Control API
• Can be used to temporarily disable measurement for certain
intervals
Annotation macros ignored by default
Enabled with [--user] flag
#include “scorep/SCOREP_User.inc”
subroutine foo(…)
! Some code…
SCOREP_RECORDING_OFF()
! Loop will not be measured
do i=1,100
[...]
end do
SCOREP_RECORDING_ON()
! Some more code…
end subroutine
#include “scorep/SCOREP_User.h”
void foo(…) {
/* Some code… */
SCOREP_RECORDING_OFF()
/* Loop will not be measured */
for (i = 0; i < 100; i++) {
[...]
}
SCOREP_RECORDING_ON()
/* Some more code… */
}
Fortran (requires C preprocessor) C / C++