Embed Size (px)
Citation preview
8/14/2019 Scor 8.0 to 9.0
http://slidepdf.com/reader/full/scor-80-to-90 1/14
This presentation is the exclusive property of the Supply Chain
Council. Copyright © Supply Chain Council. 2006. All rights reserved.
The marks SCOR®, CCOR™, DCOR™ and SCOR Roadmap™ are theexclusive property of the Supply Chain Council.
SCOR 8.0 to 9.0
Highlighting the changes and additions inrelease 9.0 of SCOR published in April
2008

8/14/2019 Scor 8.0 to 9.0
http://slidepdf.com/reader/full/scor-80-to-90 2/14
2Copyright © Supply Chain Council, 2008. All rights reserved
SCOR 9.0 Addendum
•! Overview of differences
•! GreenSCOR
GreenSCOR was created to add environmental
considerations to SCOR. “Green additions make
SCOR a tool for managing environmental impacts
of the supply chain.” •! Risk Management
“Supply Chain disruptions are a reality”. SCOR Risk
Management focuses on the avoidance/minimization
of supply chain costs and disruption.
2

8/14/2019 Scor 8.0 to 9.0
http://slidepdf.com/reader/full/scor-80-to-90 3/14
3Copyright © Supply Chain Council, 2008. All rights reserved
GreenSCOR
•! Summary of Changes
1.! Three (3) New process steps added to Make (M1.7, M2.7 and M3.8)
2.! New ‘green’ metrics added to existing and new processes
3.! New ‘green’ best practices added to existing and new processes
4.! New environmental strategy metrics proposed
•! Where to find these changes
1.! In the Process section of your reference binder (e.g. page 3.3.15)
2.! Primarily in the Cost metrics (e.g. page 2.4.14)
3.!
In the Best Practices section (starting at page 4.2.1)4.! In the Special Applications section (page 5.1.1)
3
8/14/2019 Scor 8.0 to 9.0
http://slidepdf.com/reader/full/scor-80-to-90 4/144Copyright © Supply Chain Council, 2008. All rights reserved
GreenSCOR
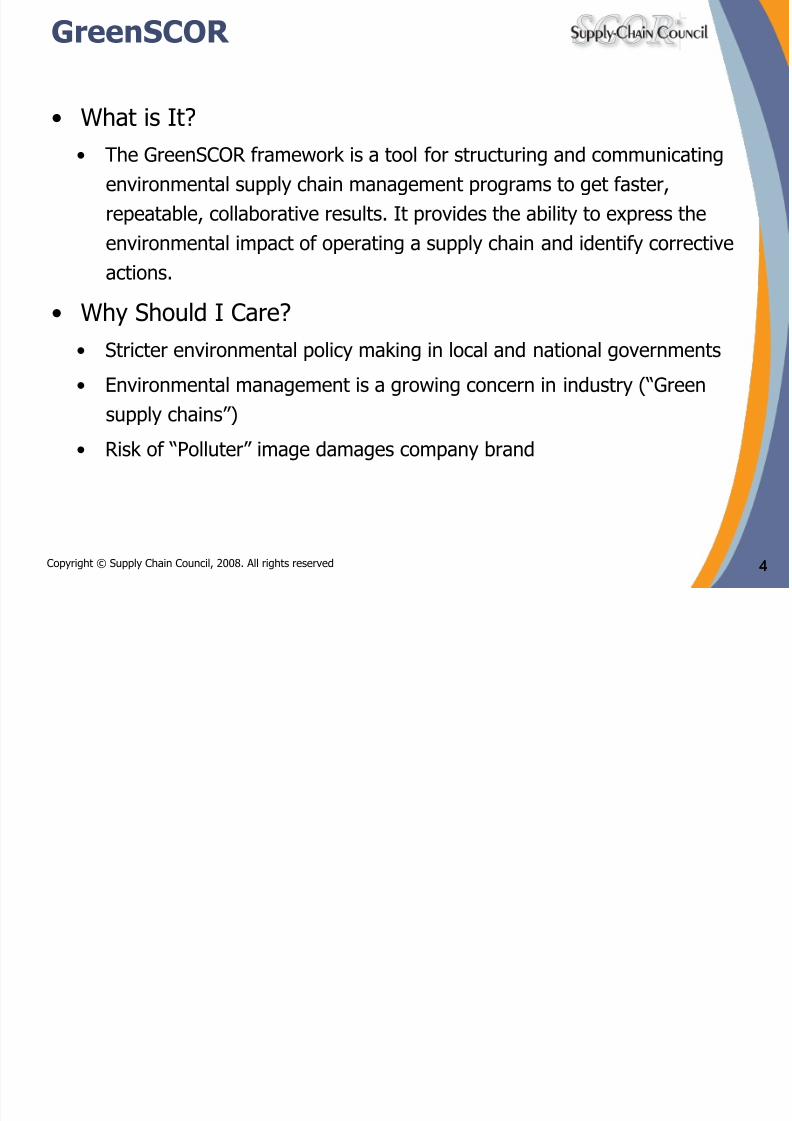
•! What is It?
•! The GreenSCOR framework is a tool for structuring and communicating
environmental supply chain management programs to get faster,
repeatable, collaborative results. It provides the ability to express the
environmental impact of operating a supply chain and identify corrective
actions.
•! Why Should I Care?
•! Stricter environmental policy making in local and national governments
•! Environmental management is a growing concern in industry (“Green
supply chains”)
•! Risk of “Polluter” image damages company brand
4

8/14/2019 Scor 8.0 to 9.0
http://slidepdf.com/reader/full/scor-80-to-90 5/14
5
M1.6Release
Product toDeliver
Copyright © Supply Chain Council, 2008. All rights reserved
GreenSCOR
5
M1.2Issue
Product
M1.3Produceand Test
M1.4PackageProduct
M1.5Stage
Product
M1.1Schedule
Production
Activities
M1.7Waste
Disposal
•! Example ‘Green’ Processes
Copyright © Supply Chain Council, 2008. All rights reserved

8/14/2019 Scor 8.0 to 9.0
http://slidepdf.com/reader/full/scor-80-to-90 6/14
6Copyright © Supply Chain Council, 2008. All rights reserved
GreenSCOR
•! Example ‘Green’ Metrics:
6
Plan •! Compliance costs•! Emissions cost per unit
Source •! % of orders receives with correct packaging•! % of suppliers with current EMS system
Make •! Energy costs as a per cent of production costs•! Waste produced as per cent of product produced
Deliver •! Fuel costs as per cent of Deliver costs•! % of carriers meeting environmental criteria
Return•
!Products returned as percent of products delivered•! Return products disposed of vs. remanufactured
Enable •! Facility energy costs as per cent of total costs•! Down time due to non-compliance issues
8/14/2019 Scor 8.0 to 9.0
http://slidepdf.com/reader/full/scor-80-to-90 7/14
7Copyright © Supply Chain Council, 2008. All rights reserved
GreenSCOR
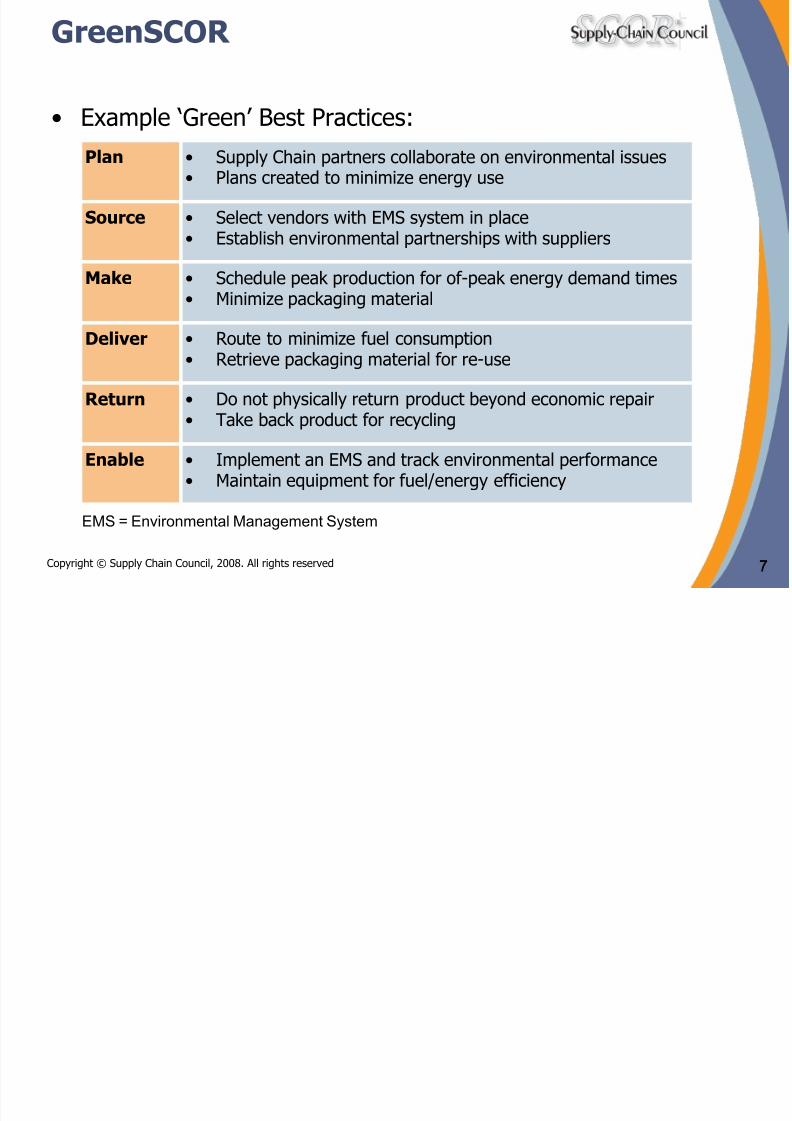
•! Example ‘Green’ Best Practices:
7
Plan •! Supply Chain partners collaborate on environmental issues•! Plans created to minimize energy use
Source •! Select vendors with EMS system in place•! Establish environmental partnerships with suppliers
Make •! Schedule peak production for of-peak energy demand times•! Minimize packaging material
Deliver •! Route to minimize fuel consumption•! Retrieve packaging material for re-use
Return •! Do not physically return product beyond economic repair
•! Take back product for recycling
Enable •! Implement an EMS and track environmental performance•! Maintain equipment for fuel/energy efficiency
EMS = Environmental Management System
8/14/2019 Scor 8.0 to 9.0
http://slidepdf.com/reader/full/scor-80-to-90 8/14
8Copyright © Supply Chain Council, 2008. All rights reserved
GreenSCOR
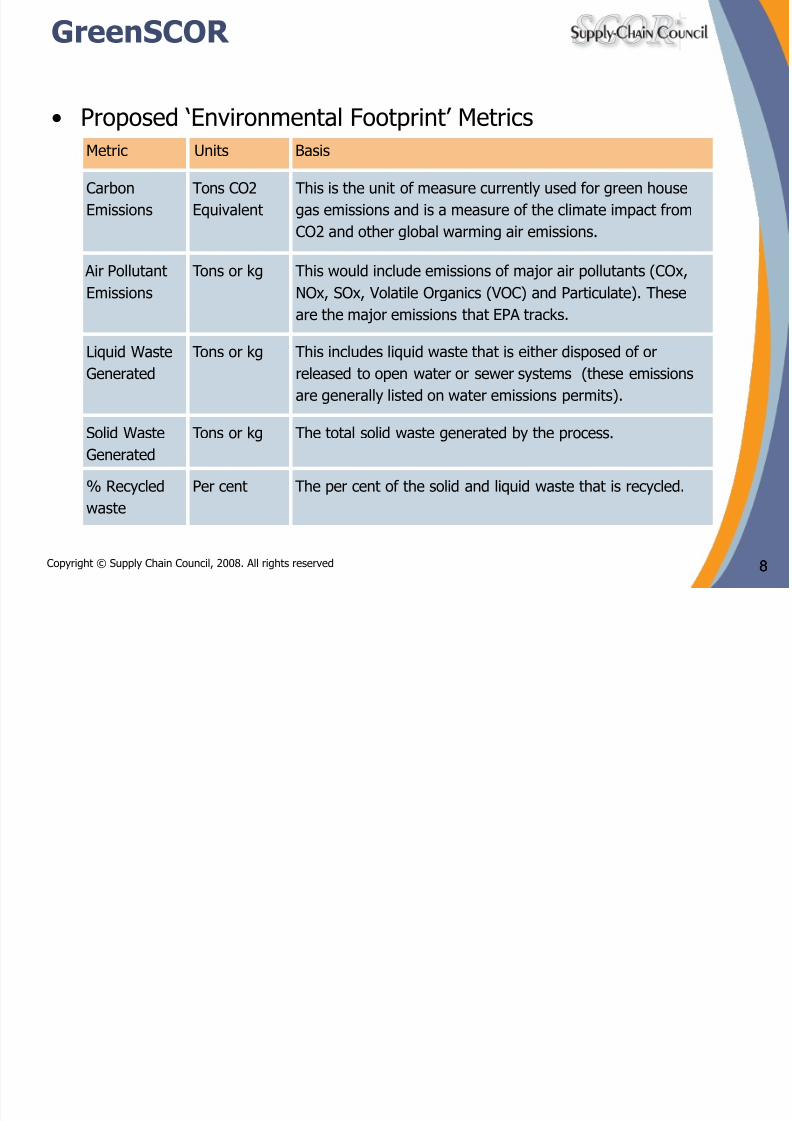
•! Proposed ‘Environmental Footprint’ Metrics
8
Metric Units Basis
Carbon
Emissions
Tons CO2
Equivalent
This is the unit of measure currently used for green house
gas emissions and is a measure of the climate impact from
CO2 and other global warming air emissions.
Air PollutantEmissions
Tons or kg This would include emissions of major air pollutants (COx,NOx, SOx, Volatile Organics (VOC) and Particulate). These
are the major emissions that EPA tracks.
Liquid Waste
Generated
Tons or kg This includes liquid waste that is either disposed of or
released to open water or sewer systems (these emissions
are generally listed on water emissions permits).
Solid Waste
Generated
Tons or kg The total solid waste generated by the process.
% Recycled
waste
Per cent The per cent of the solid and liquid waste that is recycled.

8/14/2019 Scor 8.0 to 9.0
http://slidepdf.com/reader/full/scor-80-to-90 9/14
9Copyright © Supply Chain Council, 2008. All rights reserved
SCOR Risk Management
•! Summary of Changes
1.! New enable processes added (EP.9, ES.9, EM.9, ED.9 and ER.9)
SCOR 8.0 EP.9 and ES.9 processes renumbered to EP.10 and ES.10
2.! New ‘risk management’ metrics added (e.g. Value at Risk and Supply
Chain Mitigation Cost)
3.! New ‘risk’ best practices added
•! Where to find these changes
1.! In the Process section of your reference binder (e.g. page 3.1.54)
2.! Primarily in the Cost metrics (e.g. page 2.4.10)
3.! In the Best Practices chapter (4.3) dedicated to ‘risk’ best practices.
(starting on page 4.3.1)
9

8/14/2019 Scor 8.0 to 9.0
http://slidepdf.com/reader/full/scor-80-to-90 10/14
10Copyright © Supply Chain Council, 2008. All rights reserved
SCOR Risk Management
•! What is It?
•! Supply chain risk management (SCRM) is a means for ensuring
uninterrupted business operations and customer service.
•! Using SCOR as a Risk Management foundation enables:
•! Faster implementation
•! More comprehensive identification of potential risks•! Better application of SCRM best practices
•! Better SCRM coordination with customers, suppliers, and
stakeholders.
•!
Why Should I Care?•! Supply Chain disruptions are a reality: Mattel had massive recall due to
lead content in paint; fuel distribution in the U.S. was disrupted after
hurricane Katrina damaged pipelines. Nokia production shut down due
to supplier plant fire. Kobe earthquake, 9/11, Tsunamis, and more..
10
8/14/2019 Scor 8.0 to 9.0
http://slidepdf.com/reader/full/scor-80-to-90 11/14
11Copyright © Supply Chain Council, 2008. All rights reserved
SCOR Risk Management
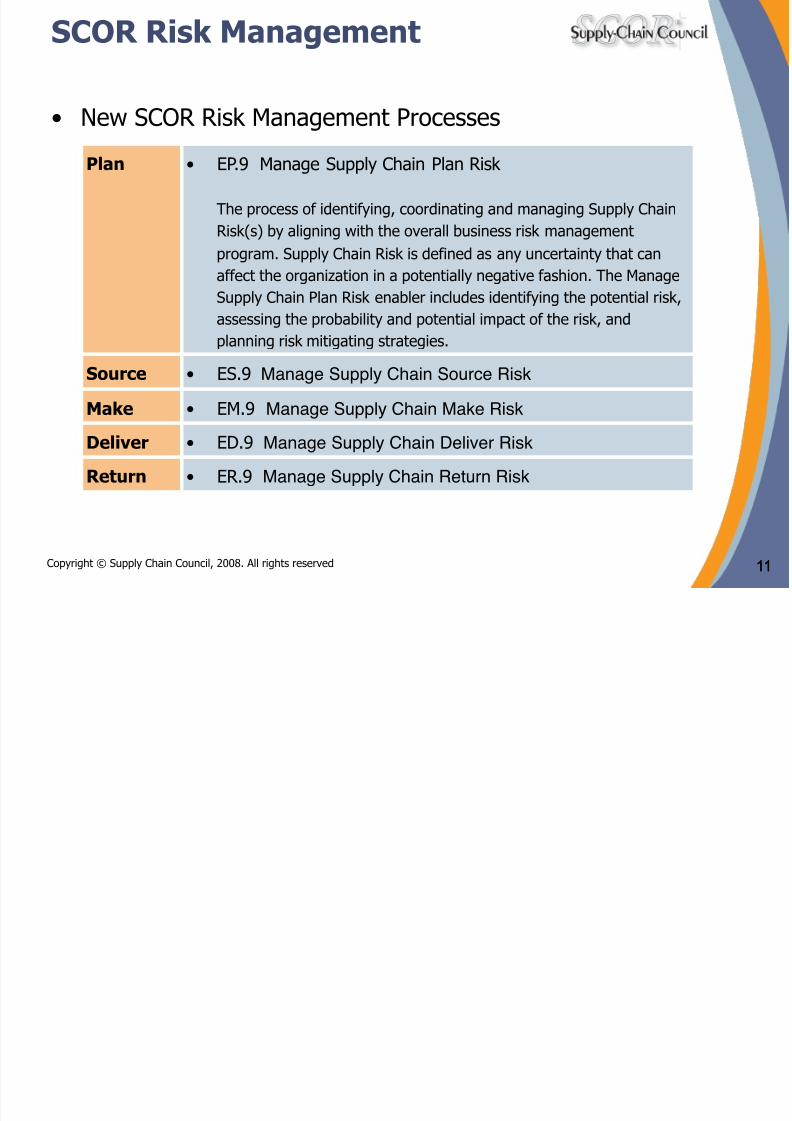
•! New SCOR Risk Management Processes
11
Plan •! EP.9 Manage Supply Chain Plan Risk
The process of identifying, coordinating and managing Supply Chain
Risk(s) by aligning with the overall business risk management
program. Supply Chain Risk is defined as any uncertainty that can
affect the organization in a potentially negative fashion. The ManageSupply Chain Plan Risk enabler includes identifying the potential risk,
assessing the probability and potential impact of the risk, and
planning risk mitigating strategies.
Source •! ES.9 Manage Supply Chain Source Risk"Make •
!EM.9 Manage Supply Chain Make Risk
"Deliver •! ED.9 Manage Supply Chain Deliver Risk"Return •! ER.9 Manage Supply Chain Return Risk"

8/14/2019 Scor 8.0 to 9.0
http://slidepdf.com/reader/full/scor-80-to-90 12/14
12Copyright © Supply Chain Council, 2008. All rights reserved
SCOR Risk Management
•! Example ‘Risk Management’ Metrics
12
Metric Units Definition
Value-At-Risk (VAR) The sum of the probability of risk events times the
monetary impact of the events for all supply chain
functions
Supply Chain Risk Mitigation Cost
The sum of the costs associated with Supply Chain Risk Mitigation
Event Risk (EVAR) The risk (probability X impact) of risk events. i.e. plant
outage, transportation outage, product failure, etc.
Residual Risk The residual (gross – mitigated) risk for a specific area,
supplier, product, etc.

8/14/2019 Scor 8.0 to 9.0
http://slidepdf.com/reader/full/scor-80-to-90 13/14
13Copyright © Supply Chain Council, 2008. All rights reserved
SCOR 8.0 to 9.0 Recap
•! Why do you use SCOR? Two new program types:
•! Managing Environmental Impact
•! Managing Supply Chain Risk
•! SCOR 9.0 added processes, metrics and best practices
•! Processes to enable waste disposition decisions and processes to
manage risk across all functions in the supply chain.
•! Metrics for assessing and benchmarking the total environmental
footprint of the supply chain and metrics for assessing the exposure or
risk.
•! Best Practices for reducing the environmental footprint of the supply
chain and best practices to reduce exposure or risk.
13
8/14/2019 Scor 8.0 to 9.0
http://slidepdf.com/reader/full/scor-80-to-90 14/14
This presentation is the exclusive property of the Supply Chain
Council. Copyright © Supply Chain Council. 2006. All rights reserved.
The marks SCOR®, CCOR™, DCOR™ and SCOR Roadmap™ are the
exclusive property of the Supply Chain Council.
www.supply-chain.org