Embed Size (px)
Citation preview
P a g e | 1
USAID DRC Mini Grids in North Kivu June 30, 2018 USAID Contract #AID-OAA-I-15-00051 / AID-OAA-TO-16-00028 – ESS WA #6 Scope of Work
SCOPE OF WORK FOR A PRE-FEASIBILITY STUDY FOR THE ESTABLISHMENT OF SEVERAL MINI-GRIDS IN NORTH KIVU PROVINCE IN THE DEMOCRATIC REPUBLIC OF THE CONGO (DRC) FINAL REPORT
PEREZ, APC 2525 Burgundy Street New Orleans, LA 70117 Project AID-OAA-I-15-0051 / AID-OAA-TO-16-00028 USAID/ Democratic Republic of the Congo (DRC) Economic Growth Office
June 30, 2018 This publication was produced for review by the United States Agency for International Development. It was prepared by Perez, APC.

P a g e | 2
USAID DRC Mini Grids in North Kivu June 30, 2018 USAID Contract #AID-OAA-I-15-00051 / AID-OAA-TO-16-00028 – ESS WA #6 Scope of Work
FINAL REPORT
SCOPE OF WORK FOR A PRE-FEASIBILITY STUDY FOR THE ESTABLISHMENT OF SEVERAL MINI-GRIDS IN NORTH KIVU PROVINCE IN THE DEMOCRATIC REPUBLIC OF THE CONGO (DRC) This document was produced for review by the United States Agency for International Development. It was prepared by Perez, APC under the Engineering Surge Support Work Assignment #6 for USAID/DRC.
Prepared by:
PEREZ, APC 2525 Burgundy Street New Orleans, LA 70117 CONTACT: Joseph M. Crowley Chief of Party 504.584.5100 [email protected]
DISCLAIMER The author’s views expressed in this publication do not necessarily reflect the views of the United States Agency for International Development or the United States Government.

P a g e | 3
USAID DRC Mini Grids in North Kivu June 30, 2018 USAID Contract #AID-OAA-I-15-00051 / AID-OAA-TO-16-00028 – ESS WA #6 Scope of Work
Table of Contents 1. Executive Summary .......................................................................................................... 5
2. Introduction ....................................................................................................................... 6 3. Overview of the electricity market in population centres in Kivu .......................................... 7 3.1 North Kivu ........................................................................................................................... 7 3.2 South Kivu .......................................................................................................................... 9 3.3 Overview of regulatory structure ......................................................................................... 9
3.4 Electricity demand projections in North and South Kivu .....................................................11
3.4.1 North Kivu ...................................................................................................................12
3.4.2 South Kivu ..................................................................................................................13
3.5 Overview of solar-pv in North and South Kivu ....................................................................13
4 Economic activities in North Kivu (Ndjingala, Walikale Centre and Mubi) ...........................17
5 Demand projection methodology ........................................................................................20
5.1 Mubi population centres analysis .......................................................................................20
5.2 Ndjingala population centres analysis ................................................................................21
5.3 Walikale centre population centre analysis .........................................................................21
5.4 Development prospects .....................................................................................................22
5.5 Justification for using baseline growth scenario as a basis for demand projections ............29
6 Population centre analysis results ......................................................................................29
6.1 Population and customer growth assumptions ...................................................................29
6.2 Financial analysis assumptions ..........................................................................................30
6.3 Mubi ...................................................................................................................................31
6.3.1 Demand projections ....................................................................................................31
6.3.2 Mubi financial analysis ................................................................................................32
6.4 Ndjingala ............................................................................................................................33
6.4.1 Demand projections ....................................................................................................33
6.4.2 Ndjingala Financial analysis ........................................................................................35
6.5 Walikale centre ..................................................................................................................36
6.5.1 Demand projections ....................................................................................................36
6.5.2 Walikale centres financial analysis ..............................................................................38
7 Operators in North and South Kivu.....................................................................................39
8 Technical Considerations ...................................................................................................41
8.1 Photo-voltaic System Considerations .................................................................................41
8.2 Technical Loss Reductions ................................................................................................42
8.3 Distribution System Components .......................................................................................43

P a g e | 4
USAID DRC Mini Grids in North Kivu June 30, 2018 USAID Contract #AID-OAA-I-15-00051 / AID-OAA-TO-16-00028 – ESS WA #6 Scope of Work
8.4 New Generation Platforms .................................................................................................43
8.5 Micro-Grid Automated Controls ..........................................................................................44
8.6 Small Mini-Grid Generation Platforms (</=200kW) .............................................................44
Appendices .............................................................................................................................45 Appendix 1 Population Centres Growth Projections ...........................................................46 Appendix 2 Financial Statement Results ............................................................................49
Appendix 3 Acronyms ........................................................................................................52
Appendix 4 Mubi ................................................................................................................53
Appendix 5 Mubi Power Analysis .......................................................................................56
Appendix 6 Ndjingala Drawings .........................................................................................61
Appendix 7 Ndjingala Power Analysis ................................................................................64
Appendix 8 Walikale Drawings ...........................................................................................69
Appendix 9 Walikale Power Analysis .................................................................................73
Appendix 10 North Kivu Drawings ......................................................................................78

P a g e | 5
USAID DRC Mini Grids in North Kivu June 30, 2018 USAID Contract #AID-OAA-I-15-00051 / AID-OAA-TO-16-00028 – ESS WA #6 Scope of Work
1. Executive Summary
Perez was engaged by the U.S. Agency for International Development (USAID) to identify and gain an understanding of the challenges faced by mini-grid developers, investors, and operators in the Democratic Republic of Congo (DRC). Perez was tasked to conduct a desk review to prepare a plan similar to the Kinshasa Plan for the Provinces of North and South Kivu. The work involved data gathering for example existing, under-construction, and planned power stations and electrical grids; population centers and estimated electric demand; inventoried hydropower opportunities and interconnection projects, evaluation of existing and potential solar pv electric loads and load centers, basic network design at HV and MV level (drawings). USAID also tasked Perez to produce a sequence of 5-year views (2020, 2025, 2030) of the development of these provinces. We reviewed publicly available reports, press articles, and maps to identify the existing and proposed load resources, supply resources, and potential transmission solutions that could improve energy access to the four focus cities/population centers. We also provide a list of potential private-sector investors and an inventory of the private companies currently involved in small-scale energy projects in the DRC. A Perez team visited DRC’s capital Kinshasa (February 10 - 24, 2017) and met with several stakeholders, including Ministry of Electricity and Hydraulics Resources (MEHR), UCM, SNEL, SOCODEE, Alphamin Bisie Mining, Trust Merchant Bank, Virunga, Helios Towers Africa. These meetings provided additional and updated information on current and future projects and plans for DRC’s power sector. The Perez team carried out the demand assessment for Mubi, Ndjingala and Walikale centre under three distinct scenarios of baseline, improved and accelerated connected customer growth projections. Under the baseline scenario, we estimate that 50 percent of the households will be connected by 2030. Under the improved growth scenario, we estimate that 70 percent of the households will be connected by 2030. We also estimate that 90 percent of the households will be connected under the accelerated growth scenario. Based on our assessment, we propose the following conceptual isolated mini-grid solutions to meet the projected peak electricity demand requirements of the towns and improve overall access to electricity through the isolated grids. Solar generation plant and batteries to a population centre are without a grid connection. The population centres are not expected to be connected to the national grid in the foreseeable future. We modelled the development of individual towns to deploy solar pv mini-grids using the baseline scenario: By 2020, the base year for installation is assumed to be 2019 which models the installation of the initial Solar Power Center. The initial installation is assumed as the first-year capital investment and uses the projected load analysis in year 2025. Solar generation is based on providing adequate PV capacity to assume as much load as possible and charge batteries during PV optimal generating conditions, without over producing and wasting energy. Battery installations are based on providing Kwh discharge during peak periods of the day during PV optimal generating charging conditions. The customer power consumption in kWh and demand factors are determined in accordance with the data furnished in this report. There are five sections in this report. The first section presents an overview of the electric power sector in the population centres of North Kivu, with a focus on the existing regulatory structure, existing supply resources and electricity demand trends. The second section presents the demand projections for the three population centers using a bottom-up approach that estimates household electrical appliance wattage and ownership by rural households. We then build the

P a g e | 6
USAID DRC Mini Grids in North Kivu June 30, 2018 USAID Contract #AID-OAA-I-15-00051 / AID-OAA-TO-16-00028 – ESS WA #6 Scope of Work
assumptions for the 3 demand projection scenarios per population centre using the daily load curve for a typical household customer incorporating penetration rates for baseline, improved and accelerated electricity demand scenarios. We then used a standard formula considering the population projection, household energy requirements, and growth in connected household customers at each population centre. In all scenarios we assumed household growth to follow a straight-line trajectory. We assumed that by 2030, the percentage connected households will reach 50% (baseline development), 75% (improved development) and 90% (accelerated development). The final section presents the financial analysis, technical solutions, recommendations and conclusions.
2. Introduction Following years of civil war and reconstruction, the DRC has embarked on an ambitious reform of its power sector. At the heart of the reform is the decision to rely heavily on private sector investment to expand electricity access and drive economic growth. While USAID currently is supporting the DRC through its own Power Sector Reform (PSR) program, which is centered in Kinshasa and is focused on assisting in the establishment of a Regulatory Agency (ARE) and a Rural Electrification Agency (ANSER), USAID wants to supplement its assistance by carrying out select studies to support the identification and definition of specific, feasible private sector investment opportunities. The purpose of this work assignment will be to prepare a study on potential mini-grid projects in the provinces of North and South Kivu located in the eastern DRC. The study will encompass transmission (or sub-transmission), and distribution, and will examine power supply options such as import from Rwanda and local hydropower and solar resources. The DRC’s electricity sector is dominated by a state-owned monopoly Société Nationale d'Electricité (SNEL). Though SNEL controls roughly 94 percent of the DRC’s electricity market, the reach and scale of SNEL’s operations is fairly limited. Less than 10 percent of the DRC’s population has access to electricity, about 30 percent in urban areas and one percent in rural areas. Currently, due to chronic mismanagement and underinvestment, only about 1,300 MWs of SNEL’s 2,442 MWs of installed capacity are available. In addition to the problems outlined above, the DRC’s power sector is overly dependent on relatively large, centralized hydropower projects. A key provision of the Electricity Law of 2014, which allows for the presence of independent power producers, could lead to the end of SNEL’s monopoly of the sector by increasing the number and viability of small-sized hydropower projects, especially in rural areas. While there is skepticism as to whether or not these projects would be able to sustain operations and recover their investments, there have been examples of small-scale hydropower projects being able to cover their operating expenses. This is especially true in cases when donors contributed to part of the base investment. Small-scale hydropower-based concessions are currently operating in Tshikapa and Bunia, where users are willing to pay up to $0.20 per kWh for reliable power, and in North Kivu, where Virunga S.A. is operating two hydropower plants and selling to household consumers at approximately $0.215 per kWh. In Sub-Saharan Africa, power outages have been shown to reduce gross domestic product (GDP) by at least two percent. A more reliable energy supply would improve the provision of social services such as healthcare and education, the agricultural sector, and small-business development, and complements USAID/DRC’s development objectives. A rural electrification agency (ANSER), once operational, will oversee independent power producers in areas where SNEL is not operational. Developing an inventory of viable small-

P a g e | 7
USAID DRC Mini Grids in North Kivu June 30, 2018 USAID Contract #AID-OAA-I-15-00051 / AID-OAA-TO-16-00028 – ESS WA #6 Scope of Work
scale energy projects and mini-grids, this pre-feasibility study will enhance the ability of the newly established ANSER to develop, promote, and attract financing for new energy projects. There are also natural links to USAID’s agricultural activities such as Kivu Value Chains and Development Food Assistance Projects (DFAP), as increased electricity would benefit many aspects of the agricultural supply chain, such as post-harvest processing (including coffee wet mills) and the cold chain for vegetables.
3. Overview of the electricity market in population centres of Kivu
3.1 North Kivu
The province of North Kivu is located in eastern DRC, to the west of Rwanda and Uganda. It covers an area of 59,483 km², of which 20 percent is made up of parks and forest reserves and 11 percent is made up of mountains and lakes. North Kivu is composed of six territories: Nyiragongo, Masisi, Rutshuru, Lubero, Beni and Walikale (table 1). In 2015, Manusco estimates the population of North Kivu and Goma to be 6 million and 800,000 respectively (table 1). This is mainly due an influx of internally displaced people and migration into Goma, the capital with a better security situation and higher economic activity. However, North Kivu is one of the most volatile provinces in DRC due to its complex ethnic composition, porous borders with Rwanda and Uganda, and the continuing presence of foreign and Congolese armed groups. The state authority has made noticeable improvement once the M23 militia group was defeated in November 2013. At national politics level, North Kivu has 47 national MP’s (including 1 female), 4 senators and 3 national ministers. The Governor for North Kivu is Julien Paluku Kahongya. Political institutions in the province are fragile and still growing. In 2015, only 3.75 percent of the energy needs of North Kivu have been met. The socio-economic profile of North Kivu is highlighted in table 1.

P a g e | 8
USAID DRC Mini Grids in North Kivu June 30, 2018 USAID Contract #AID-OAA-I-15-00051 / AID-OAA-TO-16-00028 – ESS WA #6 Scope of Work
Table 1: North Kivu socio-economic profile
Source: https://monusco.unmissions.org/sites/default/files/north_kivu.factsheet.eng_.pdf1
1 https://monusco.unmissions.org/sites/default/files/north_kivu.factsheet.eng_.pdf
North Kivu Data Detailed informationCapital Goma major economic centre with an estimated population of 800,000 (75.72km²)Surface 59,483 km² ~2.5% of the DRC. Almost twice the size of BelgiumPopulation 6 Million 60% live in rural areasLanguages Swahili FrenchTerritories 6 Masisi, Beni, Lubero, Rutshuru, Walikale, Nyiragongo and 5,178 villages
Governor Julien Paluku Kahongya
Provincial (42 MPs with only 1 female MP) is dominated by the PPRD (9 seats), the RCD/UCP (7 seats)and the MSR (5 seats)
National 47 national MPs, 4 Senators and 3 national Ministers
Resources Natural resources
Gold, Diamond, Coltan, Cassiterite, Coltan, Niobium, Wolframite, Iron, Bauxite and Timber
VirungaKahuzi BiegaMaiko
State Admin 23 buildings In urgent need of repair / maintenance
Justice Courts & prisons
1 Court of Appeal and 1 Court of 1st instance; 5 Peace Tribunals; 1 Childrens Court in Goma; 11 prisons3,590 primary schools;1,731 secondary schools149 hospitals; 521 health centres; 119 dispensaries;469 doctors and 4,528 nursesUS$1.1m (2010); 31.7% ~ agriculture, fisheries, mines, and livestock.Agriculture is 30% of exportsFood and drink is 70% of imports80% of activity is in the informal economy5,209km of roads; 5.6% is asphalted; less than 20% are in good condition3.75% of energy needs are met (2010).32% of people are in extreme education poverty;Adult literacy rate is 52.2%Life expectancy is 55 years28% access to safe drinking water
Health FacilitiesStaff
Economy GDP
Social factors Indicators
Virunga National Park
UNESCO World Heritage listed Virunga National Park;Virunga is home to the mountain gorillas, and two active volcanoes;Virunga covers 7,900 km² or more than 10% of the province.
Education Schools
Politics

P a g e | 9
USAID DRC Mini Grids in North Kivu June 30, 2018 USAID Contract #AID-OAA-I-15-00051 / AID-OAA-TO-16-00028 – ESS WA #6 Scope of Work
3.2 South Kivu
Bukavu is one of the highly densely populated places in DRC with an estimated 13,500 inhabitants / km². South Kivu’s economy is dependent on agriculture, mining and trade. The detailed socio-economic profile for South Kivu is on table 2. Table 2: South Kivu socio-economic profile
Source: https://monusco.unmissions.org/sites/default/files/south_kivu_factsheet._eng.pdf2
3.3 Overview of regulatory structure
DRC’s national policy for the electricity sector is developed, approved and implemented by the national Ministry on Electricity and Hydraulic Resources (MRHE). Other ministries that support policymaking in the energy sector are the Ministry of Rural Development, Ministry of Hydrocarbons, Ministry of Environment, Tourism and Nature Conservation. Société nationale d'électricité (SNEL), a state-owned utility enjoys market dominance in the DRC electricity market. SNEL controls at least 50 power plants across DRC, with 36 hydropower plants and 14 thermal power plants. SNEL owns approximately 2,442 MW, an equivalence of 94% of total installed capacity. Other electricity producers are predominantly in the mining industry across DRC, these provide an estimated 135 MW that equates to 6% of installed capacity. A recent
2 https://monusco.unmissions.org/sites/default/files/south_kivu_factsheet._eng.pdf
South Kivu Data Detailed information
Capital Bukavu major economic centre with an estimated population of 806,940 (60km²)one of the most dense towns in DRC @ 13,500 inhabitants/ km²
Surface 65,070 km² ~2.8% of the DRC, twice the size of BelgiumPopulation 4,944,662 (~76 people/km²), 60% live in rural areasLanguages Swahili French (Shi and Lega widely spoken)
Territories 8 Fizi, Idjwi, Kabare, Kalehe, Mwenga, Shabunda, Uvira, Walungu (and Bukavu Town)
Governors Marcelin Cishambo (Governor); Gabriel K. Mbulu (Vice-Governor)
Provincial 36 MPs including 3 women) is dominated by the Presidential Majority (97 % of the seats) Opposition occupy 1 seat
National 32 MPs (2 of them national Ministers)
Resources Natural resources
Gold, Iron, Cassiterite, Coltan, Lime stone, Petrol, Methane gas, Niobium, Columbite-Tantalite, Palm oil, Cinchona, Tea
Nature Vegetation Composed of upland forests, Savannah grasslands, Bamboo woods and dense forests
Justice Courts & prisons
1 Court of Appeal and 2 Court of 1st instance; 9 Peace Tribunals; 1 Childrens Court in Bukavu
Education Schools 21 faculties in BukavuHealth Facilities 20 (including at least 1 in each territory)Economy GDP Agriculture, Mining and Trade
Primary school enrolment: 72.8%Female literacy rates (15 - 24 year olds): 48.3%
Social factors Indicators
Politics

P a g e | 10
USAID DRC Mini Grids in North Kivu June 30, 2018 USAID Contract #AID-OAA-I-15-00051 / AID-OAA-TO-16-00028 – ESS WA #6 Scope of Work
positive development in the energy sector is the DRC Electricity Law of 2014. This new law brokered the implementation of important changes in the DRC’s energy market, resulting in the establishment of Electricity Regulation Authority (ARE), National Rural Electrification Agency (ANSER) and National Electrification Agency National Electrification Fund (FONEL)3. The law facilitated diversification of the energy mix, a focus on energy conservation and efficiency measures, and a 60% increase in the overall national electrification rate. The law also opened the electricity market to independent power producers. The law also allows for concessions for generation, transmission, distribution of electricity within a single administrative province, North Kivu included. Concessions for electricity generation are categorized and priced by size of project as follows:
• less than 1 MW • 1‐5 MW; • 5‐50 MW and; • Greater than 50 MW.
The responsibility of developing renewable energy potential was given to two institutions within MRHE as follows:
• National Services of New Energy (SENEN); and • Technical Support Unit of Energy (CATE).
Figure 1 highlights the existing and potential energy sources for North Kivu and South Kivu. The population figures are from the Manusco compiled by a recent United Nations Manusco reports4’ 5. The average household estimate is taken from the field survey team data and all other information on potential MW, number of sites, installed capacity, available capacity and unmet demand are from the United Nations Development Programme (UNDP) report on the energy potential in DRC provinces. The report estimates the installed electricity capacity to be approximately 9 MW in North Kivu and 80 MW in South Kivu. This is illustrative of the poor state of North Kivu and South Kivu electric power sector infrastructure. The report estimates the unmet demand for electricity for individual provinces using population estimates and a threshold per capita electricity demand (section 3.4).
Figure 1: overview of electricity supply resources in North Kivu and South Kivu
3 https://www.lightingafrica.org/wp-content/uploads/2016/07/27_DRC-FINAL-August-2012-x_LM.pdf 4 https://monusco.unmissions.org/sites/default/files/south_kivu_factsheet._eng.pdf 5 https://monusco.unmissions.org/sites/default/files/north_kivu.factsheet.eng_.pdf
Total Households
North Kivu 6,000,000 1,000,000 332 130.0 8.8 8.8 139.0 South Kivu 4,944,662 824,110 1,197 41.0 79.5 8.5 180.0 Total 10,944,662 1,824,110 1,529 171.0 88.4 17.3 319.0
Region
Population (2015)
Potential MW
Number of potential
sites
Installed Capacity
(MW)
Available Capacity
(MW)
Unmet Demand
(MW)

P a g e | 11
USAID DRC Mini Grids in North Kivu June 30, 2018 USAID Contract #AID-OAA-I-15-00051 / AID-OAA-TO-16-00028 – ESS WA #6 Scope of Work
3.4 Electricity demand projections in North and South Kivu One objective of USAID in commissioning this task-order is to identify solutions that can improve energy access North and South Kivu. Access to energy is the ability to avail energy that is adequate, available when needed, reliable, of good quality, affordable, legal, convenient, healthy & safe, for all required energy services across household, productive and community uses6. The initial threshold level of electricity consumption for rural households is assumed to be 230 kWh/ capita/ year corresponding to a Tier 2 consumption pattern (figure 2). World Bank suggests the use of a five‐tier mechanism to model energy access (table x). The World Bank developed framework is used by some international organisations such as United Nations through the SE4ALL initiative to measure energy access across developing countries. Figure 2: Multi-tier matrix measuring access to household electricity
Source: A New Multi-Tier Approach to Measuring Energy Access7
The population projections for the country are assumed to grow at a rate of 3.5% annually based on the latest World Bank projections. We assume the same growth rate for North Kivu and South Kivu. We also assume a flat population growth rate to 2030, the net impact of movement of internally displaced people is assumed to have a net impact of zero because of the inward and outward migration of people, there might be a population influx in some areas. Also, to project the future demand, we assume an annual load factor of 0.50. This electricity load factor is the average electricity load as a proportion of peak electricity load over a specified time period. A reserve requirement of 1.2 was used as an estimate. We understand North Kivu has 3.75 percent access to energy, we assume this to be the same in South Kivu. Therefore, 96 percent of people in North and South Kivu are without electricity. We therefore use the macro-economic approach formula (figure 3) is used to derive current and forecast future peak system demand, considering the population projection, per capita energy access requirements, load factor, and capacity reserves requirement.
6 http://www.esmap.org/sites/esmap.org/files/DocumentLibrary/Multi-tier%20BBL_Feb19_Final_no%20annex.pdf 7 http://www.esmap.org/sites/esmap.org/files/DocumentLibrary/Multi-tier%20BBL_Feb19_Final_no%20annex.pdf

P a g e | 12
USAID DRC Mini Grids in North Kivu June 30, 2018 USAID Contract #AID-OAA-I-15-00051 / AID-OAA-TO-16-00028 – ESS WA #6 Scope of Work
Figure 3: Current and future electricity demand estimation
The unmet and future demand methodology in the formulae above assumes that electricity consumption is solely dependent on the availability. Whereas the demand projections for smaller towns like Ndjingala, Walikale centre and Mubi use a bottom-up approach that estimates household appliance ownership, appliance penetration rates and demand projection scenarios that are assumed to take a baseline, improved and accelerated development trajectory as shown in sections 4, 5 and 6 of this report. Central to our bottom-up method is an acknowledgement that total electricity consumption is also dependent on the level of economic development within the population centre.
3.4.1 North Kivu North Kivu is a province of about 6 million, Goma the capital has 800,000 people with a population density of 10,565 people / km². The unmet demand of 139 MW and available capacity of 8.8 MW as at 2015. The projected electricity demand for North Kivu is the product of per capita electricity demand and projected population. The projected electricity demand is expected to increase from 2,183,425 MWh in 2015 to 4,081,348 MWh in 2030 (figure 4). The projected peak demand for cities is estimated using a load factor assumption of 0.50 for North Kivu. The projected peak demand for North Kivu is expected to increase from 544 MW in 2015 to 1,017 MW in 2030 (figure 4).
Figure 4: North Kivu current and future unmet demand estimates
Source: http://www.cd.undp.org/content/rdc/en/home/library/environment_energy/atlas‐interactif‐2014.html
Current unmet demand (2015) = (2015 population * % without access to electricity) * 230kwh *1.2 *(Reserves)(24hrs * 365 days) * 1,000 * Load Factor (0.5)
Future demand (20XX) = (20XX population - 2015 population) * 230kwh *1.2 *(Reserves)(24hrs * 365 days) * 1,000 * Load Factor (0.5)
Year Projected population
Unit Per Capita Electricity
Demand (kWh/year)
Projected Electricity
Demand(MWh /year)
Unit/Capita/Day Electricity Demand (kWh)
Projected Peak
Demand(MW)
2015 6,000,000 363.90 2,183,425 1.00 544 2020 7,126,118 393.76 2,805,985 1.08 699 2025 8,463,593 399.36 3,380,057 1.09 842 2030 10,052,093 406.02 4,081,348 1.11 1,017
North Kivu

P a g e | 13
USAID DRC Mini Grids in North Kivu June 30, 2018 USAID Contract #AID-OAA-I-15-00051 / AID-OAA-TO-16-00028 – ESS WA #6 Scope of Work
3.4.2 South Kivu South Kivu is a province of about 5 million, Bukavu the capital has 800,000 people with a population density of 13,500 people / km². Bukavu is one of the populated towns in DRC. The unmet demand of 180 MW and available capacity of 8.5 MW as at 2015. The projected electricity demand for North Kivu is the product of per capita electricity demand and projected population. The projected electricity demand is expected to increase from 1,482,890 MWh in 2015 to 2,771,880 MWh in 2030 (figure 5). The projected peak demand for cities is estimated using a load factor assumption of 0.50 for South Kivu. The projected peak demand for North Kivu is expected to increase from 369 MW in 2015 to 690 MW in 2030 (figure 5). Figure 5: North Kivu current and future unmet demand estimates
Source: http://www.cd.undp.org/content/rdc/en/home/library/environment_energy/atlas‐interactif‐2014.html
3.5 Overview of solar-pv in North and South Kivu The DRC has one of the lowest rates of electrification in the world at just 9%, with 1% in rural areas and 19% in urban areas8. Households without power across DRC are estimated at 15 million. DRC has been experiencing an energy crisis due to the lack of proper investment and management in the energy sector. Approximately 93.6% of the country is highly dependent on wood fuel as main source of energy, which is having severe impacts such as deforestation and land degradation, all this has a negative impact on the environment9. Approximately 67.9 % of DRC’s land area is covered by forest. DRC lost over 2,000 km² of its forest area between 1990 and 2000 as a result of high reliance on wood fuel energy. The situation has worsened, in the current decade, the DRC’s forest area has been reduced by an average of 1,900 km2 annually. Protecting DRC forests is a key opportunity in the fight against climate change; however, this increases the vulnerability of the local impoverished communities, as they rely on the exploitation of the abundant forests as their primary energy source and as a source of income10. The bulk of the electricity produced from poorly maintained hydro and thermal power stations, is principally used to supply the industrial sector, as well as very few urban areas11. There is little or no electricity in most rural villages. The East network (North and South Kivu), is
8 https://www.usaid.gov/powerafrica/democratic-republic-congo 9 https://www.researchgate.net/publication/306380971_A_Review_of_Energy_in_the_Democratic_Republic_of_Congo 10 https://www.researchgate.net/publication/306380971_A_Review_of_Energy_in_the_Democratic_Republic_of_Congo 11 https://www.researchgate.net/publication/306380971_A_Review_of_Energy_in_the_Democratic_Republic_of_Congo
Year Projected population
Unit Per Capita Electricity
Demand (kWh/year)
Projected Electricity
Demand(MWh /year)
Unit/Capita/Day Electricity Demand (kWh)
Projected Peak
Demand(MW)
2015 4,944,662 299.90 1,482,890 0.82 369 2020 5,872,707 324.50 1,905,707 0.89 475 2025 6,974,934 329.12 2,295,592 0.90 572 2030 8,284,034 334.61 2,771,880 0.92 690
South Kivu

P a g e | 14
USAID DRC Mini Grids in North Kivu June 30, 2018 USAID Contract #AID-OAA-I-15-00051 / AID-OAA-TO-16-00028 – ESS WA #6 Scope of Work
interconnected to the networks of Rwanda and Burundi. Local networks not linked to the main grid are used to connect isolated power plants to small remote cities.
There is huge potential for the use of renewable energy technologies to supply small and isolated rural communities at lower costs. However, the lack of proper policy, technological advancements, political and economic instability, low level of awareness and educational background are the main challenges hindering the development, deployment and commercialization of renewable energy systems for distributed power generation in the DRC.
DRC has immense solar resource potential with irradiation levels ranging between 3.25 and 6.0 kWh/m²/day12. This makes installation of photovoltaic systems viable in many parts of the country, as well as the use of thermal solar systems. Currently, there are at least 836 solar power systems, with a total power of 83 kW, located in Equateur (167), Katanga (159), North Kivu (170), the two Kasaï provinces (170), and Bas-Congo (170)13. The potential for further solar development is high.
• Solar power has the potential to be widespread in North Kivu. In the far north of the province, in Beni and Butembo, domestic solar systems are currently supplying electricity to a significant percentage of the population only used for lighting and basic electric devices, such as TV, video or music players, as well as to charge phones and back-up batteries14.
• New enterprises offering complete equipment with installation are emerging in areas where potential consumers are concentrated.
• Solar power can offer reliable electricity with low maintenance if the equipment is meant for this purpose. Small solar devices, like solar lanterns, also have a lot of potential in the North Kivu region. Affordable prices, from USD 20 to USD 30 with appropriate payment methods, are important for their success15.
• These technologies are also more likely to be disseminated in rural zones and to increase security in IDP camps. Having light at night means being able to study during hours of darkness, and less risk at night, ability to power school computer systems or refrigerate lifesaving medication and shops can stay open longer.
Alternative energy initiatives have been tested throughout North Kivu – mostly in IDP camps and rural zones – with low-density biomass briquettes, which are intended to alleviate urgent needs for cooking fuel. It is time for the government to create enabling conditions so that the private sector can play an important role in helping to close the energy access gap in DRC. This study will focus on the potential to deploy mini-grid solar pv technologies in North Kivu’s, Walikale territory, population centres of Walikale centre, Mubi and Ndjingala (figure 6) where households do not have access to the SNEL national grid. There is potential to replace kerosene with solar lamps, while solar water purification systems can help to decrease deforestation as boiling water before drinking would no longer be necessary, solar mini-grid power is can also be used for guaranteed lighting, food processing and packaging as operating
12 http://www.acp-cd4cdm.org/media/366216/emissions-reduction-profile-dr_congo.pdf 13 http://www.acp-cd4cdm.org/media/366216/emissions-reduction-profile-dr_congo.pdf 14 https://www.womensrefugeecommission.org/images/zdocs/Cooking-in-the-Congo-North-Kivu-Tech-Assess.pdf 15 https://www.womensrefugeecommission.org/images/zdocs/Cooking-in-the-Congo-North-Kivu-Tech-Assess.pdf

P a g e | 15
USAID DRC Mini Grids in North Kivu June 30, 2018 USAID Contract #AID-OAA-I-15-00051 / AID-OAA-TO-16-00028 – ESS WA #6 Scope of Work
costs are low. A mini-grid system can also have potential to support light industries and small-medium-sized enterprises (SME’s) like milling, welding and sewing.

P a g e | 16
USAID DRC Mini Grids in North Kivu June 30, 2018 USAID Contract #AID-OAA-I-15-00051 / AID-OAA-TO-16-00028 – ESS WA #6 Scope of Work
Figure 6: Map of Walikale Territory showing Mubi, Ndjingala and Walikale
Source: Bisie. A one-year snapshot of the DRC’s principal cassiterite mine (Wimmer & Hilgert, 2011)16
16 https://ipisresearch.be/wp-content/uploads/2011/11/20111128__Bisie_FHilgert_SZingg.pdf

P a g e | 17
USAID DRC Mini Grids in North Kivu June 30, 2018 USAID Contract #AID-OAA-I-15-00051 / AID-OAA-TO-16-00028 – ESS WA #6 Scope of Work
4 Economic activities in North Kivu (Mubi, Ndjingala, Walikale Centre) To develop demand projections of the North Kivu population centres of Mubi, Ndjingala and Walikale centre we start of by assessing the key socio-economic activities. Walikale territory is rich in many mineral ores including cassiterite, gold, wolframite, coltan, diamonds, and bauxite. Its terrain is mountainous and mostly covered with forest. There are no passable roads leading from Goma to Walikale. The only way of getting to Walikale from Goma is by cargo plane that goes to Kilambo where it lands on a stretch of asphalt road. The planes transport food and other necessities to Walikale territory and cassiterite back to Goma. Mubi is located 30 km from Walikale centre on the N3 highway. Ndjingala is located roughly 17km from Mubi on the N3 highway. Figure 1 shows the map of North Kivu, Walikale territory (Walikale centre, Mubi and Ndjingala). The economic activities and development prospects of each population centre of Walikale centre, Mubi and Ndjinagala are assessed through the lenses of security challenges, employment prospects, artisanal mining, lack of infrastructure, access to finance and education. An assessment of the economic activities will form the basis to establish development scenarios of baseline, improved and accelerated.
Security challenges Solidarités International surveyed 6 artisanal mining communities in Walikale territory namely Mubi, Walikale Centre, Ndjingala, Banamutabira, Banamatumo, and Banabuhini/Kibua17. Survey results revealed that local communities rated high levels of insecurity as the main reason for continued growth of poverty levels.
• Insecurity was noted to have a negative impact on movement of goods, services and community access to markets.
• As more distant markets become inaccessible, the sale of goods is only restricted to local outlets, which restricts farm production and constrain economic activity.
• Insecurity also limits communities access to their fields also affects the volumes of agricultural goods produced.
• Reduced access to fields combined with an increased demand for available agricultural produce dilutes the purchasing power of residents resulting in higher food prices up on the few local markets.
• For instance, Walikale used to be a major supplier of agricultural products, but now imports its staple food18.
• Population displacement and access to land and markets contribute to the sustained poverty and endured hardships in the Kivu local communities.
• Raids and communal clashes between armed groups in Walikale and Lubero territories forced nearly 373,000 people to flee their homes, making up 42 per cent of the province’s displaced population at the end of 201619.
• Communities in Walikale region experience waves of displaced people from time to time resulting in households that live in unacceptable circumstances. Displaced populations typically have limited access to land and can suffer from malnutrition.
• Presence of displaced populations places immense pressure on host communities that are already grappling with the challenges of daily life in the Walikale territory.
• As a result, displaced populations are typically hired for casual daily work, an unpredictable and poorly paid form of employment.
17 https://www.globalwitness.org/en/archive/artisanal-mining-communities-eastern-drc-seven-baseline-studies-kivus/ 18 https://www.odi.org/sites/odi.org.uk/files/odi-assets/publications-opinion-files/7717.pdf 19 https://www.nrc.no/dr-congo-crisis-sees-highest-global-internal-displacement

P a g e | 18
USAID DRC Mini Grids in North Kivu June 30, 2018 USAID Contract #AID-OAA-I-15-00051 / AID-OAA-TO-16-00028 – ESS WA #6 Scope of Work
• The identified challenges of insecurity, limited access to agricultural fields, weakness of market linkages and inefficient marketing as main impediments to agricultural growth, noting also that crops yield, and livestock production remained low because of reliance on traditional methods.
• The road is one of the main sources of illicit financing of various state and non-state armed actors, which translates into the presence of roadblocks along them. In exchange for the taxes, which sustain their operational presence, the armed actors provide some form of protection in return.
Employment prospects In Walikale, Ndjingala and Mubi, there are very few alternative employment opportunities exist, and the artisanal mining sector proves to be an important motor for trade. Leaving sufficient room for artisanal mining and trade to continue is the right way forward20.
• Walikale territory communities derive household revenue from a wide portfolio of sources including agriculture, mining, commerce, fishing, mineral transportation and other paid daily work.
• Walikale area has an average daily income of around 1 USD compared to the national average of 2 to 2.5 USD per day for a household in a similar community21.
• The trading town of Ndjingala has 47 percent of households that depend on daily agricultural work compared to a majority of households in Walikale centre.
• Despite the persistent security and displacement challenges, farming is considered a more reliable source of income than the volatile revenues generated by artisanal mining and trading business.
• The armed groups operating in the area help themselves to food cultivated by local households.
Artisanal mining As alternative employment opportunities are lacking in many areas, people are obliged to continue digging, despite the lower revenues22.
• The local community in Walikale territory complained that exploration works have always been carried out without their involvement and buy-in hence they are reduced to being by-standers while resources are being extracted without locals’ direct benefit.
• Locals are concerned that companies reserve for itself the exploitation of the whole area, denying the local community any space on which to engage in artisanal mining.
• Artisanal mining reflects the complexity of the issues. The absence of mining activities is said to favour enrollment by young people into armed groups. However, it has also been argued that resuming mining activities attracts armed groups in need of funding23.
• Mining income is mainly generated by artisanal miners from extracting tin, tantalum and tungsten but there is no investment and development at community level because of limited tangible incentives for traders to invest in local infrastructure.
• The bulk of artisanal mining profits are invested in the provincial capitals or abroad. • Miners are typically geographically mobile and in some mines the majority of diggers
have come from other provinces to find work.
20 https://www.globalwitness.org/en/archive/artisanal-mining-communities-eastern-drc-seven-baseline-studies-kivus/ 21 https://www.globalwitness.org/en/archive/artisanal-mining-communities-eastern-drc-seven-baseline-studies-kivus/ 22 https://www.globalwitness.org/en/archive/artisanal-mining-communities-eastern-drc-seven-baseline-studies-kivus/ 23 https://reliefweb.int/report/democratic-republic-congo/drc-walikale-territory-largely-inaccessible-dire-need-aid

P a g e | 19
USAID DRC Mini Grids in North Kivu June 30, 2018 USAID Contract #AID-OAA-I-15-00051 / AID-OAA-TO-16-00028 – ESS WA #6 Scope of Work
Lack of infrastructure / poor connectivity Walikale territory holds many mining sites that are isolated forest enclaves, and infrastructure in the territory is limited. This lack of infrastructure and limited accessibility means that public services are almost non-existent other than in the repressive form of the police and the military24.
• Infrastructure weaknesses, particularly roads and power, are also cited as difficult impediments.
• Infrastructure investments are, however, needed to implement this measure smoothly, as logistical problems are currently making the re-routing quite expensive for local stakeholders, especially in Walikale remote territories.
• There are armed active armed groups in the Kivu’s that continue to fight for control over mineral-rich areas.
• Lack of infrastructure makes it harder to establish state authority. • Without security and an ability to rid the mines of armed groups, communities remain
isolated and possibilities for economic development are extremely weakened. • Road infrastructure in Walikale territory is disastrous and worsen the isolation of some
communities. • The absence of trade routes does not allow some population to have access to local
markets, and therefore to sell their products and buy the products they need. • Not only does it provoke malnutrition and poor diets in remote regions, but it is also at
the origin of food prices raise. Access to finance Access to finance is also regarded as a serious impediment to development of trade and microenterprise start-ups. There are no banks or micro-finance institutions in the three population centres of Walikale centre, Mubi and Ndjingala. The result is that small businesses are not able to purchase equipment needed to expand production and consumers’ acquisition of appliances is limited to rates supported by domestic savings. Facilitating access to finance would directly stimulate economic activity in the local economies, support employment growth, accelerate poverty reduction, thereby generating considerable additional economic net benefits. Education Parents in the Walikale territory are forced to choose which of their children will go to school, as they do not have the resources to pay for all. Only a third of miners’ children are able to receive an education. Schooling expenses currently represent an important part of the family budget25. Despite the end of violent confrontations, and the return of a more peaceful state in numerous areas, the situation in Walikale territory remains volatile and filled with suspicion. Over the last year, however, several areas have witnessed a progressive increase in mineral trade and production. Consequently, the socio-economic situation has been gradually improving in these areas. This revival has often been due to the implementation of very concrete initiatives, especially tagging, but also, for example, the creation of centre de négoce. 24 Cuvelier J., The complexity of resource governance in a context of state fragility: he case of eastern DRC, IPIS/International Alert, November 2010, see Chapter 4 25 Cuvelier J., The complexity of resource governance in a context of state fragility: he case of eastern DRC, IPIS/International Alert, November 2010, see Chapter 4

P a g e | 20
USAID DRC Mini Grids in North Kivu June 30, 2018 USAID Contract #AID-OAA-I-15-00051 / AID-OAA-TO-16-00028 – ESS WA #6 Scope of Work
5 Demand projection methodology
5.1 Mubi population centres analysis Figure 7: Mubi field trip and other findings
Mubi overview
• Mubi is situated 30km to the North West of Walikale and is connected by an un-asphalted road, the Lowa river is approximately 3 km from the town.
• Mubi has an active commercial centre with a similar size to Walikale • Mubi has a population of approximately 32,839 people. • There is only one unmonitored water spring available to serve the entire population. • Mubi commercial centre serves several mines and has a population that depends on
agriculture, mining, and livestock rearing. • Mubi supplies nearby towns and villages with agricultural goods and is a place of
economic exchange for manufactured goods arriving from the large towns of Kisangani, Butembo and Goma26.
• Mubi food supplies are usually plentiful when the security situation is stable; however, because of closer proximity to mines, prices are usually slightly higher than in Walikale.
Mubi Access to Power:
• SNEL is nonexistent. • An inventory of ten generators in use and a few solar panels • Diesel consumption – average 30 liters for all generators per day • 2 IPP’s are supplying energy from generators to about 100 users • Customer base includes households, small businesses and shops at an average daily
rate of CDF1500 ($1). • Supply times from 08:00 to 16:00; and from 18:00 to 22:00, a total of 12 hours per day.
Mubi Existing Infrastructure:
• Hospital, schools, offices (Government and NGO), small industry (welding posts, auto repair shop, woodworking), police station, hotels, market, church mission, residential (all are operating on generators and solar panels).
• A dozen manually powered palm oil press units supplied by ABM Lowa Foundation.
26 https://www.globalwitness.org/en/archive/artisanal-mining-communities-eastern-drc-seven-baseline-studies-kivus/
Current electricity demand / supply
SNEL Existing Technology
Day supply time
Night supply time
Total supply (hrs)
Diesel use
(litres)
Customer base Population
Average Household
size
Average daily rate
(US$)
Mubi Non-existant Solar/Diesel 08:00-16:00 18:00-22:00 12 30 100 32,839 6 1

P a g e | 21
USAID DRC Mini Grids in North Kivu June 30, 2018 USAID Contract #AID-OAA-I-15-00051 / AID-OAA-TO-16-00028 – ESS WA #6 Scope of Work
5.2 Ndjingala population centres analysis Figure 8: Ndjingala field trip and other findings
Ndjingala overview
• Ndjingala is smaller than Walikale and Mubi with approximately 11,109 people. The average size of each household is 6 people;
• Ndjingala is situated 60km to the North West of Walikale and is connected by an un-asphalted road;
• Ndjingala is also one of the main access points to the Bisie mining sites as it is connected to them by a 30km footpath;
• Principal source of income is artisanal mining; Ndjingala Access to Power:
• SNEL is nonexistent. • An inventory of ten generators in use and a few solar panels • Diesel consumption – average 30 liters for all generators per day • Two Independent Power Providers are supplying energy from generators to about 50
users • Customer base includes households, small businesses and shops at an average daily
rate of CDF1500 ($1). • Supply times from 08:00 to 16:00; and from 18:00 to 22:00, a total of 12 hours per day.
Ndjingala Existing Infrastructure:
• Hospital, schools, offices (Government), hotels, church mission, residential (operating on generators and solar panels).
• A dozen manually powered palm oil press units supplied by ABM Lowa Foundation.
5.3 Walikale centre population centre analysis
Figure 9: Walikale centre field trip and other findings
Current electricity demand / supply
SNEL Existing Technology
Day supply time
Night supply time
Total supply (hrs)
Diesel use
(litres)
Customer base Population
Average Household
size
Average daily rate
(US$)
Ndjingala Non-existant Solar/Diesel 08:00-16:00 18:00-22:00 12 30 50 11,109 6 1
Current electricity demand / supply
SNEL Existing Technology
Day supply time
Night supply time
Total supply (hrs)
Diesel use
(litres)
Customer base Population
Average Household
size
Average daily rate
(US$)
Walikale Non-existant Solar / Diesel 08:00-16:00 18:00-22:00 12 30 200 30,286 6 1

P a g e | 22
USAID DRC Mini Grids in North Kivu June 30, 2018 USAID Contract #AID-OAA-I-15-00051 / AID-OAA-TO-16-00028 – ESS WA #6 Scope of Work
Walikale centre overview
• Estimated population of Walikale center is 30,286. The average size of each household is 6 people;
• Majority of households in Walikale centre depend on daily agricultural work; • Walikale centre has more small industry for soap manufacturing, cassava and rice
millers, welding posts, auto repair shop, woodworking compared to Mubi and Ndjingala; • Farming was considered a more reliable source of income than the ‘inconsistent’
revenues generated by mining and business, established trade in cash crops; • There is an established food market in Walikale compared to Mubi and Ndjinagala;
Walikale centre Access to Power:
• SNEL is nonexistent. • An inventory of ten generators in use and a few solar panels; • Diesel consumption – average 30 liters for all generators per day • Two-Three Independent Power Providers are supplying energy from generators to +/-
200 users; • Customer base includes households, small businesses and shops at an average daily
rate of CDF1500 ($1). • Supply times from 08:00 to 16:00; and from 18:00 to 22:00, a total of 12 hours per day.
Walikale Existing Infrastructure:
• Diesel generators and solar panels are used by the following potential mini-grid customers:
o Residential / households o Hospital, schools, offices (Government, and NGO’s), small industry for soap
manufacturing, cassava and rice millers, welding posts, auto repair shop, woodworking and cabinet-making;
o Walikale centre civil court, prison, police station, military base, water supply station (using gravity only), hotels, public stage, market, radio stations, church mission);
• A dozen manually powered palm oil press units supplied by ABM Lowa Foundation.
5.4 Development prospects This section summarises three feasible economic scenarios of baseline development; improved development and accelerated development for Mubi, Ndjingala and Walikale central. Each of the scenarios is feasible but has been constrained by the rate at which practical new initiatives could be implemented. The sections that follow summarize the main characteristics of the three economic scenarios, identifying particular growth triggers and persistent constraints. These

P a g e | 23
USAID DRC Mini Grids in North Kivu June 30, 2018 USAID Contract #AID-OAA-I-15-00051 / AID-OAA-TO-16-00028 – ESS WA #6 Scope of Work
plausible economic futures have then been used to identify the main drivers of increases in power demands on the concerned isolated grid. Baseline economic development – This scenario depicts continuation of the town economy in its present structure, though taking account of the impact on growth of any on-going improvements.
Improved economic development – This scenario depicts a trajectory of economic development in which the district commences activities such as agro-processing which add value to its existing commodity outputs and the value of ‘exports’ from the district.
Accelerated economic development – This scenario depicts an enhanced trajectory of economic development. It incorporates the advanced techniques in agro-processing, mining or tourism benefits. Additionally, the scenario postulates commencement of major initiatives.
Main features of the baseline economic scenario are:
• Development of tin production from the Alpha Bisie Mine with production and the associated employment prospects.
• Continued growth of a regulated artisanal mining industry with better access to markets. • Moderately strong establishment and development of SMEs serving the minerals sector,
and ancillary microenterprises. • Internally displaced people (IDP’s) start returning to their homes, community stability is
expected and associated population growth. • Basic stability and certainty of security issues and gradual improvements in the
community settlement structures with improved access to land and daily access to fields. • Development of trade in cash crops, with improved road links that dramatically lower
transport costs and providing all weather access. • Strong development of agro-processing and light manufacturing microenterprises in the
in Walikale central area. • Serious constraints on access to finance are eased considerably, driven by the business
needs of the developing minerals sector and related suppliers and microenterprises. The agriculture and meat processing enterprises also benefit correspondingly.
• Implementation of agricultural extension programs gradually improves yields of both cash crops (sweet potato, yam, coffee, cocoa, bananas, palm oil, cotton) and food crops (cassava, beans, potatoes, rice, wheat, vegetables, sorghum, millet) though yields remain relatively low. Livestock i.e., cattle, goats, poultry are produced in a moderately secure and predictable environment. Production increases improve modestly over trend.
Baseline scenario - drivers of growth in power demand
• Population and numbers of households increase well above the historical trend rate, reflecting much stronger trade in cash crops and livestock and development of mining.
• Agricultural value-chains begin to formalise as processing bottlenecks gradually ease.

P a g e | 24
USAID DRC Mini Grids in North Kivu June 30, 2018 USAID Contract #AID-OAA-I-15-00051 / AID-OAA-TO-16-00028 – ESS WA #6 Scope of Work
• Average household size increases gradually as migration into Walikale quickens in response to improved employment opportunities.
• Improving agricultural and livestock trade lift household income significantly above trend. • The growing numbers of households, rising household income and demand for electricity
grows strongly. Acquisition of electrical appliances also follows trend. • A gradual increase in new electricity customers because of faster appliance acquisition.
There is a modest decline of load factor associated with household demand from cooking and water heating.
• Household demand for power is estimated at 84% of the total projected power demand; • Commercial power demand is estimated at 16% of the total projected power demand; • Commercial power demand increases following trend, driven by new agro-processing
microenterprises welding and carpentry trades driven by a growing construction industry. • Average load (kW) per commercial customer is assumed grow as the distance from
Bisie mine increases. Based on the field trip survey notes27, the level of agricultural activity and food processing is highest in Walikale centre, followed by Mubi and then Ndjingala. We therefore estimate the following:
o Walikale – 2.5 kW / commercial customer; o Mubi – 2.00 kW / commercial customer; o Ndjingala - 1.00 / commercial customer.
Main features of improved economic development
This scenario depicts a trajectory of faster development driven by strong expansion of mining and rapid development of trade in cash crops, transported by reliable road links. Main features of the scenario are:
• Artisanal miners tin production increases 10% annually. Corresponding strong growth of SMEs and microenterprises associated with the minerals sector.
• Improved trade links with Burundi, Rwanda, Tanzania and Uganda will open new markets for food and cash crops, processed or unprocessed.
• Rollout of agricultural extension programs gradually improves yields of both cash crops (tobacco, groundnuts, sunflower seeds) and food crops, though yields remain relatively low. Production increases improve modestly over trend.
• Improvements in animal husbandry also improve modestly over trend. Trade in livestock strengthens considerably by trade links to Goma, Rwanda, Tanzania, Uganda, Burundi and Tanzania.
• Slow improvement to livestock production and quality from better infrastructure and gradual introduction of improved cattle breeds, but with the latter being insufficient to establish a hide’s industry.
• Rollout of agricultural extension programs gradually improves yields of both cash crops (tobacco, groundnuts, sunflower seeds) and food crops, though yields remain relatively low. Production increases improve modestly over trend.
27 Trip Report DRC Technical Team Survey

P a g e | 25
USAID DRC Mini Grids in North Kivu June 30, 2018 USAID Contract #AID-OAA-I-15-00051 / AID-OAA-TO-16-00028 – ESS WA #6 Scope of Work
Improved scenario - drivers of growth in power demand
• Population and numbers of households increase 20% more quickly than the baseline development scenario, reflecting the employment opportunities present by the faster development of mining and its ancillary services and stronger trade in cash crops and livestock.
• Average household size is at the same rate as in the baseline development scenario. • Household income increases are 20% higher than the baseline development scenario.
Households’ acquisition of electrical appliances is similarly 20% higher. • Power consumption per household increases at 30% above trend rates because of
faster appliance acquisition. There is a significant decline of load factor associated with household demand from cooking.
• Commercial power demand increases in line with population growth in the baseline development scenario.
Main features of accelerated economic development This highly positive scenario postulates the ‘take off’ of the Walikale economy, spurred by rapid development of the minerals sector but also incorporating significant additional source of growth. In addition to developments incorporated in the improved scenario the postulated trajectory of accelerated development incorporates the following main features: • Stronger increase in minerals production. Increases average 25% annually with
corresponding faster development of SMEs and microenterprises associated with minerals services and processing.
• Faster development of the minerals sector and the emerging services sector facilitated an improved road link to regional markets to stimulate a local financial services sector. This accelerates development of light industry, agro-processing and a meat industry.
• Faster introduction of improved cattle breeds and substantial removal of access to finance constraints enables commencement of a hides and leather industry trading shoes, garments and other leather items.
• The District launches an initiative to leverage tourism, in the Kahuzi-Biega National Park and regional game reserves. An establishing service sector in Walikale leads to development of significant tourism-related backward linkages, providing further growth to the local economy.
Accelerated scenario - drivers of growth in power demand
• Population and numbers of households increase 20% more quickly than the improved development scenario, reflecting the employment opportunities present by the faster development of mining, development of tourism and commerce.
• Average household size increases at the same rate as in the improved development scenario.
• Household income increases are 25% higher than the improved development scenario. • Households’ acquisition of electrical appliances is similarly 25% higher.

P a g e | 26
USAID DRC Mini Grids in North Kivu June 30, 2018 USAID Contract #AID-OAA-I-15-00051 / AID-OAA-TO-16-00028 – ESS WA #6 Scope of Work
• Faster growth in numbers of households, household income and accelerated roll out of distribution lines in Walikale result in the numbers of new households connected to the mini-grid system increasing at 50% above trend rates.
• Power consumption per household increases at 50% above trend rates because of faster appliance acquisition. There is a significant decline of load factor associated with household demand from cooking. Commercial power demand increases 50% more quickly than in the improved development scenario.

P a g e | 27
Figure 10: Demand projection assumptions – households and commercial
A Timing AssumptionsPeriod Timing Base Forecast Forecast Forecast Forecast Forecast Forecast Forecast ForecastFinancial Year Ending 2017 2018 2019 2020 2021 2022 2023 2024 2025
A. 1 Population growth forecast 3.50% 3.50% 3.50% 3.50% 3.50% 3.50% 3.50% 3.50% 3.50%Source: https://assets.publishing.service.gov.uk/media/5acf179be5274a76c13df8e0/wp-201712.pdf
A.2 Days / year 365A.3 Hours / day 24A.4 1MW in Kw 1,000A.5 Commercial demand for electricity (09:00 - 18:00) 10
B Percentage of Commercial Electricity consumption as % of ∑ Consumption:[B.1] Original [B.2] Revised
DRC Electricity Consumption for Industry 55%DRC Electricity Consumption for Households 38% 84%DRC Electricity Consumption for Commercial / Public Services 7% 16%Total 100% 100%
B.1 [Original] Source: USAID Conceptual Plan for Enhancing Transmission Infrastructure to Expand Electricity Access in DRC
B.2 [Revised] Industrial electricity is mainly consumed by mining customers whose electricity demands will not be supported by the mini-grids. Electricity demand has been modelled on residential and commercial demand based on the revised anticipated demand by customer type.
C Current electricity demand / supplyDay supply
timeNight supply
timeTotal supply
(hrs)Diesel use
(litres)Customer
base Population
Household size
Average daily rate
(US$)
Average load (Kw) /
commercial customer
Walikale 08:00-16:00 18:00-22:00 12 30 200 30,286 6 1.00 2.50 Mubi 08:00-16:00 18:00-22:00 12 30 100 32,839 6 1.00 2.00 Ndjingala 08:00-16:00 18:00-22:00 12 30 50 11,109 6 1.00 1.00 Source: Trip Report DRC Technical Team Survey (2018)Average load per commercial customer is assumeed grow with distance from Bisie mine - where there is likely to be higher potential for agro-processing
P a g e | 28
USAID DRC Mini Grids in North Kivu June 30, 2018 USAID Contract #AID-OAA-I-15-00051 / AID-OAA-TO-16-00028 – ESS WA #6 Scope of Work
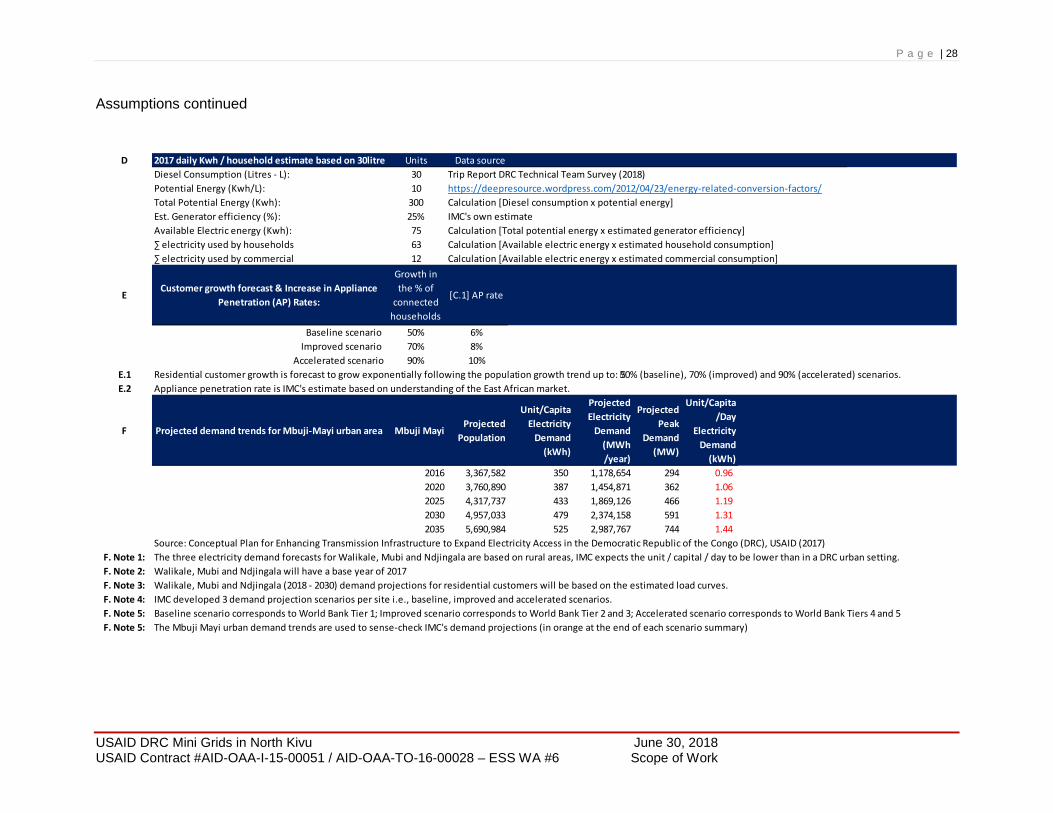
Assumptions continued
D 2017 daily Kwh / household estimate based on 30litres Units Data sourceDiesel Consumption (Litres - L): 30 Trip Report DRC Technical Team Survey (2018)Potential Energy (Kwh/L): 10 https://deepresource.wordpress.com/2012/04/23/energy-related-conversion-factors/Total Potential Energy (Kwh): 300 Calculation [Diesel consumption x potential energy]Est. Generator efficiency (%): 25% IMC's own estimateAvailable Electric energy (Kwh): 75 Calculation [Total potential energy x estimated generator efficiency]∑ electricity used by households 63 Calculation [Available electric energy x estimated household consumption]∑ electricity used by commercial 12 Calculation [Available electric energy x estimated commercial consumption]
ECustomer growth forecast & Increase in Appliance
Penetration (AP) Rates:
Growth in the % of
connected households
[C.1] AP rate
Baseline scenario 50% 6%Improved scenario 70% 8%
Accelerated scenario 90% 10%E.1 Residential customer growth is forecast to grow exponentially following the population growth trend up to: 50% (baseline), 70% (improved) and 90% (accelerated) scenarios.E.2 Appliance penetration rate is IMC's estimate based on understanding of the East African market.
F Projected demand trends for Mbuji‐Mayi urban area Mbuji MayiProjected
Population
Unit/CapitaElectricity
Demand(kWh)
Projected Electricity
Demand(MWh /year)
Projected Peak
Demand(MW)
Unit/Capita/Day
Electricity Demand
(kWh)2016 3,367,582 350 1,178,654 294 0.96 2020 3,760,890 387 1,454,871 362 1.06 2025 4,317,737 433 1,869,126 466 1.19 2030 4,957,033 479 2,374,158 591 1.31 2035 5,690,984 525 2,987,767 744 1.44
Source: Conceptual Plan for Enhancing Transmission Infrastructure to Expand Electricity Access in the Democratic Republic of the Congo (DRC), USAID (2017)F. Note 1: The three electricity demand forecasts for Walikale, Mubi and Ndjingala are based on rural areas, IMC expects the unit / capital / day to be lower than in a DRC urban setting.F. Note 2: Walikale, Mubi and Ndjingala will have a base year of 2017F. Note 3: Walikale, Mubi and Ndjingala (2018 - 2030) demand projections for residential customers will be based on the estimated load curves.F. Note 4: IMC developed 3 demand projection scenarios per site i.e., baseline, improved and accelerated scenarios.F. Note 5: Baseline scenario corresponds to World Bank Tier 1; Improved scenario corresponds to World Bank Tier 2 and 3; Accelerated scenario corresponds to World Bank Tiers 4 and 5F. Note 5: The Mbuji Mayi urban demand trends are used to sense-check IMC's demand projections (in orange at the end of each scenario summary)

P a g e | 29
USAID DRC Mini Grids in North Kivu June 30, 2018 USAID Contract #AID-OAA-I-15-00051 / AID-OAA-TO-16-00028 – ESS WA #6 Scope of Work
5.5 Justification for using baseline growth scenario as a basis for demand projections
There is no SNEL operations in Mubi, Ndjingala and Walikale centre. Only a few diesel generators and home solar systems with battery backup are used to power households. Ndjinagala, Mubi and Walikale centre insecurity was noted to have a negative impact on movement of goods, services and community access to markets. However, there is willingness to pay for households to get access to electricity. There are concerns about mini-grid projects if they would be able to sustain operations and recover their investments. However, there have been examples of small-scale hydropower projects being able to cover their operating expenses. This is especially true in cases when donors contributed to part of the base investment. The survey team estimated the following: • In Ndjingala, there are 2 IPP’s supplying energy from generators to about 56 customers. • In Walikale centre, there are 2-3 IPP’s supplying energy from generators to nearly 202
customers. • In Mubi, there are 2 IPP’s supplying energy from generators to about 100 customers. Given that the population centres under assessment have experienced long periods of instability we take a conservative approach to the projected growth in customer demand. We therefore assume that all local economies will follow a baseline growth trajectory.
6 Population centre analysis results
6.1 Population and customer growth assumptions The demand projections for the three population centers has been derived using a bottom-up approach that estimates household electrical appliance wattage, ownership by rural households and penetration rates underpinned the economic development potential of the population centre (figure 10). We then build the assumptions for the 3 demand projection scenarios per population centre using the daily load curve for a typical household customer incorporating penetration rates for baseline, improved and accelerated electricity demand scenarios (figure 10). We then used a standard formula considering the population projection, household energy requirements, and growth in connected household customers at each population centre. The initial (2017) household customers are taken from the Field Trip Reports for each of these population centres. These are currently getting their electricity from small generators and household solar systems.
• Mubi – 109 (estimate) • Walikale – 202 (estimate) • Ndjingala – 56 (estimate)
The growth of HH customers is determined by the following two variables. First, we projected the growth in the total number of households (HH):
Initial town population * DRC population growth rate
Average number of people per householdThe growth in the total number of HH =

P a g e | 30
USAID DRC Mini Grids in North Kivu June 30, 2018 USAID Contract #AID-OAA-I-15-00051 / AID-OAA-TO-16-00028 – ESS WA #6 Scope of Work
We used the initial town population & the average number of people per HH (6) from the data that was collected during field visit by the survey team. The population growth rate is assumed to be 3.5% per annum based on World Bank estimates.
Second, we then estimated the growth in the percentage of HH connected to the isolated mini-grid. To do this, we attached we assumed HH growth to follow a straight-line trajectory as highlighted in figure 11 below. We assumed that by the end of the forecast period i.e., 2030, the percentage connected households will reach 50% (baseline development), 75% (improved development) and 90% (accelerated development). Financial analysis assumptions are outlined in figure 11.
Figure 11: baseline, improved and accelerated demand projection scenarios
6.2 Financial analysis assumptions
Figure 12 highlights the assumptions used to develop the financial analysis for Mubi, Ndjingala and Walikale centre.
Figure 12 Financial model assumptions
Assumption Description Unit Assumption SourceFinancial projection Years 25 Aligned with the useful economic life of the solar panelsDetailed demand forecast Years 2018 - 2030 ToR specificationsHigh level demand forecast Years 2030 - 2043 IMC no growth in deand from 2031 onwardsTariff US$ / kWh 0.215 Virunga tariff to customers in North KivuConnection charge per customeUS$ 250 Electrical engineers ROM estimateOperation and maintenance cosUS$ Estimated per site - engineers ROM estimateDepreciation - solar panels Years 25 Manufacturers estimateDepreciation - batteries Years 10 Manufacturers estimateDepreciation method N/A Straight line AsumedDebt % 50% Based on typical finacing structures in DRCDebt % 50% Based on typical finacing structures in DRCLoan tenor Years 12 IMC estimateLoan interest % 15% IMC estimateEquity returns % 15%+ Minimum expected investor returns
Financing
Cost
Revenue
Financial model
Assumptions Forecast Forecast Forecast Forecast Forecast Forecast Forecast Forecast Forecast Forecast Forecast Forecast Forecast ForecastYear 2017 2018 2019 2020 2021 2022 2023 2024 2025 2026 2027 2028 2029 203012 - Year Forecast 1 2 3 4 5 6 7 8 9 10 11 12 13Population growth rate 3.50% 3.50% 3.50% 3.50% 3.50% 3.50% 3.50% 3.50% 3.50% 3.50% 3.50% 3.50% 3.50% 3.50%Average people per household 6 6 6 6 6 6 6 6 6 6 6 6 6 6Residential growth forecast Baseline 50% 4% 8% 12% 15% 19% 23% 27% 31% 35% 38% 42% 46% 50%Residential growth forecast Improved 70% 5% 11% 16% 22% 27% 32% 38% 43% 48% 54% 59% 65% 70%Residential growth forecast Accelerated 90% 7% 14% 21% 28% 35% 42% 48% 55% 62% 69% 76% 83% 90%

P a g e | 31
USAID DRC Mini Grids in North Kivu June 30, 2018 USAID Contract #AID-OAA-I-15-00051 / AID-OAA-TO-16-00028 – ESS WA #6 Scope of Work
6.3 Mubi
6.3.1 Demand projections
Figure 13: Demand projections for Mubi households
Daily consumption of electricity per household (kwh): A baseline daily consumption was first calculated by taking the 2017 monthly estimated diesel consumption for all the households in the town (30liters - obtained during the field visit) and calculating how many kwh can be obtained when using a diesel generator with an average efficiency of 25% (based on the characteristics of similar rural generators). This figure was then divided by the total number of connected households in the town for 2017 (also obtained during the field visit). This base figure for household daily consumption was increased on an annual basis according to the expected increases in the penetration rates of household electrical goods, (the information was based on previous studies of rural African towns). This is calculated by multiplying the total projected daily household consumption of electricity in a given year by the number of expected households who are estimated to be connected to the grid. The number of expected households who are estimated to be connected to the grid is a product of the expected annual population growth of 3.5% and the annual % increase in the number of households connected to the local grid. Daily consumption of electricity (for all households) kwh: This is calculated by multiplying the total projected daily household consumption of electricity in a given year by the number of expected households who are estimated to be connected to the grid (figure 13). The number of expected households who are estimated to be connected to the grid is a product of the expected annual population growth of 3.5% and the annual % increase in the number of households connected to the local grid. Yearly electricity consumption per household: This is calculated by multiplying the daily household electricity consumption by the 365 days of the year (figure 13). Total expected yearly energy consumption (MWh): This is calculated by multiplying the yearly expected electricity consumption per household by the expected number of households connected to the grid (figure 13).
Assumptions Forecast Forecast ForecastYear 2020 2025 2030
Total Connected Residential Households Baseline 700 2,218 4,280 Total expected daily energy consumption (Kwh) Baseline 1,483 9,005 23,483 Daily Household consumption of Electricity Kwh: Baseline 2.12 4.06 5.49 Total expected yearly energy consumption (Kwh) Baseline 541,138 3,286,716 8,571,148 Yearly Household consumption of Electricity Kwh: Baseline 772.86 1,482.12 2,002.65 Average daily Load per Customer (Kw) Baseline 1.06 2.03 2.74
Mubi Domestic
consumption
Scenario

P a g e | 32
USAID DRC Mini Grids in North Kivu June 30, 2018 USAID Contract #AID-OAA-I-15-00051 / AID-OAA-TO-16-00028 – ESS WA #6 Scope of Work
Average daily load per customer (kw): This is calculated by taking expected daily household consumption of electricity and multiplying it by the percentage of hours the electricity is expected to be turned on. In this case, the electricity is on for 12 hours which equates to 50% of a 24-hour day (figure 13).
Business expected daily consumption (kwh): This was calculated by using the USAID Conceptual Plan for Enhancing Transmission Infrastructure to Expand Electricity Access in DRC to obtain the distribution of electricity consumption in DRC by: Industry, households and commerce; which corresponded to 55%, 38%, 7% respectively. The study in question did not envision any of the electricity consumption being designated to industry as the town’s only have households and small businesses. Therefore, it was expected that of the remaining 45% of electricity, 84% would be designated to households and the remaining 16% be designated to business. The daily expected consumption for businesses was therefore deemed to always be 16/84 of the estimated daily electricity consumption for the households of a given site in a given year (figure 14). Figure 14: demand projections for Mubi commercial enterprises
6.3.2 Mubi financial analysis
• The sum of investments for Mubi have the highest Net Present Value of all 4 sites with
4.2 US$m (figure 15). This is under the assumption that the Real discount rate is 10%, the interest rates for the loans are 15%, the tariff per kwh is set at 0.215 USD$ and that the infrastructure is funded by 50% equity and 50% debt.
• Mubi also possess the second highest expected Internal Rate of Return for all 4 sites with 12%. This IRR will still be positive under adverse economic conditions such as a 5% increase in the interest rates of the loans, which would lower the IRR to 10% (figure 15).
• Under the current economic conditions, a minimum kwh tariff of 0.299 USD$ will be needed to reach 15% IRR.
• The financial analysis results in figure x below demonstrate that the project will struggle to be viable under the baseline scenario growth trajectory and when subjected to a lower tariff. The project is however less sensitive to changes in interest rate, a 5 percent uplift in interest rate at 20 percent results in a USD$1.91m NPV and 10% IRR (figure 15).
• The establishment and growth of the productive uses sector is likely to follow a positive trajectory with the improvement of the security situation in Mubi.
• The town’s close proximity to mining nodes could mean that future electricity demand has been can improve significantly has household incomes improve, and therefore also both the IRR and the NPV.
• Overall the Mubi solar pv project can improve its viability through concessionary loans or donor grants.
Average Load (Kw) 2.0Daily (Kwh) Consumption 20
Assumptions Forecast Forecast ForecastYear 2020 2025 2030
Total Connected Commercial Clients Baseline 14 83 216 Total expected daily energy consumption (Kwh) Baseline 273 1,659 4,326
Mubi Commercial / Public Services
Electricity Consumption
Scenario

P a g e | 33
USAID DRC Mini Grids in North Kivu June 30, 2018 USAID Contract #AID-OAA-I-15-00051 / AID-OAA-TO-16-00028 – ESS WA #6 Scope of Work
• The first 12 years of the project i.e., 2018 – 2020 is when the loan repayments are incurred assuming the project is accessing 50 percent of finance from debt (figure 15).
• The last 13 years of the project show a strong financial performance because of high revenues because of the assumed steady-state customer base, lower capital cost requirements and minimal debt repayment obligations (figure 15).
• The summary income statement for Mubi is in appendix 2.2 (a) and the cashflow statement is in appendix 2.2 (b). Although the Mubi solar pv project has proved to be financially constrained under the current assumptions, it will be cash positive.
Figure 15: Mubi financial analysis results and sensitivity analysis
6.4 Ndjingala
6.4.1 Demand projections Figure 16: demand projections for Ndjingala households
Outputs2018-2043 2018-2030 2031-2043
US$'m US$'m US$'mTotal Revenues 40.15 11.78 28.37 EBITDA 34.71 10.02 24.69 EBIT 27.83 7.22 20.61 EBT 17.47 0.48 16.99 Net Profit 34.95 0.96 33.98 Net Present Value (NPV) 4.19 - - IRR 11.80%
Sensitivity AnalysisNPV IRR
US$mOriginal 4.19 12%Interest rate @ 20% 1.91 10%Tariff @ 0.15 (2.07) 4%Combined (interest rate @ 20% and tariff @ 0.15) (3.91) 2%
Assumptions Forecast Forecast ForecastYear 2020 2025 2030
Total Connected Residential Households Baseline 237 750 1,448 Total expected daily energy consumption (Kwh) Baseline 579 3,226 8,198 Daily Household consumption of Electricity Kwh: Baseline 2.44 4.30 5.66 Total expected yearly energy consumption (Kwh) Baseline 211,233 1,177,339 2,992,263 Yearly Household consumption of Electricity Kwh: Baseline 891.80 1,569.42 2,066.72 Average daily Load per Customer (Kw) Baseline 1.22 2.15 2.83
Ndjingala Domestic consumption
Scenario

P a g e | 34
USAID DRC Mini Grids in North Kivu June 30, 2018 USAID Contract #AID-OAA-I-15-00051 / AID-OAA-TO-16-00028 – ESS WA #6 Scope of Work
Daily consumption of electricity per household (kwh): A baseline daily consumption was first calculated by taking the 2017 monthly estimated diesel consumption for all the households in the town (30liters - obtained during the field visit) and calculating how many kwh can be obtained when using a diesel generator with an average efficiency of 25% (based on the characteristics of similar rural generators). This figure was then divided by the total number of connected households in the town for 2017 (also obtained during the field visit). This base figure for household daily consumption was increased on an annual basis according to the expected increases in the penetration rates of household electrical goods, (the information was based on previous studies of rural African towns). This is calculated by multiplying the total projected daily household consumption of electricity in a given year by the number of expected households who are estimated to be connected to the grid. The number of expected households who are estimated to be connected to the grid is a product of the expected annual population growth of 3.5% and the annual % increase in the number of households connected to the local grid. Daily consumption of electricity (for all households) kwh: This is calculated by multiplying the total projected daily household consumption of electricity in a given year by the number of expected households who are estimated to be connected to the grid (figure 16). The number of expected households who are estimated to be connected to the grid is a product of the expected annual population growth of 3.5% and the annual % increase in the number of households connected to the local grid. Yearly electricity consumption per household: This is calculated by multiplying the daily household electricity consumption by the 365 days of the year (figure 16). Total expected yearly energy consumption (MWh): This is calculated by multiplying the yearly expected electricity consumption per household by the expected number of households connected to the grid (figure 16). Average daily load per customer (kw): This is calculated by taking expected daily household consumption of electricity and multiplying it by the percentage of hours the electricity is expected to be turned on. In this case, the electricity is on for 12 hours which equates to 50% of a 24-hour day (figure 16).
Business expected daily consumption (kwh): This was calculated by using the USAID Conceptual Plan for Enhancing Transmission Infrastructure to Expand Electricity Access in DRC to obtain the distribution of electricity consumption in DRC by: Industry, households and commerce; which corresponded to 55%, 38%, 7% respectively. The study in question did not envision any of the electricity consumption being designated to industry as the town’s only have households and small businesses. Therefore, it was expected that of the remaining 45% of electricity, 84% would be designated to households and the remaining 16% be designated to business. The daily expected consumption for

P a g e | 35
USAID DRC Mini Grids in North Kivu June 30, 2018 USAID Contract #AID-OAA-I-15-00051 / AID-OAA-TO-16-00028 – ESS WA #6 Scope of Work
businesses was therefore deemed to always be 16/84 = 4/21 of the estimated daily electricity consumption for the households of a given site in a given year (figure 17). Figure 17: demand projections for Ndjingala commercial enterprises
6.4.2 Ndjingala Financial analysis
• The sum of investments for Ndjingala have the lowest Net Present Value of all 4 sites with -US$4.5m (figure 18). This is under the assumption that the Real discount rate is 10%, the interest rates for the loans are 15%, the tariff per kwh is set at 0.215 USD$ and that the infrastructure is funded by 50% equity and 50% debt. Under the current assumptions, the Ndjingala project is showing that it is not viable unless it accesses concessionary finance or donor grants.
• Ndjingala also possess the lowest expected Internal Rate of Return for all 4 sites with -1.4%; it is worth noting that it will significantly worsen to IRR of -0.11% if the interest rates increase from 15% to 20% (figure 18).
• Under the current assumptions and conditions, a minimum tariff of 0.526 USD$ / kwh will be needed to attain a 15% IRR.
• The town’s close proximity to mining nodes could mean that future electricity demand has been underestimated, and therefore also both the IRR and the NPV.
• The financial analysis results in figure x below demonstrate that the project will significantly struggle to be viable under the baseline scenario growth trajectory
• The establishment and growth of the productive uses sector is likely to follow a positive trajectory with the improvement of the security situation in Ndjingala.
• Overall the Ndjingala solar pv project will not survive without improving its viability either through a higher than project customer base especially during the early project years, injection of concessionary loans or accessing donor grants.
• The first 12 years of the project i.e., 2018 – 2020 is when the loan repayments are incurred assuming the project is accessing 50 percent of finance from debt (figure 18).
• The last 13 years of the project show a strong financial performance because of high revenues because of the assumed steady-state customer base, lower capital cost requirements and minimal debt repayment obligations. However, this is not enough to cover for the losses incurred in the first 12 years (2018 – 2030).
• The summary income statement for Ndjingala is in appendix 2.3 (a) and the cashflow statement is in appendix 2.3 (b). Although the Ndjingala solar pv project has proved to be financially constrained under the current assumptions, it will be cash positive.
Average Load (Kw) 1.0Daily (Kwh) Consumption 10
Assumptions Forecast Forecast ForecastYear 2020 2025 2030
Total Connected Commercial Clients Baseline 11 59 151 Total expected daily energy consumption (Kwh) Baseline 107 594 1,510
Ndjingala Commercial / Public Services
Electricity Consumption
Scenario

P a g e | 36
USAID DRC Mini Grids in North Kivu June 30, 2018 USAID Contract #AID-OAA-I-15-00051 / AID-OAA-TO-16-00028 – ESS WA #6 Scope of Work
Figure 18: Ndjingala financial analysis results and sensitivity analysis
6.5 Walikale centre
6.5.1 Demand projections Figure 19: demand projections for Walikale centre households
Daily consumption of electricity per household (kwh): A baseline daily consumption was first calculated by taking the 2017 monthly estimated diesel consumption for all the households in the town (30liters - obtained during the field visit) and calculating how many kwh can be obtained when using a diesel generator with an average efficiency of 25% (based on the characteristics of similar rural generators). This figure was then divided by the total number of connected households in the town for 2017 (also obtained during the field visit). This base figure for household daily consumption was increased on an annual basis according to the expected increases in the penetration rates of household electrical goods, (the information was based on previous studies of rural African towns). This is calculated by multiplying the total projected daily household consumption of electricity in a given year by the number of expected households who are estimated to be connected to the grid. The number of expected households who are estimated to be connected to the grid is a product of the expected annual population growth of 3.5% and the annual percentage increase in the number of households connected to the local grid.
Outputs2018-2043 2018-2030 2031-2043
US$m US$m US$mTotal Revenues 17.60 5.08 12.52 EBITDA 13.68 3.69 9.99 EBIT 7.56 1.19 6.37 EBT (0.61) (4.67) 4.05 Net Profit (1.22) (9.33) 8.11 Net Present Value (NPV) (4.55) - - Net Present Value (NPV) (4.55) IRR -1.40% - -
Sensitivity AnalysisNPV IRR
Original (4.55) (0.01)Interest rate @ 20% (6.24) (0.03)Tariff @ 0.15 (7.26) (0.09)Combined (interest rate @ 20% and tariff @ 0.15 (8.81) (0.11)
Assumptions Forecast Forecast ForecastYear 2020 2025 2030
Total Connected Residential Households Baseline 646 2,045 3,947 Total expected daily energy consumption (Kwh) Baseline 1,169 7,845 21,005 Daily Household consumption of Electricity Kwh: Baseline 1.81 3.84 5.32 Total expected yearly energy consumption (Kwh) Baseline 426,831 2,863,289 7,666,973 Yearly Household consumption of Electricity Kwh: Baseline 660.99 1,400.02 1,942.40 Average daily Load per Customer (Kw) Baseline 0.91 1.92 2.66
Walikale Domestic consumption
Scenario

P a g e | 37
USAID DRC Mini Grids in North Kivu June 30, 2018 USAID Contract #AID-OAA-I-15-00051 / AID-OAA-TO-16-00028 – ESS WA #6 Scope of Work
Daily consumption of electricity (for all households) kwh: This is calculated by multiplying the total projected daily household consumption of electricity in a given year by the number of expected households who are estimated to be connected to the grid (figure 19). The number of expected households who are estimated to be connected to the grid is a product of the expected annual population growth of 3.5% and the annual % increase in the number of households connected to the local grid. Yearly electricity consumption per household: This is calculated by multiplying the daily household electricity consumption by the 365 days of the year (figure 19). Total expected yearly energy consumption (MWh): This is calculated by multiplying the yearly expected electricity consumption per household by the expected number of households connected to the grid (figure 19). Average daily load per customer (kw): This is calculated by taking expected daily household consumption of electricity and multiplying it by the percentage of hours the electricity is expected to be turned on. In this case, the electricity is on for 12 hours which equates to 50% of a 24-hour day (figure 19).
Business expected daily consumption (kwh): This was calculated by using the USAID Conceptual Plan for Enhancing Transmission Infrastructure to Expand Electricity Access in DRC to obtain the distribution of electricity consumption in DRC by: Industry, households and commerce; which corresponded to 55%, 38%, 7% respectively. The study in question did not envision any of the electricity consumption being designated to industry as the town’s only have households and small businesses. Therefore, it was expected that of the remaining 45% of electricity, 84% would be designated to households and the remaining 16% be designated to business. The daily expected consumption for businesses was therefore deemed to always be 16/84 = 4/21 of the estimated daily electricity consumption for the households of a given site in a given year (figure 20). Figure 20: demand projections for Ndjingala commercial enterprises
Average Load (Kw) 2.5Daily (Kwh) Consumption 25
Assumptions Forecast Forecast ForecastYear 2020 2025 2030
Total Connected Commercial Clients Baseline 9 58 155 Total expected daily energy consumption (Kwh) Baseline 215 1,445 3,869
Walikale Commercial / Public Services
Electricity Consumption
Scenario

P a g e | 38
USAID DRC Mini Grids in North Kivu June 30, 2018 USAID Contract #AID-OAA-I-15-00051 / AID-OAA-TO-16-00028 – ESS WA #6 Scope of Work
6.5.2 Walikale Centre financial analysis
• The sum of investments for Walikale have the second lowest Net Present Value of all 4 sites with 1.6 US$m (figure 21). This is under the assumption that the Real discount rate is 10%, the interest rates for the loans are 15%, the tariff per kwh is set at 0.215 USD$ and that the infrastructure is funded by 50% equity and 50% debt.
• Walikale also possess the second lowest expected Internal Rate of Return for all 4 sites with 8%. However, this IRR will still be positive under adverse economic conditions such as a 5% increase in the interest rates of the loans, which would lower the IRR to 8%.
• Under the current economic conditions, a minimum tariff of 0.299 USD$ / kwh will be needed to reach 15% IRR (figure 21).
• The establishment and growth of the productive uses sector is likely to follow a positive trajectory with the improvement of the security situation in Walikale centre.
• The town’s close proximity to mining nodes could mean that future electricity demand has been can improve significantly has household incomes improve, and therefore also both the IRR and the NPV.
• The financial analysis results in figure 21 below demonstrate that the project will struggle to be viable under the baseline scenario growth trajectory and when subjected to a lower tariff at US$0.15 and even higher interest rate at 20 percent. Lowering the tariff to US$0.15 results in negative -US$4.27m NPV and 0.15 percent IRR. Increasing the interest rate to 20 percent results in negative -USD$0.67m NPV and 6% IRR (figure 21).
• The establishment and growth of the productive uses sector is likely to follow a positive trajectory with the improvement of the security situation in Mubi.
• Overall the Mubi solar pv project can improve its viability through higher demand in the early project years, concessionary loans or access to donor grants.
• The first 12 years of the project i.e., 2018 – 2020 is when the loan repayments are incurred assuming the project is accessing 50 percent of finance from debt.
• The last 13 years of the project show a strong financial performance because of high revenues because of the assumed steady-state customer base, lower capital cost requirements and minimal debt repayment obligations.
• The summary income statement for Walikale centre is in appendix 2.3 (a) and the cashflow statement is in appendix 2.3 (b). Although the Walikale centre solar pv project has proved to be financially constrained under the current assumptions, it will be cash positive.

P a g e | 39
USAID DRC Mini Grids in North Kivu June 30, 2018 USAID Contract #AID-OAA-I-15-00051 / AID-OAA-TO-16-00028 – ESS WA #6 Scope of Work
Figure 21: Walikale centre financial analysis results and sensitivity analysis
7 Operators in North and South Kivu
SNEL
SNEL has a provincial office is located in Goma and is a distribution center facility that has no generation facilities nor any perspective investment plans for the province. In Goma, SNEL remains a highly centralized company with all the planning and instructions for service pricing cascading to provinces from the head office in Kinshasa. In Goma, SNEL distributes up to 3 MW that it receives from Bukavu in South Kivu. SNEL also receives power from UTECL in Uganda across the border connection and distributes it in the localities called Kasindi and Beni. In December 2017 SNEL imported from Uganda for distribution to Congolese consumers 177,517 kWh.
SNEL has in its books 29,610 low voltage customer accounts and 68 for medium voltage customers. SNEL provincial office counts on the construction of the transmission line within the NELSAP program, which includes a 220-kV line at 13 km across the Rwandan border and on the development of Ruzizi 3 in South Kivu. Cited challenges include bad state of distribution networks and need for major maintenance and rehabilitation. Therefore, it is unlikely that SNEL improves significantly it supply quality even if new power arrives from somewhere eventually. In addition, technically, SNEL does not have a monopoly on import of power to the country. From this viewpoint, the quality and extent of the distribution network will continue adversely affecting SNEL’s ability to distribute imported power in North Kivu.
Virunga Sarl
Virunga sarl is the major IPP in the province that operates 0.4 MW hydro power facility Mutwanga 1 and plans to commission 1.2 MW Mutwanga 2 near Beni at 50 km from the Uganda border. Currently, the facility supplies about 550 customers using a cash-based prepayment metering from when operations started. Another 13.8 MW power station in Matebe is meant to supply 4,500 clients, out of which 3,200 are connected through a meter and new
Outputs2018-2043 2018-2030 2031-2043
US$m US$m US$mTotal Revenues 37.49 10.98 26.51 EBITDA 30.97 9.05 21.93 EBIT 23.00 5.80 17.21 EBT 12.86 (0.96) 13.81 Net Profit 25.71 (1.91) 27.63 Net Present Value (NPV) 1.60 - - IRR 8.15%
Sensitivity AnalysisNPV IRR
US$mOriginal 1.60 8.15%Interest rate @ 20% (0.67) 6%Tariff @ 0.15 (4.27) 0.15%Combined (interest rate @ 20% and tariff @ 0.15) (6.10) 0%

P a g e | 40
USAID DRC Mini Grids in North Kivu June 30, 2018 USAID Contract #AID-OAA-I-15-00051 / AID-OAA-TO-16-00028 – ESS WA #6 Scope of Work
consumers being connected progressively. Presently, from Matebe, Virunga sells 5 MW to resellers and distributes 2.5 MW to consumers in the locality called Rutchuru. Virunga’s sarl’s vision is to deploy more than 100 MW through the construction of 8 hydropower plants in North-Kivu province. The Mutwanga I (0.4 MW) and Matebe (13.8 MW) power plants are now operational. The Mutwanga II (1.2 MW) and Luviro (15 MW) plants are being built respectively in Lubero and Beni territory, representing 30.4 MW or about 30% of the target. Virunga faces challenges to obtain the service areas most appropriate to its objectives of depreciating its BOOT investment prior to transferring the project assets to the State through a 25-year concession of which 3 years have been used. SOCODEE SOCODEE is an independent distributor of water and electricity in North Kivu. SOCODEE is an anchor client for Virunga Sarl as it purchases 5 MW from Virunga’s hydro station in Rutchuru. SOCODEE constructed a line between Rutchuru and Goma that was commissioned on 1 December 2017. The power is distributed to households for cash payments and industry, with the latest acquisition being a cement plant in Nyiragongo supplied at a medium 33kV medium voltage level. The cement plant is a former SNEL client the company build a new line and put the appropriate transformer to get reliable power supply Caritas Caritas is a technical arm of the Catholic Church managing some pico-hydro and micro-hydro generation facilities in remote areas. Key challenges relate to related mostly to the ageing equipment. Caritas main clients are the millers, small agro-processors and households but is facing strong competition from Virunga Sarl. BBoxx On 7th June 2018, UK-based off-grid renewables specialist BBOXX signed a deal with the Government of DRC to bring clean power to 2.5 million citizens across country by 2020, via off-grid solar kits and mini-grids. BBOXX has already been operating in the DRC through its partnership with Victron Energy to provide large pay-as-you-go (PAYG) solar to the urban region Goma in Eastern DRC. BBoxx has a mini-grid scheduled to be deployed in North Kivu in Q3 of 2018. Kivu Green Energy (KGE)
KGE installed the first commercial solar PV and storage micro-grid in Beni in June 2017. KGE is currently the largest supplier of electricity in Beni city and territory generating electricity through a 55 kW with a 100kVa back-up generator to ensure reliable electricity supply. Beni is home to 355,000 inhabitants and is home to large and small businesses and alike.
P a g e | 41
USAID DRC Mini Grids in North Kivu June 30, 2018 USAID Contract #AID-OAA-I-15-00051 / AID-OAA-TO-16-00028 – ESS WA #6 Scope of Work
8 Technical Considerations
8.1 Photo-voltaic System Considerations
PV Generation is an intermittent power source and not technically feasible to be able to maintain constant power production over the expanse of a micro-grid for 24/7. However, the system can utilize energy storage systems when deemed feasible to add power system stability and power availability during some non-daylight periods. A renewable Solar Center (PV Generation Plant) is modeled at each site to provide energy throughout the day and into the evening with the battery systems fully charged on an optimum solar day. It should be noted that this scenario is valid only during peak solar day periods and that weather and climatic conditions can affect the overall operation of the system. In that case another not so optimal solar day is shown to clarify the limitations. Photovoltaic (PV) power source is a renewable energy resource and considered as the only viable option in this study. Hydro and wind availability does not seem to be an option at either of the sites based on the Trip Report and Analysis. Potential Induced Degradation (PID) is a phenomenon that’s been existing for several years. It occurs on many photovoltaic (PV) panels resulting in a downgraded performance of solar panels. Some factors cause PID such as heat, humidity, and negative voltages and generally are issues on the cheaper brands. HOMER microgrid analysis software is utilized to perform the analysis for making the results of this recommendation. Generation optimization between PV and battery storage has been performed by simulating the data on ‘HOMER’ software tool over a 365-day cycle for each modelled installation year. As a back-up and quality control System Advisor Model (SAM 2017-9.5) was utilized for model verification. As with any power system network, the proper engineering and planning would have to be performed and an assessment made considering network disturbances such as the following:
• Voltage and Load Swings • Voltage and frequency regulation • Long-term flicker • Harmonics and inter-harmonics • Network short-circuit contribution and control of faults within the grid network • Stability and Reliability Analysis • Disconnection and reconnection protocols in the event of grid disturbances
The point of connection of any additional generating plant sources should be considered from a technical and environmental point of view. The decisive criterion for the assessment of the network connectivity is always the behavior of the generating plant at the network connection point and within the network of the load being supplied. Network transmission and distribution lines need to be considered when supplying loads within the grid parameters. Energy Storage Systems (ESS) will be modeled in each evaluation and can be used for storing energy for use at a future time. Energy Storage systems enables microgrids to regulate the voltage and frequency while the system operates in various modes, such as when a microgrid is unstable. Also, due to the increasing activity of renewable energy installations, which brings

P a g e | 42
USAID DRC Mini Grids in North Kivu June 30, 2018 USAID Contract #AID-OAA-I-15-00051 / AID-OAA-TO-16-00028 – ESS WA #6 Scope of Work
power intermittency into the microgrid architecture, maintaining the system at a stable mode of operation is a major issue. Smaller scale ESS can be used to store energy during off peak load periods for isolated areas at the customer utilization voltage for critical power areas such as hospitals, police stations, etc. Energy storage augments hybrid microgrids and adds to the energy captured and produced in the renewable network with a cost. The conventional energy storage system consists of banks of deep-cycle lead-acid, nickel-metal hydride batteries, flywheels or lithium-ion. However, two other energy storage technologies (ultra-capacitors and rechargeable metal-air) are now gaining favor, but not considered in this report. Each micro-grid installation should be designed for a future national grid inter-connection provision. Operations and Maintenance procedures are evaluated in other sections of this report. The O&M cost for a hybrid microgrid includes the operation and maintenance cost of the generated energy by each source. Renewable Energy Systems: There are at least five major goals of solar O&M operation:
• Optimization of plant production for increased asset revenue • Reduction of risks for asset owners and investors • Protection of asset value and longevity • Compliance with applicable regulations • Transparency on plant production, performance, issues, risks and O&M activities • Security and theft
8.2 Technical Loss Reductions
Electrical energy is lost as it flows from the generation source to the end user. Generally, up to 6% of electrical energy is consumed as losses in the system, with the majority of the losses attributed to the distribution system. Loss prevention measures are evaluated in the following areas:
• Distribution automation • Load management • Load balancing
Distribution Automation/Load Management/Load Balancing: Micro-Grid Automated Controls are considered. The microgrid control system should automatically adjust to maintain system voltage and power quality.
Reactance Control: The magnetic flux produced by the ac current produces series inductive reactance (XL). The reactance does not dissipate active power but results in voltage drop along the line and reactive power (volt-ampere-reactive). The Generation source has to supply reactive power on the line in addition to the load power. The objective is to decrease and control the reactive power as much as possible.

P a g e | 43
USAID DRC Mini Grids in North Kivu June 30, 2018 USAID Contract #AID-OAA-I-15-00051 / AID-OAA-TO-16-00028 – ESS WA #6 Scope of Work
Capacitance: Conductors separated by a distance have capacitance. The capacitance of the lines must be charged before a line can transfer power. Some power is shunted to ground from the line through the capacitive reactance.
Voltage Regulation: Voltage regulators are considered for the proper voltage control so that satisfactory voltages will be supplied to all load nodes under normal conditions of operation and system losses are compensated. Voltage regulation can enhance stability when designed properly to respond rapidly to transient effects.
Lines connecting power sources and loads for this study shall be considered short (shorter than 80 km) and could be affected by four basic parameters:
Series Resistance, Series Inductance, Shunt Capacitance, Shunt Conductance
8.3 Distribution System Components
Distribution Line Data – 15 kV:
Conductor Line Type & Size: ACSR, 100mm2 Max DC Resistance at 20º C – 0.2792 ohms 15 kV Capacity: 239 Amperes (6.20 MVA/4.97 MW)
Distribution Feeder Data – 400 Volts:
Conductor Line Type & Size: AL, 120mm2 400-volt Capacity: 315 Ampere
Distribution Feeder Tap – 400 Volts:
Conductor Line Type & Size: AL, 50mm2 400-volt Capacity: 175 Ampere
8.4 New Generation Platforms
Photovoltaic is a renewable energy source and a viable solution in this area. Photovoltaic energy farms are highly intermittent power sources and are dependent on the weather and climatic conditions. Solar is not a replacement for reliable power systems, but can be used to provide power production during available solar days. Each location is modeled with the proper site-specific input to evaluate local conditions to size properly. Energy Storage Systems (ESS) will be modeled and can be used for storing energy for use at a future time. Energy Storage systems enables microgrids to regulate the voltage and frequency while the system operates in various modes, such as when a microgrid is unstable. Smaller scale ESS can be used to store energy during off peak load periods for isolated areas at the customer utilization voltage for critical power areas such as hospitals, police stations, etc. The smaller scale facility usage units will not be modeled.
Wind is a renewable energy source, but not applicable in this area.
Hydro-Power is a renewable energy source, but not applicable in this area.

P a g e | 44
USAID DRC Mini Grids in North Kivu June 30, 2018 USAID Contract #AID-OAA-I-15-00051 / AID-OAA-TO-16-00028 – ESS WA #6 Scope of Work
Biomass and Geothermal was not considered.
8.5 Micro-Grid Automated Controls
Predictive control strategies utilize weather or price forecasts to proactively engage assets and load controls to achieve maximum system performance. By using integrated distributed generation assets, switches, controllers, monitoring and control systems, automation and other smart technology, microgrids can be more energy efficient and reliable. Microgrids can be designed and installed as smart grid networks and must be built to be cybersecure by incorporating the latest regulatory requirements. Advanced controls can be used to optimize the grid’s operation, shave peak demand loads and shift energy loads as needed. They can be used to optimize Microgrids and energy storage can maximize the use of renewable energy sources to improve sustainability.
Recommendations – Specific Automation Recommendations
-Install PLC SCADA grid network control -Provide Load monitoring devices
On a microgrid installation digital controls and smaller-scale energy storage enable consistent voltage and frequency control with reliable kVAR manipulation. In the event of a voltage dip swing, the energy storage can feed energy into the system to provide network stability. Energy storage also supports the generator sets in block load swings without fluctuations in frequency. This capability provides the possibility to engage renewable energy resources in proportions greater than a utility grid could support – up to and exceeding total network demand. Successful hybrid microgrid deployment and control depends on a fully integrated system. Major components should be available as containerized modules that can be shipped to the site and installed with plug-and-play simplicity. This solution provides the following efficiency increases in the power demand control:
-More efficient load management -Less man-hours for manual operations
8.6 Small Mini-Grid Generation Platforms (</=200kW)
For small 200 kW and below Photovoltaic installations, local suppliers and/or installers can provide solar PV power only, and distribute at 400 volts and not provide a higher grid distribution voltage. This type of small scale installation would not require batteries or step up transformation to a grid distribution voltage level.
Utilization Voltage: 400Y/230 volt, 3-phase, 50 HZ
Investors may provide installations at user load node locations and connect directly to utilization voltage using metering or a per connection cost. One such local provider and installer is GoShop located in Goma and was visited by the field team as mentioned in the Trip Report. They are presently installing system close to $1/w for PV with invertors only. Distribution and connections would also have to be included at additional costs.

P a g e | 45
USAID DRC Mini Grids in North Kivu June 30, 2018 USAID Contract #AID-OAA-I-15-00051 / AID-OAA-TO-16-00028 – ESS WA #6 Scope of Work
Appendices

P a g e | 46
USAID DRC Mini Grids in North Kivu June 30, 2018 USAID Contract #AID-OAA-I-15-00051 / AID-OAA-TO-16-00028 – ESS WA #6 Scope of Work
APPENDIX 1: Population centres growth projections
(a) Mubi population centre – household and commercial customer projections Assumptions Scenario Forecast Forecast Forecast Forecast Forecast Forecast Forecast Forecast Forecast Forecast Forecast Forecast Forecast Forecast
Year 2017 2018 2019 2020 2021 2022 2023 2024 2025 2026 2027 2028 2029 203012 - Year Forecast 1 2 3 4 5 6 7 8 9 10 11 12 13Population growth rate 3.50% 3.50% 3.50% 3.50% 3.50% 3.50% 3.50% 3.50% 3.50% 3.50% 3.50% 3.50% 3.50% 3.50%Average people per household 6 6 6 6 6 6 6 6 6 6 6 6 6 6Residential growth forecast Baseline 50% 4% 8% 12% 15% 19% 23% 27% 31% 35% 38% 42% 46% 50%Residential growth forecast Improved 70% 5% 11% 16% 22% 27% 32% 38% 43% 48% 54% 59% 65% 70%Residential growth forecast Accelerated 90% 7% 14% 21% 28% 35% 42% 48% 55% 62% 69% 76% 83% 90%Proportion of electricity demandResidential All scenarios 84% 84% 84% 84% 84% 84% 84% 84% 84% 84% 84% 84% 84%Commercial / Public ServiceAll scenarios 16% 16% 16% 16% 16% 16% 16% 16% 16% 16% 16% 16% 16%
District Population Projection 2018 2019 2020 2021 2022 2023 2024 2025 2026 2027 2028 2029 2030
Mubi 32,839 33,988 35,178 36,409 37,684 39,002 40,368 41,780 43,243 44,756 46,323 47,944 49,622 51,359 Estimated annual population growth 1,149 1,190 1,231 1,274 1,319 1,365 1,413 1,462 1,513 1,566 1,621 1,678 1,737
District household Growth Forecast 2018 2019 2020 2021 2022 2023 2024 2025 2026 2027 2028 2029 2030
Mubi 5,473 5,665 5,863 6,068 6,281 6,500 6,728 6,963 7,207 7,459 7,720 7,991 8,270 8,560 Estimated annual household growth 192 198 205 212 220 228 235 244 252 261 270 280 289
Mubi Customer Growth Forecast (Baseline) 2% 2018 2019 2020 2021 2022 2023 2024 2025 2026 2027 2028 2029 2030
Based on field visit findings 109 Residential 109 218 451 700 966 1,250 1,553 1,875 2,218 2,582 2,969 3,381 3,817 4,280 Commercial / Public ServiceBaseline 2 7 14 23 34 48 64 83 104 128 155 184 216 Total 109 220 458 714 989 1,284 1,601 1,939 2,301 2,686 3,098 3,535 4,001 4,496
Mubi Customer Growth Forecast (Improved) 2% 2018 2019 2020 2021 2022 2023 2024 2025 2026 2027 2028 2029 2030
Based on field visit findings 109 Residential 109 305 631 980 1,353 1,750 2,174 2,625 3,105 3,615 4,157 4,733 5,344 5,992 Commercial / Public ServiceImproved 4 11 22 37 56 78 105 135 169 206 248 294 344 Total 109 309 642 1,002 1,390 1,806 2,252 2,729 3,239 3,783 4,363 4,981 5,638 6,336
Mubi Customer Growth Forecast (Accelerated) 2% 2018 2019 2020 2021 2022 2023 2024 2025 2026 2027 2028 2029 2030
Based on field visit findings 109 Residential 109 392 812 1,260 1,739 2,250 2,795 3,375 3,992 4,648 5,345 6,085 6,871 7,704 Commercial / Public ServiceAccelerated 5 17 35 58 88 122 162 207 257 309 370 435 506 Total 109 398 829 1,295 1,798 2,338 2,917 3,537 4,199 4,905 5,654 6,455 7,306 8,210

P a g e | 47
USAID DRC Mini Grids in North Kivu June 30, 2018 USAID Contract #AID-OAA-I-15-00051 / AID-OAA-TO-16-00028 – ESS WA #6 Scope of Work
(b) Ndjingala population centre – household and commercial customer projections
Assumptions Scenario Forecast Forecast Forecast Forecast Forecast Forecast Forecast Forecast Forecast Forecast Forecast Forecast Forecast ForecastYear 2017 2018 2019 2020 2021 2022 2023 2024 2025 2026 2027 2028 2029 203012 - Year Forecast 1 2 3 4 5 6 7 8 9 10 11 12 13Population growth rate 3.50% 3.50% 3.50% 3.50% 3.50% 3.50% 3.50% 3.50% 3.50% 3.50% 3.50% 3.50% 3.50% 3.50%Average people per household 6 6 6 6 6 6 6 6 6 6 6 6 6 6Residential growth forecast Baseline 50% 4% 8% 12% 15% 19% 23% 27% 31% 35% 38% 42% 46% 50%Residential growth forecast Improved 70% 5% 11% 16% 22% 27% 32% 38% 43% 48% 54% 59% 65% 70%Residential growth forecast Accelerated 90% 7% 14% 21% 28% 35% 42% 48% 55% 62% 69% 76% 83% 90%Proportion of electricity demandResidential All scenarios 84% 84% 84% 84% 84% 84% 84% 84% 84% 84% 84% 84% 84%Commercial / Public Services All scenarios 16% 16% 16% 16% 16% 16% 16% 16% 16% 16% 16% 16% 16%
District Population Projection 2018 2019 2020 2021 2022 2023 2024 2025 2026 2027 2028 2029 2030
Ndjingala 11,109 11,498 11,900 12,317 12,748 13,194 13,656 14,134 14,628 15,140 15,670 16,219 16,786 17,374 Estimated annual population growth 389 402 417 431 446 462 478 495 512 530 548 568 588
District household Growth Forecast 2018 2019 2020 2021 2022 2023 2024 2025 2026 2027 2028 2029 2030
Ndjingala 1,852 1,916 1,983 2,053 2,125 2,199 2,276 2,356 2,438 2,523 2,612 2,703 2,798 2,896 Estimated annual household growth 65 67 69 72 74 77 80 82 85 88 91 95 98
Ndjingala Customer Growth Forecast (Baseline) 3% 2018 2019 2020 2021 2022 2023 2024 2025 2026 2027 2028 2029 2030
Based on field visit findings 56 Residential 56 74 153 237 327 423 525 634 750 873 1,005 1,144 1,291 1,448 Commercial / Public Services Baseline 2 6 11 17 25 35 46 59 74 91 109 129 151 Total 56 76 158 248 344 448 560 681 810 948 1,095 1,252 1,420 1,599
Ndjingala Customer Growth Forecast (Improved) 3% 2018 2019 2020 2021 2022 2023 2024 2025 2026 2027 2028 2029 2030
Based on field visit findings 56 Residential 56 103 214 332 458 592 735 888 1,050 1,223 1,406 1,601 1,808 2,027 Commercial / Public Services Improved 3 9 17 28 41 56 74 95 118 144 173 204 238 Total 56 106 222 349 485 633 792 962 1,145 1,341 1,551 1,774 2,012 2,265
Ndjingala Customer Growth Forecast (Accelerated) 3% 2018 2019 2020 2021 2022 2023 2024 2025 2026 2027 2028 2029 2030
Based on field visit findings 56 Residential 56 133 275 426 588 761 945 1,142 1,350 1,572 1,808 2,059 2,324 2,606 Commercial / Public Services Accelerated 5 13 26 42 63 86 114 144 179 216 257 302 350 Total 56 137 288 452 631 824 1,032 1,255 1,495 1,751 2,024 2,316 2,626 2,956
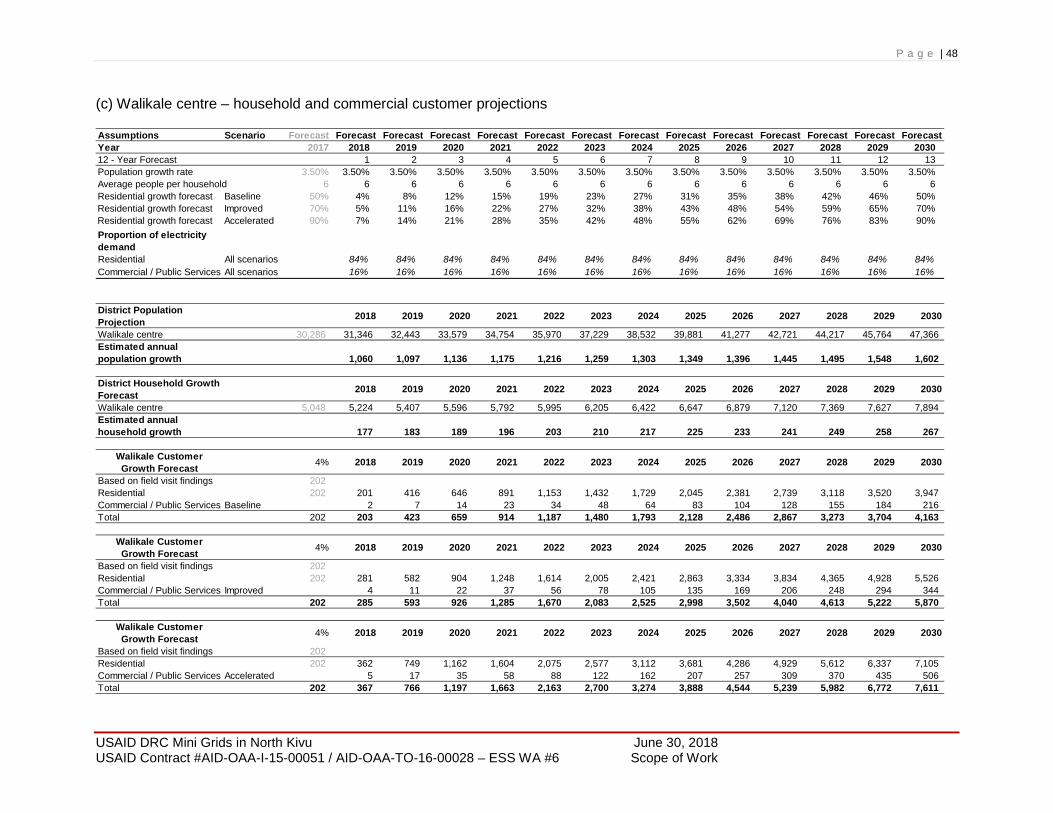
P a g e | 48
USAID DRC Mini Grids in North Kivu June 30, 2018 USAID Contract #AID-OAA-I-15-00051 / AID-OAA-TO-16-00028 – ESS WA #6 Scope of Work
(c) Walikale centre – household and commercial customer projections Assumptions Scenario Forecast Forecast Forecast Forecast Forecast Forecast Forecast Forecast Forecast Forecast Forecast Forecast Forecast ForecastYear 2017 2018 2019 2020 2021 2022 2023 2024 2025 2026 2027 2028 2029 203012 - Year Forecast 1 2 3 4 5 6 7 8 9 10 11 12 13Population growth rate 3.50% 3.50% 3.50% 3.50% 3.50% 3.50% 3.50% 3.50% 3.50% 3.50% 3.50% 3.50% 3.50% 3.50%Average people per household 6 6 6 6 6 6 6 6 6 6 6 6 6 6Residential growth forecast Baseline 50% 4% 8% 12% 15% 19% 23% 27% 31% 35% 38% 42% 46% 50%Residential growth forecast Improved 70% 5% 11% 16% 22% 27% 32% 38% 43% 48% 54% 59% 65% 70%Residential growth forecast Accelerated 90% 7% 14% 21% 28% 35% 42% 48% 55% 62% 69% 76% 83% 90%Proportion of electricity demandResidential All scenarios 84% 84% 84% 84% 84% 84% 84% 84% 84% 84% 84% 84% 84%Commercial / Public Services All scenarios 16% 16% 16% 16% 16% 16% 16% 16% 16% 16% 16% 16% 16%
District Population Projection 2018 2019 2020 2021 2022 2023 2024 2025 2026 2027 2028 2029 2030
Walikale centre 30,286 31,346 32,443 33,579 34,754 35,970 37,229 38,532 39,881 41,277 42,721 44,217 45,764 47,366 Estimated annual population growth 1,060 1,097 1,136 1,175 1,216 1,259 1,303 1,349 1,396 1,445 1,495 1,548 1,602
District Household Growth Forecast 2018 2019 2020 2021 2022 2023 2024 2025 2026 2027 2028 2029 2030
Walikale centre 5,048 5,224 5,407 5,596 5,792 5,995 6,205 6,422 6,647 6,879 7,120 7,369 7,627 7,894 Estimated annual household growth 177 183 189 196 203 210 217 225 233 241 249 258 267
Walikale Customer Growth Forecast 4% 2018 2019 2020 2021 2022 2023 2024 2025 2026 2027 2028 2029 2030
Based on field visit findings 202 Residential 202 201 416 646 891 1,153 1,432 1,729 2,045 2,381 2,739 3,118 3,520 3,947 Commercial / Public Services Baseline 2 7 14 23 34 48 64 83 104 128 155 184 216 Total 202 203 423 659 914 1,187 1,480 1,793 2,128 2,486 2,867 3,273 3,704 4,163
Walikale Customer Growth Forecast 4% 2018 2019 2020 2021 2022 2023 2024 2025 2026 2027 2028 2029 2030
Based on field visit findings 202 Residential 202 281 582 904 1,248 1,614 2,005 2,421 2,863 3,334 3,834 4,365 4,928 5,526 Commercial / Public Services Improved 4 11 22 37 56 78 105 135 169 206 248 294 344 Total 202 285 593 926 1,285 1,670 2,083 2,525 2,998 3,502 4,040 4,613 5,222 5,870
Walikale Customer Growth Forecast 4% 2018 2019 2020 2021 2022 2023 2024 2025 2026 2027 2028 2029 2030
Based on field visit findings 202 Residential 202 362 749 1,162 1,604 2,075 2,577 3,112 3,681 4,286 4,929 5,612 6,337 7,105 Commercial / Public Services Accelerated 5 17 35 58 88 122 162 207 257 309 370 435 506 Total 202 367 766 1,197 1,663 2,163 2,700 3,274 3,888 4,544 5,239 5,982 6,772 7,611

P a g e | 49
USAID DRC Mini Grids in North Kivu June 30, 2018 USAID Contract #AID-OAA-I-15-00051 / AID-OAA-TO-16-00028 – ESS WA #6 Scope of Work
Appendix 2: Financial Statement Results 2.1 (a) Ndjingala income statement
2.1 (b) Ndjingala cashflow statement
Ndjingala Income Statement Unit Total 2018-2043 Total 2018-2030 Total 2031-2043Revenue
Operational Revenue USD 17,599,560 5,082,426 12,517,133Operational Revenue USD 17,599,560 5,082,426 12,517,133
Operating ExpensesOperating Expenses USD (3,920,750) (1,394,000) (2,526,750)EBITDA USD 13,678,810 3,688,426 9,990,383
Depreciation and AmortisationDepreciation USD (6,120,752) (2,499,853) (3,620,899)EBIT USD 7,558,058 1,188,573 6,369,484
Financial Income / ExpensesFinancial Income / Expenses USD (8,170,056) (5,855,413) (2,314,643)EBT USD (611,998) (4,666,839) 4,054,841
Corporate TaxCorporate Tax USD (611,998) (4,666,839) 4,054,841Net Profit USD (1,223,996) (9,333,678) 8,109,683
Discount FactorDiscount Factor USDPresent Value USDNet Present Value USD (4,552,337)
Walikale Cash Flow Statement Total 2018-2043 Total 2018-2030 Total 2031-2043
Operational Revenue USD 37,486,005 10,979,071 26,506,935Operating Expenditures USD (6,512,750) (1,934,000) (4,578,750)Net Operating Cash Flow Before Tax USD 30,973,255 9,045,071 21,928,185
Financial expenses USD (10,145,560) (6,003,004) (4,142,556)Net Operating Cash Flow After Finance Expenses USD 20,827,695 3,042,066 17,785,629
Corporate Tax Due Paid USD 12,856,575 (956,889) 13,813,464Net Operating Cash Flow After Tax USD 33,684,270 2,085,177 31,599,093
Capital Expenditures USD (9,860,000) (8,660,000) (1,200,000)Free Cash Flow USD 23,824,270 (6,574,823) 30,399,093
Equity injection USD 4,030,000 4,030,000 0Donor Contribution Paid USD 0 0 0Debt Drawdown USD 4,030,000 4,030,000 0Cash Balance USD 31,884,270 1,485,177 30,399,093

P a g e | 50
USAID DRC Mini Grids in North Kivu June 30, 2018 USAID Contract #AID-OAA-I-15-00051 / AID-OAA-TO-16-00028 – ESS WA #6 Scope of Work
2.2 (a) Mubi Income statement
2.2 (b) Mubi cashflow statement
Mubi Income Statement Unit Total 2018-2043 Total 2018-2030 Total 2031-2043Revenue
Operational Revenue USD 40,145,613 11,776,241 28,369,372Operational Revenue USD 40,145,613 11,776,241 28,369,372
Operating ExpensesOperating Expenses USD (5,432,750) (1,754,000) (3,678,750)EBITDA USD 34,712,863 10,022,241 24,690,622
Depreciation and AmortisationDepreciation USD (6,878,160) (2,801,520) (4,076,640)EBIT USD 27,834,703 7,220,721 20,613,982
Financial Income / ExpensesFinancial Income / Expenses USD (10,361,595) (6,739,195) (3,622,400)EBT USD 17,473,107 481,526 16,991,582
Corporate TaxCorporate Tax USD 17,473,107 481,526 16,991,582Net Profit USD 34,946,215 963,051 33,983,163
Discount FactorDiscount Factor USDPresent Value USDNet Present Value USD 4,185,136
Mubi Cash Flow Statement Total 2018-2043 Total 2018-2030 Total 2031-2043
Operational Revenue USD 40,145,613 11,776,241 28,369,372Operating Expenditures USD (5,432,750) (1,754,000) (3,678,750)Net Operating Cash Flow Before Tax USD 34,712,863 10,022,241 24,690,622
Financial expenses USD (10,361,595) (5,981,605) (4,379,991)Net Operating Cash Flow After Finance Expenses USD 24,351,267 4,040,636 20,310,631
Corporate Tax Due Paid USD 17,473,107 481,526 16,991,582Net Operating Cash Flow After Tax USD 41,824,375 4,522,162 37,302,213
Capital Expenditures USD (8,480,000) (7,280,000) (1,200,000)Free Cash Flow USD 33,344,375 (2,757,838) 36,102,213
Equity injection USD 2,672,000 2,672,000 0Donor Contribution Paid USD 0 0 0Debt Drawdown USD 4,008,000 4,008,000 0Cash Balance USD 40,024,375 3,922,162 36,102,213
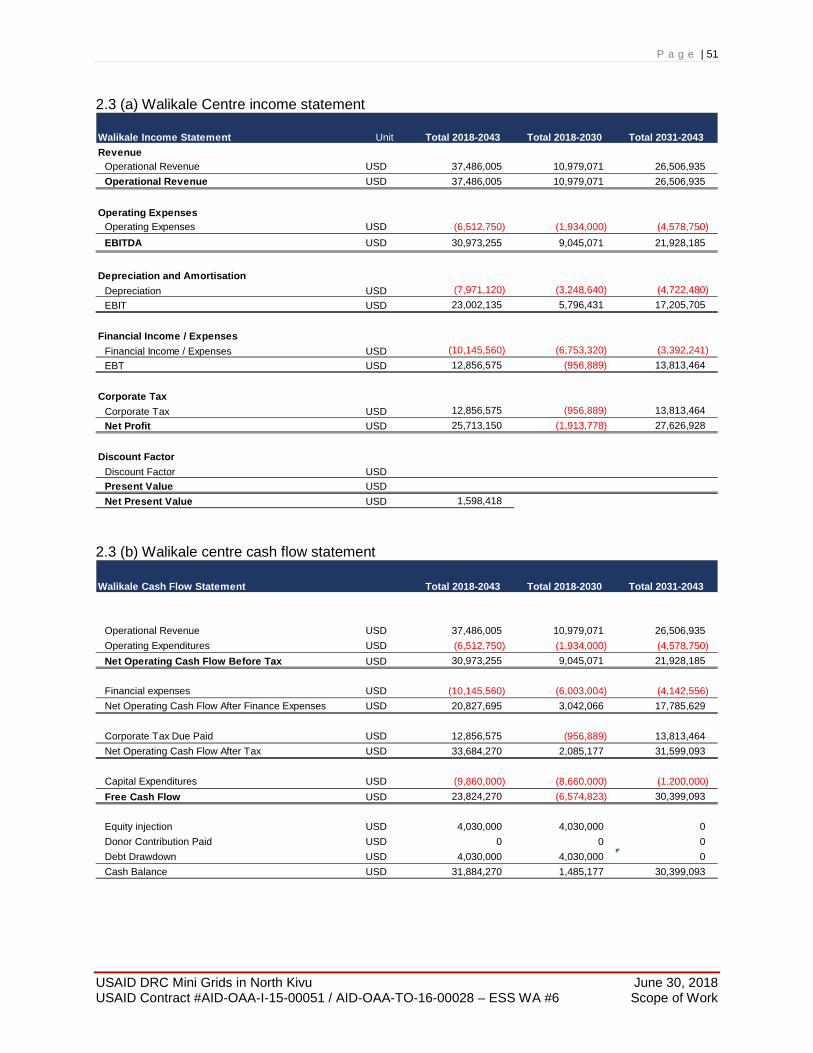
P a g e | 51
USAID DRC Mini Grids in North Kivu June 30, 2018 USAID Contract #AID-OAA-I-15-00051 / AID-OAA-TO-16-00028 – ESS WA #6 Scope of Work
2.3 (a) Walikale Centre income statement
2.3 (b) Walikale centre cash flow statement
Walikale Income Statement Unit Total 2018-2043 Total 2018-2030 Total 2031-2043Revenue
Operational Revenue USD 37,486,005 10,979,071 26,506,935Operational Revenue USD 37,486,005 10,979,071 26,506,935
Operating ExpensesOperating Expenses USD (6,512,750) (1,934,000) (4,578,750)EBITDA USD 30,973,255 9,045,071 21,928,185
Depreciation and AmortisationDepreciation USD (7,971,120) (3,248,640) (4,722,480)EBIT USD 23,002,135 5,796,431 17,205,705
Financial Income / ExpensesFinancial Income / Expenses USD (10,145,560) (6,753,320) (3,392,241)EBT USD 12,856,575 (956,889) 13,813,464
Corporate TaxCorporate Tax USD 12,856,575 (956,889) 13,813,464Net Profit USD 25,713,150 (1,913,778) 27,626,928
Discount FactorDiscount Factor USDPresent Value USDNet Present Value USD 1,598,418
Walikale Cash Flow Statement Total 2018-2043 Total 2018-2030 Total 2031-2043
Operational Revenue USD 37,486,005 10,979,071 26,506,935Operating Expenditures USD (6,512,750) (1,934,000) (4,578,750)Net Operating Cash Flow Before Tax USD 30,973,255 9,045,071 21,928,185
Financial expenses USD (10,145,560) (6,003,004) (4,142,556)Net Operating Cash Flow After Finance Expenses USD 20,827,695 3,042,066 17,785,629
Corporate Tax Due Paid USD 12,856,575 (956,889) 13,813,464Net Operating Cash Flow After Tax USD 33,684,270 2,085,177 31,599,093
Capital Expenditures USD (9,860,000) (8,660,000) (1,200,000)Free Cash Flow USD 23,824,270 (6,574,823) 30,399,093
Equity injection USD 4,030,000 4,030,000 0Donor Contribution Paid USD 0 0 0Debt Drawdown USD 4,030,000 4,030,000 0Cash Balance USD 31,884,270 1,485,177 30,399,093

P a g e | 52
USAID DRC Mini Grids in North Kivu June 30, 2018 USAID Contract #AID-OAA-I-15-00051 / AID-OAA-TO-16-00028 – ESS WA #6 Scope of Work
Appendix 3: Acronyms
A : Amperes BAD : African Bank of Development BIT : International Bureau of Work BT : Low Voltage IDRC : Research Centre for the International Development CDPE : China Drago Power Engineering COPIREP : Steering Committee for Public Enterprise Reforms DBSA : Development Bank of South Africa DG : Distributed Generation DR : Distributed Resources DRC : Democratic Republic of the Congo ESS : Energy Storage Systems f : Frequency GWh : Gigawatts Hour (106 kwh) HT : High Voltage HV : High Voltage IDA : International Development Association IGO : Isolated Grid Optimization INS : National Institute of Statistics IPP : Independent Power Producer KCC : Kamoto Cooper Company KFW : Reconstruction Credit Institute KV : Kilovolt KVA : Kilovolt Ampere kVAR : Kilovolt-Ampere Reactive kW : Kilowatt kWh : Kilowatt-hours = 1,000 watt-hours MES : Micro-Grid Energy Storage MID : Microgrid Interconnect Devices MV : Medium Voltage MVA : Mega Volt Ampere MVAR : Mega volt Ampere Reactive MW : Megawatt MWh : Megawatt Hour (10- kwh) NPV : Net Present Value PA : Feeding Point PMEDE : The Regional and Domestic Power Markets Development Project UNDP : Program of the United Nations Development PPA : Private Producer Agreement PPP : Public Partnership Private PR : SNEL : Societe Nationale d’Electricite SAPMP : Southern African Power Market Program SCI : S/S : Sub-station TRI : Internal Rate of Return USD : American Dollar

P a g e | 53
USAID DRC Mini Grids in North Kivu June 30, 2018 USAID Contract #AID-OAA-I-15-00051 / AID-OAA-TO-16-00028 – ESS WA #6 Scope of Work
Appendix 4: Mubi Drawings
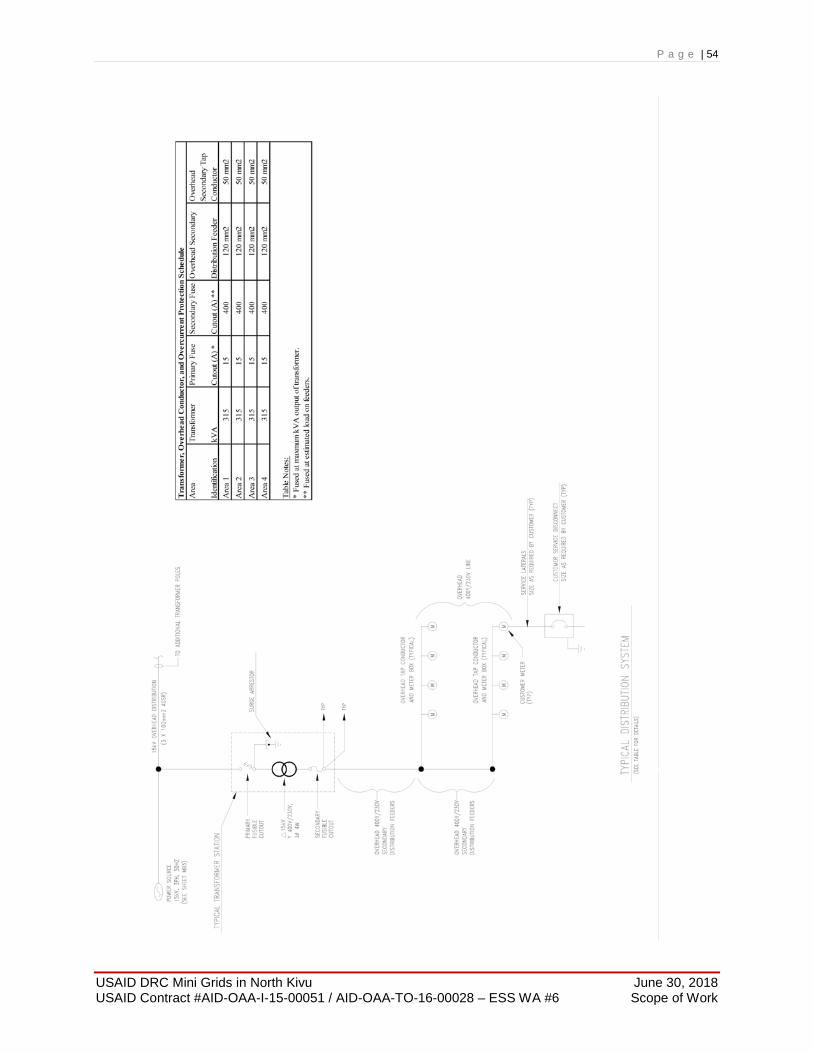
P a g e | 54
USAID DRC Mini Grids in North Kivu June 30, 2018 USAID Contract #AID-OAA-I-15-00051 / AID-OAA-TO-16-00028 – ESS WA #6 Scope of Work

P a g e | 55
USAID DRC Mini Grids in North Kivu June 30, 2018 USAID Contract #AID-OAA-I-15-00051 / AID-OAA-TO-16-00028 – ESS WA #6 Scope of Work

P a g e | 56
USAID DRC Mini Grids in North Kivu June 30, 2018 USAID Contract #AID-OAA-I-15-00051 / AID-OAA-TO-16-00028 – ESS WA #6 Scope of Work
Appendix 5: Mubi Power Analysis The following information and tables indicate the cost and recommendations to provide a renewable Solar Generation Plant and batteries to an area without a grid connection. This area is not expected to be connected to the National Grid in the foreseeable future. The proposed area uses portable gas or diesel generators to provide what existing power is generated. These portable units may need to remain in operation for those who need a constant power source on non-peak solar days for day time operation and evening loads without solar generation and total battery discharge.
The capital costs include the following: Solar Power Center: Solar Arrays, Combiner Boxes, Invertors, Batteries Primary Distribution System: Step-up Transformer to grid voltage (15 kV) Secondary Distribution System: Step-down Transformers to utilization voltage Secondary Lateral Distribution: Outgoing from the transformer stations Customer taps: Connection to Lateral with meter and final load connection Utilization Voltage: 400Y/230 volt, 3-phase, 50 HZ The costs do not include the following indirect costs: Land purchase or lease, Environmental Permits/Fees, Construction Permits/Fees The Power Analysis is based on the following considerations:
1. The base year for installation is assumed to be 2019 which models the installation of the initial Solar Power Center. The initial installation is assumed as the first-year capital investment and uses the projected load analysis in year 2025.
2. Solar generation is based on providing adequate PV capacity to assume as much load as possible and charge batteries during PV optimal generating conditions, without over producing and wasting energy.
3. Battery installations are based on providing kWH discharge during peak periods of the day during PV optimal generating charging conditions.
4. The customer power consumption in kWH and demand factors are determined in accordance with the data furnished in this report.
5. Projected PV plants in this analysis dictate the following size units:
Plant Operation Size 2019 2025
PV Capacity 1.5 MW 2.0 MW
Battery 1.5 MWH 2.0 MWH

P a g e | 57
USAID DRC Mini Grids in North Kivu June 30, 2018 USAID Contract #AID-OAA-I-15-00051 / AID-OAA-TO-16-00028 – ESS WA #6 Scope of Work
Projected Generation and consumption kWh/year at the Solar Center Power Plants:
The chart is based on the projected increase in consumption and added customers. The daily load profile is considered to remain the same.
1. This graph is based on increases in consumption, and total PV generation over a one-year time step period for a duration of 12 years
2. Each customer unit is quantified with a diversity factor then distribution factors applied accordingly
3. PV generation levels are based on output levels from the HOMER model. Their output levels are considered to remain constant until additional PV investments are made
4. This graph represents kWh generation, which indicates the amount of projected capable electricity available from the sun at these coordinates generated over time. This differs from kW generation, which indicates a peak demand of electricity needed at any point in time.

P a g e | 58
USAID DRC Mini Grids in North Kivu June 30, 2018 USAID Contract #AID-OAA-I-15-00051 / AID-OAA-TO-16-00028 – ESS WA #6 Scope of Work
The Projected Capital Investments are based on the following considerations:
1. Site distribution infrastructure will be needed to serve the area of the Micro-Grid. 2. Solar install cost includes PV modules, inverters, combination boxes, stationary
supports, connection to grid and controls. The cost of $1.5 USD per watt is based upon info provided from USAID as an expected cost for this area on the first year.
3. The battery cost includes containerized systems with foundations, racks, distribution equipment, monitoring, controls, etc. The cost of $400 USD per kilowatt-hour is based upon info provided from USAID as an expected cost for this area.
4. New customer connections are based on providing secondary services and metering to each customer location at $250/customer.
5. First Solar Center is considered to be installed in 2019 sized for the demands in the year 2025.

P a g e | 59
USAID DRC Mini Grids in North Kivu June 30, 2018 USAID Contract #AID-OAA-I-15-00051 / AID-OAA-TO-16-00028 – ESS WA #6 Scope of Work
Projected Daily Load Profile based on an Optimal solar day Year 2025:
This graph is based on model output data of generation, load profile curves, and storage for an optimal PV generation day. This type of generation day represents ideal weather with optimal solar output.
1. The load profile graphed represents typical residential/light commercial demand curves throughout a 24-hour period with data points taken at each hour.
2. Generation levels are represented by the PV output bar graphs. 3. Battery discharge levels are represented by the discharge output bar graph. Battery state
of charge is represented by the line graph and follows a 0-100% state. 4. With this scenario, PV generation is sufficient to meet the load profile and charge the
batteries within a few hours. Batteries will discharge during the peak evening load. For the late evening hours, power will not be available.

P a g e | 60
USAID DRC Mini Grids in North Kivu June 30, 2018 USAID Contract #AID-OAA-I-15-00051 / AID-OAA-TO-16-00028 – ESS WA #6 Scope of Work
Projected Daily Load Profile based on a Non-Optimal Solar Day Year 2025:
1. This graph is based on model output data of generation, load profile curves, and storage for a typical PV generation day when the sun is not optimal to produce enough power. This type of generation day represents inclement weather with limited solar output.
2. With this scenario, PV generation is not sufficient to meet the load profile and/or charge the batteries.

P a g e | 61
USAID DRC Mini Grids in North Kivu June 30, 2018 USAID Contract #AID-OAA-I-15-00051 / AID-OAA-TO-16-00028 – ESS WA #6 Scope of Work
Appendix 6: Ndjingala Drawings

P a g e | 62
USAID DRC Mini Grids in North Kivu June 30, 2018 USAID Contract #AID-OAA-I-15-00051 / AID-OAA-TO-16-00028 – ESS WA #6 Scope of Work

P a g e | 63
USAID DRC Mini Grids in North Kivu June 30, 2018 USAID Contract #AID-OAA-I-15-00051 / AID-OAA-TO-16-00028 – ESS WA #6 Scope of Work
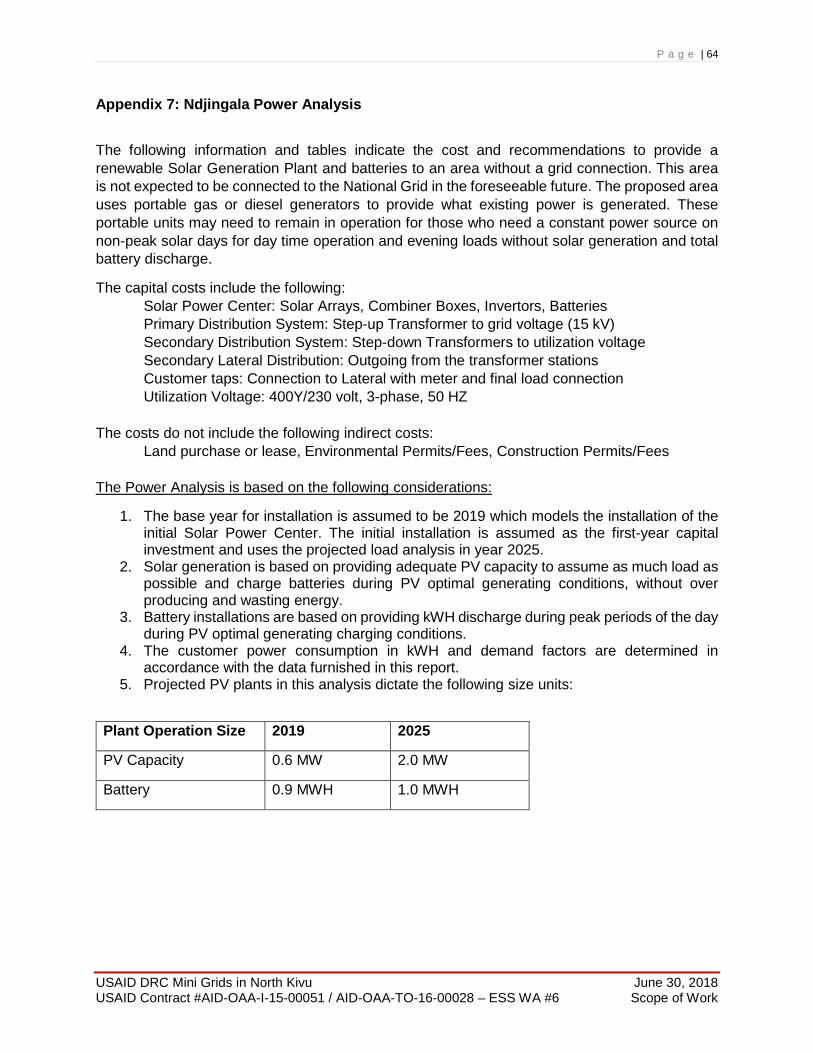
P a g e | 64
USAID DRC Mini Grids in North Kivu June 30, 2018 USAID Contract #AID-OAA-I-15-00051 / AID-OAA-TO-16-00028 – ESS WA #6 Scope of Work
Appendix 7: Ndjingala Power Analysis
The following information and tables indicate the cost and recommendations to provide a renewable Solar Generation Plant and batteries to an area without a grid connection. This area is not expected to be connected to the National Grid in the foreseeable future. The proposed area uses portable gas or diesel generators to provide what existing power is generated. These portable units may need to remain in operation for those who need a constant power source on non-peak solar days for day time operation and evening loads without solar generation and total battery discharge.
The capital costs include the following: Solar Power Center: Solar Arrays, Combiner Boxes, Invertors, Batteries Primary Distribution System: Step-up Transformer to grid voltage (15 kV) Secondary Distribution System: Step-down Transformers to utilization voltage Secondary Lateral Distribution: Outgoing from the transformer stations Customer taps: Connection to Lateral with meter and final load connection Utilization Voltage: 400Y/230 volt, 3-phase, 50 HZ The costs do not include the following indirect costs: Land purchase or lease, Environmental Permits/Fees, Construction Permits/Fees The Power Analysis is based on the following considerations:
1. The base year for installation is assumed to be 2019 which models the installation of the initial Solar Power Center. The initial installation is assumed as the first-year capital investment and uses the projected load analysis in year 2025.
2. Solar generation is based on providing adequate PV capacity to assume as much load as possible and charge batteries during PV optimal generating conditions, without over producing and wasting energy.
3. Battery installations are based on providing kWH discharge during peak periods of the day during PV optimal generating charging conditions.
4. The customer power consumption in kWH and demand factors are determined in accordance with the data furnished in this report.
5. Projected PV plants in this analysis dictate the following size units:
Plant Operation Size 2019 2025
PV Capacity 0.6 MW 2.0 MW
Battery 0.9 MWH 1.0 MWH

P a g e | 65
USAID DRC Mini Grids in North Kivu June 30, 2018 USAID Contract #AID-OAA-I-15-00051 / AID-OAA-TO-16-00028 – ESS WA #6 Scope of Work
Projected Generation and consumption kWh/year at the Solar Center Power Plants:
The chart is based on the projected increase in consumption and added customers. The daily load profile is considered to remain the same.
1. This graph is based on increases in consumption, and total PV generation over a one-year time step period for a duration of 12 years
2. Each customer unit is quantified with a diversity factor then distribution factors applied accordingly
3. PV generation levels are based on output levels from the HOMER model. Their output levels are considered to remain constant until additional PV investments are made
4. This graph represents kWh generation, which indicates the amount of projected capable electricity available from the sun at these coordinates generated over time. This differs from kW generation, which indicates a peak demand of electricity needed at any point in time.

P a g e | 66
USAID DRC Mini Grids in North Kivu June 30, 2018 USAID Contract #AID-OAA-I-15-00051 / AID-OAA-TO-16-00028 – ESS WA #6 Scope of Work
The Projected Capital Investments are based on the following considerations:
1. Site distribution infrastructure will be needed to serve the area of the Micro-Grid. 2. Solar install cost includes PV modules, inverters, combination boxes, stationary
supports, connection to grid and controls. The cost of $1.5 USD per watt is based upon info provided from USAID as an expected cost for this area on the first year.
3. The battery cost includes containerized systems with foundations, racks, distribution equipment, monitoring, controls, etc. The cost of $400 USD per kilowatt-hour is based upon info provided from USAID as an expected cost for this area.
4. New customer connections are based on providing secondary services and metering to each customer location at $250/customer.
5. First Solar Center is considered to be installed in 2019 sized for the demands in the year 2025.

P a g e | 67
USAID DRC Mini Grids in North Kivu June 30, 2018 USAID Contract #AID-OAA-I-15-00051 / AID-OAA-TO-16-00028 – ESS WA #6 Scope of Work
Projected Daily Load Profile based on an Optimal solar day Year 2025:
This graph is based on model output data of generation, load profile curves, and storage for an optimal PV generation day. This type of generation day represents ideal weather with optimal solar output.
1. The load profile graphed represents typical residential/light commercial demand curves throughout a 24-hour period with data points taken at each hour.
2. Generation levels are represented by the PV output bar graphs. 3. Battery discharge levels are represented by the discharge output bar graph. Battery state
of charge is represented by the line graph and follows a 0-100% state. 4. With this scenario, PV generation is sufficient to meet the load profile and charge the
batteries within a few hours. Batteries will discharge during the peak evening load. For the late evening hours, power will not be available.

P a g e | 68
USAID DRC Mini Grids in North Kivu June 30, 2018 USAID Contract #AID-OAA-I-15-00051 / AID-OAA-TO-16-00028 – ESS WA #6 Scope of Work
Projected Daily Load Profile based on a Non-Optimal Solar Day Year 2025:
1. This graph is based on model output data of generation, load profile curves, and storage for a typical PV generation day when the sun is not optimal to produce enough power. This type of generation day represents inclement weather with limited solar output.
2. With this scenario, PV generation is not sufficient to meet the load profile and/or charge the batteries.

P a g e | 69
USAID DRC Mini Grids in North Kivu June 30, 2018 USAID Contract #AID-OAA-I-15-00051 / AID-OAA-TO-16-00028 – ESS WA #6 Scope of Work
Appendix 8: Walikale Drawings

P a g e | 70
USAID DRC Mini Grids in North Kivu June 30, 2018 USAID Contract #AID-OAA-I-15-00051 / AID-OAA-TO-16-00028 – ESS WA #6 Scope of Work

P a g e | 71
USAID DRC Mini Grids in North Kivu June 30, 2018 USAID Contract #AID-OAA-I-15-00051 / AID-OAA-TO-16-00028 – ESS WA #6 Scope of Work

P a g e | 72
USAID DRC Mini Grids in North Kivu June 30, 2018 USAID Contract #AID-OAA-I-15-00051 / AID-OAA-TO-16-00028 – ESS WA #6 Scope of Work

P a g e | 73
USAID DRC Mini Grids in North Kivu June 30, 2018 USAID Contract #AID-OAA-I-15-00051 / AID-OAA-TO-16-00028 – ESS WA #6 Scope of Work
Appendix 9: Walikale Power Analysis The following information and tables indicate the cost and recommendations to provide a renewable Solar Generation Plant and batteries to an area without a grid connection. This area is not expected to be connected to the National Grid in the foreseeable future. The proposed area uses portable gas or diesel generators to provide what existing power is generated. These portable units may need to remain in operation.
n for those who need a constant power source on non-peak solar days for day time operation and evening loads without solar generation and total battery discharge.
The capital costs include the following: Solar Power Center: Solar Arrays, Combiner Boxes, Invertors, Batteries Primary Distribution System: Step-up Transformer to grid voltage (15 kV) Secondary Distribution System: Step-down Transformers to utilization voltage Secondary Lateral Distribution: Outgoing from the transformer stations Customer taps: Connection to Lateral with meter and final load connection Utilization Voltage: 400Y/230 volt, 3-phase, 50 HZ The costs do not include the following indirect costs: Land purchase or lease, Environmental Permits/Fees, Construction Permits/Fees
The Power Analysis is based on the following considerations:
6. The base year for installation is assumed to be 2019 which models the installation of the initial Solar Power Center. The initial installation is assumed as the first-year capital investment and uses the projected load analysis in year 2025.
7. Solar generation is based on providing adequate PV capacity to assume as much load as possible and charge batteries during PV optimal generating conditions, without over producing and wasting energy.
8. Battery installations are based on providing kWH discharge during peak periods of the day during PV optimal generating charging conditions.
9. The customer power consumption in kWH and demand factors are determined in accordance with the data furnished in this report.
10. Projected PV plants in this analysis dictate the following size units:
Plant Operation Size 2019 2025
PV Capacity 1.5 MW 2.0 MW
Battery 1.5 MWH 2.0 MWH

P a g e | 74
USAID DRC Mini Grids in North Kivu June 30, 2018 USAID Contract #AID-OAA-I-15-00051 / AID-OAA-TO-16-00028 – ESS WA #6 Scope of Work
Projected Generation and consumption kWh/year at the Solar Center Power Plants:
The chart is based on the projected increase in consumption and added customers. The daily load profile is considered to remain the same.
5. This graph is based on increases in consumption, and total PV generation over a one-year time step period for a duration of 12 years
6. Each customer unit is quantified with a diversity factor then distribution factors applied accordingly
7. PV generation levels are based on output levels from the HOMER model. Their output levels are considered to remain constant until additional PV investments are made
8. This graph represents kWh generation, which indicates the amount of projected capable electricity available from the sun at these coordinates generated over time. This differs from kW generation, which indicates a peak demand of electricity needed at any point in time.

P a g e | 75
USAID DRC Mini Grids in North Kivu June 30, 2018 USAID Contract #AID-OAA-I-15-00051 / AID-OAA-TO-16-00028 – ESS WA #6 Scope of Work
The Projected Capital Investments are based on the following considerations:
6. Site distribution infrastructure will be needed to serve the area of the Micro-Grid. 7. Solar install cost includes PV modules, inverters, combination boxes, stationary
supports, connection to grid and controls. The cost of $1.5 USD per watt is based upon info provided from USAID as an expected cost for this area on the first year.
8. The battery cost includes containerized systems with foundations, racks, distribution equipment, monitoring, controls, etc. The cost of $400 USD per kilowatt-hour is based upon info provided from USAID as an expected cost for this area.
9. New customer connections are based on providing secondary services and metering to each customer location at $250/customer.
10. First Solar Center is considered to be installed in 2019 sized for the demands in the year 2025.

P a g e | 76
USAID DRC Mini Grids in North Kivu June 30, 2018 USAID Contract #AID-OAA-I-15-00051 / AID-OAA-TO-16-00028 – ESS WA #6 Scope of Work
Projected Daily Load Profile based on an Optimal solar day Year 2025:
This graph is based on model output data of generation, load profile curves, and storage for an optimal PV generation day. This type of generation day represents ideal weather with optimal solar output.
5. The load profile graphed represents typical residential/light commercial demand curves throughout a 24-hour period with data points taken at each hour.
6. Generation levels are represented by the PV output bar graphs. 7. Battery discharge levels are represented by the discharge output bar graph. Battery state
of charge is represented by the line graph and follows a 0-100% state. 8. With this scenario, PV generation is sufficient to meet the load profile and charge the
batteries within a few hours. Batteries will discharge during the peak evening load. For the late evening hours, power will not be available.

P a g e | 77
USAID DRC Mini Grids in North Kivu June 30, 2018 USAID Contract #AID-OAA-I-15-00051 / AID-OAA-TO-16-00028 – ESS WA #6 Scope of Work
Projected Daily Load Profile based on a Non-Optimal Solar Day Year 2025:
3. This graph is based on model output data of generation, load profile curves, and storage for a typical PV generation day when the sun is not optimal to produce enough power. This type of generation day represents inclement weather with limited solar output.
4. With this scenario, PV generation is not sufficient to meet the load profile and/or charge the batteries.

P a g e | 78
USAID DRC Mini Grids in North Kivu June 30, 2018 USAID Contract #AID-OAA-I-15-00051 / AID-OAA-TO-16-00028 – ESS WA #6 Scope of Work
Appendix 10: North Kivu Drawings

P a g e | 79
USAID DRC Mini Grids in North Kivu June 30, 2018 USAID Contract #AID-OAA-I-15-00051 / AID-OAA-TO-16-00028 – ESS WA #6 Scope of Work