Embed Size (px)
Citation preview
2012Integrated Annual Report for the year ended 31 March
This report provides an overview of
Telkom’s business activities including
all operating subsidiaries, based on
reporting segments for the year ended
31 March 2012. It details the Group’s
fi nancial statements and looks ahead
at the Group’s prospects for the next
fi nancial year. The previous reporting
period for the period ended 31 March
2011 was covered in the 2011 Telkom
Integrated Annual Report.
This report includes an overview of
the business operations as well as
the fi nancial statements relating to
the Group’s activities over the period.
It has been prepared in accordance
with the Global Reporting Initiative 3
guidelines and represents a balanced
and reasonable presentation of Telkom’s
economic, environmental and social
performance.
While this document is designed to be
an integrated report, a more focused
description of Telkom’s sustainable
development activities can be found
on pages 68 to 111 for easier access
and increased clarity on certain of our
core sustainability issues. This section
includes data and information based
only on operations within the Republic of
South Africa for the year ended 31 March
2012. The South African operating
subsidiaries Swiftnet (Pty) Limited
(trading as Fastnet Wireless Service) and
Trudon (Pty) Limited have been included
in the 2012 sustainability section of this
report with respect to information relating
to climate change and greenhouse gas
emissions, water consumption, human
capital management, and occupational
health and safety.
The data relating to the Broad-Based
Black Economic Empowerment
(B-BBEE) score card also refl ects data
from the previous reporting cycle as the
current BEE review and certifi cation will
only take place following the completion
of the 2012 reporting period.
SCOPE OF REPORT
Integ
rated A
nn
ual R
epo
rt for th
e y
ea
r en
de
d 3
1 M
arc
h 2
01
2
PAPERSTOCK
COVER: PRINTED ON
Magno Satin 350gsm
INTERNAL PAGES
Printed front 135gsm Triple Green Silk
Printed back 115gsm Triple Green Silk
www.telkom.co.za
GRI and King III

1 Connecting with our stakeholders
2 Mission, vision and values
3 Strategy for 2012 – 2013
4 The year at a glance
6 Telkom shareholding at
31 March 2012
7 Telkom Group segment structure
8 Chairman’s message
12 Message from the Group Chief
Executive Offi cer
16 Board of Directors
18 Executive Committee
20 Industry overview
22 Business review
31 Awards and achievements
32 Integrated performance indicators
36 Financial overview
49 Governance
58 Enterprise risk management
66 Risk factors
68 Sustainability review
70 Group value added statement
72 Stakeholder engagement
76 Material sustainability issues
80 Human capital/our people
88 Occupational health and safety
95 Empowerment
96 Procurement
97 The Telkom Foundation
100 Environmental management
104 Product responsibility
113 Group fi nancial statements
280 Shareholders’ analysis
282 Defi nitions
283 Administration
CONTENTS
MA
KIN
G I
T SI
MPL
E
Forward looking statements
Many of the statements included in this document, as well as oral statements that may be made by us or by offi cers,
directors, prescribed offi cers or employees acting on behalf of us, constitute or are based on forward looking
statements.
All statements, other than statements of historical facts, including, among others, statements regarding our mobile
and other strategies, future fi nancial position and plans, objectives, capital expenditures, projected costs and
anticipated cost savings and fi nancing plans, as well as projected levels of growth in the communications market,
are forward looking statements. Forward looking statements can generally be identifi ed by the use of terminology
such as “may”, “will”, “should”, “expect”, “envisage”, “intend”, “plan”, “project”, “estimate”, “anticipate”, “believe”,
“hope”, “can”, “is designed to” or similar phrases, although the absence of such words does not necessarily mean
that a statement is not forward looking. These forward looking statements involve a number of known and unknown
risks, uncertainties and other factors that could cause our actual results and outcomes to be materially different
from historical results or from any future results expressed or implied by such forward looking statements. The
factors that could cause our actual results or outcomes to differ materially from our expectations include, but are not
limited to those risks identifi ed on page 66.
We caution you not to place undue reliance on these forward looking statements. All written and oral forward looking
statements attributable to us, or persons acting on our behalf, are qualifi ed in their entirety by these cautionary
statements. Moreover, unless we are required by law to update these statements, we will not necessarily update
any of these statements after the date of this document, either to conform them to actual results or to changes in
our expectations.
This is Telkom’s second integrated report and we continue to be guided
by the best practise offered to us in terms of compliance with the
Companies Act and King III. Telkom is aware of the need to improve
the service experience at every level and, since this report is one way
of doing just that, we hope to have provided you with a transparent
document that lays out the risks and opportunities that lie ahead as well
as a clear picture of how we are shaping and fulfi lling our strategies to
fi t an ever-evolving telecoms environment.
The guidance set out by King III states that companies should openly
portray the relevant risks, opportunities, governance processes and
strategies so that stakeholders can make better informed choices in
their dealings with the Company. We could not agree more and hence
we have laid out a clear structure and easy way for you to use this report
by referring to the sections listed on the inside fl ap of the cover.
There are also a number of references that we have included to make
it easier for you to refer to places of interest elsewhere in the report, or
ways in which you can access additional information.
Telkom SA Limited is the registered name of the organisation, however,
for ease of reference we have used either Telkom or “the Group” to
represent the Company and its group entities. All subsidiaries, business
divisions and products are referred to by their branded names for easy
recognition.
If you have any recommendations or suggestions as to how we can
improve on our reporting, please refer to the inside back cover of the
2012 Integrated Report for the appropriate contact details.
GRI and King III: refers the reader to an indicator used
in the application of the Global Reporting Initiative (GRI)
guidelines and King III
About this report

Connecting with our stakeholders
Organised labour
Dedicated forums to proactively and
continuously discuss and resolve issues relating
to our workforce.
We add signifi cant value to the South African
society and engage with our respective
stakeholders to ensure they are up to date
with developments in the Group while
simultaneously obtaining their feedback.
InvestorsKeeping investors
informed of the strategy, corporate governance,
operational and fi nancial performance as well as to gain
an understanding of their requirements and
expectations.
GovernorsBriefed regularly on issues of strategy
and Corporate Governance.
CustomersEnhance customer
satisfaction, retention and loyalty.
GovernmentRegular engagement
on policy issues.
Suppliers/partners
Regular meetings focusing onimproving the sourcing and
procurement process to ensure transparency
and fairness.
EmployeesDaily communications
regarding strategic, tacticaland operational issues.
The mediaNumerous briefi ng
sessions to inform the media and thus
the public.
Civil societyDedicated partnership programme funding or
sponsoring various projects across the country.
Telkom Integrated Annual Report 2012 1

2 Telkom Integrated Annual Report 2012
✔
Mission and vision
Connecting
NetworkingRelationshipsTechnologyCommunity
Personal applicationsMachines
People
Putting people fi rstCaring
CommunityEmployees
ShareholdersCustomers
(Business and consumers)
Seamlessly
Customer serviceConvenience
One-stopSimple
Cross-silo
To a better life
ProsperityCommerce/trade
EntertainmentEducation/health
EnvironmentGrowth and renewal
OUR VALUES
C ontinues improvement – Listen, act, learn, innovate.
H onesty – Be real, be open, be truthful.
A ccoutability – If it’s to be, it’s up to me.
R espect – Ensure dignity to all. Protect the environment.
T eamwork – Together we win.
VISION
Leading in the converged ICT market through deep and credible relationships and a distinctive customer experience.
Our vision includes:• Leading the provision of converged solutions.
• Providing a quality network with reach that is unmatched.
• Maintaining our leading brand promise in the business community.
• Creating innovative and pervasive broadband consumer services.
• Being the wholesale provider of choice in selected areas.
• Being the best place to work for, for committed and accountable people.
MISSIONSeamlessly
connecting people to a better life
2 Telkom Integrated Annual Report 2012
Telkom is one of Africa’s largest telecommunications companies, providing integrated communication solutions to both the business and consumer markets. We operate in nine different countries across Africa, with South Africa making up 98.9% of Telkom’s total revenue. We offer fi xed-line, mobile, ICT and data services and provide a wide range of products to suit our customers’ needs.
GRI and King III

Strategy for 2012 – 2013
Telkom Integrated Annual Report 2012 3
Strategy for 2012 – 2013
SHARP AND CLEAR STRATEGIC FOCUS
• Growing and defending profi table
Telkom Business revenues through
entry into high-growth adjacencies
focusing on convergence, value added
services and ICT offerings.
• Delivering on our investment in
Telkom Mobile by meeting the growing
data demand in South Africa and
providing a unique converged offering.
• Growing and defending profi table
revenues in Telkom Consumer Services
and Retail by increasing broadband
penetration in South Africa; while
strengthening our role as a content
aggregator.
• Transforming and upgrading the Telkom
network through the successful rollout of a
commercially-led, IP enabled network.

4 Telkom Integrated Annual Report 2012
The year at a glance
Our results for the year include an R896 million loss relating to the disposal of Multi-Links and an impairment loss of R569 million relating to iWayAfrica. Headline earnings per share declined 33.0% from the prior year. This is mainly as a result of the investment made in our mobile business as well as R605 million additional depreciation as a result of the review of the useful lives of existing network equipment as we invest to transform to a commercially led next generation network. This was partially offset by R739 million voluntary employee severance package costs included in the prior year.
Read more: for information on our fi nancial performance please see page 36
WEB: please visit www.telkom.co.za/ir
GRI and King III
Operating revenue (R million)
5 000
10 000
15 000
20 000
25 000
30 000
35 000
20122011
33 308 33 079
ADSL subscribers
200 000
400 000
600 000
800 000
1 000 000
20122011
751,625827,091
Cash flows from operating activities (R million)
5 188
5 892
1 000
2 000
3 000
4 000
5 000
6 000
20122011
Revenue generating mobile subscribers
300 000
600 000
900 000
1 200 000
1 500 000
20122011
473,604
1,483,401
Share performance 2011 2012 %
Number of ordinary share in issue shares 520,783,900 520,783,900 –
Weighted number of ordinary shares in issue shares 509,311,296 510,593,816 0.3
Headline earnings per share cents 484.8 324.7 (33.0)
Dividends per share cents 300.0 – (100.0)
Ordinary cents 125.0 145.0 16.0
Special cents 175.0 – (100.0)
Market capitalisation Rm 19,269 12,499 (35.1)
Number of ordinary shares traded ('000) 377,766 290,691 (23.1)
Highest price traded cents 39.10 38.49 (1.6)
Lowest price traded cents 32.85 24.00 (26.9)
Closing price at 31 March cents 37.00 24.00 (35.1)

Telkom Integrated Annual Report 2012 5
Revenue from mobile operations (R million)
200
400
600
800
1 000
1 200
20122011
81
1,200
Number of days lost due to injuries
1 000
2 000
3 000
4 000
5 000
6 000
7 000
8 000
20122011
6 970
3 505
Group revenue
Subscriptions and connections
Voice 34%
32%
21%
5%
4%
4%
Interconnection
Data
Mobile
Other and eliminations
EBITDA loss – mobile operations (R million)
1.1
2.2
0.5
1.0
1.5
2.0
2.5
20122011
Skills development (Points)
Achievable weighting
2008 2009 2010 2011
2
4
6
8
10
12
14
16 15
10.489.36 9.65
10.41

6 Telkom Integrated Annual Report 2012
Telkom shareholding at 31 March 2012
Government
39.8%The Government of the
Republic of South Africa is the largest shareholder in
Telkom.
Allan Gray
5.4%
Free fl oat
42.3%The free fl oat makes up the
remainder of the Group’s issued share capital and includes 11,573,158 shares held by 78,918 retail shareholders representing 2.2% of the
Group’s share capital.
Public Investment Corporation
10.5%The Public Investment Corporation (PIC) is an
investment management company wholly owned by the Government. It invests funds on behalf of public
sector entities.
Telkom treasury stock
2.0%Rossal No 65 (Pty) Limited and Acajou Investments
(Pty) Limited hold 2,046,528 shares (0.4%) and 8,143,556 shares (1.6%), respectively.
Read more: for the shareholder analysis please see page 280
GRI and King III

Telkom Integrated Annual Report 2012 7
Telkom operates in nine different countries across Africa, however, our core market is South Africa, contributing 98.9% in revenues.
The fi xed-line is our largest segment and consists of fi xed-line subscription and connection, traffi c, interconnection, data and internet services.
• Telkom Consumer Serving residential customers across South Africa, Telkom Consumer is a dedicated business unit within the Telkom Group. We provide voice and data services to customers in their homes, using Telkom’s national fi xed-line network.
• Telkom Business Telkom Business is the business unit dedicated to serving businesses of every type, industry and size in and outside South Africa. The businesses that we serve range from small and medium enterprises (SMEs) to large corporations, Government organisations and global enterprises. Positioned as the industry leader in telecommunications and ICT in South Africa, Telkom Business offers capability solutions across the technology spectrum.
• Telkom Wholesale and Networks Telkom Wholesale is South Africa’s leading provider of ICT wholesale facilities, services and solutions through our world-class network and ICT expertise. Telkom Wholesale enables customers to grow businesses by offering a variety of ICT wholesale products and solutions that are tailor-made to suit their needs.
We service any intermediary, which is licensed to provide ICT services to a third party. Our current client base includes mobile cellular operators, international ICT companies, services providers, fi xed-line operators and broadcasters, both locally and internationally.
The networks section provide and maintain all the required infrastructure which supports the revenue generating capability of the company.
• 8•ta 8•ta is an innovative mobile service provider that provides South African consumers and enterprises the ability to communicate wherever they are. Launched in October 2010, 8•ta uses state of the art Radio Access Network (RAN), core and IT technology to deliver products that are of high value, simple to use and of high quality.
• Telkom Business Mobile Telkom Business Mobile offers voice, data, messaging and value-added services to business customers.
Telkom Group segment structure
Telkom fi xed-line (revenue contribution: R30.6 billion)
Mobile (revenue contribution: R1.2 billion)
Other
South Africa International
• Trudon (64.9%) (revenue contribution: R1.2 billion) Trudon (Pty) Limited provides yellow and white page directory services, an electronic directory service, 10118 ‘The Talking Yellow Pages’ and an online web directory service.
• Swiftnet (wholly-owned subsidiary) (revenue contribution: R128 million) Swiftnet (Pty) Limited trades under the name FastNet Wireless Data Service. The FastNet suite of services include traditional connectivity services for point-of-sale, managed SIM services and customised wireless and wired Virtual Private Network Services which provide secure data transfer and backup to existing communication links at broadband speeds.
• Cybernest (revenue contribution: R1.4 billion) Our data centre offering consists of basic hosting where customers receive server rack and fl oor space, as well as cooling, power and backup power, managed and fully managed hosting and disaster recovery.
• Corporate Centre (revenue contribution: R78 million) This includes the Group’s human resources, procurement, legal, Corporate Governance, risk management, compliance, regulatory and fi nance functions. The revenue contribution relates mainly to revenue received by the Telkom Foundation from Telkom, that is eliminated on consolidation, as well as revenue from sale of materials.
• iWayAfrica Group (wholly-owned subsidiary) (revenue contribution: R368 million) iWayAfrica Group is an integration of Africa Online Limited and MWEB Africa Limited. With points of presence throughout sub-Saharan Africa, iWayAfrica Group provides customised solutions to Africa’s local, national, pan-African and multinational enterprises. iWayAfrica Group offers a hybrid of access solutions, specialising in both satellite and terrestrial access services to keep businesses connected to the world.
• Telkom International The Telkom International business unit is responsible for managing all subsidiaries.
Read more: for information on the business review please see page 22
WEB: please visit www.telkom.co.za
GRI and King III
Read more: for information on our fi nancial performance please see page 36

8 Telkom Integrated Annual Report 2012
Chairman’s message
It is an honour to be appointed as Chairman of the Telkom Board for a second term. I take the role of providing support and guidance to our stakeholders and to management very seriously. Integrating the desires of our stakeholders with the broader goals of the Group is of particular importance and, in order to achieve this, strong governance principles are required. It is therefore important that all our stakeholders be given a transparent view of how the Board’s role is best utilised to meet the needs of the organisation and the communities within which it operates.
South Africa relies on a stable Telkom that will be around for years to come. For this reason we must pursue the most suitable and sustainable course of action that enriches the lives of our customers. I believe that Telkom has, at its disposal, the ability to provide industry-leading service to its customers, but making this a reality will require hard work and a keen sense of the opportunities and challenges that lie ahead.
THE OVERALL HEALTH OF THE ORGANISATIONThe broader global economic outlook is stormy to say the least and consumers continue to feel fi nancial pressure. The macro-economic environment is tough and the overall health of Telkom must remain our primary focus going forward. Management has put strategies in place to retire legacy technologies and offer new products – such as mobile and converged data offerings – on a transformed Next Generation Network to ensure that Telkom is in the best position possible to meet the future needs of our customers. This must be accomplished in an environment that is seeing increasing pressure on traditional telecoms-related revenue streams and an increased need to invest in newer integrated communication technologies in order to meet the demand for faster, better-quality ICT products that provide better value for money.
While the picture painted of the past year may appear to have presented a Telkom struggling to hold its own in the
face of considerable external pressures, in truth, it has been a year of introspection and serious work having taken place at the Group’s core. Much of the work took place behind the scenes at both a Board level as well as at management level, which the Group Chief Executive Offi cer will speak to later in this report. While certain issues may continue to pose challenges on us for some time still, I am confi dent that the issues around regulatory risk, the burden of increased competition and contracting revenue trends are being handled with the utmost care and effi ciency by Telkom’s management team.
As a whole, the views of management are now better aligned with those of the Board and strategies have been put in place to grow shareholder value and embark on a new journey of ICT delivery.
The Board is aware of the increased capital requirements that will be needed to build Telkom’s Next Generation Network into a competitive, commercially viable investment. It is important to note that, while we are committed to growing shareholder value, we will need to take into consideration the longer-term benefi t of an improved network as the business enters its next phase.
Another key strategic focus area is that of Telkom Mobile. We are the fourth entrant in the mobile space and our competitors have had over 16 years’ experience in the sector. It is essential that Telkom’s mobile offering is sustainable over the long term and to this end it must complement the other strengths and core competencies of the business. Making Telkom Mobile a success is a focused priority for Telkom and will continue to be so in the year ahead.
Telkom’s focus on these two strategic pillars is imperative to ensure sustainability and growth of the Group and will require signifi cant capital investment over the next few years. With due consideration of Telkom’s growth requirements and current capital structure, the Board has decided it would be prudent not to declare a dividend for the 2012 fi nancial year.
Polelo Lazarus ZimNon-executive Chairman
GRI and King III

Telkom Integrated Annual Report 2012 9
The fi nalisation of the sale of our Nigeria operations – Multi-Links – in October 2011 is indeed a signifi cant milestone. We have now successfully curtailed the adverse impact that the investment has had on Telkom’s profi t and cash fl ow levels in recent years and management can now focus on its very clear strategic objectives, unencumbered by further distractions.
Progress has been made with regard to the industry regulator’s process of unbundling the local loop. The Independent Communications Authority of South Africa (ICASA) has clearly laid out what the next steps are in unpacking the issue. The reduction in Telkom’s IP Connect rates demonstrates the Group’s commitment towards playing its role in fi nding solutions in this regard.
The two important matters of independence and sustainability will be dealt with in more detail below.
CORPORATE GOVERNANCE We introduced a number of measures to strengthen the overall governance of the Board during the past year. Two Board sub-committees were established, partly to ensure independence levels were in keeping with King III, while a new Memorandum of Incorporation has been drafted in order to replace the existing version. The latter also takes into consideration the changes in relation to the shareholders’ rights pertaining to Government and the Public Investment Corporation as the class A and class B shareholders, respectively.
The Board approved the revised Business Code of Ethics in 2011 and is committed to conducting the business in an ethical manner based on an ethical foundation.
A full report on our Corporate Governance structures and processes and our governance and enterprise risk profi le can be found on pages 49 and 58 respectively.
INCREASING INDEPENDENCEUpon my re-appointment as Chairman, the question of the overall independence of the Board of Directors was brought to the fore, largely as a result of certain rights held by the Government of South Africa (as the class A shareholder) having expired on 5 March 2011. Under the existing Memorandum of Incorporation, the class A shareholder was, up until the lapsing date, entitled to appoint fi ve directors – including the Chairman – to the Telkom Board.
In response to the need to align the Group with international best practise and the King III guidelines, I am pleased to report that the Board now consists of an increased number of independent directors. The measures taken to ensure the Board is in line with international best practise, JSE Listings Requirements and King III in terms of independence are as follows:
1. The Board was previously limited to a maximum of 12 Board members; this has been increased to 14; six of whom are now independent non-executive directors, six of whom are non-executive directors and two executive directors.
2. Four additional independent non-executive directors were appointed over the course of the year, thus increasing overall independence and bringing valuable new skills and experience to the Board.
3. An Independent Directors’ Committee has been formed to assist with shareholder-related matters in which the Chairman may be confl icted – the Lead Independent Director’s effectiveness was successfully tested during the appointment of the Chairman in February.
4. Mr Sibusiso Luthuli has been appointed as lead independent director and Chairman of the Independent Directors’ Committee. Mr Luthuli’s training as a chartered accountant and his experience as a businessman, coupled with his extensive experience on the Telkom Board, will stand him in good stead as he takes up this vital role.
Those directors presently sitting on the Board, who were appointed by the class A shareholder, will be placed on rotation for re-election as and when their three-year tenure comes to an end.
STRENGTHENING THE BOARDIn addition to the newly upgraded level of independence on the Telkom Board, I am confi dent that the range of skills amongst its members will allow the Board to continue to provide focused support to management when it is required. Five of the present Board members have extensive experience in telecommunications and ICT, including academic experience, policy creation and hands-on industry experience, while the remaining Board members bring necessary skills and experience in accounting, fi nance and corporate action, law, and Corporate Governance as well as executive level experience.
I would like to welcome Dr Sibusiso Sibisi, Ms Nomavuso Mnxasana, Ms Neo Dongwana and Mr Itumeleng Kgaboesele. The Board is grateful to have their skills and I look forward to working with them going forward.
Mr Kgaboesele has taken over as Chairman of the Investment and Transaction sub-committee. As a chartered accountant with several years of investment banking experience, he brings signifi cant expertise and entrepreneurial skills which will greatly contribute to the strength of this committee and of the Board.
DRIVING SUSTAINABILITYIt is important to take into consideration the overarching role that the Group plays in South Africa’s broader economy. We touch many people’s lives on a daily basis and for this reason sustainability is of core importance to the manner in which we put our strategies into practise.
The Social, Ethics and Sustainability Committee was formed during the course of the year to ensure that matters pertaining to the long-term sustainability of the Group, as well as how it conducts itself in relation to the environments within which it operates, be given the utmost attention. The committee is accountable to both the Board and broader stakeholders of Telkom and reports to shareholders at the Company’s Annual General Meeting. This sub-committee was formed to comply with the Companies Act as well as meet the recommendations made by King III and we look forward to reporting on these pertinent issues going forward. The committee is chaired by Ms Julia Hope, a telecoms engineer with extensive experience in broadcasting and telecommunications, as well as ICT regulatory policy formulation and implementation.
10 Telkom Integrated Annual Report 2012
REGULATORY ENVIRONMENTWhile Telkom is committed to playing its part in providing broadband services to all South Africans, it must come with a balanced approach that is not onerous to the Group and its broader stakeholder community.
In order to be sustainable and effective as a group we are committed to building stronger relationships with Government – as the policy maker – as well as the industry regulator ICASA to ensure that the broader social needs are met without placing unnecessary strain or unfair disadvantages on the Telkom Group. We need to work hard at understanding the needs of Government, while putting forward our own requirements as an industry player in an increasingly liberalised market.
Telkom is entering its second decade as a publicly-listed company and has operated as a liberalised entity since 1991. There is a growing sense that the scales have been tipped in favour of Telkom’s competitors for long enough. Telkom management feels it is essential that the regulatory framework be re-assessed to refl ect the current competitive situation in order to ensure that the long-term success of the industry as a whole does not come at Telkom’s expense.
As a Board, we are committed to lending support where necessary towards ensuring that Telkom continues to contribute towards a levelled playing fi eld at all times but that the framework under which we operate is fair to all.
CONCLUSIONIn conclusion I would like to thank the members of the Board for their hard work over the past year and would also like to take this opportunity to welcome our new Board members. Mr Peter Joubert resigned from the Telkom Board in August 2011 – I would like to thank him for his valuable contribution to the Company over the past years.
Our broader stakeholders – especially our customers and our investors – are vital to the health of the organisation and we welcome any suggestions and thoughts on how we can make your Telkom experience more fulfi lling – your steadfast loyalty is greatly appreciated. Lastly I would like to thank Telkom management as well as all our employees for the hard work and dedication to the Group during what has been a very diffi cult year.
The year ahead will be diffi cult for Telkom as we continue to streamline operations and position the Group for fl exibility in the face of a changing telecoms environment. However, it is evident to me that the Group is well on its way to execute on the strategies put in place to ensure we deliver on our promise of seamlessly connecting our customers to a better life.
Lazarus ZimChairman of the Telkom Board
Chairman’s letter (continued)

Telkom Integrated Annual Report 2012 11

12 Telkom Integrated Annual Report 2012
Message from the Group Chief Executive Offi cer
Dear Stakeholder,To summarise the year under review, I would call it a year of clean-up and consolidation across the Telkom Group.
Over the past year we have placed extensive effort on the aligning and streamlining of the Group’s strategies and operations in order to better deliver value going forward. It has been a diffi cult year but one that has been hugely necessary to the future stability of the Group. Much has been accomplished in terms of realising the broader strategy and consolidating our operations but there is much that still needs to be done.
The Group faced continued erosion of the traditional fi xed-line business, while simultaneously bearing the burden of increased costs associated with positioning the Group to meet the growing broadband and mobility needs of our consumers. Demand for faster products at lower prices continues to put the Company under pressure and the impending notion of a recession means that our larger consumers are stockpiling resources somewhat and are hesitant to invest in telecoms services.
Fixed-line continues to be under pressure from competition and substitution by mobile, especially in terms of voice minutes. Data, however, continues to be an area of growth and we believe the point at which the contributions of data and of voice will be one-to-one is not far off.
FINANCIAL HIGHLIGHTSOur results for the year include an R896 million loss relating to the disposal of Multi-Links and an impairment loss of R569 million relating to the goodwill and assets of the Telkom International subsidiary iWayAfrica. Headline earnings per share declined 33.0% from the prior year. This is mainly as a result of the investment made in our mobile business as well as additional depreciation of R605 million as a result of a review of the existing network equipment in terms of its useful life as we invest to transform to a commercially-led, Next Generation Network. This was partially offset by R739 million
voluntary employee severance package costs included in the prior year. Overall, we have managed to contain operating costs – excluding depreciation, amortisation impairments and write-offs – to below infl ationary increases.
The Group faced continued erosion of the traditional fi xed-line business with fi xed-line traffi c revenue decreasing by 8.0%. Despite the decline in traffi c volumes and pricing pressure we managed to limit the fi xed-line revenue decline to 2.8%. The Group generated R2.1 billion free cash fl ow for the year under review.
Demand for faster products at lower prices continued to put our data revenue under pressure.
DIVIDENDTelkom decided not to declare a dividend in respect of the fi nancial year ended 31 March 2012. While our current fi nancial position should allow us to fund network transformation and build our data driven mobile offering, the Board has decided that it is prudent to allow for more internally generated funding for the capital expenditures planned over the next three years. This will better position Telkom to weather uncertainties as we advance our value building strategy.
Telkom’s strategic objectives of network transformation and the building of its mobile business will see dividends being considered on an annual basis based on the performance of the Group.
MULTI-LINKS SALE CONCLUDEDThe sale of Telkom’s Nigerian operation Multi-Links was concluded in October 2011. While the process faced more challenges than we were anticipating, management is satisfi ed that Telkom is now better positioned to focus on delivering better results in its core business without further distraction from non-aligned operations. We believe that the negative fi nancial and legal ramifi cations associated with retaining Multi-Links would have had a far more
Nombulelo MoholiGroup Chief Executive Offi cer
GRI and King III

Telkom Integrated Annual Report 2012 13
negative impact on the Group than divesting as quickly and profi ciently as we did.
TELKOM MOBILETelkom Mobile has been well-received by the market and the acquisition of customers has exceeded expectations. Converting these numbers into strong revenue has been somewhat disappointing, especially in the pre-paid segment. This was largely due to an under-estimation of the deep relationships that some of our competitors have with certain distributors. We have prioritised the need to improve our distribution network and have already seen an increase in distribution using larger retail channels. We also intend increasing our direct channel footprint up to threefold by the end of the year and develop effective channel mix capacity for main target segments.
The overall roll-out has been slower than we originally anticipated, primarily because the current strategy depends largely on acquiring base stations from our competitors, with varying degrees of co-operation. Early indications are that we may need to invest further in our base station coverage to meet growing data needs and provide better coverage. We are, however, already utilising our own network for the majority of our data delivery.
Going forward, we intend to focus on areas in which Telkom Business Mobile and 8•ta can differentiate their brands and provide further value-added services to customers.
TRUDONTelkom holds 64.9% of the printing and electronic directory listing group Trudon with the remainder held by Belgium’s Truvo.
Trudon continues to follow its consumers online as print readership continues to face decline. New product offerings from the likes of Google are adding additional pressure to the Group with free listing opportunities and the like. However, there is still potential upside in the medium term and Telkom has taken the decision to invest further in this asset going forward.
SWIFTNETSwiftnet continues to offer valuable services in the credit clearance and debit card market. We are embarking on a major technology refresh programme away from the radio-based X.25 technology towards mobile technology to offer a better service to our customers in the point-of-sale verifi cation, security and fl eet management services.
ALIGNING LEADERSHIP GOALSI am pleased to report that the extensive time spent balancing the views of the Telkom Board with that of management has paid off. There is a new energy within the management team and I am satisfi ed that Telkom’s leadership is committed to taking the Group to the next level.
We continue to be dogged by the historical perceptions of poor delivery and, being acutely aware of this, have now put measures in place to ensure leadership development is a priority.
A NEW SET OF VALUESWe are beginning to see improvements in overall morale and attitude across the Group. Changing the culture of an organisation is not easy and will take years to get to a point that I would believe is satisfactory. However, it is essential that we foster a culture that champions customer service at every level. I take great pride in knowing that our employees themselves came up with the values with which we will take the Company forward, those of continuous improvement, honesty, accountability, respect and teamwork. These values form the foundation of our business code of ethics, which sets out Telkom’s standards for ethical behaviour. We are committed to conducting our business in an ethical manner and I personally commit to the standards outlined in our code of ethics.
STRATEGIC PARTNERSHIPSOn 8 May 2012, Telkom announced that it had reached an in-principle agreement with Korea’s KT Corporation regarding the terms of a potential strategic venture that would, if implemented, have resulted in KT acquiring a strategic equity shareholding of 20% in the post-issue ordinary share capital of Telkom. Telkom and KT would also have entered into a fi ve-year co-source management services agreement to identify areas of mutual strategic and business co-operation.
On 30 May 2012, Telkom was informed by the Honourable Minister of Communications that the proposed transaction between the companies had been presented to the cabinet of the South African Government and that cabinet had taken the decision not to support the transaction as proposed. Telkom will continue to engage the South African Government further.
THE REGULATORY ENVIRONMENTThe telecoms and ICT environment has changed signifi cantly from where it was 10 years ago and we would like to see a full review of the industry regulations. For example, it is not sustainable for one company in an open market to continue to be under price control in perpetuity. Also, the roll-out and maintenance strategy for public payphones that Telkom must carry in line with its operating licence is unnecessarily burdensome on the Company in our view.
I would ultimately like to see a scenario in which all wholesale operations are regulated while the retail operations remain open to free-market principles. In my view, this would allow for a greater uptake of broadband services while fostering
This is our second integrated annual report. We have, once again, been guided by King III governance principles to deliver a transparent, user-friendly and accessible document to you. We are making every effort to allow the integrated approach to infuse the way we talk to our stakeholders.
We would value any feedback from you in this regard, please refer to the front of the report for information on how you can help us to get better insight into what you want to read in future reports.
This is our second integrated annual report. We have,once again, been guided by King III governanceprinciples to deliver a transparent, user-friendly andaccessible document to you. We are making everyeffort to allow the integrated approach to infuse theway we talk to our stakeholders.
We would value any feedback from you in this regard,please refer to the front of the report for informationon how you can help us to get better insight into whatyou want to read in future reports.

14 Telkom Integrated Annual Report 2012
Message from the Group Chief Executive Offi cer (continued)
an environment that will increase competition and decrease the costs of telecommunications and ICT services to for the end-user.
Local loop unbundling (LLU)We continue as Telkom to be fi rm that discussions around LLU should not be seen in isolation but rather in terms of what we want to achieve in terms of broadband penetration as a country. We believe that fi xed-line broadband, as it is the case today, has already been overtaken by mobile broadband in terms of the numbers of subscribers and therefore the fi xation with local loop unbundling may have been overtaken by time. Telkom believes that the regulatory burden placed on Telkom is not sustainable for Telkom or the country.
We will continue to engage with the industry regulator on matters affecting Telkom’s strategy.
Increasing broadband penetration and meeting Government’s ICT targetsThe Group is focused and willing to assist the South African Government with its vision to create higher broadband penetration in South Africa by 2020. We look forward to exploring future public-private partnerships in order to assist Government in achieving its objectives. In our view, the fastest and most viable means of ensuring broadband accessibility is using wireless technology and we look forward to engaging with Government to fi nd meaningful means of rolling out this technology.
Taking Telkom forward – unpacking the Group strategyWe have reviewed and refi ned Telkom’s strategic intent across the various key business areas as follows:
Growing and defending profi table Telkom Business revenues Telkom Business aims to become the industry leader in fi xed and converged communication services as well as a serious contender in cloud-related and services to the South African business market, within the next fi ve years. In order to achieve this, it is essential that we utilise the services offered across the Telkom network, leveraging off our broader Telkom network while making use of data centre services spearheaded by Cybernest as well as Telkom Mobile to provide relevant fi xed-mobile convergence (FMC) and unifi ed communication services to South African businesses.
Delivering on our investment in Telkom MobileThe broader mobile business strategy to defend erosion in our fi xed-line business while growing converged delivery channels to our customers is a key priority. We are committed to ensuring that all investments deliver value to our shareholders, and to this end we will focus closely on our mobile business strategy to ensure that it aligns to this outcome.
Meeting the growing data demand in South Africa is a core feature of our mobile strategy and it is essential that this be done in such a way that it does not lead to cannibalisation of our other services. Instead, we must offer services that reward
the customer for using Telkom’s products with varying levels of incentives depending on the customers’ level of loyalty.
Growing and defending profi table revenues in Telkom Consumer Services and RetailGlobally, our peers in the fi xed-line and broader telecoms space are battling the same dwindling revenue streams and the same unyielding demand for lower prices as we are. Consumers are entering a new era, in which they will be less tolerant of the boundaries between communication channels and more demanding in terms of their data needs. In short, consumers require a seamless communication connection to complement their everyday lives.
Using Telkom’s extensive network and integrating this with consumer related products such as mobile we are uniquely positioned to meet the future demand for converged communications and increased broadband needs.
We intend to work more closely with partners to offer value-added broadband services. The products that we would look at investigating are those that are bandwidth intensive. As an example, Telecoms companies worldwide continue to exploit video-on-demand services and Telkom would look into this as a potential future value-added service. The group recently signed an agreement with electronics manufacturer Samsung to provide entry-level Smart TV services to consumers and we expect further innovations in this regard going forward.
Transforming and upgrading the Telkom network The democratisation of information is upon us and ICT players will have to keep up in order to survive. Telkom’s investment in the Next Generation Network will enable the local loop to offer speeds of 10 Mbps and higher in selected areas to allow us to offer new services and better quality products.
In moving toward becoming a true data provider we will need to make use of the entire spectrum of services across the network. In order to achieve this we will need to ensure that our network upgrade is rolled out profi ciently, on a commercially viable basis.
Following a year of extensive planning, the implementation of the network transformation process will come online during the course of this year. There is much that needs to take place in terms of upgrading our network to meet tomorrow’s needs, however, the process has kicked off successfully with clear deliverables in place and we have since achieved major traction against these plans as we work towards delivering an all-IP (internet protocol) network, designed to enable fi xed-mobile convergence and truly differentiated high-speed broadband.
The network transformation intent is to take our fi bre deeper into the network and smartly leverage a mix of high-speed broadband access technologies. Our aggregation network is increasingly able to support super-fast transmission and enable a superior browsing experience. We have already evolved our national and regional transmission network from carrying Gbps to Tbps with great resilience and manageability. Our international connectivity has received a major boost to ensure worldwide reach with superb capacity and resilience.
Telkom’s network transformation is bound to change the face of broadband capability in South Africa.
Sustainability and environmental approach Perhaps no other sector besides telecommunications is better positioned to facilitate the shift towards sustainable,
A detailed breakdown of the fi nancial performance of our various business segments can be found on page 36, while strategic information relating to the Group’s business divisions can be found on page 22.
A detailed breakdown of the fi nancialperformance of our various business segmentscan be found on page 36, while strategicinformation relating to the Group’s businessdivisions can be found on page 22.

less energy-intensive business practices. But like most of our peers in this ‘low-to-medium impact sector’ we are still in the early stages of developing our strategy to embed sustainability practices in all aspects of our business operations.
Our approach to sustainability has been guided by the fact that we operate in a resource constrained world where responsible corporate citizens need to fi nd initiatives for the more effi cient use of natural resources such as energy and water. Telkom is involved in a range of activities to reduce energy consumption through more intelligent usage as well as investment in more energy effi cient infrastructure. We continue to invest in better monitoring systems to understand and improve our water usage. Although no targets have been set, Telkom is currently in the process of developing them for these priority areas.
The Telkom sustainability strategy, which is expected to be formally approved by the Telkom Board during the second half of 2012, seeks to ensure the integration of sustainability considerations into our business plans, decision-making processes and our operations.
We recognise that sustained investment in the skills and wellness of our staff is necessary to achieve a competitive advantage over the longer term. Thus, it is with great sadness that I must report the death of two colleagues while on duty. No fatality is acceptable and we will continue to invest in measures that reduce workplace risks for our workforce. In this context it is pleasing to note that over the past fi ve years our interventions have led to a steady, if gradual, decline in the lost time injury frequency rate as well as more than a 50% decline in the number of days lost per employee as a result of safety incidents. This indicates a signifi cant overall reduction in the severity of workplace incidents.
Going forward we will continue to target interventions at priority risk areas and achieving our performance targets developed by Telkom’s various business units. This will be done through the setting of long-term performance targets and developing the systems that will allow us to report more formally on our progress against the Global Reporting Initiative (GRI) guidelines for sustainability reporting.
OUTLOOK AND CONCLUSIONTelkom faces many challenges at the moment but we will advance calmly and in a determined manner while remaining focused on delivering on the promise of our business and strategy going forward. Group fi nancial results for the year under review have refl ected the challenges that we are currently facing as a Company but we have taken a number of signifi cant steps towards securing a successful future for Telkom and have begun casting the foundation that will allow the Group to compete well against its peers and build value in the future. Our strategy going forward is clear and focused.
The Group is now more stable and more accountable from a management perspective and we are committed to increasing our productivity levels in order to facilitate the seamless delivery of connectivity to all our customers.
In conclusion I would like to thank the Telkom employees for your hard work over the year as well as our other stakeholders for your loyalty and support. We are committed to growing value for all our stakeholders and I look forward to continuing this journey with you.
Nombulelo MoholiGroup Chief Executive Offi cer
Telkom Integrated Annual Report 2012 15

16 Telkom Integrated Annual Report 2012
Board of Directors
1 2 3
4 5 6
7 8 9
10 11 12
13 14
Telkom Integrated Annual Report 2012 17
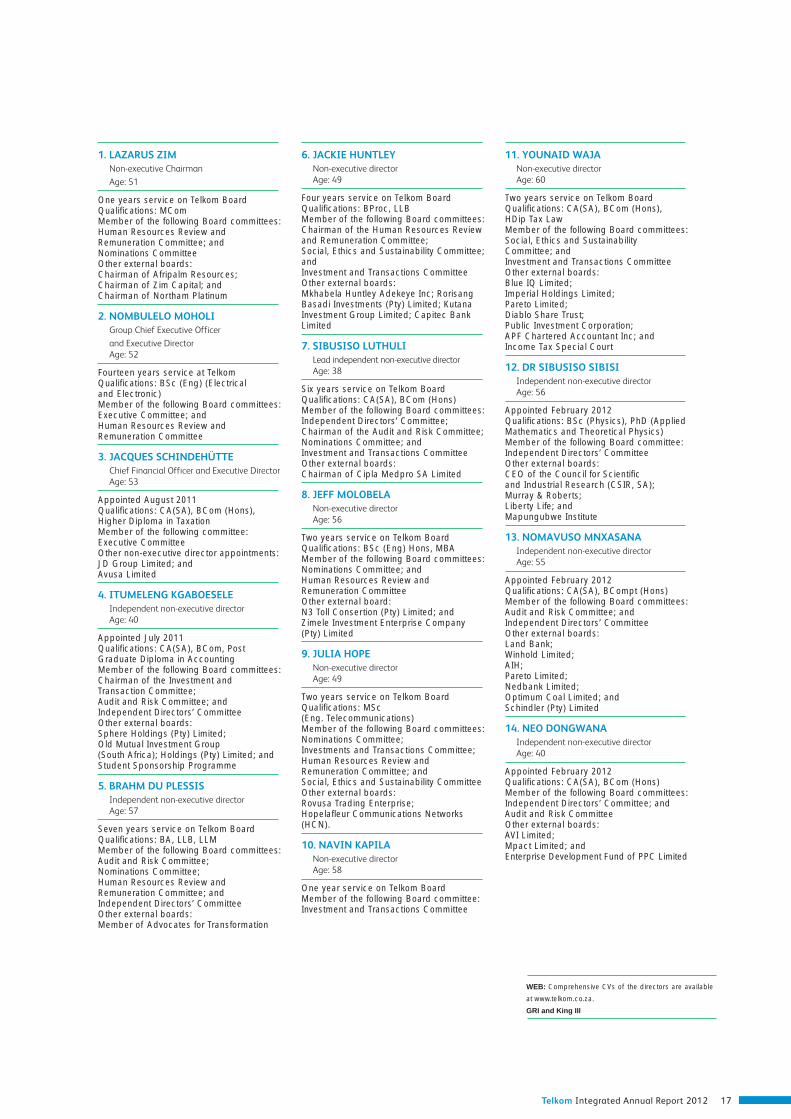
1. LAZARUS ZIMNon-executive Chairman
Age: 51
One years service on Telkom BoardQualifi cations: MComMember of the following Board committees:Human Resources Review and Remuneration Committee; andNominations CommitteeOther external boards:Chairman of Afripalm Resources;Chairman of Zim Capital; andChairman of Northam Platinum
2. NOMBULELO MOHOLI Group Chief Executive Officer
and Executive DirectorAge: 52
Fourteen years service at TelkomQualifi cations: BSc (Eng) (Electrical and Electronic)Member of the following Board committees:Executive Committee; andHuman Resources Review and Remuneration Committee
3. JACQUES SCHINDEHÜTTE Chief Financial Officer and Executive DirectorAge: 53
Appointed August 2011Qualifi cations: CA(SA), BCom (Hons), Higher Diploma in TaxationMember of the following committee:Executive CommitteeOther non-executive director appointments:JD Group Limited; andAvusa Limited
4. ITUMELENG KGABOESELEIndependent non-executive directorAge: 40
Appointed July 2011Qualifi cations: CA(SA), BCom, Post Graduate Diploma in AccountingMember of the following Board committees:Chairman of the Investment and Transaction Committee; Audit and Risk Committee; andIndependent Directors’ CommitteeOther external boards:Sphere Holdings (Pty) Limited;Old Mutual Investment Group (South Africa); Holdings (Pty) Limited; andStudent Sponsorship Programme
5. BRAHM DU PLESSISIndependent non-executive directorAge: 57
Seven years service on Telkom BoardQualifi cations: BA, LLB, LLMMember of the following Board committees:Audit and Risk Committee;Nominations Committee;Human Resources Review and Remuneration Committee; andIndependent Directors’ CommitteeOther external boards:Member of Advocates for Transformation
6. JACKIE HUNTLEYNon-executive directorAge: 49
Four years service on Telkom BoardQualifi cations: BProc, LLBMember of the following Board committees:Chairman of the Human Resources Review and Remuneration Committee;Social, Ethics and Sustainability Committee; andInvestment and Transactions CommitteeOther external boards:Mkhabela Huntley Adekeye Inc; Rorisang Basadi Investments (Pty) Limited; Kutana Investment Group Limited; Capitec Bank Limited
7. SIBUSISO LUTHULILead independent non-executive directorAge: 38
Six years service on Telkom BoardQualifi cations: CA(SA), BCom (Hons)Member of the following Board committees:Independent Directors’ Committee;Chairman of the Audit and Risk Committee;Nominations Committee; andInvestment and Transactions CommitteeOther external boards:Chairman of Cipla Medpro SA Limited
8. JEFF MOLOBELANon-executive directorAge: 56
Two years service on Telkom BoardQualifi cations: BSc (Eng) Hons, MBAMember of the following Board committees:Nominations Committee; andHuman Resources Review and Remuneration CommitteeOther external board:N3 Toll Consertion (Pty) Limited; andZimele Investment Enterprise Company (Pty) Limited
9. JULIA HOPENon-executive directorAge: 49
Two years service on Telkom BoardQualifi cations: MSc (Eng. Telecommunications)Member of the following Board committees:Nominations Committee;Investments and Transactions Committee;Human Resources Review and Remuneration Committee; andSocial, Ethics and Sustainability CommitteeOther external boards:Rovusa Trading Enterprise; Hopelafl eur Communications Networks (HCN).
10. NAVIN KAPILANon-executive directorAge: 58
One year service on Telkom BoardMember of the following Board committee:Investment and Transactions Committee
11. YOUNAID WAJANon-executive directorAge: 60
Two years service on Telkom BoardQualifi cations: CA(SA), BCom (Hons), HDip Tax LawMember of the following Board committees:Social, Ethics and Sustainability Committee; andInvestment and Transactions CommitteeOther external boards:Blue IQ Limited;Imperial Holdings Limited;Pareto Limited;Diablo Share Trust;Public Investment Corporation;APF Chartered Accountant Inc; andIncome Tax Special Court
12. DR SIBUSISO SIBISIIndependent non-executive directorAge: 56
Appointed February 2012 Qualifi cations: BSc (Physics), PhD (Applied Mathematics and Theoretical Physics)Member of the following Board committee:Independent Directors’ CommitteeOther external boards:CEO of the Council for Scientifi c and Industrial Research (CSIR, SA);Murray & Roberts;Liberty Life; andMapungubwe Institute
13. NOMAVUSO MNXASANAIndependent non-executive directorAge: 55
Appointed February 2012Qualifi cations: CA(SA), BCompt (Hons)Member of the following Board committees:Audit and Risk Committee; andIndependent Directors’ CommitteeOther external boards:Land Bank;Winhold Limited;AIH;Pareto Limited;Nedbank Limited;Optimum Coal Limited; andSchindler (Pty) Limited
14. NEO DONGWANA Independent non-executive directorAge: 40
Appointed February 2012Qualifi cations: CA(SA), BCom (Hons)Member of the following Board committees:Independent Directors’ Committee; andAudit and Risk CommitteeOther external boards:AVI Limited;Mpact Limited; andEnterprise Development Fund of PPC Limited
WEB: Comprehensive CVs of the directors are available
at www.telkom.co.za.
GRI and King III

18 Telkom Integrated Annual Report 2012
6. THAMI MSUBOChief of Human ResourcesAge: 46
Years of service at Telkom: 1BA Public Management (Hons), Bachelors of Economics in Public Management
Executive Committee
1. MOTLATSI NZEKU Managing Director: Telkom International
and SubsidiariesAge: 51
Years of service at Telkom: 16
BSc Mathematics and Physics, BEng (Hons)
3. BASHIER SALLIE Managing Director of Wholesale
and NetworksAge: 44
Years of service at Telkom: 26
MDP
5. NOMBULELO MOHOLI Group Chief Executive Officer and
Executive DirectorAge: 52
Years of service at Telkom: 14Qualifi cations: BSc (Eng) (Electrical and Electronic)
2. DEON FREDERICKSDeputy Chief Financial OfficerAge: 51
Years of service at Telkom: 18
CA(SA), BCom Business Management (Hons)
4. JACQUES SCHINDEHÜTTE Chief Financial Officer
and Executive DirectorAge: 53
Years of service at Telkom: 1
Qualifi cations: CA(SA), BCom (Hons), Higher Diploma in Taxation

Telkom Integrated Annual Report 2012 19
8. DR BRIAN ARMSTRONGManaging Director of Telkom BusinessAge: 51
Years of service at Telkom: 2
PhD, MSc (Eng) (Electrical), BSc (Eng) (Electrical)
7. OUMA RASETHABAChief of Corporate GovernanceAge: 51
Years of service at Telkom: 6
BProc, LLB (Hons), higher diploma in Company Law, LLM
9. MANELISA MAVUSO Managing Director of Consumer Services
and RetailAge: 41
Years of service at Telkom: 2
BEcon
WEB: Comprehensive CVs of the directors are available
at www.telkom.co.za.
GRI and King III

20 Telkom Integrated Annual Report 2012
Industry overview
THE REGULATORY ENVIRONMENTThe regulatory environment has seen much activity over the past year. Telkom continues to engage with the Independent Communications Authority of SA (ICASA) on a variety of issues including local loop unbundling, the access line defi cit, interconnection rates and spectrum fees.
Self-provision and fi xed-line voice competitionAs the incumbent fi xed-line operator in South Africa, fi xed-line voice revenue is and has been at the core of our business. The playing fi eld was changed with the introduction of Neotel, which competes with us in all markets, and the granting of an electronic communications network service (ECNS) licences to the state-owned Broadband Infraco (Pty) Limited, whose main objective is the provision of wholesale bandwidth to other licensees at cost-based prices. Other licensees, including the mobile operators, who used to obtain their core transmission infrastructure from us, are now adequately licensed to provide their own infrastructure and also to provide it to other licensees, in competition with Telkom’s network services.
Spectrum licence fees and accessAdministrative incentive pricing (AIP) of spectrum was introduced through regulation by ICASA in 2010 to incentivise spectrum users to make the most effective and effi cient use of the radio frequency spectrum, specifi cally with regard to spectrum use in rural areas. Although implementation of these regulations was initially deferred to 1 April 2012, there remains a level of uncertainty regarding the implementation of the various formulae and data tables and we continue to engage with ICASA to clarify the situation. As previously reported, while we expect the proposed fee structure to increase our spectrum fees, we are looking at various options to reduce this amount.
Review of universal service obligationsIn August 2010, ICASA issued a discussion document on the review of universal service and access obligations (USAOs). As indicated in the previous year’s report, we have submitted our views on the proposed USAO model to ICASA but no further progress has taken place. We are still of the belief that there will need to be further consultations with ICASA before the regulations are fi nalised.
Price controlsWe have fi led our retail tariffs in accordance with the regulations governing the standard terms and conditions for individual licences, which contemplate that such tariffs be fi led with ICASA, seven days before they become effective, but does not require ICASA approval of those tariffs.
Local loop unbundlingLocal loop unbundling (LLU) in its original form is a regulatory mandated process that enables multiple telecommunications operators to access and provide services over the ‘last mile’ infrastructure – from the local exchange to the customer’s premises – that is traditionally owned by the incumbent operator. There are other forms of wholesale services, including that known as BitStream, which could give operators access to our broadband infrastructure without requiring the physical unbundling of the loop.
After a fairly lengthy consultation process ICASA has come to the conclusion that LLU is a fairly complex and costly process that will require the conduct a regulatory impact analysis before it is mandated by regulation, as well as a market review to determine the necessity and scope of any LLU regulation. On this basis, ICASA has suggested that in the interim BitStream should be offered by Telkom from November 2012.
Mobile and fi xed-line termination ratesICASA has imposed new termination rates, which came into effect on 1 March 2010. Our two larger competitors – Vodacom and MTN – are required to reduce their termination rates, in step measures, from R0.89 to R0.40 by 1 March 2013. Also from 2013 there will be no difference between peak and off-peak rates for call termination services.
The smaller players – being ourselves (8•ta) and Cell C – are entitled to charge up to 20% more than MTN and Vodacom for calls terminated on each of our respective networks between 1 March 2011 and 28 February 2012. After that date, the maximum premium charged would fall to 15% and then to 10% in March 2013.
COMPETITION – VOICE REVENUES WILL CONTINUE TO BE ERODEDAs an integrated communications service provider, Telkom offers packaged fi xed and mobile voice, data, broadband and internet services to business and residential customers, mostly in South Africa. As a result of the Electronic Communications Act, the licensing framework has resulted in a more horizontally layered market with a large number of electronic communications and broadcasting licences issued, This has led to increased competition in our industry.
Our competitors continue to self-provide in the infrastructure development space and this trend is unlikely to abate anytime soon. Demand for faster services at cheaper rates is driving the aggressive rollout of fi bre and infrastructure services. The introduction of the planned upgrade to
The South African market has felt the effects of slowing voice and mobile revenues and there has been an increased level of competition from local telecoms companies defending their own interests. Added to this, there is a promulgation of non-traditional players in the internet space now joining the fray with their own inexpensive communications solutions.
Telecoms operators will have to look at new, adjacent offerings in order to grow their revenues. The upside is that with the introduction of new technologies and services, such as fi xed-mobile convergence, there is the potential that the existing revenue streams may be protected by an increased desire for high-speed, quality data.

Telkom Integrated Annual Report 2012 21
our network will go a long way to ensuring that we can provide our own unique offering in this regard and entice other mobile operators to utilise our network services. A commercially-led and viable pricing model in this regard will further enhance our capabilities.
An increase in the use of voice over IP (VoIP) technology is a further threat to our voice revenues and the best way to mitigate this risk is to ensure that we are competing with an upgraded and transformed, all-IP network as quickly as possible. In addition, we will continue to offer suitable products and services that grow our share of the data market in both fi xed-broadband ADSL and mobile.
The introduction of 8•ta in the mobile space has certainly increased competition in the sector. The existing major players have responded with aggressive deals and this is likely to continue. Although customer growth rates may slow over the medium term, we believe there are suffi cient credible opportunities to ensure that Telkom creates a niche for itself in the broader industry. Fixed-mobile convergence (FMC) and unifi ed communications are likely to become more important from a long-term perspective, while faster mobile data and content are likely to be at the top of the consumer’s medium-term telecommunications needs.
It is likely that telecommunications operators will focus on extracting as much value out of their existing clients resulting in an increased battle to secure the customer’s loyalty going forward.
DATA DEMAND WILL CONTINUE TO INCREASEThe South African consumer is becoming increasingly more aware of global trends in ICT and data consumption and continues to demand a faster, more stable data service at a lower price. Data, and in particular mobile data, is expected to see substantial growth in future. We have already begun the process of increasing the minimum speeds of our fi xed-line ADSL network and recently increased our minimum ADSL speed from 384 Kbps to up to 1 Mbps. Further improvement in this area is reliant on the speed at which we can action the network transformation and upgrade. We are also aware of the opportunities surrounding content delivery – that is more bandwidth intensive – and will be focusing on unlocking potential avenues that will enable consumers to use our data products and network services more effectively.
FMC as well as unifi ed communications and cloud computing will present further opportunities for Telkom to take advantage of potential adjacent revenue streams. We intend to consolidate our position in this regard and accelerate our data offerings to take a leading role in bringing these services to the market.
Actual and forecasted broadband subscribers
00
1616
010
5747
1639
187133
43131
421247
64353
832
Bro
adb
and
su
bsc
rib
ers
(’00
0)
415
82
509
1 172
582
83
721
1 671
867
90
856
2 417
1 472
97
979
3 405
2 329
108 116
1 331
3 858
5 305
1 180
4 489
3 202
122
1 444
5 914
4 349
128
1 568
6 585
4 889
126
1 520
6 326
4 680
1 000
2 000
3 000
4 000
5 000
6 000
7 000
Dec 2016Dec 2015Dec 2014Dec 2013Dec 2012Dec 2011Dec 2010Dec 2009Dec 2008Dec 2007Dec 2006Dec 2005Dec 2004Dec 2003
Fixed Nomadic Mobile Total market
Fixed-line technology market share (Voice channels)
Mar
ket s
har
e (%
)
11
100 100 100 100 100 99 98 97 96 95 94 92 91 89
986543210000010
20
30
40
50
60
70
80
90
100
Dec 2016Dec 2015Dec 2014Dec 2013Dec 2012Dec 2011Dec 2010Dec 2009Dec 2008Dec 2007Dec 2006Dec 2005Dec 2004Dec 2003
VoIP PSTN
Source: Africa Analysis: SA Telecoms model

22 Telkom Integrated Annual Report 2012
Business review
Telkom’s South African operations contributes 98.9% towards Telkom’s total revenues. It is made up of a number of consumer- and business-focused operations in voice and data across both fi xed-line and mobile. The divisions (detailed below) are largely cross-functional and share services wherever possible. Telkom South Africa is constantly looking for fresh opportunities to grow its revenue streams beyond that of traditional fi xed-line voice and has made aggressive forays into mobile and data to position Telkom for better future growth.
Below is a breakdown of the various business segments, their product offering and growth prospects; as well as the general outlook for the year ahead:
Telkom Business provides services to approximately 330,000 registered businesses in South Africa. A massive portion of the economy is reliant on Telkom services and we are well positioned to leverage off this existing client base by providing further ICT solutions to assist these businesses with their everyday requirements and to meet expected bandwidth demand growth.
We have made good progress on the uptake of voice discount plans, specifi cally by winning back business lost to least cost routing in the past; this is helping to mitigate the downward pressures on fi xed voice revenues. Overall revenues from data products showed modest yet encouraging growth over the period indicating that the strategy of managing price declined in concert with volume growth is effective. There is, however, a need to rapidly evolve our portfolio to meet the demands of the market for increased bandwidth, greatly reduced unit cost, and technology substitution, as well as to transform our sales channels to become sellers of ICT services rather than purely sellers of fi xed-lines.
Telkom Business Mobile was launched during the course of the year. The overall response from the market in terms of the features and overall quality of our products has been positive. We are now placing strong emphasis on securing stable distribution channels and re-skilling existing direct sales channels such as Telkom Direct Stores and Telkom Business client services staff. The introduction of the next generation network (NGN) will underpin the next generation
broadband, fi bre and cloud products we will begin to offer across Telkom Business customer segments, as well as enable evolution of the Telkom Business Mobile portfolio and continued progress with fi xed-mobile convergence (FMC) and Unifi ed Communications offerings.
Overall customer satisfaction levels are positive, especially so in our largest customer segment – the larger South African corporates. In terms of customer relationship leadership, we continue to make good progress, a fact that can be seen in the Telkom Business brand survey results, which have been most encouraging. Compared to our competitors we have by far the highest level of bonding. In terms of service levels, our managed services show very good and continually improving results, and our large project implementation teams are delivering exceptional performance.
Overall service improvements were as follows:
• 98.7% of Telkom Business customer SLAs met or exceeded;
• 99.2% on time delivery on large customer project implementation;
• 14% improvement in Enterprise/Wholesale broadband delivery;
• Top 2 box scores for quality to corporates 57% to 60%;
• Top 2 box scores for quality to wholesale 51% to 58%; and
• 11.2% improvement on consumer broadband delivery.
TELKOM BUSINESS…Data driven, we will continue to build on our strengths
Telkom strategy What did we achieve this year? Our commitments for 2013
• Leading the market in the provisioning of fi xed and converged communications services
• Transforming the way IT is delivered, through the Cloud
• Successfully defended our number one position in the business market.
• Secured strategic growth deals with clients including Old Mutual, Nedbank, Department of Communications and Standard Bank.
• Succeeding with fi xed-to-mobile win-back initiatives.
• Launched Telkom Business Mobile.
• Launched Telkom Business uncapped internet.
• Progressed our FMC and unifi ed communications capability.
• Further improved excellent managed services delivery and project implementation performance.
• Improvement in Telkom Business brand and reputation.
• Delivered 12% year-on-year revenue growth in Cybernest, our data centre offering.
• Launch productised cloud services Supplement existing, bespoke services with
an initial tranche of productised cloud-based services primarily aimed at the SMB segment including Hosted Exchange; Backup-as-a-Service; Payroll-as-a-Service and CRM-as-a-Service.
• Launch pre-packaged and tailor-made FMC bundles
Launch fi xed-mobile bundles. Allow customers to choose between basic, advanced, premium or customised converged voice and data deals with a compelling value proposition.
• Re-positioning our fi bre portfolio Make it easier and cheaper for our customers
to access fi bre services to satisfy their ever increasing demand for bandwidth.

Telkom Integrated Annual Report 2012 23
We are working on providing a more focused level of customer care at small business level to foster the similar levels experienced amongst our larger corporates, which tend to have dedicated client services personnel. This will, however, take time to implement.
The public sector has been a challenge; while we have made progress in terms of slightly increased revenues in the last year, sales cycles for new contracts have taken longer than expected to complete. This may be symptomatic of the sector but could also be an early warning sign of changing public sector market dynamics and downward pressure on revenues going forward. We are working hard to align the strategic intent between ourselves and Government, for example the role of Telkom where local authorities plan to deploy their own fi bre telecommunications infrastructure, and how Telkom can support Government’s broadband aspirations.
Our core product innovations and launch performance has improved substantially over the past year. Whereas two years ago we were taking far too long to get new products to the market, we have been ahead of the curve in many instances and continue to reshape and innovate our offerings to allow for further demand-driven products to enter the market.
Telkom Business has placed signifi cant effort on evolving its metro-Ethernet fi bre product portfolio. On the broadband side we have responded well to market demands by launching uncapped ADSL, high-speed ADSL and a number of bundled products. We also launched our Offi ce Link products to suit the needs of the small- and medium- sized business. We will also continue with the evolution of our Virtual Private Network (VPN) Supreme portfolio, which we believe is a world-class, market leading product in South Africa, in terms of access options, quality of service options and value-added benefi ts. We intend to grow our share of the VPN market into the medium business sector as well as continue to grow ADSL in the small business category.
ICT is expected to be the biggest growth sector in South Africa over next fi ve years and we intend to capitalise on this growth in an effi cient and sustainable manner. We are pursuing a joint organic and inorganic approach to this opportunity, and as we have reported, we continue to explore acquisition opportunities in the ICT sector.
We will consistently focus on maximising the performance of our existing products to retain customers and ensure we offer the best value proposition in the market. We will continue to seek new revenue streams from adjacent areas in ICT as well as the opportunities arising in FMC. Fast growing adjacencies that Telkom Business will be pursuing in ICT services include Unifi ed Communications, cloud services (specifi cally infrastructure as a service (IaaS) and software as a service (SaaS)), IS Outsourcing and LAN Management, which will be offered in conjunction with managed data network services and managed hosting and managed infrastructure services hosted by Cybernest.
CYBERNESTCybernest, Telkom’s managed IT infrastructure services business, is seeing good progress in terms of its integration with the broader Telkom Business offering allowing us to further extract synergies between the two. Cybernest’s sales channel has now been largely aligned with Telkom Business as well as the sales support and product development functions thus ensuring a far more integrated approach across the two product platforms. Cybernest will continue to work closely with Telkom Business to offer more products and services to the Telkom Business customer base.
External revenue at Cybernest increased 12.0% to R84 million, with a win rate on new deals approaching 50%. This is largely due to up-selling services to existing customers as well as acquiring new business. The business is skewed towards longer-term revenues from managed services. We intend to increase our focus on this area and now have a larger, more stable base from which to introduce further up-selling opportunities.
Cybernest will play an important role in the broader Telkom Business integrated ICT strategy going forward. It is at the heart of our strategy to lead the Cloud Services market: initial focus is on IaaS and basic SaaS such as mail and some small business applications. Subsequent focus will progressively expand to more advanced Iaas and Saas offers. Together with Telkom Business Cybernest will also address the LAN services segment, which is currently a strategic portfolio gap for the Company, and the IT infrastructure outsourcing market, centred on our “cloud leveraged outsourcing” proposition.
Strong execution in data capabilities and expand product delivery
Fixed-line telephony
Converged personal
communication
Broadband + ISP
Individual IT as a service
Data connectivity
Unbounded connected systems
HostingComputing and software as a
service

24 Telkom Integrated Annual Report 2012
Business review (continued)
The greatest opportunity for Telkom Consumer Services and Retail growth lies in increasing broadband and data-related revenue to diversify reliance away from fi xed-line voice. To this end, Telkom launched its uncapped ADSL service over the course of the year. This was a successful initiative that attracted new customers while retaining existing clients. For the fi rst time in the South African market a broadband trial was launched by Telkom in which the fi rst three-months were free to any new subscriber. Of the total number of participants who took part in the trial, 68% were retained as new customers. While this has not had much of an impact on the revenues for this year, it has positively contributed to the number of subscribers acquired over the year and will further enhance the future growth of the business. The overall consumer broadband subscriber base increased 10% over the year under review.
Continued deterioration in fi xed-line voice revenues continues to negatively impact the fi xed-line business as a whole. This is driven mainly by fi xed-mobile substitution, a trend that continues to plague fi xed-line incumbents across the globe. As data becomes more accessible and inexpensive we believe there will also be increased competition from IP-based technologies in terms of delivering voice-related services.
While voice revenues remain a substantial portion of Telkom’s overall business, our challenge is to ensure that we can effectively mitigate against the excessive pace at which voice revenue income streams are declining. Annuity income is one way of doing this and more than 60% of our post-paid base is now on a calling plan. Over the next year we intend
to add further value-added services to make these offerings more attractive to the customer as well as introduce new and exciting FMC products and content services to further enhance the attractiveness of our broadband offering.
Customer churn in fi xed-line continues to be a challenge. However, our rate of churn over the past year has showed improvement as a result of a number of directed initiatives and restructuring exercises that were introduced.
The main reasons for customer churn are as follows:
1. Frustration around service;2. Affordability and the economic environment; and3. Customers relocating.
We have made progress in terms of improving our service levels and have identifi ed the main areas of concern. The majority of our complaints continue to focus on progress-related queries and fault reporting. We are working on ways to provide better service in this regard and this coming year will see the introduction of improved fault management systems. Specifi cally, the use of an improved knowledge management system in our call centres will assist us with meeting consumer-related queries across the full range of Telkom products.
The transformation of Telkom’s network onto a more stable platform is also expected to improve the customer service experience and will also provide new and exciting products and services. In addition it will enable us to offer installation turnaround-time guarantees as part of our various product offerings.
TELKOM CONSUMER SERVICES AND RETAIL… T he focus is on broadband and improved customer service
Telkom Consumer Services and Retail Strategy What did we achieve? Our commitments for 2013
Grow and defend profi table Consumer Services and Retail Revenues
• Realised broadband subscriber growth of 10% year-on-year.
• Launched fi rst FMC bundle in the form of Telkom-Mix.
• Retained 68% of customers that took on the free three-month broadband trial.
• Launched uncapped broadband customer value propositions.
• Launched a hybrid voice product.
• Rationalisation of payphones to optimise cost.
• Rationalise and simplify fi xed voice portfolio New and improved simplifi ed voice portfolio in
market.
• Improve entry level broadband product proposition
Increase basic broadband offering speed from 384 Kbps to up to 1 Mbps.
• Launch new FMC and content services for broadband
Improved ISP and content services.
• Increase retail footprint 50% more physical distribution.
• Improve customer service and experience Improved self service capability and interface.
There are four focus areas for Telkom Consumer Services and Retail as part of our strategy to regain market competitiveness in the consumer market:
Voice Lessen the impact of declining voice revenues
Data Increase revenues from broadband and adjacent areas
Retail channels Improve the accessibility of our products
Service Improve customer experience and service

Telkom Integrated Annual Report 2012 25
We continued to offer forms of converged consumer products and have seen continued upside as a result. 8•ta’s mobile offering has provided increased awareness among new customers of the wide range of fi xed-line products that Telkom offers. During the past year, Telkom Mix gave customers access to the popular BlackBerry device bundled together with a fi xed-line with free calls between the two. This type of initiative promotes customer exposure to our services across the Telkom Group, while introducing converged services to the South African consumer. We will aggressively pursue new opportunities in FMC in line with our strategy to focus heavily on data-centric products and services that combine the convenience of mobility with the stability of fi xed-line services. The third evolution of the Telkom Simple product was also launched over the course of the year. Customers received a voice package with free call minutes as well as a broadband data package with a free mobile dongle and mobile data.
Telkom understands the importance of content in terms of its broadband strategy and has begun to look at ways of delivering dynamic offerings that promote an appetite for data related services. By using Telkom’s extensive network – and through integrating this with consumer related products such as mobile – we are uniquely positioned to
meet the future demand for converged communications and increased broadband needs. We intend to work more closely with partners to offer value-added broadband services. The products that we would look at investigating are those that are bandwidth intensive. As an example, Telecoms companies worldwide continue to exploit video-on-demand services and Telkom would look into this as a potential value-added service. The group recently signed an agreement with electronics manufacturer Samsung to provide entry-level Smart TV services to consumers and we expect further innovations in this regard going forward.
Over the course of the 2013 fi nancial year, Telkom intends to rationalise and simplify its fi xed-voice consumer and retail product portfolio in order to facilitate easier decision making when looking at fi xed-line voice options. The entry level broadband offering will be upgraded to up to 1 Mbps from the 384 Kbps currently on offer. Telkom will continue to improve and enhance the accessibility of our retail footprint and will endeavour to create a physical distribution presence that is 50% wider than the current network.
Data drives our consumer strategy
Product offering
media rich content and
services
• Targeted double and triple play offering with on-demand media-rich content and converged services.
• VAS and content aggregation.
Product offering
technology enablers
• Enable target offering through high speeds and caps:– Consistently more value
(speeds and caps) for the same price.
– Uncapped.– 2 Mbps entry level and
40 Mbps top level by 2015.
Consumer experience and
perception
• Consistently best-in-class customer experience.
• Establish Telkom as a leader in service innovation.
• Simplifi cation and streamlining of product offerings and communication.
Go-to-market
• Push and pull channels with aggressive incentives:– Door-to-door.– Third party retailers.– Outbound call centre.– Comprehensive online
portal.
South Africa has low broadband penetration; South African consumers’ demand for data is accelerating; and South Africa Government has broadband penetration as a priority.
Key new products: Uncapped ADSL, Telkom Mix, Telkom Simple 3.Key new products: Uncapped ADSL, Telkom Mix,Telkom Simple 3.

26 Telkom Integrated Annual Report 2012
Business review (continued)
Telkom’s commitment to its mobile strategy remains steadfast. While the tactics for achieving our mobile goals may change from time to time, we are committed to the strategy as a whole and believe that mobile is an integral part of ensuring that Telkom grows into the future.
While we have faced certain diffi culties in terms of distribution and meeting growth targets, we are on our way towards ensuring that the Telkom Mobile offering is quality-focused, relevant and easy to access.
Telkom Mobile intends to differentiate itself from the major mobile operators in South Africa and cannot compete on price alone, especially in the mobile voice segment. Through 8•ta – our consumer retail focused mobile operator – as well as Telkom Business Mobile we have begun offering services that are data intensive and that meet the needs of the connected individual.
We believe it is vital that Telkom Mobile reaches critical mass levels in order to foster increased demand for our products. On the whole, we will continue to aggressively punt our data offerings and bundles and have seen good success in our converged cross-over offerings through products such as Telkom Mix and Telkom Simple. We will continue to offer bundled services as well as enterprise services such as fi xed-line lookalike. We intend to develop and introduce more integrated FMC offerings. Data products that were launched over the year include 8•ta’s prepaid 2Gig +1Gig offer for R149 per month, 8•ta’s prepaid 120Gig Data Bundle, post-paid 10Gig Midnight Surfer, Internet Saver plans as well as Telkom Business Mobile’s Shared Internet Bundles.
Telkom Business Mobile was launched in November and now offers a range of mobile business offerings to the corporate customer. The rationale for keeping it under the Telkom
Business brand was to ensure that the sales process is kept simplifi ed as well as to make it easier for the corporate client to identify with the product.
We have completed 1,945 base station sites up to 30 June 2012 and 1,520 sites have been powered up and are transmitting signal. We continue to experience challenges in terms of fi nding adequate power on certain of the remaining base stations.
Telkom Mobile has made the decision to open up the mobile network to handle more of our own customers’ voice and data usage. This means that instead of pushing subscribers onto shared networks we are routing them onto our own network. It is a signifi cant step for us to make as it emphasises the fact that we consider our own network to be suffi ciently stable to deliver the best possible quality service to our consumers. Since March, we have increased our customers using our voice network to 52% and we will continue to increase this number. A total of 92% of our existing data customers are utilising the Telkom network rather than shared networks.
Telkom Mobile experienced higher-than-expected levels of post-paid subscriber acquisitions, while 8•ta’s pre-paid offering continues to face diffi culties due to problems within the distribution network. To a large extent we have under-estimated the strength of the relationships held between distributors and the existing mobile operators. We have, however, covered some ground in terms of increasing the distribution footprint and a distribution contract with Pep Stores was signed in December. Because of the competitive forces faced at the distribution level we intend to combine external retail channels with our own internally controlled distribution channels to strengthen Telkom Mobile’s position.
TELKOM MOBILE…The strategy is to leapfrog mobile into data leadership and disrupt in voice
Telkom Mobile Strategy What did we achieve? Our commitments for 2013
Delivering on our investment in Telkom Mobile
• Grew active subscribers by 213%.
• Launched highly competitive and leading data offerings – 3Gig, 120Gig and 10Gig midnight surfer.
• Progress in own network build-out – end June 2012: 1,945 base stations built with 1,520 sites live.
• 52% of voice subscribers active on our own network – end June 2012.
• 92% of data subscribers active on our own network – end June 2012.
• Strengthen our data network Data leadership through data network coverage,
capacity expansion and advanced technologies.
• Increase distribution through direct channels Increase direct channel footprint up to three fold
by end of year and develop effective channel mix capacity for main target segments.
• Loss control while getting business prepared for focused data strategy
Re-engineering business processes and control costs that do not contribute to profi tability.
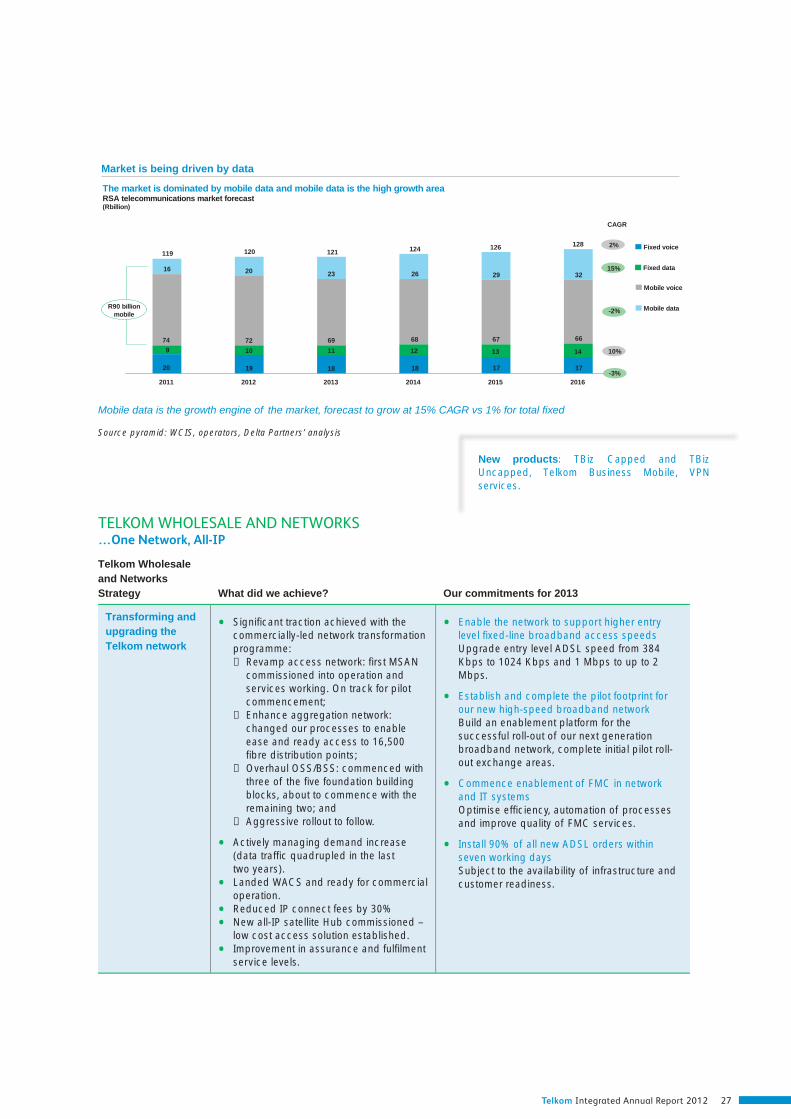
Telkom Integrated Annual Report 2012 27
TELKOM WHOLESALE AND NETWORKS…One Network, All-IP
Telkom Wholesale and Networks Strategy What did we achieve? Our commitments for 2013
Transforming and upgrading the Telkom network
• Signifi cant traction achieved with the commercially-led network transformation programme:
− Revamp access network: fi rst MSAN commissioned into operation and services working. On track for pilot commencement;
− Enhance aggregation network: changed our processes to enable ease and ready access to 16,500 fi bre distribution points;
− Overhaul OSS/BSS: commenced with three of the fi ve foundation building blocks, about to commence with the remaining two; and
− Aggressive rollout to follow.
• Actively managing demand increase (data traffi c quadrupled in the last two years).
• Landed WACS and ready for commercial operation.
• Reduced IP connect fees by 30%
• New all-IP satellite Hub commissioned – low cost access solution established.
• Improvement in assurance and fulfi lment service levels.
• Enable the network to support higher entry level fi xed-line broadband access speeds
Upgrade entry level ADSL speed from 384 Kbps to 1024 Kbps and 1 Mbps to up to 2 Mbps.
• Establish and complete the pilot footprint for our new high-speed broadband network
Build an enablement platform for the successful roll-out of our next generation broadband network, complete initial pilot roll-out exchange areas.
• Commence enablement of FMC in network and IT systems
Optimise effi ciency, automation of processes and improve quality of FMC services.
• Install 90% of all new ADSL orders within seven working days
Subject to the availability of infrastructure and customer readiness.
Market is being driven by data
The market is dominated by mobile data and mobile data is the high growth areaRSA telecommunications market forecast(Rbillion)
201620152014201320122011
20
9
74
16
119 120 121 124 126 128
CAGR
19
Fixed voice
Fixed data
Mobile voice
Mobile data
10
72
20
18
11
69
23
18
12
68
26
17
13
67
29
17
14
66
32
R90 billionmobile
-3%
10%
-2%
15%
2%
Mobile data is the growth engine of the market, forecast to grow at 15% CAGR vs 1% for total fi xed
Source pyramid: WCIS, operators, Delta Partners’ analysis
New products: TBiz Capped and TBiz Uncapped, Telkom Business Mobile, VPN services.
New products: TBiz Capped and TBizUncapped, Telkom Business Mobile, VPNservices.

Business review (continued)
Telkom Wholesale provides national network and backhaul services to other licensed operators (including Telkom Retail) in the local market:
Telk
om N
etw
ork
Wholesale Services
TelkomBusiness
TelkomConsumer
Cybernest
Other licensed operator
Retailmarket
Retailmarket
Retailmarket
Retailmarket
28 Telkom Integrated Annual Report 2012
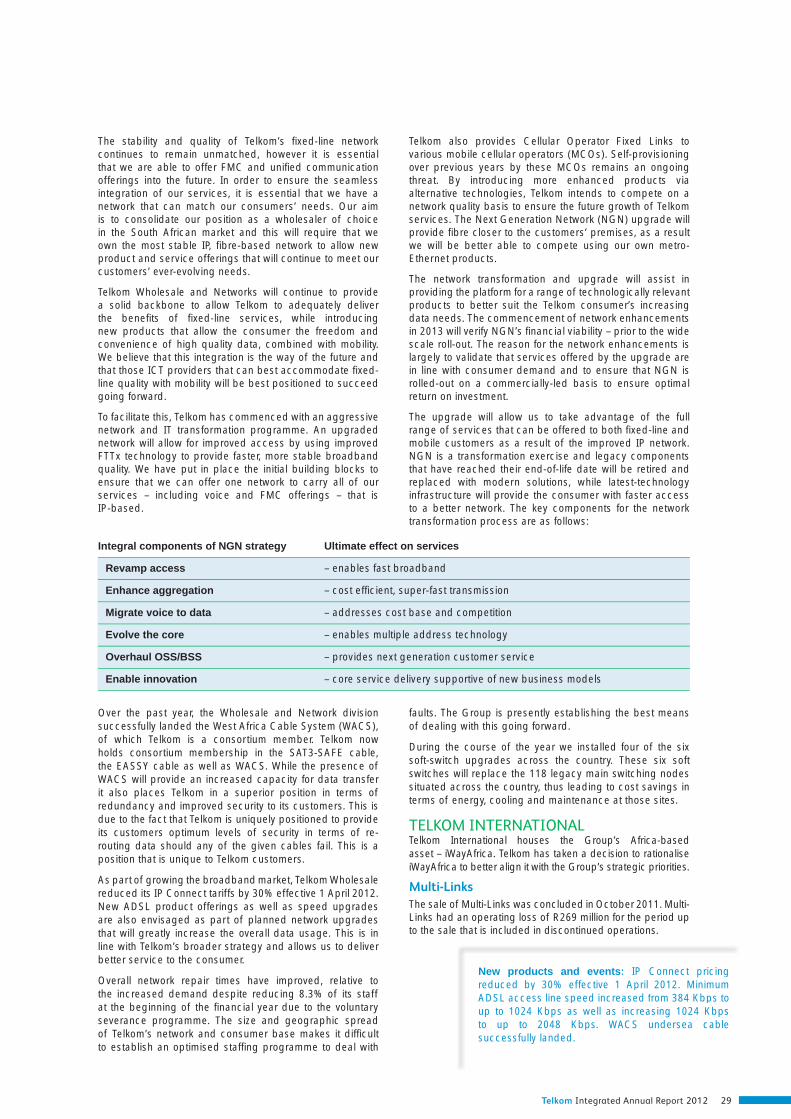
Telkom Integrated Annual Report 2012 29
The stability and quality of Telkom’s fi xed-line network continues to remain unmatched, however it is essential that we are able to offer FMC and unifi ed communication offerings into the future. In order to ensure the seamless integration of our services, it is essential that we have a network that can match our consumers’ needs. Our aim is to consolidate our position as a wholesaler of choice in the South African market and this will require that we own the most stable IP, fi bre-based network to allow new product and service offerings that will continue to meet our customers’ ever-evolving needs.
Telkom Wholesale and Networks will continue to provide a solid backbone to allow Telkom to adequately deliver the benefi ts of fi xed-line services, while introducing new products that allow the consumer the freedom and convenience of high quality data, combined with mobility. We believe that this integration is the way of the future and that those ICT providers that can best accommodate fi xed-line quality with mobility will be best positioned to succeed going forward.
To facilitate this, Telkom has commenced with an aggressive network and IT transformation programme. An upgraded network will allow for improved access by using improved FTTx technology to provide faster, more stable broadband quality. We have put in place the initial building blocks to ensure that we can offer one network to carry all of our services – including voice and FMC offerings – that is IP-based.
Telkom also provides Cellular Operator Fixed Links to various mobile cellular operators (MCOs). Self-provisioning over previous years by these MCOs remains an ongoing threat. By introducing more enhanced products via alternative technologies, Telkom intends to compete on a network quality basis to ensure the future growth of Telkom services. The Next Generation Network (NGN) upgrade will provide fi bre closer to the customers’ premises, as a result we will be better able to compete using our own metro-Ethernet products.
The network transformation and upgrade will assist in providing the platform for a range of technologically relevant products to better suit the Telkom consumer’s increasing data needs. The commencement of network enhancements in 2013 will verify NGN’s fi nancial viability – prior to the wide scale roll-out. The reason for the network enhancements is largely to validate that services offered by the upgrade are in line with consumer demand and to ensure that NGN is rolled-out on a commercially-led basis to ensure optimal return on investment.
The upgrade will allow us to take advantage of the full range of services that can be offered to both fi xed-line and mobile customers as a result of the improved IP network. NGN is a transformation exercise and legacy components that have reached their end-of-life date will be retired and replaced with modern solutions, while latest-technology infrastructure will provide the consumer with faster access to a better network. The key components for the network transformation process are as follows:
Over the past year, the Wholesale and Network division successfully landed the West Africa Cable System (WACS), of which Telkom is a consortium member. Telkom now holds consortium membership in the SAT3-SAFE cable, the EASSY cable as well as WACS. While the presence of WACS will provide an increased capacity for data transfer it also places Telkom in a superior position in terms of redundancy and improved security to its customers. This is due to the fact that Telkom is uniquely positioned to provide its customers optimum levels of security in terms of re-routing data should any of the given cables fail. This is a position that is unique to Telkom customers.
As part of growing the broadband market, Telkom Wholesale reduced its IP Connect tariffs by 30% effective 1 April 2012. New ADSL product offerings as well as speed upgrades are also envisaged as part of planned network upgrades that will greatly increase the overall data usage. This is in line with Telkom’s broader strategy and allows us to deliver better service to the consumer.
Overall network repair times have improved, relative to the increased demand despite reducing 8.3% of its staff at the beginning of the fi nancial year due to the voluntary severance programme. The size and geographic spread of Telkom’s network and consumer base makes it diffi cult to establish an optimised staffi ng programme to deal with
faults. The Group is presently establishing the best means of dealing with this going forward.
During the course of the year we installed four of the six soft-switch upgrades across the country. These six soft switches will replace the 118 legacy main switching nodes situated across the country, thus leading to cost savings in terms of energy, cooling and maintenance at those sites.
TELKOM INTERNATIONALTelkom International houses the Group’s Africa-based asset – iWayAfrica. Telkom has taken a decision to rationalise iWayAfrica to better align it with the Group’s strategic priorities.
Multi-LinksThe sale of Multi-Links was concluded in October 2011. Multi-Links had an operating loss of R269 million for the period up to the sale that is included in discontinued operations.
Integral components of NGN strategy Ultimate effect on services
Revamp access – enables fast broadband
Enhance aggregation – cost effi cient, super-fast transmission
Migrate voice to data – addresses cost base and competition
Evolve the core – enables multiple address technology
Overhaul OSS/BSS – provides next generation customer service
Enable innovation – core service delivery supportive of new business models
New products and events: IP Connect pricing reduced by 30% effective 1 April 2012. Minimum ADSL access line speed increased from 384 Kbps to up to 1024 Kbps as well as increasing 1024 Kbps to up to 2048 Kbps. WACS undersea cable successfully landed.
New products and events: IP Connect pricingreduced by 30% effective 1 April 2012. MinimumADSL access line speed increased from 384 Kbps toup to 1024 Kbps as well as increasing 1024 Kbpsto up to 2048 Kbps. WACS undersea cablesuccessfully landed.

30 Telkom Integrated Annual Report 2012
Business review (continued)
The sale of Multi-Links resulted in the recognition of a net loss of R896 million mainly due to the cumulative amount of exchange differences previously recognised in equity, which was recognised in profi t and loss on disposal of the Multi-Links foreign operation in the 2012 fi nancial year.
Included in continuing operations for the 2012 fi nancial year, are costs of R80 million to exit this business.
iWayAfricaiWayAfrica was formed as a result of integrating the business operations of Africa Online and MWEB Africa. It is essentially a satellite-based (VSAT) ISP aimed at the enterprise market in Africa. Due to the advancement of available technologies across the continent, iWayAfrica has faced serious competition from cheaper offerings in terms of fi xed and mobile broadband. The intention over the next year is to rationalise the existing operations and to adopt a strategy whereby we follow our existing customer base into Africa, providing connectivity and ICT needs where necessary.
OTHER SOUTH AFRICAN SUBSIDIARIESTrudonThe year under review saw the beginning of a new digital growth phase for Trudon – both in terms of changing usage patterns and in terms of introducing new products for the local SMME market. Trudon introduced multiple transformation initiatives across its platform in order to retain market relevance by offering services as opposed to individual product solutions.
Yellow Pages grew its internet usage by 18% compared to the previous year. The growth was mainly due to a total revamp of its on-line offering as well as an improved focus on search engine optimisation. The period also saw the launch of a mobile offering, which included the development of native applications and a mobile site. User application (app) downloads exceeded 150,000 by the end of March 2012 and mobile site usage increased 22% for the year. The aggressive approach towards harnessing the mobile market was driven by the introduction of a mobile app that speaks directly to the user audience across all platforms and devices – enabling viral advertising opportunities at the point of use.
We also saw our fi rst forays into social media with the fi rst live chat digital directory, using instant messaging platforms to link users with our 10, 118 call centres. We drove activity on social media platforms to reach an audience of 20,000 during the year, reaching the top 25 media brands on Facebook in South Africa.
Campaign management solutions were introduced and sold through state-of-the-art fulfi lment and bid management systems to secure a performance-based value offering on which Trudon could deliver a valuable and competitive cost-per-click outcome to its clients. This was achieved by accurately connecting the end users’ needs with digital advertisers’ offerings.
This required fresh content management initiatives to ensure effective sales fulfi lment and gave birth to the content hub initiative which saw the migration of advertiser intelligence from sales-centric activities towards product-rich content delivery across all platforms. Peeplio and Herenow on-line offerings were also activated to deliver higher organic traffi c volumes.
On the product side, the period saw the launch of Mysite and Mobisite – two products aimed at giving South African SMMEs a professional web and mobile presence at an affordable price. In the 2012 fi nancial year we rolled out over 10,000 of these solutions. The challenges inherent to sales force activation within this market were offset by a remuneration framework and commission system which supported a value-selling approach instead of the traditional product cycle selling.
Looking ahead, we will continue to drive usage in new channels on new devices around our core local commercial search market. In addition to this, new platforms are in development for the next fi nancial year that will harness the power of user-generated content alongside our expansive local footprint. We also intend to equip our sales force with innovative point-of-sales applications which will take advertiser solution selling into new digital dimensions.
On the product front, Trudon will be launching a set of leading edge products for the SMME market that allows them to compete with the big brands and their resources in these arenas.
Trudon aims to become a trusted advertising partner for all SMME advertising needs, regardless of the desired media platform. Vertical take-on initiatives supported by close partnerships and joint ventures (Toodu, Zap and Google Reseller) will be introduced in order to build the future Trudon – a radically different offering – focused service-orientated rather than product-based outcomes.
SwiftnetSwiftnet has undergone a major technology refresh programme to shift the offering off the traditional radio-based X.25 technology onto a mobile platform. The process was completed on 6 June 2012. Swiftnet is a stable business, however, it is vulnerable to increasing levels of competition in the market and will need to look at ways of further defending and growing its market share.

Telkom Integrated Annual Report 2012 31
Awards and achievements
The following awards and sponsorship events show the commitment that Telkom has to uplifting and improving the lives of South Africans. We thank those involved for their recognition and their support:
Frost & Sullivan African Excellence Awards The Green Excellence Award was presented to Cybernest after it earned the highest scores for technology, business commitment and environmental accountability.
ITNewsAfrica Top 10 African Women in ICT Telkom Group CEO Nombulelo Moholi was voted in the Top 10 of Most Powerful Women in the sector.
TopCo Media Top Women Award Telkom was recognised by TopCo Media for the commitment to empowerment of women in the workplace and good gender policies for 2011.
Impumelelo Top Empowered Company 2011 Telkom was awarded a certifi cate of excellence for the Top Empowered Company as a result of its sustained corporate performance, including its contribution to Broad-Based Black Economic Empowerment (B-BBEE).
2011 Financial Mail Top Empowered Companies’ survey
Telkom was ranked 54 out of 100, and came in seventh out of 10 ICT participants.
Telkom is striving towards improving its ranking as part of its transformation journey.
Black Management Forum’s Progressive Company of the Year Award
Telkom has been awarded the Black Management Forum’s 2011 Progressive Company of the Year Award, which recognised the Company’s progress in terms of B-BBEE.
MyBroadband Survey Telkom received top ratings for the 1 Mbps ADSL service and took second place and third place for its 10 Mbps ADSL service and 8•ta’s 3G service respectively.
My Broadband 2011 Broadband Awards 8•ta scooped the Mobile Broadband Service of the Year 2011 Award and was also voted the Broadband Maverick of the Year 2011.
Level 3 Gold Community Contributor – 2011 (National Department of Social Development)
This achievement showcases the Telkom Foundation’s contributor status and refl ects our commitment to good Corporate Governance.
Virgin Active Sports Industry Awards 2012: Best Community Programme
Telkom’s Rural Splash Learn to Swim programme scooped this prestigious award in the face of stiff competition.
Telkom PGA tournament This successful event was sponsored by Telkom for a 10th year in a row.
Absa Cape Epic Mountain Bike Race Successfully provided the back-end internet uplink and data communication for the event’s media. Telkom also sponsored the masters category of cyclists.

32 Telkom Integrated Annual Report 2012
Integrated performance indicators
Telkom Company Amounts in accordance with IFRS 2007 2008 2009
(in ZAR millions, unless otherwise stated) Statement of comprehensive income Operating revenue 32,340 32,571 33,659 Operating expenses (including depreciation) 24,089 24,953 27,458 Operating profi t 8,906 8,116 6,725 Investment income 502 769 307
Profi t before fi nance charges and fair value movements 9,408 8,885 7,032 Finance charges and fair value movements 1,027 1,289 1,460
Profi t before taxation 8,381 7,596 5,572 Taxation 2,690 2,599 1,854
Profi t/(loss) after taxation from continuing operations 5,691 4,997 3,718 Loss after taxation from discontinued operations – – –
Profi t/(loss) for the year 5,691 4,997 3,718 Attributable to minorities – – –
Profi t/(loss) attributable to shareholders 5,691 4,997 3,718
Statement of fi nancial position Assets Non-current assets 37,533 43,360 50,791
Property, plant and equipment 32,614 35,273 37,345 Intangible assets 3,502 3,806 3,988 Investments 887 3,883 7,693 Defi ned benefi t plan asset 54 55 48 Other fi nancial assets – – 2 Finance lease receivables 136 160 166 Deferred taxation 340 183 1,549
Current assets 7,754 8,763 10,088
Inventories 839 873 1,331 Income tax receivable 519 – 91 Current portion of deferred expenses – – – Current portion of fi nance lease receivables 71 105 109 Trade and other receivables 5,920 6,859 6,420 Current portion of other fi nancial assets 229 443 1,196 Cash and cash equivalents 176 483 941
Assets of disposal groups held for sale – – 34
Total assets 45,287 52,123 60,913
Equity and liabilities Equity attributable to the owners of the parent 25,714 25,467 27,475
Share capital 5,329 5,208 5,208 Treasury shares (1,778) (1,643) (1,521) Share-based compensation reserve 257 643 1,076 Non-distributable reserves – – – Retained earnings 21,906 21,259 22,712 Reserves of disposal groups held for sale – – –
Non-controlling interest – – – Non-current liabilities 6,580 12,407 16,388
Interest-bearing debt 3,308 7,336 10,193 Employee related provisions 1,192 3,120 4,018 Other provisions 11 32 35 Other fi nancial liabilities – 18 Deferred revenue 739 870 996 Deferred taxation 1,330 1,049 1,128
Current liabilities 12,993 14,249 17,050
Trade and other payables 4,333 4,923 5,424 Shareholders for dividend 15 20 23 Current portion of interest-bearing debt 5,775 6,026 7,511 Current portion of employee related provisions 1,159 1,065 1,284 Current portion of other provisions 547 575 669 Current portion of deferred revenue 1,107 1,424 1,826 Income tax payable – 7 – Current portion of other fi nancial liabilities 57 168 207 Credit facilities utilised – 41 106
Liabilities of disposal groups held for sale
Total equity and liabilities 45,287 52,123 60,913
Statement of cash fl ows Cash from/(used in) operating activities 3,733 5,347 6,853 Cash used in investing actitivies (6,662) (9,994) (12,129) Cash (used in)/from fi nancing activities (2,777) 2,088 2,574 (Decrease)/increase in cash and cash equivalents (5,706) (2,559) (2,702) Free cash fl ow 1,945 1,211 (1,842)
Read more: for further information please see page 36
GRI and King III

Telkom Integrated Annual Report 2012 33
Group2010 2011 2012 CAGR (%) 2011 2012 CAGR(%)
33,911 31,712 31,510 (0.5) 33,308 33,079 (0.3) 29,047 29,132 30,979 5.2) 29,443 31,250 3.0
5,579 3,114 968 (35.8) 4,405 2,408 (26.1) 800 470 367 (6.1) 213 238 5.7
6,379 3,584 1,335 (32.3) 4,618 2,646 (42.7) 2,727 1,226 745 (6.2) 1,068 1,872 75.3
3,652 2,358 590 (41.2) 3,550 774 (78.2) 1,295 793 766 (22.2) 979 595 (39.2)
2,357 1,565 (176) (149.9) 2,571 179 (93.0) – – – – (1,229) (269) (78.1)
2,357 1,565 (176) (149.9) 1,342 (90) (106.7) – – – – 120 126 5.0
2,357 1,565 (176) – 1,222 (216) (117.7)
42,841 42,659 40,906 1.7 43,943 42,362 (1.8)
37,109 36,861 35,979 2.0 37,304 36,155 (3.1) 3,718 3,445 3,418 (0.5) 3,965 3,555 (5.3) 1,612 1,857 1,170 5.7 2,103 2,260 3.7
50 50 47 (2.7) 83 47 (24.7) 95 193 48 188.4 193 48 (50.1)
250 239 244 12.4 239 244 1.0 7 14 – (100.0) 56 53 (2.7)
10,818 9,390 9,238 3.6 10,315 10,206 (1.1)
1,034 1,005 879 0.9 1,121 993 (11.4) – 91 – (100.0) 105 26 (50.2) – – – – 10 – (100.0)
109 118 128 12.5 118 128 4.2 4,975 4,803 4,951 (3.5) 5,503 5,696 1.7 1,021 1,663 2,185 57.0 1,674 2,195 14.5 3,679 1,710 1,095 44.1 1,784 1,168 (19.1)
– 319 – (100.0) 89 – (100.0)
53,659 52,368 50,144 2.1 54,347 52,568 (4.4)
28,017 27,992 27,107 1.1 29,635 29,707 11.6
5,208 5,208 5,208 (0.5) 5,208 5,208 – (1,175) (775) (775) (15.3) (771) (771) – 2,060 – – (100.0) – – –
– – – – 1,764 1,887 3.4 21,924 23,559 22,674 0.7 24,467 23,383 (2.2)
– – – – (1,033) – (100.0)
– – 387 434 12.1 14,097 14,947 12,672 14.0 14,974 12,718 (15.1)
7,858 8,189 5,891 12.2 8,198 5,897 (28.1) 4,292 4,690 4,860 32.5 4,711 4,880 1.8
44 39 34 25.3 29 36 – 19 69 26 13.0 69 26 (38.6)
1,068 1,073 1,132 8.9 1,073 1,132 2.7 816 887 729 (11.3) 894 747 (8.6)
11,545 9,429 10,365 (6.2) 8,899 9,709 9.1
4,947 5,449 5,005 2.9 4,782 4,291 (10.3) 23 21 23 8.9 21 23 4.7
1,771 155 1,287 (25.9) 157 1,289 – 1,942 1,911 1,631 7.1 1,932 1,652 (7.5)
574 13 231 (15.8) 86 240 67.1 1,964 1,742 1,968 12.2 1,771 1,995 6.1
166 – 85 86.7 16 87 133.2 136 127 133 18.5 123 129 2.4 22 11 2 (53.0) 11 3 (47.8)
– – – 452 – (100.0)
53,659 52,368 50,144 2.9 54,347 52,568 (3.3)
(472) 6,142 5,924 10.5 5,188 5,892 6.6 (6,010) (5,632) (4,719) (3.3) (4,545) (4,570) 0.3 (8,966) (2,462) (1,804) (2.4) (2,715) (1,923) (15.8)
(15,448) (1,952) (599) (19.3) (2,072) (601) (46.1) 5,366 2,074 1,960 1.6 3,481 2,134 (36.8)

34 Telkom Integrated Annual Report 2012
Integrated performance indicators (continued)
Telkom Company 2007 2008 2009
Key profi tability, liquidity and gearing indicators EBITDA 12,489 11,848 11,083 EBITDA margin % 38.6 36.4 32.9 EBITDA interest cover times 10.9 7.9 6.7 Interest cover times 8.3 6.1 4.4 Operating profi t margin % 27.5 24.9 20.0 Net profi t margin % 17.6 15.3 11.0 Return on shareholders equity (ROE) % 22.1 19.6 13.5 Total debt Rm 9,140 13,571 18,035 Net debt Rm 8,735 12,645 15,896 Current ratio :1 0.6 0.6 0.6 Gearing ratio % 35.5 53.3 65.6 Net debt to EBITDA times 0.7 1.1 1.4 Before tax operating return on assets (ROA) % 26.2 23.1 19.1 Capital expenditure to revenue % 20.4 20.9 19.9 Effective tax rate % 24.3 24.6 10.1 Employees Number of employees 25,864 24,879 23,520 Revenue per employee R 1,250,387 1,309,176 1,431,080 Fixed access line per employee 180 182 189 Employee expenses as a % of operating revenue % 21.9 21.7 21.0 Training and skills development spend Rm 426 283 300 Social Corporate social investment spend Rm 54 58 54 B-BBEE procurement spend Rm 3,029 6,718 8,800 Subscribers and lines ADSL subscribers 255,633 412,190 548,015 Calling plan subscribers 272,071 464,038 590,590 Closer subscribers 266,300 451,122 575,812 Supreme call subscribers 5,771 12,916 14,778
WiMax subscribers – – 2,615 Internet all access subscribers 302,593 358,066 423,196 Fixed access lines (‘000) 4,642 4,533 4,451 Postpaid – PSTN (‘000) 2,971 2,893 2,769 Postpaid – ISDN channels (‘000) 718 754 781 Prepaid (‘000) 795 743 766 Payphones (‘000) 158 143 135
Managed data network sites 21,879 25,112 29,979 Fixed-line penetration rate % 9.8 9.5 9.1 Revenue per fi xed access line R 5,275 5,250 5,349 Total mobile subscribers – – –Active mobile subscribers – – –Prepaid – – –Postpaid – – –
Base stations contructed – – –ARPU R – – –Prepaid R – – –Postpaid R – – –Churn on prepaid % – – –Traffi c revenue Rm 16,740 15,950 15,323 Local Rm 4,832 4,076 3,634 Long distance Rm 2,731 2,252 2,036 Fixed-to-mobile Rm 7,646 7,557 7,409 Fixed-to-fi xed Rm – – 11 International outgoing Rm 988 986 933 Subscription-based calling plans Rm 543 1,079 1,300 Interconnection Rm 1,639 1,757 2,084 Mobile domestic Rm 554 577 560Mobile international Rm 263 261 356Fixed Rm – 28 111 International Rm 823 891 1,057
Traffi c minutes millions 29,323 26,926 24,869 Local millions 14,764 11,317 8,822 Long distance millions 4,224 3,870 3,631 Fixed-to-mobile millions 4,103 4,169 4,126 Fixed-to-fi xed millions – – – International outgoing millions 596 678 656 Subscription based calling plans millions 1,896 2,997 3,546 Interconnection millions 3,740 3,895 4,088 Mobile domestic millions 2,246 2,314 2,223Mobile international millions 173 188 261Fixed millions – 113 415 International millions 1,321 1,280 1,189
Read more: for further information please see page 36
GRI and King III

Telkom Integrated Annual Report 2012 35
Group2010 2011 2012 CAGR(%) 2011 2012 CAGR(%)
10,266 8,543 6,435 (12.4) 9,370 8,546 (8.8) 30.3 26.9 20.4 (12.0) 28.1 25.8 (8.2) 7.8 9.5 8.4 (5.0) 10.4 11.2 7.1 3.8 4.4 1.8 (26.6) 5.0 2.0 (59.4)
16.5 11.9 3.1 (35.5) 13.2 7.3 (45.0) 7.0 7.0 (0.6) (150.2) 7.7 0.54 (93.0) 8.4 5.6 (0.6) (149.4) 8.7 0.6 (93.1)
9,806 8,551 7,339 (4.3) 8,355 7,186 (14.0) 5,011 4,985 4,011 (14.4) 4,907 3,933 (19.8)
0.9 1.0 0.9 8.4 1.2 1.1 (9.3) 35.0 30.5 27.1 (5.3) 28.2 24.2 (14.2) 0.5 0.6 0.6 (2.3) 0.5 0.5 (12.2)
17.2 9.9 3.1 (34.5) 13.0 7.4 (43.1) 12.5 14.1 14.7 (6.3) 13.6 14.5 6.4 10.4 33.6 129.8 39.8 27.6 76.9 178.8
23,247 22,884 20,939 (4.1) 24,028 22,045 (8.3) 1,458,726 1,385,772 1,504,847 3.8 1,386,216 1,500,522 8.2
184 182 191 1.2 – – – 20.9 22.3 26.3 3.7 29.2 26.1 (10.5) 237 238 245 (10.5) 238 245 (2.9)
52 43 36 (7.8) 43 41 (4.7) 9,730 12,263 12,293 32.3 12,263 12,293 0.2
647,462 751,625 827,091 26.5 715,221 783,193 819,019 24.7 694,348 753,951 787,117 24.2 20,873 29,242 31,902 40.8 2,979 3,199 3,381 8.9
511,535 543,316 523,057 11.6 4,273 4,152 3,995 (3.0) 2,625 2,552 2,499 (3.4)
784 772 767 1.3 744 703 623 (4.8) 120 125 106 (7.7)
33,226 34,163 38,902 12.2 8.7 8.3 8 (4.2)
5,345 4,863 4,865 (1.6) – 1,199,596 3,053,393 154.5 – 473,604 1,483,401 213.2 – 440,775 1,039,448 135.8 – 32,829 443,953 1252.3 – 970 1,782 83.7 – 22.60 68.86 204.7 – 15.86 20.89 31.7 – 238.57 206.83 (13.3) – – 58.6 –
13,893 12,045 11,078 (7.9) 3,205 2,836 2,409 (13.0) 1,805 1,588 1,365 (13.0) 6,452 5,181 5,121 (7.7)
37 78 110 115.4 910 725 495 (12.9)
1,484 1,637 1,578 23.8 2,608 1,679 1,757 1.4
531 498 375 (7.5)512 186 630 19.1 228 328 262 74.9
1,337 667 490 (9.9) 23,082 20,545 19,372 (8.0) 6,963 5,563 4,513 (21.1) 3,238 2,806 2,683 (8.7) 3,646 3,563 3,785 (1.6)
47 104 164 86.8 655 537 360 (9.6)
3,805 3,988 3,636 13.9 4,728 3,984 4,231 2.52,064 1,919 1,945 (2.8)
255 134 432 20.1 736 951 1,055 74.8
1,673 980 799 (9.6)

36 Telkom Integrated Annual Report 2012
Financial overview
HIGHLIGHTS OF THE YEAR• Generated free cash fl ow of R2.1 billion
• Completed the disposal of Multi-Links
• 213% growth in active mobile subscribers
• 10% growth in ADSL subscribers
• Fixed-line EBITDA margin increased from 36.8% to 38.6%
• Net debt to EBITDA remains 0.5x
Segment structureThe Group’s reporting segments are business units that are separately managed. The Group consists of two reportable segments. The fi xed-line segment provides fi xed-line access and data communications services and the mobile segment provides mobile voice services, data services and handset sales through 8•ta.
The “other” category is a reconciling item, which is split geographically between International and South Africa. Telkom International category provides internet services outside South Africa, through the iWayAfrica Group. The South African category includes the Trudon Group, Swiftnet, Data Centre Operations and the Group’s Corporate Centre.
Comparative information has been restated to refl ect the internal restructuring between the fi xed-line segment and the Group’s Corporate Centre and to refl ect the entire operations of Multi-Links as discontinued operations.
Operating revenueGroup operating revenue decreased by 0.7% to R33,079 million (2011: R33,308 million) in the year ended 31 March 2012.
The decrease is mainly due to lower fi xed-line traffi c and data revenue partially offset by the inclusion of mobile revenue for a full year. Data Centre Operations includes R1,322 million (2011: R1,165 million) internal revenue received from the fi xed-line segment in terms of the transfer pricing policy. This revenue is eliminated on consolidation.
Other incomeOther income includes profi t on the disposal of investments, property, plant and equipment and intangible assets as well as interest received from debtors and on loans to subsidiaries. The decrease in fi xed-line other income is mainly attributable to the inclusion of the profi t on the sale of a portion of our right of use of the SAT-3 undersea cable in the prior year. Mobile other income relates to a donation of two base station controllers received. The Corporate Centre’s other income increased due to the R167 million profi t on sale of Multi-Links.
Operating expensesGroup operating expenses increased by 6.1% to R31,250 million (2011: R29,443 million) in the year ended 31 March 2012, primarily due to an increase in selling, general and administrative expenses and depreciation, amortisation, impairments and write-offs partially offset by a decrease in employee expenses.
The increase in selling, general and administrative expenses is mainly due to the inclusion of mobile expenses and higher fi xed-line marketing and materials and maintenance expenses, partially offset by a decrease in fi xed-line bad debts.
Depreciation, amortisation, impairments and write-offs include R569 million relating to the impairment of iWayAfrica goodwill and assets. The decrease in employee expenses is mainly due to savings resulting from voluntary severance packages offered in the prior year.
Investment incomeInvestment income consists of interest received on short-term investments and bank accounts. Investment income increased by 11.7% to R238 million (2011: R213 million), as a result of higher interest and dividends received by the cell captive.
Finance charges and fair value movementsFinance charges and fair value movements include interest paid on local and foreign borrowings, amortised discounts on bonds and commercial paper bills, fair value gains and losses on fi nancial instruments and foreign exchange gains and losses.
Finance charges and fair value movements increased by 75.3% to R1,872 million (2011: R1,068 million) in the year ended 31 March 2012. The increase was mainly as a result of foreign exchange and fair value losses of R1,107 million (2011: R170 million) due to the cumulative amount of exchange differences of R1,292 million previously recognised in other comprehensive income (equity), now recognised in profi t and loss on disposal of Multi-Links, partially offset by fair value gains on forward exchange contracts and interest rate swap agreements. The interest expense decreased 14.8% to R765 million (2011: R898 million) as a result of a 14.0% decrease in the Group’s interest-bearing debt to R7,186 million (2011: R8,355 million).
TaxationThe consolidated tax expense from continuing operations decreased to R595 million (2011: R979 million) mainly due to lower deferred tax as a result of the foreign exchange losses realised on the disposal of Multi-Links and the accelerated depreciation on network equipment and lower secondary tax on companies as a result of lower dividend paid. The consolidated effective tax rate for the year ended 31 March 2012 was 76.7% (2011: 30.8%). Excluding the effects of the sale of Multi-Links and the Group impairment of iWayAfrica the consolidated effective tax rate is 33.4%.
Non-controlling interestsNon-controlling interests in the income of subsidiaries increased to R126 million in the year ended 31 March 2012 due to the higher net profi t of Trudon.
Fixed-lineThe following is a discussion of the results of operations of the fi xed-line segment before eliminations of intercompany transactions with the other segments. The fi xed-line segment is the largest segment based on revenue and profi t contribution.
Fixed-line operating revenueOur fi xed-line operating revenue is derived principally from fi xed-line subscriptions and connections; traffi c, which comprises local and long-distance traffi c, fi xed-to-mobile traffi c, international outgoing traffi c and international voice over internet protocol services; and interconnection, which comprise terminating and hubbing traffi c.
We also derive fi xed-line operating revenue from our data business, which includes data transmission services, managed data networking services and internet access and related information technology services.
Read more: for the Group segment structure please see page 7

Telkom Integrated Annual Report 2012 37
2011 % of 2012 % of
Rm revenue Rm revenue %
Subscriptions and connections 6,763 21.5 6,900 22.5 2.0
Traffi c 12,045 38.2 11,078 36.2 (8.0)
Local 2,836 9.0 2,409 7.9 (15.1)
Long-distance 1,588 5.0 1,365 4.4 (14.0)
Fixed-to-mobile 5,181 16.4 5,121 16.7 (1.2)
Fixed-to-fi xed 78 0.3 110 0.4 41.0
International outgoing 725 2.3 495 1.6 (31.7)
Subscription-based calling plans 1,637 5.2 1,578 5.2 (3.6)
Interconnection 1,679 5.3 1,757 5.7 4.6
Data 10,699 33.9 10,517 34.3 (1.7)
Other 347 1.1 386 1.3 11.2
Fixed-line operating revenue 31,533 100.0 30,638 100.0 (2.8)
Telkom has in recent years introduced calling plans as a customer retention strategy in order to defend revenues. These calling plan arrangements comprise monthly subscriptions for access line rental, value added services and free or discounted rates on calls. The access line rentals and value added services revenue components of calling plan arrangements are included in subscriptions and connections revenue. In response to the signifi cant growth in calling plan arrangements, the need arose to separate traffi c revenue resulting from subscription based calling plans into annuity revenue and the respective traffi c
revenue streams. Subscription based on calling plans revenue includes traffi c annuity revenue related to calling plans. Discounted and out of plan traffi c relating to these calling plans is disclosed under the applicable traffi c revenue streams.
The following table shows operating revenue for our fi xed-line segment broken down by major revenue streams and as a percentage of total revenue for our fi xed-line segment and the percentage change by major revenue stream for the years indicated.
Fixed-line operating revenue decreased in the 2012 fi nancial year primarily due to lower traffi c revenue and lower data revenue as a result of the inclusion of the revenue generated during the Soccer World Cup in the prior year, partially offset by higher international interconnection and subscriptions and connections revenue.
In addition, traffi c continued to be adversely affected by the increasing substitution of calls placed using mobile services rather than our fi xed-line service and dial up traffi c being substituted by our ADSL service, as well as the decrease in the number of prepaid and residential post-paid PSTN lines and increased competition in our payphones business. As a result, traffi c revenue declined 8.0% in the 2012 fi nancial year. Revenue per fi xed access line increased marginally to R4,865 in the 2012 fi nancial year from R4,863 in the 2011 fi nancial year.
Subscriptions and connectionsRevenue from subscriptions and connections consists of revenue from connection fees, monthly rental charges, value added voice services and the sale and rental of customer premises equipment for post-paid and prepaid PSTN lines, including ISDN channels and private payphones. Subscriptions and connections revenue is principally a function of the number and mix of residential and business lines in service, the number of private payphones in service and the corresponding charges. The following table sets forth information related to our fi xed-line subscription and connection revenue during the periods indicated.

38 Telkom Integrated Annual Report 2012
Financial overview (continued)
2011 2012
Rm Rm %
Fixed-line subscriptions and connections revenue 6,763 6,900 2.0
Fixed access lines (thousands, except percentages)1 4,152 3,995 (3.8)
Postpaid
PSTN2 2,552 2,499 (2.1)
ISDN channels 772 767 (0.6)
Prepaid PSTN 703 623 (11.4)
Private payphones 125 106 (15.2)
Notes:1 Fixed-line subscription access lines are comprised of PSTN
lines, including ISDN lines and private payphones, but excluding
internal lines in service and public payphones. Each analogue
PSTN line includes one access channel, each basic rate ISDN
line includes two access channels and each primary rate ISDN
line includes 30 access channels.2 Excluding ISDN channels. PSTN lines are provided using copper
cable, DECT and fibre.
Revenue from subscriptions and connections increased in the year ended 31 March 2012 mainly due to higher customer premises equipment sales and rentals and higher access line rentals, partially offset by lower installation and reconnection fees. The post-paid line rental increased by 1.8% for residential customers and by 5% for business customers on 1 August 2010 and post-paid residential and business line rental both increased by 5% on 1 August 2011.
The decrease in the number of post-paid lines in service in the 2012 fi nancial year was primarily as a result of a decrease in residential prepaid PSTN lines as well as a decrease in business PSTN lines, partially offset by an increase in ADSL lines. The decrease in prepaid PSTN lines in the 2012 fi nancial year was primarily due to the migration of customers to calling plan packages.
Traffi cTraffi c revenue consists of revenue from local, long distance, fi xed-to-mobile, fi xed-to-fi xed and international outgoing calls, international voice over internet protocol services and subscription based calling plans. Traffi c revenue is principally a function of tariffs and the volume, duration and mix between relatively more expensive domestic long distance, international and fi xed-to-mobile calls and relatively less expensive local calls.
The following table sets forth information related to our fi xed-line traffi c revenue for the years indicated.
2011 2012
Rm Rm %
Local traffi c revenue 2,836 2,409 (15.1)
Local traffi c (millions of minutes)1 5,563 4,513 (18.9)
Long distance traffi c revenue 1,588 1,365 (14.0)
Long distance traffi c (millions of minutes)1 2,806 2,683 (4.4)
Fixed-to-mobile traffi c revenue 5,181 5,121 (1.2)
Fixed-to-mobile traffi c (millions of minutes)1 3,563 3,785 6.2
Fixed-to-fi xed traffi c revenue 78 110 41.0
Fixed-to-fi xed traffi c (millions of minutes)1 104 164 57.7
International outgoing traffi c revenue 725 495 (31.7)
International outgoing traffi c (millions of minutes)2 537 360 (33.0)
Subscription based calling plans revenue 1,637 1,578 (3.6)
Subscription based calling plans (millions of minutes) 3,988 3,636 (8.8)
Total traffi c revenue 12,045 11,078 (8.0)
Total traffi c (millions of minutes) 16,561 15,141 (8.6)
Notes:1 Traffic is calculated by dividing total traffic revenue by the weighted average tariff during the relevant period. Traffic includes dial up internet
traffic.2 International outgoing mobile traffic is based on the traffic registered through the respective exchanges and reflected in interconnection
invoices.
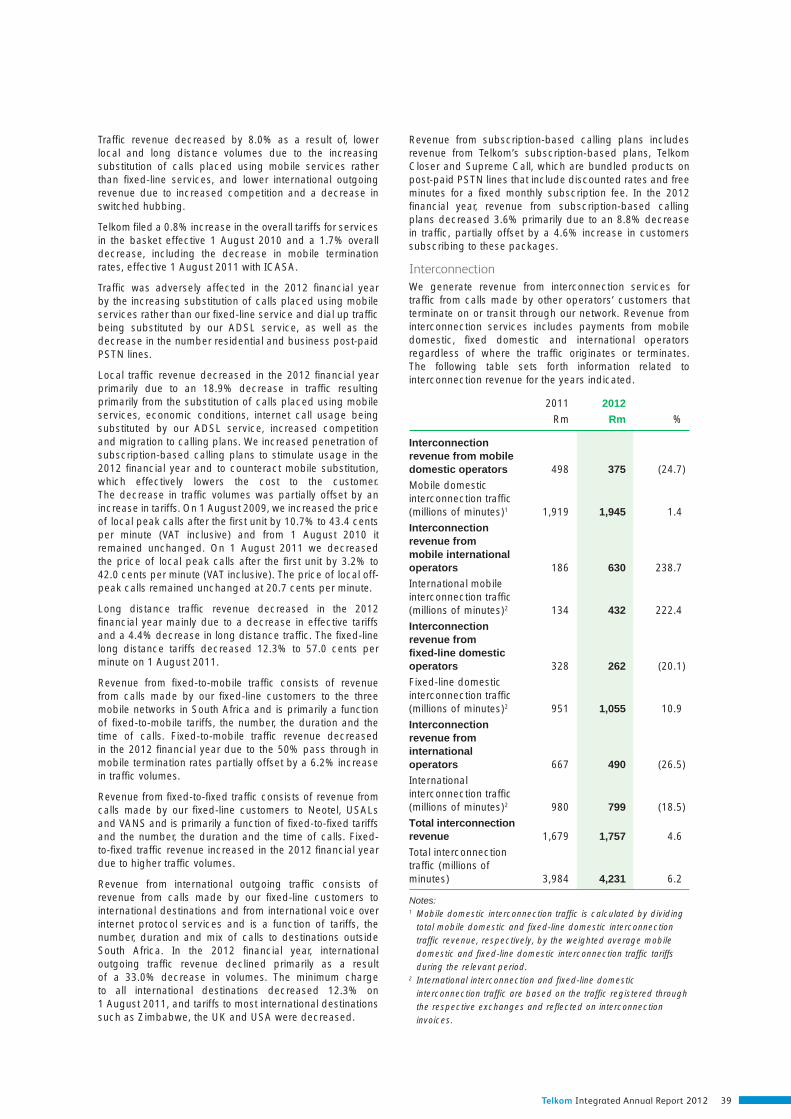
Telkom Integrated Annual Report 2012 39
Traffi c revenue decreased by 8.0% as a result of, lower local and long distance volumes due to the increasing substitution of calls placed using mobile services rather than fi xed-line services, and lower international outgoing revenue due to increased competition and a decrease in switched hubbing.
Telkom fi led a 0.8% increase in the overall tariffs for services in the basket effective 1 August 2010 and a 1.7% overall decrease, including the decrease in mobile termination rates, effective 1 August 2011 with ICASA.
Traffi c was adversely affected in the 2012 fi nancial year by the increasing substitution of calls placed using mobile services rather than our fi xed-line service and dial up traffi c being substituted by our ADSL service, as well as the decrease in the number residential and business post-paid PSTN lines.
Local traffi c revenue decreased in the 2012 fi nancial year primarily due to an 18.9% decrease in traffi c resulting primarily from the substitution of calls placed using mobile services, economic conditions, internet call usage being substituted by our ADSL service, increased competition and migration to calling plans. We increased penetration of subscription-based calling plans to stimulate usage in the 2012 fi nancial year and to counteract mobile substitution, which effectively lowers the cost to the customer. The decrease in traffi c volumes was partially offset by an increase in tariffs. On 1 August 2009, we increased the price of local peak calls after the fi rst unit by 10.7% to 43.4 cents per minute (VAT inclusive) and from 1 August 2010 it remained unchanged. On 1 August 2011 we decreased the price of local peak calls after the fi rst unit by 3.2% to 42.0 cents per minute (VAT inclusive). The price of local off-peak calls remained unchanged at 20.7 cents per minute.
Long distance traffi c revenue decreased in the 2012 fi nancial year mainly due to a decrease in effective tariffs and a 4.4% decrease in long distance traffi c. The fi xed-line long distance tariffs decreased 12.3% to 57.0 cents per minute on 1 August 2011.
Revenue from fi xed-to-mobile traffi c consists of revenue from calls made by our fi xed-line customers to the three mobile networks in South Africa and is primarily a function of fi xed-to-mobile tariffs, the number, the duration and the time of calls. Fixed-to-mobile traffi c revenue decreased in the 2012 fi nancial year due to the 50% pass through in mobile termination rates partially offset by a 6.2% increase in traffi c volumes.
Revenue from fi xed-to-fi xed traffi c consists of revenue from calls made by our fi xed-line customers to Neotel, USALs and VANS and is primarily a function of fi xed-to-fi xed tariffs and the number, the duration and the time of calls. Fixed-to-fi xed traffi c revenue increased in the 2012 fi nancial year due to higher traffi c volumes.
Revenue from international outgoing traffi c consists of revenue from calls made by our fi xed-line customers to international destinations and from international voice over internet protocol services and is a function of tariffs, the number, duration and mix of calls to destinations outside South Africa. In the 2012 fi nancial year, international outgoing traffi c revenue declined primarily as a result of a 33.0% decrease in volumes. The minimum charge to all international destinations decreased 12.3% on 1 August 2011, and tariffs to most international destinations such as Zimbabwe, the UK and USA were decreased.
Revenue from subscription-based calling plans includes revenue from Telkom’s subscription-based plans, Telkom Closer and Supreme Call, which are bundled products on post-paid PSTN lines that include discounted rates and free minutes for a fi xed monthly subscription fee. In the 2012 fi nancial year, revenue from subscription-based calling plans decreased 3.6% primarily due to an 8.8% decrease in traffi c, partially offset by a 4.6% increase in customers subscribing to these packages.
Interconnection We generate revenue from interconnection services for traffi c from calls made by other operators’ customers that terminate on or transit through our network. Revenue from interconnection services includes payments from mobile domestic, fi xed domestic and international operators regardless of where the traffi c originates or terminates. The following table sets forth information related to interconnection revenue for the years indicated.
2011 2012
Rm Rm %
Interconnection revenue from mobile domestic operators 498 375 (24.7)
Mobile domestic interconnection traffi c (millions of minutes)1 1,919 1,945 1.4
Interconnection revenue from mobile international operators 186 630 238.7
International mobile interconnection traffi c (millions of minutes)2 134 432 222.4
Interconnection revenue from fi xed-line domestic operators 328 262 (20.1)
Fixed-line domestic interconnection traffi c (millions of minutes)2 951 1,055 10.9
Interconnection revenue from international operators 667 490 (26.5)
International interconnection traffi c (millions of minutes)2 980 799 (18.5)
Total interconnection revenue 1,679 1,757 4.6
Total interconnection traffi c (millions of minutes) 3,984 4,231 6.2
Notes:1 Mobile domestic interconnection traffic is calculated by dividing
total mobile domestic and fixed-line domestic interconnection
traffic revenue, respectively, by the weighted average mobile
domestic and fixed-line domestic interconnection traffic tariffs
during the relevant period. 2 International interconnection and fixed-line domestic
interconnection traffic are based on the traffic registered through
the respective exchanges and reflected on interconnection
invoices.

40 Telkom Integrated Annual Report 2012
Financial overview (continued)
Interconnection revenue from mobile domestic operators includes revenue for call termination from mobile domestic networks, as well as access to other services, such as emergency services and directory enquiry services. Interconnection revenue from mobile domestic operators decreased in the 2012 fi nancial year mainly due to the decrease in fi xed-line termination rates.
Interconnection revenue from international mobile operators includes international outgoing calls from mobile domestic networks. Interconnection revenue from mobile international operators increased due to an increase in volumes.
Interconnection revenue from fi xed-line domestic operators includes fees paid by Neotel, underserviced area licence holders and value added network service providers for call termination and international outgoing calls, as well as access to other services, such as emergency services and directory inquiry services. Interconnection revenue from fi xed-line domestic operators increased as a result of the entrance of Neotel and the further liberalisation of the South African telecommunications industry.
Interconnection revenue from international operators includes amounts paid by foreign operators for the use of our network to terminate calls made by customers of such operators and payments from foreign operators for interconnection hubbing traffi c through our network to other foreign networks. Interconnection revenue from international operators decreased in the year ended 31 March 2012 primarily due to decreased switched hubbing traffi c volumes.
DataData services comprise data transmission services, including leased lines and packet-based services, managed data networking services and internet access and related information technology services. In addition, data services include revenue from ADSL. Revenue from data services is mainly a function of the number of subscriptions, tariffs, bandwidth and distance.
The following table sets forth information related to revenue from data services for the years indicated.
2011 2012Rm Rm %
Data connectivity 5,325 5,365 0.8Leased line facilities 2,182 2,310 5.9Internet access and related services 1,814 1,689 (6.9)Managed data network services 1,243 1,101 (11.4)Multimedia services 135 52 (61.5)Data revenue 10,699 10,517 (1.7)Number of managed network sites 34,163 38,902 13.9Internet all access subscribers 543,316 523,057 (3.7)ADSL subscribers1 751,625 827,091 10.0
Notes:1 Excludes Telkom internal ADSL services of 1,359 and 1,252 as of
31 March 2012 and 2011, respectively.
Total data revenue decreased 1.7% to R10,517 million as a result of income generated from the Soccer World Cup included in the previous year. Excluding the revenue relating to the Soccer World Cup, data revenue increased 1.6%. The slow growth is mainly as a result of increased self provisioning by mobile operators, lower internet access revenue and pricing pressures.
ADSL subscribers increased 10.0% to 827,091 when compared to the previous year. Data, however, continues to be an area of growth and we believe at some point contributions of data and of voice will be one-to-one.
Telkom is also heavily focused on increasing broadband and data related revenue to diversify its reliance away from fi xed-line voice. To this end, Telkom launched its uncapped ADSL service over the course of the last year. This was a successful initiative and at 31 March 2012 we had 35,093 uncapped ADSL customers. For the fi rst time in the South African market a ‘free three-month broadband’ trial was launched by Telkom. Of the total 74,924 customers who applied for the trial we ended up retaining 68% as customers. While this will not have much of an impact on the revenues for the year, it has positively contributed to the growth in subscribers we experienced in the current year with the resultant revenue benefi t expected to follow in the 2013 fi nancial year.
Data connectivity revenue comprises revenue from our services such as Diginet, DSL, IPLC and Megalines. Revenue from data connectivity services increased due to an increase in ADSL revenue as a result of an increase in the number of subscribers and growth in Diginet revenue, partially offset by a decrease in IPLC revenue.
Leased line facilities revenue increased mainly due to the inclusion of R239 million revenue received from 8•ta for mobile links during the year that is eliminated on consolidation. This increase was partially offset by a decrease in revenue from other mobile operators due to an increase in self-provisioning by mobile operators.
Internet access and related services, managed data network services and multi-media services revenue decreased mainly due to revenue relating to the Soccer World Cup included in the prior year.
Other revenueOther revenue includes revenue relating to co-location of other licensed operators on Telkom owned properties, the sale of materials and revenue related to the recovery of costs for work performed on behalf of other licensed operators. Other revenue increased 11.2% mainly as a result of R105 million subscriber acquisition commissions received from the mobile segment, which are eliminated on consolidation, higher revenue from expired cards and co-location, partially offset by revenue related to the Soccer World Cup included in the prior year.
Fixed-line operating expensesThe following table shows the operating expenses of our fi xed-line segment broken down by expense category as a percentage of total revenue and the percentage change by operating expense category for the years indicated.

Telkom Integrated Annual Report 2012 41
2011Rm
% ofRevenue
2012Rm
% ofrevenue %
Employee expenses 7,810 24.7 6,641 21.7 15.0
Payments to other network operators 5,193 16.5 4,839 15.8 6.8
Selling, general and administrative expenses 3,541 11.2 3,834 12.5 (8.3)
Service fees 3,158 10.0 3,123 10.2 1.1
Operating leases 647 2.1 620 2.0 4.2
Depreciation, amortisation, impairments and write-offs 4,135 13.1 4,581 15.0 (10.8)
Fixed-line operating expenses 24,484 77.6 23,638 77.2 3.5
Notes:1. Employee expenses include workforce reduction expenses
of R650 million for the fixed-line segment in the year ended
31 March 2011 and R8 million in the year ended 31 March 2012.2. Included in service fees in the 2012 financial year is a
R1,168 million intercompany charge by Cybernest for services
performed as the transfer policy was introduced on 1 April 2010
(2011: R1,043 million). This cost is eliminated on consolidation.
Fixed-line operating expenses decreased in the 2012 fi nancial year primarily due to lower employee expenses as a result of voluntary severance packages offered in the prior year and lower payments to mobile operators due to the reduction in mobile termination rates, partially offset by higher depreciation due to the review of the useful lives of existing network equipment as we invest to transform to a commercially led next generation network.
Fixed-line employee expensesEmployee expenses consist mainly of salaries and wages for employees, including bonuses and other incentives, benefi ts and workforce reduction expenses.
The following table sets forth information related to our fi xed-line employee expenses for the years indicated.
2011Rm
2012Rm %
Salaries and wages 5,761 5,618 2.5
Benefi ts 1,832 1,520 17.0
Workforce reduction expenses 650 8 98.8
Employee expenses capitalised (433) (505) 16.6
Fixed-line employee expenses 7,810 6,641 15.0
Employee expenses decreased in the year ended 31 March 2012 primarily due to voluntary employee severance package expenses of R650 million incurred in the prior year and lower bonuses paid.
Salaries and wages decreased in the year ended 31 March 2012 primarily due to lower fi xed-line headcount as a result of voluntary severance packages offered in the prior year, partially offset by average annual salary increases of 5.7%.
Benefi ts include allowances, such as bonuses, Company contributions to medical aid, pension and retirement funds, leave provisions, workmen’s compensation and levies payable for skills development. Benefi ts decreased in the 2012 fi nancial year primarily due to lower bonus payments.
Employee related expenses capitalised include employee related expenses associated with construction and infrastructure development projects. The increase in employee related expenses capitalised in the year ended 31 March 2012 is a result of the higher fi xed-line capital expenditure.
Fixed-line payments to other network operators Payments to other network operators include settlement payments paid to the three South African mobile communications network operators, Neotel for terminating calls on their networks and to international network operators for terminating outgoing international calls and traffi c transiting through their networks.
The following table sets forth information related to our payments to other network operators for the years indicated.
2011 2012
Rm Rm %
Payments to mobile network operators 3,704 3,218 13.1
Payments to international network operators 792 1,029 (29.9)
Payments to fi xed-line network operators 404 306 24.3
Data commitments 293 286 2.4
Fixed-line payments to other network operators 5,193 4,839 6.8
Payments to mobile operators decreased 13.1% largely due to the decrease in mobile termination rates partially offset by a 6.2% increase in fi xed-to-mobile traffi c volumes.
Payments to international operators increased signifi cantly during the 2012 fi nancial year mainly due to higher settlement rates as a result of a change in the mix of countries dialled and higher settlement rates as a result of foreign currency movements.
Payments to fi xed-line operators decreased in the 2012 fi nancial year primarily due to the decrease in fi xed-line termination rates.

42 Telkom Integrated Annual Report 2012
Financial overview (continued)
Fixed-line selling, general and administrative expensesSelling, general and administrative expenses include materials and maintenance costs, marketing expenditures, debtors impairment, theft, losses and other expenses, including obsolete stock and cost of sales.
The following table sets forth information related to our fi xed-line selling, general and administrative expenses for the periods indicated.
2011 2012
Rm Rm %
Materials and maintenance 1,843 1,960 (6.3)
Marketing 377 567 (50.4)
Bad debts 361 245 32.1
Other 960 1,062 (10.6)
Fixed-line selling, general and administrative expenses 3,541 3,834 (8.3)
Selling, general and administrative expenses increased by 8.3% primarily as a result of higher marketing expenses and higher materials and maintenance, partially offset by lower bad debts.
Materials and maintenance expenses include subcontractor payments and consumables required to maintain our network.
Materials and maintenance expenses increased in the year ended 31 March 2012 primarily due to a drive to reduce the fault rate on the core cable network as well as higher expenditure on the repair of copper theft incidents.
Marketing expenses increased in the 2012 fi nancial year due to the move of fi xed-line specifi c marketing expenses from the Corporate Centre to the fi xed-line segment.
Debtors impairment decreased in the year ended 31 March 2012 due to a decrease in the provision for specifi c wholesale debtors. Debtor’s impairment as a percentage of revenue improved from 1.1% in the 2011 fi nancial year to 0.8% in the 2012 fi nancial year.
Other expenses include obsolete stock, cost of sales, subsistence and travel and an offset for bad debts recovered. Other expenses increased in the 2012 fi nancial year primarily due to R111 million direct costs paid to 8•ta. These costs are eliminated on consolidation.
Fixed-line service feesService fees include payments in respect of the management of our properties, to total facilities management company, a facilities and property management company, consultants and security. Consultants comprise fees paid to collection agents and to providers of other professional services and external auditors. Security refers to services to safeguard the network and contracts to ensure a safe work environment, such as guard services.
The following table sets forth information relating to service fee expenses for the periods indicated.
2011 2012
Rm Rm %
Property management 1,336 1,292 3.3
Security and other 779 663 14.9
Data centre operations intercompany transactions 1,043 1,168 (12.0)
Fixed-line service fees 3,158 3,123 1.1
Property management fees decreased as a result of the renegotiation of the management fees paid and higher maintenance included in the previous year as a result of the Soccer World Cup.
Service fees decreased by 1.1% primarily due to savings on security costs offset by higher intercompany services charged by Cybernest. Intercompany cost is eliminated on consolidation.
Our carbon footprint and electricity consumption is calculated on page 103.
Fixed-line operating leases Operating leases include payments in respect of equipment, buildings and vehicles. Equipment leases decreased mainly due to lower rental of security equipment. Vehicle leases decreased as a result of a 10.2% reduction in the number of vehicles from 7,606 to 6,833 partially offset by infl ation and fuel increases.
Fixed-line depreciation, amortisation, impairments and write-offs
2011 2012
Rm Rm %
Depreciation 3,396 3,837 (13.0)
Amortisation 569 538 5.4
Impairments and write-offs 170 206 (21.2)
Fixed-line depreciation, amortisation, impairments and write-offs 4,135 4,581 (10.8)
Depreciation increased 13.0% due to accelerated depreciation as a result of the review of the useful lives of existing network equipment as we invest to transform to a commercially led next generation network.

Telkom Integrated Annual Report 2012 43
Mobile segment
Mobile operating expenses
2011 2012
Rm Rm %
Employee expenses 140 195 (39.3)
Payments to other network operators 161 449 (178.9)
Selling, general and administrative expenses 769 2,536 (229.8)
Service fees 87 397 (356.3)
Operating leases 27 99 (266.7)
Depreciation, amortisation, impairments and write-offs 46 219 (376.1)
Mobile operating expenses 1,230 3,895 (216.7)
Mobile expenditure increased 216.7% in the year ended 31 March 2012 to R3,895 million (2011: R1,230 million), mainly due to the inclusion of expenditure for the full year. 8•ta was launched in October 2010.
Employee expenses increased due to a 39.3% increase in 8•ta employees since March 2011 to 355 employees.
Payments to other operators consist mainly of interconnection payments to other operators and payments to MTN in terms of the roaming agreement. The increase is due to the signifi cant increase in mobile outgoing traffi c from the previous year.
The increase in selling, general and administrative expenses is mainly due to an increase in direct network cost, maintenance, cost of handsets sold, marketing expenses and bad debts.
Service fees relate to the intercompany charge by Cybernest for services rendered of R246 million (2011: R6 million) that is eliminated on consolidation.
Operating leases relate mostly to rental of buildings.
Other South African segment
Other South African operating revenueThe following table shows the operating revenue for our other segment broken down by major revenue streams and the percentage change by major revenue stream for the periods indicated:
2011 2012
Rm Rm %
Trudon 1,167 1,180 1.1
Swiftnet 127 128 0.8
Data Centre Operations 1,240 1,406 13.4
Corporate Centre 83 78 (6.0)
Other South Africa operating revenue 2,617 2,792 6.7
Revenue from directory services was relatively fl at for the year ended 31 March 2012. Lower revenue from published directories was offset by an increase in online internet services revenue. Revenue from printed directories is declining and we are focusing on growing internet revenue streams.
Data Centre Operations includes R1,322 million of internal revenue (2011: R1,165 million) that is eliminated on consolidation.
The following table shows the contributions to other South African operating expenses by each of the subsidiaries contained in our other South African segment and the percentage change for the periods indicated:
Other South African operating expenses
2011 2012
Rm Rm %
Trudon 695 718 (3.3)
Swiftnet 124 121 2.4
Data Centre Operations 1,054 1,100 (4.4)
Corporate Centre 2,584 2,712 (5.0)
Other South Africa operating expenses 4,457 4,651 (4.4)
Corporate Centre operating expenses
2011 2012
Rm Rm %
Employee expenses 1,076 1,162 (8.0)
Payments to other network operators – – –
Selling, general and administrative expenses 496 388 21.8
Service fees 704 893 (26.8)
Operating leases 11 20 (81.8)
Depreciation, amortisation, impairments and write-offs 297 249 16.2
Corporate Centre operating expenses 2,584 2,712 (5.0)
Employee expenses increased 8.0% mainly as a result of an increase in interest cost on the Telkom Retirement Fund and an increase in the post-retirement medical aid liability mainly due to an increase in interest and service costs. This was partially offset by lower bonuses.
Selling, general and administrative expenses decreased 21.8% mainly as a result of moving fi xed-line specifi c marketing expenses to the fi xed-line segment.
Service fees increased 26.8% mainly due to higher consulting fees, electricity, transport and legal costs.
Operating leases increased 81.8% due to an increase of the percentage offi ce space allocated to the Corporate Centre personnel based on an offi ce location compliance process completed during the year.

44 Telkom Integrated Annual Report 2012
Financial overview (continued)
Depreciation, amortisation, impairments and write-offs decreased 16.2% mainly due to lower write offs on support equipment in the current year.
LIQUIDITY AND CAPITAL RESOURCESGroup liquidity and capital resourcesThe following table shows information regarding our consolidated cash fl ows for the periods indicated.
2011 2012
Rm Rm %
Cash fl ows from operating activities 5,188 5,892 13.6
Cash fl ows from investing activities (4,545) (4,570) 0.6
Cash fl ows from fi nancing activities (2,715) (1,923) (29.2)
Net decrease in cash and cash equivalents (2,072) (601) 71.0
Effect of foreign exchange differences 52 (7) (113.5)
Net cash and cash equivalents at the beginning of the year 3,793 1,773 (53.3)
Net cash and cash equivalents at the end of the year 1,773 1,165 (34.3)
Cash fl ows from operating activitiesOur primary sources of liquidity are cash fl ows from operating activities and borrowings. We intend to fund our expenses, indebtedness and working capital requirements from cash generated from our operations and from capital raised in the markets. The year on year increase in cash fl ows from operating activities in the 2012 fi nancial year is mainly due to lower dividends paid in the 2012 fi nancial year as a result of the special dividend paid in the 2011 fi nancial year as well as lower taxation paid, partially offset by lower cash received from customers due to lower revenue.
Cash fl ows from investing activitiesCash fl ows from investing activities relate primarily to investments in our network. Cash fl ows used in investing activities in the 2011 fi nancial year includes the R500 million
additional investment in the cell captive; a funding vehicle utilised to fund our post retirement medial and liability. Cash fl ow invested in property, plant, equipment and intangible assets were 7.9% higher than the previous year, partially offset by lower proceeds on disposal of property, plant, equipment and intangible assets.
Cash fl ows from fi nancing activitiesCash fl ows from fi nancing activities are primarily a function of borrowing activities.
In the 2012 fi nancial year, loans repaid exceeded loans raised by R1,253 million due to the partial repayment of the syndicated loan of R1,280 million.
Working capital We had consolidated working capital from continuing operations of approximately R1.4 billion as of 31 March 2011, compared to consolidated working capital of approximately R497 million as of 31 March 2012.
The decrease in working capital in the 2012 fi nancial year was primarily due to the TL12 bond reaching maturity and classifi ed as a current liability. Telkom is of the opinion that the Telkom Group’s cash fl ows from operations, together with the proceeds from liquidity available under credit facilities and in the capital markets, will be suffi cient to meet the Telkom Group’s present working capital requirements for the 12 months following the date of this integrated report. We intend to fund current liabilities through a combination of operating cash fl ows and with new borrowings and borrowings available under existing credit facilities. We had R6.5 billion available under existing credit facilities as of 31 March 2012.
The improvement in working capital in the 2011 fi nancial year was primarily due to the repayment of short-term interest bearing debt, the payment of the Telcordia dispute and lower trade payables due to reduced capital expenditure. We had R7.6 billion available under existing credit facilities as of 31 March 2011.
We had cash and net fi nancial assets of R3.2 billion available at 31 March 2012 (2011: R3.3 billion).

Telkom Integrated Annual Report 2012 45
Debt maturityThe following table sets forth our consolidated indebtedness including fi nance leases as of 31 March 2012:
Interestpayment
dates
Interestrate/
coupon
Out-standing
as of31 March
2012
Nominalamount
out-standing
as of31 March
2012
Maturing
Year ended 31 March
2013 2014 2015 2016 2017After2017
(R millions) (%) ZAR ZAR ZAR ZAR ZAR ZAR ZAR ZAR
Telkom
Bonds
12.45% unsecured local bond due April 29, 2012 (TL12)1, 2
29 Apr and29 Oct 12.45 1,060 1,060 1,060 – – – – –
11.90% unsecured local bond due April 29, 2015 (TL15)1, 3
29 Apr and29 Oct 11.9 1,159 1,160 – – – 1,160 – –
6% unsecured local bond due February 24, 2020 (TL20)1, 4 22 Feb 6 1,495 2,500 – – – – – 2,500
Syndicated loans due December 17, 2013 7.5852 1,995 2,000 – 2,000 – – – –
EURO loans5 Quarterly 0.1 – 1.4 85 85 7 – – – – 78
USD loansSept and
March 2.4 – 2.5 539 585 141 141 141 141 21 –
Finance leases6 n/a13.43
– 37.78 845 845 79 55 79 109 144 379
Total Telkom 7,178 8,235 1,287 2,196 220 1,410 165 2,957
OTHER
Trudon (Pty) Limited
Various fi nance leases n/a5.0
– 10.0 6 6 2 4 – – – –
Kalahari Holdings – – 2 2 2 – – – – –
Total other 8 8 4 4 – – – –
Grand total 7,186 8,243 1,291 2,200 220 1,410 165 2,957
1 Listed on the Bond Exchange of South Africa.2 The TL12 was issued on April 29, 2009 at a yield to maturity of 12.47% and listed on the Bond Exchange of South Africa. 3 The TL15 was issued on April 29, 2009 at a yield to maturity of 11.91% and listed on the Bond Exchange of South Africa. 4 2,500 of these bonds were issued on February 22, 2000 at a yield to maturity of 15.00%. The TL20 bond was listed on the Bond Exchange of South Africa with
effect of April 1, 2005.5 R85 million of Telkom’s indebtedness outstanding as of March 31, 2012 was guaranteed by the Government of the Republic of South Africa. EURO loans converted
at the spot rate at 31 March.6 Finance leases are mostly secured by land and buildings.

46 Telkom Integrated Annual Report 2012
Financial overview (continued)
Capital expenditures and investments The following table shows the Telkom Group’s investment in property, plant and equipment including intangible assets from continuing operations for the periods indicated:
Year ended 31 March
2011 2012
Rm Rm %
Baseline 1,736 1,822 5.0
Network evolution 550 733 33.3
Sustainment 101 145 43.6
Effectiveness and effi ciency 155 102 (34.2)
Support 265 304 14.7
Regulatory and other 28 45 60.7
Fixed-line capital expenditure 2,835 3,151 11.1
Mobile 1,475 1,372 (7.0)
Other international
iWayAfrica 11 8 (27.3)
Other South African
Trudon 53 72 35.8
Swiftnet 16 42 162.5
Data Centre Operations 107 57 (46.7)
Corporate Centre 44 81 84.1
Telkom Group capital expenditure 4,541 4,783 5.3
Fixed-line capital expenditure, which includes spending on intangible assets, increased by 11.1% to R3,151 million (2011: R2,835 million) and represents 10.3% of fi xed-line revenue (2011: 9.0%).
Baseline capital expenditure of R1,822 million (2011: R1,736 million) was largely for the deployment of technologies to support the growing data services business, links to the mobile cellular operators and expenditure for access line deployment in selected high growth commercial and business areas.
The higher expenditure for the period can be attributed to the aggressive broadband marketing campaign designed to stimulate growth in the ADSL footprint.
Expenditure on network evolution of R733 million (2011: 550 million) was mainly to continue with the submarine cable projects to address international growth expected during the next decade and to provide next generation voice infrastructure on the national transport network as well as to relieve identifi ed capacity requirements. The increase in expenditure is as a result of the investment on the commercially led next generation network, specifi cally on operating support systems as well as the pilot roll-out.
The sustainment category expenditure of R145 million (2011: R101 million) was largely for the replacement of obsolete batteries and direct-current power systems as well as the replacement and modernisation of the access and core network.
Telkom continues to focus on its operations support systems with current emphasis on provisioning and fulfi lment, assurance and customer care and hardware technology upgrades on the enterprise networks. During the year ended 31 March 2012, R102 million (2011: R155 million) was spent on the implementation of several systems.
The support capital expenditure of R304 million (2011: R265 million) is mainly for provision of new buildings and building extensions in support of network growth and for the compliance upgrading of existing equipment buildings, including the associated AC power and air-conditioning.
The expenditure on regulatory requirements of R45 million (2011: R28 million) is primarily to institute regulatory changes to customer-facing functions.
Capital expenditure and funding levelCapital expenditure for the Group is expected to range between 20% and 25% of revenue over the 2013 fi nancial year including the impact of our mobile investment and between R18 billion and R21 billion over the next three years.
The targeted net debt to EBITDA is aimed at 1.4 times. In the short term we will operate at lower levels pending the cash outfl ows associated with the mobile related capital expenditure.

Telkom Integrated Annual Report 2012 47