Embed Size (px)
Citation preview
Group one
Scope 1 Campus Action Report
University of Toledo
Rachel Beres, Andrew Kulikowski, Jon Lockie, Chad Pietkowski, Ken Samoei, Cory Williams
4/19/2010
Abstract
The rising trend in green engineering gives way to advances in new technology and software to better
the environment and the people in it. Many companies are choosing to become more environmentally
conscious by means of recording a carbon footprint. The University of Toledo has undertaken this sort of
responsibility and has collectively calculated their very first carbon foot print. This report will explain what is
involved in only a portion of the report pertaining to direct emissions from sources owned by the University of
Toledo. The methods as to how the raw data was utilized will be thoroughly explained in the report as well as
the software that was used to carry out the necessary calculations. Plans for the future will also be discussed
along with a comparison to what may happen if nothing is done about the rising carbon dioxide emissions. The
report concludes with a section on reductions which describes a strategy that must be taken in order to lower
the school’s carbon emissions.
2 | P a g e
Table of ContentsList of Figures...........................................................................................................................................................3
List of Tables.............................................................................................................................................................4
List of Equations.......................................................................................................................................................4
1. Introduction..........................................................................................................................................................5
2. Objectives.............................................................................................................................................................6
3. Methods...............................................................................................................................................................6
3.1 Data Collection...............................................................................................................................................6
3.2 The Carbon Calculator....................................................................................................................................6
3.3 Greenhouse gas emission calculations for on campus coal usage..................................................................6
3.4 Greenhouse gas emission calculations for Natural Gas..................................................................................7
3.5 Greenhouse gas emission calculations for Gasoline.......................................................................................8
3.6 Greenhouse gas emission calculations for Diesel...........................................................................................8
3.7 Greenhouse gas emission calculations for E85...............................................................................................9
3.8 Greenhouse gas emission calculations for Biodiesel (B20).............................................................................9
3.9 Greenhouse gas emission calculations for Fertilizer.....................................................................................10
3.10 CO2 Equivalence calculation........................................................................................................................10
3.12 Constants used in equations.......................................................................................................................10
4. Results................................................................................................................................................................12
4.1 Summary of collected data...........................................................................................................................12
4.2 Emissions......................................................................................................................................................12
5. Interpretation.....................................................................................................................................................13
6. Projections..........................................................................................................................................................16
7. Reductions..........................................................................................................................................................17
8. Conclusions.........................................................................................................................................................18
9. References..........................................................................................................................................................19
10. Appendix..........................................................................................................................................................21
3 | P a g e
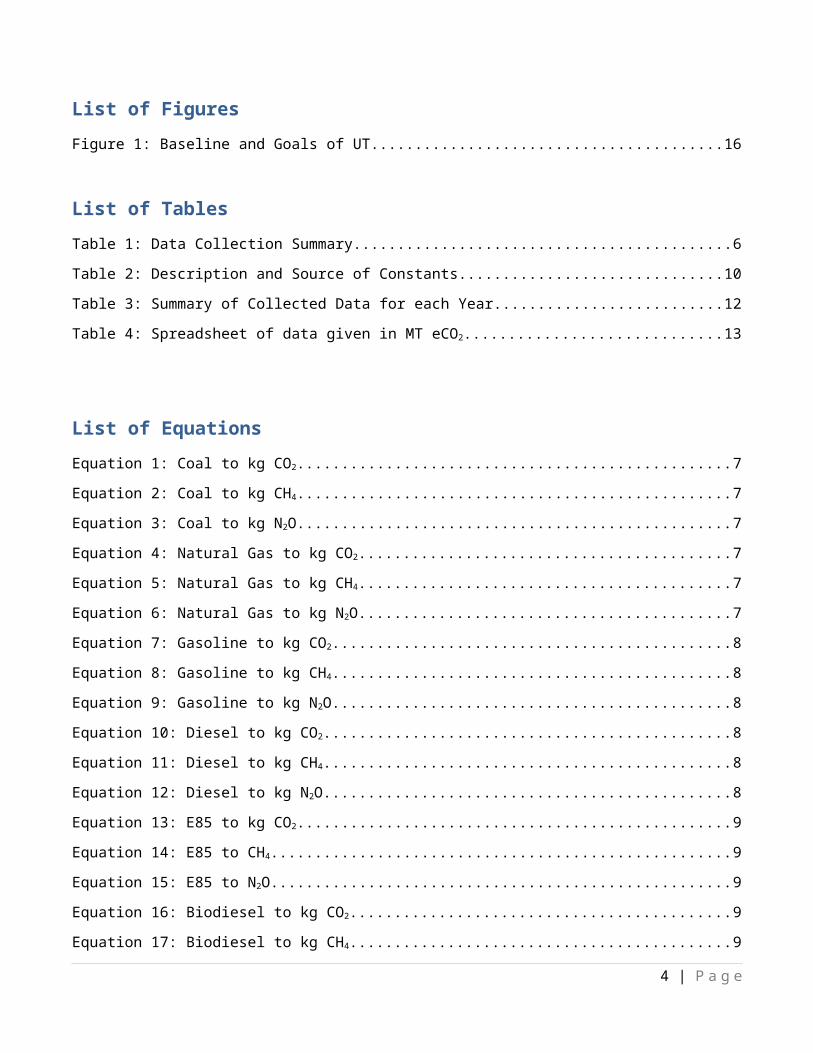
List of Figures
Figure 1: Baseline and Goals of UT.........................................................................................................................16
List of Tables
Table 1: Data Collection Summary...........................................................................................................................6
Table 2: Description and Source of Constants........................................................................................................10
Table 3: Summary of Collected Data for each Year................................................................................................12
Table 4: Spreadsheet of data given in MT eCO2......................................................................................................13
List of Equations
Equation 1: Coal to kg CO2........................................................................................................................................7
Equation 2: Coal to kg CH4........................................................................................................................................7
Equation 3: Coal to kg N2O.......................................................................................................................................7
Equation 4: Natural Gas to kg CO2............................................................................................................................7
Equation 5: Natural Gas to kg CH4............................................................................................................................7
Equation 6: Natural Gas to kg N2O............................................................................................................................7
Equation 7: Gasoline to kg CO2.................................................................................................................................8
Equation 8: Gasoline to kg CH4.................................................................................................................................8
Equation 9: Gasoline to kg N2O................................................................................................................................8
Equation 10: Diesel to kg CO2...................................................................................................................................8
Equation 11: Diesel to kg CH4...................................................................................................................................8
Equation 12: Diesel to kg N2O...................................................................................................................................8
Equation 13: E85 to kg CO2.......................................................................................................................................9
Equation 14: E85 to CH4............................................................................................................................................9
Equation 15: E85 to N2O...........................................................................................................................................9
Equation 16: Biodiesel to kg CO2..............................................................................................................................9
Equation 17: Biodiesel to kg CH4..............................................................................................................................9
Equation 18: Biodiesel to kg N2O..............................................................................................................................9
Equation 19: Fertilizer to kg N2O............................................................................................................................10
Equation 22: Metric Tons of CO2 Equivalence........................................................................................................10
4 | P a g e
1. Introduction
The rising popularity in sustainable engineering has inspired many companies to take action in order to
monitor their impact on the environment. The most common and rather effective way of monitoring a
company’s impact is to create what is known as a carbon footprint. A carbon footprint organizes all of the
different types of sources that may cause carbon emissions. The University of Toledo has decided to create their
own carbon footprint in order to better monitor their emissions. With the carbon footprint data, the university
will better be able to plan for the future and be more aware of its current and future impact on the
environment. They could choose where there is too much carbon dioxide being emitted and how to lower the
emissions. In addition, the university can then compare its own emissions to that of neighboring schools of
various sizes and locations. This could help them in knowing the amount of impact that the school causes
compared to other schools.
Before any emissions can be lowered, the school must first decide where to draw all of their data from.
Carbon emissions are categorized in three main categories: large stationary sources, utilities, and the student
and staff impacts. Each category is labeled with its respective scope number in order to differentiate between
the three. For the purpose of this report, only scope 1 will be discussed in its entirety.
Scope 1 emissions are direct emissions from sources that are owned by the University of Toledo. Within
scope 1 there are four major aspects that were addressed. The very first aspect is an on-campus co-generation
plant. This usually would include a power plant that creates electricity and heat; however the University of
Toledo does not have such a plant and will not be considered within the data. The second aspect of scope 1 is
any on-campus stationary sources. The university does actually have a stationary power source. The steam plant
powered by coal is the only stationary power/heat source. The third aspect includes direct transportation
sources. Direct transportation sources include, but are not limited to public buses, maintenance vehicles and
police vehicles owned and operated by the University of Toledo. Within this aspect, all different types of fuels
that power these vehicles also are considered because of their different impacts. The final aspect within scope 1
is refrigerants and chemicals as well as agricultural sources. Refrigerants and chemicals include any chemicals
that are used in refrigerators and freezers and any other sort of cooling device. The agricultural source on the
University campus is very small and will have a rather small impact on the carbon footprint. Hopefully by
forming this carbon footprint, the University of Toledo can successfully lower their harmful impact on the
environment and be an influential model to other companies aspiring to lower their carbon emissions.
5 | P a g e
2. Objectives
The goal of the scope 1 study was to collect resource usage data from the campus power plant, direct
transportation, and agricultural sources, estimate the emissions from these sources using a previously
developed campus carbon calculator (Clean Air Cool Planet, 2009), and interpret these results as well as provide
recommendations for emission reductions and make projections for future emissions.
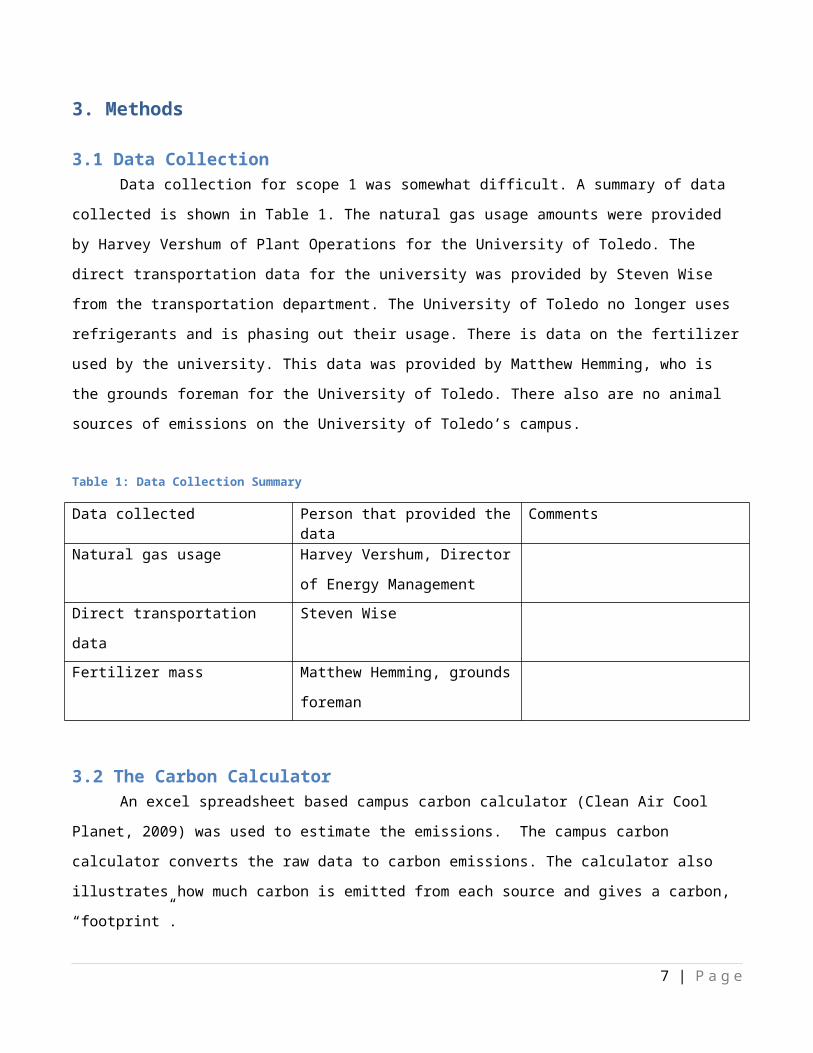
3. Methods
3.1 Data CollectionData collection for scope 1 was somewhat difficult. A summary of data collected is shown in Table 1. The
natural gas usage amounts were provided by Harvey Vershum of Plant Operations for the University of Toledo.
The direct transportation data for the university was provided by Steven Wise from the transportation
department. The University of Toledo no longer uses refrigerants and is phasing out their usage. There is data on
the fertilizer used by the university. This data was provided by Matthew Hemming, who is the grounds foreman
for the University of Toledo. There also are no animal sources of emissions on the University of Toledo’s campus.
Table 1: Data Collection Summary
Data collected Person that provided the data CommentsNatural gas usage Harvey Vershum, Director of Energy
Management
Direct transportation data Steven Wise
Fertilizer mass Matthew Hemming, grounds
foreman
3.2 The Carbon CalculatorAn excel spreadsheet based campus carbon calculator (Clean Air Cool Planet, 2009) was used to
estimate the emissions. The campus carbon calculator converts the raw data to carbon emissions. The
calculator also illustrates how much carbon is emitted from each source and gives a carbon, “footprint”.
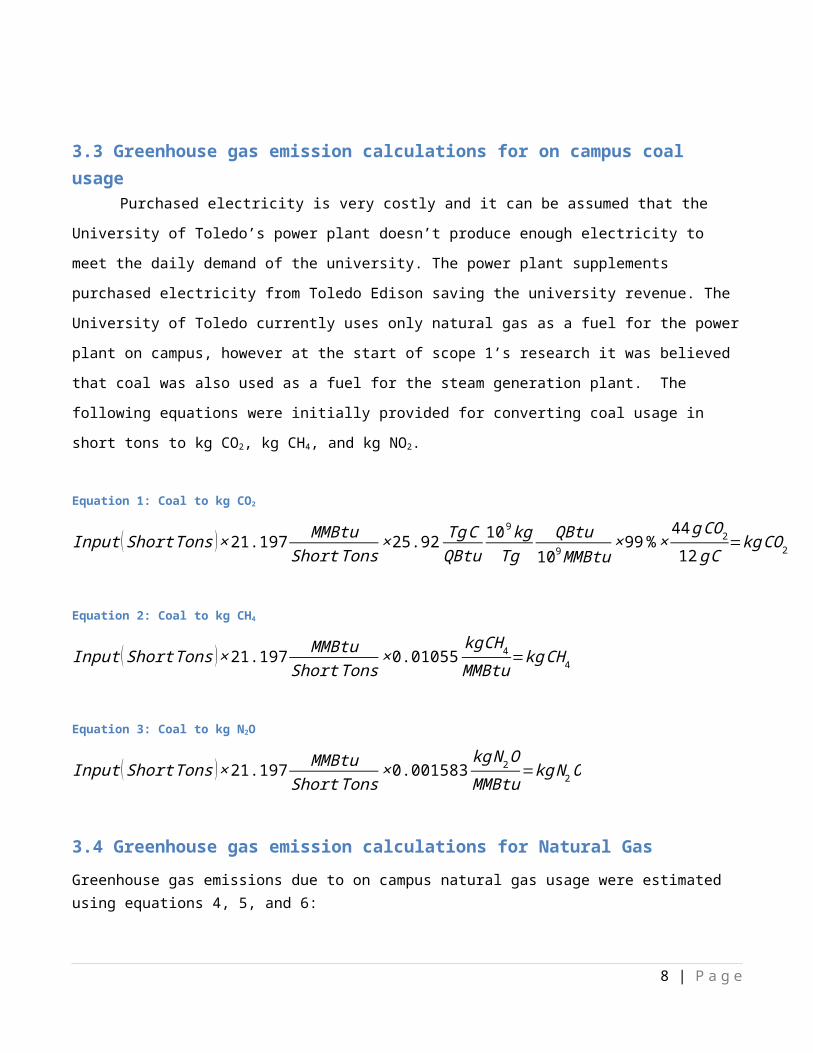
3.3 Greenhouse gas emission calculations for on campus coal usagePurchased electricity is very costly and it can be assumed that the University of Toledo’s power plant
doesn’t produce enough electricity to meet the daily demand of the university. The power plant supplements
6 | P a g e
purchased electricity from Toledo Edison saving the university revenue. The University of Toledo currently uses
only natural gas as a fuel for the power plant on campus, however at the start of scope 1’s research it was
believed that coal was also used as a fuel for the steam generation plant. The following equations were initially
provided for converting coal usage in short tons to kg CO2, kg CH4, and kg NO2.
Equation 1: Coal to kg CO2
Input (Short Tons )×21.197 MMBtuShort Tons
×25.92 TgCQBtu
109 kgTg
QBtu109MMBtu
×99 %×44 gCO2
12gC=kgCO2
Equation 2: Coal to kg CH4
Input (Short Tons )×21.197 MMBtuShort Tons
×0.01055kgCH 4
MMBtu=kgCH 4
Equation 3: Coal to kg N2O
Input (Short Tons )×21.197 MMBtuShort Tons
×0.001583kg N2OMMBtu
=kg N2O
3.4 Greenhouse gas emission calculations for Natural Gas
Greenhouse gas emissions due to on campus natural gas usage were estimated using equations 4, 5, and 6:
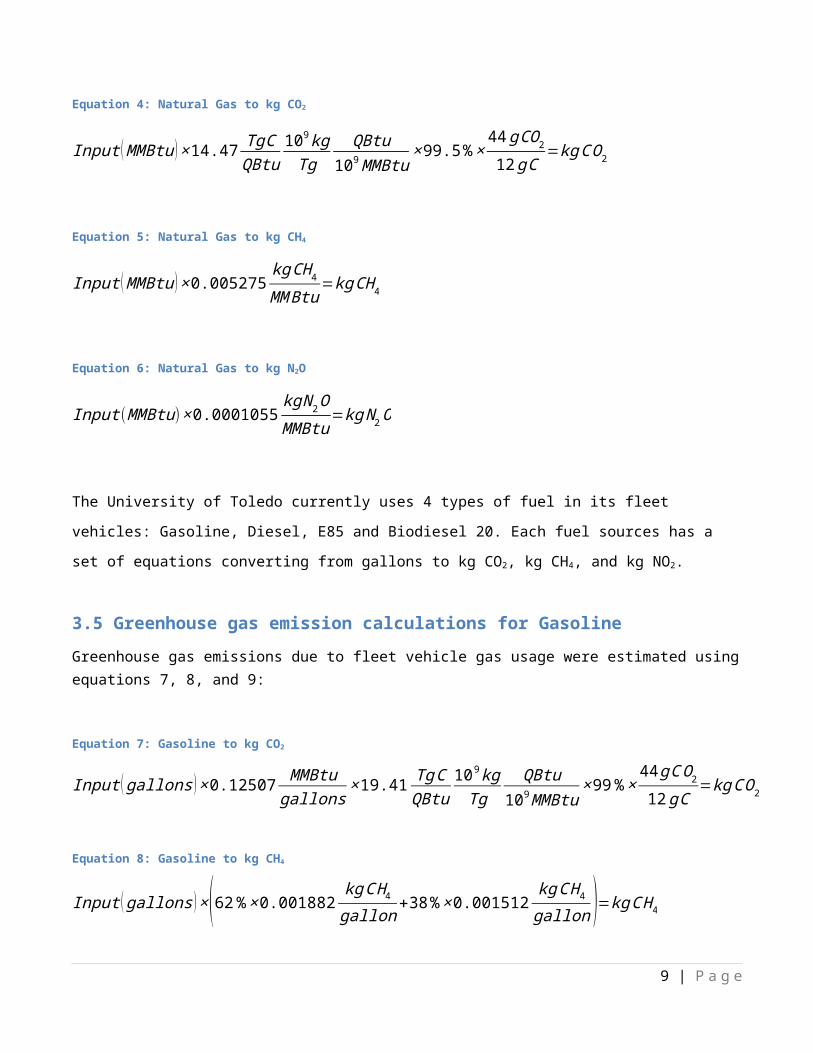
Equation 4: Natural Gas to kg CO2
Input (MMBtu )×14.47 TgCQBtu
109kgTg
QBtu109MMBtu
×99.5 %×44 gCO2
12gC=kgC O2
Equation 5: Natural Gas to kg CH4
Input (MMBtu )×0.005275kgCH 4
MM Btu=kgCH 4
Equation 6: Natural Gas to kg N2O
Input (MMBtu)×0.0001055kg N2OMMBtu
=kg N2O
7 | P a g e
The University of Toledo currently uses 4 types of fuel in its fleet vehicles: Gasoline, Diesel, E85 and Biodiesel 20.
Each fuel sources has a set of equations converting from gallons to kg CO2, kg CH4, and kg NO2.
3.5 Greenhouse gas emission calculations for Gasoline
Greenhouse gas emissions due to fleet vehicle gas usage were estimated using equations 7, 8, and 9:
Equation 7: Gasoline to kg CO2
Input (gallons )×0.12507 MMBtugallons
×19.41 TgCQBtu
109kgTg
QBtu109MMBtu
×99 %×44 gCO2
12gC=kgCO2
Equation 8: Gasoline to kg CH4
Input (gallons )×(62%×0.001882kgC H4
gallon+38 %×0.001512
kgC H 4
gallon )=kgC H4
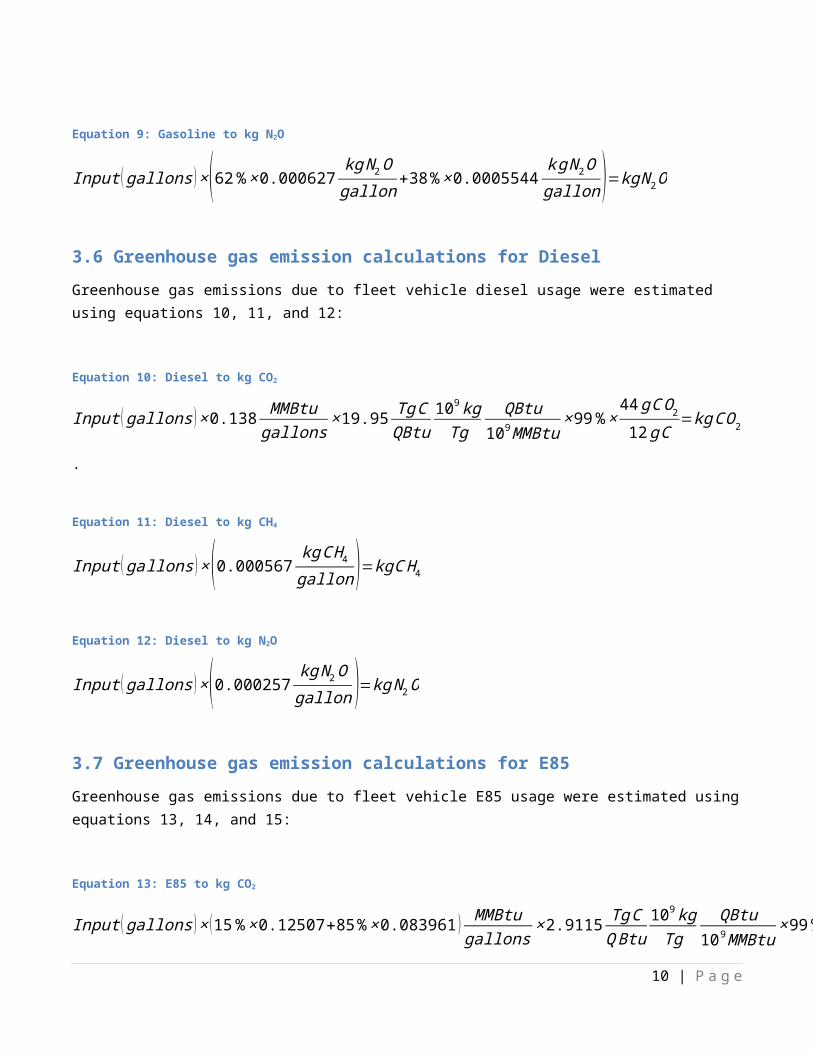
Equation 9: Gasoline to kg N2O
Input (gallons )×(62%×0.000627kg N 2Ogallon
+38 %×0.0005544k gN 2Ogallon )=kg N2O
3.6 Greenhouse gas emission calculations for Diesel
Greenhouse gas emissions due to fleet vehicle diesel usage were estimated using equations 10, 11, and 12:
Equation 10: Diesel to kg CO2
Input (gallons )×0.138 MMBtugallons
×19.95 TgCQBtu
109kgTg
QBtu109MMBtu
×99 %×44 gCO2
12gC=kgCO2.
Equation 11: Diesel to kg CH4
Input (ga llons )×(0.000567kgC H4
gallon )=kgC H 4
Equation 12: Diesel to kg N2O
Input (gallons )×(0.000257kg N 2Ogallon )=kg N 2O
8 | P a g e
3.7 Greenhouse gas emission calculations for E85
Greenhouse gas emissions due to fleet vehicle E85 usage were estimated using equations 13, 14, and 15:
Equation 13: E85 to kg CO2
Input (gallons )× (15%×0.12507+85 %×0.083961 ) MMBtugallons
×2.9115 TgCQ Btu
109 kgTg
QBtu109MMBtu
×99 %×44 gCO2
12gC=kgCO2
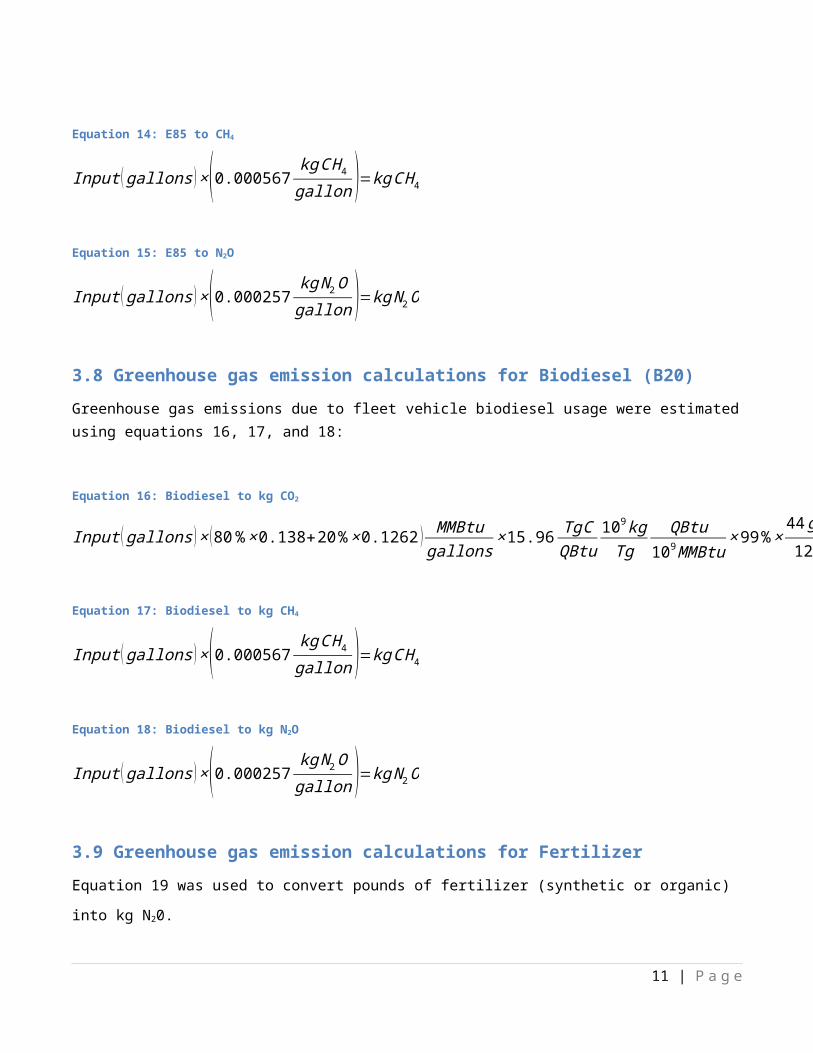
Equation 14: E85 to CH4
Input (gallons )×(0.000567kgC H4
gallon )=kgC H4
Equation 15: E85 to N2O
Input (gallons )×(0.000257kg N 2Ogallon )=kg N 2O
3.8 Greenhouse gas emission calculations for Biodiesel (B20)
Greenhouse gas emissions due to fleet vehicle biodiesel usage were estimated using equations 16, 17, and 18:
Equation 16: Biodiesel to kg CO2
Input (gallons )× (80 %×0.138+20 %×0.1262 ) MMBtugallons
×15.96 TgCQBtu
109 kgTg
QBtu109MMBtu
×99 %×44 gCO2
12gC=kg CO2
Equation 17: Biodiesel to kg CH4
Input (gallons )×(0.000567kgC H4
gallon )=kgC H4
Equation 18: Biodiesel to kg N2O
Input (gallons )×(0.000257kg N 2Ogallon )=kg N 2O
3.9 Greenhouse gas emission calculations for Fertilizer
Equation 19 was used to convert pounds of fertilizer (synthetic or organic) into kg N20.
9 | P a g e
Equation 19: Fertilizer to kg N2O
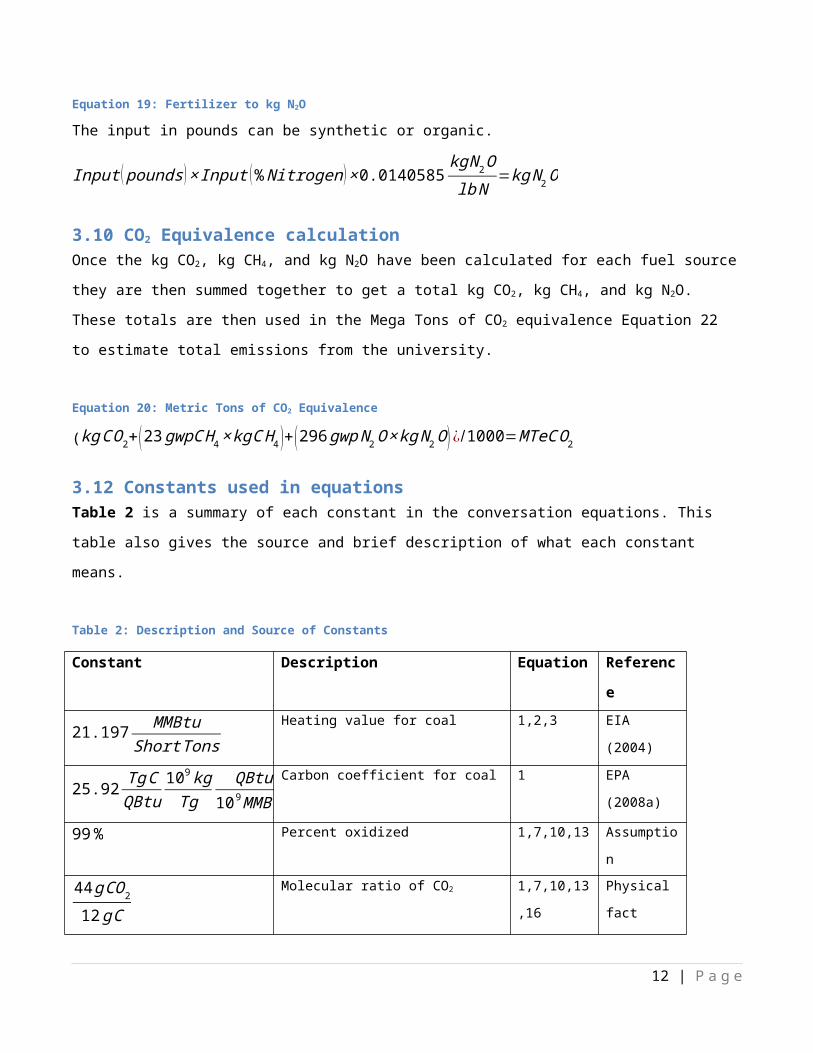
The input in pounds can be synthetic or organic.
Input ( pounds )×Input (%Nitrogen )×0.0140585kg N2Olb N
=kg N 2O
3.10 CO2 Equivalence calculationOnce the kg CO2, kg CH4, and kg N2O have been calculated for each fuel source they are then summed together
to get a total kg CO2, kg CH4, and kg N2O. These totals are then used in the Mega Tons of CO2 equivalence
Equation 22 to estimate total emissions from the university.
Equation 20: Metric Tons of CO2 Equivalence
(kgC O2+( 23gwpC H 4×kgC H4 )+ (296gwp N2O×kgN 2O )¿ /1000=MTeCO2
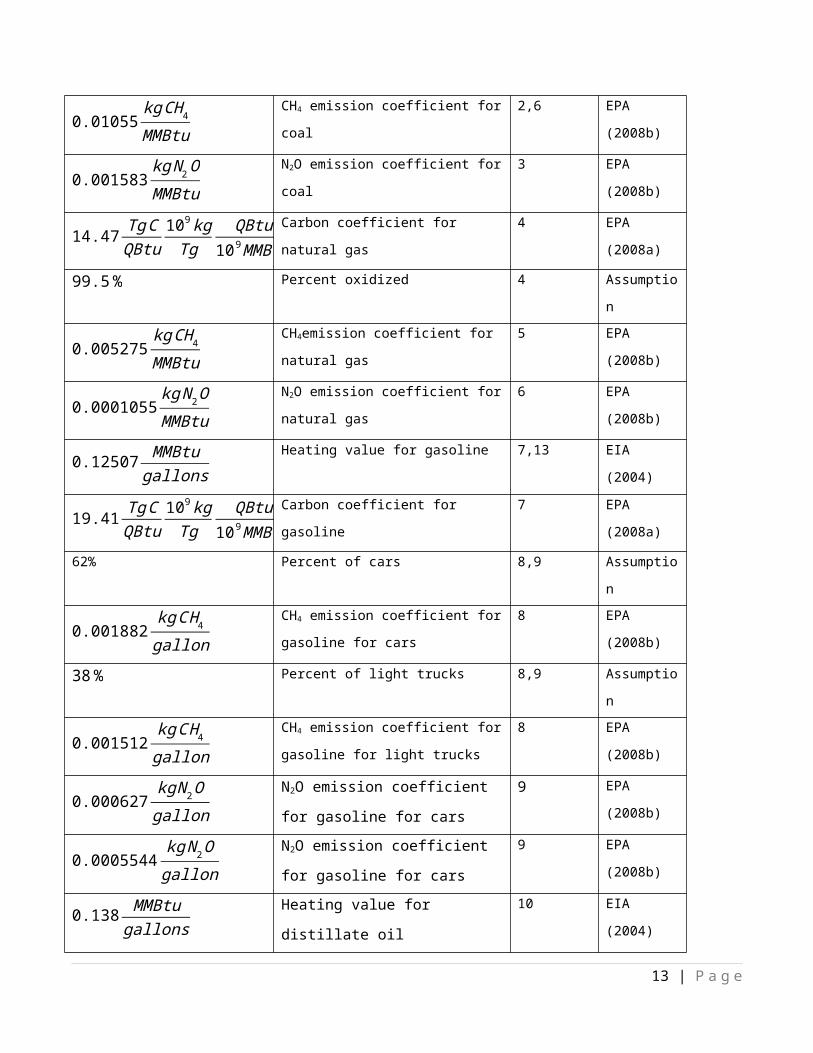
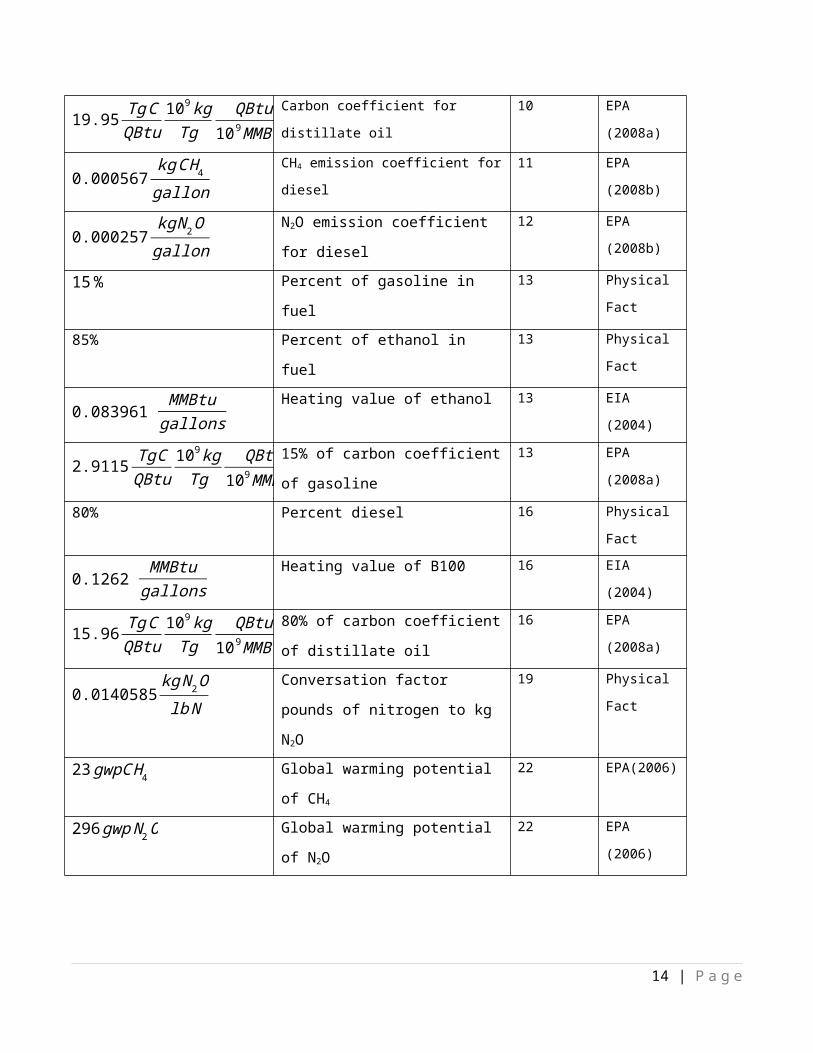
3.12 Constants used in equationsTable 2 is a summary of each constant in the conversation equations. This table also gives the source and brief
description of what each constant means.
Table 2: Description and Source of Constants
Constant Description Equation Reference
21.197 MMBtuShort Tons
Heating value for coal 1,2,3 EIA (2004)
25.92 TgCQBtu
109 kgTg
QBtu109MMBtu
Carbon coefficient for coal 1 EPA (2008a)
99% Percent oxidized 1,7,10,13 Assumption
44 gCO2
12gC
Molecular ratio of CO2 1,7,10,13,16 Physical fact
0.01055kgCH4
MMBtu
CH4 emission coefficient for coal 2,6 EPA (2008b)
0.001583kg N2OMMBtu
N2O emission coefficient for coal 3 EPA (2008b)
14.47 TgCQBtu
109kgTg
QBtu109MMBtu
Carbon coefficient for natural gas 4 EPA (2008a)
99.5 % Percent oxidized 4 Assumption
10 | P a g e
0.005275kg CH4
MMBtu
CH4emission coefficient for natural gas 5 EPA (2008b)
0.0001055kg N2OMMBtu
N2O emission coefficient for natural gas 6 EPA (2008b)
0.12507 MMBtugallons
Heating value for gasoline 7,13 EIA (2004)
19.41 TgCQBtu
109 kgTg
QBtu109MMBtu
Carbon coefficient for gasoline 7 EPA (2008a)
62% Percent of cars 8,9 Assumption
0.001882kgC H4
gallon
CH4 emission coefficient for gasoline for
cars
8 EPA (2008b)
38 % Percent of light trucks 8,9 Assumption
0.001512kgC H4
gallon
CH4 emission coefficient for gasoline for
light trucks
8 EPA (2008b)
0.000627kg N2Ogallon
N2O emission coefficient for gasoline
for cars
9 EPA (2008b)
0.0005544kg N2Ogallon
N2O emission coefficient for gasoline
for cars
9 EPA (2008b)
0.138 MMBtugallons
Heating value for distillate oil 10 EIA (2004)
19.95 TgCQBtu
109 kgTg
QBtu109MMBtu
Carbon coefficient for distillate oil 10 EPA (2008a)
0.000567kgC H4
gallon
CH4 emission coefficient for diesel 11 EPA (2008b)
0.000257kg N2Ogallon
N2O emission coefficient for diesel 12 EPA (2008b)
15% Percent of gasoline in fuel 13 Physical Fact
85% Percent of ethanol in fuel 13 Physical Fact
0.083961 MMBtugallons
Heating value of ethanol 13 EIA (2004)
2.9115 TgCQBtu
109 kgTg
QBtu109MMBtu
15% of carbon coefficient of gasoline 13 EPA (2008a)
80% Percent diesel 16 Physical Fact
11 | P a g e
0.1262 MMBtugallons
Heating value of B100 16 EIA (2004)
15.96 TgCQBtu
109 kgTg
QBtu109MMBtu
80% of carbon coefficient of distillate
oil
16 EPA (2008a)
0.0140585kg N2OlbN
Conversation factor pounds of
nitrogen to kg N2O
19 Physical Fact
23 gwpCH 4 Global warming potential of CH4 22 EPA(2006)
296 gwpN2O Global warming potential of N2O 22 EPA (2006)
4. Results
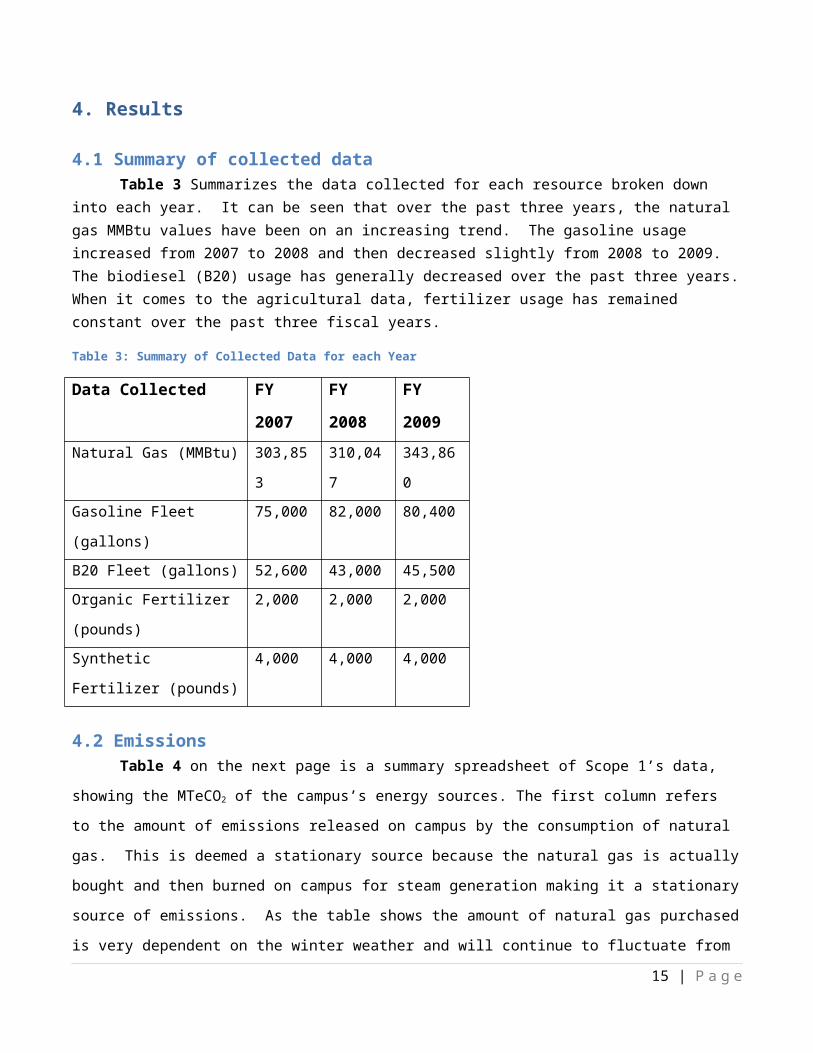
4.1 Summary of collected dataTable 3 Summarizes the data collected for each resource broken down into each year. It can be seen
that over the past three years, the natural gas MMBtu values have been on an increasing trend. The gasoline usage increased from 2007 to 2008 and then decreased slightly from 2008 to 2009. The biodiesel (B20) usage has generally decreased over the past three years. When it comes to the agricultural data, fertilizer usage has remained constant over the past three fiscal years.
Table 3: Summary of Collected Data for each Year
Data Collected FY 2007 FY 2008 FY 2009
Natural Gas (MMBtu) 303,853 310,047 343,860
Gasoline Fleet (gallons) 75,000 82,000 80,400
B20 Fleet (gallons) 52,600 43,000 45,500
Organic Fertilizer (pounds) 2,000 2,000 2,000
Synthetic Fertilizer (pounds) 4,000 4,000 4,000
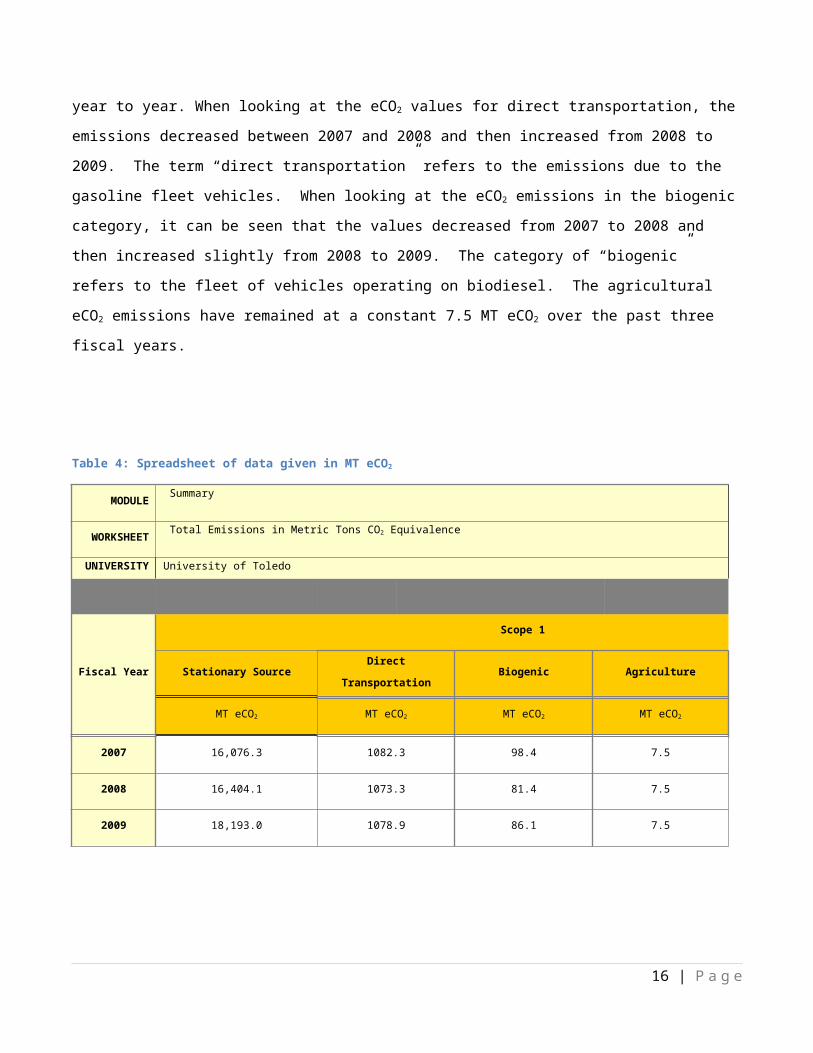
4.2 Emissions Table 4 on the next page is a summary spreadsheet of Scope 1’s data, showing the MTeCO2 of the
campus’s energy sources. The first column refers to the amount of emissions released on campus by the
consumption of natural gas. This is deemed a stationary source because the natural gas is actually bought and
then burned on campus for steam generation making it a stationary source of emissions. As the table shows the
amount of natural gas purchased is very dependent on the winter weather and will continue to fluctuate from
year to year. When looking at the eCO2 values for direct transportation, the emissions decreased between 2007
12 | P a g e
and 2008 and then increased from 2008 to 2009. The term “direct transportation” refers to the emissions due
to the gasoline fleet vehicles. When looking at the eCO2 emissions in the biogenic category, it can be seen that
the values decreased from 2007 to 2008 and then increased slightly from 2008 to 2009. The category of
“biogenic” refers to the fleet of vehicles operating on biodiesel. The agricultural eCO2 emissions have remained
at a constant 7.5 MT eCO2 over the past three fiscal years.
Table 4: Spreadsheet of data given in MT eCO2
MODULE Summary
WORKSHEET Total Emissions in Metric Tons CO2 Equivalence
UNIVERSITY University of Toledo
Fiscal Year
Scope 1
Stationary Source Direct Transportation Biogenic Agriculture
MT eCO2 MT eCO2 MT eCO2 MT eCO2
2007 16,076.3 1082.3 98.4 7.5
2008 16,404.1 1073.3 81.4 7.5
2009 18,193.0 1078.9 86.1 7.5
5. Interpretation
There is much to be learned from the current collected data. By looking at the past, we can begin to
predict the future based on the trend set forth within the previous years. Issues that may not currently seem
detrimental can be viewed on a large scale to see the “big picture.” The results of the data and projections will
make it appropriately easy to compare The University of Toledo to other schools of like size. Also, this data will
help to illustrate the areas on campus where there is the biggest concern. It will demonstrate not only which
value is highest but also the proportion to the area on campus that uses the most of that resource. We can then
13 | P a g e
begin to see the problem for what it is and where it will need to be addressed. The collected data will also
represent our current attempts to reduce the use of certain products and energies.
The data demonstrates that the University of Toledo is currently using many resources in excess. One of
these includes natural gas which accounts for the university uses for steam generation. This is a problem
because it is a limited resource that not only is very costly monetarily, but also is very costly and harmful to the
environment by causing a major greenhouse gas problem. Table 3 accurately represents the amount of eCO2
that the university has used over the past 3 fiscal years. The numbers do not immediately send up a red flag, but
upon closer review, the numbers can be found to be drastically increasing every year. In fact, there has been a
10% increase within the last three years in stationary source carbon usage. On a good note, however, Table 3
demonstrates that the amount of agricultural emissions due to fertilizer appplication is rather low and not
increasing with time. The past three fiscal years have seen a constant 7.5 MT of eCO2 emission. Also,
transportation due to the university’s bus fleet and maintenance vehicles can be found to be very constant over
the past three years.
The university does have a vast transportation fleet including a number of buses, transit vans, and
maintenance trucks. The carbon data for these vehicles can be viewed in Table 3. Even with the immense usage
by these vehicles, the carbon output by these vehicles accounts for a small percentage of the university’s overall
carbon footprint. This is most likely because the bus fleet the university now uses is run solely on biodiesel and.
This greatly reduces the overall impact compared to a traditional gas or regular diesel fleet that the university
used to utilize. Also, it needs to be understood that by incorporating this mass-transit system, the carbon
footprint due to commuters and individual drivers is greatly decreased. One evil is definitely better than the
other.
Compared to Ohio University, which is roughly the same size, having 20,672 students to Toledo’s 25,280,
Toledo has a much smaller carbon footprint in scope 1. Ohio University uses 69,331 metric tons of eCO2 on
14 | P a g e
stationary sources to generate power. That number seems astronomical compared to Toledo’s emissions of
18,193.0 metric tons of eCO2 in the same category. That is a 365% larger emission rate per student compared to
The University of Toledo. Even though Toledo’s carbon footprint in stationary sources is lower than Ohio
University, the number is still higher than desirable. The large amount of eCO2 in stationary sources can
somewhat be contributed to the fact that UT is largely a science/engineering school with many of its buildings
having vast labs and equipment that require a constant yearly temperature for use. This makes sense, and
perhaps it is those buildings that will need to be looked at closest to decide how the steam consumption can be
reduced.
The University of Toledo also outputs much less carbon due to university owned transportation than
Ohio University. Toledo uses 1078.9 metric tons of eCO2 compared to Ohio’s 1243 metric tons of eCO2 in this
area. That is a 41% higher emission rate per student compared to the University of Toledo. Perhaps it is the
density of the campus that plays a role in this category. The University of Toledo Main Campus is rather dense
and requires less bus traffic and shorter routes which would require less carbon output.
According to the numbers, The University of Toledo has emitted 7.5 metric tons of eCO2 during each of
the past three years, when factoring in agricultural sources such as fertilizer Ohio University emits 17 metric tons
of eCO2. That is a 196% higher emission rate per student compared to The University of Toledo. Once again, this
makes sense due to the density of the campus. With a more compact space, Toledo requires less fertilizer for
landscaping because there is less total landscaping.
The University of Toledo has recognized the need for more sustainable methods such as implementing
wind and solar power to help reduce the amount of electricity that is purchased from off campus sources. If
these practices continue, the current carbon numbers will get better. If the correct measures are taken, as
intended, The University of Toledo will eventually become a self-sufficient site and hopefully, a role-model for
others to follow.
15 | P a g e
6. ProjectionsFigure 1: Baseline of UT
2000 2010 2020 2030 2040 2050 2060-
10,000.0
20,000.0
30,000.0
40,000.0
50,000.0
60,000.0
70,000.0
Projections of eCO2 Emissions for Scope 1
Projection
Years
Tota
l Em
issio
ns (M
T eC
O2)
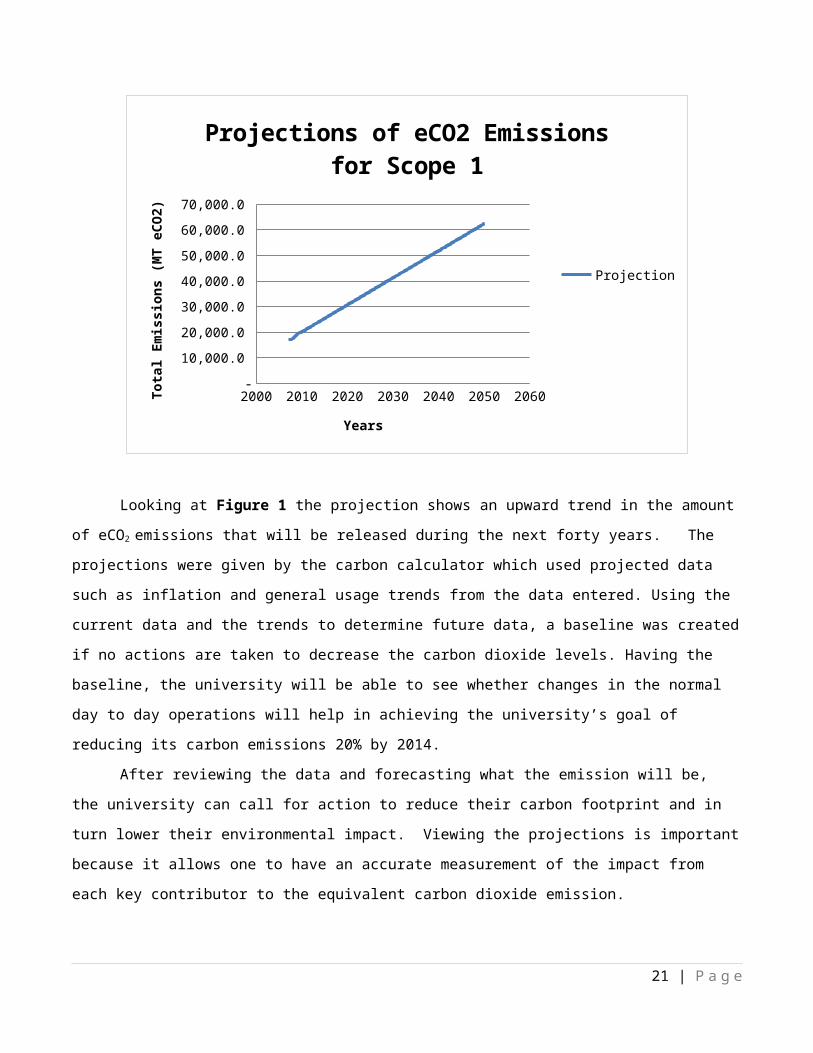
Looking at Figure 1 the projection shows an upward trend in the amount of eCO2 emissions that will be
released during the next forty years. The projections were given by the carbon calculator which used projected
data such as inflation and general usage trends from the data entered. Using the current data and the trends to
determine future data, a baseline was created if no actions are taken to decrease the carbon dioxide levels.
16 | P a g e
Having the baseline, the university will be able to see whether changes in the normal day to day operations will
help in achieving the university’s goal of reducing its carbon emissions 20% by 2014.
After reviewing the data and forecasting what the emission will be, the university can call for action to
reduce their carbon footprint and in turn lower their environmental impact. Viewing the projections is
important because it allows one to have an accurate measurement of the impact from each key contributor to
the equivalent carbon dioxide emission.
Before decisions are made in the future one can determine what type of effect and how much of an
impact a change from current operations will make. It will help prevent decisions that have little to no effect on
carbon emissions or even worse, increase current emissions. The projections will be very useful tools in helping
the university reach its goal of becoming a carbon neutral campus in the future.
7. Reductions
Much effort has been put towards collecting university’s data in order to analyze and establish a plan
that will help pinpoint high emission areas in order to take necessary actions. It is hoped that in preparing the
green house gas inventory, it will provide the strategic information needed for the next step: the development
of an institutional action plan to achieve climate neutrality. Following the president’s commitment, it is hoped
that the campus action report will aid in establishing a climate strategic plan that will be a guideline to;
Setting a target date for achieving climate neutrality.
Identifying interim targets for goals and actions that will lead to climate neutrality.
Initiating actions to make climate neutrality and sustainability a part of the curriculum and their
educational experience for all students.
Providing an action plan to expand research or other efforts necessary to achieve climate
neutrality.
Identifying ways and mechanisms for tracking progress on goals and actions.
There are several areas specific to scope 1 that will give precise decision on how to move forward in
strategizing and implementing the steps needed to reduce emissions. This campus action report will only act as
an initial step toward that plan, identifying the major sources of greenhouse gas emissions and general
strategies for reduction. The reductions discussed are conservative to On-campus stationary sources, direct
transportation sources, refrigerants, chemicals and agricultural sources. The university can reduce carbon
footprints and eventually achieve carbon neutrality by starting with the following initial steps.
17 | P a g e
1. Efficiencies: increasing the efficiency of current operations that produce greenhouse gases, which
largely means reducing current and future fossil fuel energy consumption by;
a. Inspecting Building and system design for existing and new buildings
b. Analyzing building and system operation for existing buildings
c. Improving the operation of steam and electricity plants
d. Purchasing equipments that are more efficient.
e. Immediately reviewing and initiating the University’s design and operational standards for both
new and existing buildings.
2. Conservation. New efficiencies can also be also achieved through changes in consumption habits and
patterns such as the usage of electronic equipment and waste recycling.
3. Renewables: switching to carbon-free and renewable sources of energy, or increasing the recycling of
emission causing materials.
4. Offsets: purchasing or producing carbon offsets through more direct projects. Offsets like the wind
purchase are an intermediate technique, and should only be employed after improvements through
efficiencies and renewables have been fully exploited.
By collecting data and doing a comprehensive analysis, it will provide a better monitoring strategy in
implementing the action plan that will guide the University towards carbon reduction. Also, developing real
incentives for investment in these strategies will be important in revising the current scheme of utility cost
allocation through individual building metering. However, the potential effect of each of these approaches to
carbon reduction will need to be examined in relation to the more detailed results from building audits which
will enable the development of much more precise strategies and estimates of their impact.
8. Conclusions
The data that has been collected thus far points towards an increase in our campus’ energy
consumption, a less than sustainable usage of non-renewable resources, and an undesirable level of greenhouse
gas emissions. When looking at the main campus’ steam plant gas usage, there is an obvious increase in
consumption for the three fiscal years observed.
The transportation results show that the amount of fuel used has relatively remained a constant.
However, developing smarter bus routes, increasing the amount of hybrids and or biodiesel vehicles in the
University’s fleet can contribute to decreasing the overall emissions caused by the university owned vehicles.
18 | P a g e
When looking at the data collected, it is evident that if the university carries on with its current path of
consumption and emissions that the numbers will continue to rise in an unsustainable fashion. It is necessary to
study the data gathered from the last few years and evaluate from which sectors of consumption and emissions
major changes need to be made.
To recap on the methods of reducing our emissions and consumption, it is important for the University
of Toledo to focus on becoming increasingly efficient in our operations. New and existing buildings on campus
must be evaluated for being energy efficient in design and in operation. Conservation is also going to be an
important part of this climate action plan. Current university consumption habits must be evaluated and
changes made to be more sustainable. It is also important to begin utilizing renewable resources ahead of
wasting away the non-renewable sources as we are currently. Another method that can be explored in the near
future to further advance the university’s goal of carbon neutrality is the purchasing or producing of carbon
offsets.
Being a part of the ACUPCC, it is imperative that The University of Toledo as a whole continue to
monitor our impact on the environment and make changes in our normal operations and habits that will result
in minimizing our carbon footprint. After reviewing the results of this initial study, it is absolutely necessary that
actions must be taken not only by the university but by its students in order to reach our long term goal carbon
neutrality.
19 | P a g e
9. References
Clean Air Cool Planet (2009) Campus Carbon Calculator Version 6.4 < http://www.cleanair-coolplanet.org/toolkit/inv-calculator.php> (March 3, 2010)
EIA (2004) Annual Energy Review 2004. Energy Information Administration, U.S. Department of Energy. Appendix A, http://www.eia.doe.gov/emeu/aer/contents.html
EPA (2008a) Draft Inventory of U.S. Greenhouse Gas Emissions and Sinks: 1990-2006. February 2008. Annex 2, page A-43, Table A-32.
http://www.epa.gov/climatechange/emissions/usinventoryreport.html
EPA (2008b) Draft Inventory of U.S. Greenhouse Gas Emissions and Sinks: 1990-2006. February 2008. Annex 3,
page A-98, Table A-70. http://www.epa.gov/climatechange/emissions/usinventoryreport.html
20 | P a g e
10. Appendix
(1/31/2010) RFI - Email sent to Steve Wise, head of Transit Services about fuel usages, no response yet - Jon Lockie
(2/4/2010) @ 5:26pm - Email sent to Michael Green, facilities manager/plant operations/energy concerning refrigerants & chemicals, no response yet - Andrew Kulikowski(2/4/2010) @ 5:36pm - Email sent to Douglas Collins, director of facilities & grounds, concerning our agricultural sources and fertilizer application, no response yet - Andrew Kulikowski
(2/5/2010) @ 4:23pm - Received an email back from Douglas Collins saying that he forwarded my email to Matthew Hemming who is the grounds foreman and will be sending me the pesticide information - Andrew Kulikowski
(2/8/2010) @ 10:00pm - Email sent to Harvey Vershum, Director of Energy Management, regarding stationary source emissions, no response yet - Rachel Beres
(2/9/2010) @ 4:23pm - Email received from Harvey Vershum with data of stationary source emissions. - Rachel Beres
(2/13/2010) @ 3:35 pm - Email sent to Michael Green, Manager, Plant Operations regarding Co-generation plant data.- Ken Samoei
(2/13/2010) - Email sent to Harvey Vershum, Director of Energy Management - Ken Samoei
(2/15/2010) - Email received from Harvey Vershum, Director of Energy management regarding Co-Generation Plant data - Ken Samoei
(2/16/2010) - Called and spoke to Michael Green concerning refrigerant and chemical usage. He said we have gotten rid of most refrigerants on campus but he will be forwarding my info on to Alan Vaughn, another manager who will be able to help me out a little better, no response yet - Andrew Kulikowski(2/16/2010) - Emailed Michael Green the Llloyd Jacobs letter and sent him another copy of the refrigerant and chemical list to send to Alan Vaughn - Andrew Kulikowski(2/16/2010) - Emailed Matthew Hemming (grounds foreman) to check on his status for Agricultural Sources data. Douglas Collins, my original contact had forwarded my information on to Matthew Hemming. No phone number is on record for Mr. Hemming. - Andrew Kulikowski
(2/17/2010) @ 7:39am - Email received from Matthew Hemming saying he will have data concerning our agricultural sources by Tuesday, Feb. 23. - Andrew Kulikowski(2/17/2010) - Email received from Harvey Vershum stating that our campus does not have Co-Generation Plant - Ken Samoei
(2/23/2010) - Email sent to Steve Wise, regarding transportation emission data, no response yet. - Jon Lockie
(2/24/2010) @12:54pm - Sent Matthew Hemming another email checking up on his status of attaining agricultural data. He had previously emailed me saying he would have informations to me by 2/23/2010, and I have still not received anything from him. - Andrew Kulikowski
(2/25/2010) - Received another email from Matthew Hemming and requested a call from him during business hours and is planning to receive information hopefully on 3/1/10 - Andrew Kulikowski
21 | P a g e
(3/4/2010) - Spoke with Matthew Hemming and received partial agricultural data. Will soon go to his office in order to get the rest of the fertilizer data. - Andrew Kulikowski
(3/8/2010) - Called the University of Toledo's Department of Transportation, no response yet. - Jon Lockie
22 | P a g e