Embed Size (px)
Citation preview

SCMS JOURNAL OF INDIAN MANAGEMENTSCMS JOURNAL OF INDIAN MANAGEMENTSCMS JOURNAL OF INDIAN MANAGEMENTSCMS JOURNAL OF INDIAN MANAGEMENTSCMS JOURNAL OF INDIAN MANAGEMENTCon ten t s
Volume 3 January-March 2006 Number 1
Challenges of Managing and Prashant Salwan and 05-19Growing Brands Globally Jitin Munjal
A Conceptual Framework on Brand C.Anandan, M.Prasanna Mohan Raj 20-28Architecture in Indian Context and K.Ravichandran
Key Success Factors of Franchising Ilan Alon 29-36Systems in the Retailing Sector
Models for Attribute-Based Consumer José María Cubillo-Pinilla and 37-45Classification: Ar tificial Neural Networks Joaquin Sánchez-Herreraversus MLR and MDA
Corporate Performance Management: K.G.Sankaranarayanan and 46-52An Innovative Strategic Solution Babu P. Georgefor Global Competitiveness
Professionalizing Micro Finance Girish B. and Soju Annie George 53-61for Effective Regulation
Assessing the Service Quality of Banking K.Beegadhur, Sooraj Fowdar, and 62-72Technologies in Mauritius Rooma Roshnee Ramsaran-Fowdar
Efficiency of Public Sector Enterprises-A Case Susan Chirayath 73-87Study of C.C.L., Ranchi –An Empirical Study
Creative Approach to Decision-Making J.K.Sharma and B.B.Das 88-95
The Information-Driven Kristie J.Loescher 96-106Healthcare Organization
Failsafe Strategies Harish B. 107-107
The Next Global Stage V.Raman Nair 108-108
Title of the Ar Title of the Ar Title of the Ar Title of the Ar Title of the Article Aticle Aticle Aticle Aticle Author Puthor Puthor Puthor Puthor Page No.age No.age No.age No.age No.

2 SCMS Journal of Indian Management, January-March, 2006.
Published by School of Communication and Management Studies
With this issue, SCMS Journal of Indian Management SCMS Journal of Indian Management SCMS Journal of Indian Management SCMS Journal of Indian Management SCMS Journal of Indian Management has entered the third successful year
of publication. During the last two years we have introduced several changes to improve the
quality of the journal. Our efforts were always to give the very best to our readers. The overwhelming
response we get from our readers, by way of opinions, letters to the editor, contribution of articles,
requests for subscriptions etc, speaks volumes about the quality of our Journal.
The lead articles in this issue explore two of the hottest areas in marketing i.e., branding and
globalisation. These topics are of immense concern to practitioners as well as academics. How to
go global with a brand? How to make sure that the brand realizes its full potential as it stretches
across diverse societies and markets? These are key issues of interest to brand marketers. Perhaps,
one of the best ways to get a fresh perspective on these issues may be to look at the best
practices that successful global companies have adopted. The lead articles serve this purpose.
This issue of the journal contains ten selected research papers written by authors of repute. I trust
you will find it insightful and helpful to stimulate your thought process.
Dr .G.P .C .Dr .G.P .C .Dr .G.P .C .Dr .G.P .C .Dr .G.P .C .NAYARNAYARNAYARNAYARNAYARChairman, SCMS Group of Educational Inst i tut ionsChairman, SCMS Group of Educational Inst i tut ionsChairman, SCMS Group of Educational Inst i tut ionsChairman, SCMS Group of Educational Inst i tut ionsChairman, SCMS Group of Educational Inst i tut ions
T h eC h a i r m a nspeak s . . .

3 SCMS Journal of Indian Management, January-March, 2006.
Published by School of Communication and Management Studies
SCMS Journal of Indian Management
A Quarterly Publication of
SCMS
Editor-in-Chief : Dr.G.P.C.NayarChairmanSCMS Group of Educational Institutions
Editor : Dr.D.Radhakrishnan NairFormerly Director, Mahatma GandhiUniversity Research Centre
Editorial Advisory BoardDr.Subramanian Swamy : Formerly Professor, Harvard University, Cambridge, MA, US.
Formerly Professor of Economics, IIT, Delhi.Dr.V.Mukunda Das : Director, School of Communication and Management
Studies, Kochi. Formerly Professor, I IM-K, I IM-A andIRMA-Anand.
Prof.Radha Thevannoor : Director, SCMS School of Technology and Management,Kochi.
Dr.Thomas Steger : Professor of European Management, Chemnitz Universityof Technology, Chemnitz, US.
Dr.Kishore G.Kulkarni : Professor, Metropolitan State College of Denver andEditor - Indian Journal of Economics and Business, Denver,US.
Dr.Naoyuki Yoshino : Professor of Economics, Keio University, Tokyo, Japan.Dr.Mathew J.Manimala : Professor of Organizat ion Behaviour and Jamuna Raghavan
Chair Professor of Entrepreneurship at the Indian Inst i tuteof Management, Bangalore.
Dr.Tapan K.Panda : Professor of Marketing, Indian Institute of Management,Indore.
Dr.Azhar Kazmi : Professor, Depar tment of Bus iness Administ rat ion,International Islamic University Malaysia, Kuala Lumpur,Malaysia.
Dr.Jose Maria Cubillo-Pinilla : P r o f e s s o r, I n t e r n a t i o n a l M a r ke t i n g , Po l y t e c h n i cUnivers i ty of Madr id, Spain.
Dr.I.M.Pandey : Professor of Finance and Accounting at the Indian Instituteof Management , Ahmedabad .
Dr.George Sleeba : Chief General Manager (Marketing), The Fer tilisers andChemicals Travancore L td. , (FACT) Udyogamandal ,Kochi, Kerala.
Mr.Jiji Thomson IAS : Principal Secretary to Government of Kerala.

4 SCMS Journal of Indian Management, January-March, 2006.
Published by School of Communication and Management Studies
EditorialEditorialEditorialEditorialEditorial
Editorial Assistance
Assistant Editor: Dr.Rejie George Pallathitta Editorial Assistant: Mr.E.V.Johnson
You have to accept the fact that man is not simply Homo sapiensHomo sapiensHomo sapiensHomo sapiensHomo sapiens; he’s HomoHomoHomoHomoHomosymbolificus symbolificus symbolificus symbolificus symbolificus - he’s someone who makes symbols (Walker Percy 1916-1990).
The student puzzles over a project proposal.The writer labours over a monograph.The researcher records the findings in a paper.The journalist finishes an investigative report.The executive outlines a business proposal.The novelist narrates a touching story.The poet captures a fleeting feeling.The diarist jots down the day’s events.
However, their tasks vary.But each of them accepts a challenge.They create coherent ideas in their private worlds of thought.Each of them maps those ideas into the public worlds of linguistic symbols.In composing them, these individuals create meaning for themselves.And at once they create meaning for their readers.They engage in a special form of thinking.This is making of meaning.Thus they may well define one of the most unique characteristics of our species.We are Homo symbolificus.Homo symbolificus.Homo symbolificus.Homo symbolificus.Homo symbolificus.Creative people come in all shapes and sizes, all colours and ages, and all sorts ofpersonality types: introverts and extroverts, maniacs and depressives, schizophrenicsand hysterics, sociopath and good citizen. It is not the personality type that makesthe difference, but the self. To the self, I ascribe motivation and style, the choice ofmeaning, and the making of meaning in work, career, and life course. This is the reasonwhy our management journal strives at getting perfection through articles from allover the globe. We wish and hope to get many articles in the field of management fromgreater selves to our journal to make it greater.
Dr.D.Radhakr i shnan Nai r
© SCMS Journal of Indian Management, SCMS New Campus, Prathap Nagar, Muttom, Aluva-683 106, Kochi, Kerala, IndiaPh: 91-484-262 3803 / 262 3804 / 262 3885 / 262 3887 Fax: 91-484-262 3855, Website: www.scmsgroup.orgE-mail: [email protected] / [email protected] / [email protected]
All rights reserved. No part of this publication may be reproduced in any form without the written consent of the publisher. Schoolof Communication and Management Studies and SCMS Journal of Indian Management assume no responsibility for the viewsexpressed or information furnished by the authors. Edited and published by the Editor for and on behalf of SCMS and printed atMaptho Printings, Cochin-683104.

5 SCMS Journal of Indian Management, January-March, 2006.
Published by School of Communication and Management Studies
Prashant Salwan and Jitin Munjal
Dr.Prashant Salwan, Professor, International Business
Marketing, Indian Institute of Management Indore,
Pigdambar Rau, Indore, MP 453 331 Email: [email protected]
Mr.Jitin Munjal, British Chevening Scholar, London School
of Economics and Political Science, U.K.
Importance of Brands in today ’s world …
hi le brands have a lways been impor tant for ac o m p a n y , s i n c e t h e yhelp sell the companies
products i n a more pro f i t ab lemanner, the trend in the marketingwor ld i s now unmis takab le…inthe West brand valuat ion becamecr i t ica l for st rategic managementa l o n g t i m e a g o . A s p e r J a nL i n d e m a n n , G l o b a l M a n a g i n gD i rec to r fo r B r and Va lua t ion -Interbrand, “Brands are one of acompany ’ s impor tan t a s se t s…a n d t h e y h a v e c r e a t e ds h a r e h o l d e r v a l u e s i n c e t h ec r e a t i o n o f s t o c k m a r k e t s . ”Technical ly, Brand value accounts
for 38 per cent of the global stock market valuation!
As one can see, whi le on an average, brands accountfor 38 per cent of a company ’sva luat ion, for companies such asC o c a C o l a , M c D o n a l d s a n dD i s n e y , t h e y a c c o u n t f o r 5 9per cen t , 64 per cen t and 61p e r c e n t , o f t h e c o m p a n y ’ sva l ua t ion – subs t an t i a l l y mo rethan the va lue of phys ica l assetsowned by these companies! Justas an interest ing compar ison, theva l ue o f t he wor ld ’ s top twobrands is more than the fore ignexchange reserves of India !
The Interbrand l ist again indicatest h e d o m i n a n c e o f U . S . b r a n d
Challenges of Managing andGrowing Brands Globally
W
Technically, Brand value accounts for 38 per cent of the global stock market valuation. While brands are amongstthe most stable assets of a company and can increase value in difficult market conditions, brands can lose theirvalue if not managed well. Companies are increasingly expanding the geographic scope of their operations,setting up or acquiring companies in other countries, or entering into alliances across national boundaries. As aresult, firms need to pay greater attention to coordinating and integrating their marketing strategy across markets.Rich with experiences from his visits to Samsung, Tetley, Procter and Gamble, Unilever and Coca Cola Internationalin UK and their subsidiaries in Asia, the author has studied the processes followed by them and the best businesspractices required to meet the challenges of making, growing and consolidating the brands globally.

6 SCMS Journal of Indian Management, January-March, 2006.
Published by School of Communication and Management Studies
As per interband, the top 15 brands globally (and their valuation) are:
Brand’s Share ofCompany ValueSl.No. Brand Value
1. Coca-Cola $83.9 billion 59%
2. Microsoft $56.7 billion 21%
3. IBM $43.8 billion 28%
4. General Electric $33.5 billion 10%
5. Ford $33.2 billion 58%
6. Disney $32.3 billion 61%
7. Intel $30.0 billion 21%
8. McDonald’s $26.2 billion 64%
9. AT&T $24.2 billion 24%
10. Marlboro $21.1 billion 19%
11. Nokia $20.7 billion 44%
12. Mercedes $17.8 billion 37%
13. Nescafé $17.6 billion 23%
14. Hewlett-Packard $17.1 billion 31%
15. Gillette $15.8 Billion 37%
names – wi th a l l the top ten brands being f rom theUni ted States.
Value of brands can vary substantially, year to year…
Interestingly, the valuation of brands can vary substantially fromone year to another, thus making the task of managing brandsglobally a tricky task. While brands are amongst the most stableassets of a company and can increase value in difficult marketconditions, brands can lose their value if not managed well.
Last year Coca Cola, Microsoft and IBM retained the top threepositions. However Ericsson was, the biggest value loser in theTop 100 as it went down by down 49 per cent to $3.59 billionand 71st spot. The brand that has gained the most in valuationhas been Samsung, which saw a 30 per cent gain, resulting in itsvalue being lifted from $6.37 billion to $8.31 billion - by far thebiggest jump among the top 100 brands.
Very few Asian Brands in the top 100 …
Samsung is one of just seven Asian brands in the list. The othersix predictably are Japanese, headed by automaker Toyota, with
a brand value of $19.45 billion. Honda is next with a value of$15.1 billion, followed by consumer electronics giant Sony atNo. 21 and $13.9 billion. Nintendo at No. 32 ($9.22 billion),Canon at No. 43 ($6.7 billion) and Panasonic at No.81 ($31.4billion) make up the remainder of the Asian brands.
Globalisation and Criticality of Global Brands
Large markets in the Developing Countries …
With increasing globalisation – in all arenas, such as politics,economics, finance etc., the world is turning into a global consumermarketplace. The growth rates of the economies of the developedcountries have slowed down considerably, while that of developingcountries (specially the BRIC economies) is growing much faster.Hence, the markets of the developing countries are becoming moreand more lucrative, not only from the volume point of view, but alsofrom the value point of view (with the per capita income also growingmore rapidly than in developed countries). The media andcommunications explosion, awareness about products and brandsavailable in developed countries is growing, and a latent demand forthese very goods is emerging in these countries.
Source: Interbrand study, 2000
7 SCMS Journal of Indian Management, January-March, 2006.
Published by School of Communication and Management Studies
Increase in Global Expansion of Brands …
With the globalisation of markets and the growth of competitionon a global scale, companies are increasingly expanding thegeographic scope of their operations, setting up or acquiringcompanies in other countries, or entering into alliances acrossnational boundaries. At the same time, with the spread ofglobal and regional media, the development of internationalreta i l ing , and the movement of people, goods, andorganizations across national borders, markets are becomingmore integrated. As a result, firms need to pay greater attentionto coordinating and integrating their marketing strategy acrossmarkets.
Making Management of Global Brands Critical …
An important element of a firm’s international marketing strategyis its branding policy. Strong brands help to establish the firm’sidentity in the market place, and develop a solid customerfranchise (Aaker 1996, Keller 1998, Kapferer 1997) as well asproviding a weapon to counter growing retailer power (Barwiseand Robertson 1992). They can also provide the basis for brandextensions, which further strengthen the firm’s position andenhance value (Aaker and Keller 1990). In international markets,an important issue for the companies is whether to use thesame brand name in different countries, leveraging brand strengthacross boundaries, or whether to maintain local brandsresponding to local customer preferences. A related issue iswhat level of branding to emphasize, i.e. corporate/house orproduct-level brands or some combination of both.
The central role of branding in defining the firm’s identity andits position in international markets means that it is critical todevelop explicit international brand architecture. This impliesidentifying the different levels of branding within the company,the number of brands at each level as well as their geographicand product market scope. The most critical element in thisstructure is the number of levels, i.e. corporate, house/productbusiness and product and how these are used in conjunctionwith each other. Related to the development of this architecture,is the question of how to manage brands that span differentgeographic markets and product lines. Who should havecustody of international brands, and be responsible forcoordinating their positioning in different national or regionalmarkets, as well as making decisions about use of a givenbrand name on other products or services?
In such times, establishing global brands and managing themglobally becomes critical to success and profitability of acompany. The challenges can be manifold, and these arediscussed in the next section.
2.0 Challenges in Managing Brands Globally
Various Kinds of Challenges Faced in Managing a Brand Globally …
At the core lies the challenge of making the global brand relevantto the local market, while still maintaining the same positioningthat it enjoys globally. Since the market conditions, the consumerpreferences, the competitive situation is different in every market,this can be a very daunting task.
Some of the aspects influencing these issues are detailed in thissection.
Older brands vs newer brands
One of the issues faced by Global brands is a situation whereinthe brand has a very old heritage, which has been in existencefor many years, and has developed as per the requirements ofthe particular local market. Over a period of time, this may havedeveloped in a direction very different from the positioning ofthe brand globally. At this point, to try and move the positioningto be in alignment with the global positioning, can lead to amassive loss in consumer franchise. Such problems are beingfaced by companies such as Unilever, Nestle etc., which havevery old brands, which had grown, outside of the domesticmarkets several decades back.
On the other hand, in case the brand does not exist in the localmarket and is making an entry, the task is marginally simpler, asthe global positioning can be used to launch the brand in thelocal market. In this case the challenge lies in ensuring that theglobal positioning is presented in a manner that is relevant to thelocal conditions. Such are the challenges being faced bycompanies such as Samsung, Tetley and LG etc.
Domestic base vs Export Orientation
Traditionally, the reason for expanding to international marketshas been the lack of fur ther opportunities in the domesticmarket. Thus, companies after becoming leaders in theirrespective domestic markets, find future growth more easilyfeasible by expanding into other countries. Traditionally, thedeveloped economies have had a larger market size, and if a

8 SCMS Journal of Indian Management, January-March, 2006.
Published by School of Communication and Management Studies
company had a dominant market share in the domestic (anddeveloped economy) market, it has access to large volumesof steady cash f lows that could be used to fund theexpansion overseas. This has been the route followed bymany large MNCs such as P&G, Coca Cola etc. Thesecompanies had “deep pockets” which they could rely onwhen competing with the established players in the newinternational markets.
Additionally, since the consumers in the developed countrieswere more demanding, these companies had already developedtechnologies / products that were quite sophisticated. Hencethey had the advantage of superior technology, when goinginto the developing countries.
Contrasted with that are companies such as Samsung, TCS, Haier,Infosys, who derive bulk of their sales from international markets.While they had a leading share in the domestic market, the sizeof the market (being in the developing world) was much smaller,and hence the availability of cash flows to expand internationallywas lesser in comparison. It then became critical for thesecompanies to decide how best to compete with the moreestablished players in the markets they expand into. Not onlydo they need to be smarter in the way they spend the limitedmonies they have, they also need to invest in R&D to makeproducts that meet the exacting standards of the consumers inthe developed countries. Hence the limited cash flows furtherget split between the two areas – investing in R&D and investingin marketing.
This slows down the pace at which these companies can expandinternationally … it is only in the past decade or so that easieraccess to global capital at affordable rates have helped thecause of such companies.
Monies Commitment for Developing a Brand
If one were to look at the quantum of monies needed to sustaina brand in a market, the comparison between the moniesrequired for developed and developing countries is substantiallydifferent. Just as an indicative example, it is possible for acompany to dominate the media and consumer landscape formarketing purposes for a cost of £4m / annum in a country thesize of India, whereas to achieve the same dominance in amuch smaller country like UK, would require expenses to thetune of £10-15 m / annum (as per estimates from executives inMNCs).
Criticality of Local Knowledge
Since the consumer habits, practices and needs can vary acrosscountries… and even if these are somewhat or very similar, thecultural context in which the consumers operate, may bedifferent. Hence an in-depth understanding of the local marketconditions, consumer preferences, media habits, distributionmechanics, competitive landscape, legal standards etc. are keyto development of the global brand in the local market.
Today, while market research can help understand these aspects,the company needs to be in a position to use this data effectively.In many cases, due to the centralized nature of managing globalbrands, these local cultural nuances may not get addressed bythe global brand’s marketing / advertising campaign. And thiscan lead to sub-optimal results when the marketing mix isimplemented.
Speed of Response to change in Market Conditions
The speed at which a company responds to changes in thecompetitive marketplace or to changing consumer preferencescan impact the success it achieves in the marketplace. Dependingon the degree of centralization with which the operations of thecompany are organized, the speed with which it responds inthe market can vary dramatically, e.g., though P&G gives fairdegree of autonomy to the local country team, any significantmarketplace intervention needs to be approved from the regionalheadquar ters. As compared to P&G, Unilever has a moredecentralized approach to managing local markets, and is thusseen to be faster in responding to changes in the marketplace.
This becomes critical specially in today’s scenario, wheremanufacturing of goods in developing countries offers significanteconomic advantages, and companies need to be able toco-ordinate between production, R&D, design and Marketingmanagers, who are often located in different geographiclocations. It then becomes the key task of the organization toensure that physical distance does not become a reason forslow speed of response to consumers. Alternately, if that cannotbe managed, then companies need to be willing to let go ofsome of the cost advantages and have various departments inthe same location, even though it is not cost optimal.
Developing Countries – Size of Market vs Size of Branded Market
Another aspect of critical impor tance is accurate estimationof the size of the market. Often companies make errors when

9 SCMS Journal of Indian Management, January-March, 2006.
Published by School of Communication and Management Studies
estimating the size of the market in developing countries, asthey overestimate the pace at which consumers can be madeto shift from buying commodities to buying branded goods.This is often based on companies’ previous experience ofselling in more advanced economies, where branded goodsare substantially more accepted.
This often leads to unrealistically high expectations from thelocal market and results in “underperformance” and pulling out /reducing investments in the new country.
Developing Countries – Basic Business Model and Impact on Cost
Consumers in developing countries are very often lessdemanding and discerning as compared to consumers in thedeveloped countries (though at the premium end of the market,the differences are becoming lesser and lesser, irrespective ofwhether the consumer are in developing or developedcountries). Due to this, several local brands are able to meettheir needs through low cost products, more fluctuations inquality and with little marketing expenses. Larger companies,who are more used to working with large marketing expenses,and stringent quality controls often get priced out of the market.
In such cases, the companies need to be able to adopt localpractices to compete effectively in the marketplace. This isperhaps best highlighted by the success of “Wheel” in India,which effectively took on the local champion “Nirma” in thewashing powders category. At the same time, P&G tried todevelop a detergent “Ariel Supersoaker” which was more highlypriced as they cost structures were in line with global “bestpractices” and not “local realities.” Needles to say, the brandfizzled out very soon.
Quality of Products vs Power of Branding
Interestingly, there is a substantial difference in cultural mindsetbetween the East and the West, in terms of understanding theimportance of branding in selling to the consumers. While mostcompanies in the West realize that good quality is a necessary,but not sufficient condition for selling and that good branding isvery critical in ensuring that the consumer comes and asks forthe product (commonly referred to as the “pull” strategy inmarketing), the same is not shared by many companies in theEast. It is for this reason that several companies in the electronicsgood arena, such as Panasonic, Hitachi etc have not been ableto make significant inroads in the Western markets. While theirproducts are technically superb, due to weak branding, the
consumers do not perceive them to be good buys. The strongexception to this mindset has been SONY, which realized thecriticality of branding very early and have made significantinvestments in building the brand globally. Of late, companiessuch as Samsung have also been investing heavily in buildingthe brand globally.
Awareness, brands and power brands
Many companies fall into the trap of confusing awareness withbrand recall, and brand recall with brand strength. This becomesparticularly tempting when one is operating in another countryand is keen to get a “quick return” on brand investment, speciallywhen the domestic company does not have “deep pockets”(we have already seen the substantial amount of monies neededto sustain a brand).
While all marketers know that moving on the path of awarenessto creation of a brand to creation of a power brand requireddecades, and not just years, they may be having a power brandstatus in their domestic market [achieved over several decades],and hence assume that once they launch the brand in a newmarket, it will automatically acquire the status of a power brand[“…why shouldn’t it? It’s a power brand back home …”].
Similarly, companies may be lured into thinking that the market isjust “waiting” for their brand, and hence companies can findthemselves getting frustrated at the “slow progress” being madeby the brand in new markets. Product availability is of course justone of the several things that need to fall into place beforeachieving market success (presenting the brand in theappropriate local context, with modifications in the product tomake it suitable for the local market etc. would be among theother critical ones) … however success in the domestic marketcan make the companies myopic in their view on the pace atwhich a brand will become a success in a new market.
Examples of this can be seen from India, where Coca Colaachieved success only in the last two-three years, once theyincorporated strong local idioms into their brand communicationstrategy, rather than following “sterile” globally acceptedcommunication platforms. McDonalds on the other hand suitablymodified their products for the Indian palate and hence “tasted”success much sooner. Each of these brands has achieved a“Power Brand” status only after being in the market for close toa decade, and have had to spend substantial monies to reachthis position.
10 SCMS Journal of Indian Management, January-March, 2006.
Published by School of Communication and Management Studies
The points discussed are by no means the only challenges facinga company trying to grow / manage a brand internationally, butprovide enough of a flavour of the complexity of managing abrand globally.
In the next section we will take a look at the processes followedby a few global companies in their quest for global expansionof their brands.
3.0 Processes Followed by a few Global Brands
Let us now look at examples of two Asian brands (Samsung,Haier) that have tried to make an impact on the global arena andthen look at how one Western company (Unilever) manages itsbrands globally.
Samsung
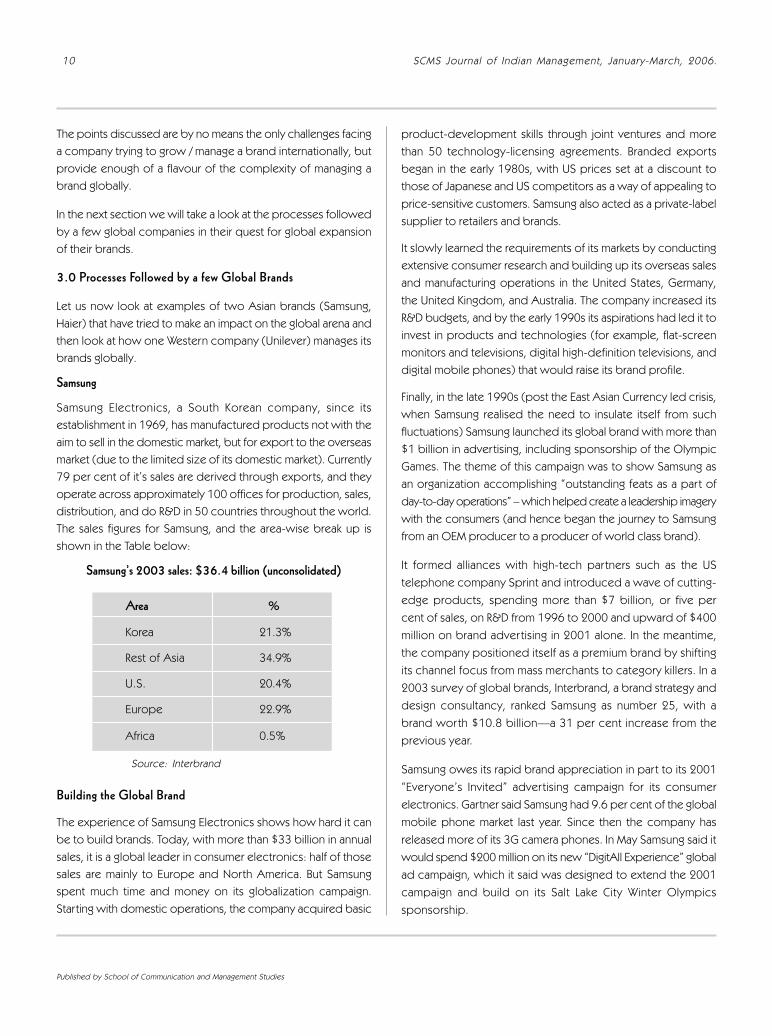
Samsung Electronics, a South Korean company, since itsestablishment in 1969, has manufactured products not with theaim to sell in the domestic market, but for export to the overseasmarket (due to the limited size of its domestic market). Currently79 per cent of it’s sales are derived through exports, and theyoperate across approximately 100 offices for production, sales,distribution, and do R&D in 50 countries throughout the world.The sales figures for Samsung, and the area-wise break up isshown in the Table below:
Samsung’s 2003 sales: $36.4 billion (unconsolidated)
product-development skills through joint ventures and morethan 50 technology-licensing agreements. Branded exportsbegan in the early 1980s, with US prices set at a discount tothose of Japanese and US competitors as a way of appealing toprice-sensitive customers. Samsung also acted as a private-labelsupplier to retailers and brands.
It slowly learned the requirements of its markets by conductingextensive consumer research and building up its overseas salesand manufacturing operations in the United States, Germany,the United Kingdom, and Australia. The company increased itsR&D budgets, and by the early 1990s its aspirations had led it toinvest in products and technologies (for example, flat-screenmonitors and televisions, digital high-definition televisions, anddigital mobile phones) that would raise its brand profile.
Finally, in the late 1990s (post the East Asian Currency led crisis,when Samsung realised the need to insulate itself from suchfluctuations) Samsung launched its global brand with more than$1 billion in advertising, including sponsorship of the OlympicGames. The theme of this campaign was to show Samsung asan organization accomplishing “outstanding feats as a part ofday-to-day operations” – which helped create a leadership imagerywith the consumers (and hence began the journey to Samsungfrom an OEM producer to a producer of world class brand).
It formed alliances with high-tech partners such as the UStelephone company Sprint and introduced a wave of cutting-edge products, spending more than $7 billion, or five percent of sales, on R&D from 1996 to 2000 and upward of $400million on brand adver tising in 2001 alone. In the meantime,the company positioned itself as a premium brand by shiftingits channel focus from mass merchants to category killers. In a2003 survey of global brands, Interbrand, a brand strategy anddesign consultancy, ranked Samsung as number 25, with abrand wor th $10.8 billion—a 31 per cent increase from theprevious year.
Samsung owes its rapid brand appreciation in part to its 2001“Everyone’s Invited” advertising campaign for its consumerelectronics. Gartner said Samsung had 9.6 per cent of the globalmobile phone market last year. Since then the company hasreleased more of its 3G camera phones. In May Samsung said itwould spend $200 million on its new “DigitAll Experience” globalad campaign, which it said was designed to extend the 2001campaign and build on its Salt Lake City Winter Olympicssponsorship.
Area %
Korea 21.3%
Rest of Asia 34.9%
U.S. 20.4%
Europe 22.9%
Africa 0.5%
Source: Interbrand
Building the Global Brand
The experience of Samsung Electronics shows how hard it canbe to build brands. Today, with more than $33 billion in annualsales, it is a global leader in consumer electronics: half of thosesales are mainly to Europe and North America. But Samsungspent much time and money on its globalization campaign.Starting with domestic operations, the company acquired basic

11 SCMS Journal of Indian Management, January-March, 2006.
Published by School of Communication and Management Studies
Samsung also got a boost from the World Cup soccertournament co-hosted by Korea and Japan during June. Salesof its plasma screens and flat-screen television sets jumpedduring the hugely popular tournament.
This year, the advertisement account has been shifted to WPP,and the size of the account is estimate to be in excess of$ 600m – quite an increase in the last seven years.
Global Branding
The Samsung Electronics brand needed to be managed in aunified manner and maintained consistently for the mid-to-long-term. The company produces and sells a variety of productsthat must be unified under the premium-brand positioning thatthey are seeking. Prior to Samsung’s decision to manage thebrand image through a central organization, many of themarketing activities were localized to the region. However, thiswas found to be leading to a dilution of the brand and amisconception of the corporate identity.
Hence all large sized branding activity was centralized out ofKorea (such as the “DigitAll Experience,” Olympics Sponsorship,“Matrix–the movie” sponsorship) and only the smaller, countryspecific branding activity was decentralized, that to after layingdown the boundaries within which the branding needs tooperate.
An additional way to keep improving on the premium imageryof the brand is to focus on at least five-six “Hero Products” inthe year, which are necessarily cutting edge products, whichcan lend premium sheen to the brand. An example would bethe launch of the 80 inch plasma TV – the largest in the world.While some of the Hero Products will not have a substantialmarket (like the above mentioned 80 inch plasma TV), they wouldserve the cause of enhancing the premium imagery for the brand.
There is substantial cross-fer tilization of ideas through regular“Global Seminars / Meetings” where the pros and cons ofmarketing ideas are debated at length.
Managing Globally
According to the executives at Samsung, the key to monitoringthe progress of the entire company is in setting the rightincentives, controls, and standardized processes in thecorporate environment. At Samsung each division is empoweredthrough a system cal led the Global Business Manager.
Implemented several years ago, this system places responsibilityon the division head for the profits generated. At the same time,the head is given the flexibility to make prudent decisions, whichare crucial for the division’s advancement.
However, this centralised approach has some drawbacks, specificallyrelating to how relevant the brand is seen to be in local markets.Samsung advertising was centralized with an American advertisingagency for the past five years and creative were made in New Yorkand then post some tweaking at the local level, they were telecastacross the globe … while this may have had some success in thedeveloped countries, there was a basic problem of the creativelacking cultural empathy with consumers in the developing countries[unlike the protagonists shown in the advertisements, there are nottoo many blonds in developing countries!].
It is now when the brand has developed a common theme acrossseveral countries that Samsung is in the process of making theadvertising for the brand more de-centralized. Thus, India, whichhas been identified as a focus area is likely to get the responsibility ofmaking advertisements specifically for the local markets. Of course,all of this will be guided by a detailed Brand Manual, which willensure that the basic equity of the brand remains consistent acrosscountries, while the local renditions can be made as per local culturalrequirements.
Haier
Haier, a Chinese white goods manufacturer, has factories andoff ices in more than 100 countr ies, a $15m Americanheadquarters in mid-town Manhattan, and a cult following amongAmerican college students who chill their beer in its mini-fridges,sold at Wal-Mart. And Haier is gearing up to become even moreglobal - of the $8 bn / annum sales, about $1 bn sales areachieved from overseas markets.
Market Leader in China, looking for growth beyond China …
Domestically, by 1991 it was a market leader in China, and thecompany had expanded beyond fridges into a range of whitegoods by taking over other moribund state enterprises. TodayHaier ’s factory sheds cover more than a square kilometre ofQingdao. Haier is the leading seller in China of most homeappliances, with market shares of 20-70 per cent. However,Haier ’s Chairman, Mr.Zhang admits that plunging returns in hiscore white goods business domestically, are driving him abroad.After China joined the World Trade Organisation, he said, “every

12 SCMS Journal of Indian Management, January-March, 2006.
Published by School of Communication and Management Studies
multinational set up in China. Margins are low here. If we don’tgo outside, we cannot survive.”
Driven by the Lure of Better Profits …
Higher prices for branded goods translate into huge profits.For household appliances, the US profit pool is wor th morethan $2 billion, nine times the profit pool of China and 100times that of Brazil. For consumer electronics, it is wor thmore than $1 billion, ten times more than China’s and 20times Brazil’s. Moreover, developed countries offer a widerrange of sizable segments to target. The US market forp ro jec t ion te lev i s ions ( sc reens o f 45 i nches—115centimeters—and up) is wor th more than all of the videoproducts sold in India, while the $400 million wor th ofcompact refrigerators sold in the United States in 2000amounted to twice the total value of all refrigerators sold inSouth Africa or Poland.
It has had some success in the global market, with overseassales of approx. $1 billion - Haier claims 30 per cent of themarket for small fridges and half the market for wine coolers inAmerica, and a tenth of Europe’s air-conditioner market. Haieris now the world’s fourth-largest white-goods maker behindWhirlpool, Electrolux and Bosch-Siemens and ahead of GE—though that is mostly owing to its big domestic productionvolumes. The company wants to improve this position to numberthree.
The Strategy is driven towards Building the Brand …
The strategy that it is using in the U.S. is to build up consumerawareness. And they are attempting to make consumers feel thatHaier meets their needs significantly better than competition. Sotheir strategy has focused on developing innovative products. Forexample, they chose the dormitory refrigerator (used by students)not because the product was cheap, but because they felt theirdormitory refrigerators could satisfy the needs of American collegestudents better than competition. So they designed this product forthat group of consumers - the design was innovative and differentfrom what was offered by the competitors (e.g. they added a foldableflap that could be used to place laptop computers, which are ownedby most college students in America – hence, attention to suchsmall details made the difference!) resulting in them having beenable to outsell similar products made by competition (which fell intothe trap of considering this as being too small a niche to cater tospecifically with product innovations).
From the Lower End to the Higher End of the Products …
Now they are moving into higher-end refrigerators - so one can saythat they have first focused on the low end, and now will move intothe medium end and later on into the higher end.
But the college dorm and oenophile markets will take Haier only sofar. To reach his goal of $1 billion sales in the USA by 2005 (currentsales are $300m), the local manager says, “we need core productsto attain mass retail presence.” That means mainstream items like airconditioners and washing machines especially, family-sizedrefrigerators, the product with which Haier got its start. But whileAsian brand names have become common on everything fromtelevisions to cars, the major-appliance market in the U.S. is stilldominated by Whirlpool, General Electric, and Maytag. The biggestforeign player is Sweden’s Electrolux, which got into U.S. kitchensby buying Frigidaire. The four companies together make 98 per centof the nine million standard refrigerators sold in the U.S. each year.Haier’s goal: ten per cent of that market by 2005. “Given what we’vedone in other categories,” he says, “I don’t see why we can’t achievethat.”
But are the Resources and Focus in Place? …
But size does not automatically mean quality; just as buyingname recognition at any price (that $ 15m Manhattan HQ) doesnot equal careful brand building. Haier ’s drive into marketsabroad mirrors a push into new markets at home. In both,diversification is driven by opportunism and not good strategy.Predicting that profits in 2004 will be flat at two billion yuan for athird successive year, despite an expected 20-30 per cent risein sales, outside China, Haier has so far concentrated on nicheproducts like — mini-fridges (to which it adds a handyfold-down flap for a laptop) and wine coolers. But to continueto grow globally it will have to compete with the likes ofWhirlpool in their main markets. Yet Haier lacks such firm’s R&D,design skills, research strength (it employs just ten researchersin America). In addition, their distribution and their servicenetworks also has poor backing. Mr.Zhang (Chairman of Haier)says his biggest problem is hiring decent managers, since hecannot pay as well as rivals. Haier does not have establishedbrands—or the money to build one.
Nor is Haier being careful to keep costs low. Mr.Zhang insiststhat Haier must produce outside China to be responsive tocustomers. Yet, with that strategy, that deprives Haier of itsgreatest advantage: China’s vast pool of low-cost labour.

13 SCMS Journal of Indian Management, January-March, 2006.
Published by School of Communication and Management Studies
Meanwhile, Haier’s attempt to reward creativity—allowing everyengineer the freedom to design and build his own productshas worked very well, leaving it with a bewildering 96 categoriesof goods in 15,100 specifications, including a fridge that picklesKorean kimchee cabbage and a washing machine that also cleanssweet potatoes! Most of these variants add more to productioncosts and complexity than they will ever add to sales. Worse,the group has moved beyond white goods into computers,mobile phones (where sales have been disappointing), andeven interior design and pharmaceuticals. All with unlimitedpotential, insists Mr.Zhang. “This is a globalised era. No singleindustry can survive. There is a great future in these markets.”
Tackling the tough Developed Markets First …
Haier ’s development strategy is to explore the difficult marketsfirst and then go into the easier markets. So the first efforts are toexplore the European and American markets rather than thedeveloping countries. While they realize that it is very hard to godirectly to developed markets and fight face-to-face with moreadvanced competitors, the stated objective is not just to earnhard currency but also to build up the company’s brandawareness and recognition. And in order to enter developedcountries, products have to pass through a very stringentcertification process. Usually this process takes almost one year.And once they enter the market, often people will feel thatproducts from China are just cheap junk. So in order to sell it’sgoods at a decent price, they have to regularly improve on theirquality. While this puts pressure on Haier, it also helps them toimprove and build up their brand reputation in the home country.
Retail Partnerships…Based on Meeting their NeedsBetter than Competition
On the retail front, they already have relationships with the topten largest chain stores. But instead of only managing relationswith the retailers, they are focussing on what they feel issomething which is much more important – to help the retailersmake more monies. Instead of just building good relations, theyintend to help the retailers identify who are their target consumergroups and then design products specifically for them.
Different chain stores have different consumers - some of themtarget a lower-end consumer — one example of that isWal-Mart. Others target a higher-end consumer like Sears. Sothey intend to help retailers by developing products that meettheir specific needs. This is not something that is likely to belucrative for the large white goods brands in the US, and will
thus be an extension of the “niche market exploitation” and“product differentiation” strategy, which has worked well forthem till now.
The Path ahead …
Haier also realizes the importance of having a powerful brand inthe U.S. market, there are many mature brand names such asMaytag, Whirlpool, and G.E, and Haier realizes that people feelthat those are the most trusted brand names. It is also the samein the European market - there it is Bosch and Siemens that aremost trusted. Most of these brand names have been in existencefor more than 100 years, but Haier has a history of only ten-plusyears. In addition it has only been a few years since Haier firstmoved into these overseas markets, hence Haier ’s focus on the“niche market exploitation” and “product differentiation strategy.”
As stated by Mr.Zhang “Also key to strengthening Haier ’s brandname is our speed and our ability to differentiate ourselves fromour competitors. While other companies may also recognize aconsumer ’s needs, they may not be able to conver t thisknowledge into real products in a timely enough fashion. AtHaier, we can convert ideas into products in a very short time.This is especially after our recent business-process reengineering.Secondly, our products must not appear similar to any othercompany’s products. We must develop products that clearlydifferentiate us from all of our competitors.”
In 2000, Haier became the first Chinese company to open amajor manufacturing facility in the U.S. Last year its first productswent on sale. And this year the $40 million factory expects toturn out 200,000 family-sized refrigerators. If it seems odd for aChinese company to open a factory in the U.S.— since thetraffic is typically in the other direction, since labour costs are somuch lower in China—Haier has its reasons. First, it is expensiveto ship big, hollow refrigerators from China. Second, Haier likesdesign and production to be close to its markets. (The grouphas eight design centers and 13 factories outside China). A U.S.factory also allows Haier to stick a made in the U.S.A. label onits products and is a sign to retailers that the company is inAmerica to stay. As for Chinese workers, there aren’t many -out of 220 employees, only factory president Zhang Zinmin, asmall support staff, and about half a dozen engineers are Chinese.
Just as the Camden facility represents Haier ’s determination tofit into the American market, the company’s sales headquartersin Manhattan represents another attempt to put down roots.
14 SCMS Journal of Indian Management, January-March, 2006.
Published by School of Communication and Management Studies
Haier spent $15 million to buy the former Greenwich Bankbuilding, a 1924 landmark that embodies solidity. In addition tooffices and research labs, the company plans to put a showroomand a restaurant in the former banking hall. Haier likes to seeitself as different. “We can’t just do me-too products,” saysJemal, the local manager. “The competition is much moreestablished, with great brands and distribution, so if we’re likethem, we’ll be crushed.” The fridges from Camden, for example,are your basic white boxes. But the company points to distinctivefeatures like see-through vegetable crispers and door shelvesthat hold gallon jugs - small things, but Haier hopes thesetouches wil l help to distinguish the refrigerators in theentry-level market segments they’re in.
As it ventures out of niches into the mass market, Haier is startingto do consumer advertising. Previously most of its ads werelimited to brand promotion on billboards and airport luggagetrolleys. Now it wants to reach shoppers directly, so that someday people will no longer wonder, “Haier who?” But thecompany’s first effor t, an ad in the September issue of GoodHousekeeping for the Access P lus f reezer, looksold-fashioned—a brand-building effor t equivalent to abasic white box.
American appliance makers are aware of what Haier plans.“Itake it very seriously,” says GE Appliances chief executive
Jim Campbell. Not that he feels threatened. GE has unrivalledbrand recognition, a vast range of products, and a nationwideservice network. Haier has one small factory and a dream.
Nonetheless, Haier ’s bid to take a chunk of the Americanmarket is a serious one. “Over five years,” says analyst NicholasHeymann of Prudential Securities, “it could become a force.”With good-quality products and low prices - a Haier 14-cubic-foot unit costs $370, about $50 less than a Whirlpool - it is notfanciful that Haier could break into America the way Sony did inthe 1950s or Samsung did in the 1980s. In one important way,Haier has an advantage over the earlier Asian pioneers. MarshallMeyer, of the Wharton School of Business, notes that givenChina’s vast geography, disparate markets, and multiplicity ofnational and local authorities, Haier has dealt with many of theproblems of globalisation without leaving home.
“Haier has meticulous planning like a Japanese company andexecution like GE,” says Camden general manager Guberski.“And when these guys decide to do something, boy, do theyact fast.”
Other Chinese Companies
Background
Many companies in China have shown quite convincingly thatthey can manufacture competitively priced, high-qualityproducts.
In fact, Chinese companies have shown convincingly that theycan produce competitively priced, high-quality goods. Galanz,for instance, makes microwave ovens on an OEM basis for almostall of the world’s leading consumer electronics companies. Swansupplies General Electric with dishwashers. And ChanghongElectric supplied Wal-Mart Stores with televisions sold under anunrelated brand, Apex Digital, in a giant one-day promotion in2002.
The Chinese companies most likely to succeed in establishingbrands in overseas markets are those that have a track record inlow-cost, high-quality manufacturing and show marketingprowess on the local level. In general, Chinese manufacturershave relied on a fully integrated model in the domestic market.They star t off using foreign technology and then try to developtheir own technology and products. Most of these companiesare heavi ly asset-based and have large manufactur ingorganizations, and almost all have their own distribution networksand large, cheap sales forces. Replicating this model withtraditional products in developed markets would be prohibitivelyexpensive, time-consuming, or beyond the skills of management.Only a few Chinese companies, such as Haier, have built factoriesin the United States; Haier ’s leaders believe that the addedexpense of producing goods there will be outweighed by theability to respond more quickly to changes in local consumertastes.
More specifically, the Chinese have no overseas distributionchannels or service networks, little promotional or advertisingsavvy, and limited pricing skills. It is questionable whether thesecompanies could quickly develop a feel for the design andfeature preferences of Western customers.
Alternate Business Models to grow the Brand Globally
There are two business models that would help a Chineseconsumer products company move its branded goods quicklyinto developed markets while taking the time to become familiarwith them.

15 SCMS Journal of Indian Management, January-March, 2006.
Published by School of Communication and Management Studies
The first model is a step-by-step procedure in which productsexported from China penetrate overseas markets throughindependent distributors serving discount channels. This gradualprocess would permit Chinese companies to gain anunderstanding of customer behaviour and to build brandrecognition.
In the second model, Chinese companies buy an establishedbrand that has fallen on hard times and then move its productionto China to benefit from lower labour costs.
The Step-by-Step Approach
Channel consolidation in advanced markets has long been seenas a barrier to outsiders. Mass-market retailers in the United Statesfor example, control more than half of the consumer electronicsmarket, and the trend is accelerating. This development meansthat there are fewer competitors to which manufacturers canpitch their goods and that they have less power over pricing.Exclusivity deals can also block access to consumers.Nonetheless, a big problem in retailing today is sameness.Retailers are looking for distinct brands and products, and ifthese provide good margins and fair prices for the consumer,so much the better.
Working with distributors provides a Chinese company with achance to learn more about US markets and build its overseascapabilities.
Buying your Way in
The alternative to entering a market step-by-step is to buy into itthrough mergers and acquisitions. Suitable targets would becompanies with valuable assets—brands, customer bases,technology, or channels—as well as products that have becomeoverpriced as a result of management’s failure to monitor costs,to move production offshore to low-cost locations (such asChina), or to extract the best prices from overseas factories oroffshore OEMs.
A buyer could move the bulk of the acquired company’sproduction to China and retain the brand name, distributionchannels, and some of the local talent. Over time, it couldco-brand the product with its own name to build consumerawareness of its Chinese brand. Once the association andawareness had been firmly established, the buyer could phaseout the target brand. The biggest obstacle for a Chinesecompany would be locating qualified turnaround managers
for its typically distressed targets, since it would be unlikelyto have postmerger-management and market ing sk i l l sin-house.
The TCL Case
A leading Chinese electronics maker is pursuing a variant of thisapproach. TCL International Holdings purchased an insolventGerman television maker, Schneider Electronics, for $8 million inSeptember 2002, in an attempt to break into the Europeanmarket. Included in the acquisition price were Schneider ’splants; its distribution network of chain stores, hypermarkets,and mail order; and trademark rights to a series of brands,including Schneider and Dual. TCL, hoping to avoid Europeanquotas on the importation of Chinese TV sets, expects tocontinue production in Europe. A professional managementteam is helping TCL understand the local market and salesnetworks, and some Schneider employees have been re-hiredto oversee production. If the strategy is successful, TCL couldone day introduce the TCL brand to the European market;electronics products bearing the name are already exported toAustralia, the Middle East, Russia, South Africa, and SoutheastAsia. In a twist, TCL is using its Schneider brand to position itsmobile telephones in the high-end segment of the Chinesemarket. More recently, TCL bought GoVideo, of Scottsdale,Arizona, which makes DVD players.
Unilever
Managing the Brand Identity …
For Unilever, there is a common approach to measuring equityof a brand in different countries. There is global vision for aglobal brand…where they think the brand should be in terms ofits personality, values, etc. Brands in individual countries arethen accessed against this global vision and gaps are identified.Hence each country knows where they are with respect towhere they should be.
Unilever realizes that the biggest challenge in managing brands acrossregions is that these brands have very different heritage in differentcountries. Global brand management is a recent phenomenon andmost of their brands have been in local countries for over 100 years.Overcoming this could mean changing what the brand has stoodfor many years…hence it is a slow process and needs to involve thelocal brand team (custodians of their consumers’ needs) at eachstage.

16 SCMS Journal of Indian Management, January-March, 2006.
Published by School of Communication and Management Studies
Most brands of Unilever ’s are global brands. There could besome regional brands (Fair and Lovely - a fairness cosmetic creamin the Indian subcontinent) and some local brands (Wheel - awashing powder in India). Even if names are all different mostbrands today belong to a global brand set.
Global Brand Team Structure …
Global brands have a global brand director, who works with ateam of people; together they form the Global Brand Team. Alldirections, development work, strategic communication iscarried out by this team. The team members come from theregions i.e. people working on the brand at the regional/locallevel . Hence “operat ing company ” interests are wel lrepresented, as is the need for one global direction andstrategy.
Best Practice in Innovation…
All innovations are GBT approved innovations only. But theproject leader would be from a lead region (the region that willlaunch first and be responsible for roll-out). It could also be asimultaneous launch in more than one region, still the projectleader will be from one region and responsible for the globallaunch. The project team will have representatives from differentregions. The gate keeping will be done by the GBT.
Best Practice in Communication …
The advertising agency is by and large the same for the brandaround the world. The global brand team and the agencywou ld work toge the r to p roduce commun ica t ion /communication strategy, which gets adapted or parallellydeveloped for the other regions. The strategy developmentprocess is centra l ised, but the actual communicat iondevelopment is decentralised. Also there could be additionalcommunicat ion needs for loca l count r ies based oncompetitive pressures, equity in the market, size of the brandetc, which is managed by the regional team.
The advertising for the local markets is quite decentralised. Itis rarely an adaptation of a global campaign. It would beparallelly developed for the region. Two of three regions willdevelop the campaign jointly (single briefing). This way thestar ting point is the same, but local considerations are therefrom the star t as well. The single brief helps to ensurecommon parameters/guidelines.
Other Global Majors
Insights from other Globally renowned marketers are sharedbelow:
P&G and Coca Cola
● Common adver tising agencies globally, with localcountries being given fair amount of leeway to makeadvertisements that are relevant to the local conditions.However, to ensure that the brand identity ismaintained, the final approval comes from the GlobalBrand Manager, who works in close consultation withthe local brand managers.
● Interestingly, both companies have moved towardsthis more decentralized development of advertisementcampaigns only in the last decade or so, and prior tothis, they used local adaptations of global themes asthe primary mechanism for advertising in new countries.
● Both companies believe that each brand should standon it’s own and hence do not follow the “umbrellabranding” format wherein the corporate brand is usedto strengthen the brand’s position in the marketplace(unlike Unilever).
● P&G invests heavi ly in ensur ing that di f ferentdepartments (often located in different parts of theglobe) interact in an effective and efficient manner, toensure that speed to market is not compromised dueto diverse locations.
Whirlpool
● Has an understanding / alliance with P&G in the USAand Unilever in Europe, for sharing of ideas on productdevelopment and consumer insights, for mutualbenefit.
4.0 Conclusions:
In this debate, the cornerstone is to ensure that the brand has aconsistent positioning globally, while giving enough leeway tothe local managers to tailor make the advertisement campaignto meet the particular needs of the market.
Hence, a combination of strong direction in terms of what are“must haves” and what are the “must not dos” for each brandneed to be specified very clearly (perhaps using a detailed brand

17 SCMS Journal of Indian Management, January-March, 2006.
Published by School of Communication and Management Studies
manual). At the same time, with the “must haves” having beenmet, enough flexibility needs to be given to the local teams todecide on the most appropriate execution of the advertisementcampaign. There is also a need for a Global Brand Manager whois the sole custodian for the brand worldwide, and who mustwork with regional / local brand teams to ensure that the needsof the corporate (consistency in the brand’s equity) and theneeds of the local market (tailor the brand to appeal to the localconsumers) are met.
Managing the Brand Identity
A common metric for analysis of adherence to the global equityof a brand needs to be followed, so that there is an objectiveway of deal ing with confl icts between the corporaterequirements and the requirements of the local country teams.Almost all major global marketers have a partnership with a MarketResearch agency to develop such a metric for use across theglobe.
Corporate vs Product vs Hybrid brands
Very often it is easier to make inroads into another country byacquiring a local brand. Also, sometimes the parent brand /corporate brand may be well-known in a country, while thecorporate’s brand may not be all that well-known (e.g. P&Gmay be well-known in India, but Pantene was an unknownbrand till seven years back). In such cases the company needsto decide on how best to handle the branding strategy. Ithas an opt ion o f choos ing between the fo l lowingapproaches:
● Corporate Branding: where the corporate brand isthe one that is adver tised and is the brand faceconsumers are exposed to. This approach is usedby brands such as Nike, Adidas, Shell, Bennettonetc.
● Product Brands: where the consumer is exposed tothe product brand e.g. Camay, Tide, Ariel and thecorporate brand are not used. This approach is alsoused when a strong brand is acquired by a companye.g. Castrol brand that was bought over by BritishPetroleum, or the Kwality biscuits brand (which wasa local brand in India) that was bought over byBritannia (the largest biscuit manufacturer/marketerin India).
● Hybrid approach: wherein for some of the brands theproduct brand is used and for some brands acombination of the corporate and product brand isused. Examples would include Nestle, Kit Kat,Cadbury’s Dairy Milk, and Cherry Coke etc.
Local Knowledge and Control(Manpower Deployment – expats vs local)
One o f the ways o f re ta in ing cont ro l on the loca loperations is to have expat managers occupy key positionsin the company. Whi le this helps in ensur ing that thecorporate culture gets replicated in the local company, itruns the risk of not being able to extract the local knowledgethat is l ikely to be crucial for market success. Hence,substant ia l s tandardizat ions in procedure / process,training / exposure across countries should be used toensure commonality of culture, and at the same time, ensuringthat local talent is used for gaining the best local insights.
This is par ticularly an area where large sof tware companiesfrom India, such as Wipro, Infosys and TCS fail to grow thebusiness as rapidly as they could, since a large par t of theSales Development and Marketing is done by expat Indians(for reasons of lower cost to company). It is only in thelast few years that these companies have star ted hiringlocal talent to take advantage of the local knowledge base.
Advertising Agencies – Global vs Local
The case for a common advertising agency handling the brandglobally is fairly obvious, for reasons of maintaining consistencyacross countries. However, here there are two critical aspectsthat need to be considered:
● The local arm of the agency needs to be given enoughflexibility to work on a communication that is relevantto the local consumers / rooted in local idioms.
● In case the local arm of the global advertising agency isweak, then the local arm of the company needs to begiven the flexibility of working with another advertisingagency / pressure must be put on the global agency toimprove the quality of its people locally.
Growth Strategy: Slow Testing of the Waters vs all out Frontalattack vs buying your way in …
The strategic route to be taken for growth in a market needs
18 SCMS Journal of Indian Management, January-March, 2006.
Published by School of Communication and Management Studies
to be very well thought out. Often this is a function of the riskappetite of the parent corporate / availability of funds.
A less risky approach is of course to do a “soft launch” in afew selected / niche markets, thereby ensuring that financialliabilities are limited and at the same time, enough time isspent in the market to understand market structures andconsumer preferences. This is the most popular strategy andis the strategy being followed by Haier, and most othercompanies these days.
An alternate option is to buy out a strong local brand, so thatone can enter the market with a “bang” and star t off with astrong and dominant market position, which can then bebuttressed with the launch of its own brands. This was thepath followed by Coca Cola in India, with the acquisition ofthe Thums Up – a local brand of cola.
Korean companies such as LG and Samsung went ahead witha full frontal attack on the Indian market with the launch of aslew of products in the white goods category, albeit aftersubstantial homework having been done.
View on the Time Horizon
The company also needs to decide on what time horizoni s i t g i v i n g i t s e l f f o r s ucce s s … t h i s h a s obv iou simplications in terms of the amount of monies it needs tobudget, and in a way also underl ine the intent of thecompany, e.g. Kel logg’s invested without holding backfor a period of 18 years in Japan before turning profitable,simi lar ly, Coca Cola continues to lose money in India forthe las t decade, but s t i l l does not s t ing on marketinvestment. Whereas, Titan (an Indian watch brand) pulledthe plug on the global journey of i ts brand within twoyears, when it real ized the true extent of the moniescommitment needed.
Speed of Response to Markets
Ir respective of the location of various departments (speciallymanufacturing depar tments which are increasingly beingoutsourced to developing countries), mechanisms for smoothinter-departmental co-ordination need to be worked out, toachieve faster response times to markets. P&G has goneseveral steps ahead in this direction in managing this on aglobal basis, through investments in IT and by under takingBusiness Process re-engineering and tracks its response timeto market year after year.
Point of Differentiation
The corporate needs to be sharply focussed on what is thetrue point of differentiation between their brand and theincumbent brands. Typically, brands from the developingcountries expanding into the developed world use thena tu r a l p r i ce po in t advan tage a s t he key po in t o fdifferentiation. While this is bound to work well in the shor tterm, the corporate needs to ensure that parallelly anothersignif icant point of differentiation is created, lest it bebranded as a brand that operates in the lower end of themarket.
Examples would include Samsung, which star ted off as abrand operating in the lower end of the market, and it hashad to spend more than $ 400m last year to upgrade itsimage in the minds of the consumers. And by the looks ofit, it will need to sustain this kind of spending for the nextfour-five years before it can assure itself of a premiumpositioning.
Another candidate for this aspect would be the softwarecompany from India, which ti l l now have relied essentiallyon low cost software engineers to create an arbitrageoppor tunity. Over a period of time it needs to build itscapabil i t ies and brand in being able to offer industryspecific solutions / move up the value chain and becomemore of a “consultancy” type of outfit. This is already beingattempted by companies such as Infosys which is makinga conscious attempt to build its brand and exploit its“Global Delivery Model” as the new point of differentiationvis-à-vis other consulting companies.
Key words: Brand Valuation, globalisation, leveraging brand strength,brand Orientation, market share consumers, Building the Global Brand,Hybrid brands.
Bibliography
Aaker, David and Kevin Keller, “Consumer Evaluations of BrandExtensions,” Journal of Marketing, 54, 1, 27-33, 1990.
Aaker, David, “Building Strong Brands,” New York: The FreePress, 1996.
Allan R . Gold, Glenn Leibowitz, and Anthony Perkins, “Acomputer Legend in the making,” The McKinseyQuarterly, Number 3, 72–83, 2001.

19 SCMS Journal of Indian Management, January-March, 2006.
Published by School of Communication and Management Studies
Barwise, Patrick and Thomas Rober tson, “Brand Por tfolios,”European Management Journal, 10, 3 (September),277-285, 1992.
Battle of the brands, Consumer Reports; Aug., Vol. 70 Issue8, 12, 4, 2 char ts, 8, 2005.
Berner, Robert,Kiley, David Der Hovanesian, Mara,Rowley, IanArndt, “Michael GLOBAL BRANDS,” Business Week;8/1/2005 Issue 3945, 86, 4, 2 char ts, 4c, 2005.
Clark, Duncan, “Going Global,” Forbes, August, 2004.
Cour t, Freeling, Leiter and Parsons, “If Nike can just do it, whycant we,” McKinsey Quarterly, 3, 1997.
Featherstone, Mike, “Global Culture: An Introduction,” GlobalCulture: Nationalism, Globalization and Modernism,in M i ke Fea the r s tone (ed . ) , London: SagePublications, 1990.
Filho, Calicchio and Lunardini, “Brand Building in EmergingMarkets,” McKinsey Quarterly, Special Edition, 2003.
Fischer, Bill, “The Enigma of Shanghai Brands,” Sunday Column,2003.
Foy, Peter and Kumar, Anil, “Rolling Out the Red Carpet,”McKinsey Quar terly, 4, 1997.
Hoschka and Liningston,“Winning Asian Strategies,” McKinseyQuar terly, 1, 2002.
Interbrand repor ts on the gainers in the global brand war,Design Week; 7/28/2005, Vol. 20 Issue 30, 5, 1/5,2005.
Kapferer, Jean-Noel, Strategic Brand Management, secondedition, London: Kogan Page. Olins, W. (1989),Corporate Identity, London: Thames and Hudson,1997.
McGregor, “Jena Brand Aids,” Fast Company; Aug., Issue 97,28, 1/3, 2005.
McIntyre, Paul, “Samsung Shouts, Coke Goes soft,” 2004.
Ming-Huei Hsieh, “Measuring Global Brand Equity UsingC r o s s - N a t i o n a l S u r v e y D a t a , ” J o u r n a l o fInternational Marketing; Vol. 12 Issue 2, 28, 30, 8char ts, 2004.
Parsons, Andrew J., “Nestle: The vision of local managers,”McKinsey Quar terly, 2, 1996.
Paul Gao, Jonathan R . Woetzel, and Y ibing Wu (2003),“Can Ch inese B rands make i t ab road?” TheMcKinsey Quar ter ly , Spec ia l Ed i t ion: G loba ldirections,2003.
Sapsford, Jathon, “Toyota Introduces a New Luxury Brandin Japan: Lexus,” Wal l Street Journal - EasternEdit ion; 8/3/2005, Vol. 246 Issue 23, B1, 2, 1c,2005.
Schuiling, Isabelle, “How different are branding strategies inthe pharmaceutical industry and the fast-movingconsumer goods sec to r, ” Jou r na l o f B randManagement; May 2004, Vol. 11 Issue 5, 366, 15,2004.
Smith, “Carl The Impor tance of the IMA Brand,” StrategicFinance; Aug., 2005, Vol. 87 Issue 2, 6, 1, 1bw,2005.
The 100 Top Brands, Business Week; 8/1/2005 Issue 3945,90, 4, 2005.
Tischler, “Linda SMELLS LIKE BRAND SPIRIT,” Fast Company;Aug., 2005 Issue 97, 52, 6, 3c, 2005.
Wu, Y ib ing, “China’s Ref r igerator Magnate,” McKinseyQuarterly, 3, 2003.

20 SCMS Journal of Indian Management, January-March, 2006.
Published by School of Communication and Management Studies
C.Anandan, M.Prasanna Mohan Raj and K.Ravichandran
A Conceptual Framework onBrand Architecturein Indian Context
levels of branding within the firm, thenumber of brands at each level as wellas their geographic and productmarket scope. The most cr i t ica lelement in this structure is the numberof levels, i .e. corporate, house/product business and how theseare used in conjunction with eachother.
1.1 Definition
Brand Architecture is an organizingstr ucture of brand por tfolio thatspeci f ies the brand roles andrelationship among the brands anddifferent product market context.
Dr.C.Anandan, Asst.Professor, Depar tment ofManagement Studies, National Institute of Technology,Thiruchirappall i-620 015, Tamilnadu, Email:[email protected]
Mr.M.Prasanna Mohan Raj is doing his PhD in Branding.
Dr.K.Ravichandran is working as Regional Officer, AICTE-Kolkata, Email: [email protected]
With the g lobal izat ion ofmarkets and the growth ofcompetition on a global
scale, companies are increasinglyexpanding the geographic scope oftheir operations, all firms have multiplebrands and they manage them as ateam to work together and to helpeach other and to avoid getting in eachother ’s way.
The central role of branding in definingthe firm’s identity and its position inmarkets means that it is critical todevelop explicit brand architecture.This implies identifying the different
Brand architecture is a key component of the firm’s overall marketing strategy. It provides a structure to leverage strongbrands into other markets, assimilate acquired brands, and rationalize the firm’s branding strategy. Brand architecturedefines and orders the relationship between brands, the corporate entities and families of products and services. Thisarticle looks at how firms have developed brand architecture and the drivers that shape that architecture. Theimportance of designing clear and effective brand architecture and managing brands in order to maintain a harmoniousbalance within this architecture are discussed. Various Models adopted for Brand architecture are also discussed withIndian examples. The paper concludes by emphasizing the need for the effective managing the firm’s brand architecturein the light of ongoing global trends of industry consolidation, global competition and lowering the information costs.

21 SCMS Journal of Indian Management, January-March, 2006.
Published by School of Communication and Management Studies
Brand Architecture is the vehicle by which the brand teamfunctions as a unit to create synergy, clarity and leverage.
If it is assumed each brand as artists, the brand architecture willplay the role of Director ’s job of providing the artists correctroles and making them function as team rather than a collectionof ar tists. The Brand architecture creates a system, like a roadmap, that helps consumers and key corporate constituents tonavigate easily among brands and make the right choices.
2. Drivers of Brand Architecture
Brand architecture, like any living organism, is continually changing,both shaped by and evolving in response to these drivers:
1. Firm’s Administrative Heritage
2. Corporate endorsement
3. Product Diversity
4. Product Market integration
5. Consistency
2.1 The Firm’s Administrative Heritage
The firm’s administrative heritage is central to understanding itsbranding strategy. Firms with a centralized organizational structureand global product divisions, such as Sony or Siemens, are morelikely to have global brandsi. Both Siemens and Sony adopt acorporate branding strategy emphasizing the quality and reliabilityof their products. A firm that has historically operated on a highlydecentralized basis where country managers have substantialautonomy likely to have a substantial number of local brands.Unilever’s are adopting this strategy and having the local brands.
2.2 Corporate Endorsement
Corporate endorsement of product level brands is increasinglyused as a mechanism to integrate brand structure across markets,providing a unifying element across product offerings.Companies such as IBM and Apple, place considerable emphasison corporate identityii. In the case of IBM, “Big Blue” is associatedwith a solid corporate reputation and projects the company’simage of a large reliable computer company, providing productsand services worldwideiii. Equally, Apple used its colored applelogo to project the image of a vibrant challenger in the personalcomputer marketiv. Indian company with highly diverse productlines such as TATA having Automobiles, FMCG, InformationTechnology and Finance services rely on the corporate brandname (and its logo) to project an image of reliability.
2.3 Product Diversity
The interrelatedness of the product businesses in which thefirm is involved will be one of the major drivers in determiningthe Brand architecture. Firms that are involved in closely relatedproduct lines or businesses rely on similar core competenciesoften emphasize corporate brands. Amul, for example, isinvolved in a range of product businesses from Dairy productsand Chocolates to Ice Creams. All of them are relying heavily onQuality Conscious. The Gujarat Co-operative Milk MarketingFederation Ltd. has emerged as the top scorer in the servicecategory of the prestigious IMC Ramkrishna Bajaj National QualityAward - 2003v. Use of the Amul name provides reassurance andreinforces the firm’s reputation for Quality and reliable products.
Conversely, when firms are involved in a range of diverse productbusinesses that target different customer segments, and havedifferent associations, opt to develop separate identities andassociations for individual businesses or products. For example,Hindustan Lever and P&G has no corporate brand and emphasizeeither product or house brands, thus establishing separateidentities for their businesses such as personal care, femininecare and detergentsvi.
2.4 Product Market Integration
Another driver influencing the firm’s brand architecture is thedegree of product market integration. This can be viewed notonly in terms of whether customers have similar purchase needsand interests worldwide, but also whether the same competitorsare present in these markets. Where the same competitorscompete in all or most markets, but local competitors are alsopresent, use of a multi-tier branding structure, including globalcorporate or product brands as well as local brands is desirable.For example Coca-Cola and Pepsi, not only have their globalbrand of colas, but also numerous local and regional brandscatering to specific market tastes like Fanta and Mirinda in India.Similarly Colgate has also regional brand variants such as Colgateherbal, Colgate gel.
2.5 Consistency
Consistency is the important factor relative to the diversity ofproducts and product lines within the company. There shouldbe balance between the number of brand names and a commonidentity across different products. Establishment of strong anddistinctive brand images for different product lines help toestablish their separate identities, conversely, use of a common

22 SCMS Journal of Indian Management, January-March, 2006.
Published by School of Communication and Management Studies
brand name consolidates effort and can produce synergies.
3. Framework of Brand Architecture
Management needs to design an efficient harmonious brandarchitecture that spans operations in different countries andproduct lines. Brand architecture defines and orders the
relationship between brands, the corporate entities and families
of products and services. Ultimately, the architecture creates a
system, like a road map, that helps consumers and key corporate
constituents to navigate easily among brands and make the right
choices. Brand architecture is defined by five dimensions as
follows (Figure is shown in Annexure I).
BRAND
PORTFOLIO
. Endorsers
. Benefit brands
. Co-brands
. Driver roles
PRODUCT-MARKET
CHARACTERISTICS PORTFOLIO ROLES
. Strategic brands
. Linchpin brands
. Silver Bullets
BRAND FORTFOLIO
STRUCTURE
. Brand Groupings
. Brand hierarchy
PORTFOLIO
GRAPHICS
. Logo
. Visual presentation
BRANDARCHITECTURE
Annexure I
Figure No.1 Framework of Brand Architecture
23 SCMS Journal of Indian Management, January-March, 2006.
Published by School of Communication and Management Studies
i. Brand portfolio
ii. Portfolio roles
iii. Product market context roles
iv. Portfolio structure
v. Portfolio Graphics
3.1 Brand Portfolio
The combination of all brands and sub brands attached withProduct-market offerings, including co-brands with other firmsis called Brand Por tfolio. Brand architecture involves themanagement of brand portfolio. The Brand portfolio of HindustanLever Ltd consists of 110 brands with 950 of different types ofpacks, which are operating under different market context likehealth care, personal care, beverages etcvii. The brand portfoliocan be strengthened by both addition and deletion of brands inview of portfolio perspective.
3.2 Portfolio Roles
Portfolio roles are the toll to provide the systems view of brandportfolio, include the following:
● Strategic Brand
● Linchpin Brand
● Silver bullet
● Cash cow brand
These portfolio roles are not mutually exclusive. The brand maybe simultaneously a linchpin and silver-bullet brand.
3.2.1 Strategic Brand
The strategic brand may be the dominant brand, which isprojected to maintain or grow its sales and profit. Thesebrands are also called as Mega Brands. Reliance Infocomm isthe strategic brand of Reliance Group of companies, becausethe future of the organization is to move beyond traditionalplastic and textile industry. Vicks is a strategic brand for P&Gas it laid the foundation for a position in Over-the-CounterCategoryviii.
3.2.2 Linchpin Brand
Linchpin brand indirectly influences the business by providingthe basis for customer loyalty. It is the leverage point of futurevision of the firm. Vimal may be called as Linchpin brand forreliance industriesix.
3.2.3 Silver Bullet
A Silver bullet is a brand, which can be powerful force in creating,changing or maintaining a brand image. It positively influencesthe image of another brand. Successful silver bullets are listedas follows:
HP laser Jet’s resolution Enhancement is the branded featureserved to make credible claims that Hewlett-Packard hadachieved another breakthrough in printer technology.
Colgate gel is positioned as having branded feature of“Freshness.” Colgate gel, silver bullet brand of Colgate hasserved to position in the freshness platform.” It has changedthe image of Colgate that it is not only providing the Strongteeth but also freshness. It has served to make the claim thatColgate had achieved another breakthrough in oral industryx.
3.2.4 Cash Cow Brands
Strategic, linchpin and silver-bullet brands need investment inorder to fulfill their strategic mission. The cash cow brandshaving significant customer base that need not require theinvestment that other portfolio brands need. There is loyalcustomer base that will be stay on with the brand, even thoughsales may be stagnant or slowly declining. Resources generatedby the Cash cow brand will be invested in other brands, whichwill be the bases for future growth of the brand portfolio. Forexample Maruthi 800, which has seen its sales drop in recentmonths, it has not been phased out as it is the bread andbutter model for Maruthi Udyog Limited. Now Maruti 800 istargeted new customer segments like two-wheeler ownersand teachersxi.
3.3.Product -Market Context Roles
The Product-Market context roles of the group of brands shouldbe well defined and coordinated for effective Brand architecture.There are four sets of product-market context roles as follows:
● Endorser/Sub brand roles
● Benefit brands
● Co-brands
● Driver roles
3.3.1 Endorser/Sub brand roles
An endorser brand is an established brand that providescredibility and substance to the offeringxii. It is the master brand;

24 SCMS Journal of Indian Management, January-March, 2006.
Published by School of Communication and Management Studies
the prime indicator of the offering to define the specificoffering while sub brands may augment the master brand.These brands usually represent organizations rather thanproducts. Endorser brands expl ici t the organizat ionalassociations such as innovation, leadership and trust, forexample “Nescafe Sunrise” create associat ion with i tsmother brand Nestle. Wipro, operating in different businesssectors, which are endorsed under mega, brand WIPROxiii.To achieve clar i ty, synergy and leverage in the brandpor tfol io, endorser brand and sub-brands should beproperly util ized.
3.3.2 Benefit Brands
The benefit brand is a brand that provides features, Componentingredient or services, which augment the branded offering. Thebranded benefit will be most powerful when it is relevant to the brandpromise and contributes to the functional benefit. Benefits mayrepresent points of differentiation lead to get competitive advantage.
Branded Features
Following Brands are providing the benefits to the customersthrough their features.Table No. 1 (Branded Features) is shownin Annexure III.
Branded Components
Following Brands are providing the benefits to the customersthrough the ingredients or components in their product. Intelinside, a classic branded component program has consistentlyproduced substantial price premiums.
Table No. 2 (Branded Components) is shown in Annexure III.
Branded Services
The special attributes of these following Service brands willprovide the benefits.
Table No. 3 (Branded Services) is shown in Annexure III.
3.3.3 Co-Brands
Two or more well-known brands are combined in an offer toaddress to the common target is called as Co-branding. Eachof the brand sponsors expects that the other brand name willstrengthen the preferences, purchase intention and brand imageand hopes to reach new audience. One of the co-brands maybe the component or ingredient brand (such as ITC’s “Sun feast”
biscuits with “Aavin” milk) or an endorser. Image reinforcementmay take place due to co-brandingxiv.
3.3.4 Driver Role
Brand architecture design involves selecting the set of brandsto be assigned as major driver roles. Driver role represents theextent to which a brand drives the purchase decision and definesthe use experience. These brands will have priority in brandbuilding. The brand with a driver role will have significant loyalcustomer base. The driver Brand is usually a master brand or subbrand. For example, “Fair ever” is in the driver role for CavinKareBrand Architecture. Even, endorsers and branded benefits canalso have some driver rolexv.
3.4 Brand Portfolio Structure
Brand Architecture provides clarity to the customers by designingthe structure of all brands. These brands in the Portfolio aresharing the relationship with each other. Brand portfolio structurewill decide purpose, direction and sense of order to theorganization. There are following three approaches can beutilized to present the portfolio structure.
● Brand Groupings
● Brand Hierarchy Trees
● Brand range
3.4.1 Brand Groupings
The logical grouping of brands that has a meaningful characteristicin common is called as Brand Groupings or configuration. Thegroups provide logic to the brand portfolio and help to growovertime. Generally, Brands are grouped based on Segment,Product, and Design. For eg. Brand Grouping of Procter &Gamble Ltd. can be made as followsxvi.
Segment - Children (Vicks) and women (Ariel, Tide,Rejoice, Whisper)
Product - Health care and Feminine care
Design - Classic and Contemporary
These are the dimensions that define the structure of manyproduct markets. Portfolio brands grouped along such basicproduct-market segmentations tend to be more easi lyunderstood by consumers. Distribution channels and applicationscan also be used as categorical variables for grouping the brands.Now companies are introducing branded variants, which arespecific brand lines supplied to specific distribution channels.
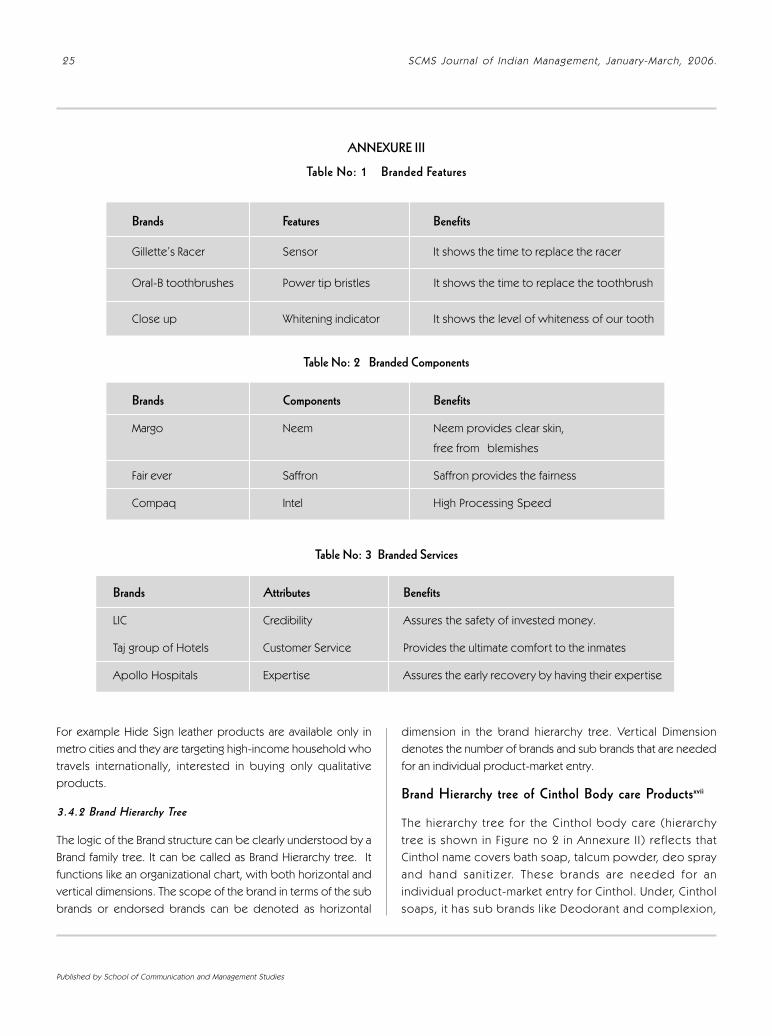
25 SCMS Journal of Indian Management, January-March, 2006.
Published by School of Communication and Management Studies
For example Hide Sign leather products are available only inmetro cities and they are targeting high-income household whotravels internationally, interested in buying only qualitativeproducts.
3.4.2 Brand Hierarchy Tree
The logic of the Brand structure can be clearly understood by aBrand family tree. It can be called as Brand Hierarchy tree. Itfunctions like an organizational chart, with both horizontal andvertical dimensions. The scope of the brand in terms of the subbrands or endorsed brands can be denoted as horizontal
dimension in the brand hierarchy tree. Ver tical Dimensiondenotes the number of brands and sub brands that are neededfor an individual product-market entry.
Brand Hierarchy tree of Cinthol Body care Productsxvii
The hierarchy tree for the Cinthol body care (hierarchytree is shown in Figure no 2 in Annexure I I) ref lects thatCinthol name covers bath soap, talcum powder, deo sprayand hand sani t izer. These brands are needed for anindividual product-market entry for Cinthol. Under, Cintholsoaps, it has sub brands l ike Deodorant and complexion,
ANNEXURE III
Table No: 1 Branded Features
Brands Features Benefits
Gillette’s Racer Sensor It shows the time to replace the racer
Oral-B toothbrushes Power tip bristles It shows the time to replace the toothbrush
Close up Whitening indicator It shows the level of whiteness of our tooth
Table No: 2 Branded Components
Brands Components Benefits
Margo Neem Neem provides clear skin,
free from blemishes
Fair ever Saffron Saffron provides the fairness
Compaq Intel High Processing Speed
Table No: 3 Branded Services
Brands Attributes Benefits
LIC Credibility Assures the safety of invested money.
Taj group of Hotels Customer Service Provides the ultimate comfort to the inmates
Apollo Hospitals Expertise Assures the early recovery by having their expertise

26 SCMS Journal of Indian Management, January-March, 2006.
Published by School of Communication and Management Studies
L ime Fresh, Deo. Cinthol Deo spray has the sub brandsl ike spice, Lemon, Sandal and Cologne. These horizontaldimensions ref lect the sub brands and endorsed brandstha t res ide under brand umbre l l a o f C in tho l . B randhierarchy t ree is used as tool to eva luate the brandarchitecture .It helps to provide the clear picture whetherbrand system has log ic and c la r i ty . Hav ing a log ica lhierarchy structure among sub brands, helps in generatingclarity.
3.4.3 Brand Range
The range of the Por tfolio brands is the Key issue in Brandarchitecture. It answers the key issue such as, how far shouldthe brands be stretched across markets and products?Endorser brands and sub brands not only extend leveragebut also protect associations of a brand that needs to beleveraged.
Leveraging brand assets and creating synergy by generating brandassociations in different contexts are the two major objectivesof Brand Architectures. These are fulfilled by Extensions. Brands,having credibility in intangible associations are more able to
extend to new categories because those intangibles can workin a wide variety of contexts. For eg. Dettol is having intangibleassociations of “Hygiene and Protection against germs.” So ithas extended successfully in wide variety of contexts such asDettol soap, Dettol plaster, Dettol shaving cream, Dettol handwash. Similarly Denim has successful extension of Denim soapand Denim talcum powder by having association of “Machoimagexix.”
If the extensions are poorly executed, It will dilute the brandassociation. When the brand is tied closely to a product class,its potential for extension is limited. For eg, even though Brandname of “Horlicks” has positive associations, it has not donewell when it is extended to Biscuitsxx. Customers should sensethe strong associations between the extensions and shouldfeel comfortable with new category.
3.5. Portfolio Graphics
Portfolio graphics are defined by Visual representations suchas packaging symbols , Product design, layout of Pr intadver tisements and taglines. The Most visible and centralbrand graphic is the logo that represents the brand in its
CINTH O L
CINTH O L SO AP
CINTH O L DEO SPRAY
CINTH O L TALCUM PO W DER
CINTH O L H AND
SANITIZER
Deodorant & Com plexion
Lim e Fresh
Deo Spice Lem on Sandal Cologne
Annexure II
Figure No.2 Brand Hierarchy Tree of Cinthol Body Care Products
CINTHOL
CINTHOLDEO SPRAY
CINTHOLTALCUMPOWDER
CINTHOLHAND
SANITIZERCINTHOL
SOAP
Deodorant&
Complexion
LimeFresh SpiceDeo Lemon Sandal Cologne
27 SCMS Journal of Indian Management, January-March, 2006.
Published by School of Communication and Management Studies
various roles. The corporate logo and visual identification(Apple, Philips) played a major role in identifying the brandand defining brand image worldwide. Apple used its colouredapple logo to project the image of a vibrant challenger in thepersonal computer marketxxi.
Portfolio graphics reflects the relative driver role of set of brands.The relative size and positioning of two brands on a logo willreflect their relative importance. For eg. In all variants of Colgatesuch as Gel, Total, Herbal Brand names appears in smaller typefacethan Colgate. This portfolio graphics reflects that Colgate is theprimary driver of the productxxii.
Portfolio Graphics denotes the brand portfolio structure. VisualGrouping of brands can be reflected by the colour and acommon logo. For eg., the use of Maggi colour and packagelayout (Yellow letters in the Red background) provides the verystrong master impact over its brands, indicating that they aresharing the Common brand associations.
4. Brand Architecture Models
There was, however, considerable variation even within a giventype of structure depending to a large extent on the firm’sadministrative heritage and international expansion strategy aswell as the degree of commonality among product lines orproduct businesses. In addition, these models are continuallyevolving in response to the changing configuration of marketsor as a result of the firm’s expansion strategy in internationalmarkets. To develop a viable brand strategy, Firms need to fittheir Brand architecture into suitable Models. The Brandarchitecture models establish the relationships between thecorporate brand and various sub-brands. Brand architecture maytypically fit into one of the following modelsxxiii.
● Corporate Brand Model
● Divisional Model
● Hybrid Model
● Exception Model
In selecting these four models firms should consider the degreeof synergy that exists across its divisions and product lines.Synergy is an elusive concept raised by CEOs that essentiallytranslates as “One plus One equals three.”
4.1 Corporate Brand Model
Companies, having real synergies may be suited to pursue the
corporate brand model. In this model, Companies willpredominantly use the single corporate brand. GE, Philips, WiproBPL and Himalya health care are using their corporate names in allof their products. Their prime objective was to establish a strongglobal identity for the brand rather than respond to local marketconditions.Cost saving is one of the advantages of this model and maintainingthe single corporate brand may be less expensive supportingmultiple divisional names. Firms, which are not having strongcorporate brand, may incur significant short-term costs toestablish message.
4.2 Divisional Model
Divisions will use respective names in the Divisional Model andcorporate names may be muted. Products were tailored to localpreferences. Customer preferences were highly localizedHindustan Lever Ltd. follows this model. It has different brandnames across the brand category such as Lux, Lifebuoy,Close-up, Pepsodent, etc. Brands will develop considerablegoodwill over the time. Even if, firm having this brand isacquired by another firm, the brand name will not be changed.For eg. though HLL acquired Ponds and Brookebond, it retainsits old brand names, because customers trust that brandnamexxiv.
4.3 Hybrid Model
Firms may go for Hybrid model to balance the goodwill andsynergies. This model not only sends corporate widemessage but also allows individual divisions the flexibility toposition themselves against competitors in their respectiveniches.
A number of companies had hybrid brand structures with acombination of corporate and product brands. Coca-Cola, forexample uses the Coca-Cola name on its cola brand worldwide,with product variants such as Diet Coke, Coke Vanilla. In addition,Coca-Cola has a number of local or regional soft drink brandssuch as Fanta, Limcaxxv. Similarly Hindustan Lever Ltd. is also havingregional brands like Wheel washing powder, Bru instant coffee etcxxvi.
This model implements the dual message approach throughcombined names such as TATA Indica and TATA Chakra Gold.Thus companies could capitalize on the goodwill inherent intheir divisional brands (Chakra Gold), yet still sending the broadercorporate image by associating Corporate name (TATA) withdivisional brand namexxvii.
28 SCMS Journal of Indian Management, January-March, 2006.
Published by School of Communication and Management Studies
4.4 Exceptional Model
Companies may create or acquire new product /divisions todeviate from the corporate brand position. The new productmay focus on a new customer segment. In these exceptionalsituations, this model can be applied. Aditya Birla Group ofcompanies has recently adopted this model. L&T CementDivision, later acquired by Aditya Birla Group of companies,created the new brand cement called “Ultra Techxxviii.”
These models are continually evolving in response to thechanging configuration of markets or as a result of the firm’sexpansion strategy. There was, however, considerable variationeven within a given type of model depending to a large extenton the firm’s administrative heritage as well as the degree ofcommonality among product lines or product businesses.
5. Conclusion
Global trends of industry consolidation, global competition andlowering the information costs enforce the firms to considerhow to modify their brand architecture in the Indian perspective.They are capturing for opportunities to reduce the number ofbrands and improve efficiency as well as to harmonize brandstrategy across product lines. Focus on a limited number ofstrategic brands in markets enables the firm to consolidate andstrengthen its position and enhance brand power. These strategicbrands are called as “Power brands or Mega brands.” Effectivemanagement of brand architecture in the light of changing marketconditions and the firm’s market expansion is crucial to retain itsposition and strengthening power brands in the markets.Companies, which properly manage their brand architecture,will emerge as the winners of battle of Indian market.
References
i ht tp://www.gujmedia.de/_content/10/00/100044/
CorpBrand_Praes_engl.pdf
ii www.crmuk.co.uk/downloads/ACID01.pdf
iii www.cdf.org/cdf/atissue/vol4_2/IBM/big_blue.html.
iv http://pages.stern.nyu.edu/~sdouglas/rpubs/intbrand.html
v www.amul.com/awards.html
vi Harsh Verma, “Brand Management,” Excel books, First edition,2002, 237- 242
vii www.indiainfoline.com/bisc/jbmk06.html
viii http://www.pg.com/india/hhcl/finresults.htm
ix http://www.ril.com/eportal/VirtualPageView.jsp?page_id=598
x http://www.financialexpress.com/fe/daily/20000619/
efe16024.html
xi h t t p : / / w w w. b l o n n e t . c o m / 2 0 0 4 / 1 0 / 1 5 / s t o r i e s /
2004101502320200.htm
xii rcw.raiuniversity.edu/management/ mba/brand-manag/
lecture-notes/lecture-24.
xiii M.G.Paremeswaran,“Brandbuildingadver t is ing,” Tata
McGraw- Hill Publisher Co. Ltd, I edition, 2002, 145-148.
xiv h t t p : / / w w w . i t c p o r t a l . c o m / n e w s r o o m /
press_sept27_1_04.htm
xv www.chennaibest.com/cityresources/Fashion_and_Beauty/
interview06.asp
xvi http://www.pg.com/india/hhcl/finresults.ht
xvii http://www.cinthol.com
xviii h t t p : / / w w w. a g e n c y f a q s . c o m / w w w 1 / n e w s /company_news/Marketing/1135.html
xix http://f i lmfaremagazine.indiatimes.com/ar ticleshow/472314.
xx http://www.etstrategicmarketing.com/SmJul-Aug04/
Strategic-Article6-.html
xxi h t t p : / / p a g e s . s t e r n . n y u . e d u / ~ s d o u g l a s / r p u b s /intbrand.html
xxii h t t p : / / w w w. t h e m a n a g e m e n t o r. c o m / k u n i v e r s e /
kmailers_universe/mktg_kmailers/BPS180
xxiii h t t p : / / w w w. f r a n k l y n n . c o m / n e w s / a r t i c l e s /
Brand%20Architecture.pd
xxiv www.ipan.com/press/99jan/2701bb.htm
xxv www.domain-b.com/news_review/ 200007july/20000710
newsa.html
xxvi www.i imcal .ac. in/community/marcel l / ar t ic les/KB/
Hindustan_Lever_Limited.htm
xxvii Harsh Verma, “Brand Management,” Excel books, First edition,2002, 253- 257
xxviii http://www.grasim.com/media/Press-releases/200410oct/
20041026-ultratech-cement.htm
29 SCMS Journal of Indian Management, January-March, 2006.
Published by School of Communication and Management Studies
Key Success Factors ofFranchising Systemsin the Retailing SectorI l an A lon
This ar ticle examines the key success factors of franchisors in the retai l ing industr y by focusing on theimpact of ten organizational variables on the “success” of the franchising firm. Success is measured interms of both size and growth simultaneously. The signif icant variables show that the time it takes thefirm to franchise is negatively related to its success, while the internationalization, the propor tion offranchising, the number of company-owned units and the age of the franchisor are posit ively relatedto its level success. Franchisors in the retai l ing sector can benefit from this study by concentrating oncreating the organizational conditions that form the key success factors for a retai l franchisor.
D r. I l a n A lon , T homas J . Pe t t e r s Cha i r o fInternat ional Bus iness, Execut ive Director ofRol l ins-China Center, Ro l l ins Col lege, 1000Holt Ave - 2722, Winter Park, F lorida 32789,U n i t e d S t a t e s o f A m e r i c a , E m a i l :ia lon@rol l ins .edu
(Fortune 1995). The increased competitive environment hasraised the need to examine the impact of competitive practiceson the level of success. A surrogate measure of success is theability of the company to achieve economies of scale through
scale and growth.
This study focuses narrowly on thereta i l ing industry because (1)franchising accounts for as much as40 per cent of US retail sales and (2)retailing has experienced increasedcompetitive pressures over the lastdecade. The concentration on a singleindustry is a lso exper imenta l lypreferred (Dant et al. 1996; Sen 1998;Alon 1999).
Growing, but contrasting, evidence onthe success and failure of franchisorsneeds to be examined. While somestudies point to the success of
F ranchis ing was shown to exer t a power ful force inthe US economy. Accord ing h i s to r ica l s ta t i s t i csf rom the Department of Commerce, franchising has
increased tenfold between 1972 and 1988 (Kostecka 1988).At present, franchising sales in the USexceed $1 trillion, or about ten percent of the total private economy(Alon, 2005). Better understanding ofthe key success factors of franchisingcontr ibutes to the l i terature ofsuccess/ fa i lure and may havefar- reaching economica l andmanagerial implications.
Over the last decade, franchisors inmost of the traditional industries,particularly in fast food and retailingindustr ies , have exper iencedincreasing competition, greater marketsaturat ion, s lowing growth, andgrowing numbers of territorial disputes

30 SCMS Journal of Indian Management, January-March, 2006.
Published by School of Communication and Management Studies
franchising over independent businesses (e.g., Justis et al., 1992;Castrogiovanni et al. 1993; IFA 1998), a growing literature that iscritical of this view is emerging (e.g., Bates 1995; Stanworth etal. 1997). An examination into the causal factors of successamong franchisors should, therefore, broaden the body ofknowledge on this critical issue.
This study attempts to develop a managerially useful framework,which has the potential to help franchisors develop betterstrategies to achieve competitive advantage. The focus is,therefore, on the controllable elements of the franchisingorganization (organizational factors). The factors that areselected are also readily available to prospective franchiseesand investors prior to the purchase, potentially increasing thewiseness of the decision.
Model Development
The literature of success/failure of franchisors has showninconclusive findings. While studies sponsored by franchisingassociations, most notably the International Franchise Associationand the British Franchise Association, have found that franchisingis a highly successful method of doing business, a few otherreports argued to the contrary.
An IFA survey of 1,001 franchisees selected randomly from 4,000registered franchisors conducted by the Gallup Organizationbetween September and October 1997 and released in March1998 found that:
● Eight out of ten were small businesses with only onefranchise,
● 92 per cent of franchisees considered themselvesvery or somewhat successful,
● The majority of franchise owners were satisfied withtheir business,
● 65 per cent say they would purchase the franchiseagain if given the opportunity,
● 93 per cent believe that being associated with thefranchise gives them a competitive advantage,
● 72 per cent said their expectations were met, and
● On average, gross earnings ranged from $76,000 fora single unit franchisee to $142,000 for a multiple-unitfranchisee.
The picture that emerges is that franchising is a highly successful
method of doing business, which provides sustainablecompetitive advantage and a reasonable standard of living forits owners.
In contrast to the IFA findings, another group of researchsuggested that franchise associations have an interest inpromoting the franchise concept, particularly to politicians andinvestors. Thus, they are more likely to be biased (Stanworth etal. 1997). Fortune magazine (1995), for example, reported thatsince the mid-1980s, franchising growth either matched or laggedbehind GDP growth. Stanworth et al. (1997) found that USfranchising growth has kept pace with whole US economy, whilein the UK, the franchise industry experienced negative real growth.The authors noted that in the UK franchisee survival rate is nodifferent from other start-up firms over a five-year period.
Franchising is viewed as a hybrid organization form that haselement of markets and hierarchies because the franchisor retainssome ownership and control, but gives up the operations ofthe units. Two popular approaches to explaining the use offranchising have been resource-scarcity and agency theories.Most studies using these theories have tried to explain the factorsassociated with the proportion of franchising. The theory ofresource scarcity suggests that firms initially franchise becausethey lack the resources for expansion. Such resources are notmerely f inancial (capital scarcity), but also managerial ,knowledge- based, organizational, etc. The agency perspective,on the other hand, focuses on the monitoring skills of thefranchisor. According to the agency perspective, firms franchisebecause they are unable to monitor their managers efficiently.Because franchisees have a residual claim on sales, shirking isavoided and the need for monitoring is diminished (Shane1996a). A number of recent studies have shown that thesetheories are complementary (Combs and Castrogiovanni 1994;Combs and Ketchen 1999; Alon 2000).
Franchising Speed: Years-to-Franchising
Franchising reduces the agency problems of firm growth because(1) it reduces the cost associated with selecting, assimilatingand monitoring new employees, (2) l imits the cost ofdetermining the abilities of store managers, and (3) decreasesshirking and moral hazard since the franchisee is a residualclaimant. Franchising promotes rapid development of economiesof scale and economies of scope, lowering the cost per unitand increasing the firm’s competitive stance (Shane 1996a).Franchising also provides the franchisor with the resources, such

31 SCMS Journal of Indian Management, January-March, 2006.
Published by School of Communication and Management Studies
as managerial input, local market knowledge, labor and capital,for growth. Franchisors in the retailing sector, particularlyemerging ones, are faced with high levels of competition andmarket saturation. This competitive framework necessitatesfranchisors to grow rapidly. “When new franchisors enterindustries in which they face established competitors, the speedwith which they grow to a size at which they can operate at acompetitive cost is important” (Shane 1996a, p. 221).
H1: The shorter the length of time it takes the retailer tofranchise, the higher its chances of success
Franchising Internationalization
The internationalization of franchising systems has received a lotof attention in recent years from researchers and practitionersa l ike. The genera l consensus is that f ranchisors thatinternationalize their systems can achieve critical scale and bemore competitive in the long run (Welsh and Alon, 2002; Alonand Welsh, 2003). Operating a franchise system acrossheterogeneous locations develops the franchisor ’s monitoringcapabilities and distance management skills (Alon, 1999).Franchisors that seek franchisees throughout the world expandtheir potential market of franchisees, appreciating theiropportunities for success (Alon and Welsh, 2001).
H2: Franchisors that seek internationalization are more likelyto be successful
Franchising Strategy: Proportion Franchising
While the determinants of the proportion of franchising havebeen examined (e.g., Alon, 2001), few studies focused onthe impact of the propor tion of franchising on the firm’ssuccess. Falbe and Welsh (1998) found that the proportion offranchising is positively related to system quality, brand name,and the level of communication, among other factors. Businessbelonging to franchisors and franchisees that have a higherproportion of franchising were less likely to fail. The franchisorfa i lu re va r iab les inc luded i l lega l /uneth ica l conduct ,misrepresentation/dishonesty, market saturation, faddishproduct appeal, over expansion, and competition fromcompany-owned units. The franchisee variables consisted ofunwi l l ingness to fo l low the sys tem or get invo lved,misrepresentation/dishonesty, failure to pay vendors on time,inadequate facility maintenance, expanding too rapidly, poorlocal economic conditions, overstaffing of facility, inappropriateinventory levels, and overcapitalization.
H3: Franchisors that have a higher proportion of franchisingunits are more likely to be successful
Company-Owned Outlets
The number of company owned units necessary by a franchisormay have an impact on the franchisor ’s level of success. The“rule of thumb” often used by franchising practitioners is that afranchisor should at the very least operate two units over threeyears or three units over two years. Franchisor owned outletsserve many important functions in the franchising system. Itallows the franchisor to test new concepts, innovate with itsmanagement systems, stay in touch with the customers, andlearn from ongoing operations. In a study by Alon (2001),retailers with a larger scale also were able to achieve highergrowth rate in the number of outlets in early stages of franchisingdevelopment, suggesting that company-based outlets are criticalfor expansion. Franchisors owned outlets also allow thefranchisor to respond to environmental challenges during timeof adversity, without the bureaucratic challenges, which may bemounted by franchisees in the system.
H4: Franchisors with a large number of company-ownedoutlets are more likely to be successful
Age/Experience
Falbe et al. (1998) argued that as firms get older, they becomeincreasingly formalized and standardized, more rigid, lessadaptive to change, more self-centered and detached from theexternal environment. Their findings surprisingly showed thatolder franchise systems were more aggressive, used morefranchise councils and recognition to promote new ideas,tended to introduce more innovation than younger ones. Otherstudies of franchising argued that older firms have moreresources, are more likely to operate in diverse locations (Alon1999). Huszagh et al. (1992), for example, suggested thatexperience in site selection, store layout, procurement andoperation policies can facilitate cost reductions based onimproved know-how. Experience in itself is an indication ofsuccess, which may provide an edge in the competitivemarketplace.
H5: Experience in the business, measured by age, will bepositively related to franchisor ’s success
Methodology
The study uses ordinary-least-squares (OLS) regression to

32 SCMS Journal of Indian Management, January-March, 2006.
Published by School of Communication and Management Studies
analyze the impact of ten organizational variables on thefranchising firm’s level of success. The first eight of the tenvariables are controllable elements of the franchising mix. Wehave hypothesized relationships with five of the controllablevariables mentioned in the above section.
Sample
Data for the dependent and independent variables were derivedfrom Entrepreneur Magazine 1997 Annual Franchise 500 list. Atotal of 52 retailing firms, consisting of the entire franchised retailsector available in the magazine, were examined. The choice ofdata source was based on several factors. First, this data presentthe most comprehensive data source on franchising in the UnitedStates (Entrepreneur 1998). Second, this data were usedextensively by franchising researchers (e.g., Shane 1996a, Shane1996b; Falbe and Welsh 1998; Sen 1998; Alon 1999). Third, thedata were shown to be both unbiased (LaFontaine 1992) andvalid (Mehta et al. 1999). Mehta et al. (1999) found no significantdifferences between the data available in Entrepreneur and thedata found two other leading sources of franchising: TheFranchise Annual and Bond’s Franchise Guide. Finally, themagazine itself checks more than 80 per cent of its informationthrough the Uniform Franchise Offering Circular, a publicationrequired by US regulation.
Dependent Variable: Success
This study uses a composite multiplicative measure of size andgrowth as a proxy for success. The decision to use thiscomposite measure was based on several factors. First, weexplain why size and growth are important dependent variablesof success. Then, we explain why the measures were combined.Finally, we explain how the dependent variable is measured.
Size, measured as the total number of units, is an importantfunction of success because size is positively related to marketshare, market power and credibility, and economies of scale inpurchasing, operating and promotion (Alon 1999). Size alsoincreases the monitoring capabilities of the franchisor throughlearning allowing for fur ther expansion (Huszagh et al. 1992).
The rate of growth in the total number of units is an importantmeasure of performance because it is a more robust measurethan growth in sales, assets or employment, and it is a goodproxy of success when financial data is not available (Shane1996a). Sen (1998) found that franchisor ’s growth in outlets ishighly correlated to the growth of dollar sales for the leadingrestaurant chains.
Individually, neither the size nor the growth rate fully capturesthe essence of success. Using size by itself presumes thatsmall firms, even ones that are growing rapidly, are less successfulthan big ones. Focusing only on growth suggests that big firmsthat are not growing are less successful than rapidly growingsmall firms. Neither proposition is by itself entirely correct. Relyingon standardization and formalization, large firms are more oftenconcerned with stability, leading to little change in the totalnumber of outlets (size), while small firms tend to be moreaggressive and innovative to achieve rapid development,economies of scale, brand name recognition, and competitiveadvantage (Falbe et al. 1998).
The use of a composite measure of size and growth differentiatesmore clearly between successful and failing franchisors. Smallfirms are not necessarily less successful than bigger ones, assuggested by the size measurement, and low growth is notnecessarily detrimental for large firms, as it is presumed inmeasures growth.
A multiplicative measure was used because the variables aremeasured in different units of analysis. Multiplicative measuresderived from Entrepreneur ’s data were previously employedby Shane (1996b) to measure monitoring capabilities. Wederived the dependent variable by multiplying the rate ofgrowth by the size (total number of outlets). We thenfollowed a procedure similar to the one used by Shane(1996a). We added a constant of 55 to the product of thetwo measures, because some firms had a negative growthrate, and performed a logarithmic transformation to normalizethe data.
Independent Variables
Ten independent variables relating to the franchisor wereexamined. Five of them are the hypothesized variables: (1)years-to-franchising, (2) internationalization, (3) proportion offranchising, (4) number of company-owned outlets, (5) age/experience. The rest are the control variables: (1) fee, (2) royaltyrate, (3) financing, (4) availability of financing, (5) and (6) start-upcosts. Similar conceptualizations of these variables wereused in previous research (Shane 1996a, 1996b; Combs andCastrogiovanni 1994; Alon 1999). The use of this data isadvantageous because the study can be replicated and becausethis data is available to all stakeholders of the franchising firm.Table 1 summarizes the hypothesized relationships and theircorresponding measures.

33 SCMS Journal of Indian Management, January-March, 2006.
Published by School of Communication and Management Studies
Table 1: Measurements and Hypotheses of the Variables
Variable Measurement Hypothesis
H1: LYTF Log (# of years prior to franchising) Positive
H2: INT Internationalization (0=no 1=yes) Positive
H3: PF # franchised / total # of units Positive
H4: COMP # of company-owned outlets Positive
H5: AGE # of years in existence
Control Variables
FEE Franchising Fee ($)
ROY Royalty Rate (%)
FIN Financing (0=none 1=some)
DISP Dispersion (0=regional 1=national)
LSTART Log (start-up costs)
Discussion and Results
Table 2 shows the descriptive statistics of the dependent andindependent variables, while table 3 provides a correlation matrix.
Taken together these tables show some of the simplerelationships that exist among the variables under investigation.Finally, table 4 tests the key success factor model in the franchisingsector.
Table 2: Descriptive Statistics of the Variables
Variable Mean Std. Deviations Minimum Maximum
SUCCESS 3.29 0.65 1.99 4.74
Years to Fran 8.09 12.05 0 50
LYTF 0.68 0.48 0 1.71
FEE 22.11 12.66 0 75
ROY 4.78 1.98 0 13
FIN 0.12 0.33 0 1
DISP 0.68 0.46 0 1
PF 0.81 0.23 0 1
COMP 10.42 21.24 0 100
AGE 18.09 19.2 2 113
START 124.7 137.57 2 700
LSTART 1.9 0.44 0.3 2.85

34 SCMS Journal of Indian Management, January-March, 2006.
Published by School of Communication and Management Studies
Lytf fee Roy Fin disp Int Pf comp Age lstart
Lytf 1.00
Fee -0.10 1.00
Roy -0.07 0.15 1.00
Fin -0.04 0.03 -0.01 1.00
Disp -0.07 -0.06 -0.15 0.03 1.00
Int 0.02 0.06 0.23 -0.07 0.26 1.00
Pf -0.31 0.12 -0.30 0.09 0.14 -0.03 1.00
Comp 0.00 0.24 -0.05 -0.05 0.15 0.08 -0.19 1.00
Age 0.68 0.08 -0.26 0.14 -0.03 -0.15 -0.05 0.11 1.00
lstart 0.07 0.31 0.06 0.00 -0.08 0.05 -0.10 0.42 0.31 1.00
Table 3: Correlation Tables of the Independent Variables
Table 4: Key Success Factors of Franchisors in the Retailing Industry
Dependent Variable: Success
R^2 = 66%
Adjusted R^2 = 57%
Prob Value of F = 0.00000
Variable Coefficient Std. Error T-Ratio P-Value
LYTF -0.625 0.200 -3.132 0.003
NT 0.243 0.159 1.526 0.135
PF 0.983 0.296 3.324 0.002
COMP 0.013 0.003 4.130 0.000
AGE 0.023 0.005 4.432 0.000
Control
FEE 0.002 0.007 0.283 0.780
ROYALTIES -0.000 0.035 -0.002 1.000
FINANCING -0.078 0.178 -0.438 0.664
DISPERSION -0.019 0.137 -0.137 0.892
LSTART -0.023 0.169 -0.137 0.892

35 SCMS Journal of Indian Management, January-March, 2006.
Published by School of Communication and Management Studies
The model has an adjusted R-squared of 57 per cent, which
significantly explains the success of the franchisors in the
retail ing sector. the Independent Variables.
The variables, years to franchising, international ization,
propor tion of franchising, company-owned outlets, and
age/experience, exhibit a coefficient consistent with our
hypothes ized re la t ionsh ips . Wi th the except ion of
internationalization all are significant at the p = 0.05 level.
The internationalization variable is mildly significant in the
hypothesized direction. One explanation for the weak
coefficient is that internationalization is often a challenge
fo r f r anch i so r s t ha t d ra i n s resou rces and pu t s t he
franchisors in new competitive environments.
According to our study, franchisors that want to achieve a
higher level of success in terms of growth and scale should
become franchised quickly after opening, internationalize their
system to appeal to a larger global audience, grow the
franchising line of their business, operate a sufficient number
of company-owned stores, and accumulate experience over
time which will help them increase their competitiveness.
Simi lar studies of different industr ies can be useful in
demonstrating the validity of our findings and applicability of
our propositions in other sectors.
References
Alon, Ilan, “Service Franchising: A Global Perspective,” New
York: Springer, 2005.
Alon, Ilan and Dianne Welsh, eds., “International Franchising
in Industrialized Markets: Western and Nor thern
Europe,” Chicago IL: CCH Inc. Publishing, 2003.
Alon, Ilan and Dianne Welsh, eds., “International Franchising
in Emerging Markets: China, India and Other Asian
Countries,” Chicago IL: CCH Inc. Publishing, 2001.
Alon, Ilan, “The Use of Franchising by US-Based Retailers,”
Journal of Small Business Management, 39 (2), 111-
122, 2001.
Alon, I lan, “The International izat ion of U.S. Franchising
Systems,” New York: Garland Publishing, 1999.
Bates, T., “Analysis of Survival Rates Among Franchise andIndependent Small Business Star tups,” Journal ofSmall Business Management, 33 (2), 26-36, 1995.
Block, Z., and MacMillan, I., “Corporate Venturing,” Boston:
Harvard Business School Press, 1993.
Castrogiovanni, G. J., Justis, R . T., and Julian, S. D., “Franchise
Failure Rates: An Assessment of Magnitude andInf luencing Factor ,” Jour na l of Smal l Bus inessManagement, 16, 105-114, 1993.
Combs, James G., and Gary J. Castrogiovanni,“FranchisorStrategy: A Proposed Model and Empirical Test of
Franchise Versus Company Ownership,” Journal ofSmall Business Management, 32 (2), 37-48, 1994.
Combs, James G. and David J. Ketchen, “Can Capital ScarcityHelp Agency Theory Explain Franchising? Revisiting
the Capital,” Academy of Management Journal, 42(2), 196-207, 1999.
Dant, Rajiv P., Audhesh K. Paswan, and Patrick J. Kaufmann,“What We Know About Ownership Redirection in
Franchising: A Meta-Analysis,” Journal of Retailing,72 (4), 429-444, 1996.
Falbe, Cecilia M., Thomas C. Dnadridge, and Ajith Kumar,
“ The E f f ec t o f O rgan i za t iona l Con tex t onEntrepreneurial Strategies in Franchising,” Journal ofBusiness Venturing, 14, 125-140, 1998.
Falbe, Ceci l ia M. and Dianne H. B. Welsh, “NAFTA and
Franchising: A Comparison of Franchisor Perceptionsof Character is t ics Associated with Franchisee
Success and Failure in Canada, Mexico, and theUnited States,” Journal of Business Venturing, 13,
151-171, 1998.
For tune “Trouble in Franchise Nation,” 131 (4), 115-117,
1995.
In ter nat iona l Franch ise Associa t ion, “ I FA Educat iona lFoundation Survey of Franchise owners, Conducted
by the Gal lup Organization, F inds 92 Per centSuccessful, Majority Would Do It Again,” Washington
D.C., 1-2, 1998.

36 SCMS Journal of Indian Management, January-March, 2006.
Published by School of Communication and Management Studies
Mehta, Snajy S., Dawn Luza, Carey Counsil, and BalasundramManiam, “Analysis of Franchising Data: A Comprative
Evaluat ion of Leading Secondary Sources,” inProceedings of the 13th Annual International Societyof Franchising Conference, Miami, (March), 1999.
Sen, Kabir C., “The Use of Franchising as a Growth Strategyby US Restaurant Franchisors,” Journal of ConsumerMarketing, 15 (4) 397-407, 1998.
Shane, Scott A., “Hybrid Organizational Arrangements and TheirImplications for Firm Growth and Survival: A Study ofNew Franchisors,” Academy of Management Journal,39 (1), 216-234, 1996a.
Shane, Scott A . , “Why Franch ise Companies ExpandOverseas,” Journal of Business Venturing, 11 (2), 73-88, 1996b.
S t a n w o r t h , J o h n , D a v i d P u r d y, a n d S t u a r t P r i c e ,“Franchise Growth and Fai lure in the USA andthe UK: A Troubled Dreamworld Revis i ted,” 2(2), 75-94.
We l s h , D i a n n e a n d I l a n A l o n , e d s . , “ I n t e r n a t i o n a lFr anch i s i ng i n I ndus t r i a l i zed Ma r ke t s : Nor thAmer ica , Pac i f i c R im , and Other Deve lopedCount r ies , ” Ch icago I L : CCH Inc . Pub l i sh ing ,2002.

37 SCMS Journal of Indian Management, January-March, 2006.
Published by School of Communication and Management Studies
Models for Attr ibute-BasedConsumer Classi f icat ion:Artificial Neural Networksversus MLR and MDAJose Maria Cubillo-Pinilla and Joaquin Sanchez-Herrera
as a bridge between the biological neural model and the artificialneural model.
In order to establish a direct similitudebetween the biological synopticactivity and artificial neural nets, thefollowing aspects have to be takeninto account: signals which reach thesynopsis are the neurone inputs; theseare pondered (softened andsimplified) through a parameter calledweight, associated to the correspondingsynopses; these input signals canexcite the neurone (synopses withpositive weight) or inhibit it (negativeweight); the effect is the combinationof the pondered inputs; i f the
Dr. Jose Ma r i a Cub i l lo -P i n i l l a , Ass t . P ro fes so r o fInternational Marketing, Polytechnic University ofMadrid, Ctra.de Valencia, km.7, 28031, Madrid-Spain,Email: [email protected]
Dr.Joaquin Sanchez-Her rera, Associate Professorof Marketing, University Complutense of Madrid,Email: [email protected]
The implementation of reliable models for the marketing planning process has been lately of great concern. Though some
of the techniques frequently applied are useful for this purpose, results do not always satisfy marketing executives.
However, research on this field has allowed develop a new technology, which provides higher accuracy than traditional
ones: artificial neural networks (ANN). The present work details the methodological basis of this technique and compares
its classification efficiency with the multiple discriminant analysis (MDA) and the multinomial logit regression (MLR) models.
Artificial Neural Networks.Definition and Conceptual Introduction
he simplest definition describingan ar tificial neural net, and alsothe most widely accepted,
was formulated by Dr. Rober tHecht-Nielsen, the inventor of one ofthe first neural computers. Accordingto that definition, a neural net isunderstood as a computing systemmade up of a number of simpleprocessing units which are greatlyinterconnected and processinformation by means of their dynamicstate of response to external inputs(Caudill, 1998). This definition serves
T

38 SCMS Journal of Indian Management, January-March, 2006.
Published by School of Communication and Management Studies
combination is equal or bigger than the neurone threshold, theneurone is activated, but if it is smaller, there is no activation ofthe neurone. In an artificial neural system, the same as in abiological one, the basic unit is the neurone, also called processelement. Neurones are organised in layers, which can be input,output, or hidden layers, according to their position in the net.
Figure 1 shows the typical structure of an ar tificial neural netwhere an input layer receives external input (I). Though it is not
always like that, this input layer is made up of two processelements or ar tificial neurones. There are also two hiddenlayers (H). In this case they are made up of four neuroneseach, but their usefulness will be explained later. They arecalled hidden layers because they have no direct relationshipwith input or output data. Finally, there is a last output layer(O), which represents the result of the previous processunits. In this case the output layer is represented only by anar tificial neurone.
The main feature of Artificial Neuronal Nets is that they are
systems and, the same as their biological model, they learn astime passes. In neural systems, learning takes place by the
modification of weights in the net. It is in this aspect where the“intelligence” of Neural Nets lies and this is what differentiates
them from other modern computing systems. There are twobasic learning systems which affect the net structure and the
results achieved. The learning system can be either supervisedor non-supervised.
In supervised learning both inputs and outputs of the net areknown beforehand. According to this system the net gets
training by knowing the relationships established between inputand output data. In non-supervised learning only input data
are known. The net, in this case, does not have any models tolearn from. The reply achieved by means of non-supervisedlearning is a certain relationship within input data. Outputsgenerally take place in the form of datasets similar to eachother; this is very much alike to a clustering procedure.
Learning in neural nets is inherent to the training process. As theneural net gets training, its ability to solve problems increases.From this we can deduce that the net needs known inputs andoutputs and gets training from them so as to be able later tomodel phenomena based on that previous learning. There are atleast twelve rules of neural learning though the most widelyused is the Generalised Delta Rule. The delta rule is a centralfunction within the nets. This rule uses back propagation; anabbreviation for back propagation neural network of error(BPNN), and it allows find a point where the error is minimum.
The same as for other scientific disciplines, neural error isunderstood as the difference between the desired value andthe obtained value,
odi λλδ −= where:
= the resulting difference
= the desired value
= the obtained value
Figure 1
Simulated NN Structure
I
I
H
H
H
H
H
H
H
H
O
i d o
i
d
o

39 SCMS Journal of Indian Management, January-March, 2006.
Published by School of Communication and Management Studies
Nets with back propagation adjust weights until they find theminimum possible error. The result obtained is compared withthe result desired and the error or difference between them iscalculated. This error signal spreads backwards from the outputlayer. The intermediate or hidden units receive however a fractionof that error, which corresponds to their contribution to the output.
This process is repeated layer after layer until all neurones gettheir relative portion of contribution to the total output error.Based on the calculation of the received error, the connectionweights of each neurone are updated making them convergetowards the minimum possible error. In this way the neural netlearns and adapts itself in order to reach a satisfactory solutionto the set up problem (Freeman, Skapura 1993).
2. Marketing and Artificial Neural Nets
The applications of Artificial Neural Nets to business in generaland to marketing in par ticular have been really scarce up tonow. Their most direct application is related to economy ands tock exchange marke t p red ic t ions , where neu ra larchitectures have been more successful than any othertechnique.
In the field of marketing the possibilities of this new tool arecountless, though for the strategic procedure the most valuableapplications may be:
a) Consumer Research
b) Segmentation and classification
c) Demand forecasting
d) Advertising response models
e) Price modelling, etc.
All application fields mentioned can nowadays be assessed by
means of traditional statistic techniques. Regression techniques
can be used for modelling the behaviour of a segment; it is
possible to find the relationship between some variables by
means of a causal analysis; it is also possible to make predictions
from temporal series by means of the ARIMA or Box Jenkins and
the spectral analysis; in the same way some help elements can
be found in the design and launching of goods with conjoint
analysis. However, the ANN can solve problems with a
non-lineal structure, highly complex data situations, and
without any previous knowledge of the exact form of the model
to be followed.
ANN applications for marketing issues are increasingly
frequent, though scarcely used within the academic field.
Table 1 shows some of the most interesting contributions to
this area.
Table 1
Marketing Research and Neural Nets
Article Title Author Publication Year Findings
An Artificial Neural NetAttraction Harald Schmalenbach Jan.Business Review: ZFBF Hruschka Business 2001Model to analize market share Review: ZFBFeffects of marketing instruments.
Data mining and modeling James J. Direct Sep.as a marketing activity Vanecko, Marketing 1999
Andrew WRusso
For store-level data, neural net models perform betterand imply a price response that is qualitativelydifferent from the well-known multinomial logitattraction model. Price elasticities of neural netattraction models also lead to specific managerialimplications in termsof optimal prices
What the data mining and modeling activity includesis illustrated and set in that high performance contextvia process schematics and a scenario description.Although there are many statistical modelingtechniques, for marketing purposes two primarytechniques are commonly utilized: regression andtree models. A third technique, neural nets, has recentlybecome more widely used.

40 SCMS Journal of Indian Management, January-March, 2006.
Published by School of Communication and Management Studies
Comparing performance of feed Hruschka, European Apr.forward neural nets and Research Harald, Journal of 1999K-means for cluster-based market Natter, Operationalsegmentation. Martin
Article Title Author Publication Year Findings
Neural net analysis ferrets out David C Marketing Oct.‘totally satisfied’ customers. Foster News 1997
Applying neural computing to Zahavi, Journal of Aug.target marketing. Jacob, Interactive 1997
Levin, Marketing.Nissan.
Prediction of customer segments Kvaal, Marketing Nov.with neural nets. Knut, and 1996
Djupvik, ResearchHarald Today.
The performance of a specifically designed feed forwardartificial neural network with one layer of hidden units iscompared to the K-means clustering technique in solvingthe problem of cluster-based market segmentation.Classification of respondents on the basis of external criteriais better for the neural network solution.
Several industry and private studies indicate that the numberof customers who repurchase is 3-10 times greater for the“totally satisfied” than for the “somewhat satisfied” groups.Neural network analysis can be used for a number of action-oriented purposes, including: 1. impact rankings, 2. what-ifscenarios, 3. survey upgrading, and 4. added decision support.
The study explores the feasibility of using neural computingas a means for targeting audiences for promotion throughthe mail, from among a list of customers in a database eitheras an alternative and/or as a supplement to discrete-choicelogistic regression models.
It is shown that, at least for the data used in this study, the fitachieved for both methods is approximately the same, butthe process of configuring and setting up a neural networkfor a database marketing application is not straightforwardand may require extensive experimentation and computerresources. The results are therefore not encouraging for theneural net approach.
The article shows the importance of being able to categorizethe customers into segments in order to handle them morecomprehensively, and to monitor the transitions of customersbetween different segments over time. The neural netsegmentation model used classifies the customers basedon their preference profiles on some chosen attributes.
One of the most difficult things about using qualitative data iswading through the masses of text produced. Artificial neuralnetworks (ANN) promise to aid research in reducing thecomplexity of text data cost-effectively. It appears that theunsupervised type of ANN holds the greatest potential formarket research applications.
There is an increasing focus on the benefits believed to awaitthe researcher with a large enough data set and sufficientcomputing power, particularly in fast moving consumergoods (FMCG) companies. The problems of matchingcomplex models to vast, complex and incomplete data setsmeans that such approaches will take some time to becomeaccepted as tools for marketing modeling.
Neural networks seem to offer an alternative paradigm for themodeling of complex dynamic data sets.
The neural network does not know what it is doing or why itmay be successful, and the user of a neural network is unlikelyto know or understand why either. That is a truer reflection thanthe misplaced confidence in over-simplistic linear models.
Using neural nets to analyze Moore, Marketing Win.qualitative data. Karl, Research 1995
Burbach,Robert,Heeler,Roger
Modelling methodology: Freeman, Market Jan.Basics to neural, nets - A return Paul Research 1994to ignorance? Rennolls, Society.
Keith Journal ofthe MarketResearchSociety.

41 SCMS Journal of Indian Management, January-March, 2006.
Published by School of Communication and Management Studies
3. Models for Attribute-Based Consumer Classification: ArtificialNeural Networks, Multinomial Logit Regression and MultipleDiscriminant Analysis Applied to the Spanish Video GameConsole Market.
In order to reinforce the conceptual content of previousparagraphs and show the usefulness of Artificial Neural Nets for
the marketing field, the attribute-based consumer classificationmodel selected will serve as a practical comparative frame.
3.1. Data
In order to carry out a comparative study, we selected 150
current users of the three most impor tant video-consolebrands: Sony Play station 2, Nintendo Game Cube, and
Microsoft Xbox. Users propor tion for each of the threeconsole brands was calculated according to the market
pa r t i c ipa t ion o f t he b r ands . Tab le 2 shows t heserelationships:
Table 2Sample Distribution by Brand
Frquency Sony Playstation 43
Microsoft Xbox 33
Nintendo Game Cube 42
Total 118
% Sony Playstation 36.4
Microsoft Xbox 28.0
Nintendo Game Cube 35.6
Total 1 00.0
Individuals selected answered a questionnaire of seven itemsmeasured by a Likert scale of seven points. Items included werethe following: ‘technical quality,’ ‘videogames quantity,’‘videogames quality,’ ‘games are easy to find’ (distribution),‘price,’ ‘accessories’ and ‘popularity ’ (market penetration).Reasons supporting this data structure were the following:
a) Since this market is l imited to three brands, usershad prev ious re la t i ve in format ion about thestructure of benefits expected and the featuresrelated to each brand.
b) This is a high implication product due to its longstay in the market (mean=5 years) and to thecost of consoles and games. Consequently, thedecis ion-making process involves a thoroughsearch and evaluat ion of informat ion avai lable.
c) However, our purpose is to assess the relationshipbetween the customer f inal decis ion and hisperception about consoles available in the market. Thismakes the analysis more technically complex since not
lineal relationships may generate between attributesand the brand selected, as well as impurities derivingfrom the characteristics of individual perception.
After the collection, selection, coding, and loading of data, 118individuals with valid responses to the questionnaire wereanalysed using MLR, MDA, and ANN in order to compare theclassification efficiency of each of the three methods.
3.2. Results
First, data were analysed by MLR using each of the three brandsas dependent variable and the seven items corresponding tothe relevant features of the market as independent variables.
For the MLR model, ijp probability for j category from
i
subsample was:
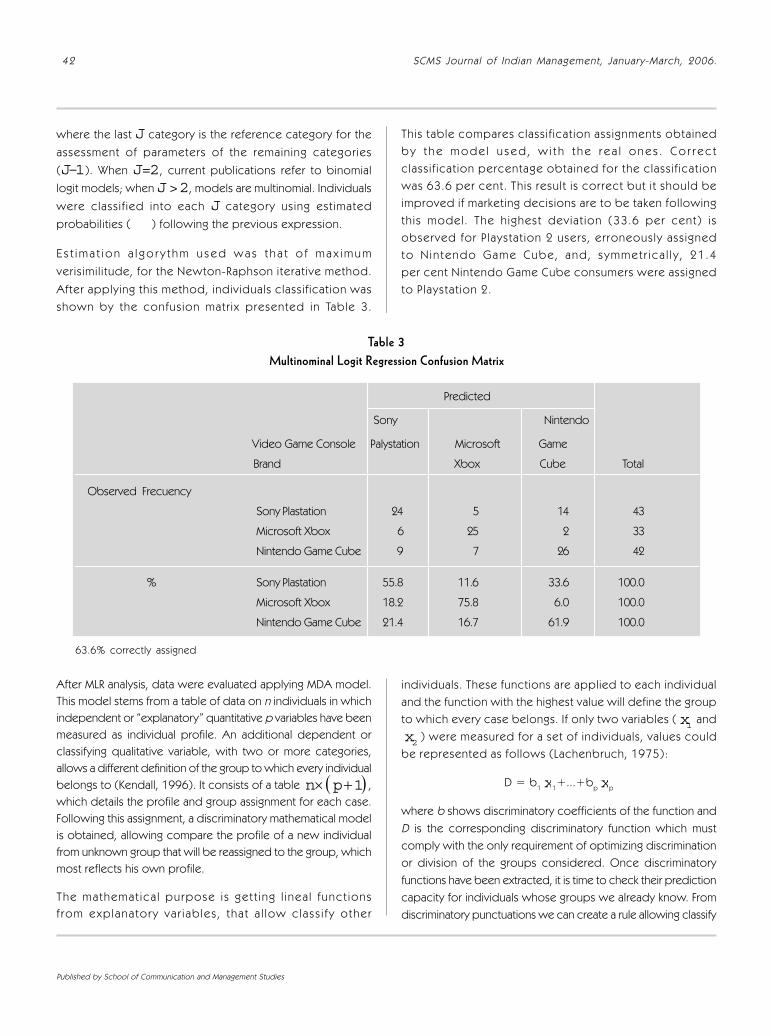
42 SCMS Journal of Indian Management, January-March, 2006.
Published by School of Communication and Management Studies
where the last J category is the reference category for theassessment of parameters of the remaining categories
(J–1). When J=2, current publications refer to binomiallogit models; when J > 2, models are multinomial. Individuals
were classi f ied into each J category using est imatedprobabilities ( ) following the previous expression.
E s t i m a t i o n a l g o r y t h m u s e d w a s t h a t o f m a x i m u mverisimil i tude, for the Newton-Raphson iterative method.
After applying this method, individuals classif ication wasshown by the confus ion matr ix presented in Table 3.
This table compares classi f icat ion assignments obtainedb y t h e m o d e l u s e d , w i t h t h e r e a l o n e s . C o r r e c tclass i f icat ion percentage obtained for the class i f icat ionwas 63.6 per cent. This result is correct but i t should beimproved if marketing decisions are to be taken followingth is model . The h ighest deviat ion (33.6 per cent) isobserved for P laystat ion 2 users, erroneously ass ignedto N in tendo Game Cube , and , symmet r i ca l l y , 21 .4per cent Nintendo Game Cube consumers were assignedto Playstat ion 2.
After MLR analysis, data were evaluated applying MDA model.This model stems from a table of data on n individuals in whichindependent or “explanatory” quantitative p variables have beenmeasured as individual profile. An additional dependent orclassifying qualitative variable, with two or more categories,allows a different definition of the group to which every individualbelongs to (Kendall, 1996). It consists of a table ( )1+× pn ,which details the profile and group assignment for each case.Following this assignment, a discriminatory mathematical modelis obtained, allowing compare the profile of a new individualfrom unknown group that will be reassigned to the group, whichmost reflects his own profile.
The mathemat ica l purpose i s get t ing l i nea l funct ionsf rom exp lana tory va r i ab les , tha t a l low c lass i f y o ther
individuals. These functions are applied to each individualand the function with the highest value will define the groupto which every case belongs. If only two variables (
1x and
2x ) were measured for a set of individuals, values couldbe represented as follows (Lachenbruch, 1975):
D = b1 x1+...+bp 1xp
where b shows discriminatory coefficients of the function andD is the corresponding discriminatory function which mustcomply with the only requirement of optimizing discriminationor division of the groups considered. Once discriminatoryfunctions have been extracted, it is time to check their predictioncapacity for individuals whose groups we already know. Fromdiscriminatory punctuations we can create a rule allowing classify
Table 3Multinominal Logit Regression Confusion Matrix
Predicted
Sony Nintendo
Video Game Console Palystation Microsoft Game
Brand Xbox Cube Total
Observed Frecuency
Sony Plastation 24 5 14 43
Microsoft Xbox 6 25 2 33
Nintendo Game Cube 9 7 26 42
% Sony Plastation 55.8 11.6 33.6 100.0
Microsoft Xbox 18.2 75.8 6.0 100.0
Nintendo Game Cube 21.4 16.7 61.9 100.0
63.6% correctly assigned

43 SCMS Journal of Indian Management, January-March, 2006.
Published by School of Communication and Management Studies
individuals into each of the three video-console brands. Bayestheorem is the most common assignment method for this stageof the analysis. The probability of any i individual, with d
i1, d
i2,
..., dic discriminatory punctuations, belonging to group j, is
represented as:
( ) ( ) ( )( ) ( )∑
=
=k
jjj
jj
j
GPGDP
GPGDPDGP
1
where:
( )jGP = a priori probability of belonging to group j.
( )jGDP = probabil i ty for his discr iminatory
punctuations of being di1, d
i2, ..., d
ic ,supposing theindividual belongs to group j
The individual will be correctly classified if:
P(Gj/D)=max{P(G
1/D), ..., P(G
k/D)}
The ef f ic iency of the discr iminatory funct ion can be
assessed according to the percentage of cases that werecor rec t l y ass igned. Tab le 4 shows f i nd ings fo r the
classification performed.
Table 4
Discriminant Analysis Confusion Matrix
Predicted
Sony Nintendo
Video Game Console Brand Palystation Microsoft Xbox Game Cube Total
Observed Frecuency
Sony Plastation 23 5 15 43
Microsoft Xbox 5 26 2 33
Nintendo Game Cube 9 8 25 42
% Sony Plastation 53.4 11.6 34.8 100.0
Microsoft Xbox 15.1 78.7 6.0 100.0
Nintendo Game Cube 21.4 19.0 59.5 100.0
62.7% correctly assigned.
The table detai ls the three original groups (Xbox, PS2,Game Cube); the diagonal in th is table indicates theabsolute and relat ive values for cases correctly assigned(62.7 per cent) . S imi lar ly to MLR model , the h ighestclassification errors were found for Playstation 2 and GameCube consumers.
The model was checked using ANN, with the neuronal typologyshown in Figure 2. It consists of a first entry layer with sevenneurones corresponding to the seven items previouslydescribed. Then, a two hidden layers structure was selected,
the first layer with seven process elements or neurones, and thesecond with only three. We selected this structure because itpresented low error values. Though genetic algorythmswere used in order to find the optimum ANN structure,none of the typologies suggested by these algorythmsshowed lower error values than the structure presentedhere. Fur thermore, sigmoid transfer function was used for thetwo hidden layers. The exit layer comprised three neurones,representing the three video-console brands for the caseselected.
j = 1, ..., k
D = (di1, ..., d
is, ..., d
ic)
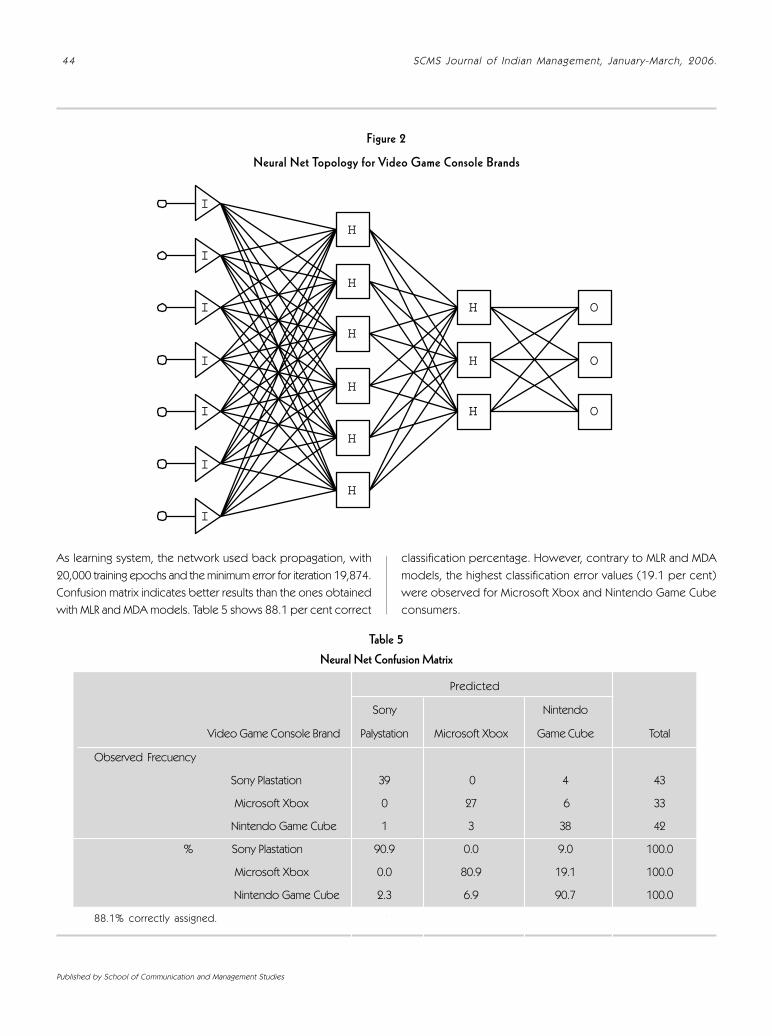
44 SCMS Journal of Indian Management, January-March, 2006.
Published by School of Communication and Management Studies
Figure 2
Neural Net Topology for Video Game Console Brands
I
I
I
I
I
I
I
H
H
H
H
H
H
H
H
H
O
O
O
classification percentage. However, contrary to MLR and MDAmodels, the highest classification error values (19.1 per cent)were observed for Microsoft Xbox and Nintendo Game Cubeconsumers.
As learning system, the network used back propagation, with20,000 training epochs and the minimum error for iteration 19,874.Confusion matrix indicates better results than the ones obtainedwith MLR and MDA models. Table 5 shows 88.1 per cent correct
Table 5Neural Net Confusion Matrix
Predicted
Sony Nintendo
Video Game Console Brand Palystation Microsoft Xbox Game Cube Total
Observed Frecuency
Sony Plastation 39 0 4 43
Microsoft Xbox 0 27 6 33
Nintendo Game Cube 1 3 38 42
% Sony Plastation 90.9 0.0 9.0 100.0
Microsoft Xbox 0.0 80.9 19.1 100.0
Nintendo Game Cube 2.3 6.9 90.7 100.0
88.1% correctly assigned.

45 SCMS Journal of Indian Management, January-March, 2006.
Published by School of Communication and Management Studies
4. Conclusions
The ana lys is of consumers´ character i s t ics and the i rrelationship with purchase behaviour is essential for theplanning of any marketing strategy. Never theless, since mostdata to be analysed derive from perception processes, usualstatistic techniques are not always suitable.
The analysis of the Spanish video-consoles market hasrevealed the existence of a more efficient technology,though its applications are st i l l scarce. Global correctclassification percentage for consumer ’s classification was63.6 per cent for MLR model, 62.7 per cent for MDA model,and 88.1 per cent for ANN model. However, the internalcomplexity of ANN brings some difficulty to the analysis ofdata. This fact makes the model very efficient for predictionstudies but not so explanatory as traditional techniques.
Fur ther research wi l l be necessar y in order that ANNpred ic t ion capac i t y can i nc lude the poss ib i l i t y o finterpretation and direct translation to marketing.
Bibliography
Alber tini F., Sontag E.D., “For neural networks, functiondetermines form,” Neural Networks 6, 975-990, 1992.
Alonso, J . , “E l compor tamiento del Consumidor, Unaaproximación teórica con estudios empíricos,” InstitutoNacional de Consumo, 1984.
Angeline P. J., Saunders G. M., and Pollack, J. P., “An evolutionaryalgorithm that constructs recurrent neural networks,”IEEE Transactions on Neural Networks, 5(1): 54-65,1994.
Baldi, P. and Pineda, F., “Contrastive learning and neural oscillator,”Neural Computation, 3:526-545, 1991.
Bauer, R. A., “Consumer Behaviour as Risk Taking. In Risk Takingand information Handling in Consumer Behaviour,” ed.Donald F. Cox. Boston: Harvard Business School,Division of Research, 1967.
Bengio, Y., “Markovian models for sequential data,” NeuralComputing Surveys, 2:129-162, 1999.
Bettman, J. R., “The structure of consumer choice process,”Journal of Marketing Research, Vol. 8., 465-471.November, 1971.
Caudill, M., “Neural Network Primer: Part I,” AI Expert, California,1989.
Hair, J.F.; Aderson, R.E.; Tatham, R.L.Y. Black, W., “ MultivariateData Analysis,” 4ª edición, Englewood Cliffs: PrenticeHall, 1995.
Lilien, G. L. y Kotler, P., “Toma de decisiones en mercadotecnia,”Un enfoque a la construcción de modelos, EditorialCecsa, México, 1990.
Moreau Y., Vandewalle J., “Approximation of Dynamical Systemsby Compositions,” Mathematical Theory of Networksand Systems, 96, St-Louis, MO, June 24-28, 1996.
Murray, J., “Experiences of Neural Networks in Practice,” Journalof Targeting, Measurement and Analysis for Marketing,Vol II, No.1, 1993.
Neelameghan, R.Y. Jan, D., “Consumer Choice Process forExperience Goods: An Econometric Model andAnalysis,” Journal of Marketing Research, Vol. XXXVI(August), 373-386, 1999.
Newell, A.; Seaw, J. C., Y Simon, H. A., “Elements of a theory ofhuman problem solving,” Psychological Review, 65,151-166, 1958.
Ortega, J.M. and Rheinboldt, W.C., “Iterative Solution of Non-linear Equations in Several Variables and Systems,”Academic Press, New York: 1970.
Pearson D.W., “Output zeroing within a Hopfield network, in ArtificialNeural nets and Genetic algorithms,” Albrecht R.F., ReevesC.R. and Steele N.C. eds., Springer-Verlag, 1993.
Pearson D.W., “Hopfield Networks and symmetry groups,”Neurocomputing 9, 305-314, 1995.
Rao, V. R., y Darius J. S., “Some Issues in the Construction ofModels for Marketing Decisions,” en Research inMarketing, Vol. 4, ed. J. Sheth, 251-272. Greenwich,Conn.: Jai Press, 1981.
Verbeek, E., “Prejuicios y realidades sobre redes neuronales,”Investigación y Marketing, No. 56, 1997.
Vries, B and Principe, J. C., “A theory for neural networks withtime delays, In R . P. Lippmann, J. E. Moody, and D. S.Touretzky, editors,” Advances in Neural InformationProcessing Systems 3, pages 162-168. San Mateo,CA: Morgan Kaufmann, 1991.
Werbos P.J. , “General izat ion of back propagation withapplication to a recurrent gas market model,” NeuralNetworks, 1, 1988.
Zbikowski R., “Lie Algebra of Recurrent Neural Networks andIdentifiability,” Proceedings of the American ControlConference ACC 93, San Francisco, CA, June 2-4, 1993.

46 SCMS Journal of Indian Management, January-March, 2006.
Published by School of Communication and Management Studies
Corporate PerformanceManagement: An InnovativeStrategic Solutionfor Global Competitiveness
M r. K . G . S a n k a r a n a r a y a n a n , L e c t u r e r,Depa r tment of Commerce, NZ Col lege,Goa.
M r. B a b u P. G e o r g e , L e c t u r e r, S c h o o l o fM a n a g e m e n t , P o n d i c h e r r y U n i v e r s i t y ,P o n d i c h e r r y , India - 6 0 5 0 1 4 , E m a i l :g e o r g e b a b u @ i n d i a t i m e s . c o m
The present paper attempts to weave together the piecemeal writ ings about a s ignif icant innovationin the management of corporate performance, namely, CPM or Corporate Performance Management,an umbrel la term that describes the methodologies, processes, systems, and matr ices used to managethe performance of an enterprise. A typical CPM suit br ings together the capabi l i t ies existed with i tspredecessor technologies to produce a superior outcome that is far more than the sum of what theprevious technologies could do independent ly. The paper takes the readers through the histor icaldevelopment of CPM, i ts costs and benefits, and the nuances involved in i ts implementat ion. A fewreal l i fe examples on CPM implementat ion are also provided at the end of the paper.
Introduction: Making Sense of CPM
n ever-increasing uncertaintyand chaos in the businesse n v i r o n m e n t m a k e
enterpr ises to look towardsinvestments that wi l l keep themcompetitive by trimming costs andmaximizing the benefits of availableresources. Corporate PerformanceManagement (CPM), alternat ivelyknown as Bus iness PerformanceManagement (BPM) or EnterprisePerformance Management (EPM), is anumbrella term that describes themethodologies, processes, systems,and matrices used to monitor and
manage the business performance ofan enterprise, according to Gartner,the research and advisory firm thatinitially coined the term in 2001 (SeeGeishecker, 2002; Genovese andHayward, 2003). It is an approach thata ims to ensure ef f ic iency andeffectiveness in strategy execution bybringing in organized and integratedimprovements in the managementprocesses at all levels (Webber, 2003).It helps businesses discover efficientuse of their business units and financial,human, and material resources. Itprovides the much-requiredtransparency into the systems andprocesses of the organization and
K.G.Sankaranarayanan and Babu P. George
A
47 SCMS Journal of Indian Management, January-March, 2006.
Published by School of Communication and Management Studies
helps businesses to demonstrate accountability and compliance.Note that predictable and controllable corporate performance aswell as the demonstration of its ethical roots is of utmostimportance given the increased regulatory and investor pressures.
CPM is an integrated package whose usage spans acrossbusiness planning, financial analysis, and the needs of functionalareas like marketing, personnel, and operations (Williams andWilliams, 2004). Thus, for enterprises to make the best use of it,they must take a holistic view, making CPM a part of every segmentof their businesses. A typical CPM suite contains software tohelp plan initiatives, track progress, and analyze the results. Thesoftware consolidates data from various sources, analyzes thedata, and significantly aids in managerial decision-making andplan execution (Moncla and Arents-Gregory, 2003). By now,CPM solutions and expertise have become greatly intricate andhave been fine-tuned to the specific nuances of differentindustries.
One easy way to understand more about CPM is to describewhat is not. CPM isn’t simply business intelligence (BI). It is nota tool implemented in a single department that analyses data.Nor is it deployed reactively based on outside events. Moreover, it does not merely focus on history. Instead, CPM is thereal-world insight delivered across a suite of applications withembedded business processes that essentially sits on top ofthe reporting foundation that BI creates. It is an enterprise-widetool that is used to offer reports and analysis and also to integratethat data with planning, budget ing, forecast ing, andconsolidating. And, rather than a tool used just to analyze history,CPM is most valuable for its ability to help businesses look to thefuture and plan appropriate actions. A CPM solution, if properlydeployed and used, can help users regain control over theirbusinesses, increase their organizational credibility and removebarriers throughout the enterprise. Being more sophisticatedthan the currently employed scorecards and executivedashboard products, CPM enables managers to get an upperhand on their business understanding, to use this understandingin making real collaboration across the enterprise a reality and toconfidently respond to the changes and trends that are takingplace in the environment (Moncla and Arents-Gregory, 2003).
With all the data at its reach collected and analyzed, enterprisesachieve a whole new method for risk mitigation or moreaccurately, r isk avoidance. CPM offers actual businessperformance assessment so that users can better understandwhere and when their business is at risk as well as when to
avoid potentially dicey situations. For example, the intelligenceprovided by a CPM suite can help managers to understand theprobability of impact upon production should a supplier shutdown, and allow them to factor that scenario and contingencyoperations into forecasting plans. No wonder, CPM is touted asthe next generation of Business Intelligence (Grigoria, et al.,2004).
Global competition and the economic uncertainty are all workingto squeeze margins for almost any business. As a result,organizations are increasingly looking to make investments inthose areas that will help them trim process costs in the future.The benefits offered by CPM are crucial for many types ofbusinesses in today’s increasingly competitive economy. Agrowing number of organizations are realizing that CPM is justthe right tool to help them accomplish the required level ofprocess cost competitiveness.
The CPM Evolution
The evolution of CPM can be traced somewhat parallel to that ofcomputer and communication technologies (Baltaxe and VanDecker, 2003).
● In the 1970s, Decision Support Systems provided away for organizations to model their futures. Usingmainframe-based multidimensional technologies,finance departments and operations research groupscould analyze and plan by distribution channel,customer, product line, and more, giving them thecapability to spot and exploit gaps in the market.
● In the 1980s, Executive Information Systems (EIS)provided CEOs and their executive teams withtechnology that could be used to invest igateorganizational strengths and weaknesses, withouthaving to get assistance from programmers.
● In the 1990s, the pace of businesses accelerateddramatically. Business Intelligence (BI) became the keyto speeding up the processes of planning, reporting,and analysis. Alongside, Enterprise Resource Planning(ERP) systems became a tool every company just hadto have.
● Almost at the same time, the increasing availability ofPCs with online connectivity resulted in the proliferationof end-user systems that could analyze complexdatabases distributed across functional, industry, andcommunity boundaries.

48 SCMS Journal of Indian Management, January-March, 2006.
Published by School of Communication and Management Studies
● The latter half of the 1990’s was an ‘awareness era.’More than the technological innovations that wereoccurring, which were definitely significant, this era isnoted for an increasing awareness that technology byitself wasn’t the answer. Although technologies haveresulted in the availability of more information, that toofaster, none of these technologies had beenpar ticularly helpful to senior managers who stillstruggled to find ways to enable better strategicexecution. It is certainly not enough to have thetechnological infrastructure to run a business. The rightcombination of technological assets is more importantin delivering results. What is required is something thatis hierarchically superior that can realign the disparatetechnological solutions available to solve functionalproblems under a common super-system theoutcome of which will be an all-encompassingsolution. Such a solution achieves more than what ispossible with the linear sum total of those discreettechnologies that are the building blocks of the super-system.
● This line of thought led to a renewed focus on howto better implement strategy and many books andar ticles were published by the end of 1990’s onnew management methodologies (Neely, Adams,and Kennerley, 2002); the Balance Scorecard (BSC)being perhaps the best known (Kaplan and Norton,1996). The BSC emphasized that organizations mustplan and monitor all aspects of their business andnot just financial outcomes. This included customerretent ion, internal process eff ic iency, internallearning, and growth. Specialized solutions likeCustomer Relationship Management (CRM) systemsalso geared in to the business landscape (Shaw,1999).
Role of CPM in Bridging the Strategic Gap
While the aforesaid methodologies and their suppor tingtechnologies were good in themselves, they were not able toprovide a comprehensive answer. It is only when the positive sidesof these different methodologies are combined with managementprocesses (e.g., budgeting, forecasting, management reporting)to plan and measure the right things, supported by technology,can organizations really start to influence the implementation ofstrategy, which is where CPM pitches in.
The gap between strategy and execution is something thatworries many experts even now. It is shocking to learn that onan average only one tenth of the formulated strategies aresuccessfully executed even while a large number of investorsand analysts are of the opinion that execution is more importantthan strategy itself (Davenport, 1993). This occurs largely due tothe lack of alignment among measures, processes, people, andtechnology. Many organizations are happy with quantifiablefinancial measures while more impor tant others, includingmeasures of intangible properties, are gravely neglected (Rucci,Kirn, and Quinn, 1998). While CPM is built to identify andmeasure the right things rightly, it does not exaggerate metricvariables at the cost of more intangible ones. This avoidsmanagement processes from being skewed unduly towardsquantifiable, financial measures.
Thus, CPM combines different methodologies with managementprocesses, enabling organizations to actively influence at all theintermediate levels involved in strategizing. The earlier solutions,at the most loosely and often unreliably, connected the systemsand processes that were used to generate budgets and targets.One of the major drawbacks of the traditional scorecard systemswas a judgmental problem that occurred when the metricstargeted in a plan did not match the metrics employed to examinewhether the plan was successfully executed (Dinesh andPalmer, 1998). CPM successfully overcomes this by providing aflow-path for the initial plan metrics to smoothly transfer intosystems for monitoring progress and judging final results.
Every business will have certain critical success factors, whetherthey are about sales, finance, inventory, deliveries, product quality,service, or customer retention, that must be monitored and adjustedrapidly to meet company goals (Kaplan and Norton, 1992). Theincreasing pace of business activity means business leaders at alllevels must evaluate performance metrics in terms of these criticalsuccess factors, much more frequently than ever before. Timelyinformation about increased product demand or poordelivery service levels enables decision makers to respondfast with increased production or higher staffing levels. Theneed for a new marketing campaign tomorrow may dependon what happened in sales earlier this week. The value of anorder from a suppl ier may change from hour to hourdepend ing on one ’ s own inven to ry and nea r - te rmpro jec t ions ( B runne r e t a l . , 1999) . F re sh bus i nes sperformance data is a goldmine for companies that mustturn on a dime (Creelmann, 1998).

49 SCMS Journal of Indian Management, January-March, 2006.
Published by School of Communication and Management Studies
In addition, many CPM solutions are equipped with technologiesthat can chart ‘what if ’ scenarios from which users can betterunderstand where and when their businesses are at risk, whatare the opportunities that match the organizational capabilities,and when to exploit them. The feedback looping technologiesbehind CPM permit the revolutionary option of continuousimprovements in plans based on current data, before whichonly discreet plan alternations were possible, say, annually. Thus,through CPM solutions, users gain a great deal of control overtheir businesses, increase their organizational credibility, anddo away with frictional barriers existing throughout the enterprise.This new approach goes far beyond the traditional definitionsof management control that were historical, reactive, and adhoc.
CPM Dashboards and Data Integration
With the revolutionary growth of diversified technological bases,facilitating data integration and interoperability have become a hugechallenge (Bruckner, List, and Schiefer, 2002). Data integration isnecessitated because of the different types of data, differenttechnology infrastructure, different locations, different administrativeownership, different data structures, and different data semanticsthat forces organizations to make suboptimal decisions (Linthicum,2000). Dashboards built into a CPM suite overcome the problem ofdata integration barrier to a large extent by creating one data catalogfrom which access to any data will be made available (note that datawould have been pre-processed to meet dashboard platformrequirements). In brief, CPM Dashboards perform the followingfunctions, inter alia:
● Integrate data f rom mult iple, dist r ibuted,heterogeneous data sources to supplyinformation to dashboards.
● Pull data directly from distributed data sources,protect production databases, and avoid creatingcostly data marts.
● Reduce integration cost, data management cost,and development time and effort for dashboardprojects.
● Make fresher data available for decision makingacross the enterprise.
● Deploy scalable, service-oriented data integrationarchitecture to get more from investments in data,integration, and tools.
CPM and Key Performance Indicators (KPIs)
The soul of CPM is the pruned out set of a manageable numberof Key Performance Indicators (KPIs) that measure the overallhealth of an enterprise (Rowley, Mostowfi, and Lees, 2002). It isnot only that performance happens somehow, but also the sameis to be known to the management for further action. Performancemeasurement is a field to which companies have placed a lot ofattention recently (Ahmad and Dhafr, 2002). KPI functionality ofa CPM suite ensures that individuals at all hierarchical levels aremarching in step to the same collaborative, coordinated, andstandardized goals. Among other things, KPIs are of immenseaid to the human resource management function as they help tooptimize reward schemes according to individual’s ability toimplement action plans that meet strategic goals.
A KPI is a measure or metric that is included in a CPM suitebecause its measurement drives performance achievement. KPIsare quantifiable matrices (but, not every quantifiable performanceindicator matrix is a KPI) that reflect the performance of anorganization in achieving its goals and objectives. Individualmeasures in any KPI set may measure variables like throughouttime, customer satisfaction, product/service quality, employeemorale, etc. At a higher level, these individual measures can bemade to do things that each of them could not have doneindependently of each other (Cleveland, 1996). The success ofany performance management program is thus contingent upon selecting the correct KPIs. Not only that, the selection ofwrong KPIs can result in counterproductive behaviour andsuboptimal results. For selecting the right set of KPIs, mostimportantly, the decision authority should have an understandingof the required individual performance measures, the set ofperformance measures as a whole, and the relation that shouldexist between the performance measurement system and theenvironment. Answers to the following questions could structureone’s thoughts about the KPI selection decision (See Neely,
Gregory, and Platts, 1996):
• What is to be measured?
• How many metrics should I have?
• How often should I measure?
• Who should be accountable for the metric?
• How complex should the metric be?
• How do I normalize the metric?
• What should be my benchmark?
• How do I ensure the metrics reflect strategic drivers?

50 SCMS Journal of Indian Management, January-March, 2006.
Published by School of Communication and Management Studies
In fact, these answers are critical in choosing the correct KPIssuiting particular organizational contexts. Note that, since KPIsform the most significant building blocks of a CPM suite, lotmany of the post CPM implementation problems can definitelybe avoided if proper care is exerted at the time of selectingKPIs.
Steps in CPM Implementation
The implementation of CPM is easier said than done. Often,problems surface even at the beginning, mostly in the form of apolitical process (Spangenberg, 1994). It is to be justified fromthe point of view of return of investment and has to necessarilywin a face-off against other competing projects such as CRM.The senior level management in the organization may ultimatelygive the green signal to star t small and go incrementally.Fortunately this is possible, technically as well. At times, therewill already be in place in the organization a set of CPMcomponents, because many parts of CPM are built on existingideas that have already become the backbones of existingsystems.
The first vital step in CPM implementation is to have a pool oftechnology suppliers who could provide the requisite hardware,software, and constant service assistance. It is important to selecttechnologies that could be easily updated and upgraded. Thevalue derivable out of a particular CPM solution is greatlycontingent upon the KPI items chosen; the dilemma is inchoosing 15 to 20 necessary KPI items from hundreds of metricsincluded in the whole package. The help of a consultant may besought to evaluate the existing systems and procedures and tocompile the list of requirements. A single area of the businesscould be identified to start with, and to reduce the potential riskfactor involved. The next important task is to recognize the typeof CPM users in the organization; say, whether they use it forstrategic, tactical, or operational purposes. This is so becausethe system requirements and their usages are expected to bedifferent for each of these users. The strategic user may beinterested to know what would happen if the company got intoa new international market, a tactical user about the budgetaryallocation for the next period, and an operational user about thecurrent inventory status.
Since technology diffusion takes place in a socio-technicalsystem and the applicability of any technological frameworkdepends largely on its fit with the organizational culture, trainingfor cultural adaptation is extremely important for the technology
to be acceptable in the organization. Training can be impartedthrough formal sessions, but legitimacy for the new system ishard to permeate unless a critical mass of favourable opinionleadership is forthcoming, and suitable social engineering is tobe under taken to generate this favourable voice amongrespectable members of the organization. If this much is donewithout much failure as part of CPM implementation within asingle business unit, the entire steps can be star ted over withthe remaining areas such that, ultimately, all the business unitsand their processes are tied together under the ambit of CPM.Note that it is unreasonable to expect the best results from CPMwhen it is introduced in only one or two units.
Many enterprises have begun to learn the potential offered byCPM, both the big and the mid-market ones. There are custompacked CPM solutions at low costs available to the specificneeds of different types of organizations. Some of the CPMsoftware vendors readily visible in the market are HyperionSolutions (www.hyperion.com), Cognos (www.cognos.com),SAP (www.sap.com), PeopleSoft (www.peoplesoft.com),Infosys (www.infosys.com), and SAS Institute (www.sas.com).Reputed organizations like Infosys have not only developedCPM packages, but also implemented the same in their ownorganizations. This helped them to streamline friction-freeinformation flow in all directions and across all levels in theorganization. Infosys moved from 400 to 30 metrics that aredirectly linked to their strategic objectives and performancesalong these metrics are being constantly reviewed by their seniormanagement to manage corporate performance. According toInfosys, these initiatives resulted in 65 per cent reduction incycle time for budgeting, 40 per cent reduction in planningcycle times, freeing up 20 per cent of senior management timethat was previously spent on review meetings, and 30 per centimprovement in forecast efficiency. Notably, the company hasalmost always met its financial forecasts, which stands as atestimony to the effectiveness of CPM.
Using CPM in the Real World: More Examples
§ California Eastern Laboratories (www.cel.com) recentlyfollowed the steps described above to deploy CPMsolution and has met with great success. CEL, theNor th American sales and marketing par tner forproducts made by NEC Compound SemiconductorDevices, wanted to make sure it was ready for futuregrowth. CEL implemented the software applications itchose in phases, star ting with human resources and

51 SCMS Journal of Indian Management, January-March, 2006.
Published by School of Communication and Management Studies
benefits management and moving onto financial, ordermanagement, advanced supply chain planning,purchasing and business intelligence tools. The wholeprocess took about eight months. Instead of gatheringdata f rom separate warehouse management ,accounting, supply chain planning and humanresources systems, the company was able toconsolidate its applications into a single integratedpackage. CEL could turn to a single source forinformation. Now, CEL’s distribution system is closelylinked to its planning system. Its 13 sales offices,multiple distribution centers and channels are highlyinterconnected. By connecting planning, execution,and business intelligence, it has got global visibility
into the demand and supply across its supply chain.
§ Winn-Dixie (www.winn-dixie.com), which operatesone of the largest supermarket retail chains throughoutmost of the USA after implementing CPM, could save$4.4 million apart from the other benefits like betterplanning and greater accountability.
§ Lockheed Mar tin (www.lockheedmartin.com), theaerospace giant, which implemented a sweeping CPMproject by automating the consolidation of data fromhundreds of systems and legal entities within thecompany could reduce its finance staff by more thanone thousand with an average savings of $40 millionper year from a project that probably did not costmore than $10 million from star t to finish.
In an analysis of 437 publicly traded firms, 205 of whichhad structured performance measurement systems,Andre de Waal (www.andredewaal.nl) found that overa three year period the financial performance of thosefirms with a performance measurement system like CPMhad substantially improved and substantially becamebetter than those firms without a similar system. Thisimproved performance was visibly reflected in theirstock prices.
Concluding Remarks
Better matching between the desired organizational goals andactua l performance, in addit ion to susta ined g lobalcompetitiveness, are the most alluring promises of the CorporatePerformance Management suite. CPM adds value to the business
by focusing on how an organization develops, implements,and monitors strategic plan. This strategic focus is maintainedover every managerial process, right down to the contributionindividual budget holders make.
CPM provides the much-required transparency into the systemsand processes of the organization. It promises quality output ata lesser cost. It helps businesses to demonstrate accountabilityand compliance and provides opportunities for active managerialintervention at different stages of the conduct of a business.Increased return on investment and high managerial efficiencyand associated effectiveness should attract potential buyers totypical CPM solution suites. CPM, though relying to a great dealupon numbers, goes far beyond quantitative management, or‘management by numbers.’ It brings back to the fore ofmanagement practice the once forgotten treasure of insight,superimposes it upon the numbers and delivers integratedsolutions to the complex problems of the present daybusinesses.
After taking a general survey of the components constitutingCPM, as well as the significance and paybacks of integrating itinto the key processes of a business, the next question is wherewe are heading to. Many business organizations have adoptedat least some modules of it like ERP, data mining, warehousing,and business intelligence applications, but one module withoutintegrating with the others. Worse, the applications of thesemodules are rarely if ever informed by an overarching businessstrategy. It is known to all that organizational decision-makingbecomes suboptimal due to disintegrated business processesand incorporation of CPM technologies for enabling integrationis the sure path to a great return on investment in technology.
To the question of whether CPM is the next big thing to come,Gar tner (www.gar tner.com) is strongly of the view thatenterprises that incorporate CPM in philosophy and praxis willhave a leading edge over their industry peers. Even though thearguments presented in this article may make one to believe thatthere is a high probability for this to be true, it is more advisablethat organizations maintain a cautiously informed optimism, betterunderstand about what it can mean to their businesses, andbuild up step by step through preparatory strategies than naivelyjump into the forefront of the bandwagon. Of course, CPM isnot a static set of particular technologies that delivers the bestgood across time and space, but the technology mix of CPMvaries from time to time. Getting locked into par ticular

52 SCMS Journal of Indian Management, January-March, 2006.
Published by School of Communication and Management Studies
technologies that are non-scaleable and non-interoperable andthat require significant investments is a scenario that is to bedefinitely avoided.
Keywords: Corporate Performance Management and its distinguishingfeatures, Historical evolution of CPM, Dashboards, Key PerformanceIndicators, CPM implementation, and Case-studies.
References
Ahmad, M.M. and Dhafr, N., “Establishing and improving manufacturingperformance measures,” Robotics and Computer IntegratedManufacturing, 18, 171-176, 2002.
Baltaxe, D. and Van Decker, J., “The BPM transformation: Where itis today, where it’s going tomor row,” BusinessPerformance Management, November, 18-27, 2003.
Bruckner, R. M., List, B. and Schiefer, J., “Striving towards nearreal-time data integration for data warehouses,” InKambayashi, Y., Winiwarter, W., Arikawa, M. (Eds.),Proceedings of the DaWaK 2002, LNCS 2454, 317-326,2002.
Brunner, J., Becker, D., Buhler, M., Hildebrandt, J., and Zaich, R.Value Based Performance Management, Wiesbaden:Gabler, 1999.
Cleveland, B., “What are the Key Performance Measurements (KPIs) ina Call Center?” Maryland: ICMI Inc, 1996.
Creelmann, J., “Building and Implementing a Balanced Scorecard,”MA: Lexington Books, 1998.
Davenpor t, T.H., “Process Innovation: Reengineering Workthrough Information Technology,” Boston: HarvardBusiness School Press, 1993.
Dinesh, D. and Palmer, E., “Management by objectives and thebalanced scorecard: Will Rome fall again?” ManagementDecision, 36 (6), 32-46, 1998.
Geishecker, L., “Manage Corporate performance to OutperformCompetitors,” Gartner Group, Note No. COM-18-3797,2002.
Genovese, Y. and Hayward, S., “Business Process Fusion
Transforms Applications,” Gartner Article Top View,Note No. AV-21-2090, 2003.
Grigoria, D., Casatib, F., Castellanosb, M., Dayalb, U., Sayalb, M.,and Shan, M.C., “Business Process Intell igence,”Computers in Industry, 53, 321-343, 2004.
Kaplan, R.S. and Norton, D.P., “The Balanced Scorecard: TranslatingStrategy into Action,” Harvard Business School Press,MA: Cambridge, 1996.
Kaplan, R.S. and Norton, D.P., “The balanced scorecard; Measuresthat drive performance,” Harvard Business Review,January/February, 71-79, 1992.
L inth icum, D. S. , “Enterpr ise Appl icat ion Integrat ion,”Massachusetts: Reading, 2000.
Moncla, B. and Arents-Gregory, M., “Corporate performancemanagement: Turning strategy into action,” DM Review,December issue (accessed f rom http:/ /www.dmreview.com/editorial/dmreview, on 15-09-2004), 2003.
Neely, A.D., Adams, C., and Kennerley, M., “The PerformancePrism, the Scorecard for Measuring and ManagingBusiness Success,” London: Prentice Hall, 2002.
Nelly, A., Gregory, M., and Platts, K., “Performance measurementsystem design,” International Journal of Operations andproduction Management, 15 (4), 80-116, 1996.
Rucci, A.J., Kirn, S.P., and Quinn, R.T., “The employee-customerchain at Sears,” Harvard Business Review, January/February, 82-97, 1998.
Shaw, R., “Measuring, managing and improving the performanceof CRM,” Interactive Marketing, 1(1), 44-58, 1999.
Spangenberg, H. , “Understanding and implement ingperformance management,” Plumstead: Juta, 1994.
Webber, A., “CEO bashing has gone too far,” USA Today, June3, 15-16, 2003.
Williams, S. and Williams, N., “The business value of businessintelligence,” Business Intelligence Journal, 8, 4-17,2004.

53 SCMS Journal of Indian Management, January-March, 2006.
Published by School of Communication and Management Studies
Girish B. and Soju Annie Goerge
P rofess iona l iz ingMicro Financefor E f fect ive Regu la t ion
The major hurdles to the development of the micro finance sector, particularly to the growth of Micro FinanceInstitutions (MFIs) appear to be the lack of an enabling regulation, capacity of MFIs to expand, and absence ofstandardisation. Hence the need of the hour is to build trust about the sector by addressing the concerns of theinvestors/bankers particularly related to the lack of standardisation and absence of a shared language. Creation oftrust through standardization can be quickly achieved by professionalizing the sector by creating a new breed ofcertified professionals. These Certified Micro finance Professionals (CMPs), supposed to behave in a certainpredictable manner by virtue of their training, can bring in compliance and standardization. The strategy is to bringin regulation through professionalism, create trust in the minds of all stakeholders about investing in MFI through ashared and common language, and create incentives for MFIs to take capacity building seriously.
vital for India that this movement/revolution picks up paceand scales its peak effectively.
The role of Micro Finance Institutions(MFIs) i s increas ing ly beingrecognized as a vital component inthe overall strategy for micro financein India. Given the yawning demand-supply gap4 that exists in the sector,there is a vital need for freeingresource flows into the sector so thatthe potential is attained. Private sectorinvestment seems to be an obviouschoice for meeting this gap given thefact that micro finance is increasinglybeing cons idered as a v iableproposition5 . But the response of theprivate sector (both in terms of equityand debt) has not been as
o s u s t a i n t h e f r u i t s o f t h e e c o n o m i c p r o g r e s sachieved in the recent years1, India needs to focusits efforts towards addressing its pover ty, given that it
is the home for 1/3rd of the world’spoor. M ic ro f i nance has beenrecogn i sed to be one o f thepromis ing s t ra teg ic opt ions toreduce poverty by the internationalagencies working towards the UNmillennium development goal ofhalv ing the world’s pover ty by20152. It is really hear tening thatmicro f inance seems to be thecurrent buzz word in India and isf inal ly receiv ing the attent ion i tdeserves, be it in the Union Budgetor among investors l i ke V inodKhosla3 who have come forward toinvest in Indian micro finance. It is
M r . G i r i s h B . , C o u n t r y R e p r e s e n t a t i v e -(I n d i a ) G r a m e e n F o u n d a t i o n U S A , E m a i l :g n a i r @ g f u s a . o r g
M s . S o j u A n n i e G e o r g e , C o n s u l t a n t , I C I C IB a n k L t d . , B a n d r a - K u r l a C o m p l e x , M u m b a i -5 1 .
T
54 SCMS Journal of Indian Management, January-March, 2006.
Published by School of Communication and Management Studies
encouraging as the potential envisages it to be.
An analysis of the major hurdles to the growth and scaling up ofMFIs reveals that their origin could be traced back to (i) the lackof an enabling regulatory environment (including absence of asuitable legal form, ambiguity regarding the product portfolio ofMFI like acceptance of savings, pension and micro-insurance,entry barriers in accessing foreign and domestic equity market,ECB regulations, and having to comply to the government diktatsimposed on them from time to time), (ii) low capacity in termsof skill set, of a large number of MFIs to scale up in a sustainablemanner (Out of 800 to 1000 MFIs, less than 10 are large6) and (iii)the low level of standardization (of processes and systems) inthe micro finance sector given the variability in models andapproach.
These hurdles get translated into paucity of funds for the MFIsfor onward lending to members, expansion and scaling up. Thesources of such funds for the MFI are mainly Equity, Debt andGrants. Piece-meal regulatory reforms like opening up of ECB ordiluting NBFC norms for MFIs alone may not result in large flow offunds to the MFIs/sector if the other constraints are not addressedconcurrently. Unless the concerns of the equity investors, lendersand donors in the micro finance sector, particularly with respectto the standardization of the processes as well as financial andnon-financial reporting (like outreach, poverty assessment,impact etc) are addressed through a common language, whichmakes sense to all the stake holders, the hesitation to invest willcontinue.
In future, if and when the legal form for an MFI is prescribed byRBI/GOI, whether within the NBFC regulations or under separateregulations, the standardization with respect to the financialrepor ting may be achieved to a certain extent. However,developing the trust of the investors in the sector will be a vitalmandate and challenge of any regulator of the sector, and itshould be made certain that the steps to regulate also facilitatedevelopment. (The opponents of regulation of any kind arguethat it will thwart growth in such a burgeoning/growing sectoras this).
Regulation: The debate
There are clearly three lines of arguments with respect to theregulation of the micro finance sector. The argument for self-regulat ion, which is par t of the NABARD Task Forcerecommendation7, does not address the crucial question ofincentivising the MFIs to conform. This is true for the vast majority
of MFIs in the country, which are small, typically with less than10,000 memberships and currently enjoying almost unlimitedoperational freedom owing to their low visibility due to theirmodest size. Apparently, the argument for a separate regulatorybody, in the line of SEBI, TRAI, IRDA and PFRDA, which will havea mandate of not just regulation but also development of thesector so that macro level issues like regional disparity in growthof micro finance are also addressed, appears sound but has notbeen well received. The argument for “no regulation” is alsostrong but assumes that there are currently no regulations for anMFI. Literature8 however shows that there are multiple regulations/regulators9 monitoring the sector given the variability that existsamong the micro finance providers. The typical response ofmost MFIs would be to restrict their growth beyond a particularsize due to concerns regarding the visibility, which might attractmultiple regulators, all acting with its own separate agenda.
In this context, it will not be incorrect to assume a generalconsensus on the need for some regulation so as to facilitatethe growth of the sector and the argument for an SRO or regulationby RBI appears to be the plausible option in the near future.
The flip side is, given the fact that that there are likely to be about800 to 1000 MFI-NBFCs10 (i.e., if all the MFIs in India apply for anNBFC licence; the NABARD Task Force quotes the number ofNGO-MFIs that are required to reach one million SHGs to be inthe range of 400011 ), how effective can the RBI/regulator be inenforcing standards is a debatable issue. Will the regulator useits own staff to ensure compliance? What sort of manpower willbe required for the same? Alternatively, will it use the existingprofessional bodies like ICA/ICWA etc to audit compliance? Inthat case, how prepared such bodies are to audit given thatmicro finance is now a wide and complex subject in its ownwhich br ings together apparent ly disparate and evencontradictory concepts of development and business.
Shared Language, Trust and Standardisation
It is really encouraging that the number of traditional banksforaying into the field of micro finance and particularly financingMFIs is increasing. This can be attributed partly to the recentencouraging steps taken by the government and partly to theincreasing belief that micro finance is a viable businessproposition as considered by lead players like the ICICI Bank.This trend needs to continue for the sector to develop and forthat, the banks should be in a position to assess the riskassociated with MFI lending in an appropriate manner. The

55 SCMS Journal of Indian Management, January-March, 2006.
Published by School of Communication and Management Studies
problem apparently is that for many such banks the sectoritself is a novel one, talking a different language (The financialratios followed in case of an MFI is different from those fortypical financial institutions. The accounting practices couldalso be di f ferent especia l ly for NGO-MFIs with grantcomponents12.) and conventional financial ratios may not makesense for assessing the credit worthiness of an MFI.
Let us elaborate. Most of the lenders, particularly the traditionalbankers who are recent entrants, still depend majorly on financialstatements like the Balance Sheet and Profit and Loss accountfor assessing an MFI, but this may not reveal the right pictureabout the MFI. An of-quoted example is the applicability ofCapital Adequacy Ratio (CAR) for a Trust which has all its equitydonated13. The ratios also can be tricky. For instance, there aredifferent ways of calculating repayment rate, such as Cumulative,On-time, Current etc, each having distinct uses. An MFI mayhave a very low repayment rate but still can still post a rosyratio14 . Even the same ratio may be calculated differently bydifferent MFIs. (Social investors like Mr. Vinod Khosla have raised/shared this concern in his interaction/ evaluation of MFIs forequity investment and foresee a large in-flow of funds if theissues of standardisation and shared language are addressed).Unless the banker is really aware of these intricacies, she maynot get a fair idea of what is going on and hence might notobtain a good assessment of the risk. Then there are reschedulingof loans, rerouting etc, which are difficult to detect unless thereis standard software, which still remains a dream for the microfinance sector. Needless to say, there are more sophisticatedways in which the balance sheet and P&L account can be madeto appear more promising than it really is. Thus a banker goingby the conventional Financial Statements, even if endorsed by aChartered Accountant cannot assume to be in a safe position.
The new age private sector banks are trying to address thisthrough acquired competence by hiring personnel with fieldexperience. However, they are also not in a position to assessan MFI in a comprehensive manner as usually the time availablefor a due diligence process with a bank official is usually lessthan a week which is insufficient for an in-depth verification.Thus the alternative currently is to look for qualitative aspects likeexcellence/ robustness of the board, management team, pastrecord of repayment etc and to depend on rating agencies likeM-Cril.
Rating is definitely a useful for the banker to assess her risk.However, a rating exercise is usually done on an annual basis,
and takes about a week’s time. This gives a snapshot of theaffairs based largely on the existing information system and theargument here is that in a dynamic and non-standardisedsituation, more comprehensive and possibly concurrentassessments to ensure quality and create confidence amongthe stakeholders are required. While rating is useful, it is notadequate.
Transparent reporting in a language which is common, sharedand understood by all stakeholders, through standardisation isimportant not only for accessing commercial funds but also forthe donors/grant makers who support MFIs because of thesubstantial development impact of micro finance and aregenerally interested more in non-financial reporting variables.Other major players like Grameen Foundation, Unitus etc, whoare working for developing the sector by channelling resourcesand facilitating acceleration of the growth of the sector are alsofacing similar situations and hence facing the risk of losingcredibility before their donors.
Evidently, there is a pressing need for the different stakeholdersof the sector to speak a common and shared language so thatthe same information conveys the same meaning to all. Thiswould be decisive in attracting funds, both equity and debt tothe sector. A shared language gains further significance giventhe diversity that exists among MFIs with regard to their legalforms15 and capacity/ maturity16. Consequently, it is alsoimportant for the regulator, to bring in a common language tosmoothen information flow within the sector and thus createtrust and reduce its workload. All this has to be done withoutimpeding the growth of the sector. Learning from earlierexperience in the Indian financial sector and given that the sectoris in its growing phase, it is advisable to be cautious as onepoor investment by a major banker may be enough to sendwrong signals and the sector may go the IRDP way17 .
Building Capacity: Who Is Interested?
Capacity of MFIs to scale up and expand is another area to bestrengthened to facilitate flow of funds to the MFIs and sector.Currently there are a lot of efforts and resources put in by variousfacilitators like NABARD (BIRD), SIDBI, FWWB (ISMW), Sa-Dhan,ICICI SIG, UNITUS and the other facilitators are also taking initiativesin this direction by offering training programmes to its partnersto enhance their skills for scaling up. However experience inthis area, particularly with respect to training programmes forMFIs bring out the following:

56 SCMS Journal of Indian Management, January-March, 2006.
Published by School of Communication and Management Studies
a. Generally an MFI does not have much incentive to send theemployees for training. Training is rarely a priority and oftenemployees are sent mainly because such trainings are fullysponsored. Often such capacity building initiatives becomedonor/banker driven rather than based on a desire on thepart of the MFI to develop its HR capabilities. There are manyreasons for this. Very often the key personnel could not bespared for a week or so due to normal work pressure. Thereis also the question of whether an MFI should try to developtalent in-house or hire competency. Often the latter getsprominence, as it is the easier route.
b. When trainings are donor driven, the follow up andimplementation takes a beating making the training programmea free holiday trip.
c. Paucity of established and reputed trainers is also perceivedas a problem in making the programmes attractive.
d. The perceived gap between the concepts and practices ofmicro finance is another aspect, which makes the trainingsless attractive for the MFIs. There is a feeling that theacademics, who are often the trainers, do not or cannotappreciate the so called “ground level realities.”
e. Many MFIs are still operating in a small scale and apparentlyare not interested in expanding significantly due to thecomplexities it will face once the scale increases. Small MFIsdo not feel much need for capacity building.
Professionalise to Standardise! Certified Micro FinanceProfessionals:
The Concept
A strategic option to address these issues, at least to a significantextent, is to professionalize the sector. Obviously there areprofessionals working in the sector now. They are basicallymanagement graduates with or with out specialization in rural/development management and finance professionals likeChartered/Cost Accountant (CA/ ICWA). While many of themare good in their domains, it is “interesting” to note that there arevery few options when it comes to those who have receivedspecialised (and holistic) training in micro finance. (Focusedtraining on micro finance could include a wide range of topicsfrom poverty assessment, models, processes and operations,products and financial management to impact assessment).
This gap can be addressed by creating a class of professionalswho may be known as Certified Micro finance Professionals
(CMPs). This class will consist of professionals trained in allaspects of micro finance and who will constantly updatethemselves about the changes in the sector. By virtue of theirprofessional training and code of ethics, they will be expectedto behave in a consistent and predictable manner and therebybring in standardization. The CMPs will be similar to the CAs/ICWAs/Company Secretaries (CSs) in terms of their commitmentto the profession and professional behaviour18.
The Scope of a CMP
A CMP will have to make sure that all the documents andcommunication, which emanates out of an MFI is in a sharedcommon language and is true and accurate. She will be makingsure that the information, which is being shared in the publicdomain, is accurate and is represented in an unambiguousmanner so that all the stakeholders will understand it in the sameway. Thus she may also be involved in looking at the processes,f ine-tun ing the systems, plugging loopholes etc, assupplementary functions.
Though this can be the broad scope of a typical CMP as envisagedin this write up, many of the above are debatable. For instance,the CMP need not necessari ly be involved in processstandardisation and it may be best if left to the MFI. However,her major responsibility is to cer tify that the output of theprocesses as reflected in various documents, reports andinformation are genuine, true and accurate. Process changesand standardisation can be an option for an MFI, for which itmay seek the help of the CMP voluntarily.
The scope and responsibilities lead to the required skill set andconsequently the training that the CMP needs to functioneffectively. She will require in depth theoretical and practicalknowledge in all aspect of micro finance from pover tyassessment, models, systems and processes in micro finance,management, development and banking. Thus a full course for aCMP may take a couple of years to complete, while otherprofessionals like MBAs, CAs etc can complete the course byavail ing exemptions of subjects covered by their otherprofessional qualifications.
Who wants CMPs?Marketing/Selling the concept: Advantages for Investors/Bankers
Along with creating a class of professionals, a brand has to bebuilt for the CMPs. The bankers and the public should be sold

57 SCMS Journal of Indian Management, January-March, 2006.
Published by School of Communication and Management Studies
the idea that the seal/s ignature of a CMP is a mark ofstandardization and quality of the accounts/reports/documents/processes of an MFI. If the bankers and investors adhere to thisand insist on the cer tificate of CMP for release of funds,standardization will set in.
Aligning MFI incentives for compliance
Currently, the MFIs do not have much incentive to follow thestandards, as conforming is voluntary besides affecting theirfreedom. There are appreciable efforts by international agenciesto motivate the MFIs to adopt standard and transparentprocesses by providing them recognition, for instance theFinancial Transparency Award of CGAP and the ProcessExcellence Awards given by ABN and Planet Finance. Sa-Dhan19
through its work on formulation and dissemination of financialand governance performance standards for MFIs also tries toachieve this. These are at best first steps towards bringing MFIsto a common standardised platform. Given the growth raterequired for the sector to achieve its rather ambitious target,other steps are also required to encourage MFIs to comply.The best way is to link compliance to the lifeblood of MFIs,funds. A policy advocacy drive has to be initiated to encouragebanks/FIs to lend/invest in CMP certified MFIs for their ownprotection. This will create a pull for the MFIs to go for thecertification of their report by a CMP. This “encouragement”can be scaled in such a way that within a few years it becomesmandatory for any MFI to have a CMP certification to accessloan funds from mainstream banks. This will require the RBI tobe convinced that a certain amount of discipline can be broughtin the sector in a fast and economical manner through CMPcertification so that it directs the banks to lend only to MFIswith CMP certification for priority sector classification.
The concerns regarding how such a ruling will affect theexpansion and growth of the sector, is bound to be raised.The conjecture here is that by implementing this in a phasedmanner, making it obligatory only over a period of time andby giving exceptions in the way a CMP cer tification can beobtained for the existing MFIs based on their stage ofdeve lopment , these concerns cou ld be addressedeffectively.
The MFIs can have many options. It can have a CMP in-house oras a consultant. (This could be similar to the MicroSavecertification20, but instead of a voluntary certification, in orderto ensure compliance, the signature of the CMP on the MFI
documents has to be made mandatory under regulation.) MFIscan encourage their employees to take up certification. MFIscan alternatively hire a CMP. These are similar to the currentpractice with CAs for final audit. To assist the existing MFIs,separate cer tif ication process for the CFO/CEO can beprescribed so that their compliance is easy.
Scale and Certification
Scale and Certification: The certification can be mandatorydepending on the scale of operations as in the case of aCompany Secretar y cer t i f icat ion. For instance, i f themembership/loan outstanding exceeds a certain limit there canbe an in-house CMP and a part time CMP should be allowedfor smaller MFIs.
Creating CMPs
Creating CMPs: It is important to have adequate CMPs to providecertification. This would mean a professional body to certify, atraining facility and demand for the course i.e. people interestedin obtaining certification. Here a couple of apparently viableoptions could be
f. To create an apex institution/statutory body similar to theInstitute of Chartered Accountants of India (ICAI) /Instituteof Cost and Works Accountants of India (ICWAI) /Institute ofCompany Secretaries of India (ICSI), which will directlyconduct courses through its own chapters and givescer tification. Here the assumption is that there will besufficient demand for the course. Such demand can becreated by encouraging the CFOs/CEOs of the MFIs toundergo courses (on-line or distance mode/part time) andget certified. However creating a large demand might taketime.
g. The apex institution can alternatively tie up with the existingprofessional bodies/institutes to offer an add-on certification.For instance, the Institute of Rural Management Anand (IRMA),a premier rural management institution offers courses onmicro finance. The chartered institute can offer thosestudents who have taken micro finance course the optionof obtaining the CMP title by clearing a few additional papers.Similar tie-ups with ICA and ICWA and IACS is also possible.Any Chartered Accountant can get an additional CMPcer tification by clearing a few papers offered by theChartered Institute of Micro Finance of India (CIMFI).

58 SCMS Journal of Indian Management, January-March, 2006.
Published by School of Communication and Management Studies
h. The incentives must be aligned for the new breed ofprofessionals to behave in a professional manner. Theapex institution can assist the CMPs to procure business,update themselves etc. The disincentive will be that theywill lose their cer tification for non-compliance and willbe black listed (Just as in the case of other professionalbodies).
Who can do this?
I t wil l be diff icult for one entity, to do al l the above. Acol lect ive act ion of Academic Ins t i tu t ions , F inanc ia lInstitutions, professional bodies and MFIs will be requiredto make this a reality. The CIMFI wil l be more effective if iti s p romoted by o rgan iza t ions l i ke Sa -Dhan , MCR I L ;academic/research/training bodies l ike IRMA , I IFM, I IM,CMFR , ISMW; FIs l ike ICICI, SBI; along with internationalresource agencies l ike MicroSave and CGAP. Al l of theabove organisat ions are, in one way or other, tr ying toaddress the major three hurdles mentioned before. Thecapacity building, research, policy advocacy and fundingcapabi l i t ies of these organisat ions should be broughttogether in a complimentary fashion under a commonumbrel la with a clearly la id out set of objectives andoutputs.
Conclusion
In recapitulation of the above discussion, it is possible to createa large number of CMPs in a short period by
i. Forming and getting an Institute of Chartered MFP recognizedand legitimised by Parliament by an ACT,
j. Offering courses by all modes, full time, part time, distanceeducation as well as on-line to maximize access,
k. Lobbying with GOI/RBI to make the CMP certificationmandatory for borrowing from banks/FIs, which will makeregulation easier as standardization will bring in bettercompliance,
l. Creating brand and selling the concept to banks and FIs as arisk management strategy,
m. Making life easier for MFIs by giving opportunity to existingCFOs and CEOs to get certification at softer terms, makingthe presence of a full time CMP mandatory only in the caseof large scale operations and for smaller MFIs allowing forpart-time CMPs. This will create demand for capacity building,
n. Tying up with existing professional bodies and managementschools to offer add-on cer tification and helping theprofessionals to procure business. Align incentives for theCMPs to behave professionally,
o. Gradually opening chapters of CIMFI across the country.
Some of the assumptions of the proposal are questionable:
p. The professional bodies l ike Inst i tute of Char teredAccountants of India, Inst i tute of Cost and WorksAccountants of India, other management institutes etc willagree to collaborate.
q. It is possible to get charter from parliament, get RBI to suggestthe banks to lend only to CMP certified MFIs. That is broadlylegitimacy can be created.
r. The organisations mentioned above are interested or willcome together to float a new institution and can agree onthe standards, willing to accept the CIMFI as a controllingbody.
s. There will be enough demand for CMPs so that students willbe interested in spending time and efforts for undergoingthe course. This is related to the question of salaries andperks a CMP can expect.
t. There are enough trainers available to support the Institute.
CIMFI: Chartered Institute of Micro Finance of India
CMP: Chartered Micro finance Professional
End Notes
1Riding on a rebound in the agriculture and allied sector, andstrongly aided by improved performance in industryand services, the Indian economy registered a growthrate of 8.5 per cent in 2003-04, the highest ever exceptin 1975-76 and 1988-89. http://indiabudget.nic.in/es2004-05/chapt2005/chap11.htm
According to the keynote address by the Finance Minister PChidambaram, delivered at the opening session of theWorld Economic Forum’s 20th India Economic Summit,on December 5, 2004, the Indian economy is poisedfor sustained economic growth of 7-8 per cent for thenext ten years. The FM told participants. “For the firsttime, there is universal acceptance that India is riding a

59 SCMS Journal of Indian Management, January-March, 2006.
Published by School of Communication and Management Studies
wave of susta ined economic growth.” http:/ /www.weforum.org/site/homepublic.nsf/Content/India’s+finance+minister+predicts+growth+for+a+decade+as+investment+panel+formed
2 Littlefield, Elizabeth, Jonathan Morduch, and Syed Hashemi,January 2003, “Is Microfinance an effective strategy toreach the millennium development goals?” CGAP FocusNote No.24 ht tp: / /www.cgap.org/docs/FocusNote_24.html
3 Vinod Khosla is one of the most successful venture capitalistsof all time and has recently evinced a keen interest insupporting micro finance, especially in India. The sectoris currently attracting the notice of several venture capitalfunds, and social investors some of which are LokCapital, Unitus, and Acumen Fund. The exciting featureabout these investors is that they all view micro financeas not only a socially responsible but also a profitableventure and expects to earn good/ near-market returns;even those which function on a not-for-profit basismonitors the results on market terms which would gomiles towards boosting the growth of the sector.
4 One estimate made by EDA Rural Systems, Gurgaon, assumesthat the total requirement of credit for the rural poorfamilies would be of the order of at least Rs. 15,000crore on the basis of a minimum need of Rs. 2,000 perfamily. Another estimate made by Sa-Dhan, puts theneed at Rs. 50,000 crore based on an annual creditusage assumed at Rs. 6,000 per rural households andRs.9,000 for urban poor households. If we also includethe demand estimates for rural housing (constructionand repair/upgrade) by the National Housing Bank, therequirement of funds would work out to an additionalRs. 1,000 crore per year. The demand for other financialservices like savings and insurance has not beenincluded here. ht tp: / /www.nabard.org/ ro les/microfinance/index.htm
Against this annualized estimated demand between Rs.15,000 -50,000 crores, the cumulative disbursements throughthe organized financial sector over more than a decade(February 1992 to March 2004) have reached onlyRs .3900 crore. ht tp: / /www.nabard.org/ ro les/microfinance/index.htm
5 Nachiket Mor, Executive Director, who is in charge of the microfinance activities of the ICICI Bank mentions in aninterview with the Business Line, “There is no altruism, itis all business and driven by the need to find newmarkets,” published as “ICICI Bank micro creditdisbursements treble” on March 17, 2005. http://www.thehindubusinessline.com/2005/03/17/stories/2005031701430600.htm
6 The top 10 MFIs account for over 40 per cent of the portfolioin an M-CRIL review done on 69 MFIs in India SanjaySinha, (June 2003) “Financial services for Low IncomeFamilies: An appraisal”, Microfinance Round Tablereport, IIMB Management Review.
7 Taken from the Repor t submitted by the Task Force onSupportive Policy and Regulatory Framework for MicroF inance const i tuted by NABARD in 1999.Recommendations made could be classified into thefour broad areas of mainstreaming of MFIs and othermicro finance structures, regulation and supervision ofMFIs, organisational aspects relating to MFIs and capacitybuilding of MFIs, banks and Self-help Groups (SHGs).
8 “Macro environment and legal and regulatory framework: India”(March 2002), Women’s World Banking.
9 The different acts and regulations impacting the micro financesector could be a vir tue of the organisational form ofthe MFI including the Banking Act, RBI regulations whichcome under the Banking Law; NBFC regulations, TrustAct, Societies Act, Companies Act and Co-operativeLaw; it could also be common to all such as the IncomeTax Laws, Labour Laws; State government laws likeMoney Lenders Act are also applicable since MFIs arenot explicitly excluded and not recognised as an entity.All of this leads to much ambiguity and consequentrent seeking.
10 Sanjay Sinha, (June 2003) “Financial services for LowIncome Families: An appraisal”, Microfinance RoundTable repor t , I IMB Management Review
,http:/ /
www.nabard.org/roles/microfinance/index.htm
11 “Task Force on Supportive Policy and Regulatory Frameworkfor Micro Finance Report” (1999) NABARD. http://www.nabard.org
60 SCMS Journal of Indian Management, January-March, 2006.
Published by School of Communication and Management Studies
12 The common financial ratios in case of an MFI are Portfolio atRisk (PAR), Repayment rate, Financial Self-Sufficiencyetc while for a bank it could be Capital Adequacy,Non-Performing Assets (NPA), Debt-Equity, DebtService Coverage, Return on Equity, Return on Assetsetc. The accounting practices in case of an NGO- MFIwhich has accepted grants might be new to a bankerwho is unfamiliar with non-profit concerns. How manybank officials are aware of such practices is anybody’sguess. Accounting of Grants received through FCRAaccount could be another alien area for a local bankerwho appraises an MFI.
13 Capital Adequacy Ratio(CAR) is the ratio between the capitaland risk weighted assets. Presently, many banks andrating agencies are insisting on a CAR of 8-10 per centfor micro finance portfolio typically consisting ofunsecured loans, which could make sense in case of alimited liability structure. A Trust is an unlimited liabilitystructure meaning that the board members are jointlyand severally liable for all the debts. Therefore a highcapital ratio which tries to ensure that the promotershave sufficient stake in the entity and takes the firstlosses so that they do not take inappropriate risks doesnot hold much relevance in case of a Trust. Alternately,in case of a Trust with the entire capital donated, theboard may not have any stake to protect the same as itis free of cost.
According to the Planet Finance Country Study: India (May 2002)“Because NGOs are registered as societies or trusts,they do not have any equity capital and can never be“capital adequate” in terms of leveraging debt in a largeway.” www.planetfinance.org
14 The true picture of the repayment levels would be revealedonly if one takes a intense look at the numbers thathave gone into the numerator and denominator. TheMFI could be including prepayments, late payments ofamounts overdue from previous periods along withthe current due payments in the numerator while thedenominator could include only the current dues orpast dues of prior periods. The portfolio quality couldbe surmised only if all these aspects are looked into.Also it is suspect that how many MFIs can and doseparate the principal and interest payments in ratiocalculations which could again distor t the ratios.
“Measuring Microcredit Delinquency: Ratios can beHarmful to your Health” (June 1999) CGAP OccasionalPaper No.3. http://www.cgap.org
Other points of contention include whether to consider a loanas overdue only when the interest is overdue or whetherthe MFI should start accounting for it when the principalfalls overdue.
“The lack of data to monitor asset quality was glaring.” “Assetquality can be improved by focusing on the financialmanagement skills of the MFIs.” Planet Finance CountryStudy: India (May 2002) www.planetfinance.org
15 Legal forms of MFIs in India range from Not-for-profit MFIs(Societies, Public Trusts and Section 25 companies) toMutual benefit MFIs (State credit cooperatives, NationalCredit cooperatives and Mutually Aided Cooperativesocieties) and For-profit MFIs (For-Profit Companies andNBFCs).
16 Performance-wise also there is a wide variability among theMFIs of the country as revealed in the micro financereview done by M-CRIL on a sample size of 90 MFIs inIndia. Of the total sample, 60 per cent of the MFIs hadportfolio size less than Rs. 6.3 million. Among the 90MFIs, 33 per cent had a membership of <=5000 whilealmost 28 per cent has >25,000 members. Near 49per cent had a repayment rate of >95 per cent while23 per cent had collection rates <85 per cent. ThePAR was >20 per cent in 33 per cent of the caseswhile almost an equal number had PAR <=5 per cent.A quarter of the sample enjoyed an Operational Self-Sufficiency (OSS) >100 per cent whereas 50 per centof the sample had <=50 per cent OSS. More than 11per cent of the sample had a Financial Self-Sufficiency(FSS) of >100 per cent even as 54 per cent had <=50per cent FSS.. “The M-CRIL Microfinance Review 2003(revised February 2004)”, www.m-cril.com
Not more than 10 MFIs are reported to have an outreach of100,000 micro finance clients. An overwhelmingmajority of MFIs are operating on a smaller scale withclients ranging from 500 to 1500 per MFI. http://www.nabard.org/roles/microfinance/index.htm
17 The Integrated Rural Development Programme, though initiatedwith huge fanfare, failed mainly due to the loan pardonsdone for political considerations and wrong targeting,

61 SCMS Journal of Indian Management, January-March, 2006.
Published by School of Communication and Management Studies
leading to a bad repayment culture. If bankers err inassessing their MFI partners because of which paymentdefaults happen, there exists the danger that this mayspread through the entire micro finance portfolio inthe country. This is of grave concern as the backboneof the sector is peer pressure and supervision, andpractically it is very difficult to enforce repayment.
18 Institute of Chartered Accountants of India is a statutory bodyestablished under the Chartered Accountants Act, 1949for the regulation of the profession of char teredaccountancy in India. The Institute has a pro-activeDisciplinary Cell to ensure compliance of professionalethics and Code of Conduct in terms of the CharteredAccountants Act as well as various pronouncementsissued by the Central Council of the Institute. TheInstitute not only entertains complaints from StockHolder/User Group but also takes suo-moto action incases which come to the knowledge of the Institutethrough external information. The provisions containedin the code of conduct of the institute are moststringent ones as comparing to any other in the worldand the actions taken by the institute against thedefaulting members are also very stringent. There arevery few cases, where the Indian courts have takenmore stringent action against the members than what isproposed by the institute. http://www.icai.org/common/index.html
The Institute of Company Secretaries of India is a premierprofessional body constituted under the CompanySecretaries Act, 1980 to develop and regulate theprofession of Company Secretaries in India. The ICSI,bes ides conduct ing Company Secretarysh ipexaminations and enrolling qualified students asmembers after practical training, exercises professionalsupervision over the members in matters pertaining toprofessional ethics and Code of Conduct. It alsoorganises on a regular basis professional developmentand continuing education programmes and brings outresearch publications, guidance notes, secretarialstandards as well as professional monthly journalChartered Secretary for corporate executives and StudentCompany Secretary and CS Foundation Course Bulletinfor students. The ICSI regularly interacts with government,regulatory bodies and chambers of commerce and industryon policy and professional matters.
As per Section 383 A of the Companies Act 1956, companieswith a paid up share capital of Rs 50 lakh, or more musthave a whole-time company secretary. In case of a companywith a paid up capital of less than Rs 50 lakh, a CS with anIntermediate pass is also eligible for appointment.
Beecides issuing statutory certifications and appearing beforevarious quasi-judicial authorities as an authorisedrepresentative, he issues due diligence and comfortcertificates, acts as a secretarial auditor and an advisorand consultant on finance and management. http://www.compet i t i onmas te r. com/pages /ca ree r /company_secretary.html
Function of Company Secretary
A Company Secretary has been recognised by variousenactments as one of the principal officers of theCompany. The knowledge and training acquired by himmakes him versatile to carry out various functions inFinance, Accounts, Legal Administration and Personnelareas in addition to his own secretarial duties andresponsibilities. In fact, his role starts from the verymoment when the idea of formation of a Company isconceived. However, his responsibilities may vary fromcompany to company. http://www.icsi.edu/icsiweb/home/about.asp
19 Sa-Dhan is a specialized network of Community DevelopmentFinance Institutions in India, created for taking forwardthe collective requirements of these organizations, interms of dialoguing with policy makers, capacitybuilding, and identification and development ofminimum standards of performance in a participatorymanner.
20MicroSave is a unique project that promotes development ofmarket-led approach to delivering financial servicesamong MFIs through primary field level research, actionresearch, toolkit and curriculum development, andinformation dissemination. To become a Cer tifiedService Provider (CSP) of MicroSave toolkits, it isrequired to go through classroom training, follow-upfield work and reinforced by on-job application of thetool. The toolkits are practice-based, practitioner –focused, and field-tested and being a MicroSave CSPinvolves a very rigorous process and is considered asan acclaimed recognition.

62 SCMS Journal of Indian Management, January-March, 2006.
Published by School of Communication and Management Studies
Assessing the Service Qualityof Banking Technologiesin MauritiusRooma Roshnee Ramsaran Fowdar, Sooraj Fowdar and Ashwin Beegadhur
Mrs.Rooma Roshnee Ramsaran-Fowdar, Faculty of Lawand Management, University of Mauritius, Reduit, Mauritius,Email: [email protected]
Mr.Sooraj Fowdar, Faculty of Law and Management, Universityof Mauritius, Reduit, Mauritius, Email: [email protected]
Mr.Ashwin Beegadhur, Financial Training Company,7th Floor Bucklersbury House, 83 Cannon Street,London, U.K., Email: [email protected]
In this era of intense competitive pressures, the banking sector has often been the subject of service quality
assessment. However, service quality assessment of banking technologies in emerging economies is rare.
Hence, the main aim of this study is to measure and analyse the service quality of banking technologies in
Mauritius. The SERVQUAL instrument with five dimensions, namely tangibility, reliability, assurance, empathy
and responsiveness, was used. The study reveals customers’ expectations of service from banks across most
of the dimensions, in par ticular, aspects relating to responsiveness and reliability dimensions.
This research will study about the effectiveness of self-servicetechnologies (SSTs) in improving service quality in the banking
sector. The study also provides usefulins ight to tack le such per t inentquestions as: do customers makeproper use of SSTs and whether theSSTs meet quality standards expectedby customers? In this respect, thebroad objectives of this project are toassess the service quality of bankingtechnologies , and understandcustomers ’ expectat ions andperceptions of the service qualityat t r ibutes of these bank ingtechnologies.
Literature Review
Joseph and Stone (2003) argue that
Co m p a n i e s i n m a n y i n d u s t r i e s h a v e t u r n e d t otechnology to get the best out of their sales forceand improve relationships
with customers and the banking sectoris not an exception. The bankingsector has evolved a lot, both in termsof serv ices i t prov ides andtechnology. In fact, technology offersan alternative and better deliverychannel through which bank ingproducts and serv ices can beprovided. Though the banking sectorconsists of domestic and offshorebanks, the study lays emphasis onlyon the domestic ones. The bankingsector in Mauritius is mainly made upof the Bank of Mauritius, ten domesticcommercial banks and ten offshorebanks.

63 SCMS Journal of Indian Management, January-March, 2006.
Published by School of Communication and Management Studies
the offer of customer-friendly technology, such as menu-drivenautomated teller machines (ATMs), telephone and internetbanking services, as a means of delivering traditional bankingservices has become commonplace in recent years as a way ofmaintaining customer loyalty and increasing market share.
Banking technologies consist of tangible resources such ashardware and communication systems, advanced computer-based transaction and processing systems, database marketingprogrammes and multi electronic delivery tools like ATMs, phonebanking, amongst others. It also includes intangible resourcessuch as human skills and their technical know-how that can beuseful in delivering highly effective service to customers.
The explosion of technology is changing the banking industryfrom paper and branch banks to ‘digitised and networkedbanking services.’ Banks with the ability to invest and integrateinformation technology wil l become dominating in thehighly competitive global market. Nonetheless, technology cancreate par ticular problems and consequently can have anegative impact on customers. Joseph et al. (1999) concludethat technology fai lures, service design problems andcustomer-driven failures are sources of dissatisfaction forcustomers using SSTs. Their findings point to problems relatedto accuracy of transactions, accessibility of service, customersupport and security.
SSTs have now become a critical component of customerservice, where almost half of all transactions are carried out inthe absence of a teller (Lawrence and Karr, 1996). In Mauritius,some of these tools are widely used while others are still at anearly stage of development but in the years to come, they willbe fully developed and would be popular as well. These SSTsinclude Automated Teller Machines (ATMs), phone banking,credit cards, debit cards and internet banking.
A common definition of service quality is that the service shouldcorrespond to the customers’ expectations and satisfy theirneeds and requirements (Edvardsson, 1998). This implies thatbanks, in seeking to provide a high quality service, should identifythese needs and expectations and establish the way in whichcustomers prioritise them.
Most authors agree that service quality consists of an outcomeand a process element, where outcome is the achievement ofsome end by the customer (for example, cash from an ATM)and process is the interaction between the customer and theservice unit. Further classification of service quality has been
addressed by a number of authors. Grönroos (1988) identifiesthe five key determinants of service quality as professionalismand skills, reputation and credibility, behaviour and attitudes,accessibility and flexibility; and reliability and trustworthiness.
The most widely reported framework is that proposed byParasuraman et al (1988) as the basis of SERVQUAL, consistingof the five dimensions of service quality namely tangibility,reliability, responsiveness, assurance and empathy. Reliability canbecome the prime focus of organisational activity. “Getting itright first time all the time” may become the target for accountaccuracy, keeping promises, meeting deadlines and providingt imely and accurate in format ion to customers . Theresponsiveness dimension actually incorporates a number ofactivities, including the readiness of staff to tell customers exactlywhen things will be done, the provision of prompt service,giving customers their undivided attention as well as beingdemonstrably responsive to customers’ request. Empathy wasidentified as a quality displayed by staff when they demonstrablyhad “customers’ best interests at heart” by offering convenientopening hours, understanding of individual customer needsand problems as well as providing individual attention. Assurancerequires staff to have the knowledge to answer customers’questions and the ability to provide competent, confidential,courteous and friendly service. Finally, the tangibility dimensionincludes investment in equipment, the appearance of thebranches in terms of appeal, cleanliness and tidiness.
SERVQUAL can provide an indication of the relative importanceof the service quality dimensions, which influence customers’overall quality perceptions and so bring priority areas tomanagement’s attention. It is suggested by Parasuraman et al(1993) that SERVQUAL is the best model to be adopted in thecontext of banking and may be used to track service qualitytrends over time, compare branches within a bank, compare anorganisation with its competitors and categorise customer intoperceived quality segments based on their individual SERVQUALscores.
Service quality can be determined by the level of discrepancybetween consumer expectat ions or desires and theirperceptions of what they receive, as described by theSERVQUAL scale. The two determinants of service quality arethus customers’ expectations and perceptions. According toGale (1994), understanding what consumers expect from aservice organisation is necessary for service managers becauseexpectations provide a standard of comparison against which

64 SCMS Journal of Indian Management, January-March, 2006.
Published by School of Communication and Management Studies
consumers judge an organization’s performance. In the servicequality literature, expectations are viewed as desires or wants ofconsumers or what they feel a service should offer rather thanwould offer.
Schiffman and Kanuk (2000) explain that perceptions can betranslated as the end result of one or a number of observations.It is the process by which an individual selects, organises andinterprets stimuli into a meaningful and coherent picture of theworld. One starting point is that every single customer perceivesservice quality in a personal way. Customers base their qualityjudgement on a number of experiences. Managing service qualityis concerned with managing the gaps between expectationsand perceptions on the part of management, employers andcustomers. The most important gap is that between customer’sexpectation of service and their perception of the service actuallydelivered and this is the gap that SERVQUAL is designed toinvestigate.
Many firms are nowadays focusing their efforts on maintaining aloyal customer base. This is particularly true in the financialservices sector where increasing competition, technology, socialand cultural factors have been the chief drivers of service qualityinitiatives in the last decade. Technology has facilitated theautomation of services (processing of accounts and transactions,er ror and cost reduct ion and increased ef f ic iency) .Improvements in IT and database competencies allowed theestablishment and development of telephone banking, creditcards and debit cards. Sophisticated automatic teller machines(which allowed cash withdrawals, balance enquiries andstatements) also became widespread. In the process of thesechanges, financial service providers moved from the processdriven control and check to a sales and customer orientation(Dalton, 1998). Service quality improvements were necessarynot only to reduce costs and increase competitiveness but alsoto improve revenue, by selling a greatly enlarged portfolio ofproducts to an increasingly wealthy, aware and demandingconsumer (Newman, 2001). Moreover Domegan (1996) statesthat the issue of attracting and retaining customers is of concernto managers. Recent evidence shows that improving the qualityof customer service is a key to achieving a competitive advantage.
The provision of IT-based service options, in itself, does notguarantee customer satisfaction. Johnson (1998) argues thatbanking technologies can affect customers’ perceptions ofservice quality either positively or negatively. To successfullyimprove customer satisfaction, IT-based services must be used
in a value-added manner determined by customers. Berkley andGupta (1994) develop a model to describe how bankingtechnologies can be used to specific service quality dimensionsincluding reliability, responsiveness, competence access,communications, security, understanding and knowing thecustomers, and quality control.
Methodology
Secondary data were initially gathered from bank personnel toclarify the concepts of SSTs that banks offer. In addition, a fewexperience surveys were conducted with banking personnel toshed light on this subject. The population studied consisted ofthe Mauritian adult (18 years and above). A quota sample of 150adults was interviewed, with quotas set in terms of age andgeographic district. In order to set these quotas, recent datafrom the Central Statistical Office (CSO) have been used.
Based on the literature search of renowned researchers in thedomain of service quality in banking, a questionnaire wasformulated to investigate customers’ knowledge about bankingtechnologies and to measure expectations of performance priorto the service encounter as well as perceptions of performancein the course of or after service encounter. The differencesbetween perceptions and expectations were calculated. Thesegaps give an indication of the service quality of bankingtechnologies. A pilot test of the questionnaire was conductedamong ten bank customers. Some corrections were made tothe initial questionnaire. The questionnaire survey approach wasthen administered using the personal/face-to-face interviewssince this was considered as the most effective one in terms ofresponse rate and clarification of questions. The fieldwork wasconducted by an exit interview that is, waiting for people infront of banks.
Analysis and Discussion
This section consists of an assessment of the awareness of SSTsand the reasons they are used, the evaluation of service qualityfor banking technologies and the analysis of the SERVQUALdimensions across the banking technologies considered. Finally,several hypotheses are tested.
The majority of respondents visit their bank branch to eitherwithdraw cash (30.9 per cent) or to make a deposit (28.9per cent). This gives an indication that some people prefer toconduct their transactions at bank tellers instead of using ATMs.Moreover, the level of awareness on the availability o f t he
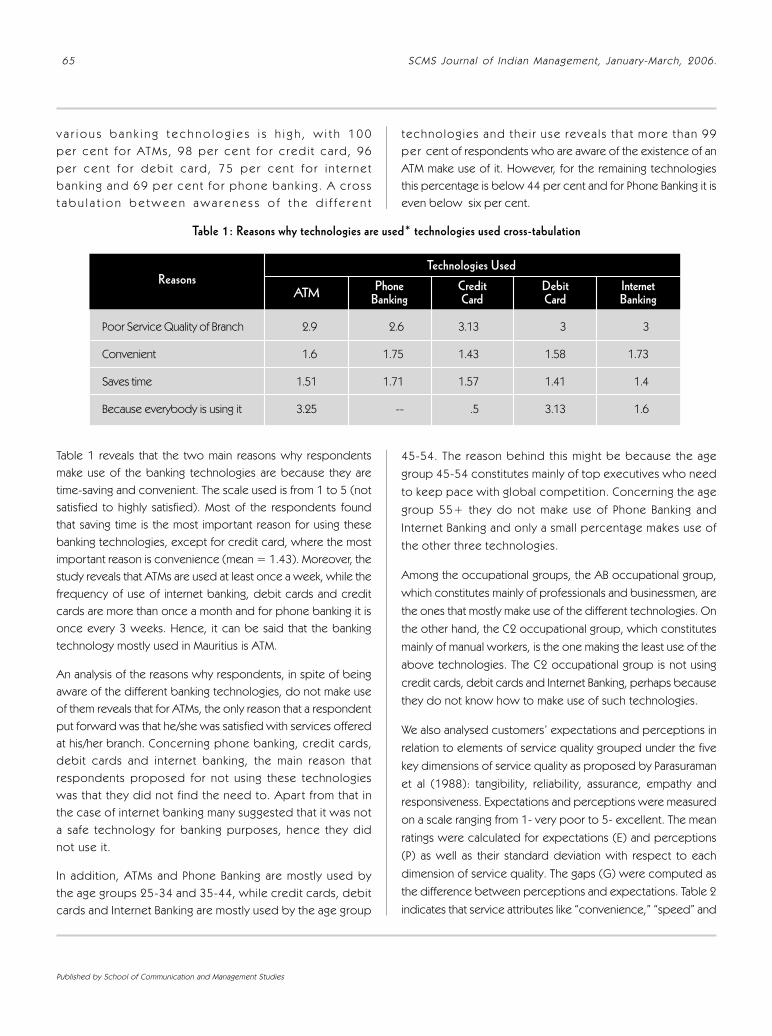
65 SCMS Journal of Indian Management, January-March, 2006.
Published by School of Communication and Management Studies
v a r i o u s b a n k i n g t e c h n o l o g i e s i s h i g h , w i t h 1 0 0per cen t fo r ATMs , 98 pe r cen t fo r c red i t ca rd , 96pe r cen t fo r deb i t ca rd , 75 pe r cen t fo r i n te rne tbank ing and 69 pe r cen t fo r phone bank ing . A c rosst a b u l a t i o n b e t w e e n a w a r e n e s s o f t h e d i f f e r e n t
techno log ies and the i r use revea l s tha t more than 99per cent of respondents who are aware of the existence of anATM make use of it. However, for the remaining technologiesthis percentage is below 44 per cent and for Phone Banking it iseven below six per cent.
45-54. The reason behind this might be because the agegroup 45-54 constitutes mainly of top executives who need
to keep pace with global competition. Concerning the agegroup 55+ they do not make use of Phone Banking and
Internet Banking and only a small percentage makes use ofthe other three technologies.
Among the occupational groups, the AB occupational group,which constitutes mainly of professionals and businessmen, are
the ones that mostly make use of the different technologies. Onthe other hand, the C2 occupational group, which constitutes
mainly of manual workers, is the one making the least use of theabove technologies. The C2 occupational group is not using
credit cards, debit cards and Internet Banking, perhaps becausethey do not know how to make use of such technologies.
We also analysed customers’ expectations and perceptions inrelation to elements of service quality grouped under the five
key dimensions of service quality as proposed by Parasuramanet al (1988): tangibility, reliability, assurance, empathy and
responsiveness. Expectations and perceptions were measuredon a scale ranging from 1- very poor to 5- excellent. The mean
ratings were calculated for expectations (E) and perceptions(P) as well as their standard deviation with respect to each
dimension of service quality. The gaps (G) were computed asthe difference between perceptions and expectations. Table 2
indicates that service attributes like “convenience,” “speed” and
Table 1: Reasons why technologies are used* technologies used cross-tabulation
Poor Service Quality of Branch 2.9 2.6 3.13 3 3
Convenient 1.6 1.75 1.43 1.58 1.73
Saves time 1.51 1.71 1.57 1.41 1.4
Because everybody is using it 3.25 -- .5 3.13 1.6
Technologies UsedInternetBanking
DebitCard
CreditCard
PhoneBankingATM
Reasons
Table 1 reveals that the two main reasons why respondentsmake use of the banking technologies are because they aretime-saving and convenient. The scale used is from 1 to 5 (notsatisfied to highly satisfied). Most of the respondents foundthat saving time is the most important reason for using thesebanking technologies, except for credit card, where the mostimportant reason is convenience (mean = 1.43). Moreover, thestudy reveals that ATMs are used at least once a week, while thefrequency of use of internet banking, debit cards and creditcards are more than once a month and for phone banking it isonce every 3 weeks. Hence, it can be said that the bankingtechnology mostly used in Mauritius is ATM.
An analysis of the reasons why respondents, in spite of beingaware of the different banking technologies, do not make useof them reveals that for ATMs, the only reason that a respondentput forward was that he/she was satisfied with services offeredat his/her branch. Concerning phone banking, credit cards,debit cards and internet banking, the main reason thatrespondents proposed for not using these technologieswas that they did not find the need to. Apar t from that inthe case of internet banking many suggested that it was nota safe technology for banking purposes, hence they didnot use it.
In addition, ATMs and Phone Banking are mostly used bythe age groups 25-34 and 35-44, while credit cards, debitcards and Internet Banking are mostly used by the age group

66 SCMS Journal of Indian Management, January-March, 2006.
Published by School of Communication and Management Studies
“time-saving” were rated as having the highest expectationscores, while others like “high security” and “physical safety” at
ATM terminals were rated among those with the lowestexpectation scores. This implies that customers expected service
encounters in the former cases to be exceptionally high.
Moreover, actual service encounters revealed that for most of
the attributes, actual perceptions fell short of the expectationlevels. Just to mention a few, attributes pertaining to “staff giving
adequate explanation of service,” “allows easier/efficient control
of your account,” “tone of voice of operator friendly,” and“reliability” registered the most significant discrepancy betweenexpectations and perceptions. However, alongside, “speedy,”“easy to understand” and “easy to use” attributes noted thesmallest departure from expectations, though still negative. Thesefigures should be interpreted with caution. It is equally importantto take into account the standard deviation (SD) scores, whichprovide useful information about the pattern of responding.Attributes with higher SD scores are those where divergence ofopinion exists to a large extent.
Table 2: SERVQUAL dimensions for banking technologies in general
P-E
GapSERVQUAL Dimensions
Perception (P) Expectation (E)
Mean S.D. Mean S.D.
Tangibility
- Physical safety at ATM Terminal 3.49 0.92 2.68 1.09 - 0.81
Total 3.49 2.68 -0.81
Reliability
- Easy to use 4.15 0.91 3.78 0.84 0.37
- Accessibility 4.23 0.98 3.53 0.87 - 0.50
- Reliability 3.99 0.77 3.21 0.86 - 1.02
- Accuracy 3.99 1.07 3.45 0.75 - 0.54
TTTTTotal 4.09 3.49 -0.60
Assurance
- High Security 3.31 1.36 2.75 0.93 - 0.56
Total 3.31 2.75 -0.56
Empathy
- Easy to understand 4.11 1.02 4.04 0.73 - 0.07
- Tone of voice of operator friendly 3.92 0.95 2.92 0.87 - 1.00
- Staff giving adequate explanation of service 3.82 0.93 2.54 0.83 - 1.28
- Allows easier/efficient control of your account 4.18 0.95 3.18 0.99 -1.00
Total 4.01 3.17 -0.84
Responsiveness
- Convenience 4.64 0.57 4.13 0.83 - 0.51
- Speed 4.58 0.67 4.19 0.71 - 0.39
- Time-saving 4.26 0.86 4.21 0.71 - 0.05
Total 4.49 4.18 -0.31

67 SCMS Journal of Indian Management, January-March, 2006.
Published by School of Communication and Management Studies
From Table 2 attributes like “physical safety at ATM terminal,”“allowing efficient control of accounts” and “high security” havehigh standard deviation scores for perceptions, implying thatbank customers’ opinions differ to a large extent. One explanationcould be that customers across different age and occupationalgroups could be having different experiences of these issues.
On the whole, responsiveness has noted the highest expectationscore, followed by reliability, empathy, tangibility and lastlyassurance. As far as gaps are concerned, empathy accounts forthe largest negative gap, followed by tangibility, reliability,assurance and responsiveness. This is in contrast with the findingof Zeithaml et al. (1990) where reliability is the most importantdimension and tangibility the least important in their study of1936 customers of two banks, two insurance companies and along-distance telephone company.
Appendix 1 (Table 3) illustrates expectations and perceptionsscores attributed to the SERVQUAL dimensions applicable foreach of the banking technologies investigated namely ATMs,phone banking, credit cards, debit cards and internet banking.Expectation or the desired service level mean scores for ATMsrange from 3.34 to 4.65 (from average to excellent). “Speed” isthe attribute with the highest expectation mean score. The strongnegative gap, however, indicates that it is not so in reality. Wegenerally tend to believe that ATMs are speedy because we donot wait in long queues inside the bank. Interestingly customersdo not have to wait outside at ATM terminals, especially at peakhours. At times, it is even better to withdraw cash inside thebank, which is relatively speedier than at the ATM terminal. Thisdoes not mean that the technology is not speedy. Indeed, it isspeedy, but circumstances, such as long queues, need forreplenishment and ATMs being out of order might account forthe negative gap associated with the service attribute of speed.However, the high SD score shows that opinions varyconsiderably across customers from different bankinginstitutions.
Appendix 1 also indicates that for ATMs attributes associatedwith the responsiveness dimension have obtained high scoresfor expectations, followed by reliability. Interesting features ofthis table are the two positive gaps identified for “time saving”and “ease of use” under the responsiveness and reliabilitydimensions respectively. They indicate instances where actualservice encounters have exceeded expectations, which accountfor one of the various factors leading to customer satisfaction.For the remaining attributes negative gaps have been observed
reflecting poor service encounters well below the expectedservice level. Overall, the results of ATMs are quite different fromthose of Table 2. Positive gaps had not been noted in the firstinstance. Thus, while Table 2 might suggest that service quality isnegative/poor across all the attributes, an analysis of the individualtechnologies might indicate otherwise.
Attributes relating to phone banking have been categorised asforming par t of re l iabi l i ty, assurance, empathy andresponsiveness, whereby responsiveness is characterised bythe highest expectations scores. As far as gaps are concerned,all four dimensions for this technology are showing negativegaps, implying that actual service encounters have not beenabove the expected service, thus giving an indication of poorservice quality. The highest negative gaps are those of empathy(-1.00) and assurance (-0.73). Results show that very highexpectations had been initially set for this technology, which isquite new in the Mauritian context. It could also imply that dueto information gaps, customers have not been well acquaintedwith the technology prior to use. Referring to the tone of voiceof the operator being friendly, which has been assigned anegative gap score; the deficiency might not rest solely on thetelephone operator. These people might be doing this type ofwork on a daily basis, which might lead to boredom and thuslack of interest in their jobs. It is then a matter of reviewing thehuman resource policies and not really improving the servicequality.
Responsiveness has been rated the most highly expected servicedimension for credit cards, with a mean expectation score of4.64, followed by reliability (4.19). Besides, all dimensions scorednegative gaps, ranging from –0.41 to –1.14. The most seriouscase is that of staff giving adequate explanation of use (–1.28),whereas convenience denotes the smallest negative gap (-0.30).Viewed from another perspective, if customers do not make aneffor t to inquire about an explanation on the use of thistechnology, bank staff will not be able to provide any guidance.
The expected service level for the responsiveness servicedimension for debit cards is highest (4.64) as compared to theother SERVQUAL dimensions. The trend is different for the gapswhere empathy (efficient control of customers’ bank account)has been identified as having the largest discrepancy betweenexpectation and perception. Similarly the reliability of debit cardshas been subject to a negative gap of –0.9. It has also beennoted that the assurance dimension shows a positive gap of0.01, implying that bank customers are quite satisfied with the

68 SCMS Journal of Indian Management, January-March, 2006.
Published by School of Communication and Management Studies
Tabl
e 3
: SER
VQU
AL
dim
ensio
n fo
r spe
cific
ban
king
tech
nolo
gies
SERV
QU
AL
Dim
ensi
ons
of
Bank
ing
Tech
nolo
gies
Inte
rnet
Ban
king
Deb
it Ca
rdCr
edit
Card
Pho
ne B
anki
ngA
TMs
EP
G*
EP
G*
EP
G*
EP
G*
EP
G*
Mean
SD
Mean
SD
P-E
Mean
SD
Mean
SD
P-E
Mean
SD
Mean
SD
P-E
Mean
SD
Mean
SD
P-E
Mean
SD
Mean
SD
P-E
Tang
ibili
ty- P
hysi
cal
safe
ty a
t ATM
Term
inal
Tota
l3.
492.
680.
81Re
liab
ility
- Ea
sy to
use
4.24
0.96
4.35
0.53
0.11
4.10
0.87
3.83
0.83
0.27
4.16
0.93
3.76
0.76
0.40
4.26
0.75
3.86
0.83
0.40
3.99
1.03
3.10
1.23
0.89
- A
cces
sib
ility
4.16
0.96
4.03
0.76
0.13
4.00
1.00
3.76
0.78
0.24
4.13
0.89
3.43
0.93
0.70
4.11
1.01
3.57
0.93
0.54
3.77
1.02
2.86
0.93
0.91
- Rel
iab
ility
4.40
0.75
3.70
0.83
0.70
3.91
0.93
2.79
0.80
1.12
4.29
0.77
3.31
0.88
0.98
4.33
0.72
3.43
0.81
0.90
4.24
0.66
2.81
0.97
1.43
- Acc
urac
y4.
191.
054.
050.
640.
143.
641.
192.
920.
790.
724.
140.
983.
370.
820.
77To
tal
4.25
4.03
0.22
3.91
3.32
0.59
4.19
3.50
0.69
4.23
3.62
0.61
4.04
3.04
1.00
Ass
uran
ce-
Hig
h Se
curit
y3.
341.
393.
050.
980.
293.
131.
442.
400.
780.
733.
521.
342.
860.
880.
663.
241.
413.
250.
890.
013.
301.
252.
191.
101.
11To
tal
3.34
3.05
0.29
3.13
2.40
0.73
3.52
2.86
0.66
3.24
3.25
0.01
3.30
2.19
1.11
Empa
thy
- Ea
sy to
4.11
1.02
4.04
0.73
0.07
und
erst
and
- To
ne o
f vo
ice
of o
per
ato
r is
3.92
0.95
2.92
0.87
1.00
frien
dly
- Sta
ff gi
ving
adeq
uate
exp
lana
tion
of
3.82
0.73
2.54
0.83
1.28
serv
ice
- Allo
ws
easie
r/ef
ficie
nt c
ontro
l4.
190.
963.
190.
931.
004.
160.
943.
171.
050.
99of
you
r acc
ount
Tota
l4.
114.
040.
073.
922.
921.
004.
012.
871.
144.
163.
170.
99Re
spon
siven
ess
- Co
nven
ienc
e4.
610.
583.
830.
980.
784.
720.
603.
960.
830.
764.
600.
544.
300.
790.
304.
710.
514.
650.
980.
064.
570.
584.
510.
540.
06- S
pee
d4.
650.
603.
910.
790.
744.
540.
784.
210.
620.
334.
470.
734.
490.
610.
02-
Tim
e-sa
ving
4.11
1.01
4.18
0.76
0.07
4.47
0.66
3.97
0.82
0.50
4.19
0.90
4.49
0.56
0.30
- Ef
ficie
nt a
ndfa
st m
eans
of
4.69
0.62
4.16
0.72
0.53
4.56
0.64
4.16
0.81
0.40
pay
men
tTo
tal
4.46
3.97
0.49
4.58
4.05
0.53
4.64
4.23
0.41
4.64
4.41
0.23
4.41
4.50
0.09
3.49
0.92
2.68
1.09
0.81
*Und
erlin
ed f
igur
es r
epre
sent
neg
ativ
e fig
ures
.
APP
END
IX 1
69 SCMS Journal of Indian Management, January-March, 2006.
Published by School of Communication and Management Studies
service quality of debit cards as being a secure form of payment.Overall satisfaction depends on various other issues including agood quality of service.
The mean expectation scores for internet banking varies from3.30 to 4.57 (from average to excellent) while the mean scorefor perceptions are lower, ranging from 2.19 to 4.51. Two ofthe dimensions, namely reliability and assurance display overallnegative gaps. The reliability gap relates to the accessibility ofcustomers to internet and the difficulty that the latter mightbe facing in using Internet. This cannot be wholly attributedto a shor tcoming on behalf of the bank, especially if peoplemight not have access to the Internet.
We also attempted to assess the SERVQUAL dimensionsacross the f ive technologies under consideration. It isimpor tant to note that only reliability, assurance, empathyand responsiveness scores have been compared across thesefive technologies since tangibility applies only to ATMs. Withreference to the total mean expectations scores, it can besaid that for all technologies, these are above four, implyingthat customers expect a performance level varying from goodto excellent. Conversely, perceptions are at an average,thereby generating negative gaps. These are impor tantindicators for bank authorit ies. The implicat ion is thatsomething has gone wrong in the service delivery processand bank authorities need to investigate the reasons for sucha discrepancy, since service quality, among other thingsaccounts for overall customer satisfaction.
As regards the reliability dimensions, customers had thehighest expectation with regards to ATMs and the lowest forinternet banking, most probably because the former has abetter usage rate, resulting in expectations being highest.Overall, reliability denotes negative service quality gaps for allthe banking technologies.
The study also showed a positive assurance score for debitcards only. This gives an indication that customers view debitcards safer as compared to cash, cheques or credit cards.Internet banking has the largest assurance gap of –1.11. Thisnegative gap could be explained by the fact that bankcustomers might be reluctant to use such a technologybecause of security concern, especially since hackers maybreak into computer systems and access customer accounts.Security issues need to be taken seriously into considerationif customers want to improve the service quality. Assurance
scores are negative for other technologies as well. The mostper tinent reason is again related to security issues.
Only four technologies have been considered for the empathydimension, namely ATMs, phone banking, credit card anddebit card. Users of debit cards and ATMS have higherexpectations of these technologies, with mean scores of4.16 and 4.11 respectively. However, there are large gapsthat exist for technologies like debit cards, credit cards andphone banking. Negative gaps tend to give an indication ofpoor service quality. In the case of phone banking, the reasonfor such a gap might be because the tone of voice of theoperator is not friendly; while for debit and credit cards thereason might be inadequate explanation of these services onthe part of bank staff.
As regards the responsiveness dimension only internetbanking has obtained a positive gap of 0.09. This has beenattributed mainly to the speed of transactions, which is timesaving. The other four technologies have demonstratednegative gaps, with highest one being –0.53 for phonebanking, owing to criticisms on the speed, convenience,reliability and security issues.
Hypothesis Testing
This part deals with testing seven hypotheses. The hypothesesdeal with how customers from different age groups as wellas occupational groups assess the service quality of bankingtechnologies. It has been assumed that there are significantdifferences in the service quality assessment of bankingtechnologies across age and occupational groups. It has tobe noted that in developing these hypotheses, only thedemographic variables have been used, that is, age groupand occupational group.
ANOVA was performed to identify significant differences inthe mean perception of the 42 different service qualityattributes of banking technologies across the different agegroups. The null hypothesis (H01) is rejected since thep-value = 0.032. This implies that there are indeed significantdifferences in the mean perception of service quality attributesof banking technologies across age groups.
Moreover, with reference to the different occupational groups(H2), we find significant differences in the mean perceptionof service quality attributes of banking technologies acrossdifferent occupational groups. To compare the means of the
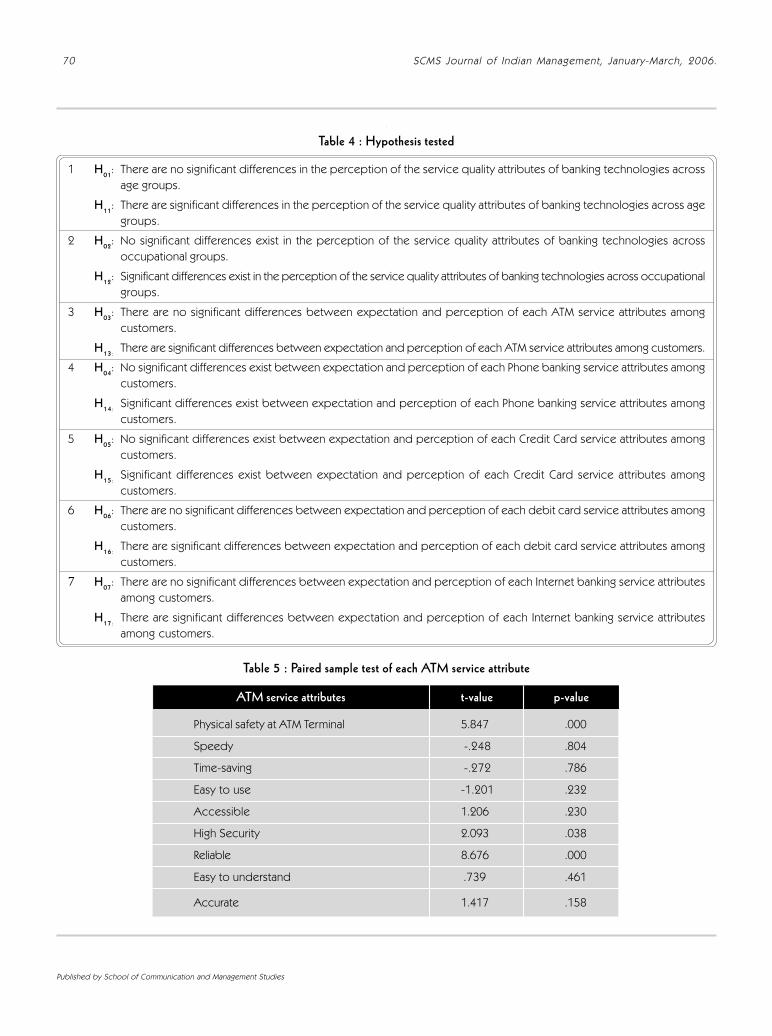
70 SCMS Journal of Indian Management, January-March, 2006.
Published by School of Communication and Management Studies
Table 4 : Hypothesis tested
1 H01: There are no significant differences in the perception of the service quality attributes of banking technologies acrossage groups.
H11: There are significant differences in the perception of the service quality attributes of banking technologies across agegroups.
2 H02: No significant differences exist in the perception of the service quality attributes of banking technologies acrossoccupational groups.
H12: Significant differences exist in the perception of the service quality attributes of banking technologies across occupationalgroups.
3 H03: There are no significant differences between expectation and perception of each ATM service attributes amongcustomers.
H13: There are significant differences between expectation and perception of each ATM service attributes among customers.
4 H04: No significant differences exist between expectation and perception of each Phone banking service attributes amongcustomers.
H14: Significant differences exist between expectation and perception of each Phone banking service attributes amongcustomers.
5 H05: No significant differences exist between expectation and perception of each Credit Card service attributes amongcustomers.
H15: Significant differences exist between expectation and perception of each Credit Card service attributes amongcustomers.
6 H06: There are no significant differences between expectation and perception of each debit card service attributes amongcustomers.
H16: There are significant differences between expectation and perception of each debit card service attributes amongcustomers.
7 H07: There are no significant differences between expectation and perception of each Internet banking service attributesamong customers.
H17: There are significant differences between expectation and perception of each Internet banking service attributesamong customers.
Table 5 : Paired sample test of each ATM service attribute
Physical safety at ATM Terminal 5.847 .000
Speedy -.248 .804
Time-saving -.272 .786
Easy to use -1.201 .232
Accessible 1.206 .230
High Security 2.093 .038
Reliable 8.676 .000
Easy to understand .739 .461
Accurate 1.417 .158
ATM service attributes t-value p-value
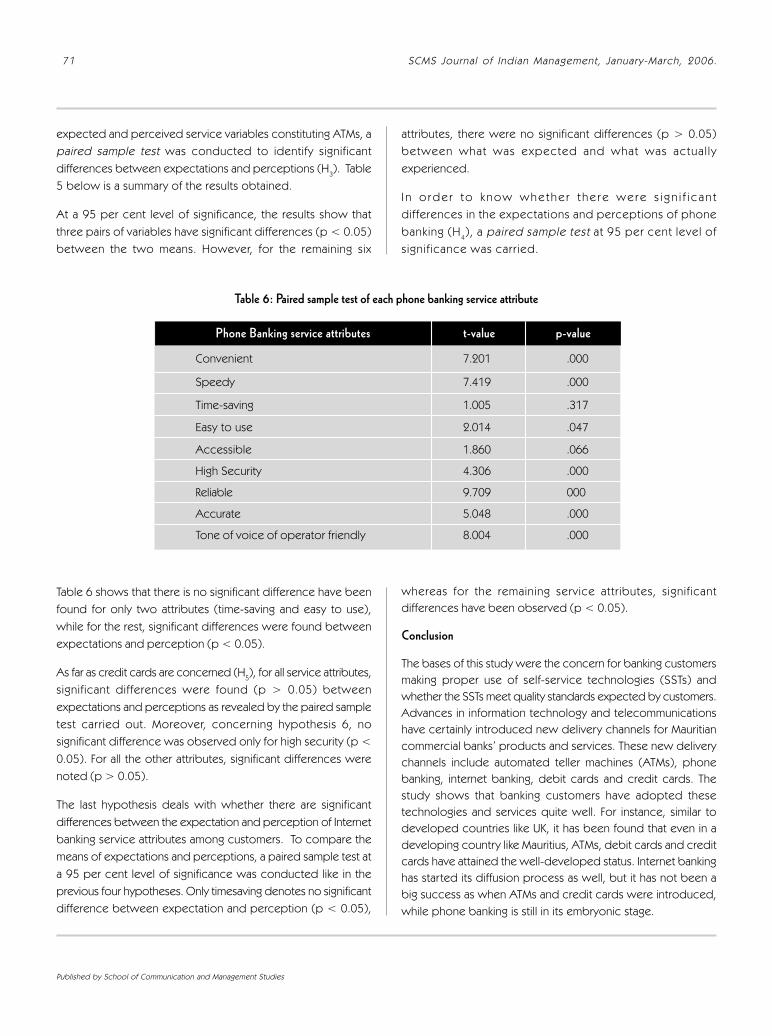
71 SCMS Journal of Indian Management, January-March, 2006.
Published by School of Communication and Management Studies
expected and perceived service variables constituting ATMs, apaired sample test was conducted to identify significantdifferences between expectations and perceptions (H3). Table5 below is a summary of the results obtained.
At a 95 per cent level of significance, the results show thatthree pairs of variables have significant differences (p < 0.05)between the two means. However, for the remaining six
attributes, there were no significant differences (p > 0.05)between what was expected and what was actua l lyexperienced.
I n o r d e r t o k n o w w h e t h e r t h e r e w e r e s i g n i f i c a n tdifferences in the expectations and perceptions of phonebanking (H4), a paired sample test at 95 per cent level ofsignif icance was carr ied.
Table 6 shows that there is no significant difference have beenfound for only two attributes (time-saving and easy to use),while for the rest, significant differences were found betweenexpectations and perception (p < 0.05).
As far as credit cards are concerned (H5), for all service attributes,significant differences were found (p > 0.05) betweenexpectations and perceptions as revealed by the paired sampletest carried out. Moreover, concerning hypothesis 6, nosignificant difference was observed only for high security (p <0.05). For all the other attributes, significant differences werenoted (p > 0.05).
The last hypothesis deals with whether there are significantdifferences between the expectation and perception of Internetbanking service attributes among customers. To compare themeans of expectations and perceptions, a paired sample test ata 95 per cent level of significance was conducted like in theprevious four hypotheses. Only timesaving denotes no significantdifference between expectation and perception (p < 0.05),
whereas for the remaining service attributes, significantdifferences have been observed (p < 0.05).
Conclusion
The bases of this study were the concern for banking customersmaking proper use of self-service technologies (SSTs) andwhether the SSTs meet quality standards expected by customers.Advances in information technology and telecommunicationshave certainly introduced new delivery channels for Mauritiancommercial banks’ products and services. These new deliverychannels include automated teller machines (ATMs), phonebanking, internet banking, debit cards and credit cards. Thestudy shows that banking customers have adopted thesetechnologies and services quite well. For instance, similar todeveloped countries like UK, it has been found that even in adeveloping country like Mauritius, ATMs, debit cards and creditcards have attained the well-developed status. Internet bankinghas started its diffusion process as well, but it has not been abig success as when ATMs and credit cards were introduced,while phone banking is still in its embryonic stage.
Table 6: Paired sample test of each phone banking service attribute
Convenient 7.201 .000
Speedy 7.419 .000
Time-saving 1.005 .317
Easy to use 2.014 .047
Accessible 1.860 .066
High Security 4.306 .000
Reliable 9.709 000
Accurate 5.048 .000
Tone of voice of operator friendly 8.004 .000
Phone Banking service attributes t-value p-value

72 SCMS Journal of Indian Management, January-March, 2006.
Published by School of Communication and Management Studies
Moreover, customers were found to have very high expectationsof service from banks across most of the dimensions that wereinvestigated, in particular aspects relating to responsiveness andreliability dimensions. However, the level of perceptions of actualservice was below expectations levels. This has resulted in anumber of gaps between expectations and perceptions, andtherefore there are number areas where enhancement is neededin order to improve service quality. For instance, banks mayattempt to increase the usage of banking technologies throughmarket segmentation and promotion. In addition, banks needto raise the security level for internet banking and credit cardpayments.
References
Berkley, B and Gupta, A ., “Improving Service Quality withInformation Technology,” International Journal ofInformation Management, Vol. 14, 109-121, 1994.
Dalton, W., “Speech at Middlesex University Business School,”London, 1998.
Domegan, C.T., “The adoption of information technology incustomer service,” European Journal of Marketing, Vol.30, No. 6, 52-69, 1996.
Edvardsson, B., “Service quality Improvement,” Managing ServiceQuality, Vol. 8, No. 2, 142-149, 1988.
Gale, B.T., “Managing Customer Value: Creating Quality and Servicethat Customers can see,” The Free Press, New York, NY,1994.
Grönroos, C., “Service Quality: The Six Criteria of Good PerceivedService Quality,” Review of Business, 9-13, 1988.
Johnson, A., “How do you really feel about your bank?,”Canadian Business, Vol. 71, No. 7, 1988.
Joseph, M, McClure, C and Joseph, B., “Service quality in thebanking sector: the impact of technology on servicedelivery,” International Journal of Bank Marketing, Vol.17, No.4, 1999.
Joseph, M and Stone, G., “An empirical evaluation of US bankcustomer perceptions of the impact of technology onservice delivery in the banking sector,” InternationalJournal of Retail and Distribution Management, Vol.31,No.4, 2003.
Lawrence, L.S and Karr, J., ‘Technology spending and alliances:new highs in financial services firms,” Journal of RetailBanking Services, Vol. 17, No. 3, 45-52, 1996.
Newman, K., “Interrogating SERVQUAL: a critical assessment ofservice quality measurement in a high street retail bank,”The International Journal of Bank Marketing, Vol. 19,No. 3, 126-139, 2001.
Parasuraman, A, Zeithaml, V.A and Berry, L.L., “SERVQUAL: AMult ip le- i tem Scale for Measur ing ConsumerPerceptions of Service Quality,” Journal of Retailing, Vol.64, 12-40, 1988.
Parasuraman, A, Zeithaml, V.A and Berry, L.L., “More on improvingservice quality measurement,” Journal of Retailing, Vol.69, No. 1, 22-33, 1993.
Reisman, A and Zhao, L., “A Taxonomy of Technology TransferTransaction Types,” Journal of Technology Transfer,Spring, 38-42, 1991.
Zeithaml, V.A, Parasuraman, A. and Berry, L.L., “Delivery QualityService: Balancing Customer Perceptions and,” The FreePress, USA, 1990.

73 SCMS Journal of Indian Management, January-March, 2006.
Published by School of Communication and Management Studies
Efficiency of Public SectorEnterprises-A Case Study ofC.C.L., Ranchi-An Empirical Study
Dr.Susan Chirayath, Professor-OB & HR , SCMS
S c h o o l o f Te c h n o l o g y a n d M a n a g e m e n t
(SSTM), Prathap Nagar, Muttom, Aluva-683 106,
Kochi , Emai l : [email protected]
This paper highlights the efficiency of public sector enterprises with special reference to C.C.L., RANCHI,efficiency being defined in terms of (a) capital employed, (b) sales, (c) profit-gross and net – and (d)profitability ratio. Figures are obtained from the statements regarding the financial position, income and expenditurestatement, statements regarding important financial information and relative ratios. The total capital, employed istotal net assets, which includes fixed as well as working capital. In the fixed assets, the work in progress is alsoincluded. In the working capital, inventories, debtors, fund, cash and bank balances and other current assets areincluded. The study period is 1990-1991 to 1999-2000, long enough to know the behaviour of the variables.
fficiency in public enterprises is an important aspect ofthe study of industrial as well as managerial economics.It is the efficiency, which determines the growth of a firm
or an industry. The efficiently operatedenterprises help to accelerate the rateof growth of an economy. Butefficiency evaluation is a complex andmultifaceted problem particularly in apublic sector enterprise. Unlike in aprivate enterprise where the volumeof prof i t earned is genera l lycons idered a re l iable index ofefficiency, the performance evaluationof a public enterprise is a difficultproposition. The public enterprise isgenerally governed by the motto ofserving the national interest; it has tomeet several subjective criteria ofexcellence. But the question is howto judge the eff ic iency and the
subjective performance of a public sector enterprise.
In an economy like India where public sector enterprises havean impor tant ro le to p lay, theevaluation of the working of publicenterprises is very essential. It isargued that the economy of thecountry is not properly growing dueto the reason that public sector isnot running ef f ic ient ly . The lowefficiency of public sector enterprisesis the reason of the low rate ofdevelopment of industrial sector ofthe economy. This is the reason whyin the new economic policy, thepublic enterprise’s role in the economyhas been curtailed and disinvestmentspolicy has been adopted in the caseof inefficiently run public enterpriseunits of the country.
Susan Chirayath
E
74 SCMS Journal of Indian Management, January-March, 2006.
Published by School of Communication and Management Studies
The economists have used a number of indices to judge theefficiency of public enterprises viz., net income, production,boost in sale, and factors of productivity and growth of the firm.But profit and profitability i.e. profitability on capital andprofitability on sale are the most accepted criteria to judgeefficiency of public as well as private enterprise industrial units.
The mining industry in India is next to agriculture, in terms ofresource generation and employment opportunity. Coal miningoccupies a major position contributing nearly 60 per cent of thecommercial energy requirements in India, followed by iron-ore,limestone and bauxite. Coal India presently contributes 90 percent of the total coal production in India. It is the largest publicsector in terms of employment to the tune of 6,36,000 peopleproducing 250 million tonnes of coal per year. But the story ofCoal India is not merely the story of the unrelenting struggleagainst all odds to produce and supply coal throughout thecountry. It is also the story of the heartbeats of 6.4 lakhs ofemployees and their families working and staying at times, inremote areas of our country.
The Central Coal fields Ltd. (C.C.L.) is one of the subsidiaries ofCoal India Ltd. (C.I.L.), registered under the Company’s Act inthe year 1975. The mixing and extraction of coal is entrusted toCIL, which is a public sector organization. The company isdivided into eight subsidiaries and C.C.L. is one of them. It isthe major source of medium cooking coal in India. Theproductivity of under ground mines and many of the surfacemines is low, but because of the high price of cooking coal, thecompany has been making marginal profits and losses. With therecent deregulation of cooking coal price, the profitability ofthe company is expected to improve.
After adopting the new economic policy, there is much debateon the disinvestments in the public sector undertakings. Thereason given is the poor performance of these organizations.But, a public sector has not only the objective of profit making,it has also the objectives like use of natural and human resourcesavailable in the country, provision of commodities to theconsumer at a low price, development of infrastructure and anumber other things.
The researcher intends to examine to which extent this public sectorunit is able to achieve these objectives and what is the trend of thefinancial as well as production performance of this unit.
The study also seeks to examine the trend of capital investment,production, sale, profit (gross and net) of the C.C.L. The study
has not only theoretical impor tance, but, it has policyimplications, it will help the policy makers of C.C.L. to changethe strategy to improve the performance of the unit.
Objectives of the study
The objectives of the study were the following:
1. To assess the efficiency of public sector enterprises, withreference to C.C.L., the efficiency being defined in terms of
a. Capital employed,
b. Sales,
c. Profit-gross and net and
d. Profitability ratio.
Review of Literature
The efficiency evaluation is a complex as well as an importantproblem, particularly in public enterprises. Though it has attractedthe attention of number of economists all over the world, thereis still controversy on the index of the efficiency of publicenterprises. Attempts have been made by some economists toexamine the relationships between the indices of efficiency andcertain economic factors. Net income is considered as one ofthe criteria for measuring the efficiency of public enterprises,according to Ivan Turk (1974) 1. According to Lal (1974) 2. andGanguly (1984) 3. the increasing volume of production showshigher efficiency. Capital output ratio is one of the indices ofefficiency as considered by economists like Collins and Preston(1974) 4. Average productivity of labour is used frequentlybecause of the relative ease to present productivity level,according to Clay and Walley (1965). 5. According to Galbraith(1962), 6. profits is the general criterion, which indicates theoverall efficiency combining all the different operations together.The lower the cost per unit of output, the higher would be theefficiency of public enterprise, according to Gupta (1968)7.According to Kumaran (1986), debt-equity ratio too has animpor tant role in determining the efficiency of a publicenterprise.
Thus, there is no dearth of literature on the indices of efficiencyevaluation of public enterprises. But not much has been doneto examine empirically the behaviour and trend of the importantindices of efficiency of a public enterprise. No systematicempirical work has been done to examine the factors, whichdetermine the efficiency of a public sector enterprise like theCentral Coal Fields.

75 SCMS Journal of Indian Management, January-March, 2006.
Published by School of Communication and Management Studies
Hypotheses Tested in the Study
1. There is no change in the total capital employed in the C.C.L.,during 1990-1991 to 1999-2000.
2. The volume of sale has not changed during this period;
3. There is no change in the profit-gross and net- of the C.C.L.,during this period,
4. The profitability ratio i.e., profit on capital, profit on sale,prof i t on work ing capita l have remained unchangeddur ing the s tudy per iod.
Methodology
A.Data Source
Data source is secondary; ie., the relevant information arecollected from the annual reports and accounts published bythe C.C.L.
Figures are obtained from the statements regarding financialposition, income and expenditure statement, statementsregarding important financial information and relative ratios.
In this study, total capital employed is total net assets, whichincluded fixed as well as working capital. In the fixed assets, thework in progress is also included. In the working capital, weinclude inventories, debtors, fund, cash and bank balances andother current assets.
B. Data Analysis
In the study, there is computation of cer tain statistics likearithmetic mean, standard deviation and, co-efficient of variationof the variables. The linear trends of the variables like capital,sale, profit and profitability have been fitted by ordinary leastsquare method and significance of the co-efficient are testedby ‘t’ test. The index numbers of the variables have beenestimated to know the changes in the variables during the studyperiod.
Efficiency of PSEs: A theoretical study
Measurement means quantification. There is no unique methodof measurement for industrial efficiency or its components. It isdifficult to formulate a simplified, objective test for this purpose.The difficulty to evaluate efficiency of a firm to any definite degreeis due to the multiple use of the term ‘efficiency’ with referenceto expenditure and income, effor ts and satisfaction, withachievement-and products etc. The difficulty is compounded
by the fact that not all these indicators are always consistentwith each other, and therefore any attempt to combine theminto one composite efficiency index will reflect more ajudgmental bias if not an exercise in futility. A firm may set itsown standards of output for each input and norms of behaviourfor various other achievements; but whether the level of standardor norm is right is not easy to ascertain.
Moreover, it becomes necessary to compare one situationwith a similar situation in other places or in the same placeover a period of time. The measurement of efficiency alsoinvolves a large number of interdependent variable likeproduction, costs, prices, the nature of industry (slow orlow yielding), the size of the industry (big and muchcomplicated having many managerial problems), the natureof public accountability (public enterprises are procedureoriented rather than result oriented) and the social obligationof the enterprise (it has to fulfil l social obligations of thegovernment). One can measure the technical efficiencythrough some physical indicators such as capital-outputratio, capital- labour ratio or actual cost-standard cost ratioetc. The last ratio, i.e., actual cost-minimum possible cost,may also be used to measure the internal efficiency of thefirm. The overall efficiency of the firm, whether we takeproductive eff iciency or economic eff iciency, may bedifficult to measure precisely. Even if all of them wereamenable to precise measurement, which is not true in actualpractice, there still remains the problem of attaching suitableweights to d i f fe rent va r i ab les . Cons idera t ion has tobe g iven , fo r ins tance, to the cos t o f product ion ofse rv ice per un i t o f resource , the sa t i s fac t ion of theconsume r s i n r e spec t o f quan t i t i e s , qua l i t i e s andpr ices , the s ta te o f l abour re la t ions and degree towhich a spi r i t of wi l l ing cooperat ion has been createda m o n g m e m b e r s o f s t a f f , a n d t h e a b i l i t y o f t h ewhole organ iza t ion to ad jus t i t se l f to the chang ingc i rcumstances , i t s readiness to make exper iments andto qu ick ly adopt the l a tes t techn ica l improvements .Thus , t he pe r fo rmance reco rd o f t he na t iona l i zedindus t ry i s a cont rovers ia l th ing . I t def ies the s impledescr ipt ion or eva luat ion .
Economists examine the performance of publicenterprises by various approaches
1. Profit and loss approach
2. Balance sheet approach

76 SCMS Journal of Indian Management, January-March, 2006.
Published by School of Communication and Management Studies
3. Fiscal approach
4. Employment approach
5. Cost accounting approach
6. Productivity approach
7. Development and stability approach
Considering all these aspects, we may say that efficiency of apublic enterprise can be judged by examining the followingelements of the enterprise:
1. Value and volume of production
2. Factor productivity
3. Profit and profitability
4. Size of employment
5. Cost of production
6. Utilisation of installed capacity
7. Time schedule
8. Capital accumulation
9. Contribution to the State Treasury.
The efficiency of a public enterprise, which is generally revealedby the volume of production and productivity factor, profit andprofitability, size of employment etc. is affected by a number offactors. The factors affecting efficiency are investment, capital –labour ratio, debt-equity ratio, gross fixed asset to current ratio,wage rate, and interest rate.
Thus, the efficiency of a public enterprise depends on a numberof interrelated factors. The effect of an individual factor is notdefinite. It varies from enterprise to enterprise, time to time, andits impact changes due to the change in the circumstances.Therefore, it is very difficult to evaluate the impact of a particularfactor in the determination of efficiency of a public enterprise.
Introduction to Central Coal Fields Limited (CCL)
The Central Coalfields Limited (CCL) is one of the subsidiaries ofCoal India Limited (CIL), registered under the Company’s Act inthe year 1975. The mining and extraction of coal is entrusted tothe public sector organization, CIL. The Company is divided intoeight subsidiaries and CCL is one of them.
All the mines and establishment of CCL at present are situated inthe districts of Ranchi, Hazaribagh, Giridih, Bokaro and Palamu.CCL has fifteen areas headed by CGM/GM with uniformorganizational set up. The total manpower of the company ason 31.3.2002 was 91,649.
Main Objectives of CCL.
1. A . To carry on the business of coal mining
B. Acquisition of coal mining
C. To produce or otherwise engage generally in theproduction, sale and disposal of coal, its by-product.
D. Mining coal, manufacturing coke, and otherbusiness,
E. Manufacturing, trading and other business.
2. Reorganization and reconstruction of coalmines taken overby the government.
3. Policy formulation and advisory function
4. To finance replacement expenditure, to develop technicalknow-how
5. Exploration and Prospecting
6. To manufacture and sell coal as a patent fuel
7. To carry on mining and quarrying coal and other by- productdirectly or through agents.
8. To act as traders of coal and coke and other by-productsdirectly or through agents.
9. To manufacture coke and mine proprietors coke in all theirrespective branches.
The main project objectives are to support the market-orientedreform India is undertaking in the coal sector and especially toprovide financial and technical support to Coal India’s efforts tomake itself commercially viable and self-sustaining under pinningIndia’s broad drive to achieve economic growth. The projectalso aims to increase domestic supplies of Coal India for thepower sector and other industries until imports and productionfrom private investments can fill the emerging supply gap.
Efficiency in CCL-An Empirical Analysis
1. To find out where there is any change in the total capitalemployed in the CCL, during the study period 1990-91 to1999-2000 - the trend co-efficient was found out. Theresults are summarized in Table 1.
Table.1 Shows the figure of capital (K) employed in CCL, during1990-1991 to 1999-2000. As shown in Graph1, it is found thatthere is continuous rise in the figure of capital (K) employedwith the exception of the year 1996. The index of the capitalemployed has raised to 203 crores in comparison to the baseyear 1990-1991.

77 SCMS Journal of Indian Management, January-March, 2006.
Published by School of Communication and Management Studies
Year Rs.in Crores
1990 1185.70
1991 1299.40
1992 1615.50
1993 2003.80
1994 2119.10
1995 2170.30
1996 1984.30
1997 2115.00
1998 2382.70
1999 2406.90
Source: Annual Report of CCL
Table 1Capital employed in CCL during 1990-1991- to 1999-2000
Graph 1
1185.71299.4
1615.5
2003.8
2119.12170.3
1984.3
2115
2382.7 2406.9
0
500
1000
1500
2000
2500
3000
1990 1991 1992 1993 1994 1995 1996 1997 1998 1999
Series1
The average of the annual capital employed is Rs.1928.32
crores with standard deviation = 447.33, the co-efficient
of var iat ion being 23.2 per cent. The l inear trend of
t he cap i t a l emp loyed ha s been e s t ima ted to be
K=1226.37+127.63 T, which shows that the figure of capital
employed is increasing at an annual rate of Rs.127.63 crores.
On the basis of ‘t’ test, the trend co-efficient is significantat f ive per cent level of signif icance. It means that duringthe period 1990-1991 to 1999-2000, there is signif icantr ise in the amount of capital employed in the CCL.

78 SCMS Journal of Indian Management, January-March, 2006.
Published by School of Communication and Management Studies
2. To find out whether the volume of net sale has changed ornot, during the study period, the trend co-efficient was
found out by examining the values of net sale during thisperiod. The results are summarized in Table 2.
Table 2Net sales in CCL, during, 1990-1991 to 1999-2000
Year Net Sales (Rs. in crores)
1990 760.40
1991 788.34
1992 905.80
1993 1281.20
1994 1426.09
1995 1354.70
1996 1428.80
1997 1650.90
1998 1962.10
1999 1951.00
Source: Annual Report of CCL
76 0 .4 78 8 .3 4
9 0 5.8
12 8 1.2
14 2 6 .0 913 54 .7
14 2 8 .8
16 50 .9
19 6 2 .1 19 51
19 9 0 19 9 1 19 9 2 19 9 3 19 9 4 19 9 5 19 9 6 19 9 7 19 9 8 19 9 9
S eries2
Graph 2
Table 2 and Graph 2 show that there is continuous rise in the netsales with the exception of the Years 1995 and 1999. The indexof net sale rose to 256.67 in comparison to the base year1990-1991.
The average of net sale for the period is Rs.1350 crores, with
standard deviation equal to 412.79, the co-efficient of variationbeing 30.58 per cent.
The linear trend of the net sale has been estimated to N.S =578.98+149.19T, which shows that the figure of the net sale isincreasing at an annual rate of 140.19 crores.

79 SCMS Journal of Indian Management, January-March, 2006.
Published by School of Communication and Management Studies
On the basis of “t” test, the trend co-efficient is significant atfive per cent level of significance. It means, during the studyperiod, there is significant rise in the amount of net sale in theCCL.
3. To find out whether the volume of total sale has changed ornot during the study period, the trend co-efficient was foundout by examining the values of total sale during this period.The results are summarized in Table 3.
Year Sales (Rs. in crores)
1990 1161.04
1991 1207.10
1992 1494.30
1993 1768.95
1994 1982.49
1995 1833.48
1996 2259.02
1997 2384.02
1998 2982.34
1999 2884.54
Table 3Total Sale in CCL, during, 1990-1991 to 1999-2000
Graph 3
Source: Annual Report of CCL
1161.041207.1
1494.3
1768.951982.49
1833.48
2259.022384.02
1982.34
2884.54
0
500
1000
1500
2000
2500
3000
3500
1990 1991 1992 1993 1994 1995 1996 1997 1998 1999
S eries2
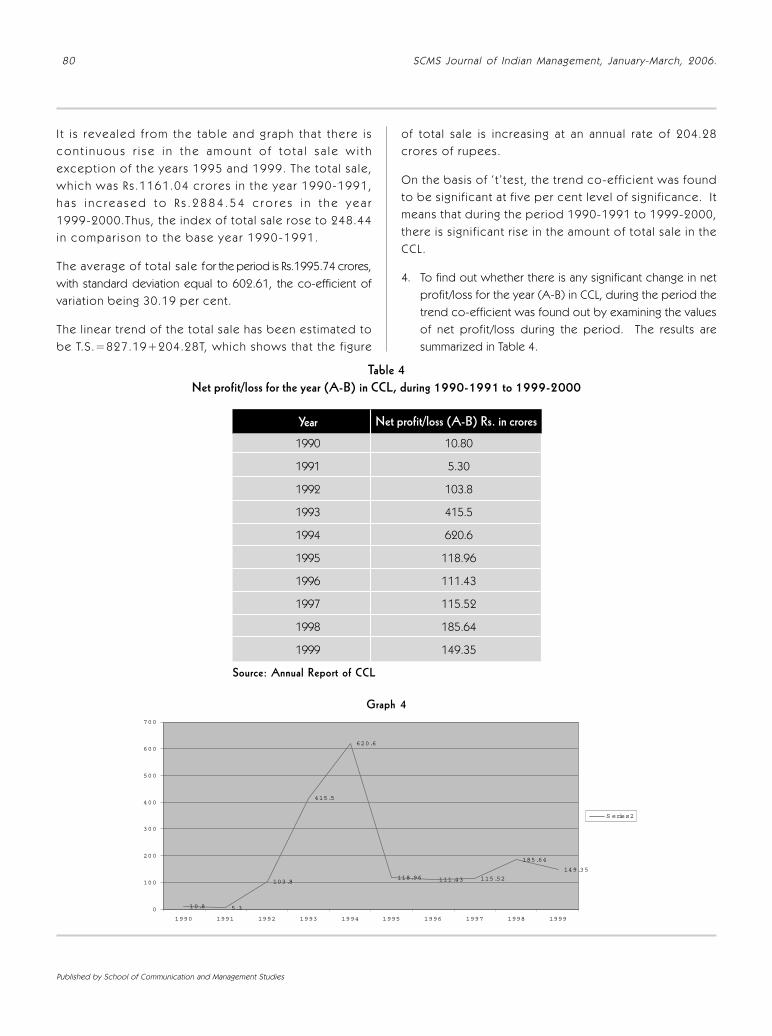
80 SCMS Journal of Indian Management, January-March, 2006.
Published by School of Communication and Management Studies
I t i s revea led f rom the t ab le and g raph tha t t he re i sc o n t i n u o u s r i s e i n t h e a m o u n t o f t o t a l s a l e w i t hexcept ion of the years 1995 and 1999. The tota l sa le ,wh ich was Rs .1161.04 c rores in the yea r 1990-1991,h a s i n c r e a s e d t o R s . 2 8 8 4 . 5 4 c r o r e s i n t h e y e a r1999-2000.Thus, the index of tota l sa le rose to 248.44in compar i son to the base yea r 1990-1991 .
The average of tota l sa le for the period is Rs.1995.74 crores,with standard deviation equal to 602.61, the co-efficient ofvar iat ion being 30.19 per cent.
The l inear t rend of the tota l sa le has been est imated tobe T.S.=827.19+204.28T, which shows that the f igure
of tota l sa le is increasing at an annual rate of 204.28crores of rupees.
On the basis of ‘ t ’ test , the trend co-eff ic ient was foundto be s igni f icant at f ive per cent level of s igni f icance. I tmeans that during the period 1990-1991 to 1999-2000,there is s igni f icant r ise in the amount of tota l sa le in theCCL.
4. To find out whether there is any significant change in netprofit/loss for the year (A-B) in CCL, during the period thetrend co-efficient was found out by examining the valuesof net profit/loss during the period. The results aresummarized in Table 4.
Table 4Net profit/loss for the year (A-B) in CCL, during 1990-1991 to 1999-2000
Year
1990 10.80
1991 5.30
1992 103.8
1993 415.5
1994 620.6
1995 118.96
1996 111.43
1997 115.52
1998 185.64
1999 149.35
Source: Annual Report of CCL
Graph 4
Net profit/loss (A-B) Rs. in crores
10.8 5.3
103.8
415.5
620.6
118.96 111.43 115.52
185.64
149.35
0
100
200
300
400
500
600
700
1990 1991 1992 1993 1994 1995 1996 1997 1998 1999
S eries2
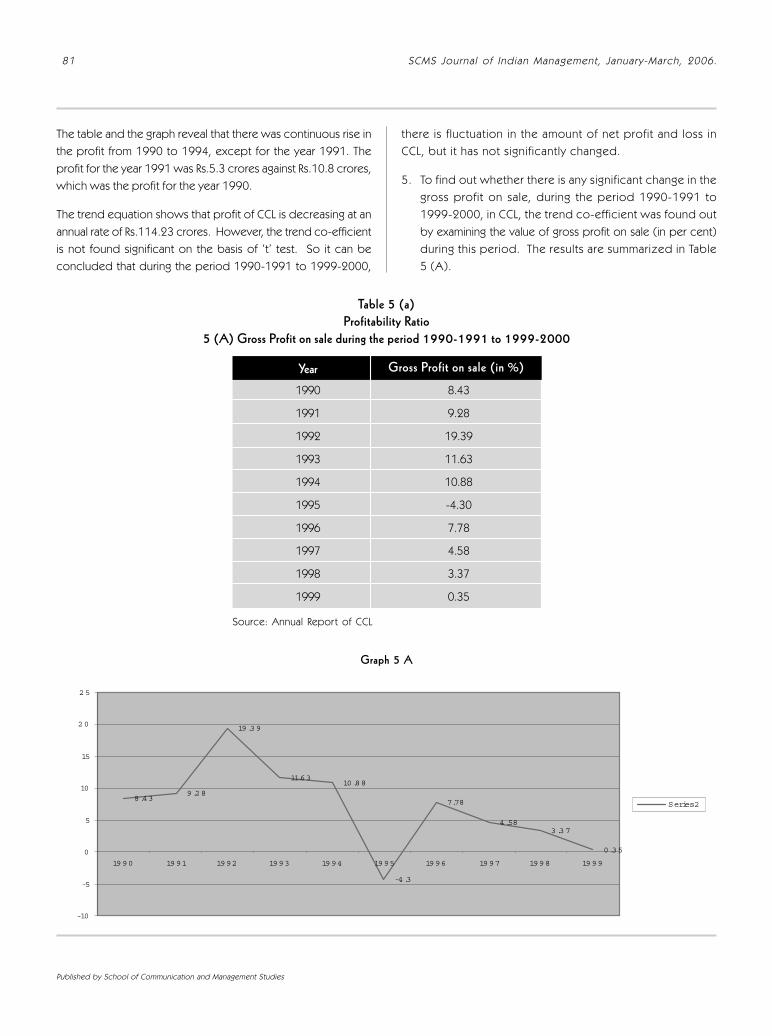
81 SCMS Journal of Indian Management, January-March, 2006.
Published by School of Communication and Management Studies
The table and the graph reveal that there was continuous rise inthe profit from 1990 to 1994, except for the year 1991. Theprofit for the year 1991 was Rs.5.3 crores against Rs.10.8 crores,which was the profit for the year 1990.
The trend equation shows that profit of CCL is decreasing at anannual rate of Rs.114.23 crores. However, the trend co-efficientis not found significant on the basis of ‘t’ test. So it can beconcluded that during the period 1990-1991 to 1999-2000,
there is fluctuation in the amount of net profit and loss inCCL, but it has not significantly changed.
5. To find out whether there is any significant change in thegross profit on sale, during the period 1990-1991 to1999-2000, in CCL, the trend co-efficient was found outby examining the value of gross profit on sale (in per cent)during this period. The results are summarized in Table5 (A).
Table 5 (a)Profitability Ratio
5 (A) Gross Profit on sale during the period 1990-1991 to 1999-2000
Year
1990 8.43
1991 9.28
1992 19.39
1993 11.63
1994 10.88
1995 -4.30
1996 7.78
1997 4.58
1998 3.37
1999 0.35
Gross Profit on sale (in %)
Source: Annual Report of CCL
Graph 5 A
8.439.28
19.39
11.6310.88
-4.3
7.78
4.583.37
0.35
-10
-5
0
5
10
15
20
25
1990 1991 1992 1993 1994 1995 1996 1997 1998 1999
Series2
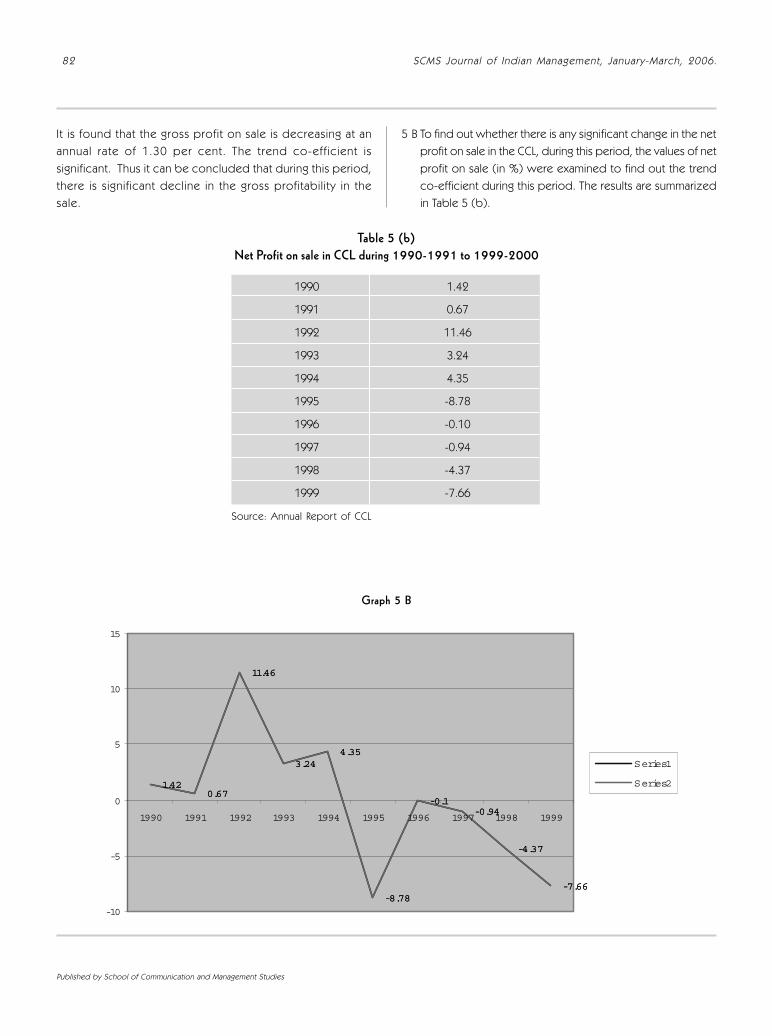
82 SCMS Journal of Indian Management, January-March, 2006.
Published by School of Communication and Management Studies
It is found that the gross profit on sale is decreasing at anannual rate of 1.30 per cent. The trend co-efficient issignificant. Thus it can be concluded that during this period,there is significant decline in the gross profitability in thesale.
5 B To find out whether there is any significant change in the netprofit on sale in the CCL, during this period, the values of netprofit on sale (in %) were examined to find out the trendco-efficient during this period. The results are summarizedin Table 5 (b).
1.420.67
11.46
3.244.35
-8.78
-0.1-0.94
-4.37
-7.66
1.420.67
11.46
3.244.35
-8.78
-0.1-0.94
-4.37
-7.66
-10
-5
0
5
10
15
1990 1991 1992 1993 1994 1995 1996 1997 1998 1999
Series1
Series2
Graph 5 B
Year
1990 1.42
1991 0.67
1992 11.46
1993 3.24
1994 4.35
1995 -8.78
1996 -0.10
1997 -0.94
1998 -4.37
1999 -7.66
Source: Annual Report of CCL
Table 5 (b)Net Profit on sale in CCL during 1990-1991 to 1999-2000

83 SCMS Journal of Indian Management, January-March, 2006.
Published by School of Communication and Management Studies
It is found that profit on sale-net profit- is increasing at
an annual rate of 0.80 per cent. However, the trend
co-efficient is not found to be significant on the basis of
‘t’ test. Thus it may be said that during this period, net
profitabil ity on sale has not changed, although there is
wide fluctuation in the figure of net profitabil ity on sale
du r i ng th i s pe r iod .
6. To find out whether there is any change in the grossprofit on capital in the CCL, during this period, the valuesof gross profit on capital (in %) were examined to findout the trend co-efficient during that period. The resultsare summarized in Table 6 (a).
Table 6 (a)Gross Profit on capital in CCL, during 1990-1991 to 1999-2000
Year
1990 5.40
1991 5.63
1992 10.87
1993 7.43
1994 7.32
1995 -2.69
1996 5.60
1997 3.57
1998 2.77
1999 0.28
Gross Profit on capita (in %)
Source: Annual Report of CCL
5.4 5.63
10.87
7.43 7.32
-2.69
5.6
3.572.77
0.28
-4
-2
0
2
4
6
8
10
12
1990 1991 1992 1993 1994 1995 1996 1997 1998 1999
Series2
Graph 6 A

84 SCMS Journal of Indian Management, January-March, 2006.
Published by School of Communication and Management Studies
means that during the period 1990-1991 to 1999-2000, thereis significant decline in the gross profitability on capital in CCL.
6 B. To find out whether there is any significant change in theNet Profit on Capital in the CCL, during this period, thetrend co-efficient was found out by examining the valuesof net profit on capital (in %) during this period. Theresults are summarized in Table 6(b).
It was seen that the average of gross profitability during thisperiod was 4.625 per cent with standard deviation equal to2.90, co-efficient of variation being 62.7 per cent. Here wefind that gross profitability on capital is decreasing at an annualrate of 0.72 per cent.
On the basis of ‘ t ’ test , the trend co-eff ic ient is foundto be s igni f icant at f ive per cent level of s igni f icance. I t
Table 6 (b)Net profit on capital in CCL, during 1990-1991 to 1999-2000
Year
1990 0.91
1991 0.40
1992 6.42
1993 2.07
1994 2.93
1995 -5.48
1996 -0.07
1997 -0.73
1998 -3.60
1999 -6.21
Net profit on capital (in %)
Source: Annual Report of CCL
0.910.4
6.42
2.07
2.93
-5.48
-0.07-0.73
-3.6
-6.21
-8
-6
-4
-2
0
2
4
6
8
1990 1991 1992 1993 1994 1995 1996 1997 1998 1999
Series2
Graph 6 B
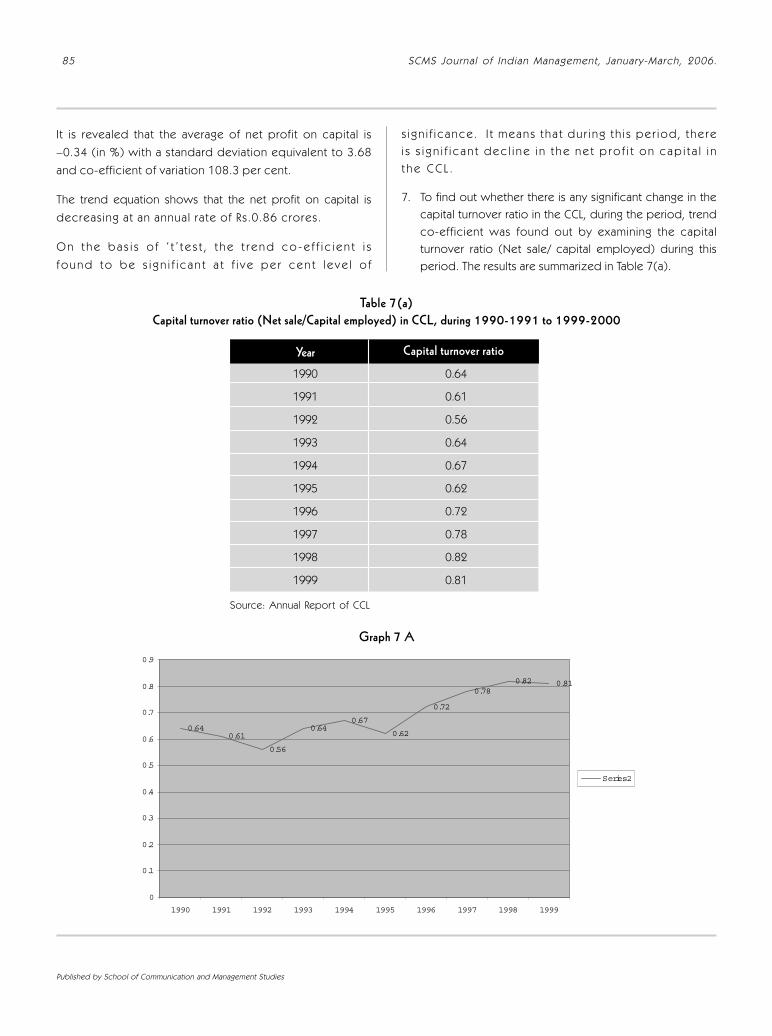
85 SCMS Journal of Indian Management, January-March, 2006.
Published by School of Communication and Management Studies
It is revealed that the average of net profit on capital is–0.34 (in %) with a standard deviation equivalent to 3.68
and co-efficient of variation 108.3 per cent.
The trend equation shows that the net profit on capital is
decreasing at an annual rate of Rs.0.86 crores.
O n t h e b a s i s o f ‘ t ’ t e s t , t h e t r e n d c o - e f f i c i e n t i s
f o u n d t o b e s i g n i f i c a n t a t f i v e p e r c e n t l e v e l o f
s i gn i f i c ance . I t means t ha t du r i ng t h i s pe r iod , t he rei s s i g n i f i c a n t d e c l i n e i n t h e n e t p r o f i t o n c a p i t a l i nt h e C C L .
7. To find out whether there is any significant change in thecapital turnover ratio in the CCL, during the period, trendco-efficient was found out by examining the capitalturnover ratio (Net sale/ capital employed) during thisperiod. The results are summarized in Table 7(a).
Table 7(a)Capital turnover ratio (Net sale/Capital employed) in CCL, during 1990-1991 to 1999-2000
Year
1990 0.64
1991 0.61
1992 0.56
1993 0.64
1994 0.67
1995 0.62
1996 0.72
1997 0.78
1998 0.82
1999 0.81
Capital turnover ratio
Source: Annual Report of CCL
0.640.61
0.56
0.640.67
0.62
0.72
0.780.82 0.81
0
0.1
0.2
0.3
0.4
0.5
0.6
0.7
0.8
0.9
1990 1991 1992 1993 1994 1995 1996 1997 1998 1999
Series2
Graph 7 A

86 SCMS Journal of Indian Management, January-March, 2006.
Published by School of Communication and Management Studies
I t i s found out that the average of capi ta l tu rnoverrat io dur ing the per iod is 0.69 with standard deviat ionequal to 0.63, the co-ef f ic ient of var ia t ion being 91.7per cent .
The trend equation shows that the capital turnover ratio isincreasing at an annual rate of 0.02 per cent. However,the t rend co-ef f ic ien t i s not found to be s ign i f icanton the bas i s o f ‘ t ’ tes t . So , i t may be sa id tha t dur ing
th i s per iod, though there i s much f luc tua t ion in thecap i ta l tu rnover ra t io in CCL , i t has not s ign i f icant l ychanged.
7 B. To find out whether there is any significant change in theworking capital turnover ratio in CCL, during this period,the trend co-efficient was found out by examining thevalues of working capital turnover ratio during this period.The results are summarized in Table 7(b).
Table 7(b)Working capital turnover ratio in CCL, during 1990-1991 to 1999-2000
Year
1990 1.52
1991 1.50
1992 1.37
1993 1.29
1994 1.49
1995 1.66
1996 2.55
1997 2.53
1998 3.12
1999 3.38
Working capital turnover ratio
Source: Annual Report of CCL
1.52 1.51.37
1.29
1.491.66
2.55 2.53
3.12
3.38
0
0.5
1
1.5
2
2.5
3
3.5
4
1990 1991 1992 1993 1994 1995 1996 1997 1998 1999
Series2
Graph 7 B

87 SCMS Journal of Indian Management, January-March, 2006.
Published by School of Communication and Management Studies
It is found that the average of working capital turnover ratiofor the period is 2.04,with a standard deviation equal to 0.74,co-efficient of variation being 36.3 per cent.
The trend equation shows that the working capital turnover ratiois increasing at an annual rate of 0.23
On the basis of ‘t’ test, the trend co-efficient is significant at fiveper cent level of significance. It means, during this period, thereis significant rise in the working capital turnover ratio in the CCL.Thus, it is found that the capital employed has doubled during1990-1991 to 1999-2000, and there is significant increase in theamount of capital employed during this period.
The value of sales-gross and net had also significantly increasedduring that period. The index of net sale has increased to 257per cent in comparison to the sale of the base year 1990-1991.But if we consider the figure of profit and loss, we find thatthere is a slow increase rate of loss of the CCL. The profitabilityon sale has considerably declined from 8.3 per cent in 1990-1991 to 0.35 per cent in 1999-2000.
There is much fluctuation in the figure of profitability on capitaland it has also declined significantly during that period. If weconsider the technology side and the figure of capital turnoverratio, we find that the figure has a slow rising trend. During theperiod of study, there is significant rise in the figure of workingcapital turnover ratio. This is not good trend, the rising figure ofcapital output ratio indicates the poor performance trend of theCCL.
Conclusion
The study revealed that there is rise in the figure of capitalemployed, total production and net sale, but productivity oncapital is continuously declining. As a result, there is loss in theCCL. Measures should be adopted to reduce the loss; otherwisethis prestigious unit of the coal mining industry will not be ableto survive. Immediate measures should be taken to reducewasteful expenditure and reduce the loss caused by the loss ofworking hours due to industrial unrest. There is need to changethe capital structure according to the need. An important reasonfor the loss of the CCL is the continuous increase in the cost,particularly wage cost and its inability to fix the price accordingto the need. Autonomy should be given to this unit to changethe price according to the need. These measures, if adopted in
good spirit, will increase the profit and profitability and thisprestigious unit will survive to change the economic scenario ofthe country.
References
B.B.Lal, “Notes and Memoranda- A note on productivity andeconomic growth (with special reference to India),”The Indian Journal of Economics, No.216, Vol.V, July,125, 1974.
B.Ganguly, The Economics of Public Enterprises (A Break-Evenanalysis), Bharati Bhawan, 191, 1984.
Ivan Turk, “Efficiency analysis through their interrelated indicators:The Yugoslav approach – in Ram Reddy’s Governmentand Public Enterprises,” Frank Cass and Co.Ltd.,Gaimsborough House, London, 1974.
J.B.Gelbraith, Economic development in perspective, Gawcett,New York, 93, 1962.
M.J.Clay and B.H.Walley, Performance and profitability, A manualof productivity and cost reduction techniques forindustry and commerce, longeman Green and Co.Ltd.,London, 1965, 183-184, 1965.
R.N.Collins, and L.E. Preston, “Price-cost margin and industrystructure,” Review of Economics and Statistics, Vol.57,271-286, 1969.
V.K.Gupta, “Cost functions, concentration and barriers to entryin twenty nine manufacturing industries of India,”Journal of Industrial Economics, 17,1968,57-72.
Bibliography
Annual Report of CCL.
Asha Jain, “Price and cost margin in Indian manufacturingindustries: An economic analysis,” Ph.D.thesis, IndianInstitute of Technology, Kanpur, July, 1981.
Lakshmi Narain, “Efficiency Audit of Public Enterprises in India,S.Chand and Co. Ltd., Delhi, 1984.
P.K. Gosh, “Public enterprises in India (organization andmanagement),” Book world, Calcutta, 1982.
R.R.Barthwal, “Industrial Economics-An introductory textbook,”Wiley Eastern Limited, 1984.
Reports and Government Publications.

88 SCMS Journal of Indian Management, January-March, 2006.
Published by School of Communication and Management Studies
C r e a t i v e A p p r o a c h t oDec i s i o n Mak i n gJ.K.Sharma and B.B.Das
D r. J . K . S h a r m a , F a c u l t y o f M a n a g e m e n tS t u d i e s , D e l h i U n i v e r s i t y a n d v i s i t i n gP r o f e s s o r a t “ G r o u p e E S S E C , G r a d u a t eSchoo l o f Managemen t ” i n F r ance .
Cmde.B .B .Das (Retd) , Dean - Academics andM a n a g e m e n t S t u d i e s , K r i s h n a I n s t i t u t e o fE n g i n e e r i n g a n d Te c h n o l o g y , G h a z i a b a d ,Ema i l : bbdas@k ie t .edu
The decision-making is becoming difficult day by day due to the influence of many factors such as constraintsof resources, highly competitive market environment, rapidly changing science and technology and ever-expanding knowledge base etc. The vast data and varied alternatives that a decision-maker is to handle forarriving at the right decision is beyond human capacity. Therefore the decision-maker has to adopt quantitativetechniques with computer suppor t. The OR techniques are highly suitable for decision-makers to identifyalternatives, evaluate their merits and demerits and to choose the right alternative. The decision-maker shall becreative in his approach to promote innovative ideas. Only creative decisions can lead the organization to afuture that can bring perceivable benefits. Therefore, the stress for creative decision-making is mandatory forthe present day organizations.
ec i s ion-mak ing in the present day scenar io hasbecome a complex task. The uncer ta inty of thefu tu re and the na tu re of
volatile market situation with highdegree of compet i t ion, g reat lyinfluence and pose difficulties formanager i a l dec i s ion-mak ing .The eve r -chang ing knowledgeand techno logy a l so add newdegree of di f f icu l t ies with l i t t leo r no precedents . A l thoughwell-structured problems can besolved in many ways most ly a toperat ional level, but to handletact ical and strategic issues thedec i s ion make r f ace the rea lchallenge. In order to effectivelyaddress these problems and toprovide suitable decisions in the
recent global age, creative approach to decision-making isbecoming an essential requirement.
The quant i ta t ive techniquesparticularly OR techniques are mostsuitable for decision-makers to handleuncertain and risky situations to arriveat the right decisions. However, thefaith of decision-makers on thesetechniques often fail due to lack ofawareness and knowledge on OR andfear of mathematical modeling.
Most of the time it is the mental blockof the decision-maker that compelsthem to avoid the use of thesetechniques. The experts are availableto analyze the problem by using thesetechniques to evaluate the alternativesand to put up the choices with merits
D

89 SCMS Journal of Indian Management, January-March, 2006.
Published by School of Communication and Management Studies
or demerits. OR enables the analysis of the problem in a logicalmanner by adopting certain well defined phases through modelevaluation and testing. In spite of having the powerful tools andtechniques if any decision-maker fails to take the right decisionthat is mainly for lack of creative problem solving ability.
Problem solving in OR is a combination of approach both scienceand ar t. Much has been discussed about the science ofdecision-making; mathematical models, solution algorithms,statistical analysis procedures, and so on. But it is also necessaryto understand the ar t of problem solving mainly how to make itcreative in nature.
Art, by its varying nature, is a creative discipline. Thus creativity isthe most important attribute of good management. Creativity isalso the essence of research and motivation. While creativity isstrongly allied to problem-solving, it has largely been ignored asa powerful component of the OR problem solving.
Creativity is closely linked to productivity. Therefore the stressfor improving creative mind of the employer, organizations worldover are conducting suitable training programmes. Researchbrings out that to improve organizational creativity, a focus shouldexist on reducing barriers to creativity, training in problem solvingincluding problem identification, improving communication skillsand participative management styles. The creativity problemsolving can have number of benefits such as:
● A reduction in problem uncertainty
● An increase in the number of available solutionalternatives
● An increase in competitive advantage
● A decrease in the number of solution revisions
● A more efficient utilization of individual abilities.
Problems & Problem Solving
A problem can be defined in many ways. The following arefew examples:
● A felt difficulty
● A gap, or obstacle to be circumvented
● Dissatisfaction with a purposeful state
● A perception of a variance, or gap between the presentand some desired state of affairs.
The selection of a course of action from among severalalternatives is known as the decision and the person (s)respons ible for th is se lect ion is (are) ca l led thedecision-maker(s). We emphasise that a problem exists whenthe present and desired state of affairs are at least perceived tobe different; in reality they may actually be the same or may beperceived in a different fashion by others. Therefore, therecognition that a problem exists is the first step in problemsolving.
A solution to a problem is achieved whenever the present anddesired states of affairs are perceived to be sufficiently close.Hence, the size of the gap must be measurable, and the skillsand resources needed to solve the problem must beobtainable. Problem-solving is the activity associated withselecting appropriate course of action and changing the presentto the desired state. A solution cannot be obtained unless somechange in the reality of perception occurs. Problem-solvingconsists of several measures cognitive functions such as:
● The ability to think rapidly of several characteristic ofa given object or situation
● Classifying object or ideas
● Perceiving relationship
● Thinking of alternative outcomes
● Listening characteristics of a goal
● Producing logical solutions
Solving real problem requires a wide range of creative,conceptual and logical thinking abilities. Therefore problemsolving requires definition, analysis, solution and implementation.
Problem Definition
Formal modeling approaches usually begin with the assumptionthat the problem has been identified. There are five componentsin defining a problem: the decision maker- the one faced withthe problem; controllable variables – those aspects of a problemsituation under the decision maker ’s control; uncontrollablevariables – those not under the decision maker ’s control butwhich can affect the outcome of choice; constraints – limitationsor requirements imposed on the possible values of the variables;and outcomes – produced jointly by the decision maker ’schoice and the uncontrollable variable. The value of an outcomeis a specified relationship between the controllable anduncontrollable variables. The objective becomes one ofmaximizing or minimizing value of the outcome.
90 SCMS Journal of Indian Management, January-March, 2006.
Published by School of Communication and Management Studies
Problem definition is not a trivial task. The complexity of a problemincreases when a group rather than an individual assumesresponsibility for a decision, when uncontrollable factors changein an unpredictable fashion, when the number of alternatives, orcontrollable variables, increases, when more than one objectiveexists, and when human behaviour becomes an important factor.
Problem Anaylsis
An analysis of the structure and content of a problem is requiredin order to build an adequate model. One method of analysisthat often assists the problem solving effort is classification.Classification is an aid to capturing past experience which willstimulate imagination and guide creativity.
There are many ways to classify problems. Problems are classifiedaccording to the difficulty of formulating the structure. Fivecategories are proposed:
1. Problems in which the logical structure is simple andtransparent enough to be solved by inspection anddiscussion
2. Problems where the structure is apparent but the way inwhich to represent it symbolically is not clear
3. Problem where the structure is not apparent but neverthelessthere is the possibility of extracting structure by data analysis
4. Problem where it is not possible to isolate the effects ofindividual variables and it is necessary to experiment.
5. Problem where sufficient data are not available andexperimentation is precluded
A simpler scheme is to classify problem as well structured, semistructured or ill structured. This is determined by the amount ofinformation available about the gap between the present anddesired state of affairs.
For well-structured problems, we have complete informationabout the problem and means of closing the gap. An ordinarytransportation problem is one example. Ill structured problemon the other hand are characterized by a lack of this informationas well as fuzziness or vagueness about the present and desiredstates. The design of social services for instance falls into thiscategory. Semi structured problems fall somewhere in betweenthese two categories. Most problems addressed throughsimulation analysis are characteristics of semi-structuredproblems.
Problem for decision-making perspective can be classified intwo dimensions frequency and replication. The frequency,which a given decision has to be made within a given space oftime, is a measure of the repetitiveness of the task of thedecision-maker. The replication refers to the uniformity in thedefinition of the problem; the greater the variation, the lower thelevel of replication. Problems with the higher degree of frequencyand replication lend themselves to programmable, automateddecision procedure. Those with low frequencies but higherreplication suggest the need for programmable decisions butan economic issue exists as to whether the cost saving or otherbenefits justified the efforts and expense involved in developingan automated procedure. Problems with lower replication butwith higher frequency are generally ill structured with manyunpredictable and poorly defined characteristics and unclearobjectives. Yet the high frequency suggests the decision supportsystems are appropriate. Finally, those problems with lowreplication and low frequency are the least amenable toautomated decision aids, but are prime candidates for creativeproblem solving approaches.
In OR the analysis phase typically culminates in a model. Modelbuilding is a process of enrichment and elaboration, movingfrom the simple to the complex. Analogy or association withthe previously developed logical structure plays an importantrole in this process. Model enrichment is accomplishedthrough the process of changing constants into variables,adding variables, relaxing linear and other assumptions, andincluding randomness. In this fashion, the modeling processitself is a creative endeavour.
Classification schemes can also provide a useful frame ofreference for modelers. Eight classification schemes formodels i.e. functions, structure, dimensionality, temporalreference, degree of cer tainty, degree of generality, degreeof closure, and degree of qualifications have been identifiedby cer tain authors.
Others also view several classification schemes. At the sametime most classification schemes have serious deficiencies:
● Few classification schemes point to a specific problemsolving approach
● Those leading to analytical techniques promotedeterministic thinking and limit the size of the solutionspace that will be explored.

91 SCMS Journal of Indian Management, January-March, 2006.
Published by School of Communication and Management Studies
● Most have a portioning perspective, which fosters theview, that working on one or more similar problem ismore effective because the whole problem is toomessy to qualify.
● Little prescriptive understanding of what to do with aproblem given.
Problem Solution
The problems can be solved, dissolved, or resolved. To solve aproblem implies some sort of optimization. This is referred asresearch approach, which is the characteristic of traditionalmethodology. To resolve the problem, the clinical approach, isto select a course of action that satisfies and suffices. Theprocess consists chiefly of trial and error, judgment and commonsense. To dissolve a problem we change the nature of theproblem and the environment so as to remove the problem. It isreferred as design approach that it employs techniques of boththe clinical and research perspective. It involves an assessmentof the total system rather than sub optimization of its parts. Oneexample is the problem of designing a new device to picktomatoes in order to reduce damage during harvesting. Whilemuch thinking went into the mechanical design with little success,the actual solution was to develop a new tomato plant withtougher skin.
There are three principal means of solving a problem. First onecan transform the present to the desired states (as perceived bythe decision-maker) through changes in technology, policy andso on. More than likely such changes are the result of technicalanalysis and of modeling efforts (the research approach).Second, the desired state can be transformed to the present,usually through perception alone (the clinical or satisfyingapproach), finally some combination of the two approachescan be applied (the design approach).
The more structured a problem is, the more likely that theresearch, or algorithmic approach will be an effective means forsolving the problem. While one must have a sound knowledgebase of techniques and a basic facil ity for developingmathematical model, little creativity is required to develop amodel and obtain a solution.
The majority of practical or applications occur for semi-structured problems. The design of production and serviceoperations are typical applications which are often modelas linear programs, simulations etc. Heuristics often play an
impor tant role in the solution of such problems. In contrastto structured problems, a great amount of oppor tunity existsfor applying creative problem-solving techniques.
Ill structured problems are the most difficult to analyze andsolve. Insufficient information often exists to even proposean adequate model or determined a method of solution.Such problems lend themselves well to creative problemsolving approaches.
Implementation
Planning is the key element of implementation. Planning shouldinclude a consideration, action steps for implementing an idea,and the consequences of each step. To end, creative thinkingis vitally important. A number of questions that should beconsidered for successful implementation are:
1. Are resources adequate for implementing this idea?
2. Do others possess the motivation and commitment neededfor successful implementation?
3. Is the idea likely to encounter closed thinking and orresistance to change in general?
4. Are there procedural obstacles that need to be overcome?
5. Are there structural obstacles in the organization (e.g.communication channels) that need to be overcome?
6. What organizational or managerial policies will need to beovercome?
7. How much risk taking is likely to be tolerated by thoseresponsible for implementation
8. Are there any ongoing power struggles with theorganization that might block implementation?
9. Are there any inter personal conflicts that might prevent orhinder the idea from being put into action?
10. Is the general cl imate of the organizat ion one ofcooperation or distrust?
Operations Research Methodology
Problem formulation involving an analysis of the systemunder study, the objectives of the decision-maker, andalternate courses of action. Model construction consistsof hypothesizing relationship between variables subjectto and not subject to control by the decis ion-maker.Solving the model requires the use of various mathematicaltools and numerical procedures.

92 SCMS Journal of Indian Management, January-March, 2006.
Published by School of Communication and Management Studies
Testing the model and solution involves determining thepredictive ability of the model, verification of data, andvalidation of hypothesized relationships. Establishing controlover the solution involves developing ranges or boundsover which the solution is applicable, and developing rulesfor modifying the solution when environmental changesoccur. Finally, implementation involves the establishment ofprocedures and organizational changes necessary to makesolution work.
Difficulties in Problem Solving
Many of the reasons why problems are not adequately solvedare due to the lack of an appropriate methodology for problemsolving and psychological perceptions on the part of theproblem solver. The following aspects are highlighted to realizethe gravity of problem solving.
1. Failure to recognize the existence of a problem
a) Some people tend to personalize problem
b) Information is not received to signal that a problemexists
c) Problems are too complex for comprehension
d) Problems arise without peoples’ prior experience
e) There is a lack of objectives or standards
2. Failure to define the correct problem
a) One situation may contain many inter-twined problems
b) Obvious problems are often the symptoms of muchdeeper problems
c) An inability to identify accurately what is going on canlead to inaccurate problem identification
d) Incorrect inferences can lead to inaccurate problemidentification
e) Poor quest ions y ielding useless or erroneousinformation mislead the problem solver
f) Attitudes and beliefs can blind the problem solver tothe real causes and often can led to undesirablesolution
g) Problems and their causes are over simplified
h) Culprits, not causes, are identified as the source ofthe problem
i) Accepting others definitions lead to solving the wrongproblem
j) Fixation on either world view or functions provide tonarrow a scope
k) All problems are often treated as logical problem
3. Failure to use all available information
a) The problem solver fails to seek relevant information
b) Perceptual blocks to thinking
c) Memory limitations block the problem solving process
d) The problem solver gets lost in details
4. Failure to recognize the question assumptions
a) It is assumed that there is a solution to every problem
b) Rigid thinking limits one’s view point
5. Failure to consider wide range of alternatives
a) Problem definition is limited
b) Premature evaluation or judgment
c) ‘Lack of time’ is cited as an excuse
6. Failure to address implementation issues
a) Responsibility for implementation is not determined
b) Cultural and value differences
c) Recommendations do not lead to decisions
d) Solutions are not validated against the problemdefinition
e) The cost of solving a problem is too expensive
The complexity of the many problems and difficulties that naturallyarise in solving problems suggest the need for creativity. Themore creative we are, the more alternatives we will have fromwhich to select. This improves the quality and effectiveness ofthe resulting decision and reduces risk and error while increasinginnovation.
Concepts of Creative Thinking
As can be expected, no generally accepted definition ofcreativity exists. Creativity has been defined from the perspectiveof the product of creative behaviour; the process of creative

93 SCMS Journal of Indian Management, January-March, 2006.
Published by School of Communication and Management Studies
behaviour; characteristics of the individual who creates; andenvironmental and cultural influences. Few definitions of creativityare:
● “…The association of thoughts, facts, ideas etc. into anew and relevant configuration, one that has meaningbeyond the sum of its parts that provides a synergisticeffect.”
● “…That mental process in which past experience iscombined and recombined, frequently with somedistortion, in such a fashion that one comes up withnew patterns, new configurations, new arrangements,that better solve some need of mankind.”
Some eminent authors define creativity in problem solving andplanning as:
“…The ability of a subject in a choice situation to modify selfimposed constraints so as to enable him to select course ofaction or produce outcomes that he would not otherwise selector produce, and are more efficient or valuable to him than anyhe would otherwise have chosen.”
Creative behaviour is oriented toward solving meaningfulproblems and results in new ideas and discoveries. It is a bendingof knowledge, imagination and evaluation. This process occursthrough the association of knowledge and experience in newways. The outputs of creative thinking can be products,processes, models, algorithms, implementation strategies andso forth.
Badawy distinguishes creativity from spontaneity and originality.Spontaneity is the range of possibilities immediately available toan individual based on his or her intrinsic qualities andexperience. Originally in thought does not necessarily qualify ascreativity. Creativity uses what is already existing and availableand changes it in unpredictable ways, producing unexpectedresults. One example in or can be found in George Dantzing’sreminiscences on the development of linear programming. Dantzingwas attempting to solve a planning problem for the Air Force,which was formulated as what we now call today a linear program.
Parnes et al. describe creativity in terms of sensitivity, synergy,and serendipity. Sensitivity involves awareness and perceptionin order to discover problems and invent solutions. Many internalconsulting operations research groups have met their demisebecause of a lack of this attribute. Consultants must find problems
and sell their services. Synergy is behaviour of a total system thatis unpredicted by the behaviour of any of the components.Synergy is often lacking conscious thought. When two or moreideas are combined in a creative manner, the resulting idea isoften significantly more useful than the individual ideas. Forexample, it had been known since the 1940s that the simplexmethod of linear programming can interpreted in a special wayfor network flow problems. It was not until the 1970s, however,that this idea, when combined with efficient data structuresfrom computer science, led to extremely fast computer codesfor such problems.
Serendipity refers to the awareness of the relevance of accidentalhappenings. A well-known example is that of Arthur Fry, a 3Mchemical engineer who created the ‘Post-it’ notes. Spencer Silver,a 3M scientist discovered and adhesive with very low stickingpower. While dismissed as an ineffective bonding agent, Frywas able to creatively put the adhesive to gel use, Rosen manprovides several additional examples in science.
Sensitivity, synergy and serendipity all require divergent thinkingthat is the discovery and identification of many alternatives. Fordivergent thinking to be successful, one must have a solidfoundation of knowledge, imaginat ion and evaluat ion.Knowledge consists of the tools and skills acquired over theyears as well as the experiences gained in applying them. Forthe successful practice or, this includes basic technical,mathematical and computing skills, models and algorithms, andunderstanding of the modeling and problem solving process,communication skills and interpersonal skills. An analogybetween knowledge and creativity is often made with akaleidoscope; the more pieces there are, the more patterns thatcan be produced. This increases one’s knowledge base oftechniques and skills necessary for creative behaviour.
Imagination is the research orientation that is devoted towardsforming new patterns or ideas. Knowledge alone does notguarantee creativity. Pieces of knowledge, like the pieces in thekaleidoscope must be rearrange to form new patterns and ideas.Imagination in or must include analysis different ways of taking aproblem apart, defining variables, generating hypothesis etc;and synthesis putting facts together to form objectives andconstraints creating models, identifying behavioural implications,and generation ideas for solution procedures. Finally, one mustbe able to constructively evaluate ideas in order to produceuseful ones.

94 SCMS Journal of Indian Management, January-March, 2006.
Published by School of Communication and Management Studies
Block to Creativity
Creative ability does not belong to a select few who are “born withit” a fundamental premise of creative thinking is that all people haveinnate creative potential unfortunately, all people also have culturallyproduced internal and external blocks to the use of their creativeability. These include learned habits, self-discouragement andtimidity. Psychological research has shown that the two halves ofthe brain are responsible for different types of thinking. The left-brain controls analytical thought while the right brain is associatedwith creative behaviour. Over 90 per cent of formal educationtrains the left-brains over judicial thinking. We are taught the “onecorrect way” to solve problems, i.e. to judge, and to critique.Textbooks instills in this way of thought, particularly in the quantitativedisciplines. For example, problems of type X are always modeledas linear programs, while those of type Y are always modeled asMarkov chains. Seldom are alternative modeling strategies presented.
Creativity Enhancement
Since we can unders tand many of the reasons whyindividuals are not creative. We can continuously takesteps to enhance creative behaviour. Rigid thinking andpremature judgment are two of the major internal factorsthat block creativity. Divergent thinking and deferment ofjudgment are the antitheses. Creative idea results fromlarge quantit ies of any idea. List-making exercises such asf inding as many uses for a penci l , brick or toothpick areoften used to develop creative thinking. In such a three-minute exercise, one typical ly f inds that the averageperson wil l generate only 5-10 ideas. By understandingand practising creative behaviour, one learns to deferjudgment, combine ideas and develop unusual ideas, andsuch l ists wil l easi ly exceed. Organizational cl imate alsohas a major impact on creativity. External factors that areconductive to creative thinking includes:
❒ Providing freedom to think differently.
❒ Maintaining an optional work culture.
❒ Providing real ist ic work goals.
❒ Using a low level of supervis ion.
❒ Delegating responsibi l i t ies.
❒ Encouraging par ticipation
❒ Proving immediate and timely feedback
❒ Providing necessar y resources and suppor t
❒ Encouraging open expression of ideas
❒ Accepting “off the wall ideas”
❒ Providing assistance in developing ideas
❒ Encouraging r isk taking
❒ Providing t ime for individual effor ts
❒ E n c o u r a g i n g p r o f e s s i o n a l g r o w t h a n ddevelopment
❒ Encouraging interaction with others outside thework group
❒ Recognizing the value of ideas
❒ Exhibit ing confidence in workers
Internal factors that lead to creativity include:
❒ Openness to new ideas
❒ Curiosity
❒ Independence
❒ Perseverance
❒ Risk-taking
❒ Discipline
❒ Playfulness
❒ Impulsiveness
Conclusion
In general, the culture of many organizations does not supportthese conditions that lead to creative behaviour. Culturalchange, education and training are necessary to develop acreative climate.
A variety of steps can be taken to enhance creativity. First, onecan help individuals to understand the influence of theirbackgrounds, experiences and habits on behaviour. In thisway, individuals are allowed to perceive themselves as beingcreative and remove the internal blocks to creative behaviour.Second, a climate that can be created to encourage creativethinking by removing external blocks to creativity. Sensitivity toproblems can be increased; skills that will enhance the gatheringof knowledge can be taught; methods to release imaginationcan be developed; the systematic means for evaluating ideascan be learned. Finally, oppor tunities to practice creativethinking in a judgmental and non-punitive climate can beencouraged.

95 SCMS Journal of Indian Management, January-March, 2006.
Published by School of Communication and Management Studies
References
Alane Jordan Starko, Creativity in Classroom, 2000.
Edited by M C Manuel Mora, Guisseppi A Forgionne, JatinderN.D.Gupta “Decis ion Making Suppor t Systems;Ach ievemen t s and Cha l l enges fo r t he NewDecade,” 2002.
Ed i ted by Randy Y. H i rokawa, Marsha l l Scot t Poo le ,Communication and Group Decision Making, 1996.
Edited by Rober t J Sternberg, Handbook on creativity, 1998.
Gareth Morgan, Creative Organization Theory: A Resourcebook, 1989.
Jacob Goldenberg, David Mazursky, Creativity in ProductInnovation, 2002.
Louies G Pol, Richard K Thomas, Demography for BusinessDecision Making, 1997.
Marci Segal, Creat iv i ty and Personal i ty Type: Tools forUnderstanding and Inspiring the Many Voices ofCreativity, 2001.
Mar tin S Lindauer, Aging, Creativity and Ar t: A Posit ivePerspective on Late-Life Development, 2003.
Mary Schwar tz, Kinsey Gimbel, Leadership Resources: AGuide to Training and Development Tools.
Semyon D Savransky, Engineering of Creativity, 2000.

96 SCMS Journal of Indian Management, January-March, 2006.
Published by School of Communication and Management Studies
Kr ist ie J .Loescher
T h e I n f o r m a t i o n - D r i v e nH e a l t h c a r eO r g a n i z a t i o n
D r. K r i s t i e J . L o e s c h e r, L e c t u r e r, M c C o m b s
School of Bus iness , The Un ivers i ty of Texas a t
Aust in, 1 University Sta B 6000, Austin, TX 78712-
0201. P r ior to enter ing academia , she spent
15 years work ing in hosp i ta l admin i s t ra t ion ,
Ema i l : k r i s t ie . [email protected] .edu
The purpose of this paper is to describe the necessary organizat ional and cultural infrastructure to
suppor t the reengineer ing of processes and the resolut ion of data integrat ion issues requi red to
successful ly implement a cl in ical data warehouse (CDW). The CDW is an impor tant step toward an
electronic medical record (EMR), and the CDW must be designed and implemented with that end in
mind. The Healthcare Network (HN) used as an example in this paper is par t icipat ing in a nat ional
system-wide implementat ion of a cl in ical data warehousing system.
n June 1999, Premier, a group purchasing organization formore than 1,800 hospitals around the country, announcedplans to invest $50 mil l ion dollars to bui ld a cl inical
data warehouse “that wil l serve asthe foundation for broad disease-management-based init iatives thata im to improve qua l i ty of carewhi le reducing cost at memberhospitals” (Hensley, 1999). Withinsix months, Ascension Health, thenat ion’s largest Cathol ic heal th-care system completed vendorselection for implementation of itscl inical data warehouse system tobe imp lemented ac ross i t s 38hosp i ta l s . Both of these la rgesystems are implementing cl inicaldata warehouses (CDWs) for thesame purpose: to improve clinical
per formance whi le decreas ing costs .
These healthcare systems are looking to a CDW to aggregatemany different kinds of clinical data,which are typically found spreadthroughout a healthcare organizationin individual department informationsystems, financial records, and paper-based medical records. In their typicalform, these data are unconnected toeach other and unavailable for use inanalysis. The analytical power thatcould be achieved by integrating thesedata is the siren song of the CDW. Byintegrating detailed clinical measuresf rom laboratory resu l ts toelectrocardiograms to medicationtiming, patterns can be identified thatresul t in the def in i t ion of “best
I

97 SCMS Journal of Indian Management, January-March, 2006.
Published by School of Communication and Management Studies
practice”: the most efficient and effective treatment plan for aparticular disease or injury. Identification of “best practice” allowshealthcare practitioners to eliminate unnecessary and costly steps,decrease variation in treatment plans across similar patients, andimprove overall outcomes for those patients.
A CDW, as an archival/retrieval system, takes historical data,integrates the data across several sources, and makes it availablefor easy retrieval and analysis. A CDW is a milestone along thepath towards a fully electronic, “living” medical record system,which integrates data entry with archival and retrieval into oneseamless system. While few electronic medical record (EMR)systems exist today, many healthcare and IT pundits predictthey will become the standard for record keeping within thenext decade (Gaillour, 1999). The implementation of the CDWmust be viewed in terms of its place in the continuum toward anEMR to support initiation of process revision consistent withboth systems and avoid the establishment of processes that willbecome redundant with a further change in platform and focus.
While not as involved as the implementation of an EMR,building a CDW is an overwhelmingly complex task, requiringthe aggregation of data in multiple formats from multiplesources. In many cases, electronic data must be createdwhere only paper records existed before. This type oftransformation requires significant changes to occur in theway cl in ical data is gathered throughout a healthcareorganization and thus requires significant changes to occurin the way healthcare professionals across all disciplines viewand execute their daily work. Changes of this magnitude anddepth within an organization challenge the status quo ofalmost every employee and will require massive amounts oftraining and oversight to achieve.
The purpose of this repor t is to identify the critical successfactors for implementing a CDW within a healthcare system.The first section of this repor t wil l examine the crit icalsuccess factors for implementing large-scale informationtechnology systems l ike a CDW effectively. The secondsection will discuss the reengineering required to integratethe development, maintenance and use of a large-scaleinformation technology system into the organization’s dailywork. While the subject of this repor t is a CDW and theexamples used are from the healthcare industry, the issuesdiscussed and the requirements identif ied for successfulimplementation and integration can apply to any large-scaleinformation technology system in any industry.
Methods
This report utilizes literature from the healthcare informationsystems, training and development, and corporate managementindustries. Primary research for this paper was conducted in aninterview with the Director of Information Systems for a healthcarenetwork, that is, participating in a national system-wide projectto obtain and implement a clinical data warehouse.
Results
Implementing Large-Scale Information Technology SystemsEffectively.
In this section, the importance of connecting, sharing, andstructuring of the information technology (IT) infrastructure willbe discussed along with the critical need for high quality, costeffective IT support, for partnerships between IT and businessmanagement, for a specified infrastructure strategy, and for areengineering focus in order to implement large-scale IT systems,like a CDW, effectively.
IT Infrastructure Attributes
An IT infrastructure that will suppor t implementation of alarge-scale IT system has three attributes (Haeckel & Nolan, 1993):
1. Connecting – “the degree to which the IT platform linksinformation sources, media, locations and users” (Haeckel &Nolan, 1993). Since the purpose of a CDW is to connect usersto previously unavailable data, this infrastructure attribute isessential for successful implementation.
2. Sharing – “getting everyone on the same page in a largebusiness requires an institutional capability to share data,interpretations of that data, and specifications for coreprocesses” (Haeckel & Nolan, 1993). How an applicationis implemented may be more important that the features ofthe application itself. “A stand-alone application is lesslikely to deliver sustainable competitive advantage than oneimplemented on an integrated technology platformdesigned for extensive information sharing” (Haeckel &Nolan, 1993). In the healthcare network where theprimary data for this report was gathered, a plethora ofstand-alone, department-based IT systems have beeninstalled over the past ten years. Embracing sharing as acore infrastructure requirement represents a major changein the philosophy for the IT depar tment and for thehealthcare system as a whole.

98 SCMS Journal of Indian Management, January-March, 2006.
Published by School of Communication and Management Studies
To suppor t integrated systems that are cost-effectiveto operate and suppor t, technology must meet twocriteria (Ross, Beath, & Goodhue, 1996):
§ A well-defined technology architecture – “rules fordistributing hardware, software and support” (Rosset al., 1996) which are standard for all applications.These rules specify “what kinds of data to shareand how to store them, where to locate servers,and how to support applications and technologies”(Ross et al., 1996).
§ Data and platform standards – a mechanism forachieving the architectural vision. “Standards limitthe range of technologies that IT staff must support,enabling them to provide faster, more cost-effectivesupport” (Ross et al., 1996).
3. Structuring – Metadata or data dictionaries. “Structureis created by information about information….how datais classified, organized, related, and used” (Haeckel &Nolan, 1993). Structuring is especially challenging inhealthcare where nation-wide data and terminologystandards are lacking (Grimson, Grimson, & Hasselbring,2000), (Wong, 2000). However, the effor t of creatings t r ucture i s wel l wor th i t when implement ing alarge-scale IT system, especially a CDW where data frommultiple sources is being integrated. “When informationfrom previously unrelated sources is structured in ameaningful way, human beings become capable ofthinking thoughts that were previously unthinkable.Computers that use their speed and memory to revealpatterns in raw data augment the extraordinary capacityof humans to recognize and assign meaning to patterns”(Haeckel & Nolan, 1993).
Each of these attributes becomes increasingly significant asan organization moves from a focus on archival systems (likethe CDW) to a focus on live systems (like the EMR). Timeand attention in each of these areas will serve to enhancenot only the implementation process for the CDW, but alsothe implementation of an EMR down the road.
High Qual i ty, Cost Effect ive IT Suppor t . The l i teraturedesc r ibes th ree d imens ions o f I T knowledge andcompetence necessary for implementation of large-scale ITsystems (Ross et al., 1996):
❙ Technical skills – “build bridges between old systemsand new, de l i ve r da ta ac ross loca t ions andapplications, and recognize oppor tunities to applynew technologies as they become available” (Rosset al., 1996).
❙ Business understanding – developed by “co-locatingIT staff with individual business units…assigning high-level IT staff as account managers or relationshipmanagers to work closely with l ine managers indefining IT requirements and leading IT initiatives”(Ross et al., 1996).
❙ P rob lem-so l v i ng o r i en ta t ion – respons ib i l i t yd i s t r ibu ted to eve ry member o f the I T s t a f f .Empowered teams rep l ace s t a f f members“responsible only for completion of well-definedtasks” (Ross et a l . , 1996). As IT staf f becomeincreasingly educated and increasingly expensive, iti s an impor tan t means o f re ten t ion and cos teffectiveness to organize so that you have “morepeople thinking and more creative solutions” (Rosset al., 1996).
These three dimensions describe an IT depar tment verydifferent than the one interviewed for this repor t. The ITstaff are centralized and largely unknown to most managers.Task-based jobs predominate, as do antiquated skills. Thehea l thcare sys tem has recogn ized these i ssues andcompleted plans to outsource the IT function to a large ITfirm, specializing in the implementation and management oflarge-scale IT systems. According to the Director ofInformation Systems, this decis ion was mandatory forsuccess, since the old department did not have the resourcesor internal political capital to make the changes necessary tobuild the attributes described here. Other organizationsfacing large-scale IT implementations must do the same “makeor buy” analysis.
Par tnership between IT and Business Management. As Craigwrites, “successful [technology system] implementations aredr ive assembled, by cross- funct iona l teams ab le todemonstrate the benefits of [the technology] to their variousconstituencies (Craig, 2000). The users and the fundingsources are predominately outside of the functional ITdepar tment. There can be no successful IT implementationwithout shared risk and responsibility between IT and the

99 SCMS Journal of Indian Management, January-March, 2006.
Published by School of Communication and Management Studies
users/sources of funding (business management) outsideof IT (Ross et al., 1996). “Shared risk and responsibility requiretrust and mutual respect between IT and clients, and an abilityto communicate, coordinate, or negotiate quickly andeffectively” (Ross et al., 1996). This relationship is maintainedby two things (Ross et al., 1996):
❙ A business management project owner
❙ Top management leadership in establishing IT priorities
According to Bensaou, IT users and IT specialists shouldconnect within an organization through a process he calls“organizational bonding” that is widely used in Japaneseorganizations. In Japan, integration is encouraged by “rotatingmanagers through the IT function, co-locating specialists andusers, and giving IT oversight to executives who also overseeother functions” (Bensaou & Earl, 1998). Bensaou discusseshow organizational bonding helps to break down thedivisions between users and IT specialists by helping themunderstand each other ’s vocabularies, issues, and needs(Bensaou & Earl, 1998). Goodhue notes, “When usersunderstanding the business task are involved in systemsdesign, it is more likely that the resulting system will fit thetask need. Thus, user involvement potentially affects notonly user commitment, but also the quality or fit of theresul t ing system” (Goodhue & Thompson, 1995). Inaddition, by having the executives in charge of IT lead otherfunctions, such as finance and planning, IT is not isolatedwithin the company.
This requirement poses a true challenge for the healthcarenetwork interviewed for this repor t. Healthcare is highlycredential conscious and tends to organize in “silos” bycl in ica l disc ipl ine. At the same t ime, the heal thcareprofessionals in this healthcare system, while technicallyproficient in their area of expertise, tend to have a low levelof understanding of non-clinical business areas, includingIT. While “organizational bonding” may not be possible inthis organization in the shor t-term, an increased level ofunderstanding and awareness of IT perspectives is possibleand should be a priority for the future.
Infrastructure Strategy
In the labor-intensive healthcare industry, knowledge andinformation are the products offered to the customer (thepatient). Clinical knowledge and process information are
assets that require management, raw materials that must beinventoried and available to employees (Galagan, 1997). Akey implementation requirement for a CDW is deciding whichroute to take to this goal. The literature identifies twostrategies: codification and personalization.
Codification strategy tends to be the choice of “companiesthat sell relatively standardized products that fill commonneeds” (Hansen, Nohria, & al., 1999) and refers to thecodification of knowledge and electronic storage of thisknowledge for easy retrieval and analysis. It is a structured“discover-codify-disseminate” model (Bar tlett, 1998). Thepersonalization strategy tends to be used in “companiesthat provide highly customized solutions to unique problems,knowledge is shared mainly through person-to-personcontacts” (Hansen et al., 1999). Personalization is a looserand more inclusive “engage-explore-apply-share” approach(Bartlett, 1998).
Codification is more easily applied to explicit knowledge,while tacit knowledge is more easily personalized. Galaganquotes Bipin Junnarkar, Director of Knowledge Managementat Monsanto, “Explicit knowledge is what can be capturedand shared with information technology…tacit knowledgeevolves from people’s interactions, and requires skill andpractice.” (Galagan,1997). Explicit knowledge is obviouslyeasier to codify and store electronically for searching,sharing, and disseminating. Sharing tacit knowledge requiresan expectation that employees perform at a high level ofinteraction and communication ski l ls. Galagan quotesJunnarkar again, saying “The secret is in the interaction:people with people and people with information.” (Galagan,1997)
In healthcare, both explicit and tacit knowledge are widelyused, making the decision of which information managementstrategy to choose a pivotal one. The codified strategy canprovide many benefits to the management of the typical,uncomplicated patient, such as those that can be managedby clinical pathways or protocols. Examples of this type ofpat ient inc lude normal obstet r ica l del iver ies , s implepneumonia, and many orthopedic procedures such as kneeand hip replacements. By codifying and sharing the bestpractice for treating these types of patients, variation, rework,and resource use decreases. The personalized strategy canprovide many benefits to the management of the a-typicaland complicated patient, such as trauma and critical care

100 SCMS Journal of Indian Management, January-March, 2006.
Published by School of Communication and Management Studies
patients; patients requiring a customized plan of care, involvingmany different types of specialists and technicians who mustcoordinate their efforts and share knowledge to effectively carefor their patients. By creating process and standards for sharingknowledge among people who have specialized expertise, thewealth of knowledge available to treat each patient is magnified.
Hansen presents examples of healthcare companies that chosedifferent strategies. The first, Access Health, runs a call-in “Ask-A-Nurse”-type program. Access Health chose the codifiedstrategy and exploits the reuse of knowledge. As with similarprograms, a registered nurse responds to callers, using thecompany’s ‘clinical decision architecture’ to assess the caller ’ssymptoms, rule out possible conditions, and recommend ahome remedy, doctor ’s visit, or emergency room trip. AccessHealth util izes a “knowledge repository, which containsalgorithms of the symptoms of more than 500 illnesses. CEOJoseph Tallman describes the company’s strategy: We are notinventing a new way to cure disease. We are taking availableknowledge and inventing a process to put it to better use”(Hansen et al., 1999). Although the investment in developingthe algorithms was large, according to Hansen’s research, theyhave been used an average of 8,000 times (as of 1998 whenHansen conducted the research). That level of reuse supportsa low price per call which makes it attractive for Access Healthcustomers (insurance companies and provider groups) to payfor its services and still save money based on the callers whoavoid expensive and unnecessary emergency room visits(Hansen et al., 1999). The application of this idea might beapplied to such hospital-based programs as obstetrics, daysurgery, and simple pneumonia where the hospital, its patients,and its insurance company customers would benefit from thecodification of best practices. The benefits would include anincrease in the accessibility and dissemination of best practices,which would thereby improve quality while decreasingunnecessary resource use.
Hansen’s example of a healthcare entity that chose thepersonalization strategy is Memorial Sloan-Kettering CancerCenter. At Sloan-Kettering “a variety of experts consults oneach patient’s case, and managing the experts’ collaboration is,in essence, managing the center ’s knowledge” (Hansen et al.,1999). Hansen quotes James Dougherty, Sloan-Kettering’sdeputy physician-in-chief as he characterizes the collaborationamong professionals, “we coordinate intensive face-to-facecommunication in order to ensure that knowledge is transferredbetween researchers and clinicians and between different types
of clinicians (Hansen et al., 1999).” The infrastructure thatsuppor ts this collaboration includes several face-to-facemeetings per week, including all practitioners on the disease-specific team (there are 17 of these teams at Sloan-Kettering).“The meetings cover basic science initiatives, clinical findings,patient care, and ongoing research” (Hansen et al., 1999).
The type of information technology required to support acodified strategy is very different from they type that is requiredto support a personalized strategy, which is one of the reasonsthat choosing between these two approaches is a criticalsuccess factor for successful IT system implementation.Codified organizations tend to invest heavily in IT and look todata warehouses, data mining support, and, in the case ofhospitals, CDWs to suppor t knowledge acquisition anddissemination. Personalized organizations look to IT to facilitateconversations and the exchange of tacit knowledge by investingat a much more modest level in teleconferencing, groupware,and easily accessible directories of experts. Personalizedorganizations invest significantly more in ‘people time’ than in‘machine time,’ while codified organizations do the opposite.
An investment in a CDW is an investment in a codified strategy.It is vital that the organization implementing such a systemunderstand the ramifications of this choice, especially on theareas of the organization that currently rely on tacit knowledgeand will not be as well served by the CDW. The CDW will not bea panacea that answers all questions. It will not be an effectivetool in managing the complex, one-of-a-kind patient. Thesetypes of patients are often very expensive for a healthcare system,and it is vital that expectations on the impact a CDW can have inthese situations are not overstated.
Why not add a second type of system to support the exchangeof tacit knowledge required for managing the complex patient?Why must a choice be made between these two strategies? Inaddition to the differing levels and types of organizational andtechnical support, the personnel skills and abilities required toimplement these strategies are widely and markedly differentand require different types of incentives. As Hansen notes“emphasizing the wrong approach or trying to pursue both canquickly undermine a business” (Hansen et a l . , 1999).Consequences of trying to be both codified and personalizedinclude making the major investment in technology required tosuppor t a codified approach, only to have par ts of theorganization not use it. Likewise investing in and incentivisingpeople to functionally share knowledge is a time and resource
101 SCMS Journal of Indian Management, January-March, 2006.
Published by School of Communication and Management Studies
consuming approach and must be applied to those complexareas/situations where it is cost effective. “Companies thatstraddle the two strategies may also find themselves with anunwieldy mix of people. Having both inventors [personalizedstrategy] and implementers [codified strategy] rubbing elbowscan be deadly” (Hansen et al., 1999). An exception, Hansensays, can be found in companies “where business units operatelike stand-alone companies” (Hansen et al., 1999). In thissituation, the two strategies can co-exist as long as the strategywithin each business unit is consistent. However, “companieswith tightly integrated business units should either focus ononly one of the strategies or spin off units that don’t fit themold” (Hansen et al., 1999). Hansen also notes, however, thata company focused primarily on a codified strategy cansuccessfully implement pieces of the personalized strategy tobe applied in special circumstances and vice versa with acompany focused primarily on a personalized strategy. The80/20 rule should be followed when choosing between thesetwo strategies, using the following questions:
1. Does the organization primari ly (80 per cent) offerstandardized or customized products? A codified strategyfits companies that are creating a standardized product, whilea personalized strategy fits those with a customized product(Hansen et al., 1999).
2. Does the organization have a mature or innovative product?A codified strategy fits companies that have a mature productwhile a personalized strategy fits with those that have aninnovative product (Hansen et al., 1999).
3. Does the organization’s people rely on explicit or tacitknowledge to solve problems? Explicit knowledge (dataitems) obviously is easier to codify, while tacit knowledge(insights, judgment) is easier to transfer person-to-person(Hansen et al., 1999).
4. Why do customers buy your products over that of thecompetitors? What value do customers (which includepayers and physicians as well as patients in the case of thehealthcare system interviewed) expect from the organization?How does the knowledge that resides in the company addvalue for these customers? An organization’s responses tothese questions are critical in guiding the appropriate strategychoice (Hansen et al., 1999).
The healthcare system that provided input into this report meetsthe first two criteria for using a codified system: 80 per cent ofits business is standardized, routine patient care, and the product
is mature. However, the organization relies largely on tacitknowledge, given the paucity of codified data, for makingdecisions. Finally, according to the Director of InformationSystems at the healthcare network, healthcare customers arenot able to accurately judge the quality of the care theyreceive. Their assessments and choices are made based onthe things they can assess: the quality of the personalrelationships with staff, the cleanliness of the surroundings,etc., which will not be impacted directly by a CDW, but wouldbe impacted by a personalized strategy, where obvious timeand resources are spent bringing people with knowledge totheir bedside for consultation. With a score of two forcodified and two for personalized, the Director of InformationSystems notes that successfully implementing a codifiedsystem in this environment will require fundamental changesin the way the work of a majority of employees is carried outas wel l as fundamenta l changes in the incent ive andmanagement systems. These issues are discussed in thenext section.
Business Process Reengineering
Perhaps the lynchpin in the successful appl icat ion ofinformation technology, business process reengineering (BPR)“is central to ensuring that strategies are aligned through theclarification of needs, plans, and priorities” (Grimson et al.,2000). Implementing a system-wide, expensive system thatis expected to fundamentally change/improve basic workprocesses without reengineering those processes first isputting the cart before the horse. A complete reengineeringis necessary where the technology is meant to replace theold workflow patterns (Wong, 2000). BPR should drive thechoice and application of such systems, which are intendedto be enablers of BPR, not drivers. IT is a tool, not an end inand of itself. An organization should understand what thelatest IT makes possible, but should not let it drive its ownimplementation. Buying IT because it exists and implementinga large system on top of existing business processes is theclassic recipe for an unused or underused system, which willnot offer the expected return on investment (Wong, 2000).“Business reengineering means “star ting over ”... it meansasking this question: ‘If I were re-creating this company today,given what I know and given current technology, what wouldit look like?” (Hammer & Champy, 1993).
Healthcare workers and systems tend to be very changeresistant (Grimson et al., 2000). Much of the data “continues

102 SCMS Journal of Indian Management, January-March, 2006.
Published by School of Communication and Management Studies
to be processed manually in spite of decades of experiencein the successful application of information technology inother information-intensive industries” (Grimson et al., 2000).However, as the healthcare system interviewed for this reporthas experienced, the pressure for change is mounting. Profitmargins continue to shrink as costs rise and reimbursementsdecline, the number of uninsured and underinsured acrossthe country continues to increase, and the demand forhigh-quality, safe healthcare is rising from an increasinglywell-educated public (Grimson et al., 2000), (Wong, 2000).“Efficiency and cost effectiveness (balancing quality with costcontainment) are two major driving forces behind this needto change” (Grimson et al., 2000).
The healthcare industry’s answer to this crisis has consistentlybeen a focus on best practice. Best practice in healthcaretranslates into the expectation that if you define the most effectiveand efficient protocol to treat a condition, disseminate thismodel, and decrease variation among practitioners; quality willincrease and costs will decrease (Deming & Walton, 1988). Inactuality, the dissemination of best practices has been difficult,given that few of the characteristics of an information-drivenorganization exist in most healthcare systems. In fact, healthcarecultures tend to be diametrically opposed to this type ofinformation sharing (Wong, 2000). This opposition is due to the‘culture of blame’ and threat of litigation that surrounds medicalerrors, the fragmented nature of the practice of medicine, thedecentralization and relative isolation of individual healthcareentities, and the capital-poor nature of these entities (Grimsonet al., 2000), (Wong, 2000).
There has been significant focus in the healthcare networkinterviewed here and in the healthcare industry in general oncontinuous quality improvement (CQI) efforts. As describedby Deming, to implement CQI, the organization applies a logical,step-by-step approach to defining a process, measuring itsbaseline performance, identifying a desired state, and the gapbetween the current state and this desired state. A plan is thendeveloped to move the process from baseline towards thedesired state, measuring progress along the way (Deming &Walton, 1988). While the healthcare system interviewed herehas experienced some amount of success through CQI efforts,CQI is not going to get that organization to the position ofcompetitive advantage required to not just survive, but thrive, intoday’s healthcare market. As described by Hammer andChampy, while quality programs and reengineering share anumber of common themes, the two approaches differ
fundamentally. “Quality programs work within the framework ofa company’s existing processes and seek to enhance them…theaim is to do what we already do, only to do it better.Reengineering…seeks breakthroughs, not by enhancing existingprocesses, but by discarding them and replacing them withentirely new ones” (Hammer & Champy, 1993). Reengineering“doesn’t mean tinkering with what already exists or makingincremental changes that leave basic structures intact” (Hammer& Champy, 1993). Only “fundamental rethinking and radicalredesign of business processes” (Hammer & Champy, 1993)will lead to the dramatic improvements in cost and qualityrequired for competitiveness and profitability.
As the healthcare network works to implement an integrateddata archival and retrieval system with a CDW, BPR must be usedto create the processes needed to not only make this stepsuccessful, but also begin to create the processes that willallow live electronic record creation, retrieval, and analysisthrough an EMR. “Beginning with the end in mind” (Covey,1990) is the primary critical success factor for successfullarge-scale IT implementation.
The next section will fur ther discuss the necessity of usingreengineering to become an information-driven organization toeffectively integrate a large-scale IT system into an organization.
Integrating Large-Scale IT Systems into the Organization
This section will discuss the reengineering required to integratethe development, maintenance and use of a large-scaleinformation technology system into the organization’s daily work.The implementation of a CDW will result in unprecedentedamounts of newly available data for decision-making. Havingthe data available is not synonymous with its effective utilization.A review of the literature identified four characteristics oforganizations that are successful in managing and utilizing largeamounts of codified information:
1. They view knowledge as an asset to be managed just likeother key raw materials used in the business
2. They practice strong interorganizational collaboration
3. Their organizational infrastructures support learning andsharing information
4. Their corporate cultures support knowledge acquisition anddissemination through the mission/vision of the organization,through their suppor t of creativity, and through theirprioritization of knowledge management.

103 SCMS Journal of Indian Management, January-March, 2006.
Published by School of Communication and Management Studies
Knowledge as a “Manageable Asset”
The value of knowledge as an asset has grown as much of theUnites States’ economy has shifted to knowledge work (Scott,2000). As this shift has occurred, “firms attempt to retainknowledge to avoid repeating mistakes or ‘reinventing the wheel.’Moreover, firms are focusing on managing and creatingknowledge for competitive advantage” (Scott, 2000). Healthcareis a highly labor-intensive service industry, relying heavily onknowledge and information as its products. Organizations thathave embraced knowledge as a product and whosuccessfully manage it will be referred to in this section as“information-driven organizations.”
A key characteristic of the information-driven organization is thefocus and effort put toward managing both information sharingand acquisition as any other asset or raw material for the business.Knowledge, of course, does not easily fit into the roletypically defined for a raw material. “Unlike traditional rawma te r i a l , k now ledge u sua l l y i s n ’ t coded , aud i t ed ,inventoried, and stacked in a warehouse for employees touse as needed. It’s scattered, messy, and easy to lose”(Galagan, 1997). An informat ion-dr iven organizat iondevelops processes des igned to capture and shareknowledge. The core belief in an organization that suppor tsknowledge acquisition and dissemination is that “enhancedindividual learning will translate into improved organizationalbehaviors and performance” (King, 2001). The aphorismKing uses to capture this concept is “better knowledge forbetter behavior for better performance” (King, 2001).
Within the healthcare network interviewed for this repor t,knowledge is not coherently managed. Por tions of theorganizat ion assume the responsibi l i ty of “keeper ofknowledge” (pr imar i ly planning/market ing and cl in icalsuppor t/research). This knowledge is not seen as theproper ty of all, thus most employees, even those at themanagement level, have developed few skills in knowledgeacquisition or dissemination. A training program and areassignment of knowledge responsibilities will be required togive employees the tools they will need to effectively utilize thedata provided by the CDW in making clinical decisions.
Interorganizational Collaboration
By allowing a wide range of external as well as internal knowledgeexchange, interorganizational collaboration is an importantcharacter is t ic of an in format ion-dr iven organizat ion.“Organizations collaborate with customers, suppliers, and
competitors forming new networks of learning. Such knowledgelinks enable an organization to access and internalize theskil ls and capabil it ies of their par tners. This enables theextended enterprise to create new knowledge, disseminateit throughout the value chain, and embody i t in jointproducts, services and systems” (Scott, 2000).
A common fo rm o f i n te ro rgan i za t iona l know ledgeco l l abora t ion found i n hea l thca re i s benchmark i ngperformance. “Interorganizational collaboration catalyzesthe learning process by st imulat ing reconsideration ofcu r r en t p r ac t i ce s ” ( Sco t t , 2000 ) . B y cha l l e ng i ngassumptions, interorganizational collaboration suppor tsinnovation and experimentation. However, the l iteraturenotes that “prior experience affects the organization’sabsorpt ive capaci ty and how recept ive i t i s to newknowledge. How quickly the knowledge diffuses dependson an organization’s abil ity for imitation, and its ecologyof learning” (Scott, 2000).
Finally, mutual trust is a prerequisite for interorganizationalcollaboration. “Collaboration depends on high levels ofmutual trust to encourage the continuation and growth ofsuccessful relationships. With mutual trust, par tners wil lreciprocate openness and shar ing of information andknowledge . . . A recept i ve , t r u s t i ng and suppor t i veenvironment encourages risk taking and experimentation”(Scott, 2000).
A n u n d e r s t a n d i n g o f t h e l e v e l a n d a m o u n t o finterorganizational collaboration required for successfulintegration and uti l ization of a large-scale IT system doesnot ex is t at the heal thcare system interv iewed here.Perceptions vary as to the level of trust in the environment.Given the “si lo” organizational structure around clinicaldisciplines mentioned earl ier, there is l itt le suppor t forinterorganizational collaboration provided by the formalorganizational structure. Without a clear understanding ofthe capacity of the organization for interorganizationalcollaboration, data provided by a CDW will be underutilizedand the dissemination of best practices identified with thedata will be limited.
Organizational Infrastructure to Suppor t Learning/Sharing.For knowledge to be managed as an asset and foremployees to use their time for learning/sharing effectivelyand eff iciently, an infrastructure must exist to suppor temployees. Galagan notes that Amoco defines suppor t

104 SCMS Journal of Indian Management, January-March, 2006.
Published by School of Communication and Management Studies
for learning as “access to databases of effective practices,benchmarking studies, models and tools. It also means plentyof coaching and training in learning practices” (Galagan, 1997).This infrastructure also helps employees analyze what theyhave learned, to apply it, and put it into the context that willmost support their work. Galagan quotes Monsato’s Junnaker,“We’re not constrained by information; we are constrainedby sense-making. We are not constrained by ideas but bywhat to do with them” (Galagan, 1997).
Human re sou rces i n f r a s t r uc tu re mus t a l so suppor tknowledge acquisition and dissemination. Using work timefor knowledge acquisit ion is not only accepted, but alsoexpected. Time is built into job descriptions and learning/sharing effor ts are expected and rewarded in evaluations.Galagan quotes Amoco’s Dave Ledet, Director of SharedLearning, “Learning is considered everyone’s job at Amoco,from the pure knowledge workers to people who work infield and plant locations…our performance managementand reward systems all reinforce shared learning.” (Galagan,1997) . Cra ig s t resses the impor tance of encouragingemployees to “share information freely across corporateboundaries” (Craig, 2000). In short, employees must have thetime, energy, and incentive to acquire knowledge and shareknowledge with each other. “A high level of social interaction isnecessary to surface assumptions and transform tacitorganizational knowledge into explicit knowledge” (Scott, 2000).
To align with these infrastructure elements, the organizationalstructure of a firm must reflect the philosophy of collaborationand experimentation. A flat, decentralized structure, utilizingshared leadership and employee empowerment is mostconducive to supporting an information-driven environment(King, 2001).
All of these infrastructure elements must be created within thehealthcare network interviewed for this report. While knowledgeis a primary product in healthcare, this system has not organizeditself around that fact . The retool ing and reeingineer ingof processes and structures required to create theseinfrastructure elements wil l be intensive and far-reachinginto the organizat ion. The foundat ion for th is changemust come from the corporate cul ture.
Supportive Corporate Culture
Several authors spoke of the impor tance of corporateculture to encourage knowledge capture and knowledgeshar ing wi th in an organization. According to Galagan,
“Companies that want to leverage their knowledge are findingthat it takes a corporate cultural change to ensure the effectivemanagement of knowledge. This shift in culture results in aworkforce that is willing to learn and share knowledge” (Galagan,1997). An obvious interaction between the other characteristicsof an information-driven organization and corporate culture is inthe need for employees to have the time to learn and shareknowledge. If this time is not built into job descriptions and isnot an expectation within the culture, other job duties can easilytake priority. Knowledge acquisition and sharing will wither onthe vine without the nourishment of time and attention. Kingdiscusses the type of cultural suppor t needed to succorknowledge acquisition and dissemination; he refers to thedevelopment of a “university culture – one that values learning,informed debate, and academic freedom” (King, 2001). Kingfur ther explains that to support a culture of knowledge sharing,“the ubiquitous ‘knowledge is power ’ assumption must betransformed into one in which sharing is appreciated andrewarded” (King, 2001).
Another key component to an ideal knowledge culture is asupport for creativity. This support includes “a tolerance for thesmall failures that will inevitably result when innovations arepursued, the valuing of ideas that are generated (even if they arenot pursued), the willingness to ‘think outside the box,’ and thepostponing of the evaluation of ideas until they are fullyformulated” (King, 2001).
Finally, only strong leadership can provide the direction acompany needs to choose, implement and overcome resistanceto a new technology and a new way of working (Hansen etal., 1999). It is an organization’s mission and vision asembodied by the priority structure perpetuated by the CEOand other senior management that makes an information-driven organization possible. In addition, this attention fromleadership provides the suppor t necessar y to fostercoordination among and between HR , IT, and the goals/objectives of the organization, aligning all of the effor tsbehind creating and suppor ting an environment that exhibitsthe characteristics discussed above.
Comments
A Model for Becoming Information-Driven
Based on the literature review, Figure 1 provides a modeldepicting the relational view of the characteristics of aninformation-driven learning organization.
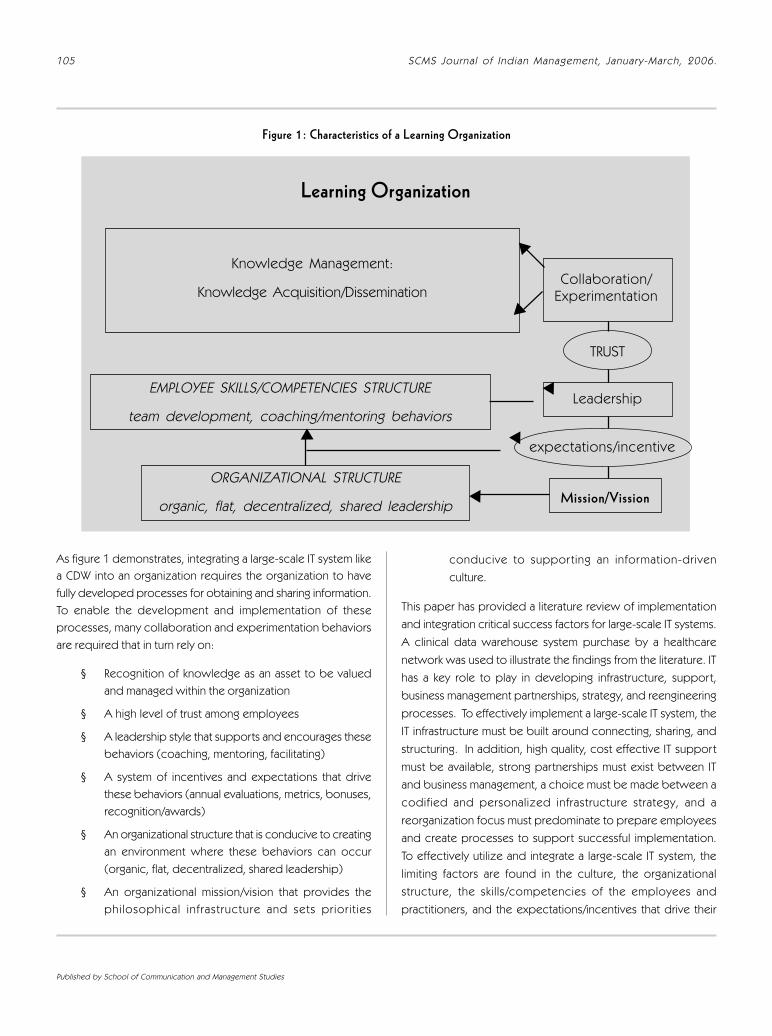
105 SCMS Journal of Indian Management, January-March, 2006.
Published by School of Communication and Management Studies
As figure 1 demonstrates, integrating a large-scale IT system likea CDW into an organization requires the organization to havefully developed processes for obtaining and sharing information.To enable the development and implementation of theseprocesses, many collaboration and experimentation behaviorsare required that in turn rely on:
§ Recognition of knowledge as an asset to be valuedand managed within the organization
§ A high level of trust among employees
§ A leadership style that supports and encourages thesebehaviors (coaching, mentoring, facilitating)
§ A system of incentives and expectations that drivethese behaviors (annual evaluations, metrics, bonuses,recognition/awards)
§ An organizational structure that is conducive to creatingan environment where these behaviors can occur(organic, flat, decentralized, shared leadership)
§ An organizational mission/vision that provides thephi losophical infrastructure and sets priorit ies
conducive to suppor ting an information-drivenculture.
This paper has provided a literature review of implementationand integration critical success factors for large-scale IT systems.A clinical data warehouse system purchase by a healthcarenetwork was used to illustrate the findings from the literature. IThas a key role to play in developing infrastructure, support,business management partnerships, strategy, and reengineeringprocesses. To effectively implement a large-scale IT system, theIT infrastructure must be built around connecting, sharing, andstructuring. In addition, high quality, cost effective IT supportmust be available, strong partnerships must exist between ITand business management, a choice must be made between acodified and personalized infrastructure strategy, and areorganization focus must predominate to prepare employeesand create processes to support successful implementation.To effectively utilize and integrate a large-scale IT system, thelimiting factors are found in the culture, the organizationalstructure, the skills/competencies of the employees andpractitioners, and the expectations/incentives that drive their
Figure 1: Characteristics of a Learning Organization
Knowledge Management:
Knowledge Acquisition/DisseminationCollaboration/
Experimentation
TRUST
Leadership
expectations/incentive
Mission/VissionORGANIZATIONAL STRUCTURE
organic, flat, decentralized, shared leadership
EMPLOYEE SKILLS/COMPETENCIES STRUCTURE
team development, coaching/mentoring behaviors
▼
▼
▼
▼
▼
▼
Learning Organization

106 SCMS Journal of Indian Management, January-March, 2006.
Published by School of Communication and Management Studies
behavior. To meet the challenges of the next ten years willrequire effective and efficient acquisition and dissemination ofknowledge. The healthcare network interviewed for this report,and the rest of the organizations in the healthcare industrythat hope to implement systems like CDW and, eventually,EMR, wi l l be requi red to reengineer themselves intoinformation-driven, learning organizations, which are ableto effectively and efficiently utilize new IT systems to enablethe in fo r mat ion t rans fe r, coord ina t ion , and ana lys i sprocesses. Only then will the potential return on investmentin IT be realized.
References
Bartlett, C., “McKinsey & Company: Managing Knowledge andLearning,” Harvard Business School Case 9-396-357,1(20), 1998.
Bensaou, M., & Earl, M., “The Right Mind-set for ManagingInformation Technology,” Harvard Business Review,119(118), 1998.
Covey, S., The 7 Habits of Highly Effective People (First ed.):Fireside, 1990.
Craig, R., “KM Comes of Age,” ENT, 5 (7), 36 (32), 2000.
Deming, W. E., & Walton, M., The Deming Management Method:Perigee, 1988.
Gaillour, F., “Rethinking the CDR: Is Perfect the Enemy of theGood?” Clinical Computing, 22, 1999.
Galagan, P., “Smart Companies (Knowledge Management),”Training & Development, 51 (12), 20 (24), 1997.
Goodhue, D., & Thompson, R ., “Task-Technology Fit andIndividual Performance,” MIS Quarterly, 19 (2), 213 (229),1995.
Grimson, J., Grimson, W., & Hasselbring, W., “The SI Challengein Health Care,” Communications of the ACM, 43 (6),48, 2000.
Haeckel, S., & Nolan, R., “Managing by Wire,” Harvard BusinessReview, 122 (110), 1993.
Hammer, M., & Champy, J., Reengineering the Corporation(First ed.): HarperCollins, 1993.
Hansen, M., Nohria, N., & al., e. “What’s Your Strategy forManaging Knowledge?” Harvard Business Review, 77(2), 106 (111), 1999.
Hensley, S., “Catalyst for Change,” Modern Healthcare, 29 (25),128, 1999.
King, W., “Strategies for Creating a Learning Organization,”Information Systems Management, 18 (1), 12 (18), 2001.
Ross, J., Beath, C., & Goodhue, D., “Develop Long-TermCompetitiveness through IT Assets,” Sloan ManagementReview, 38 (1), 31 (11), 1996.
Scott, J., “Facilitating Interorganizational Learning with InformationTechnology,” Journal of Management InformationSystems, 17 (2), 81(86), 2000.
Wong, H., “The Diffusion of Decision Suppor t Systems inHealthcare: Are We There Yet?” Journal of HealthcareManagement, 45 (4), 240 (213), 2000.

107 SCMS Journal of Indian Management, January-March, 2006.
Published by School of Communication and Management Studies
the competitive advantage, one has to keep track of capabilitiesand understand which capability is critical and which are not.
The second section of the book talks about strategies to grow thecore business and strategies to entering markets, which are new tothe firm. The chapter focuses on creating frameworks to understandthe risks of entering existing or new markets. In the existing marketsone has to overcome entry barriers. So in order to overcome theentry barrier the firm has to find value gaps, which are not satisfied byany existing players and where the firm has inherent capabilities. Oneof the unconventional strategies that author puts forth is that in theearly stages of the lifecycle of the market, the low risks entry objectiveshould be differentiation while in the mature stage the entry objectivesshould be low price.
This section also gives valuable insights into using low price entrystrategy; strategies to shape markets where firms attempt to createmarkets from scratch. While low price entry strategy requires lowcost capacities, creating markets from scratch as a high-riskventure. The author also tells the executives not to close off alloptions and re-evaluate the options as more precise informationis obtained. This will enable the organization to develop multiplemigration paths, which is a strategy to avoid risk.
The book is rich with case studies and examples but moreimportantly devoid of any jargons. The book aims to develop anunderstanding about the concepts through frameworks.Frameworks help the readers to apply these concepts to anybusiness be it service, consumer or industry. The author cites thecases of Southwest airlines, Dell, Sony, Yamaha, Jet Blue, and Cisco,which enable the readers to relate the concepts with actualimplementation. This book is not only a must read but also a bookthat should be owned and kept for future reference.
Mr.Harish B.Lecturer-Marketing
SCMS, KochiEmail: [email protected]
Skimming andScanning
his book is a must read for practitioners and students ofbusiness. The aim of the book is to help the readers todesign business models where risks can be reduced to
manageable proportions. In this era of consolidation and acquisitions,companies are gearing to grow in scale using high-risk strategies.
The book is divided into two sections. Section one talks aboutdesigning strategies for avoiding risks while the second sectiondeals with the risks in growth and diversification strategy.
The author identifies three major sources of business risks thatcan rail any strategy: Demand Risk, Competitive risk and Capabilityrisk. Demand risk is the risk that the value proposition of the firmtrying to sell will not be accepted by the market. Competitive riskis the risk that competitors will take away its customers. Capabilityrisk that a firm is not able to deliver the value propositions thatcustomers will pay for or the firm will not be able to make a profitbecause of the capabilities cost.
This book also convinces the customers to adopt a framework“outcome-to-objective” to identify options that isolate the firmsfrom the key risks. The key is to identify more choices that deliverthe desired outcomes, thus reducing the risk. The author cautionsthat one needs to break the inside-out mindset in order to generatethese multiple choices.
The book talks about three steps to design a low risk strategy.The first step is to have a clear understanding of the competitiveobjective. The next step is to develop the core competitiveobjective that cannot be imitated by the competitors and finalstep is to use the core objectives to reduce capability risks.
The first section also talks on designing strategies with lowcapability risks. In this part, the author warns the Business leadersto devote sufficient time to develop complex capabilities. Theauthor also considers low medium and high-risk strategies foracquiring capabilities. The high-risk strategy can be creating anentirely new value chain. The author says that to continuously sustain
Book Title : Fail Safe StrategiesAuthor : Sayan ChaterjeePages : 284Publisher : Wharton School PublishingPrice : Rs.499/-
12345678901234567890123456789012123456789012345678901234567890121234567890123456789012345678901212345671234567890123456789012345678901212345678901234567890123456789012123456789012345678901234567890121234567
T

108 SCMS Journal of Indian Management, January-March, 2006.
Published by School of Communication and Management Studies
1234567123456712345671234567123456712345671234567123456712345671234567123456712345671234567123456712345671234567123456712345671234567123456712345671234567123456712345671234567123456712345671234567123456712345671234567123456712345671234567123456712345671234567123456712345671234567
Skimming andScanning
enichi Ohmae, who coined the phrase globalization, hasproved his expertise again on the emergence of internationaleconomy in his latest book, THE NEXT GLOBAL STAGE.
He has used his traditional clear writing style to simplify an extremelycomplex subject of how the global economy continues to metastasizeinto every corner of the globe, into an understandable text.
This book was first published in March 2005 and consists of threeparts, each part consisting of 3-to-4 chapters. In the 3 chapters ofPart I - The Stage - Ohmae looks at some of the areas of explosivegrowth and identifies some of the characteristics of the globaleconomy like the 4 C’s - communications, capital, corporations andconsumers. The four chapters in Part II - Stage Directions - examinethe major trends emerging on the global stage. And, the 3 chaptersin Part III - The Script - provide analysis of how the changes andtrends will impact governments, corporations and individuals.
The section on reinventing economics serves as a very usefulpreamble to the remainder of the book, where the author dissectsboth governments and business practices before going on to discussplatforms for progress inclusive of technologies and languages. Theentire book is an attempt to expound on the powerful and irreversibleprocess of economic activity moving largely unhindered to the placeswhere it can exist most inexpensively. The thesis is that a radicallynew world is taking shape from the ashes of yesterday’s nation-basedeconomic world and to succeed one must act on the global stage,leveraging radically new drivers of economic power and growth.
Ohmae cautions against relying on the legacy of economic thinkerssuch as John Maynard Keynes and Milton Friedman. Keynes’ theoriesmight have been correct when they were presented first but Ohmaepoints out that conditions now are so different that thinking likeKeynes will prevent one from understanding the new global economy.Capital now flows easily across borders, which has made it possible
Title : THE NEXT GLOBAL STAGE:Challenges and opportunities in our borderless world
Author : Kenichi OhmaeEdition : First Indian Reprint 2005ISBN : 81 – 297 – 1132 – XPrice : Rs.499/-Publisher : Wharton School PublishingIndian Reprint : Pearson Education (Singapore) Pte.Ltd.
for a manufacturing opportunity to move to a place of lower labourcosts. The capital to create the infrastructure will naturally be availableand will flow to that region.
Regions should not cut themselves off from the flow of internationalcapital and ideas, but instead should tap into it. The author vehementlyargues for the development of the “region state,” tomorrow’s mostpotent economic institution, where the borders of political entities startto be defined by the economic activity of the region rather than political,ethnic or cultural borders. The economic zones of the People’s Republicof China do not end at the political boundaries, but are defined by thepresence of factories and what the people do for a living.
One of the most significant sections of the book is where Ohmaediscusses how governments traditionally shore up the weakestsectors of the domestic economy. He also discusses the flow ofcapital into the People’s Republic of China and how governmentsdistribute wealth rather than create it. The other interesting part of thebook is about China and the regions of Asia poised to be the nextboom growth areas, like Vietnam. Ohmae concludes with a detailedlook at strategy in an era where it’s tougher to define competitors,companies, and customers than ever before.
THE NEXT GLOBAL STAGE offers a practical blueprint forbusinesses and governments by highlighting some of the mainlevers organizations can pull to tap into the global economy. Forgovernment officials, global business leaders and economists whointend to thrive in this new environment, this is one that’s readableand a great desk reference as well.
Dr.V.Raman NairDy.Director
SCMS, Kochi.Email: [email protected]
K
12345678901234567890123456789012123456789012345678901234567890121234567890123456789012345678901212345671234567890123456789012345678901212345678901234567890123456789012123456789012345678901234567890121234567

109 SCMS Journal of Indian Management, January-March, 2006.
Published by School of Communication and Management Studies
SCMS Journal of Indian Management
Subscription / Advertisement Form
Name :Address :
City :Zip Code :Country :E-mail :Phone :Draft Number :
(in favour of “SCMS Journal of Indian Management, Cochin”)
Subscription RatesIndian (in Rupees)
Companies/Academic Institutes : 1000 ($60) 1800 250 ($15)
Individual : 400 700 125
Students : 280 450 100
AdverAdverAdverAdverAdver tisement Ratetisement Ratetisement Ratetisement Ratetisement Rate
Outside back cover : Rs.30,000 in color, Rs.15,000 in black and white
Inside front cover : Rs.17,500 in color, Rs.10,000 in black and white
Inside back cover : Rs.15,000 in color, Rs.6,000 in black and white
Inner full-page : Rs.7500 in color, Rs.4,000 in black and white
Inner half-page : Rs.5000 in color, Rs.3,000 in black and white
For all communications contact:Editor, SCMS Journal of Indian Management, SCMS New Campus, Prathap Nagar, Muttom,Aluva - 683 106, Kochi, Kerala, India.Phone: 91-484-262 3803 / 262 3804 / 262 3885 / 262 3887 Fax: 91-484-262 3855Website: www.scmsgroup.org E-mail: [email protected] / [email protected]
1 year 2 years Per issue

School of Communication and Management Studies

SCMS JOURNAL OF INDIAN MANAGEMENTSCMS JOURNAL OF INDIAN MANAGEMENTSCMS JOURNAL OF INDIAN MANAGEMENTSCMS JOURNAL OF INDIAN MANAGEMENTSCMS JOURNAL OF INDIAN MANAGEMENT12345678901234567890123456789012123456789012345678901234567890121234567890123456789012345678901212345678901234567890123456789012123456789012345678901234567890123456789012345678901212345678901234567890123456789012123456789012345678901234567890121234567890123456789012345678901212345678901234567890
Aims and Scope
The SCMS Journal of Indian Management is a peer-reviewed Journal. The Journal deems it its mission to submit to the readers fresh fruitof management thoughts and rich cream of current innovative research. The format of the Journal is designed reader-friendly. Theacademia and the corporates have an easy access to the Journal.
The Journal looks for ar ticles conceptually sound, at once methodologically rigorous. The Journal loves to deal knowledge inmanagement theory and practice individually and in unison. We wish our effort would bear fruit. We hope the Journal will have a longlife in the shelves catering to the needs of b-students and b-faculty.
§ Proposals for ar ticles that demonstrate clear and bold thinking, fresh and useful ideas, accessible and jargon-freeexpression, and unambiguous authority are invited. The following may be noted while ar ticles are prepared.
§ What is the central message of the article you propose to write? Moreover, what is new, useful, counterintuitive, or importantabout your idea?
§ What are the real-world implications of the proposed article? Can the central message be applied in businesses today, andif so, how?
§ Who is the audience for your ar ticle? Why should a busy manager stop and read it?
§ What kind of research have you conducted to support the argument or logic in your article?
§ What academic, professional, or personal experience will you draw on to make the argument convincing? In other words,what is the source of your authority?
§ The manuscript of reasonable length shall be sent to the Editor—SCMS Journal of India Management (Both for postal andelectronic submission details are given here under).
The manuscript should accompany the following separately:
§ An abstract (about 100 words), a brief biographical sketch of above 100 words for authors describing designation,affiliation, specialization, number of books and ar ticles published in the referee journals, membership on editorial boardsand companies etc.
§ The declaration to the effect that the work is original and it has not been published earlier shall be sent.
§ Tables, charts and graphs should be typed in separate sheets. They should be numbered as Table 1, Graph 1 etc.
§ References used should be listed at the end of the text.
§ Editors reserve the right to modify and improve the manuscripts to meet the Journal’s standards of presentation and style.
§ Editors have full right to accept or reject an article for publication. Editorial decisions will be communicated with in a periodof four weeks of the receipt of the manuscripts.
§ All footnotes will be appended at the end of the ar ticle as a separate page. The typo script should use smaller size fonts.1234567890123456789012345678901212345678901234567890123456789012123456789012345678901234567890121234567890123456789012345678901212345678901234567890112345678901234567890123456789012123456789012345678901234567890121234567890123456789012345678901212345678901234567890123456789012123456789012345678901
Address for SubmissionElectronic Submission : E-mail: [email protected]/
[email protected] electronic submission must be in the form of an attachment with a coveringletter to be sent as e-mail
Post Submission : The EditorSCMS Journal of Indian Management,SCMS New Campus, Prathap Nagar, Muttom,Aluva – 683 106, Kochi, Kerala, IndiaPh : +91 484 2623803, 2623804, 2623885, 2623887Fax : 91 484 2623855
1234567890123456789012345678901212345678901234567890123456789012123456789012345678901234567890121234567890123456789012345678901212345678901234567890112345678901234567890123456789012123456789012345678901234567890121234567890123456789012345678901212345678901234567890123456789012123456789012345678901

The Next Global Stage 110 -110V.Raman Na i r
SCMSJOURNAL OF
INDIAN MANAGEMENT
B R A N D S ! B R A N D S !
CONSUMER AND RETAIL ING
S K I M M I N G AND S C A N N I N G
C h a l l e n g e s o f M a n a g i n g a n d 05 -19G r o w i n g B r a n d s G l o b a l l y
P r a shan t S a lwan and J i t i n M u n j a lA Conceptua l F ramework on B rand 20 -28A r c h i t e c t u r e i n I n d i a n C o n t e x t
C.Anandan, M.Prasanna Mohan Raj and K.Rav ichandran
Key Success Factors of Franchis ing 29 -36Systems in the Reta i l ing Sector
I l a n A l o nModels fo r At t r ibu te-Based ConsumerClass i f icat ion: Ar t i f ic ia l Neura l 37 - 45Networks versus MLR and MDA
José Mar í a Cub i l lo -P in i l l a and Joaqu in Sánchez-Her re ra
Corporate Performance Management:An Innovat ive St ra teg ic Solut ion for 46 - 52G l o b a l C o m p e t i t i v e n e s s
K.G.Sankaranarayanan and Babu P.George
Profess ional iz ing Micro F inance 53 - 61f o r E f f e c t i v e R e g u l a t i o n
Gi r i s h B. and Soju Annie GeorgeAssess ing the Serv ice Qual i ty of Bank ing 62 - 72Te c h n o l o g i e s i n M a u r i t i u s
Ashwin Beegadhur, Sooraj Fowdar and Rooma Roshnee R amsa r an - Fowda r
Ef f ic iency of Publ ic Sector Enterpr ises-A Case S tudy o f C .C . L . , Ranch i – 73 - 87An Empir ica l Study
Susan Ch i r aya thCreat ive Approach to Decis ion-Making 88 - 95
J .K .Sha rma and B . B .Da s
T h e I n f o r m a t i o n - D r i v e n 96 - 106Hea l thcare Organ izat ion
K r i s t i e J . L o e s c h e r
F a i l s a f e S t r a t e g i e s 107 -107Ha r i sh B .
The Next Global Stage 108-108Raman Nair
V O L U M E I I I , N U M B E R IV O L U M E I I I , N U M B E R IV O L U M E I I I , N U M B E R IV O L U M E I I I , N U M B E R IV O L U M E I I I , N U M B E R I
J A N U A RJ A N U A RJ A N U A RJ A N U A RJ A N U A R YYYYY - M A R C H 2 0 0 6- M A R C H 2 0 0 6- M A R C H 2 0 0 6- M A R C H 2 0 0 6- M A R C H 2 0 0 6
GLOBAL COM P E T I T IVENESS
BANK ING AND F INANCE
L E A D E R S H I P
HEALTHC ARE
I S S N 0 9 7 3 - 3 1 6 7I S S N 0 9 7 3 - 3 1 6 7I S S N 0 9 7 3 - 3 1 6 7I S S N 0 9 7 3 - 3 1 6 7I S S N 0 9 7 3 - 3 1 6 7Listed in Cabell’s DirectorListed in Cabell’s DirectorListed in Cabell’s DirectorListed in Cabell’s DirectorListed in Cabell’s Director yyyyy

SCMS Journal of Indian ManagementSchool of Communication and Management Studies
SCMS New Campus, Prathap NagarMuttom, Aluva-683 106, Kochi, Kerala, India
Ph: 91-484-262 3803 / 262 3804 / 262 3885 / 262 3887 Fax: 91-484-262 3855E-mail: [email protected] / [email protected]
Website: www.scmsgroup.org
123456789012345678901234567890121234567890123456789012345678901212345678901234567890123456789012123456789012345678901234567890121234567890123456789123456789012345678901234567890121234567890123456789012345678901212345678901234567890123456789012123456789012345678901234567890121234567890123456789

SC
MS
S
CM
S
SC
MS
S
CM
S
SC
MS
JJJJ Jo
ur
ou
ro
ur
ou
ro
ur n
al o
f In
dia
n M
anag
em
en
t n
al o
f In
dia
n M
anag
em
en
t n
al o
f In
dia
n M
anag
em
en
t n
al o
f In
dia
n M
anag
em
en
t n
al o
f In
dia
n M
anag
em
en
t
V
V
V
V
Vo
lum
e III
, N
umb
er I
, J
olu
me
III,
Num
ber
I,
Jo
lum
e III
, N
umb
er I
, J
olu
me
III,
Num
ber
I,
Jo
lum
e III
, N
umb
er I
, J a
nuar
anua
ran
uar
anua
ran
uar yyyy y
-Mar
ch 2
00
6,
-Mar
ch 2
00
6,
-Mar
ch 2
00
6,
-Mar
ch 2
00
6,
-Mar
ch 2
00
6,
P
P
P
P
P
ages
1-1
10
ages
1-1
10
ages
1-1
10
ages
1-1
10
ages
1-1
10