Embed Size (px)
Citation preview
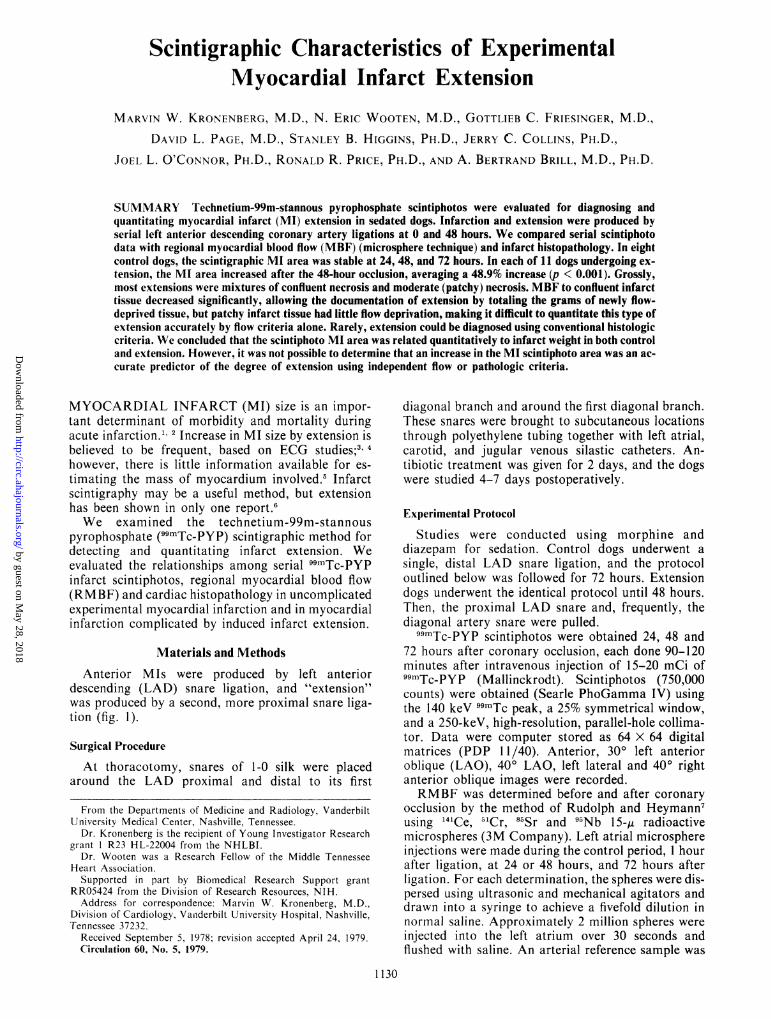
Scintigraphic Characteristics of ExperimentalMyocardial Infarct Extension
MARVIN W. KRONENBERG, M.D., N. ERIC WOOTEN, M.D., GOTTLIEB C. FRIESINGER, M.D.,DAVID L. PAGE, M.D., STANLEY B. HIGGINS, PH.D., JERRY C. COLLINS, PH.D.,
JOEL L. O'CONNOR, PH.D., RONALD R. PRICE, PH.D., AND A. BERTRAND BRILL, M.D., PH.D.
SUMMARY Technetium-99m-stannous pyrophosphate scintiphotos were evaluated for diagnosing andquantitating myocardial infarct (MI) extension in sedated dogs. Infarction and extension were produced byserial left anterior descending coronary artery ligations at 0 and 48 hours. We compared serial scintiphotodata with regional myocardial blood flow (MBF) (microsphere technique) and infarct histopathology. In eightcontrol dogs, the scintigraphic MI area was stable at 24, 48, and 72 hours. In each of 11 dogs undergoing ex-tension, the MI area increased after the 48-hour occlusion, averaging a 48.9% increase (p < 0.001). Grossly,most extensions were mixtures of confluent necrosis and moderate (patchy) necrosis. MBF to confluent infarcttissue decreased significantly, allowing the documentation of extension by totaling the grams of newly flow-deprived tissue, but patchy infarct tissue had little flow deprivation, making it difficult to quantitate this type ofextension accurately by flow criteria alone. Rarely, extension could be diagnosed using conventional histologiccriteria. We concluded that the scintiphoto MI area was related quantitatively to infarct weight in both controland extension. However, it was not possible to determine that an increase in the MI scintiphoto area was an ac-curate predictor of the degree of extension using independent flow or pathologic criteria.
MYOCARDIAL INFARCT (MI) size is an impor-tant determinant of morbidity and mortality duringacute infarction.1' 2 Increase in MI size by extension isbelieved to be frequent, based on ECG studies;3' 4
however, there is little information available for es-timating the mass of myocardium involved.5 Infarctscintigraphy may be a useful method, but extensionhas been shown in only one report.6We examined the technetium-99m-stannous
pyrophosphate (99mTc-PYP) scintigraphic method fordetecting and quantitating infarct extension. Weevaluated the relationships among serial 99mTc-PYPinfarct scintiphotos, regional myocardial blood flow(RMBF) and cardiac histopathology in uncomplicatedexperimental myocardial infarction and in myocardialinfarction complicated by induced infarct extension.
Materials and Methods
Anterior MIs were produced by left anteriordescending (LAD) snare ligation, and "extension"was produced by a second, more proximal snare liga-tion (fig. 1).
Surgical Procedure
At thoracotomy, snares of 1-0 silk were placedaround the LAD proximal and distal to its first
From the Departments of Medicine and Radiology, VanderbiltUniversity Medical Center, Nashville, Tennessee.
Dr. Kronenberg is the recipient of Young Investigator Researchgrant I R23 HL-22004 from the NHLBI.
Dr. Wooten was a Research Fellow of the Middle TennesseeHeart Association.Supported in part by Biomedical Research Support grant
RR05424 from the Division of Research Resources, NIH.Address for correspondence: Marvin W. Kronenberg, M.D.,
Division of Cardiology, Vanderbilt University Hospital, Nashville,Tennessee 37232.
Received September 5, 1978; revision accepted April 24, 1979.Circulation 60, No. 5, 1979.
diagonal branch and around the first diagonal branch.These snares were brought to subcutaneous locationsthrough polyethylene tubing together with left atrial,carotid, and jugular venous silastic catheters. An-tibiotic treatment was given for 2 days, and the dogswere studied 4-7 days postoperatively.
Experimental Protocol
Studies were conducted using morphine anddiazepam for sedation. Control dogs underwent asingle, distal LAD snare ligation, and the protocoloutlined below was followed for 72 hours. Extensiondogs underwent the identical protocol until 48 hours.Then, the proximal LAD snare and, frequently, thediagonal artery snare were pulled.99mTc-PYP scintiphotos were obtained 24, 48 and
72 hours after coronary occlusion, each done 90-120minutes after intravenous injection of 15-20 mCi of99M Tc-PYP (Mallinckrodt). Scintiphotos (750,000counts) were obtained (Searle PhoGamma IV) usingthe 140 keV 99mTc peak, a 25% symmetrical window,and a 250-keV, high-resolution, parallel-hole collima-tor. Data were computer stored as 64 X 64 digitalmatrices (PDP 11/40). Anterior, 300 left anterioroblique (LAO), 400 LAO, left lateral and 40° rightanterior oblique images were recorded.RMBF was determined before and after coronary
occlusion by the method of Rudolph and Heymann7using 141Ce, 51Cr, 85Sr and 95Nb 15-,u radioactivemicrospheres (3M Company). Left atrial microsphereinjections were made during the control period, 1 hourafter ligation, at 24 or 48 hours, and 72 hours afterligation. For each determination, the spheres were dis-persed using ultrasonic and mechanical agitators anddrawn into a syringe to achieve a fivefold dilution innormal saline. Approximately 2 million spheres wereinjected into the left atrium over 30 seconds andflushed with saline. An arterial reference sample was
1130
by guest on May 28, 2018
http://circ.ahajournals.org/D
ownloaded from

SCINTIGRAPHY OF INFARCT EXTENSION/Kronenberg et al.
MICROSPHERE INJECTION
Ce -141Cr - 51Sr - 85Nb- 95D ORIGINALLY
t FLOW- DEPRIVED
NEWLY1 FLOW-DEPRIVED,
I.2nd SNARES
Left anterior descending
FIGURE 1. Experimental model ofinfarct extension. The first snare ligation of the left anterior descendingartery produces anterior infarction. The second snare ligation produces extension in a "watershed" fashion.Serial left atrial microsphere injections were used to quantitate myocardial blood flow.
collected using a motorized pump withdrawing at 18.0ml/min for 3 minutes (Harvard Apparatus). A 12-leadECG and the arterial pressure were recorded duringthe control period and at each microsphere injection.The dogs were sacrificed after a final image and MBFat 72 hours. In three control dogs, MBF was deter-mined at control, 1, 24 and 48 hours.
For postmortem analysis, the atria and fat were ex-cised, and the combined ventricles were sliced intoserial 4-5-mm transverse slices using an electric meatslicer. Thirty-five-millimeter photographs of the wholeheart and the slices were made. Two weighed, repre-sentative slices of the infarct - one apical and onebasal - were fixed in formalin for subsequent histo-pathologic studies. Three or more representative in-farct slices adjacent to the surfaces of the histologicslices were weighed, sketched and divided into multi-ple sections for determining their 99mTc and micro-sphere activities. The remaining myocardium wasapportioned into additional counting vials accordingto its gross appearance - yellow MI, red ("hemor-rhagic") MI, pale and patchy MI, normal and peri-infarct tissue (a normal-appearing zone 3-5 mm wideoutside the gross MI borders). Sections with red, red-yellow, and yellow necrosis were designated as "con-fluent infarct" tissues.The histologic slices were stained with hematoxylin
and eosin and by the PAS method and examinedmicroscopically in detail to define the extent of the 24-hour vs the 72-hour infarct. 99mTc activity in the sec-tions was measured in 14 dogs in duplicate using atwo-channel gamma counter (Searle PhoGamma HP,Model 1185). Microsphere activity was measured in
each tissue sample for 500 seconds using a mul-tichannel analyzer with counting windows centeredover the principal energy peak of each isotope(Packard AutoGamma Scintillation Spectrometer,Model 5986).
Data AnalysisThe dogs with a minimum of two sets of scin-
tiphotos and flows were included in the analysis.
Tissue Data
There was an average of 65 representative slice sec-tions for each heart (range 24-96) weighing0.625 ± 0.388 g (mean ± SD). All samples were codedaccording to their gross appearance, location in theventricle (anterior, lateral, posterior and septal), andposition in the ventricular wall (endocardial, epicar-dial, transmural, left interventricular septum, mid-septum and right septum).MI weight was defined as the sum of the weights of
all infarct samples. The weights of infarct and normaltissue in the slices used for histologic study werecalculated using the formula MIH = MIADJWTH/ WTADJ, where MIADJ is the average MI weightin two adjacent slices, WTADJ is the average weight ofthe adjacent slices, WTH is the weight of the histologicslice, and MIH is the MI weight of the histologic slice.
99mTc Activity
The differences between duplicate counts in tissuesections were quite small, ranging from 0.009%
1 131
by guest on May 28, 2018
http://circ.ahajournals.org/D
ownloaded from
VOL 60, No 5, NOVEMBER 1979
(n = 61) to 0.5% (n = 94) in two dogs chosen at ran-dom.Myocardial Blood Flow
The radioactivity of individual spheres was iden-tified using a computer program modeled after thematrix method of Rudolph and Heymann.7 Thisresolved in vitro mixtures of the spheres we used towithin 3% of their individual count rates. Flow to eachsection was determined in ml/min/g wet weight andwas also calculated as relative MBF, the flow to eachsection as a fraction of the weighted mean flow to allnormal tissue in that heart at each flow determination.The precision of our MBF technique after myocar-
dial infarction was determined as follows. Micro-spheres ("'Ce, 5Cr and 85Sr) were injected during thecontrol period and I and 24 hours after infarction,respectively. The resulting 108 myocardial sectionswere counted five times sequentially. The standarddeviation of the mean flow to the sections was 2.2, 3.4and 1.6% for the control, 1- and 24-hour flows, respec-tively. Total myocardial flow was also quite stable.The standard deviation was 0.5, 1.9 and 0.5% of themean total flow at control, 1 and 24 hours, respec-tively.
ScintiphotosThe computer-stored images were processed to
define the MI area. The best view for demonstratingthe infarct over the 3-day study was chosen. We usedconstant, measured background subtraction andmanually outlined the 99mTc-PYP-positive imageusing an electronic cursor system to mark the MIborder. The MI area was expressed in numbers ofmatrix cells. Frequent reference to analog Polaroidimages facilitated the analysis.
Serial MBF and scintiphoto data were analyzedusing the CLINFO Data Management System (Divi-sion of Research Resources, NIH, Bethesda,Maryland). Flow parameters were compared withchanges in the scintigraphic infarct area. Data wereanalyzed using paired and unpaired t tests, chi-squareand linear regression analyses as appropriate.8'Statistical significance was defined as p < 0.05.
Results
Forty-three dogs were operated. Twenty-four dogswere excluded from analysis, because 12 died beforecompleting the study, nine had incomplete flow or
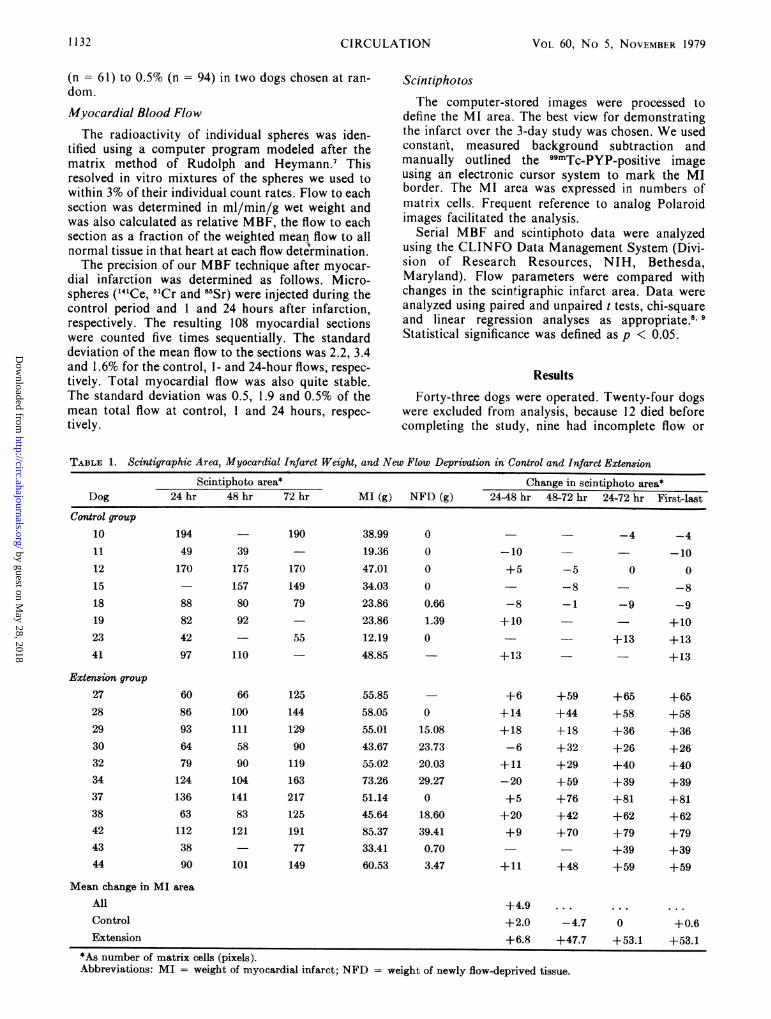
TABLE 1. Scintigraphic Area, Myocardial Infarct Weight, and New Flow Deprivation in Control and Infarct ExtensionScintiphoto area* Change in scintiphoto area*
Dog 24 hr 48 hr 72 hr MI (g) NFD (g) 2448 hr 48-72 hr 24-72 hr First-lastControl group
10 194 190 38.99 0 - -4 -411 49 39 19.36 0 -10 - -1012 170 175 170 47.01 0 +5 -5 0 015 157 149 34.03 0 - -8 -818 88 80 79 23.86 0.66 -8 -1 -9 -919 82 92 23.86 1.39 +10 - +1023 42 55 12.19 0 +13 +1341 97 110 48.85 +13 +13
Extension group27 60 66 125 55.85 +6 +59 +65 +6528 86 100 144 58.05 0 +14 +44 +58 +5829 93 111 129 55.01 15.08 +18 +18 +36 +3630 64 58 90 43.67 23.73 -6 +32 +26 +2632 79 90 119 55.02 20.03 +11 +29 +40 +4034 124 104 163 73.26 29.27 -20 +59 +39 +3937 136 141 217 51.14 0 +5 +76 +81 +8138 63 83 125 45.64 18.60 +20 +42 +62 +6242 112 121 191 85.37 39.41 +9 +70 +79 +7943 38 77 33.41 0.70 - +39 +3944 90 101 149 60.53 3.47 +11 +48 +59 +59
Mean change in MI areaAll +4.9 ... ... ...
Control +2.0 -4.7 0 +0.6Extension +6.8 +47.7 +53.1 +53.1
*As number of matrix cells (pixels).Abbreviations: MI = weight of myocardial infarct; NFD = weight of newly flow-deprived tissue.
1132 CIRCULATION
by guest on May 28, 2018
http://circ.ahajournals.org/D
ownloaded from
SCINTIGRAPHY OF INFARCT EXTENSION/Kronenberg et al.
scintiphoto data, and three had no MI after LAD liga-tion. Nineteen had infarction, survived the studyprotocol and had sufficient paired flow and scintiphotodata for analysis. There were eight control and 11 ex-tension dogs. A mean of 3.2 flows per dog was ob-tained. Three scintiphotos were obtained in all exten-sion dogs and a mean of 2.25 per control dog.
Scintiphotos
The optimum projection was selected and used forserial views in each dog. The 30° or 40° LAO viewswere the most commonly used images (16 of 19 dogs),as they were the most easily followed and had the leastbony interference. The scintiphotos were outlinedafter background erasure, which averaged 30% of in-farct counts. The data reported (table 1) are the resultsobtained by one trained observer who applied thecriteria objectively, but not in a "blinded" fashion.The same serial images of seven randomly selecteddogs (20 scintiphotos) were reanalyzed in a blindedfashion 18 months later by the same observer and by asecond blinded observer. The results were highlyreproducible. For the two trials of observer 1,r = 0.97, and for each trial of observer 1, the results ofobserver 2 were closely related (r = 0.94 and 0.96,respectively; for each, n = 20, p < 0.001). For the firsttrial, the mean difference between the observers was3.0 ± 14.1 pixels (SD), an average difference of 2.6%.The difference was .15 pixels in only three images.There was no consistent difference between theobservers.
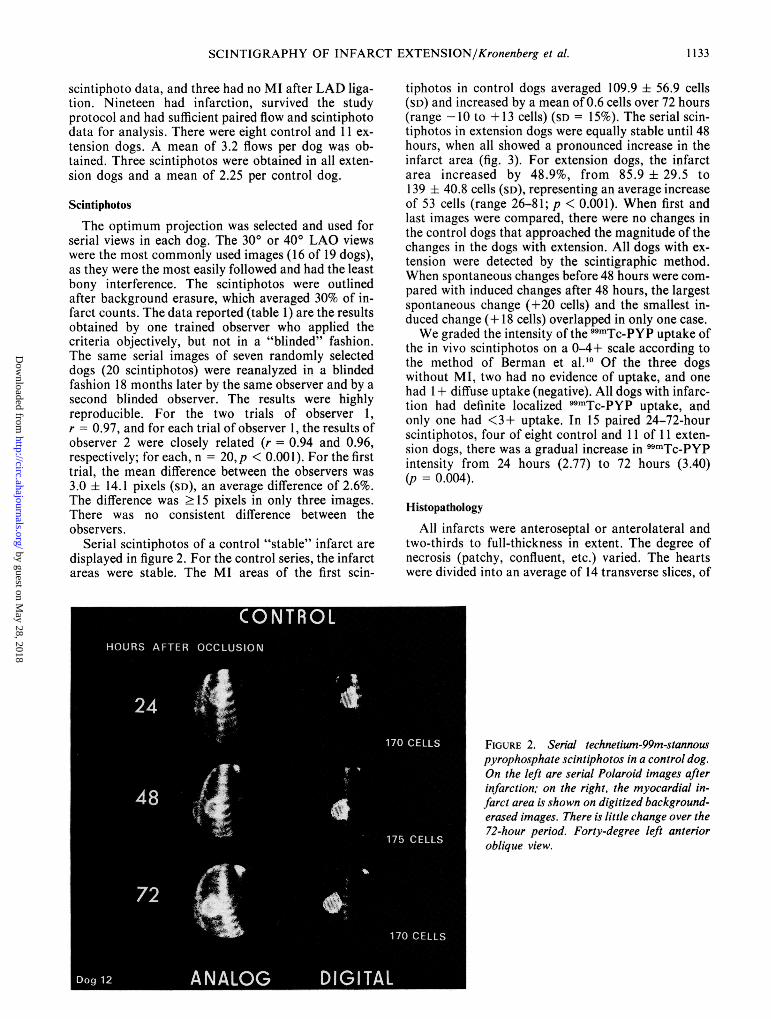
Serial scintiphotos of a control "stable" infarct aredisplayed in figure 2. For the control series, the infarctareas were stable. The MI areas of the first scin-
tiphotos in control dogs averaged 109.9 ± 56.9 cells(SD) and increased by a mean of 0.6 cells over 72 hours(range -10 to + 13 cells) (SD = 15%). The serial scin-tiphotos in extension dogs were equally stable until 48hours, when all showed a pronounced increase in theinfarct area (fig. 3). For extension dogs, the infarctarea increased by 48.9%, from 85.9 + 29.5 to139 ± 40.8 cells (SD), representing an average increaseof 53 cells (range 26-81; p < 0.001). When first andlast images were compared, there were no changes inthe control dogs that approached the magnitude of thechanges in the dogs with extension. All dogs with ex-tension were detected by the scintigraphic method.When spontaneous changes before 48 hours were com-pared with induced changes after 48 hours, the largestspontaneous change (+20 cells) and the smallest in-duced change (+ 18 cells) overlapped in only one case.We graded the intensity of the 99mTc-PYP uptake of
the in vivo scintiphotos on a 0-4+ scale according tothe method of Berman et al.10 Of the three dogswithout MI, two had no evidence of uptake, and onehad 1+ diffuse uptake (negative). All dogs with infarc-tion had definite localized 99mTc-PYP uptake, andonly one had <3+ uptake. In 15 paired 24-72-hourscintiphotos, four of eight control and 11 of 11 exten-sion dogs, there was a gradual increase in 99mTc-PYPintensity from 24 hours (2.77) to 72 hours (3.40)(p = 0.004).
Histopathology
All infarcts were anteroseptal or anterolateral andtwo-thirds to full-thickness in extent. The degree ofnecrosis (patchy, confluent, etc.) varied. The heartswere divided into an average of 14 transverse slices, of
FIGURE 2. Serial technetium-99m-stannouspyrophosphate scintiphotos in a control dog.On the left are serial Polaroid images afterinfarction; on the right, the myocardial in-farct area is shown on digitized background-erased images. There is little change over the72-hour period. Forty-degree left anterioroblique view.
1133
by guest on May 28, 2018
http://circ.ahajournals.org/D
ownloaded from

VOL 60, No 5, NOVEMBER 1979
FIGURE 3. Serial technetium-99m-stannouspyrophosphate scintiphotos in infarct exten-sion. Format as in figure 2. A second, moreproximal left anterior descending arteryocclusion was done after the 48-hour scinti-photo, and the myocardial infarct area in-creased significantly. Forty-degree leftanterior oblique view.
which 12 included infarct tissue. Infarct weight rangedfrom 12.2-85.4 g. The average infarct weight in con-trol hearts was 31.0 ± 12.8 g (SD), which represented30.5% of the weight of the combined left and right ven-tricles. Infarct weight in extension averaged56.1 ± 14. 1 g (SD), 59.5% of the combined ventricularweight. This was significantly greater than the controlinfarcts. (p < 0.001).
Histologic examination consistently confirmed thelocation of infarct borders chosen by gross visualobservation. However, it was not possible to differen-tiate or quantitate extension reliably using conven-tional histopathologic criteria.1' In only two cases ofextension was it possible to define the margin oforiginal ischemic injury. These two dogs had a well-defined line of degenerating polymorphonuclearneutrophils surrounding an area of confluent necrosis.Peripherally, there was additional acute damagewithout cell lysis, chronologically consistent with ex-tension.
Myocardial Blood Flow
We evaluated MBF as a method for quantitatingthe original infarction and extension. There were dis-tinct, contrasting flow patterns in control and exten-
sion hearts. The MBF for a representative slice in atypical "control" heart is shown in figure 4. The MBFto infarcted lateral and anterior subendocardial sec-tions diminished by 1 hour after occlusion and usuallyremained low. Flow to epicardial sections in otherslices dropped but often increased later to nearly nor-mal levels.
Figure 5 shows flow changes in extension dogs.MBF was more complex, because infarct tissue couldbe originally flow deprived or newly flow deprived(NFD) (i.e., after extension). Tissue originally flow-deprived was defined as tissue in which flow decreasedafter the first occlusion, in contrast to NFD tissue,where flow was within normal limits until after the sec-ond occlusion.
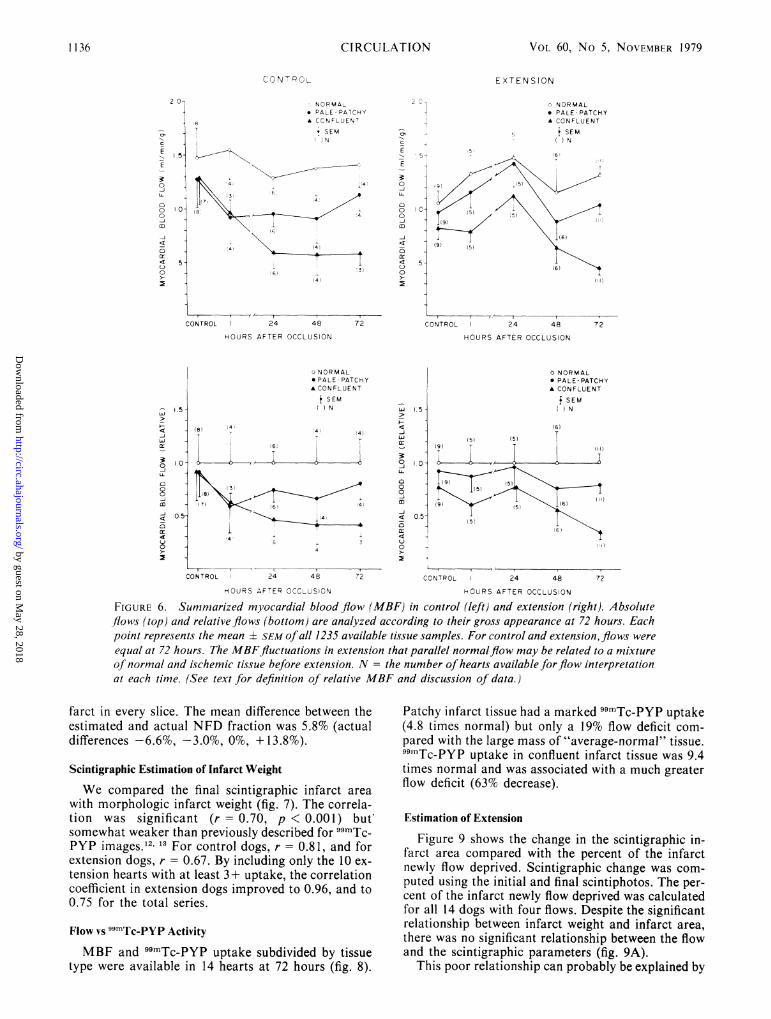
Figure 6 summarizes the flow data. For both con-trol and extension, normal and MI flow varied con-siderably. In the control period, absolute MBFappeared to be greater in control than in extensiondogs, but this trend was not statistically significant.
Infarct MBF in control dogs decreased markedly by1 hour. Flow to confluent infarct tissue decreasedfurther by 24 hours and then remained stable. Flow topale-patchy infarct tissue rose slightly by 72 hours, butnot significantly.
Infarct MBF in extension dogs showed
1134 ClIRCULATION
by guest on May 28, 2018
http://circ.ahajournals.org/D
ownloaded from

SCINTIGRAPHY OF INFARCT EXTENSION/Kronenberg et al.
D 32Slice 4 a
CU
Pale Patchy
Red
Yellow
OCCLUSION
1.51'a.E
o.o0
0
0c)
m-J
< .50tr
0
0
c-c Normal LV (B 3)A---A Normal LV (B9)
_ Lateral Ml (B 8)
-.-a AnteriorMI (B 10)
Control 24 48 72
HOURS AFTER OCCLUSION
FIGURE 4. Serial myocardial blood flow in a represen-
tative slice in a control dog. Typical sections show a reduc-tion inflow to ischemic tissue, maintenance of normal flowin nonischemic tissue, and the variability of normal flow.MI = myocardial infarct; LV = left ventricle.
characteristics that suggested a mixture of normal andinfarct tissue. At 72 hours, infarct flows in extensiondogs were equal to those in the control dogs. However,before then, the higher flow level and mid-course fluc-tuations similar to those in normal tissue are believeddue to a mixture of normal and infarct tissue, all ofwhich became infarcted after the second occlusion.Several variables might affect the mid-course MBF.Mid-course flow would be highest in dogs with smallinitial infarcts and large amounts of extension. Also,the mid-course data could have been altered if dogswith the largest initial infarcts had died after extensionwas induced. However, only one dog died after exten-sion.To define changes due to extension, we examined
MBF in terms of relative MBF, with normal meanflow defined as 1.0 in order to reduce the influence ofserial fluctuations in normal flow (see Data Analysis).The relative flows to infarct and normal tissues were
ranked in ascending order by gross tissue morphologyto define the best flow discriminator among them andto estimate the degree of new flow deprivation (NFD)necessary for patchy and confluent infarction. At 72hours, the relative flow value of 0.66 ± 0.14 (SD) mostaccurately distinguished normal from confluent in-farct tissue, with the fewest misclassified sections(average 2.2/heart). Patchy infarct tissue had higherflow, and it was impossible to accurately separate thistissue type from normal by flow criteria alone.
"I 1.5
-J
0
0
0
0 .0cr
0
0
OCCLUSION EXTENSIONo- o Normal LV (A )
--u Lateral Ml (A7)
-----.. Lateral MI(A8)
Anterior M l(AIO)
Cont ro 24 48 72
HOURS AFTER OCCLUSION
FIGURE 5. Serial myocardial blood flow in a represen-
tative slice in an extension dog. Flow to tissue originallyflowdeprived (A 10) decreased after the first occlusion. Flow tolateral sections (A 7 and A8) remained normal until after thesecond occlusion, then dropped to infarct levels. Flow to a
typical normal section (Al ) remained stable. Flow to tissueoriginally flow deprived decreased again after extension.L V = left ventricle; MI = myocardial infarct.
Based on the above analysis, we designed severalcriteria for defining NFD. The strictest criterion was
maintenance of normal flow (>0.66) until after 48hours, then a decrease of at least 25% in MBF to thattissue section. Tissue originally flow deprived had a
decrease in flow to <0.66 at 1, 24, or 48 hours. Resultsare listed in table 1. For NFD, sensitivity andspecificity are high on a section-by-section basis butare somewhat lower on a dog-by-dog basis. Threedogs in the extension series had little or no NFD tissuedespite large increases in the scintigraphic MI area.Two of seven control dogs had small amounts of NFDtissue (<1.4 g). More lenient flow criteria showedgreater sensitivity but less specificity for extension.The NFD algorithm was also applied to normal
tissue in the extension dogs. Only nine of 303 normaltissue sections met the criteria for NFD. By definition,no normal tissue was included in the NFDcalculations.The accuracy of the representative slice method for
defining the fraction of NFD tissue was evaluated in 4hearts. The NFD fraction was estimated using theflow data from three representative slices in each heartand compared to the actual NFD mass, which was ob-tained by evaluating the flow to all sections of the in-
D 19Slice 4
U Ml
if ),
V1
1135
by guest on May 28, 2018
http://circ.ahajournals.org/D
ownloaded from
CIRCULATION
C o rI
NORMALv PALE- PATCHYA CONFLUENT
# SEM)N
1' '4 548 4
4 4~~~~~~~~~~~~~
16 _ v3,
E
E
301
C')00
az
4
0
CONTROL 24 48 72
HOURS AFTER OCCLUSION
VOL 60, No 5, NOVEMBER 1979
E X TENSION
o NORMAL* PALE -PATCHYA CONFLUENT
i SEM()N
.5~~~~~~~~~~~5) (51
5- <1) \
CONTROL 24 48 72
HOURS AFTER OCCLUSION
o NORMAL* PALE- PATCHYA CONFLUENT
f SEMhi
(8)
_ I
1 1(71 ~ 6i6
LL 1.5 -
0
0 -U-
4 0.5
0
0Iii
.5
CONTROL 24 48 72
HOURS AFTER OCCLUSICN
(91(5) (5)
i I
o NORMAL* PALE-PATCHYA CONFLUENT
f SEM() N
(61IT
I1)I I
(51
(6!
l5
CONTROL 24 48
HOURS AFTER OCCLUSION
FIGURE 6. Summarized myocardial blood flow (MBF) in control (left) and extension (right). Absoluteflows (top) and relative flows (bottom) are analyzed according to their gross appearance at 72 hours. Eachpoint represents the mean ± SEM of all 1235 available tissue samples. For control and extension,flows were
equal at 72 hours. The MBFfluctuations in extension that parallel normalflow may be related to a mixtureof normal and ischemic tissue before extension. N = the number of hearts available forflow interpretationat each time. (See text for definition of relative MBF and discussion of data.)
farct in every slice. The mean difference between theestimated and actual NFD fraction was 5.8% (actualdifferences -6.6%, -3.0%, 0%, + 13.8%).
Scintigraphic Estimation of Infarct Weight
We compared the final scintigraphic infarct areawith morphologic infarct weight (fig. 7). The correla-tion was significant (r = 0.70, p < 0.001) butsomewhat weaker than previously described for 99mTc-PYP images.12' 13 For control dogs, r = 0.81, and forextension dogs, r = 0.67. By including only the 10 ex-tension hearts with at least 3 + uptake, the correlationcoefficient in extension dogs improved to 0.96, and to0.75 for the total series.
Flow vs 99mTc-PYP Activity
MBF and 99mTc-PYP uptake subdivided by tissuetype were available in 14 hearts at 72 hours (fig. 8).
Patchy infarct tissue had a marked 99mTc-PYP uptake(4.8 times normal) but only a 19% flow deficit com-pared with the large mass of "average-normal" tissue.99mTc-PYP uptake in confluent infarct tissue was 9.4times normal and was associated with a much greaterflow deficit (63% decrease).
Estimation of Extension
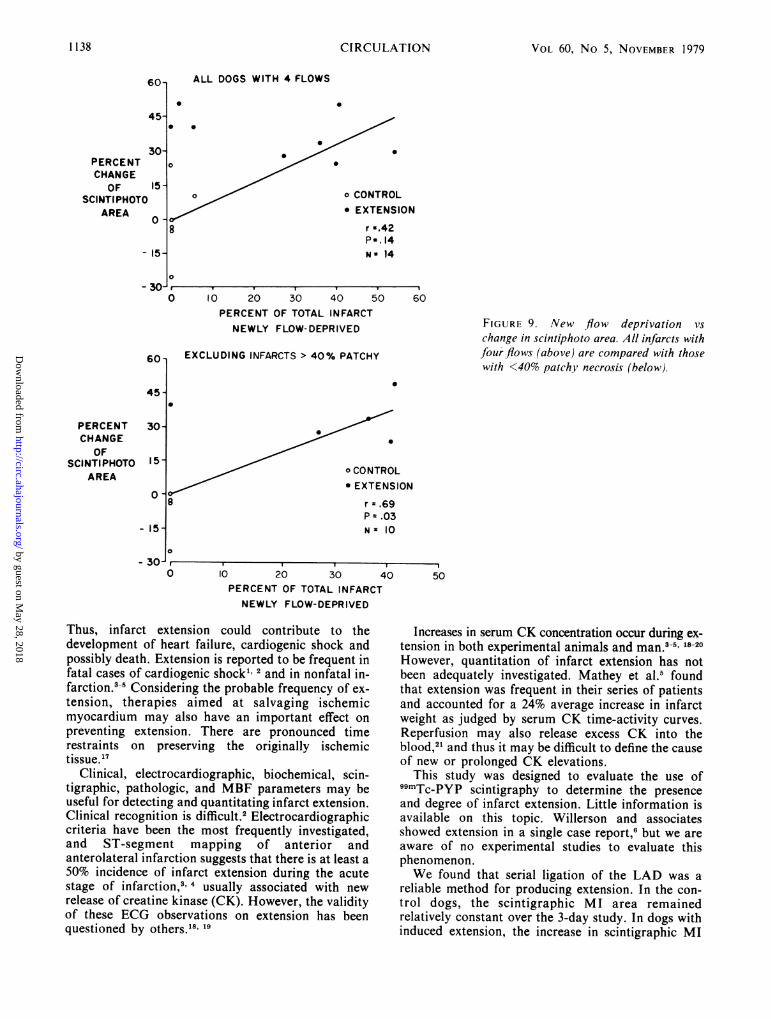
Figure 9 shows the change in the scintigraphic in-farct area compared with the percent of the infarctnewly flow deprived. Scintigraphic change was com-puted using the initial and final scintiphotos. The per-cent of the infarct newly flow deprived was calculatedfor all 14 dogs with four flows. Despite the significantrelationship between infarct weight and infarct area,there was no significant relationship between the flowand the scintigraphic parameters (fig. 9A).
This poor relationship can probably be explained by
1136
2 0-
T
.5-
c
E
E
03
0
4
LL-
0
4
0co
a:
Er
1.0
5i
.-
(.0
0.5-
J
y4
3
4
0
8i
JM
-i
72
Nx
'4)
.L
13
.'4
~4
by guest on May 28, 2018
http://circ.ahajournals.org/D
ownloaded from

SCINTIGRAPHY OF INFARCT EXTENSION/Kronenberg et al.
0
0
o CONTROL
* EXTENSION
r =, 70P <,001 N=19
1 1 . 450 15 30 45
6 7 960 75 90
INFARCT WEIGHT (g)FIGURE 7. Relationship ofscintigraphic myocardial infarct area and infarct weight. The relationships aresignificant for the entire series and the subsets of control and extension dogs. TcPYP = technetium-99m-stannous pyrophosphate.
the presence of patchy infarct tissue. All infarcts wereeasily visible in scintiphotos, including predominantlypatchy infarcts. This patchy tissue was ischemic, butits flow was relatively high due to a mixture of normaland infarct tissue. Thus, little patchy tissue met thedefinition for NFD, although scintigraphy showed ex-tension. When all dogs that had infarcts with > 40%patchy necrosis were excluded from analysis (fig. 9B),there was a significant relationship between the changein the scintiphotos and the percentage of the heart
15,
newly flow deprived (r = 0.69). The percent patchy in-farct weight in control dogs was 23% (range 0-90%),and only two dogs had >20% patchy infarction (46%and 90%). Extension dogs had an average of 39%patchy necrosis (range 10-88%), but only two had<25% patchy tissue (10% and 14%).
DiscussionMI size is a powerful determinant of prognosis and
complications in acute myocardial infarction.14-16
RED-YELLOW
RED
r PALE
YELLOW r r
0.2 0.4 0.6
FIGURE 8. Myocardial blood flow (MBF)compared with tissue technetium-99m-stannous pyrophosphate (TcPYP) content.Each point represents the mean ± SEM ofallavailable samples. Infarcted tissue had highTcPYP uptake. Tissue with confluentnecrosis had much lower MBF than pale orpatchy infarct tissue. A VG = average; NL= normal; POST = posterior; cpm =counts per minute.
0.8 1.0. 1.2 1.4 1.6 1.8
MYOCARDIAL BLOOD FLOW (ml/min/g)
240-
200-
Tc PYP-POSITIVECELLS
0
160 -
120-
0
0
0
0
0 *80 -
40-
0-
0
0
10-
TCPYP(Cpm/g) I
0
-4 PATCHY
PERI-INFARCT
VN- t-WAVG. ML. ML. POS'C WALL
vF v II I I9 II I Iv 9I v 5
1137
by guest on May 28, 2018
http://circ.ahajournals.org/D
ownloaded from
VOL 60, No 5, NOVEMBER 1979
PERCENTCHANGE
OFSCINTI PHOTO
AREA0
ALL DOGS WITH 4 FLOWS
0
0
0
. .
o CONTROL* EXTENSION
r -.42P-. 14N - 14
20 30 40 50PERCENT OF TOTAL INFARCTNEWLY FLOW-DEPRIVED
EXCLUDING INFARCTS > 40% PATCHY
FIGURE 9. New flow deprivation vschange in scintiphoto area. All infarcts withfour flows (above) are compared with thosewith <40% patchy necrosis (below).
o CONTROL* EXTENSION
r - .69P = .03Ns 10
10 20 30 iPERCENT OF TOTAL INFARCTNEWLY FLOW-DEPRIVED
Thus, infarct extension could contribute to thedevelopment of heart failure, cardiogenic shock andpossibly death. Extension is reported to be frequent infatal cases of cardiogenic shock1 2 and in nonfatal in-farction.3-5 Considering the probable frequency of ex-tension, therapies aimed at salvaging ischemicmyocardium may also have an important effect onpreventing extension. There are pronounced timerestraints on preserving the originally ischemictissue. '7
Clinical, electrocardiographic, biochemical, scin-tigraphic, pathologic, and MBF parameters may beuseful for detecting and quantitating infarct extension.Clinical recognition is difficult.2 Electrocardiographiccriteria have been the most frequently investigated,and ST-segment mapping of anterior andanterolateral infarction suggests that there is at least a50% incidence of infarct extension during the acutestage of infarction,3' usually associated with newrelease of creatine kinase (CK). However, the validityof these ECG observations on extension has beenquestioned by others.'8, 19
Increases in serum CK concentration occur during ex-3-5, 18 20tension in both experimental animals and man.
However, quantitation of infarct extension has notbeen adequately investigated. Mathey et al.5 foundthat extension was frequent in their series of patientsand accounted for a 24% average increase in infarctweight as judged by serum CK time-activity curves.Reperfusion may also release excess CK into theblood,21 and thus it may be difficult to define the causeof new or prolonged CK elevations.
This study was designed to evaluate the use of`SmTc-PYP scintigraphy to determine the presenceand degree of infarct extension. Little information isavailable on this topic. Willerson and associatesshowed extension in a single case report,6 but we areaware of no experimental studies to evaluate thisphenomenon.We found that serial ligation of the LAD was a
reliable method for producing extension. In the con-trol dogs, the scintigraphic MI area remainedrelatively constant over the 3-day study. In dogs withinduced extension, the increase in scintigraphic MI
PERCENTCHANGE
OFSCINTI PHOTO
AREA
0
- 3U-40 50
I I I - - -I
1138 CIRCULATION
by guest on May 28, 2018
http://circ.ahajournals.org/D
ownloaded from
SCINTIGRAPHY OF INFARCT EXTENSION/Kronenberg et al.
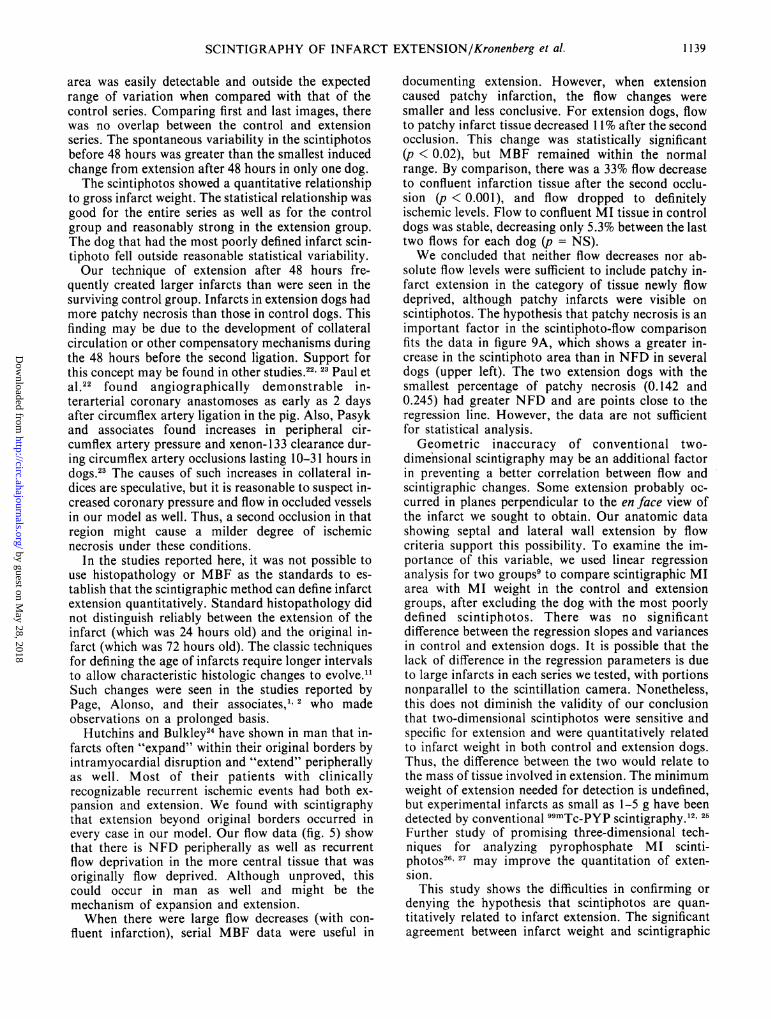
area was easily detectable and outside the expectedrange of variation when compared with that of thecontrol series. Comparing first and last images, therewas no overlap between the control and extensionseries. The spontaneous variability in the scintiphotosbefore 48 hours was greater than the smallest inducedchange from extension after 48 hours in only one dog.The scintiphotos showed a quantitative relationship
to gross infarct weight. The statistical relationship wasgood for the entire series as well as for the controlgroup and reasonably strong in the extension group.The dog that had the most poorly defined infarct scin-tiphoto fell outside reasonable statistical variability.Our technique of extension after 48 hours fre-
quently created larger infarcts than were seen in thesurviving control group. Infarcts in extension dogs hadmore patchy necrosis than those in control dogs. Thisfinding may be due to the development of collateralcirculation or other compensatory mechanisms duringthe 48 hours before the second ligation. Support forthis concept may be found in other studies.22 23 Paul etal.22 found angiographically demonstrable in-terarterial coronary anastomoses as early as 2 daysafter circumflex artery ligation in the pig. Also, Pasykand associates found increases in peripheral cir-cumflex artery pressure and xenon-133 clearance dur-ing circumflex artery occlusions lasting 10-31 hours indogs.23 The causes of such increases in collateral in-dices are speculative, but it is reasonable to suspect in-creased coronary pressure and flow in occluded vesselsin our model as well. Thus, a second occlusion in thatregion might cause a milder degree of ischemicnecrosis under these conditions.
In the studies reported here, it was not possible touse histopathology or MBF as the standards to es-tablish that the scintigraphic method can define infarctextension quantitatively. Standard histopathology didnot distinguish reliably between the extension of theinfarct (which was 24 hours old) and the original in-farct (which was 72 hours old). The classic techniquesfor defining the age of infarcts require longer intervalsto allow characteristic histologic changes to evolve.1'Such changes were seen in the studies reported byPage, Alonso, and their associates," 2 who madeobservations on a prolonged basis.
Hutchins and Bulkley24 have shown in man that in-farcts often "expand" within their original borders byintramyocardial disruption and "extend" peripherallyas well. Most of their patients with clinicallyrecognizable recurrent ischemic events had both ex-pansion and extension. We found with scintigraphythat extension beyond original borders occurred inevery case in our model. Our flow data (fig. 5) showthat there is NFD peripherally as well as recurrentflow deprivation in the more central tissue that wasoriginally flow deprived. Although unproved, thiscould occur in man as well and might be themechanism of expansion and extension.When there were large flow decreases (with con-
fluent infarction), serial MBF data were useful in
documenting extension. However, when extensioncaused patchy infarction, the flow changes weresmaller and less conclusive. For extension dogs, flowto patchy infarct tissue decreased 11% after the secondocclusion. This change was statistically significant(p < 0.02), but MBF remained within the normalrange. By comparison, there was a 33% flow decreaseto confluent infarction tissue after the second occlu-sion (p < 0.001), and flow dropped to definitelyischemic levels. Flow to confluent MI tissue in controldogs was stable, decreasing only 5.3% between the lasttwo flows for each dog (p = NS).We concluded that neither flow decreases nor ab-
solute flow levels were sufficient to include patchy in-farct extension in the category of tissue newly flowdeprived, although patchy infarcts were visible onscintiphotos. The hypothesis that patchy necrosis is animportant factor in the scintiphoto-flow comparisonfits the data in figure 9A, which shows a greater in-crease in the scintiphoto area than in NFD in severaldogs (upper left). The two extension dogs with thesmallest percentage of patchy necrosis (0.142 and0.245) had greater NFD and are points close to theregression line. However, the data are not sufficientfor statistical analysis.Geometric inaccuracy of conventional two-
dimensional scintigraphy may be an additional factorin preventing a better correlation between flow andscintigraphic changes. Some extension probably oc-curred in planes perpendicular to the en face view ofthe infarct we sought to obtain. Our anatomic datashowing septal and lateral wall extension by flowcriteria support this possibility. To examine the im-portance of this variable, we used linear regressionanalysis for two groups9 to compare scintigraphic MIarea with MI weight in the control and extensiongroups, after excluding the dog with the most poorlydefined scintiphotos. There was no significantdifference between the regression slopes and variancesin control and extension dogs. It is possible that thelack of difference in the regression parameters is dueto large infarcts in each series we tested, with portionsnonparallel to the scintillation camera. Nonetheless,this does not diminish the validity of our conclusionthat two-dimensional scintiphotos were sensitive andspecific for extension and were quantitatively relatedto infarct weight in both control and extension dogs.Thus, the difference between the two would relate tothe mass of tissue involved in extension. The minimumweight of extension needed for detection is undefined,but experimental infarcts as small as 1-5 g have beendetected by conventional 99mTc-PYP scintigraphy.'2 25Further study of promising three-dimensional tech-niques for analyzing pyrophosphate MI scinti-photos26' 27 may improve the quantitation of exten-sion.
This study shows the difficulties in confirming ordenying the hypothesis that scintiphotos are quan-titatively related to infarct extension. The significantagreement between infarct weight and scintigraphic
1139
by guest on May 28, 2018
http://circ.ahajournals.org/D
ownloaded from

VOL 60, No 5, NOVEMBER 1979
infarct area makes it reasonable to believe that semi-quantitative scintigraphic estimation of extensionshould be possible, although the accuracy with whichthe quantity of extension can be judged remains uncer-tain.
Acknowledgments
The authors thank Andrew Manlove, James Phillips and HaroldHoward for surgical preparation and assistance, Mary CooleyWalker and Richard Vantrease for illustrations, Jonathan Bermanand John L. Wolford, Jr. for technical assistance, Richard A.Steckley, M.D. for his analysis of scintiphotos, and Donna Glennfor her aid in preparing the manuscript.
ReferencesI. Page DL, Caulfield JB, Kastor JA, DeSanctis RW, Sanders
CA: Myocardial changes associated with cardiogenic shock. NEngl J Med 285: 133, 1971
2. Alonso DR, Scheidt S, Post M, Killip T: Pathophysiology ofcardiogenic shock. Quantification of myocardial necrosis,clinical, pathologic, and electrocardiographic correlations. Cir-culation 48: 588, 1973
3. Reid PR, Taylor DR, Kelly DT, Weisfeldt ML, Humphries JO,Ross RS, Pitt B: Myocardial infarct extension detected byprecordial ST-segment mapping. N Engl J Med 290: 123, 1974
4. Madias JE, Venkataraman K, Hood WB Jr: Precordial ST-segment mapping. 1. Clinical studies in the coronary care unit.Circulation 52: 799, 1975
5. Mathey D, Bleifeld W, Buss H, Hanrath P: Creatine kinaserelease in acute myocardial infarction: correlation with clinical,electrocardiographic, and pathological findings. Br Heart J 37:1161, 1975
6. Willerson JT, Parkey RW, Bonte FJ, Meyer SL, Atkins JM,Stokely EM: Technetium stannous pyrophosphate myocardialscintigrams in patients with chest pain of varying etiology. Cir-culation 51: 1046, 1975
7. Rudolph AM, Heymann MA: The circulation of the fetus inutero. Methods for studying distribution of blood flow, cardiacoutput and organ blood flow. Circ Res 21: 163, 1967
8. Snedecor GW, Cochran WC: Statistical Methods, 6th ed.Ames, Iowa, Iowa State University Press, 1967
9. Armitage P: Statistical Methods in Medical Research. NewYork, John Wiley and Sons, 1977, pp 281-284
10. Berman DS, Amsterdam EA, Hines HH, Salel AF, Bailey GJ,DeNardo GL, Mason DT: New approach to interpretation oftechnetium-99m pyrophosphate scintigraphy in detection ofacute myocardial infarction. Clinical assessment of diagnosticaccuracy. Am J Cardiol 39: 341, 1977
11. Mallory GK, White PD, Salcedo-Salgar J: The speed of healingof myocardial infarction: a study of the pathologic anatomy inseventy-two cases. Am Heart J 18: 647, 1939
12. Botvinick EH, Shames D, Lappin H, Tyberg JV, Townsend R,Parmley WW: Noninvasive quantitation of myocardial infarc-tion with technetium-99m pyrophosphate. Circulation 52: 909,1975
13. Stokely EM, Buja LM, Lewis SE, Parkey RW, Bonte FJ,Harris RA Jr, Willerson JT: Measurement of acute myocardialinfarcts in dogs with 99mTc-stannous pyrophosphate scin-tigrams. J Nucl Med 17: 1, 1976
14. Norris RM, Brandt PWT, Caughey DE, Lee AJ, Scott PJ: Anew coronary prognostic index. Lancet 1: 274, 1969
15. Sobel BE, Bresnahan GF, Shell WE, Yoder RD: Estimation ofinfarct size in man and its relation to prognosis. Circulation 46:640, 1972
16. Bleifeld W, Mathey D, Hanrath P, Buss H, Effert S: Infarctsize estimated from serial serum creatine phosphokinase in rela-tion to left ventricular hemodynamics. Circulation 55: 303,1977
17. Hillis LD, Braunwald EB: Myocardial ischemia. N Engl J Med296: 1034, 1093, 1977
18. Reese L, Scheidt S, Killip T: Variability of precordial ST-segment maps after acute myocardial infarction in man. Cir-culation 48 (suppl IV): IV-38, 1973
19. Thompson PL, Katavatis V: Acute myocardial infarction.Evaluation of praecordial ST segment mapping. Br Heart J 38:1020, 1976
20. Shell WE, Kjekshus JK, Sobel BE: Quantitative assessment ofthe extent of myocardial infarction in the conscious dog bymeans of analysis of serial changes in serum creatinephosphokinase activity. J Clin Invest 50: 2614, 1971
21. Jarmakani JM, Limbird L, Graham TC, Marks RA: Effect ofreperfusion on myocardial infarct, and the accuracy of es-timating infarct size from serum creatine phosphokinase in thedog. Cardiovasc Res 10: 245, 1976
22. Paul MH, Norman LR, Zoll PM, Blumgart HL: Stimulationof interarterial coronary anastomoses by experimental acutecoronary occlusion. Circulation 16: 608, 1957
23. Pasyk S, Bloor CM, Khouri EM, Gregg DE: Systemic and cor-onary effects of coronary artery occlusion in the unanesthetizeddog. Am J Physiol 220: 646, 1971
24. Hutchins GM, Bulkley BH: Infarct expansion versus extension:two different complications of acute myocardial infarction. AmJ Cardiol 41: 1127, 1978
25. Bruno FP, Cobb FR, Rivas F, Goodrich JK: Evaluation of99mtechnetium stannous pyrophosphate as an imaging agent inacute myocardial infarction. Circulation 54: 71, 1976
26. Keyes JW Jr, Leonard PF, Brody SL, Svetkoff DJ, RogersWL, Lucchesi BR: Myocardial infarct quantification in the dogby single photon emission computed tomography. Circulation58: 227, 1978
27. Lewis M, Buja LM, Safer S, Mishelevich D, Stokely E, LewisS, Parkey R, Bonte F, Willerson J: Experimental infarct sizingusing computer processing and a three-dimensional model.Science 197: 167, 1977
CIRCULATION1140
by guest on May 28, 2018
http://circ.ahajournals.org/D
ownloaded from

O'Connor, R R Price and A B BrillM W Kronenberg, N E Wooten, G C Friesinger, D L Page, S B Higgins, J C Collins, J L
Scintigraphic characteristics of experimental myocardial infarct extension.
Print ISSN: 0009-7322. Online ISSN: 1524-4539 Copyright © 1979 American Heart Association, Inc. All rights reserved.
is published by the American Heart Association, 7272 Greenville Avenue, Dallas, TX 75231Circulation doi: 10.1161/01.CIR.60.5.1130
1979;60:1130-1140Circulation.
http://circ.ahajournals.org/content/60/5/1130the World Wide Web at:
The online version of this article, along with updated information and services, is located on
http://circ.ahajournals.org//subscriptions/
is online at: Circulation Information about subscribing to Subscriptions:
http://www.lww.com/reprints Information about reprints can be found online at: Reprints:
document. Permissions and Rights Question and Answer information about this process is available in the
located, click Request Permissions in the middle column of the Web page under Services. FurtherEditorial Office. Once the online version of the published article for which permission is being requested is
can be obtained via RightsLink, a service of the Copyright Clearance Center, not theCirculationpublished in Requests for permissions to reproduce figures, tables, or portions of articles originallyPermissions:
by guest on May 28, 2018
http://circ.ahajournals.org/D
ownloaded from