Embed Size (px)
Citation preview

AAllmmaa MMaatteerr SSttuuddiioorruumm –– UUnniivveerrssiittàà ddii BBoollooggnnaa
DOTTORATO DI RICERCA IN
Scienze e Tecnologie Agrarie, Ambientali e Alimentari
Ciclo XXVII
Settore Concorsuale di afferenza: 07/E1
Settore Scientifico disciplinare: AGR/07
Genetic basis of variation for root traits and response to heat stress in
durum wheat
Presentata da: Dr. Ghasemali Nazemi
Coordinatore Dottorato Relatore Chiar.mo Prof. Giovanni Dinelli Prof. Silvio Salvi
Correlatore
Chiar.mo Prof. Roberto Tuberosa
Esame finale anno 2015

2
AAllmmaa MMaatteerr SSttuuddiioorruumm –– UUnniivveerrssiittàà ddii BBoollooggnnaa
Genetic basis of variation for root traits and response to heat stress in
durum wheat
A dissertation
Presented to the Department of Agricultural Sciences
University of Bologna
In fulfillment of the requirements for the degree of doctor of philosophy
By
Ghasemali Nazemi
March, 2015

i
Table of Contents
ACKNOWLEDGMENTS ................................................................................................................. 1
SUMMARY ........................................................................................................................................ 2
CHAPTER 1. INTRODUCTION ..................................................................................................... 4
1.1 THE IMPORTANCE OF DURUM WHEAT ............................................................................... 4
1.2 THE DURUM WHEAT GENOME .............................................................................................. 5
1.3 THE PROGRESSES IN DURUM WHEAT BREEDING ............................................................ 5
1.4 BREEDING FOR ABIOTIC STRESS TOLERANCE ................................................................. 6
1.4.1 Drought stress ............................................................................................................................. 7
1.4.2 Heat stress ................................................................................................................................... 8
1.4.3 Salt stress .................................................................................................................................... 8
1.5 THE STUDY OF ROOT SYSTEM ARCHITECTURE ............................................................... 9
1.6 MOLECULAR MARKERS AND THEIR APPLICATIONS IN BREEDING .......................... 10
1.7 IDENTIFICATION OF QUANTITATIVE TRAIT LOCI (QTL) .............................................. 11
1.7.1 Use of Segregating Populations ................................................................................................ 12
1.7.2 Germplasm collection and association mapping approaches .................................................. 12
1.7.3 Marker assisted selection .......................................................................................................... 14
1.8 REFERENCES............................................................................................................................. 15
FIGURES .......................................................................................................................................... 27
CHAPTER 2. RESEARCH AIMS ................................................................................................. 31
CHAPTER 3. ASSOCIATION MAPPING FOR ROOT ARCHITECTURAL TRAITS IN
DURUM WHEAT SEEDLINGS AS RELATED TO AGRONOMIC PERFORMANCE ....... 32
3.1 ABSTRACT ................................................................................................................................. 32
3.2 ABBREVIATIONS ................................................................................................................... 33
3.3 INTRODUCTION ....................................................................................................................... 34
3.4 MATERIALS AND METHODS ................................................................................................. 35
3.4.1 Plant material ........................................................................................................................... 35
3.4.2 Root morphology evaluation ..................................................................................................... 35
3.4.3 Field data .................................................................................................................................. 36
3.4.4 Molecular profiling ................................................................................................................... 37
3.4.5 Statistical analysis and association mapping analysis ............................................................. 38
3.5 RESULTS .................................................................................................................................... 39

ii
3.5.1 Phenotypic variation of the accessions’ panel for RSA traits ................................................... 39
3.5.2 Correlation among RSA features and agronomic traits ........................................................... 40
3.5.3 QTL analysis for RSA features and agronomic traits ............................................................... 41
3.5.4 QTLs for seminal root angle ..................................................................................................... 41
3.5.5 QTLs for total root number ....................................................................................................... 42
3.5.6 QTLs for primary, total and average root length ..................................................................... 43
3.5.7 QTLs for shoot length ............................................................................................................... 44
3.6 DISCUSSION .............................................................................................................................. 44
3.6.1 Phenotypic variation for RSA traits .......................................................................................... 44
3.6.2 Correlation among RSA features and agronomic traits ........................................................... 45
3.6.3 QTL analysis for RSA features and agronomic traits ............................................................... 46
3.7 CONCLUSIONS .......................................................................................................................... 48
3.8 REFERENCES............................................................................................................................. 49
FIGURE ............................................................................................................................................ 57
TABLES ............................................................................................................................................ 59
CHAPTER 4. LINKAGE MAPPING FOR ROOT SYSTEM ARCHITECTURE IN DURUM
WHEAT MERIDIANO × CLAUDIO MAPPING POPULATION ............................................ 64
4.1 ABSTRACT ................................................................................................................................. 64
4.2 INTRODUCTION ....................................................................................................................... 65
4.3 MATERIALS AND METHODS ................................................................................................. 67
4.3.1 Plant material ........................................................................................................................... 67
4.3.2 Root system architecture evaluation ......................................................................................... 68
4.3.3 Molecular profiling ................................................................................................................... 68
4.3.4 Statistical analysis and QTL analysis ....................................................................................... 69
4.4 RESULTS .................................................................................................................................... 70
4.4.1 Phenotypic analysis of root system architecture ....................................................................... 70
4.4.2 Correlations and distributions of the root system architecture traits ....................................... 71
4.4.3 Identification of QTL for root system architecture traits .......................................................... 71
4.4.3.1 Identification of QTLs for thousand kernel weight ................................................................ 72
4.4.3.2 Identification of QTLs for seminal root angle ....................................................................... 72
4.4.3.3 Identification of QTLs for total number root and percent of 6th root ................................... 72
4.4.3.4 Identification of QTLs for primary, seminal and total root length ........................................ 73
4.4.3.5 QTLs for diameter, surface and volume of primary and seminal roots ................................. 73

iii
4.4.3.6 QTLs for shoot length ............................................................................................................ 74
4.4.3.7 QTLs for root and shoot dry weight and root shoot ratio ...................................................... 74
4.4.3.8 RSA Features of QTL clusters ................................................................................................ 75
4.5 DISCUSSION .............................................................................................................................. 76
4.6 CONCLUSIONS ........................................................................................................................... 78
4.7 REFERENCES ............................................................................................................................. 80
FIGURES .......................................................................................................................................... 85
TABLES ............................................................................................................................................ 92
CHAPTER 5. GENETIC VARIATION FOR AERENCHYMA AND OTHER ROOT
ANATOMICAL TRAITS IN DURUM WHEAT ......................................................................... 98
5.1 ABSTRACT ................................................................................................................................. 98
5.2 INTRODUCTION ....................................................................................................................... 99
5.3 MATERIALS AND METHODS ............................................................................................... 100
5.4 RESULTS AND DISCUSSION ................................................................................................ 101
5.5 CONCLUSIONS ........................................................................................................................ 103
5.6 REFERENCES........................................................................................................................... 104
FIGURES ........................................................................................................................................ 108
TABLES .......................................................................................................................................... 112
CHAPTER 6. MAPPING QUANTITATIVE TRAIT LOCI FOR RESPONSE TO HEAT
STRESS USING CELL MEMBRANE STABILITY (CMS) IN A COLLECTION OF
DURUM WHEAT .......................................................................................................................... 117
6.1 ABSTRACT ............................................................................................................................... 117
6.2 INTRODUCTION ..................................................................................................................... 118
6.3 MATERIALS AND METHODS ............................................................................................... 120
6.3.1 Plant material ......................................................................................................................... 120
6.3.2 Heat stress response evaluation using cell membrane stability (CMS) .................................. 120
6.3.3 Molecular profiling ................................................................................................................. 121
6.3.4 Statistical analysis and association mapping analysis ........................................................... 122
6.4 RESULTS AND DISCUSSION ................................................................................................ 123
6.4.1 Phenotypic variation of the accessions’ panel for heat stress response ................................. 123
6.4.2 Relationship between population structure and heat stress response .................................... 124
6.4.3 QTL analysis for heat stress response .................................................................................... 125
6.5 CONCLUSIONS ........................................................................................................................ 126

iv
6.6 REFERENCES........................................................................................................................... 127
FIGURES ........................................................................................................................................ 133
TABLES .......................................................................................................................................... 138
Appendix ......................................................................................................................................... 142

1
ACKNOWLEDGMENTS
At first, I would like to thank my God that was always right at my side for help, comfort and
guidance.
I would like to appreciate, Professor Roberto Tuberosa, who gave me the opportunity to start my
graduate program and supported the entire program with his relaxed, open-minded, and enthusiastic
mentorship.
I would like to sincerely thank my supervisor, Professor Silvio Salvi, for his support, kindness,
encouragement, help and friendship. I have learned many things (both scientific and life) from him
throughout my PhD studies.
I would like to acknowledge Professor Maria Corinna Sanguineti, Dr. Marco Maccaferri and Dr.
Riccardo Bovina for their helps, comments and suggestions with the statistical and analytical
aspects of my work.
I wish to extend my thank to all my colleagues in the laboratory of the Department of Agricultural
Sciences (DipSA), University of Bologna for helping me in many ways during my studies. It is my
pleasure also to convey my appreciation to the Department of Agriculure, I.A.U. Haji abad Branch,
Iran for supporting me throughout my studies.
Finally but most importantly, I would like to thank my family, specially my beautiful and loving
wife, Gita Dehghani, for without her support and patience, I would never have seen this through. I
also thank my daughter, Sahba, who constantly give me inspiration and strength.

2
SUMMARY
Durum wheat is the second most important wheat species worldwide and the most important crop in
several Mediterranean countries including Italy. Durum wheat is primarily grown under rainfed
conditions where episodes of drought and heat stress are major factors limiting grain yield. The
research presented in this thesis aimed at the identification of traits and genes that underlie root
system architecture (RSA) and tolerance to heat stress in durum wheat, in order to eventually
contribute to the genetic improvement of this species. The thesis describes and reports the results of
four experiments.
In the first experiment, seedlings of 183 durum wheat elite accessions were evaluated in order to
identify Quantitative Trait Loci (QTLs) using genome-wide association mapping for several RSA-
related traits including root number, seminal root angle, primary root length, and others. Highly
significant differences among accessions were detected for all traits. Out of the 48 QTLs detected,
15 overlapped with QTLs for agronomic traits and/or grain yield in two or more environments as
detected in previous studies. Root number and seminal root angle appeared the most promising
traits for further studies on the adaptive role of RSA plasticity on field performance in environments
differing for water availability. Our results provide novel insights on the genetic control of RSA and
its implications on field performance of durum wheat.
In the second experiment, the genetic basis of variation for RSA traits were investigated using a
population of 176 recombinant inbred lines (RILs) derived from the cross between two Italian elite
durum wheat (Meridiano and Claudio), in order to identify QTLs for RSA and compare their
overlaps with other QTLs identified in other experiments and environments. The following
seedling-stage RSA and seed traits were: root number, seminal root angle, primary root length, total
root length, thousand kernel weight, shoot length, root and shoot dry weight. The results indicated a
wide range of phenotypic variation for RSA traits. The largest heritability was observed for
thousand kernel weight (78.6%) and seminal root angle (65.4%). In total, 48 novel QTLs for RSA
traits were identified on all chromosomes, with the exception of chromosome 4A. Both parents
contributed favorable alleles at QTLs. Among the considered RSA traits, seminal root angle
appeared the most promising for undertaking further studies on the role of RSA traits. The most
important QTLs for seminal root angle identified in this study mapped on chromosomes 4B and 6B.
Variation in root anatomical traits influences whole plant physiology and crop adaptation to adverse
soil conditions and thus impacts yield and its stability. Typical components of anatomical root traits
are the arrangement of cells and tissues as observed by microscopy sections. In the third
experiment, we investigated the phenotypic variation of eleven root anatomical traits including

3
aerenchyma features in ten elite durum wheat cultivars. Significant differences among cultivars
were identified for several traits. Trait heritability ranged from 0.12 (number of xylem vessels) to
0.72 (number of aerenchyma lacunae). While area and number of aerenchyma lacunae were highly
correlated, neither trait correlated with other root features, suggesting an independent physiological
and/or genetic control in respect to the other root anatomical traits. The old Italian founder cultivar
Cappelli was shown to have a significantly higher portion of root aerenchyma of all the modern
cultivars. These results show for the first time the presence of sizeable genetic variation in
aerenchyma-related root anatomical traits in cultivated tetraploid wheats, prompting for additional
studies aimed at mapping the quantitative trait loci governing such variation and to test their role in
the adaptive response of durum wheat to abiotic stresses as related to soil conditions.
Heat stress is an agricultural problem in many areas of the world. In the fourth experiment, genome
wide association mapping based on the panel of 183 elite of durum wheat accessions was deployed
in order to dissect the genetic control and identify QTLs for response to heat stress. The experiment
was conducted using a randomized complete block design with two replications in greenhouse
environmental conditions. Cell membrane stability (CMS) was recorded as a proxy index to
evaluate the response to heat stress in a three-step experiment: constitutive heat stress response,
acquired heat stress response and constitutive-acquired heat stress response. Significant differences
among genotypes were observed for all measured CMS traits. The highest heritability (h2 = 0.86)
was recorded for constitutive-acquired heat stress response. The panel was profiled with simple
sequence repeat, Diversity Arrays Technology and sequence-tagged site markers (957 markers in
total). Thirty four single marker/QTL regions were located in all chromosomes; four major QTLs
(LOD ≥ 3) for constitutive heat stress response were detected on chromosome 5A, 6A, 7B, while
one QTL for constitutive-acquired heat stress response was detected on chromosome 6B. The wide
range of genetic variation and the limited influence of population structure support the reliability of
our results and prompt for additional finer investigations of the physiological bases underlying these
QTLs, towards their exploitation in breeding.

4
CHAPTER 1. INTRODUCTION
1.1 THE IMPORTANCE OF DURUM WHEAT
Wheat (Triticum spp.) is the most important stable food crop for more than one third of the world
population and contributes more calories and proteins to the world diet than any other cereal crops
(Shewry, 2009). It is grown worldwide on more than 219 million hectares, with a world production
of 715 million tons in 2013 (http://faostat3.fao.org/). So, wheat is the third most-produced cereal
after maize (well over 900 million tons) and rice (740 million tons), taking up more arable land than
any other crop.
Durum wheat (Triticum turgidum L. var. durum, 2n = 4x = 28) is the second most important wheat
species and the only tetraploid species of wheat of commercial importance that is widely cultivated
today. It is an important crop for the agriculture and economy of Mediterranean countries where
more than half of the global acreage of this crop is grown. Recently, this cereal has been the object
of renewed interest, because of its valuable production and adaptation to low rainfall and semi-arid
environments (Belaid, 2000; Morancho, 2000; Maccaferri et al. 2008; Habash et al. 2009). Durum
wheat is primarily grown under rainfed conditions where the frequent occurrence of drought
combined with heat stress is the major factor limiting grain yield (Araus et al. 2002, 2003a,b;
Condon et al. 2004).
The major durum wheat producing countries are Italy, Spain and France in UE, Canada, Syria,
USA, Algeria and Morocco, while minor production areas occur in Russia, Turkey, Tunisia, Mexico
and India. Italy is the main market for the durum wheat production from the European Community.
In addition, Italy has been conducting an intense breeding activity over the last century which has
supported its long tradition of pasta making. Durum wheat has the ideal properties for making the
best pasta. It is high in protein and gluten, both of which are necessary components for pasta
making. Durum wheat production has been a part of people’s diet, for a long time. The rapidly
increasing demand for more durum wheat both in global and domestic markets, combined with the
availability of proven technologies and practices in countries offer an excellent opportunity for
commercialization of the crop so that the smallholder farmers can significantly participate in the
production of high quality durum wheat to improve their income and livelihood (Newai 2006).
The durum wheat breeding program in Iran is conducted in collaboration with the International
Centre for Agricultural Research in the Dry Areas (ICARDA) and is aimed at developing varieties

5
adapted to the different environments prevailing in Iran, including cold and mildly cold winter
areas. The improved durum wheat genotypes are evaluated in multi-environment trials (MET) to
test their performance across environments and to select the best genotypes in specific
environments or stable performing genotypes across a range of environments. Genotype-by-
environment (GxE) interaction is commonly encountered when different genotypes (cultivars) are
evaluated in MET, as suggested by many studies/reports (Brancourt-Hulmel and Lecomte 2003;
Yan and Kang 2003; Fan et al. 2007).
1.2 THE DURUM WHEAT GENOME
Among a rich variety of wheat species and forms, two are important for human diet, namely bread
wheat (Triticum aestivum) and durum wheat (Triticum turgidum, i.e. Triticum durum Desf.). Bread
and durum wheat are alloheaxaploid and allotetraploid species (see Fig. 2), with large genome size
(16 and 11 Gb, respectively) rich in repetitive elements. All these features make wheat genome
particularly complex among crops (Ganal and Röder 2007; Mayer et al. 2014).
Durum wheat, Triticum turgidum (Genome formula:AABB), evolved from the hybridization of two
diploid ancestors. The A genome is considered as the pivot genome common to all wheat species
and derives from an ancestor of the wild wheat Triticum urartu (AA genome, 2n = 14. Dvorak et al.
1992).The B genome likely originated from the SS genome of an Aegilops species belonging to the
Sitopsis section and similar (Van Slageren 1994) to the present Aegelops speltoides (Sarkar and
Stebbins 1956; Marcussen et al. 2014).
Bread wheat, Triticum aestivum (AABBDD), evolved from the second independent hybridization
(Dubcovsky and Dvorak 2007; Marcussen et al. 2014) between an ancestor of the diploid Aegilops
tauschii var. strangulate (DD genome, McFadden and Sears 1946) and an allotetraploid wheat. This
hybridization occurred, probably, in the west of Iran 8,000 years ago, when the first cultivated
tetraploid wheats (AABB) were introduced in the areas where the diploids wild wheats, holding the
D genome, were already grown (Feldman and Sears 1981).
1.3 THE PROGRESSES IN DURUM WHEAT BREEDING
The first step in a breeding program consists in the creation of variability, usually by hybridization,
with the aim of accumulating enough genetic variation and providing novel useful recombinant
forms for the target traits in the progeny. The choice of parents for crosses requires a prioritization

6
of the goals to be achieved by breeding, and the collection and characterization of genetic sources
carrying favourable alleles for the target traits (Royo et al. 2009).
Higher grain yield, shorter stature and early maturity are among the main breeding objectives in
durum wheat. As it was stated, Italy is characterized by an intense breeding activity in the last
century. During the first decades of the 20th century the breeding activities led to selection of
several varieties from landraces grown in South Italy and from africanum (ie. from Africa) types of
durum wheat (Bozzini 1970; D’Amato 1989). After the Second World War new breeding programs
were developed to select durum wheat genotypes well adapted to the unfavorable environments of
South Italy by introgressing useful traits from foreign syropalestinian types of durum wheat (i.e.
Eiti) (De Cillis 1942). During the 1970s, a series of CIMMYT short straw recombinant lines were
introduced in the Italian breeding programs (Bozzini et al. 1998). This strategy led to the release of
new durum wheat cultivars with a high yield potential and high pasta making quality (Vallega and
Zitelli 1973).
Comparisons of cultivars bred in different periods can shed an interesting light on the evolutionary
trends in morphophysiological, agronomical and qualitative characteristics of the durum wheats
grown in a given region and provide the most direct estimate of breeding progress (Jiang et al.
2003; Guarda et al. 2004; Shearman et al. 2005).
1.4 BREEDING FOR ABIOTIC STRESS TOLERANCE
The world population continues to increase rapidly and agriculture will have to increase its crop
productivity by 70-110% in 2050 to feed the world (Tester and Langridge 2010; Tilman et al.
2011). This task is challenging, as not only we must increase crop yields by a margin not seen
before but also we have to do this in a changing climate (Roy et al. 2011). Climate change
associates with increased exposure to abiotic stress factors such as drought, heat and salt, all of
which have major impacts on crop productions.
Genetic enhancement of crops is one of the most important strategies to increase productivity under
less then optimal agricultural conditions. A key requirement of the wheat breeding programs is to
develop varieties that can cope with a wide range of abiotic stresses while still maintaining high
grain quality. Abiotic stress is an important consideration in wheat breeding, as plants need to be
grown in a variety of locations and environmental conditions. They can influence crop growth, yield
and quality of the desired product as well as contribute to the cost of production and to the use of
pesticides and fertilizers.

7
In many areas that have been considered marginal for growing crops, due to their low fertility,
drought, heat, salt, and other abiotic stresses typically act to disturb the production system.
Additionally, climate change has brought new challenges to agriculture to produce food, feed, fiber
and biofuels. To cope with these new challenges, many plant breeding programs have recently
reoriented their breeding scope to stress tolerance. The tolerance to a particular stress is quite
variable but is related to the plant’s ability to withstand adverse conditions, survive, and reproduce
successfully. Indeed, Miti et al. (2010) defined tolerance as the reduction in yield under stress
conditions compared to the yield under the optimal condition of cultivation. The genetic control of
abiotic stress tolerance is quantitative and involves many loci distributed in different regions of the
genome in cultivated species (Wu et al. 2011).
1.4.1 Drought stress
Drought is the most significant environmental stress in agriculture worldwide and improving yield
under drought is a major goal of plant breeding. Drought tolerance is defined as the ability of a
plant to live, grow, and reproduce satisfactorily with limited water supply or under periodic
conditions of water deficit (Turner 1979). In recent years, crop physiology and genomics have led
to new insights in drought tolerance providing breeders with new knowledge and tools for plant
improvement (Tuberosa and Salvi 2006).
Tolerance to drought is a complex quantitative trait controlled by several small effect genes or
QTLs (Barnabas et al. 2008; Fleury et al. 2010). To address the complexity of plant responses to
drought, it is vital to understand the physiological and genetic basis of this response. Failure to
understand the molecular mechanisms of seed yield stability has hampered both traditional breeding
and the use of modern genetics in the improvement of drought tolerance of crop plants (Passioura
2010; Sinclair 2011).
Drought stress is a primary limitation to crop production (Boyer 1982; Tuberosa et al. 2007), and
important agroecosytems may face increasing drought risk as the result of global climate change
(Trenberth et al. 2007). It is estimated that by 2025, over 60% of the human population will inhabit
countries with water shortage (Arnel 1999). The identification and understanding of traits
improving crop drought tolerance are essential for the development of more drought-tolerant crops
and cropping systems. In the last decades, plant physiologists have identified a number of traits that
might help plants adapt to drought, use acquired water efficiently and tolerate desiccation, as well
as a smaller number of traits that may assist soil water acquisition (Blum 1996; Cattivelli et al.

8
2008; Sinclair et al. 1990; Bruce et al. 2002; Richards 2006; Nelson et al. 2007). For instance, root
system architecture traits are the important regulator of water acquisition under drought. Plants with
longer and deeper roots have better access to water resources available at depth, and are therefore
more prevalent among species found in dry environments (Ehdaie et al. 2003; Manschadi et al.
2006, 2010; Asseng and Turner 2007; Lilley and Kirkegaard 2007; Hammer et al. 2009; Wasson et
al. 2012; Uga et al. 2013). While plants generally allocate relatively more resources to the root
system in response to mineral deficiencies and drought (Lynch, 2007a, b).
1.4.2 Heat stress
Heat stress adversely affects wheat production in many regions of the world and is particularly
detrimental during reproductive development. Heat stress is defined as increased temperature level
sufficient to cause irreversible damage to plant growth and development. Increasing the heat
tolerance of crop species would therefore help to increase and stabilize crop production around the
world. To this end, utilizing diverse genetic resources for breeding is a potentially important
strategy.
Wheat growth and development is divided into three phases: vegetative, reproductive, and grain
filling. Heat stress during the vegetative stage is not of major concern due to the sowing of wheat
during the winter or spring months. Immediately prior to anthesis, the number of grains are
determined and subsequently filled following anthesis. The number of grains and individual kernel
weight make up the two major yield components in wheat (Satorre and Slafer 1999). Depending on
the timing, intensity, and duration of heat stress, grain set and grain filling may be disrupted,
therefore compromising yield.
Measurement of cell membrane stability (CMS) is a technique that has been used for as an indirect
measure for both heat and drought tolerance in various crops (Sullivan 1972) and it is a tool already
applied in breeding programs for heat tolerance (Ibrahim and Quick 2001a, b; Ottaviano et al. 1991;
Tripathy et al. 2000).
CMS is a measure of electrolyte diffusion resulting from heat-induced cell membrane leakage
(Blum and Ebercon 1981, Saadalla et al. 1990). The technique has already been used to screen and
evaluate different wheat genotypes for thermal tolerance (Yildirim et al. 2009).
1.4.3 Salt stress
Salt stress is a major constraint to agricultural food production because it decreases crop yield and
restricts the use of agricultural land. The problem is increasing annually due to climatic change and

9
poor irrigation management. Most cultivated crops are salt sensitive and therefore salinity is an
ever-present threat to agriculture (Flowers and Flowers 2005). Salt tolerance in crop plants is a
genetic and physiological complex trait and is controlled by several quantitative trait loci (Flowers
2004; Nguyen et al. 2013).
The plant response to salinity stress is composed of two phases (Munns and Tester 2008). The first
phase concerns the osmotic stress that is perceived immediately upon plant exposure to highly
saline conditions. Osmotic stress makes uptake of water by plants difficult and adversely affects
shoot and root growth. To facilitate water uptake under such conditions, plants have to accumulate
extra solutes to maintain the water balance of the cells. The second phase is manifested when high
concentrations of toxic ions are built up over a longer period of time. As NaCl is a major constituent
of saline soil, plants accumulate Na+ and Cl
- ions up to levels that are toxic, reducing amongst
others their photosynthetic capacity (Tavakkoli et al. 2011). Therefore, both shoot Na+ and Cl
-
contents were considered important factors for salt-induced damage (Hasegawa et al. 2000; Munns
and Testers 2008; Teakle and Tyerman 2010) even more because the toxicity effects of these ions
appear to be cumulative (Tavakkoli et al. 2011).
1.5 THE STUDY OF ROOT SYSTEM ARCHITECTURE
Root system architecture (RSA) has emerged in recent years as an important focus for plant
genetics and breeding study (Smith and De Smet et al. 2012, Orman-Ligeza et al. 2013). The key
impediment to genetic analysis of cereal root system architecture has so far been the ability to study
roots in situ. Howeverprotocols streamlining phenotypic observations have now been developed for
adult plants under field conditions (Manschadi et al. 2006; Wojciechowski et al. 2009; Trachsel et
al. 2011) and, more frequently, for young and/or adult plants grown in rizothrons under controlled
environmental conditions (Bengough et al. 2004; Sanguineti et al. 2007; Liu et al. 2013). Analyses
of genetic factors contributing to root system architecture remain however limited, partly because of
the above noted difficulty of observing the distribution of roots in field conditions, and partly
because of the complexity of the effects of environmental conditions on root system architecture.
Throughout its life cycle, root system architecture (RSA) is finely tuned to the requirements of the
whole plant. Roots play several essential roles, including anchoring to the soil, mechanical support
to stems, uptake of water and nutrients (therefore playing an essential role in environmental stress
tolerance) and others (De Dorlodot et al. 2007; Osmont et al. 2007; Smith and De Smet 2012). Root
phenotypic traits are thus characterized by plasticity because roots are organs which primarily
respond to water and nutrient availability levels in the soil (Grossman and Rice, 2012). However,

10
root system architecture traits are also characterized by constitutive genetic inheritance components
which allows to predict the root phenotypes at the adult plant stage based on observations carried
out at seedling stage, which is much more manageable.
In this context, the study of root architectural system (RSA) features/QTLs as related to crop
performance can help identifying proxy traits for enhancing adaptation to different soil properties,
moisture conditions, nutrient concentration, etc. (Bacon et al. 2003; Yu et al. 2007; Hochholdinger
and Tuberosa 2009; Obara et al. 2010; Tuberosa 2013; Uga et al. 2013; Lynch 2013). For example,
deep roots might provide a higher protection against dehydration by extracting water stored in
deeper soil horizons (Ehdaie et al. 2003; Manschadi et al. 2006, 2010; Asseng and Turner 2007;
Hammer et al. 2009; Lilley and Kirkegaard 2011; Wasson et al. 2012; Uga et al. 2013). Therefore,
identifying and introgressing alleles for deeper rooting in shallow-rooted, drought-susceptible
cultivars (Grando and Ceccarelli 1995; Ehdaie et al. 2010; Steele et al. 2007; Uga et al. 2013)
appears a desirable approach, as underlined by the “steep, cheap and deep” ideotype recently
proposed by Lynch (2013).
1.6 MOLECULAR MARKERS AND THEIR APPLICATIONS IN BREEDING
Molecular marker technologies offer a wide range of novel approaches to improve the efficiency of
selection strategies. Broadly explained, molecular marker technologies are based on the detection of
sequence variation between varieties where the sequence variant sits in a region of the genome
closely linked to a trait of interest.
Crop improvement relies on the effective utilization of genetic diversity. Molecular marker
technologies promise to increase the efficiency of managing genetic diversity in breeding
programmes. DNA-based molecular markers have several advantages over the traditional
phenotypic selection and their potential benefits as marker-assisted selection (MAS) have been
widely discussed (Melchinger, 1990; Paterson et al. 1991; Young 1996; Mohan et al. 1997;
Anderson 2003; Varshney and Tuberosa 2007), especially to provide solutions to overcome some of
the problems faced by classical phenotypic screening approaches in plant breeding programs.
The most widely used systems, adopted at different stages in the evolution of marker technologies,
are restriction fragment length polymorphism (RFLP), randomly amplified polymorphic DNA
(RAPD), amplified fragment length polymorphism (AFLP), microsatellites or simple sequence
repeats (SSR) and single nucleotide polymorphism (SNP) (Botstein et al. 1980; Weber and May
1989; Williams et al. 1990; Vos et al. 1995; Chee et al. 1996). These technologies can genotype

11
agricultural crops with varying degrees of efficiency. They have various degrees of limitations
associated with their capability to quickly develop and/or rapidly assay large numbers of markers.
Although some of these limitations can be alleviated by equipment (e.g. highly parallel capillary
electrophoresis), most of them are inherently linked to the sequential nature, low reproducibility, or
high assay costs of the marker technologies, or the reliance on DNA sequence information.
Diversity arrays technology (DArT) was developed as a hybridisation-based alternative, which
captures the value of the parallel nature of the microarray platform (Jaccoud et al. 2001; Akbari et
al. 2006).
1.7 IDENTIFICATION OF QUANTITATIVE TRAIT LOCI (QTL)
Quantitative trait loci (QTLs) are loci which segregation in an experimental of natural population
affect the expression of a quantitative trait (Long et al. 2008). A QTL is generally identified with
the help of moleculargenetic markers. Recent technical advancements and refinement of analytical
methods are making QTL mapping easier and more popular (Salvi and Tuberosa 2005; Salvi and
Tuberosa 2015). Several methods have been developed for the identification of QTLs. The most
basic is the use of analysis of variance to compare the score of the quantitative trait between each
marker allele (Soller et al. 1976; Zeng 1994). Although easy to carry out, this method has several
severe drawbacks: it requires a high population of samples, it cannot distinguish between multiple
QTLs on the same chromosome or marker, and it cannot describe the probable position of the QTL
on the chromosome.
A more powerful method for QTL detection is interval mapping. Interval mapping uses multiple
markers to assign a likelihood profile to each region of the chromosome. The individual regions are
defined as intervals between two markers, with the strength of the correlation between each set of
markers and the score of the quantitative trait being used to assign the likelihood profile. Regions
with a likelihood profile greater than a pre-assigned threshold are designated as QTL. This
technique is superior to analysis of variance as it gives the probable location of the QTL and
requires fewer samples. However, it has a similar degree of difficulty in distinguishing between
multiple QTLs on the same chromosome (Lander and Botstein 1989; Zeng 1994). To ameliorate
this problem a technique called Composite Interval Mapping (CIM) may be used. Using CIM it is
possible to distinguish between separate QTLs on the same chromosome by assigning groups of
markers as a proxy for the already established QTL. The effect of these QTL proxy markers is then
taken into account when calculating likelihood profiles for other regions on the chromosome (Zeng

12
1994). Composite interval mapping aids in distinguishing between multiple QTLs on the same
chromosome but is dependent on researcher’s accuracy in designating the markers to serve as QTL
proxies.
1.7.1 Use of Segregating Populations
QTL mapping can be carried out in segregating populations such as Recombinant inbred lines
(RILs), Near isogenic lines (NIL), or Double haploid lines (DH). Recombinant inbred lines (RILs)
are developed by crossing two inbred parent lines followed by repeated selfing to create a new
inbred line, whose genome is a mosaic of the parental genomes. As each RIL is an inbred strain, it
can be propagated eternally and can be used for genetic mapping. The progeny are allowed to self-
fertilize until homozygosity is achieved and the lines are then used to identify QTLs related to the
phenotypic differences between the parents (Browman 2004).
Another type of very valuable permanent population in genetic mapping of target traits is
represented by near isogenic lines (NILs). Such genetic stocks are characterized by an isogenic
background with the exception of single chromosome regions (ideally one per line) introgressed
(substituted) from a donor accessions. They are usually generated though back-crossing to a
recurrent parent at least for six generations, in order to be able to selectively analyse the phenotypic
effect attributable to a QTL (Pumphrey et al. 2007; Xu and Crouch 2008). The introgressed
chromosome regions may carry the QTL and could therefore drive to an hypothesis-driven high-
resolution mapping.
Diploids produced from chromosome doubling of haploids are called doubled or double haploid
(DH). The DH approach has several advantages that make it useful in genetics and plant breeding.
Forster et al. (2007) reviewed various approaches for haploid production in plants. Forster and
Thomas (2004) and Szarejko and Forster (2007) reviewed the use of DHs in genetic studies and
plant breeding. DHs have been used in plant breeding programmes to produce homozygous
genotypes in a number of important species, e.g. tobacco (Nicotiana tabacum L.), wheat, barley,
canola (Brassica napus L.), rice and maize (Maluszynski et al. 2003)
DH populations are desirable genetic materials for genetic mapping including the construction of
genetic linkage maps and gene tagging using genetic markers. QTL analysis is facilitated by using
DH mapping populations and the homozygosity of DHs enables accurate phenotyping by replicate
trials at multiple sites (Forster and Thomas 2004).
1.7.2 Germplasm collection and association mapping approaches

13
Association mapping (AM) or linkage disequilibrium (LD) approach is receiving increasing
attention as QTL mapping method complementary to biparental mapping populations. AM seeks a
phenotype-locus association in populations of unrelated genotypes. AM has recently been
advocated as the method of choice for identifying loci involved in the inheritance of complex traits
in plant genetic research as well (Flint-Garcia et al. 2003; Kraakman et al. 2006; Cockram et al.
2010; Zhao et al. 2007; Atwell et al. 2010; Kloth et al. 2012) and it has been demonstrated to be
promising to exploit the full potential of novel molecular marker and sequencing technologies (Zhu
et al. 2008).
Besides basic plant and cell biology, however mapping individual QTLs is only useful inasmuch as
QTLs are transferrable to other populations of the same or related crop species (Collard et al. 2005).
Association mapping relies on the presence of trait-associated linkage disequilibria in collections of
widely diverse germplasm (Mackay and Powell 2007).
AM can achieve a higher resolution of causal trait polymorphism than linkage mapping. In addition
AM can also accommodate germplasm with broader genetic variation (i.e. from breeding lines to
landraces and even wild progenitors) and allows for the mapping of many traits simultaneously.
Thus, there is reduced need to develop expensive and time-consuming biparental populations for
each target trait. However, because of the much reduced LD extent in AM populations compared to
linkage mapping populations, a significantly greater number of genetic markers are needed to cover
the whole genome and perform a genome-wide association scan (Nordborg and Weigel 2008;
Neuman et al. 2010). With the number of available robust genetic markers such as SSRs and Single
Nucleotide Polymorphisms (SNPs) increasing and the cost of genotyping decreasing, AM has
become a more attractive approach for revealing the genetic architecture of various traits in crop
species
Generally, AM involves six steps (see Fig. 3 from Al-Maskri et al. 2012): (1) selection of a diverse
association panel/group of individuals from a natural population/germplasm collection that may
include, land races, elite cultivars, wild relatives and exotic accessions (2) a comprehensive and
precise phenotyping is performed over the traits such as yield, stress tolerance or quality related
traits of the selected genotypes in multiple repeats and years/environments, (3) the genotypes are
then scanned with suitable molecular markers (AFLP, SSRs, SNPs), (4) population structure and
kinships are determined to avoid false positives followed by (5) quantification of LD extent using
different statistics like D, D' or r2. Finally, (6) genotypic and phenotypic data are correlated using
appropriate statistical software allowing tagging of molecular marker positioned in close proximity

14
of gene(s) underlying a specific trait. Consequently, the tagged gene can be mobilized between
different genotypes and/or cloned and annotated for a precise biological function.
Recently, several AM studies have been published on a variety of crops including common wheat
(Breseghello and Sorrells 2006; Ravel et al. 2006; Roy et al. 2006; Crossa et al. 2007; Jing et al.
2007; Tommasini et al. 2007; Peng et al. 2008; Liu et al. 2013), durum wheat (Sanguineti et al.
2007; Maccaferri et al. 2010; 2011), barley (Kraakman et al. 2004; Kraakman et al. 2006; Rostoks
et al. 2006; Cockram et al. 2008; Varshney et al. 2012), maize (Remington et al. 2001; Wilson et al.
2004; Weber et al. 2007; Lua et al. 2010), and rice (Agrama et al. 2007).
1.7.3 Marker assisted selection
In marker-assisted selection (MAS) breeding, the plant breeder takes advantage of the association
between agronomic traits and allelic variants of genetic, mostly molecular, markers. The general
idea behind marker-assisted breeding is as follows. Before a breeder can utilize linkage-based
associations between traits and markers, the associations have to be assessed with a certain degree
of accuracy and thus marker genotypes can be used as indicators or predictors of trait genotypes and
phenotypes. When the alleles in question are few in number and have major effects on phenotype,
such as a single gene based disease resistance, mapping a monogenic trait goes along with the
mapping of markers, while introduction of the desired alleles into the cultivar can be carried out
readily by the classical breeding procedures of crossing, backcrossing, selfing and selection. In both
cases, breeders depend on a clear relationship between genotype and phenotype to monitor the
presence of the desired alleles in the populations of concern. For quantitative traits, however, a
reliable assessment of trait–marker association requires large scale field experiments as well as
statistical techniques. One of the potential outcome is to allow the breeder to monitor the
transmission of trait genes via closely linked markers, thus enabling ‘genotype building’, or
‘haplotype breeding’ (Salvi and Tuberosa 2015) i.e. construction of desired genotypes by deliberate
crossing and selection, using the marker genotype as a selection criterion.
Several quantitative loci are often detected as associated with a complex phenotype and, as a
consequence of the high LD encountered in experimental crosses, markers can reliable act as
predicting variables (Whittaker et al. 1995). Some authors (e.g. Hospital et al. 1997) underlined that
the possible fixation of unfavourable alleles at loci with small effect on the phenotype (often
undetected in QTL mapping) could significantly affect the efficiency of MAS over breeding cycles.

15
1.8 REFERENCES
Agrama HA, Eizenga GC, Yan W (2007) Association mapping of yield and its components in rice
cultivars. Mol. Breed. 19:341-356
Akbari M, Wenzl P, Caig V, Carling J, Xia L, Yang S, Uszynski G, Mohler V, Lehmensiek A, Kuchel
H, Hayden MJ, Howes N, Sharp P, Vaughan P, Rathmell B, Huttner E, Kilian A (2006)
Diversity arrays technology (DArT) for high-throughput profiling of the hexaploid wheat
genome. Theor Appl Genet 113:1409–1420
Al-Maskri AY, Sajjad M, Khan SH (2012) Association mapping: a step forward to discovering new
alleles for crop improvement. Int. J. Agric. Biol. 14: 153-160
Anderson JA (2003) Plant genomics and its impact on wheat breeding. In: Plant molecular breeding
(H.J.Newbury, Ed.), Blackwell Publ., Boca Raton, 184-215
Araus JL, Slafer GA, Reynolds MP, Royo C (2002) Plant breeding and drought in C-3 cereals: What
should we breed for? Ann. Bot. 89: 925–940
Araus JL, Bort J, Steduto P, Villegas D, Royo C (2003a) Breeding cereals for Mediterranean
conditions: ecophysiological clues for biotechnology application. Ann. Appl. Biol. 142: 129–
141
Araus JL, Villegas D, Aparicio N, Del Moral LF, El Hani S, Rharrabti Y, Ferrio JP, Royo C (2003b)
Environmental factors determining carbon isotope discrimination and yield in durum wheat
under Mediterranean conditions. Crop Sci. 43: 170–180
Arnel NW (1999) Climate change and global water resources. Global Environmental Change 9, 31–
49
Asseng S, Turner NC (2007). Modeling genotype x environment x management interactions to
improve yield, water use efficiency and grain protein in wheat. In 'Scale and Complexity in
Plant Systems Research: Gene-Plant-Crop Relations.Vol 21.' (Eds JHJ Spiertz, PC Struik and
HH VanLaar) pp. 93-103
Atwell S, Huang YS, Vilhjalmsson BJ, Willems G, Horton M, Li Y, Meng D, Platt A, Tarone AM,
Hu TT, Jiang R, Muliyati NW, Zhang X, Amer MA, Baxter I, Brachi B, Chory J, Dean C,
Debieu M, de Meaux J, Ecker JR, Faure N, Kniskern JM, Jones JD, Michael T, Nemri A, Roux
F, Salt DE, Tang C, Todesco M, Traw MB, Weigel D, Marjoram P, Borevitz JO, Bergelson J,
Nordborg M (2010) Genome-wide association study of 107 phenotypes in Arabidopsis thaliana
inbred lines. Nature 465:627-631
Bacon MA, Davies WJ, Mingo D, Wilkinson S (2003) Root signals. Roots: the hidden half. Marcel
Dekker Inc, New York, pp 460–471
16
Barnabas B, Jager K, Feher A (2008) The effect of drought and heat stress on reproductive
processes in cereals. Plant Cell Environ. 31:11–38
Belaid A (2000) Durum wheat in WANA: production, trade and gains from technological change.
Proceedings of the seminar ‘Durum wheat improvement in the Mediterranean region: new
challenges. Zaragoza, Spain, 12–14 April 2000. Options Mediterraneennes, Serie A, Seminaires
Mediterraneens, 40, 35–49
Bengough AG, Gordon DC, Al-Menaie H, Ellis RP, Allan D, Keith R, Thomas WTB, Forster BP,
(2004) Gel observation chamber for rapid screening of root traits in cereal seedlings. Plant and
Soil, 262: 63–70
Blum A (1996) Crop responses to drought and the interpretation of adaptation. Plant Growth
Regulation 20: 135–148
Blum A, Ebercon A (1981) Cell membrane stability as a measure of drought and heat tolerance in
wheat. Crop Science 21: 43-47
Botstein D, White R, Skolnick M, Davis R (1980) Construction of a genetic linkage map in man
using restriction fragment length polymorphisms. Am J Hum Genet 32:314–331
Boyer JS (1982) Plant productivity and environment. Science 218: 443–448
Bozzini A (1970) Genetica e miglioramento genetico dei frumenti duri. Genet. Agr. 24, 145–193.
Bozzini A, Corazza L, D’Egidio MG, Di Fonzo N, La Fiandra D, Pogna NE, Poma I, (1998) Durum
wheat (Triticum turgidum spp. durum). In: Scarascia Mugnozza, G.T., Pagnotta, M.A. (Eds.),
Italian Contribution to Plant Genetics and Breeding. Viterbo, Italy, pp. 181–194
Brancourt-Hulmel M, Lecomte C (2003) Effect of environmental variates on genotype 3
environment interaction of winter wheat: A comparison of biadditive factorial regression to
AMMI. Crop Science 43, 608–617
Breseghello F, Sorrells ME (2006) Association mapping of kernel size and milling quality in
wheat (Triticum aestivum L.) cultivars. Genetics 172:1165-1177
Browman KW (2004) “The Genomes of Recombinant Inbred Lines”, Genetics 169:1133-1146.
Bruce W., Edmeades G. & Barker T. (2002) Molecular and physiological approaches to maize
improvement for drought tolerance. Journal of Experimental Botany 53:13–25
Cattivelli L, Rizza F, Badeck FW, Mazzucotelli E, Mastrangelo AM, Francia E, Mare C, Tondelli A,
Stanca AM (2008) Drought tolerance improvement in crop plants: an integrated view from
breeding to genomics. Field Crops Research 105, 1–14
Chee M, Yang R, Hubbell E, Berno A, Huang XC, Stern D, Winkler J, Lockhart DJ, Morris MS,
Fodor SPA (1996) Accessing genetic information with high-density DNA arrays. Science

17
274:610–614
Cockram J, White J, Leigh FJ, Lea VJ, Chiapparino E, Laurie DA, Mackay IJ, Powell W, O'Sullivan
DM (2008) Association mapping of partitioning loci in barley. BMC Genetics 9(16). doi:
10.1186/1471-2156-9-16
Cockram J, White J, Zuluaga DL, Smith D, Comadran J, Macaulay M, Luo ZW, Kearsey MJ,
Werner P, Harrap D, Tapsell C, Liu H, Hedley PE, Stein N, Schulte D, Steuernagel B, Marshall
DF, Thomas WTB, Ramsay L, Mackay I, Balding DJ, Waugh R, O'Sullivan DM, Consortium A
(2010) Genome-wide association mapping to candidate polymorphism resolution in the
unsequenced barley genome. Proceedings of the National Academy of Sciences of the United
States of America 107:21611-21616
Collard BCY, Jahufer MZZ, Brouwer JB, Pang ECK (2005) An introduction to markers,
quantitative trait loci (QTL) mapping and marker-assisted selection for crop improvement: The
basic concepts. Euphytica 142:169-196
Condon AG, Richards RA, Rebetzke GJ, Farquhar GD (2004) Breeding for high water-use
efficiency. J. Exp. Bot. 55: 2447–2460
Crossa J, Burgueño J, Dreisigacker S, Vargas M, Herrera-Foessel SA, Lillemo M, Singh RP,
Trethowan R, Warburton M, Franco J, Reynolds M, Crouch JH and Ortiz R (2007) Association
analysis of historical bread wheat germplasm using additive genetic covariance of relatives
and population structure. Genetics 177: 1889-1913
D’Amato F (1989) The progress of Italian wheat production in the first half of the 20th century: the
contribution of breeders. Agr. Med. 119, 157–174
De Cillis U (1942) In: Maimone, G. (Ed.), The sicilian wheats (in Italian), pp. 1–323
De Dorlodot S, Forster B, Pagès L, Price A, Tuberosa R, Draye X (2007) Root system architecture:
opportunities and constraints for genetic improvement of crops. Trends in plant science, 12(10),
474-481
Dubcovsky J, Dvorak J (2007) Genome plasticity a key factor in the success of polyploid wheat
under domestication. Science, 316: 1862-1866
Dvorak J, Akhunov ED, Akhunov AR, Deal KR, Luo MC (2006) Molecular characterization of a
diagnostic DNA marker for domesticated tetraploid wheat provides evidence for gene flow
from wild tetraploid wheat to hexa-ploid wheat. Mol Biol Evol, 23: 1386-1396
Ehdaie B, Whitkus RW, Waines JG (2003) Root biomass, water use efficiency, and performance of
wheat-rye translocations of chromosomes 1 and 2 in spring bread wheat ‘Pavon’. Crop Sci
43:710–717

18
Ehdaie B, Merhaut DJ, Ahmadian S, Hoops AC, Khuong T, Layne AP, Waines JG (2010) Root
system size influences water-nutrient uptake and nitrate leaching potential in wheat. J Agron
Crop Sci 196:455–466. doi:10.1111/j.1439-037X.2010.00433.x
Fan XM, Kang MS, Chen H, Zhang Y, Tan J, Xu C (2007) Yield stability of maize hybrids
evaluated in multi-environment trials in Yunnan, China. Agronomy Journal 99, 220–228
Fleury D, Jefferies S, Kuchel H, Langridge P (2010) Genetic and genomic tools to improve drought
tolerance in wheat. J Exp Bot. 61:3211–3222
Flint-Garcia SA, Thornsberry JM, Buckler ESt (2003) Structure of linkage disequilibrium in plants.
Annu Rev Plant Biol 54:357-374
Flowers TJ (2004) Improving crop salt tolerance. J Exp Bot 55:307–319
Flowers TJ, Flowers SA (2005) Why does salinity pose such a difficult problem for plant breeders?
Agric Water Manag 78:15–24
Forster BP, Thomas WTB (2004) Doubled haploids in genetics and plant breeding. Plant Breeding
Reviews 25, 57–88
Forster BP, Herberle-Bors E, Kasha KJ, Touraev A (2007) The resurgence of haploids in higher
plants. Trends in Plant Science 12, 368–375
Ganal MW, Roder MS (2007) Microsatellite and SNP markers in wheat breeding, Vol. 2. In:
Varshney RK, Tuberosa R, (Eds.), Genomic assisted crop improvement: genomics applications
in crops. The Netherlands: Springer, 1-24
Grando S, Ceccarelli S (1995) Seminal root morphology and coleoptile length in wild (Hordeum
vulgare ssp. spontaneum) and cultivated (Hordeum vulgare ssp. vulgare) barley. Euphytica
86:73–80
Grossman JD, Rice KJ (2012) Evolution of root plasticity responses to variation in soil nutrient
distribution and concentration. Evol Appl 5:850–857. doi:10.1111/j.1752-4571.2012.00263.x
Guarda G, Padovan S, Delogu G (2004) Grain yield, nitrogen-use efficiency and baking quality of
old and modern Italian bread-wheat cultivars grown at different nitrogen levels. Eur. J. Agron.
21, 181–192
Habash DZ, Kehel Z, Nachit M (2009) Genomic approaches for designing durum wheat ready for
climate change with a focus on drought. J Exp Bot 60: 2805–2815
Hammer GL, Dong ZS, McLean G, Doherty A, Messina C, Schusler J, Zinselmeier C, Paszkiewicz
S, Cooper M (2009) Can changes in canopy and/or root system architecture explain historical
maize yield trends in the US Corn Belt? Crop Sci 49:299–312. doi:10.2135/cropsci2008.03.
0152

19
Hasegawa PM, Bressan RA, Zhu JK, Bohnert HJ (2000) Plant cellular and molecular responses to
high salinity. Annu Rev Plant Phys 51:463–499
Hochholdinger F, Tuberosa R (2009) Genetic and genomic dissection of maize root development
and architecture. Curr Opin Plant Biol 12:172–177. doi:10.1016/j.pbi.2008.12.002
Hospital F, Moreau L, Lacoudre F, Charcosset A, Gallais A (1997) More on the efficiency of
marker-assisted selection. Theoretical and Applied Genetics, 95: 1181-1189
Ibrahim A, Quick JS (2001a) Heritability of heat tolerance in winter and spring wheat. Crop Sci.
41:1401–1405
Ibrahim A, Quick JS (2001b) Genetic control of high temperature tolerance in wheat as measured
by membrane thermal stability. Crop Sci. 41:1405–1407
Jaccoud D, Peng K, Feinstein D, Kilian A (2001) Diversity arrays: a solid state technology for
sequence information independent genotyping. Nucleic Acids Res 29:e25
Jiang, GM, Sun JZ, Liu HQ, Qu CM, Wang KJ, Guo RJ, Bai KZ, Gao LM, Kuang TY (2003)
Changes in the rate of photosynthesis accompanying the yield increase in wheat cultivars
released in the past 50 years. J. Plant Res. 116, 347–354
Jing HC, Kornyukhin D, Kanyuka K, Orford S, Zlatska A, Mitrofanova OP, Koebner R,
Hammond-Kosack K (2007) Identification of variation in adaptively important traits and
genome-wide analysis of trait-marker associations in Triticum monococcum. Journal of
Experimental Botany 58: 3749-3764
Kloth KJ, Thoen MPM, Bouwmeester HJ, Jongsma MA, Dicke M (2012) Association mapping of
plant resistance to insects. Trends in Plant Science 17:311-319
Kraakman ATW, Niks RE, Van den Berg PMM, Stam P, Van Eeuwijk FA (2004) Linkage
Disequilibrium Mapping of Yield and Yield Stability in Modern Spring Barley Cultivars.
Genetics 168: 435-446
Kraakman ATW, Martinez F, Mussiraliev B, van Eeuwijk FA, Niks RE (2006) Linkage
disequilibrium mapping of morphological, resistance, and other agronomically relevant traits in
modern spring barley cultivars. Molecular Breeding 17:41-58
Lander ES, Botstein D (1989) Mapping mendelian factors underlying quantitative traits using RFLP
linkage maps. Genetics 121:185-199
Lilley JM, Kirkegaard JA (2007) Seasonal variation in the value of subsoil water to wheat:
simulation studies in southern New South Wales. Aust J Agric Res 58:1115–1128. doi:10.
1071/ar07046
Liu WX, Danivola TV, Rouse MN, Bowden RL, Friebe B, Gill BS, Pumphrey MO (2013)

20
Development and characterization of a compensating wheat-Thinopyrum intermedium
Robertsonian translocation with Sr44 resistance to stem rust (Ug99). Theor Appl Genet:
126(5):1167-77
Liu X, Li R, Chang X, Jing R (2013) Mapping QTLs for seedling root traits in a doubled haploid
wheat population under different water regimes. Euphytica: 189: 51–66
Long Y, Zhang C, Meng J (2008) Challenges for QTL analysis in crops. J. Crop Sci. Biotech. 11 (1):
7 ~ 12
Lua Y, Zhangc S, Shah T, Xiec C, Haoc Z, Lic X, Farkharib M, Ribaut JM, Caoa M, Ronga T, Xu Y
(2010) Joint linkage–linkage disequilibrium mapping is a powerful approach to detecting
quantitative trait loci underlying drought tolerance in maize. Proc Natl Acad Sci USA.
107:19585–19590. doi: 10.1073/pnas.1006105107
Lynch JP (2007a) Rhizoeconomics: the roots of shoot growth limitations. Hortscience 42: 1107–
1109
Lynch JP (2007b) Roots of the second green revolution. Australian Journal of Botany 55: 493–512
Lynch JP (2013) Steep, cheap and deep: an ideotype to optimize water and N acquisition by maize
root systems. Ann Bot 112:347–357. doi:10.1093/aob/mcs293
Maccaferri M, Sanguineti MC, Corneti S, Ortega JLA, Ben Salem M, Bort J, DeAmbrogio E, del
Moral LFG, Demontis A, El-Ahmed A, Maalouf F, Machlab H, Martos V, Moragues M,
Motawaj J, Nachit M, Nserallah N, Ouabbou H, Royo C, Slama A, Tuberosa R (2008)
Quantitative trait loci for grain yield and adaptation of durum wheat (Triticum durum Desf.)
across a wide range of water availability. Genetics 178: 489-511
Maccaferri M, Sanguineti MC, Mantovani P, Demontis A, Massi A, Ammar K, Kolmer J, Czembor
J, Ezrati S, Tuberosa R (2010) Association mapping of leaf rust response in durum wheat. Mol
Breed 26: 189-228
Maccaferri M, Sanguineti MC, del Moral LFG, Demontis A, El-Ahmed A, Maalouf F, Machlab H,
Martos V, Moragues M, Motawaj J, Nachit M, Nserallah N, Ouabbou H, Royo C, Slama A,
Tuberosa R (2011) Association mapping in durum wheat grown across a broad range of water
regimes and yield potential. J Exp Bot 62: 409-438
Mackay I, Powell W (2007) Methods for linkage disequilibrium mapping in crops. Trends in Plant
Science 12:57-63
Maluszynski M, Kasha KJ, Forster BP, Szarejko I (eds) (2003) Doubled Haploid Production in Crop
Plants: a Manual. Kluwer Academic Publishers, Dordrecht, Netherlands
Manschadi AM, Christopher J, Devoil P, Hammer GL (2006). The role of root architectural traits in

21
adaptation of wheat to water-limited environments. Funct Plant Biol 33:823–837
Manschadi AM, Christopher JT, Hammer GL, Devoil P (2010) Experimental andmodelling studies
of drought-adaptive root architectural traits in wheat (Triticum aestivum L.). Plant Biosyst
144:458–462. doi:10.1080/11263501003731805
McFadden ES, Sears ER (1946) The origin of Triticum spelta and its free-threshing hexaploid
relatives. Journal of. Heredity, 37: 81-89, 107-116
Melchinger AE (1990) Use of molecular markers in breeding for oligogenic disease resistance.
Plant Breed 104: 1-19
Miti F, Tongoona P, Derera J (2010) S1 selection of local maize landraces for low soil nitrogen
tolerance in Zambia. Afr J Plant Sci 4:67–81
Mohan M, Nair S, Bhagwat A, Krishna TG, Yano M, Bhatia CR, Sasaki T (1997) Genome mapping,
molecular markers and marker assisted selection in crop plants. Mol Breed 3:87-93
Morancho J (2000) Production and marketing of durum wheat worldwide. Proceedings of the
seminar ‘Durum wheat improvement in the Mediterranean region: new challenges. Zaragoza,
Spain, 12–14 April 2000. Options Mediterraneennes, Serie A, Seminaires Mediterraneens, 40,
35–49
Marcussen et al. (2014) Ancient hybridizations among the ancestral genomes of bread wheat.
International Wheat Genome Sequencing Consortium (IWGSC). Science,
18;345(6194):1250092
Mayer KFX et al. (2014) A chromosome-based draft sequence of the hexaploid bread wheat
(Triticum aestivum) genome. International Wheat Genome Sequencing Consortium (IWGSC).
Science, 18;345(6194):1251788
Munns R, Tester M (2008) Mechanisms of salinity tolerance. Annu Rev Plant Biol 59:651–681
Nelson DE, Repetti PP, Adams TR, et al. (2007) Plant nuclear factor Y (NF-Y) B subunits confer
drought tolerance and lead to improved corn yields on water-limited acres. Proceedings of the
National Academy of Sciences of the United States of America 104: 16450–16455
Neumann K, Kobiljski B, Dencic S, Varshney RK and Borner A (2010) Genome wide association
mapping: A case study in bread wheat (Triticum aestivum L.). Molecular breeding. DOI
10.1007/s11032-010-9411-7
Newai Gebre-ab (2006) Commercialization of smallholder agriculture in Ethiopia. Ethiopian
Development Research Institute, Addis Ababa. 22pp
Nguyen V, Ribot S, Dolstra O, Niks R, Visser RF, Linden CG (2013) Identification of quantitative
trait loci for ion homeostasis and salt tolerance in barley (Hordeum vulgare L.). Mol Breed

22
31(1):137–152. doi:10.1007/s11032-012-9777-9
Nordborg M, Weigel D (2008) Next-generation genetics in plants. Nature 456: 720-723
Obara M, Tamura W, Ebitani T, Yano M, Sato T, Yamaya T (2010) Fine-mapping of qRL6.1, a
major QTL for root length of rice seedlings grown under a wide range of NH4(+)
concentrations
in hydroponic conditions. Theor Appl Genet 121:535–547. doi:10.1007/s00122-010-1328-3
Orman-Ligeza B, Parizot B, Gantet PP, Beeckman T, Bennett MJ, Draye X (2013) Post-embryonic
root organogenesis in cereals: branching out from model plants. Trends Plant Sci. 18: 459–467
Ottaviano E, Gorla MS, Pe E, Frova C (1991) Molecular markers (RFLPs and HSPs) for the genetic
dissection of thermotolerance in maize. Theor. Appl. Genet. 81:713–719
Passioura JB (2010) Scaling up: the essence of effective agricultural research. Funct Plant Biol.
37:585–591
Paterson AH, Tanksley SD, Sorrells ME (1991) DNA markers in plant improvement. Adv. Agron.
46:39-90
Peng JH, Bai Y, Haley SD, Lapitan NLV (2008) Microsatellite-based molecular diversity of bread
wheat germplasm and association mapping of wheat resistance to the Russian wheat aphid.
Genetica 135 (1): 95-122
Pumphrey MO, Bernardo R, Anderson JA (2007) Validating the Fhb1 QTL for Fusarium head blight
resistance in near-isogenic wheat lines developed from breeding populations. Crop Science, 47:
200-206
Ravel C, Praud S, Murigneux A, Linossier L, Dardevet M, Balfourier F, Dufour P, Brunel D,
Charmet G (2006) Identification of Glu-B1-1 as a candidate gene for the quantity of high-
molecular-weight glutenin in bread wheat (Triticum aestivum L.) by means of an association
study. Theor Appl Genet 112: 738-743
Remington DL, Thornsberry JM, Matsuoka Y, Wilson LM, Whitt SR, Doebley J, Kresovich
Goodman MM, Buckler ES (2001) Structure of linkage disequilibrium and phenotypic
associations in the maize genome. PNAS 98: 11479-11484
Richards R (2006) Physiological traits used in the breeding of new cultivars for water-scarce
environments. Agricultural Water Management 80:197–211
Rostoks N, Ramsay L, MacKenzie K, Cardle L, Bhat PR, Roose ML, Svensson JT, Stein N,
Varshney R K, Marshall DF, Graner A, Close TJ, Waugh R (2006) Recent history of artificial
outcrossing facilitates whole-genome association mapping in elite inbred crop varieties. PNAS
103: 18656-18661
Roy JK, Bandopadhyay R, Rustgi S, Balyan HS, Gupta PK (2006) Association analysis of

23
agronomically important traits using SSR, SAMPL, and AFLP markers in bread wheat. Current
Science 90: 683-689
Roy SJ, Tucker EJ, Tester M (2011) Genetic analysis of abiotic stress tolerance in crops. Current
Opinion in Plant Biology 14:232-239
Royo C, Elias ME, Manthey FA (2009) Durum wheat breeding. M.J. Carena (ed.), Cereals,
DOI:10.1007/978/-0-387-72297-9
Saadalla MM, Shanahan JF, Quick JS (1990) Heat tolerance in winter wheat: I. hardening and
genetic effects on membrane thermostability. Crop Science 30:1243-1247
Salvi S, Tuberosa R (2005) To clone or not to clone plant QTLs: present and future challenges.
Trends Plant Sci 10(6):297–304
Salvi S, Tuberosa R (2015) The crop QTLome comes of age. Curr Opin Biotechnol. 19;32C:179-
185
Sanguineti MC, Li S, Maccaferri M, Corneti S, Rotondo F, Chiari T, Tuberosa R 2007. Genetic
dissection of seminal root architecture in elite durum wheat germplasm. Ann Appl Biol 151:
291-305
Sarkar P, Stebbins GL (1956) Morphological evidence concerning the origin of the B genome in
wheat. American Journal of Botany, 43: 297-304
Satorre EH, Slafer GA (1999) Wheat: ecology and physiology of yield determination. The
Hawthorn Press ISBN 1-56022-874-1, Stroud, Gloucestershire, UK
Shearman VJ, Sylvester-Bradley R, Scott RK, Foulkes MJ (2005) Physiological processes
associated with wheat yield progress in the UK. Crop Sci. 45, 175–185
Shewry PR (2009) The HEALTHGRAIN programme opens new opportunities for improving wheat
for nutrition and health. Nutrition Bulletin, 34(2): 225–231
Sinclair TR, Bennett JM, Muchow RC (1990) Relative sensitivity of grain yield and biomass
accumulation to drought in field-grown maize. Crop Science 30, 690–693
Sinclair TR (2011) Challenges in breeding for yield increase for drought. Trends Plant Sci. 16:289–
293
Smith S, De Smet I (2012) Root system architecture: insights from Arabidopsis and cereal crops.
Philos Trans R Soc Lond B Biol Sci. 367:1441-1452
Soller M, Brody T, Genizi A (1976) On the power of experimental designs for the detection of
linkage between marker loci and quantitative loci in crosses between inbred lines. Theoretical
and Applied Genetics 47:35-39
Steele KA, Virk DS, Kumar R, Prasad SC, Witcombe JR (2007) Field evaluation of upland rice

24
lines selected for QTLs controlling root traits. Field Crops Res 101:180–186
Sullivan CY (1972) Mechanism of heat and drought resistance in grain sorghum and methods of
measurement. In: Rao NGP, House LR, editors. Sorghum in the seventies. New Delhi, India:
Oxford & IBH publ Co.; p. 247–64
Szarejko I, Forster BP (2007) Doubled haploidy and induced mutation. Euphytica 158, 359–370
Tavakkoli E, Fatehi F, Coventry S, Rengasamy P, McDonald GK (2011) Additive effects of Na+ and
Cl- ions on barley growth under salinity stress. J Exp Bot 62:2189–2203
Teakle NL, Tyerman SD (2010) Mechanisms of Cl- transport contributing to salt tolerance. Plant
Cell Environ 33:566–589
Tester M, Langridge P (2010) Breeding Technologies to Increase Crop Production in a Changing
World. Science 327:818-822
Tilman D, Balzer C, Hill J, Befort BL (2011) Global food demand and the sustainable
intensification of agriculture. Proceedings of the National Academy of Sciences of the United
States of America 108:20260-20264
Tommasini L, Schnurbusch T, Fossati D, Mascher F, Keller B (2007) Association mapping of
Stagonospora nodorum blotch resistance in modern European winter wheat varieties. Theor
Appl Genet 115: 697-708
Trachsel S, Kaeppler SM, Brown KM, Lynch JP (2011) Shovelomics: high throughput phenotyping
of maize (Zea mays L.) root architecture in the field. Plant and Soil, 341(1-2), 75-87
Trenberth KE, Jones PD, Ambenje P, et al. 2007. Observations: surface and atmospheric climate
change. In: Solomon S, Qin D, Manning M, et al eds. Climate change 2007: the physical
science basis. Contribution of Working Group I to the Fourth Assessment Report of the
Intergovernmental Panel on Climate Change. Cambridge: Cambridge University Press.
Tripathy JN, Zhang J, Robin S, Nguyen HT (2000) QTLs for cell-membrane stability mapped in
rice (Oryza sativa L.) under drought stress. Theor. Appl. Genet.100:1197–1202
Tuberosa R, Salvi S (2006) Genomics-based approaches to improve drought tolerance of crops.
Trends Plant Sci. 11, 405–412
Tuberosa R, Salvi S, Giuliani S, Sanguineti MC, Bellotti M, Conti S, and Landi P (2007) Genome-
wide approaches to investigate and improve maize response to drought. Crop Science 47:
S120–S141
Tuberosa R (2013) Phenotyping for drought tolerance of crops in the genomics era. Frontiers in
Physiology, 3: 347
Turner NC (1979) Drought resistance and adaptation to water deficits in crop plants. In: Mussell H,

25
Staples CR, eds. Stress physiology in crop plants. New York: John Wiley & Sons, 343–372
Uga Y, Sugimoto K, Ogawa S, Rane J, Ishitani M, Hara N, Kitomi Y, Inukai Y, Ono K, Kanno N,
Inoue H, Takehisa H, Motoyama R, Nagamura Y, Wu J, Matsumoto T, Takai T, Okuno K, Yano
M (2013) Control of root system architecture by DEEPER ROOTING 1 increases rice yield
under drought conditions. Nat Genet 45:1097–1102. doi:10.1038/ng.2725
Vallega J, Zitelli G (1973) New high yielding Italian durum wheat varieties. In: Proceedings of the
Genetics and Breeding of Durum Wheat, Bari, 14–18 May, pp. 373–400
Van Slageren MW (1994) Wild wheats: a monograph of Aegilops L. and Amblyopyrum (Jaub. and
Spach) Eig (Poaceae). Agricultural University, Wageningen & International Center for
Agricultural Research in Dry Areas, Aleppo, Syria
Varshney RK, Tuberosa R (2007) Application of linkage disequilibrium and association mapping in
crop plants. Genomics Approaches and Platforms, Vol 1: 97-119
Varshney RK, Paulo MJ, Grando S, Eeuwijk FA, Keizer LCP, Guo P, Ceccarelli S, Kilian A, Baum
M, Graner A (2012) Genome wide association analyses for drought tolerance related traits in
barley (Hordeum vulgare L.) Field Crops Res.126:171–180. doi: 10.1016/j.fcr.2011.10.008
Vos P, Hogers R, Bleeker M, Reijans M, van de Lee T, Hornes M, Fritjers A, Pot J, Peleman J,
Kuiper M, Zabeau M (1995) AFLP: a new technique for DNA Wngerprinting. Nucleic Acids
Res 23:4407–4414
Wasson AP, Richards RA, Chatrath R, Misra SC, Prasad SVS, Rebetzke GJ, Kirkegaard JA,
Christopher J, Watt M (2012) Traits and selection strategies to improve root systems and water
uptake in water-limited wheat crops. J Exp Bot 63:3485–3498. doi:10.1093/jxb/ers111
Weber J, May P (1989) Abundant class of human DNA polymorphisms which can be typed using
the polymerase chain reaction. Am J Hum Genet 44:388–396
Weber A, Clark RM, Vaughn L, Sánchez-Gonzalez JdJ, Yu J, Yandell BS, Bradbury P, Doebley J
(2007) Major Regulatory Genes in Maize Contribute to Standing Variation in Teosinte (Zea
mays ssp. parviglumis). Genetics 177: 2349-2359
Whittaker JC, Curnow RN, Haley CS, Thompson R (1995) Using marker-maps in marker-assisted
selection. Genetical Research, 66: 225-232
Williams J, Kubelik A, Livak K, Rafalski J, Tingey S (1990) DNA polymorphisms ampliWed by
arbitrary primers are useful as genetic markers. Nucleic Acids Res 18:6531–6535
Wilson LM, Whitt SR, Rocheford TR, Goodman MM, Buckler ES (2004) Dissection of maize
kernel composition and starch production by candidate gene association. Plant Cell 16:2719-
2733

26
Wojciechowski T, Gooding MJ, Ramsay L, Gregory PJ (2009) The effects of dwarfing genes on
seedling root growth of wheat. Journal of Experimental Botany 60, 2565–2573
Wu Y, Liu W, Li X, Li M, Zhang D, Hao Z, Weng J, Xu Y, Bai L, Zhang S, Xie C (2011)
Lownitrogen stress tolerance and nitrogen agronomic efficiency among maize inbreds:
comparison of multiple indices and evaluation of genetic variation. Euphytica 178 (online first)
Xu Y, Crouch JH (2008) Marker-assisted selection in plant breeding: from publications to practice.
Crop Science, 48: 391-407
Yan W, Kang MS (2003) ‘GGEBiplot analysis:Agraphical tool for breeders, geneticists, and
agronomists.’ (CRC Press: Boca Raton, FL)
Yildirim M, Bahar B, Koç M, Barutçular C (2009) Membrane thermal stability at different
developmental stages of spring wheat genotypes and their diallel cross populations. Tarim
Bilimleri Dergisi, 15 (4): 293-300
Young ND (1996) QTL mapping and quantitative disease resistance in plants. Annu Rev
Phytopathol 34:479-501
Yu G-R, Zhuang J, Nakayama K, Jin Y (2007) Root water uptake and profile soil water as affected
by vertical root distribution. Plant Ecol 189:15–30. doi:10.1007/s11258-006-9163-y
Zeng Z-B (1994) Precision mapping of quantitative trait loci. Genetics 136:1457-1468
Zhao K, Aranzana MJ, Kim S, Lister C, Shindo C, Tang C, Toomajian C, Zheng H, Dean C,
Marjoram P, Nordborg M (2007) An Arabidopsis example of association mapping in structured
samples. PLoS Genet 3:e4
Zhu C, Gore M, Buckler ES, Yu J (2008) Status and Prospects of Association Mapping in Plants.
103835/plantgenome2008020089 1:5-20

27
FIGURES

28
Fig. 1 Spikes of durum wheat

29
Fig. 2 Durum and Bread wheat evolution

30
Fig. 3 A simplified flow chart showing different stages of association mapping for tagging a gene of
interest using germplasm accessions.

31
CHAPTER 2. RESEARCH AIMS
The research presented in this thesis aims to identify traits and genes that underlie root system
architecture and tolerance to heat stress in durum wheat.
Hence, the objectives of this study were:
- A set of elite durum wheat accessions previously tested for yield and other agronomic traits
in 15 field trials carried out by Maccaferri et al. (2011) across a broad range of
Mediterranean environments was evaluated at an early growth stage in order to map root
system architecture QTLs and verify their effects on grain yield and other agronomic traits.
- Root system architecture traits were evaluated on a recombinant inbred line population from
the cross between the cvs. Meridiano and Claudio as a focus for studies the genetic regions
controlling and identify QTL associated with root trait architecture in durum wheat.
- Genetic analysis of the variation observed in various anatomical root traits of the durum
wheat cultivars is described. To our best knowledge, this is the first investigation of this type
in durum wheat. The presence of genetic variation for root anatomical traits and the
possibility to rapidly phenotype them could provide novel opportunities for durum wheat
breeding programs.
- Association mapping study for heat tolerance in durum wheat was investigated using cell
membrane stability (CMS) in a panel of durum wheat accessions well-suited for association
mapping studies to detect QTLs associated with heat response traits.

32
CHAPTER 3. ASSOCIATION MAPPING FOR ROOT ARCHITECTURAL TRAITS IN
DURUM WHEAT SEEDLINGS AS RELATED TO AGRONOMIC PERFORMANCE
3.1 ABSTRACT
Association mapping provides useful insights on the genetic architecture of quantitative traits across
a large number of unrelated genotypes, which in turn allows an informed choice of the lines to be
crossed for a more accurate characterization of major QTLs in a biparental genetic background. In
this study, seedlings of 183 durum wheat elite accessions were evaluated in order to identify QTLs
for root system architecture (RSA). The QTLs identified were compared with QTLs detected for
grain yield and its component traits, plant height and peduncle length measured in a previous study
where the same accessions were evaluated in 15 field trials with a broad range of soil moisture
availability and productivity (Maccaferri et al. in J Exp Bot 62:409–438, 2011). The following RSA
features were investigated in seedlings at the four-leaf stage: seminal root angle, primary root
length, total root length, average root length, root number and shoot length. Highly significant
differences among accessions were detected for all traits. The highest repeatability (h2 = 0.72) was
observed for seminal root angle. Out of the 48 QTLs detected for RSA, 15 overlapped with QTLs
for agronomic traits and/or grain yield in two or more environments. The congruency of the effects
of RSA traits and agronomic traits was evaluated. Seminal root angle and root number appear the
most promising traits for further studies on the adaptive role of RSA plasticity on field performance
in environments differing for water availability. Our results provide novel insights on the genetic
control of RSA and its implications on field performance of durum wheat.
Keywords Association mapping, Triticum turgidum L. subsp. durum (Desf.) Husn., QTL, Root
architecture, Yield, Drought, Agronomic performance, Root number, Seminal root angle
This chapter has been published in Molecular Breeding (2014). DOI 10.1007/s11032-014-0177-1

33
3.2 ABBREVIATIONS
AM Association mapping
ARL Average root length
DArT Diversity Array Technology(R) markers
GMEs General mean of environments
GY Grain yield
HYE High-yielding environments
HYEsM Mean of high-yielding environments
KPSM Number of kernels per square meter
LD Linkage disequilibrium
LYE Low-yielding environment
LYEsM Mean of low-yielding environments
MAS Marker-assisted selection
MYE Medium-yielding environment
MYEsM Mean of medium-yielding environments
PdL Ear peduncle length
PH Plant height
PRL Primary root length
QTL Quantitative trait locus
RIL Recombinant inbred line
RSA Root system architecture
SL Shoot length
SRA Seminal root angle
SSR Simple sequence repeat markers
TKW Thousand kernel weight
TRL Total root length
TRN Total number of roots
TW Test weight (grain volume weight)

34
3.3 INTRODUCTION
The fast rise in global food demand coupled with the increasing unpredictability of weather
conditions consequent to climate change require the release of cultivars with higher yield potential
and able to maintain acceptable yield levels and quality under a broad range of environmental
conditions. In view of the quantitative nature of the traits governing yield and yield stability,
effectively meeting this formidable challenge will require a multidisciplinary approach based upon
both conventional and genomics-assisted breeding practices. Accordingly, major efforts are
underway to identify loci (genes and QTLs) for morpho-physiological traits that control yield
potential and yield stability, particularly in cereal crops grown across regions characterized by a
broad range of water availability (Tuberosa et al. 2007; Fleury et al. 2010; Uga et al. 2013). An
example is provided by the Mediterranean Basin, where durum wheat (Triticum durum Desf.) is
grown in a range of conditions varying from favorable environments to dryland areas characterized
by frequent drought episodes and high temperature stresses, mainly during grain filling (Loss and
Siddique 1994; Royo et al. 2010; Maccaferri et al. 2011). Under such conditions, the evaluation of a
suitable set of genotypes provides valuable leads for the identification of drought-adaptive traits
(Blum 1988; Grando and Ceccarelli 1995; Passioura 2002; Richards 2006; Araus et al. 2008;
Reynolds and Tuberosa 2008; Passioura and Angus 2010; Royo et al. 2010; Tardieu and Tuberosa
2010) and the underlying QTLs (Sanguineti et al. 2007; Mathews et al. 2008; Maccaferri et al.
2011; Bennett et al. 2012; Bai et al. 2013; Graziani et al. 2014).
In this context, the study of root architectural system (RSA) features/QTLs as related to crop
performance can help to identify proxy traits for enhancing adaptation to different soil properties,
moisture conditions, nutrient concentration, etc. (Bacon et al. 2003; Yu et al. 2007; Hochholdinger
and Tuberosa 2009; Obara et al. 2010; Sharma et al. 2011; Tuberosa 2012; Lynch 2013; Uga et al.
2013). For example, deep roots might provide a higher protection against dehydration by extracting
water stored in deep soil horizons (Ehdaie et al. 2003; Manschadi et al. 2006, 2010; Lilley and
Kirkegaard 2007; Hammer et al. 2009; Wasson et al. 2012; Uga et al. 2013). Therefore, identifying
and introgressing alleles for deeper rooting in shallowrooted, drought-susceptible cultivars (Grando
and Ceccarelli 1995; Steele et al. 2007, 2008; Ehdaie et al. 2010; Uga et al. 2013) is a desirable
approach, as underlined by the ‘steep, cheap and deep’ ideotype recently proposed by Lynch
(2013).
The evaluation of RSA features directly in the field is very difficult, expensive and time-consuming,
especially when dealing with the large number of plants and genotypes required for QTL analysis,
particularly with target traits of low heritability (Richards 2008; Christopher et al. 2013). Moreover,

35
field screening is usually destructive and leads to a substantial loss of the geometry of the root
(Nagel et al. 2009). In this respect, it has been reported that adult geometry of the root is strongly
related to seminal root angle (SRA), with deeply rooted wheat genotypes showing a narrower SRA,
while genotypes with a shallower root system show wider SRA (Manschadi et al. 2008).
Different systems have been adopted to enable an early screening of RSA traits in wheat (Kubo et
al. 2007; Sanguineti et al. 2007; Nagel et al. 2009; Munns et al. 2010; Ren et al. 2012; Bai et al.
2013; Christopher et al. 2013; Liu et al. 2013; Watt et al. 2013). In these cases, the assumption is
that genotypes that differ in RSA at an early stage would also differ in the field at stages when
nutrient and/or water capture is most critical for grain yield.
Among the possible approaches for the functional dissection of quantitative traits, association
mapping (AM) has been developed as an alternative to traditional bi-parental linkage mapping to
identify associations between phenotypic values of target traits and molecular markers (Ersoz et al.
2007; Sorrells and Yu 2009). In this study, the set of elite durum wheat accessions previously tested
for yield and other agronomic traits in 15 field trials carried out by Maccaferri et al. (2011) across a
broad range of Mediterranean environments was evaluated at an early growth stage in order to map
RSA–QTLs and verify their effects on grain yield and other agronomic traits.
3.4 MATERIALS AND METHODS
3.4.1 Plant material
The panel of 183 elite accessions of durum wheat included cultivars and breeding lines selected in
Mediterranean countries (Italy, Morocco, Spain, Syria and Tunisia), Southwestern USA and Mexico
that were released from the early 1970s up to the late 1990s (Appendix 1). The panel included also
‘founder genotypes’ used as parents in breeding programs throughout the Mediterranean Basin and
at International CGIAR Centers (CIMMYT and ICARDA). The accessions were chosen according
to their pedigree and highly related accessions were excluded. Accessions showing large differences
in heading date were excluded to limit possible bias of phenology in the interpretation of the results
pertaining to the agronomic traits. A detailed phenotypic and molecular characterization of the
panel was previously reported in Maccaferri et al. (2006, 2010, 2011).
3.4.2 Root morphology evaluation
Root morphology was evaluated according to the protocol first described by Bengough et al. (2004),
then modified by Sanguineti et al. (2007) and further modified in the present work. For each
genotype, 15 seeds were weighed, then sterilized in a 1 % sodium hypochlorite solution for 10 min,

36
rinsed thoroughly in distilled water and placed in Petri dishes at 28 °C for 24 h. Then, eight
homogeneous seedlings with normal seminal root emission were positioned spaced 5 cm from each
other on a filter paper sheet placed on a vertical black rectangular (42.5 × 38.5 cm) polycarbonate
plate for root obscuration. Distilled water was used for plantlets’ growth. Each experimental unit
included six plantlets, since the two external ones were considered as border plantlets and, as such,
discarded. RSA traits were measured in plantlets that were grown for 9 days at 22 °C under a 16-h
light photoperiod. The experiment was conducted according to a randomized complete block
design, with three replications in time.
The following traits were investigated on a single plant basis: spread of seminal root angle (SRA),
first measured at 3.5 cm from the tip of the seeds as the distance between the two external roots of
each plantlet and then converted to degrees, primary root length (PRL), total root length (TRL),
total number of roots (TRN), average root length (ARL), and shoot length (SL).
Due to the high number of genotypes under evaluation, the accessions were divided into sets of 25–
30 accessions each hereafter reported as blocks. In order to account for possible differences in
growth rate among blocks, blocking was taken into account in the subsequent analysis of variance
(ANOVA) and a linear adjustment for block effect was carried out. Cultivar Meridiano was also
repeated as internal check in every block.
RSA traits were measured on plantlets’ images using the software SmartRoot® (Lobet et al. 2011)
for all the traits, except for SRA and SL that were measured manually.
3.4.3 Field data
Details and results of the agronomic performance of the panel of accessions were reported in
Maccaferri et al. (2011). Briefly, the 183 accessions were tested in 15 field trials carried out during
two growing seasons (2003/2004 and 2004/2005) in six countries (Italy, Lebanon, Morocco, Spain,
Syria and Tunisia) and in some cases at two water regimes (rainfed and irrigated). Each trial has
been coded according to the country (first three letters of each code), the water regime (with ‘r’ and
‘i’ standing for rainfed and irrigated trial, respectively) and the year (with 04 and 05 standing for
2004 and 2005, respectively) in which they were conducted. More in detail, three trials were carried
out in Italy (Itl1-r04 in Cadriano, 44° 33' N and 11° 24' E; Itl2-r04 and Itl2-r05 in Cerignola, 41° 28'
N and 15° 84' E), four in Lebanon (Lbn-r04, Lbn-i04, Lbn-r05, and Lbn-i05 in Rayack, 33° 51' N
and 35° 59' E), two in Morocco (Mrc-r04 and Mrc-i04 in SidiElaydi, 31° 15' N and 7° 30' W), two
in Spain (Spn1-r04 in Gimenells, 38° 56' N and 0° 29' E; Spn2-r05 in Granada, 37° 15' N and 3° 46'
E), two in Syria (Syr-r05 and Syr-i05 in Tel Hadya, 36° 56' N and 36° 04' E) and two in Tunisia
37
(Tns-r05 and Tns-i05 in Kef, 36° 14' N and 8° 27' E). Each field trial was characterized for the main
environmental conditions, i.e., temperature, water availability and soil moisture. For the present
study, a re-analysis of agronomic traits was performed with a new genetic map made available at
University of Bologna (Maccaferri et al. 2014). In particular, the analysis focused on grain yield
(GY), thousand kernel weight (TKW), number of grains per square meter (KPSM), grain volume
weight or test weight (TW), plant height (PH) and ear peduncle length (PdL). Based on the GY
values reported in Maccaferri et al. (2011), each trial was classified according to its yield level as
follows: low-yielding environment (LYE) ranging from 0.9 to 3.6 t ha-1
; medium-yielding
environment (MYE) ranging from 4.1 to 5.7 t ha-1
, high-yielding environment (HYE) ranging from
5.8 to 6.8 t ha-1
. Each class included five environments, except LYEs for PH, PdL and TW where
only three environments were considered. For each agronomic trait, single environment values and
the general mean over all the tested environments (GMEs) were analyzed. The mean values of each
environmental class were also included in the analysis (indicated as LYEsM, MYEsM and
HYEsM).
On average, in the field trials considered herein the lines of this AM panel showed a heading
window of of seven days, with the 70% of the lines heading within two days and 80% within three
days (Maccaferri et al. 2011).
3.4.4 Molecular profiling
In the present study, the SSR-based map (334 SSRs) reported in Maccaferri et al. (2011) was
enriched with DArT marker. In total, 957 markers (334 SSRs and 623 DArT markers) were used for
the molecular profiling of the 183 accessions.
DArT markers were generated by Triticarte Pty Ltd. (Canberra, Australia;
http://www.triticarte.com.au). The durum wheat PstI/TaqI array v 2.0, containing 7,600 single
DArT clones obtained as described in Mantovani et al. (2008), was used for genotyping the panel.
The locus designation used by Triticarte Pty. Ltd. was adopted (‘wPt’, ‘rPt’ and ‘tPt’ loci
corresponding to wheat, rye and triticale clones, respectively), and alleles at polymorphic loci were
scored as hybridization positive (1) or negative (0).
Markers were ordered according to a consensus map developed at the University of Bologna in the
framework of an international cooperation for that purpose (Maccaferri et al. 2014a). Four mapping
populations, i.e., Kofa × Svevo (KS RIL population, Maccaferri et al. 2008), Colosseo × Lloyd (CL
RIL, Mantovani et al. 2008), Meridiano × Claudio (MC RIL, Maccaferri et al. 2011) and Simeto ×
Levante (SL RIL, Maccaferri et al. unpublished) were developed by the University of Bologna in

38
collaboration with Produttori Sementi Bologna SpA (Argelato, BO, Italy). Ten additional maps
provided by international partners were used to assemble a common consensus map, used to order
the markers available for genotyping the experimental materials herein presented (Maccaferri et al.
2014a).
3.4.5 Statistical analysis and association mapping analysis
The analysis of variance (ANOVA) was conducted on RSA traits based on the mean values of the
experimental units. In order to reduce the effect due to blocks, the general mean of each set of
genotypes included in the same block was used to correct the corresponding single values, using a
linear regression method. To detect possible maternal effects due to seed size, an analysis of
covariance was carried out for each trait using kernel weight as covariate.
Repeatability (h2) was calculated on a mean basis across three replications. Accession means were
used to calculate Pearson’s correlation coefficients of RSA traits versus the agronomic traits (GY,
TKW, KPSM, PH and PdL) for each environment, as well as versus the mean values of each
environmental class and the general mean.
To reduce the risk of false-positive marker-trait associations, rare alleles (i.e., with frequencies
equal or<0.10) were considered asmissing data. Additionally, marker points showing residual allelic
heterogeneity within accession were also considered as missing data; thus, a total of 957
informative markers (i.e., 334 SSR and 623 DArT markers) that was possible to project on the
consensus linkage map were utilized for Association Mapping (AM) analysis.
Presence of significant population structure in the panel had been previously shown by Maccaferri
et al. (2011) with a combination of model- and distance based analyses using the program
STRUCTURE v. 2 (Pritchard et al. 2000). The optimal population structure model was identified by
five hypothetical subgroups that led to the Q matrix of membership coefficients of each accession to
all subgroups (for details see Maccaferri et al. 2011). Prior to proceeding with AM analysis, a
multiple regression analysis was performed to test the significance of the differences among
subgroups for the measured RSA traits.
A co-ancestry kinship (K) matrix was obtained for the mapped SSR and DArT markers by pairwise
genetic similarity values (GSij) that were calculated for all accession pairs using the simple
matching coefficient for multi-state markers. Linkage disequilibrium (LD) was estimated using the
program TASSEL, v. 2.1 (www. maizegenetics.net, Yu et al. 2006); D’ and r2 values are a function
of the corresponding inter-marker distances and the comparison-wise significance was computed
with 10,000 permutations. The r2 LD value was estimated for intra-chromosomal loci and related to
39
genetic distances between loci (cM). When all pairs of adjacent loci were in LD (r2 > 0.3), this
region was referred to as a LD block (Stich et al. 2005). Genome-wide scans for AM for both RSA
traits and agronomic traits were conducted using the TASSEL program, ver. 4.0 (Bradbury et al.
2007). The 334 SSR and 623 DArT markers were tested for significance of marker-trait association
under the fixed general linear model (GLM) including the Q population structure results as
covariates (Q GLM), and the mixed linear model (MLM) including the Q population structure
results plus the K kinship matrix (Q+K MLM).
For GLM analysis, besides the marker-wise association probability values, the experiment-wise
association significance probability was obtained based on a permutation test implemented in
TASSEL (10,000 permutations in total). The experiment-wise test provides a much more stringent
threshold for significance as compared to the marker-wise test (Bradbury et al. 2007). Three
significance levels of marker-trait association were considered, i.e., marker-wise at P = 0.01 [-
log(P) = 2.0] and P = 0.001 [-log10(P) = 3.0] and experiment-wise at P = 0.1 [-log10(P) = 4.0,
Bonferroni’s correction]. The QTL analysis was conducted on both RSA and agronomic traits.
In the present work, only RSA–QTLs co-locating with agronomic traits in at least two environments
and/ or on mean values (general means or at least one environmental class mean) are reported.
Multiple, adjacent co-segregating significant markers were assigned to a unique QTL region if the
strongest marker for the agronomic trait was within 2.5 cM from the reference marker (i.e., where
the LOD value was highest) for RSA-QTLs, verifying a significant and strong LD among markers
(possibly with r2 values C0.6) (Massman et al. 2011). To facilitate the comparison of the effect of
the same chromosomal region on different traits and assess their possible relationship, the effect of
each single QTL was always referred to the reference allele (i.e., the allele with the highest
frequency) as compared to the overall phenotypic mean at the RSA–QTL peak marker. The allele
effect was also reported as percentage of the trait phenotypic mean.
3.5 RESULTS
3.5.1 Phenotypic variation of the accessions’ panel for RSA traits
Frequency distributions for RSA traits are shown in Fig. 1, together with the standard deviation
estimated on the check cultivar Meridiano, and the LSD based on the ANOVA results. All traits
show an approximately normal distribution, indicating a polygenic control. Kernel weight of the
samples was taken into account as a covariate in the statistical analysis; the covariate was highly
significant for SRA, ARL and TRL, while it was not significant for PRL, TRN and SL. The effect
of the significant covariate was taken in due account in the calculation of the adjusted means of the

40
corresponding traits. No significant regression (data not shown) between phenotypic values of RSA
traits and population structure was detected, indicating that the variation observed herein was not
influenced by the coefficient of membership of the tested material to the five germplasm subgroups.
The experimental material showed a wide range of variation for RSA traits as reported in Table 1
together with the results of the ANOVA. In detail, the RSA traits ranged as follows: SRA from 48°
to 147° with a mean value of 100°, PRL from 13.8 to 32.9 cm with a mean value of 21.1 cm, TRL
from 52.8 to 144.7 cm with a mean value of 94.6 cm, SL from 7.2 to 16.3 cm with a mean value of
9.7 cm and ARL from 12.0 to 26.0 cm with a mean value of 18.2 cm. TRN showed the lowest
variation, from 4.01 to 6.46 roots per plant, with a mean value of 5.18. The ANOVA showed highly
significant differences between the genotypes for all traits, with CV values ranging from 6.1% for
TRN to 17.0% for PRL. Repeatability values ranged from 48.6% for PRL to 72.8% for SRA. In this
respect, it should be underlined that these values are somehow overestimated, due to the fact that
the genetic variance includes also the genotype by environment interaction.
3.5.2 Correlation among RSA features and agronomic traits
The analysis of the correlations between RSA traits and agronomic performances of the 183
accessions is reported in Table 2. Correlation coefficients are reported for the mean values of each
one of the three environmental classes, namely LYEsM
, MYEsM
and HYEsM
as well as for the
general mean over all environments (GMEs); additionally, the number of environments showing
significant correlations within each class is reported in brackets. Highly significant albei low
correlations were detected between SRA and TKW (r = -0.23, -0.21 and -0.20 in MYEsM
, HYEsM
and GMEs, respectively). Accordingly, highly significant and equally low correlations were
detected between SRA and TW (r = -0.20, -0.26 and -0.22 in LYEsM
, MYEsM
and GMEs,
respectively). Moreover, SRA showed significant correlations with PdL in LYEsM
(r = -0.20),
HYEsM
(r = -0.19) and GMEs (r = -0.20). All these correlations showed a significant, albeit low,
negative value, thus suggesting that a more superficial root system (i.e., increase in SRA) is
associated with a decreased PdL, TKW and TW. SRA was also significantly correlated with KPSM
in MYEsM
(r = 0.23), HYEsM
(r = 0.24) and GMEs (r = 0.23). A significant, positive correlation
was observed between SL and PH in MYEsM
(r = 0.19), HYEsM
(r = 0.21) and GMEs (r = 0.20).
As to GY, significant albeit low correlations were only detected with TRN in LYEsM
and GMEs (r
= 0.24 and 0.18, respectively). No additional significant correlation was detected between GY and
other RSA traits.

41
3.5.3 QTL analysis for RSA features and agronomic traits
The results of AM analysis are reported in Table 3 and in Supplementary Table 1. QTLs are
reported ordered according to their map position. In total, we identified 10 QTLs for SRA, 11 for
PRL, 10 for ARL, 8 for TRL, 4 for TRN and 5 for SL. Among these 48 QTLs, 15 overlapped with
QTLs for agronomic traits. Among these 15 QTLs, three (i.e., QARL1-2A, QSRA4-6A and QSRA6-
6B) were significant at marker-wise significance level of P < 0.001 (-log10 > 3.0), while the other
12 were significant at the marker-wise significance level of P < 0.01 (-log10 > 2.0); none of these
QTLs exceeded the experiment-wise threshold computed based on the Bonferroni’s correction, a
highly conservative approach as to Type I error. The QTLs described hereafter are identified
according to the RSA traits for which the QTLs were detected; in case the same QTL affected more
than one RSA trait, the QTL is named after the trait showing the highest P value. The overlap with
QTLs for GY, TW, TKW, KPSM, PH and PdL is also reported.
For the sake of clarity, we wish to point out that whenever the relative effects of RSA-QTL alleles
on root traits were positively or negatively associated to the effects on grain yield and other
agronomic traits, these concurrent effects are defined as “congruent” and “contrasting”,
respectively.
3.5.4 QTLs for seminal root angle
Among the 15 QTLs that overlapped with SRA-QTLs, six were identified for SRA on
chromosomes 1B, 3A, 4B, 6A and 6B, with R2 values ranging from 4.59% (QSRA5-6B) to 7.74%
(QSRA4-6A). None of these QTLs for SRA co-located with QTLs for other RSA features measured
in this study. Among these six SRA-QTLs, three (QSRA3-4B, QSRA5-6B and QSRA6-6B) co-located
with GY-QTLs in at least two environments, while QSRA1-1B co-located with GY-QTLs in one
environment only. QSRA3-4B co-located with GY-QTLs in three environments (two LYEs and one
MYE), in LYEM
, MYEsM
and GMEs; notably, the effects estimated for GY were congruent with
those estimated for SRA. QSRA5-6B co-located with GY in two HYEs; the effects estimated for GY
congruent with those estimated fof SRA. QSRA6-6B co-located with GY in two environments (one
LYE and one HYE) and in HYEsM
; in this case, the allelic effects for SRA and GY were congruent
in one HYE and HYEsM
but contrasting in the LYE.
Considering GY components (i.e., TKW and KPSM), four out of the six SRA-QTLs (all except
QSRA1-1B and QSRA2-3A) co-located with QTLs for at least one of these traits in two or more
environments. In detail, QSRA3-4B co-located with KPSM in one MYE (with contrasting effects in
comparison with SRA) and in LYEsM
, with an affect congruent with SRA; moreover, the same

42
QTL co-located also with TKW in one HYE, with an effect in contrast with SRA. QSRA4-6A co-
located with TKW in five environments (one LYE, two MYEs and two HYEs) as well as with
TKW in LYEsM
and HYEs, all showing effects congruent with those on TKW and SRA. QSRA5-6B
co-located with TKW in LYEsM
with a consistent effect for TKW and SRA; even though this QTL
overlapped with LYEsM
only, it is noteworthy because its effects on the mean of five environments
suggests a more prominent role for this QTL. QSRA6-6B overlapped with QTLs for KPSM in one
LYE and in one MYE, both of which showed contrasting effects as compared to SRA.
Considering the other agronomic traits, two RSA-QTLs appear particularly interesting for their co-
location with QTLs for TW, a trait closely related to grain quality and to starch accumulation
capacity in the final phase of grain filling in durum wheat. QSRA1-1B co-located with TW-QTLs in
four environments (one LYE, one MYE and two HYEs), all with contrasting effects as compared to
SRA except for one HYE (Itl1-r04), where consistent effects were noted, Additionally, this QTL
influenced GY in one LYE, with contrasting effects as compared to SRA. Moreover, QSRA2-3A
influenced TW in three environments, two MYEs (with effects congruent with SRA) and one HYE
(with an effect contrasting with that on SRA). QSRA4-6A influenced TW in one LYE and in LYEsM
,
with contrasting effects with those on SRA in both cases. In two MYEs, TW was influenced also by
QSRA5-6B, in both cases with congruent effects on TW.
Finally, two SRA-QTLs co-located with QTLs for morphological traits at the adult stage of the
plants in the field. QSRA3-4B influenced PH in three environments (two HYEs and one MYE) and
in HYEsM
, in all cases with contrasting effects on PH. Moreover, QSRA3-4B influenced PdL in the
least productive LYE (Spn2-r05), also in this case with an effect in contrast to those on SRA.
QSRA6-6B showed contrasting effects on PdL in three environments (one LYE, one MYE and one
HYE).
3.5.5 QTLs for total root number
Two QTLs for TRN (QTRN1-3A and QTRN2-4B) overlapped with QTLs for agronomic traits.
QTRN1-3A (R2 = 5.10%) co-located with KPSM-QTLs in eight environments (four HYEs, three
MYEs and one LYE) as well as in HYEsM
, MYEsM
and in GMEs, in all cases with effects
congruent with those on TRN. Moreover, QTRN1-3A co-located with TKW-QTLs in five
environments (four HYEs and one MYE) and in HYEsM
, in all cases with contrasting effects as
compared to those on TRN. QTRN1-3A co-located also with TW-QTLs in two environments (one
HYE and one MYE with contrasting and congruent effects, respectively) and in HYEsM
(with
contrasting effects). Finally, it overlapped with PH-QTLs in six environments (four HYEs and two

43
MYEs) and with PdL-QTLs in two environments (one MYE and one HYE), in all cases with
contrasting effects
QTRN2-4B (R2 = 5.59%) co-located with TKW-QTLs in two HYEs (with contrasting effects) and
one MYE (with congruent effects). QTRN2-4B co-located also with KPSM-QTLs in three
environments (with contrasting effecst in two MYEs and congruent effects in one HYE). QTRN2-4B
also co-located with a GY-QTL in one HYE environment, with contrasting effects.
3.5.6 QTLs for primary, total and average root length
Among the six QTLs that were identified, two (QARL1-2A and QPRL2-2B) co-located for PRL,
TRL and ARL (the identification acronym was attributed based on the trait with the highest R2
value), while the other four QTLs were specific for only one of these RSA traits. QARL1-2A was
identified on chr. 2A, with R2 values of 9.41% for ARL, 7.33% for TRL and 5.56% for PRL. In all
cases, the reference allele showed negative effects for these RSA traits. QARL1-2A influenced
KPSM in seven environments (three LYEs, two MYEs and two HYEs) and in GMEs, in all cases
with congruent effects. Moreover, QARL1-2A co-located with TW-QTLs in two environments (one
LYE and one MYE), in MYEsM
and in GMEs, in both cases with contrasting effects. QPRL2-2B
was detected on chr. 2B, with R2 values equal to 5.83% for PRL, 5.25% for ARL and 4.21% for
TRL. This QTL showed a congruent effect on GY in one LYE and a small contrasting effect in one
HYE. It co-located also with TW-QTLs in two HYEs, in MYEsM
and in GMEs, always with
congruent effects.
Considering the scored RSA traits, PRL was influenced by QPRL1-1B and QPRL3-4A with R2
values of 6.18 and 4.47%, respectively, both showing congruent effects. QPRL1-1B co-located with
TW-QTLs in LYEsM
(with a consistent effect) as well as in HYEsM
and in GMEs (in both cases
with contrasting effects). QPRL3-4A co-located with KPSM-QTLs in two environments (one HYE
and one MYE, both with consistent effects) and with TKW-QTLs in the same HYE (Itl2-r04) with
contrasting effects.
As to TRL, QTRL1-6B (R2 = 5.32%) co-located with a GY-QTL in GMEs (with a consistent effect)
and with a TKW-QTL in LYEM
(with a contrasting effect). Moreover, it co-located with KPSM-
QTLs in one MYE and in MYEsM
, in both cases with consistent effects. It co-located also with PH-
QTLs in three environments as well as in MYEsM
, HYEsM
and GMEs, and with PdL-QTLs in four
environments, HYEsM
and GMEs. At this QTL, the reference allele negatively affected both PH and
PdL while affecting positively TRL.
44
As to ARL, QARL2-7B (R2 = 4.67%) co-located with TKW in four environments (one LYE, two
MYEs and one HYE), with contrasting effects; moreover, QARL2-7B co-located with TW in two
environments (one LYE with a consistent effect and one MYE with a contrasting effect). It co-
located also with KPSM-QTLs in one HYE, in MYEsM
and in GMEs, in all cases with effects
consistent with those on ARL. Finally, it co-located with one PdL-QTL in LYEsM
, showing a
contrasting effect.
3.5.7 QTLs for shoot length
Only one QTL identified for SL co-located with agronomic traits. QSL1-3A (R2 = 4.14%) co-
located with TW-QTLs in one HYE and in GMEs, showing consistent positive effects in both cases,
but contrasting with SL effect. Additionally, QSL1-3A co-located with QTLs for KPSM and TKW
in one HYE, with a contrasting effect on SL, and a congruent one on TKW.
3.6 DISCUSSION
A valuable feature of the panel of genotypes evaluated in this study is their limited range in heading
time as previously reported (Maccaferri et al. 2011). Limited variability in phenology is of utmost
importance for a meaningful interpretation of studies to investigate the role of drought-adaptive
features on field performance across environments characterized by large variability in soil moisture
during the reproductive stage, a factor that plays a key role in setting yield potential particularly in
Mediterranean environments (Araus et al. 2003a, b; Garcia del Moral et al. 2003; Royo et al. 2010).
3.6.1 Phenotypic variation for RSA traits
A number of approaches/techniques have been developed for the description of RSA in controlled
environments at different levels of throughput and cost (Tuberosa et al. 2002; Sanguineti et al.
2007; Nagel et al. 2009; Zhu et al. 2011; Grossman and Rice 2012; Pacheco Villalobos and Hardtke
2012; Postma and Lynch 2012; Bai et al. 2013; Lavenus et al. 2013; Watt et al. 2013; Wasson et al.
2014). The approach utilized herein allows for a reasonably rapid and accurate phenotyping of RSA
in hundreds of plants, as usually required by any QTL study.
With the exception of TRN, the durum accessions tested herein have shown a range of variation
(from two up to three fold in magnitude) and repeatability (from 48.6 % for PRL to 72.8 % for
SRA) for RSA traits that appears suitable for further investigation. These results are particularly
noteworthy considering that the tested materials are mainly elite cultivars that usually explore only
a limited portion of the variability present in the genepool available for each species. The variability

45
found for RSA features may to a certain extent reflect the adaptive value of such features for the
environmental conditions prevailing in the original selection sites of each cultivar. Therefore, this
experimental material provides further opportunities for dissecting RSA complexity and its possible
functional role in field performance and grain yield plasticity of durum wheat.
3.6.2 Correlation among RSA features and agronomic traits
Overall, the correlations between RSA features and agronomic traits were very low, not at all
unexpectedly in consideration that RSA data were measured at a very early stage and in growing
conditions unable to properly mimic soil conditions, hence unable to account for RSA plasticity and
its adaptive role for grain yield (GY) in the field. This notwithstanding, once the variability of
phenotypic values was dissected at the QTL level, the analysis of RSA data and agronomic
performance has revealed several concurrent QTL effects on RSA, GY and other agronomic traits.
Other studies conducted in maize (Landi et al. 2007, 2010) and rice (Steele et al. 2007; Uga et al.
2013) grown under controlled conditions have revealed sizeable, concurrent effects of QTLs for
RSA features on GY and other agronomic traits evaluated under field conditions, thus providing
valuable opportunities for genomics-assisted breeding approaches, like in the case of rice (Steele et
al. 2006).
Among the investigated root traits, SRA was negatively correlated with TKW and TW, a result
possibly due to the influence of root angle on root distribution in soil layers, hence on water uptake
from deeper soil horizons (Manschadi et al. 2010; Lynch 2013; Lynch et al. 2014). SRA was also
correlated with both KPSM (positive association) and TKW (negative association) in MYEsM
,
HYEsM
and GMEs. These findings account for the lack of association of SRA with GY since a
counterbalancing effect between the two main yield components inevitably leads to a lack of
significant effects of such variability on GY itself.
The positive, albeit low, correlation observed between TRN and GY in LYEsM
and also GMEs
suggests a beneficial adaptive role of TRN on GY in environments with low yield potential due to
unfavorable growth conditions, consistently with the study conducted by Liu et al. (2013) on RSA
traits and GY in wheat at two different water regimes. Notably, among the RSA features herein
investigated TRN was the trait with the highest correlation with GY. These results could be ascribed
to the fact that a higher number of seminal roots provide greater early vigor a trait known to be
particularly crucial for enhancing water uptake in drought-prone environments (Blum 1996;
Richards 2006, 2008; Reynolds and Tuberosa 2008). It is noteworthy that in the study conducted by
Liu et al. (2013), focusing on RSA traits and GY at two different water regimes, TRN was the trait

46
with the highest correlation with GY. Accordingly, we observed a positive correlation between SL
and PH in MYEsM
, HYEsM
and GMEs, a result that further underlines the importance of early
seedling growth on yield performance of wheat.
3.6.3 QTL analysis for RSA features and agronomic traits
The large number of QTLs (48 in total) for RSA features evidenced in our study underlines the
complexity of the genetic control of these traits already at an early growth stage. Previous QTL
studies conducted on the same set of genotypes considered herein have revealed striking differences
as to the role of specific QTLs on specific traits when the genetic dissection was based upon
biparental mapping (Maccaferri et al. 2008; Graziani et al. 2014) and association mapping
(Maccaferri et al. 2011). Therefore, a more exhaustive search for novel haplotypes governing RSA
traits in durum wheat should deploy larger and more genetically diverse panels as well as biparental
mapping populations, preferably derived from non-elite materials such as landraces and wild
relatives (e.g., emmer wheat and T. dicoccoides) more likely to carry novel alleles for RSA features
conferring adaptation to water-limited conditions. The use of high density SNP maps (Trebbi et al.
2011; Van Poecke et al. 2013; Maccaferri et al. 2014a, b) coupled with sequencing information will
facilitate the identification of novel haplotypes and in some case may also provide valuable clues on
the possible candidates underlying root phenotypes. Along this line, the high LD of elite durum
wheat germplasm (Maccaferri et al.
2005, 2006) does not allow for meaningful speculation on the possible role of genes syntenic to
candidates that have been suggested to control RSA features in other cereals.
Approximately, 30 % (15/48) of the SRA–QTLs concurrently affected agronomic traits including
also GY and/or its main components, thus providing circumstantial albeit valuable evidence as to
the implications of RSA variability at an early growth stage on the field performance of durum
wheat.
The RSA trait with the most extensive overlap with agronomic performance was SRA, a feature of
particular interest in both durum and bread wheat as recently highlighted by Christopher et al.
(2013) since the angle of roots at their emergence from the seeds could be a valuable proxy for
rooting depth (Kato et al. 2006; Wasson et al. 2012). Accordingly, modeling of RSA features
suggests that a narrow angle of wheat roots could lead, in general, to deeper root growth and higher
yields (de Dorlodot et al. 2007; Manschadi et al. 2008; Wasson et al. 2012; Lynch 2013). In the
present study, considering the results obtained for the single QTLs, the relationship between GY,
GY component traits and SRA varied according to the level of yield potential of each particular

47
location, consistently with the findings of Christopher et al. (2013) in bread wheat, thus indicating
that the optimal root angle ideotype is likely to vary according to the target environment. Other
studies have underlined the specificity of the response of GY to RSA features in different
environments. As reported by Wasson et al. (2012), in wheat, the same RSA features led to
markedly different GY responses according to the environment in which those materials were first
selected and then cultivated (Oyanagi et al. 1993; Manschadi et al. 2008). Therefore, if
experimental evidence suggests that SRA in seedlings might be closely related to adult plant rooting
depth, the field conditions in which the crop is grown determine the final performance in a given
environment (White and Kirkegaard 2010; Wasson et al. 2012). In the present study, the six QTL
regions that influenced SRA and agronomic performance showed contrasting relationships as to the
effects of SRA on GY and its components. Contrasting effects of a specific drought-adaptive QTL
on GY as a function of different environmental conditions have been previously reported and the
underlying reasons critically discussed (Collins et al. 2008). In this respect, particularly noteworthy
is the case of QSRA6-6B, where SRA and GY effects were negatively associated in Spn2-r05, a
LYE devoid of moisture in the superficial soil horizon (Maccaferri et al. unpublished) usually more
massively explored by root systems with a wider SRA. Conversely, SRA and GY effects at QSRA6-
6B were positively associated in HYEsM
, possibly due to the fact that shallow roots have been
shown to more effectively acquire mobile and immobile nutrients that in fertile soils tend to be
more abundant in topsoil layers (Lynch 2013). Notably, a PH-QTL has been mapped to the same
position in durum wheat (Sanguineti et al. 2007), a finding consistent with the effects of the same
region reported in the present work for PdL, the main component of PH in durum wheat
(Maccaferri et al. 2008). A similar relationship between SRA with GY and TW was observed for
QSRA1-1B, where SRA was negatively related to GY in a LYE and to TW in one environment of
each one of the three yield classes (LYE, MYE, HYE); however, a positive association with the
QTL effects on TW was observed in P3r04, the second highest yielding environment. At the other
four SRA-QTLs the effects on SRA and GY-QTL were positively related. Among these four QTLs,
QSRA3-4B showed a negative association of SRA with PH mainly in HYEs as well as with PdL in
Spn2-r05 a LYE.
Interestingly, QSRA3-4B co-located with a QTL identified by Ren et al. (2012) for root length-
related traits in bread wheat, thus highlighting the importance of this region in governing RSA in
both species and making this QTL a valuable candidate for fine mapping and cloning. In our study,
also QSRA4-6A showed concurrent effects on TKW and SRA, but not on TW in P4r05, the less
yielding environment, and LYEsM
, suggesting again a positive effect of a potentially deeper root

48
systems in extremely poor and dry environments. This hypothesis is further supported by the co-
location of QSRA4-6A with the QTL identified by Kubo et al. (2007) for penetration ability of the
root in deeper soil layers, consistently with the root ideotype proposed by Lynch (2013) as a means
to allow the plant to more effectively explore deeper soil levels and capture higher amounts of soil
moisture.
Among the QTLs detected for RSA traits and overlapping with agronomic features, six were related
to root length. In general, at these QTLs a positive association between root length and agronomic
performance was observed, mainly in environments with lower water availability.
3.7 CONCLUSIONS
Notwithstanding the critical role played by roots on the agronomic performance of wheat, so far
only two studies have addressed the implications of RSA–QTLs of seedlings to field performance in
wheat (Sanguineti et al. 2007; Bai et al. 2013). Our study has unveiled the presence of several novel
RSA–QTLs while highlighting those with concurrent effects also on agronomic traits and yield
under field conditions. Among RSA traits, seminal root angle appears the most promising for
undertaking further studies on the role of RSA on field performance. Based upon the results herein
reported, we have developed biparental RIL populations obtained from the cross of accessions
contrasted for root angle and other RSA features in order to more accurately assess the genetic basis
of RSA in durum wheat and the effects of the most relevant RSA–QTL haplotypes on GY in
different water regimes. Eventually, this information might lead to the identification of RSA loci
worthy of a MAS approach aimed to enhance yield potential and yield stability of durum wheat
grown under different soil moisture conditions.

49
3.8 REFERENCES
Araus JL, Bort J, Steduto P, Villegas D, Royo C (2003a) Breeding cereals for Mediterranean
conditions: ecophysiological clues for biotechnology application. Ann Appl Biol 142:129–141
Araus JL, Villegas D, Aparicio N, del Moral LFG, El Hani S, Rharrabti Y, Ferrio JP, Royo C
(2003b) Environmental factors determining carbon isotope discrimination and yield in durum
wheat under Mediterranean conditions. Crop Sci 43:170–180
Araus JL, Slafer GA, Royo C, Serret MD (2008) Breeding for yield potential and stress adaptation
in cereals. Crit Rev Plant Sci 27:377–412. doi:10.1080/07352680802467736
Bacon MA, Davies WJ, Mingo D, Wilkinson S (2003) Root signals. Roots: the hidden half. Marcel
Dekker Inc, New York, pp 460–471
Bai C, Liang Y, Hawkesford MJ (2013) Identification of QTLs associated with seedling root traits
and their correlation with plant height in wheat. J Exp Bot 64:1745–1753.
doi:10.1093/jxb/ert041
Bengough AG, Gordon DC, Al-Menaie H, Ellis RP, Allan D, Keith R, Thomas WTB, Forster BP
(2004) Gel observation chamber for rapid screening of root traits in cereal seedlings. Plant Soil
262:63–70
Bennett D, Izanloo A, Reynolds M, Kuchel H, Langridge P, Schnurbusch T (2012) Genetic
dissection of grain yield and physical grain quality in bread wheat (Triticum aestivum L.) under
water-limited environments. Theor Appl Genet 125:255–271. doi:10.1007/s00122-012-1831-9
Blum A (1988) Breeding for stress environments. CRC Press Inc., Boca Raton
Blum A (1996) Crop responses to drought and the interpretation of adaptation. Plant Growth Regul
20:135–148
Bradbury PJ, Zhang Z, Kroon DE, Casstevens TM, Ramdoss Y, Buckler ES (2007) TASSEL:
software for association mapping of complex traits in diverse samples. Bioinformatics
23:2633–2635. doi:10.1093/bioinformatics/btm308
Christopher J, Christopher M, Jennings R, Jones S, Fletcher S, Borrell A, Manschadi AM, Jordan D,
Mace E, Hammer G (2013) QTL for root angle and number in a population developed from
bread wheats (Triticum aestivum) with contrasting adaptation to water-limited environments.
Theor Appl Genet 126:1563–1574. doi:10.1007/s00122-013-2074-0
Collins NC, Tardieu F, Tuberosa R (2008) Quantitative trait loci and crop performance under abiotic
stress: where do we stand? Plant Physiol 147:469–486. doi:10.1104/pp.108.118117
de Dorlodot S, Forster B, Pages L, Price A, Tuberosa R, Draye X (2007) Root system architecture:
opportunities and constraints for genetic improvement of crops. Trends Plant Sci 12:474–481

50
del Moral LFG, Rharrabti Y, Villegas D, Royo C (2003) Evaluation of grain yield and its
components in durum wheat under Mediterranean conditions: an ontogenic approach. Agron J
95:266–274
Ehdaie B, Whitkus RW, Waines JG (2003) Root biomass, wateruse efficiency, and performance of
wheat-rye translocations of chromosomes 1 and 2 in spring bread wheat ‘Pavon’. Crop Sci
43:710–717
Ehdaie B, Merhaut DJ, Ahmadian S, Hoops AC, Khuong T, Layne AP, Waines JG (2010) Root
system size influences water-nutrient uptake and nitrate leaching potential in wheat. J Agron
Crop Sci 196:455–466. doi:10.1111/j.1439-037X.2010.00433.x
Ersoz ES, Yu J, Buckler ES (2007) Applications of linkage disequilibrium and association mapping.
In: Varshney RK, Tuberosa R (eds) Genomics-assisted crop improvementvol 1: genomics
approaches and platforms, vol 1. Springer, New York, pp 97–120
Fleury D, Jefferies S, Kuchel H, Langridge P (2010) Genetic and genomic tools to improve drought
tolerance in wheat. J Exp Bot 61:3211–3222. doi:10.1093/jxb/erq152
Grando S, Ceccarelli S (1995) Seminal root morphology and coleoptile length in wild (Hordeum
vulgare ssp. spontaneum) and cultivated (Hordeum vulgare ssp. vulgare) barley. Euphytica
86:73–80
Graziani M, Maccaferri M, Royo C, Salvatorelli F, Tuberosa R (2014) QTL dissection of yield
components and morphophysiological traits in a durum wheat elite population tested in
contrasting thermo-pluviometric conditions. Crop and Pasture Science 65:80–95
Grossman JD, Rice KJ (2012) Evolution of root plasticity responses to variation in soil nutrient
distribution and concentration. Evol Appl 5:850–857. doi:10.1111/j.1752-4571.2012.00263.x
Hammer GL, Dong ZS, McLean G, Doherty A, Messina C, Schusler J, Zinselmeier C, Paszkiewicz
S, Cooper M (2009) Can changes in canopy and/or root system architecture explain historical
maize yield trends in the US Corn Belt? Crop Sci 49:299–312.
doi:10.2135/cropsci2008.03.0152
Hochholdinger F, Tuberosa R (2009) Genetic and genomic dissection of maize root development
and architecture. Curr Opin Plant Biol 12:172–177. doi:10.1016/j.pbi.2008.12.002
Kato Y, Abe J, Kamoshita A, Yamagishi J (2006) Genotypic variation in root growth angle in rice
(Oryza sativa L.) and its association with deep root development in upland fields with different
water regimes. Plant Soil 287:117–129. doi:10.1007/s11104-006-9008-4
Kubo K, Elouafi L, Watanabe N, Nachit MM, Inagaki MN, Iwama K, Jitsuyama Y (2007)
Quantitative trait loci for soil-penetrating ability of roots in durum wheat. Plant Breed 126:375–

51
378
Landi P, Sanguineti MC, Liu C, Li Y, Wang TY, Giuliani S, Bellotti M, Salvi S, Tuberosa R (2007)
Root-ABA1 QTL affects root lodging, grain yield, and other agronomic traits in maize grown
under well-watered and water-stressed conditions. J Exp Bot 58:319–326
Landi P, Giuliani S, Salvi S, Ferri M, Tuberosa R, Sanguineti MC (2010) Characterization of root-
yield-1.06, a major constitutive QTL for root and agronomic traits in maize across water
regimes. J Exp Bot 61:3553–3562. doi:10.1093/jxb/erq192
Lavenus J, Goh T, Roberts I, Guyomarc’h S, Lucas M, De Smet I, Fukaki H, Beeckman T, Bennett
M, Laplaze L (2013) Lateral root development in Arabidopsis: fifty shades of auxin. Trends
Plant Sci 18:455–463. doi:10.1016/j.tplants.2013.04.006
Lilley JM, Kirkegaard JA (2007) Seasonal variation in the value of subsoil water to wheat:
simulation studies in southern New South Wales. Aust J Agric Res 58:1115–1128.
doi:10.1071/ar07046
Liu X, Li R, Chang X, Jing R (2013) Mapping QTLs for seedling root traits in a doubled haploid
wheat population under different water regimes. Euphytica 189:51–66. doi:10.1007/s10681-
012-0690-4
Lobet G, Pages L, Draye X (2011) A novel image-analysis toolbox enabling quantitative analysis of
root system architecture. Plant Physiol 157:29–39. doi:10.1104/pp.111.179895
Loss SP, Siddique KHM (1994) Morphological and physiological traits associated with wheat yield
increases in Mediterranean environments. Adv Agron 52:229–276. doi:10.1016/s0065-
2113(08)60625-2
Lynch JP (2013) Steep, cheap and deep: an ideotype to optimize water and N acquisition by maize
root systems. Ann Bot 112:347–357. doi:10.1093/aob/mcs293
Lynch JP, Chimungu JG, Brown KM (2014) Root anatomical phenes associated with water
acquisition from drying soil: targets for crop improvement. J Exp Bot. doi:10.1093/jxb/eru162
Maccaferri M, Sanguineti MC, Noli E, Tuberosa R (2005) Population structure and long-range
linkage disequilibrium in a durum wheat elite collection. Mol Breed 15(3):271–289.
doi:10.1007/s11032-004-7012-z
Maccaferri M, Sanguineti MC, Natoli V, Ortega JLA, Salem MB, Bort J, Chenenaoui C, De
Ambrogio E, del Moral LG, De Montis A, El-Ahmed A, Maalouf F, Machlab H, Moragues M,
Motawaj J, Nachit M, Nserallah N, Ouabbou H, Royo C, Tuberosa R (2006) A panel of elite
accessions of durum wheat (Triticum durum Desf.) suitable for association mapping studies.
Plant Genet Resour 4:79–85. doi:10.1079/PGR2006117

52
Maccaferri M, Sanguineti MC, Corneti S, Ortega JLA, Ben Salem M, Bort J, DeAmbrogio E, del
Moral LFG, Demontis A, El-Ahmed A, Maalouf F, Machlab H, Martos V, Moragues M,
Motawaj J, Nachit M, Nserallah N, Ouabbou H, Royo C, Slama A, Tuberosa R (2008)
Quantitative trait loci for grain yield and adaptation of durum wheat (Triticum durum Desf.)
across a wide range of water availability. Genetics 178:489–511.
doi:10.1534/genetics.107.077297
Maccaferri M, Sanguineti MC, Mantovani P, Demontis A, Massi A, Ammar K, Kolmer JA,
Czembor JH, Ezrati S, Tuberosa R (2010) Association mapping of leaf rust response in durum
wheat. Mol Breed 26:189–228. doi:10.1007/s11032-009-9353-0
Maccaferri M, Sanguineti MC, Demontis A, El-Ahmed A, del Moral LG, Maalouf F, Nachit M,
Nserallah N, Ouabbou H, Rhouma S, Royo C, Villegas D, Tuberosa R (2011) Association
mapping in durum wheat grown across a broad range of water regimes. J Exp Bot 62:409–438.
doi:10.1093/jxb/erq287
Maccaferri M, Cane MA, Salvi S, Noli E, Colalongo C,Massi A, Clarke F, Pozniak C, Korol A,
Fahima T, Dubcovsky J, Xu S, Karsai I, Knox R, Clarke J, Tuberosa R (2014a) A consensus
framework map of durum wheat (Triticum durum Desf.) suitable for linkage disequilibrium
analysis and genome-wide association mapping. BMC Genomics 15:873
Maccaferri M, Ricci A, Salvi S, Milner SG, Noli E, Martelli PL, Casadio R, Akhunov E, Scalabrin
S, Vendramin V, Ammar K, Blanco A, Desiderio F, Distelfeld A, Dubcovsky J, Fahima T, Faris
J, Korol A, Massi A, Mastrangelo AM, Morgante M, Pozniak C, N’Diaye A, Xu S, Tuberosa R
(2014b) A high-density, SNP-based consensus map of tetraploid wheat as a bridge to integrate
durum and bread wheat genomics and breeding. Plant Biotechnol J. doi:10.1111/pbi.12288
Manschadi AM, Christopher J, Devoil P, Hammer GL (2006) The role of root architectural traits in
adaptation of wheat to water-limited environments. Funct Plant Biol 33:823–837
Manschadi AM, Hammer GL, Christopher JT, deVoil P (2008) Genotypic variation in seedling root
architectural traits and implications for drought adaptation in wheat (Triticum aestivum L.).
Plant Soil 303:115–129. doi:10.1007/s11104-007-9492-1
Mantovani P, Maccaferri M, Sanguineti MC, Tuberosa R, Catizone I, Wenzl P, Thomson B, Carling
J, Huttner E, DeAmbrogio E, Kilian A (2008) An integrated DArT-SSR linkage map of durum
wheat. Mol Breed 22: 629–648
Manschadi AM, Christopher JT, Hammer GL, Devoil P (2010) Experimental andmodelling studies
of drought-adaptive root architectural traits in wheat (Triticum aestivum L.). Plant Biosyst
144:458–462. doi:10.1080/11263501003731805

53
Massman J, Cooper B, Horsley R, Neate S, Dill-Macky R, Chao S, Dong Y, Schwarz P, Muehlbauer
GJ, Smith KP (2011) Genome-wide association mapping of Fusarium head blight resistance in
contemporary barley breeding germplasm. Mol Breed 27:439–454. doi:10.1007/s11032-010-
9442-0
Mathews KL, Malosetti M, Chapman S, McIntyre L, Reynolds M, Shorter R, van Eeuwijk F (2008)
Multi-environment QTL mixed models for drought stress adaptation in wheat. Theor Appl
Genet 117:1077–1091. doi:10.1007/s00122-008-0846-8
Munns R, James RA, Sirault XRR, Furbank RT, Jones HG (2010) New phenotyping methods for
screening wheat and barley for beneficial responses to water deficit. J Exp Bot 61:3499–3507.
doi:10.1093/jxb/erq199
Nagel KA, Kastenholz B, Jahnke S, Van Dusschoten D, Aach T, Muehlich M, Truhn D, Scharr H,
Terjung S, Walter A, Schurr U (2009) Temperature responses of roots: impact on growth, root
system architecture and implications for phenotyping. Funct Plant Biol 36:947–959.
doi:10.1071/fp09184
Obara M, Tamura W, Ebitani T, Yano M, Sato T, Yamaya T (2010) Fine-mapping of qRL6.1, a
major QTL for root length of rice seedlings grown under a wide range of NH4+ concentrations
in hydroponic conditions. Theor Appl Genet 121:535–547. doi:10.1007/s00122-010-1328-3
Oyanagi A, Nakamoto T, WadaM(1993) Relationship between root-growth angle of seedlings and
vertical-distribution of roots in the field in wheat cultivars. Jpn J Crop Sci 62:565–570
Pacheco-Villalobos D, Hardtke CS (2012) Natural genetic variation of root system architecture
from Arabidopsis to Brachypodium: towards adaptive value. Philos Trans R Soc Biol Sci
367:1552–1558. doi:10.1098/rstb.2011.0237
Passioura JB (2002) Environmental biology and crop improvement. Funct Plant Biol 29:537–546.
doi:10.1071/fp02020
Passioura JB, Angus JF (2010) Improving productivity of crops in water-limited environments. Adv
Agron 106:37–75. doi:10.1016/s0065-2113(10)06002-5
Postma JA, Lynch JP (2012) Complementarity in root architecture for nutrient uptake in ancient
maize/bean and maize/bean/squash polycultures. Ann Bot 110:521–534.
doi:10.1093/aob/mcs082
Pritchard JK, Stephens M, Rosenberg NA, Donnelly P (2000) Association mapping in structured
populations. Am J Hum Genet 67:170–181
Ren Y, He X, Liu D, Li J, Zhao X, Li B, Tong Y, Zhang A, Li Z (2012) Major quantitative trait loci
for seminal root morphology of wheat seedlings. Mol Breed 30:139–148. doi:10.1007/s11032-
54
011-9605-7
Reynolds M, Tuberosa R (2008) Translational research impacting on crop productivity in drought-
prone environments. Curr Opin Plant Biol 11:171–179. doi:10.1016/j. pbi.2008.02.005
Richards RA (2006) Physiological traits used in the breeding of new cultivars for water-scarce
environments. Agric Water Manag 80:197–211. doi:10.1016/j.agwat.2005.07.013
Richards RA (2008) Genetic opportunities to improve cereal root systems for dryland agriculture.
Plant Prod Sci 11:12–16
Royo C, Maccaferri M, Alvaro F, Moragues M, Sanguineti MC, Tuberosa R, Maalouf F, del Moral
LFG, Demontis A, Rhouma S, Nachit M, Nserallah N, Villegas D (2010) Understanding the
relationships between genetic and phenotypic structures of a collection of elite durum wheat
accessions. Field Crops Res 119:91–105. doi:10.1016/j.fcr. 2010.06.020
Sanguineti MC, Li S, Maccaferri M, Corneti S, Rotondo F, Chiari T, Tuberosa R (2007) Genetic
dissection of seminal root architecture in elite durum wheat germplasm. Ann Appl Biol
151:291–305. doi:10.1111/j.1744-7348.2007.00198.x
Sharma S, Xu S, Ehdaie B, Hoops A, Close TJ, Lukaszewski AJ, Waines JG (2011) Dissection of
QTL effects for root traits using a chromosome arm-specific mapping population in bread
wheat. Theor Appl Genet 122:759–769. doi:10.1007/s00122-010-1484-5
Sorrells ME, Yu J (2009) Linkage disequilibrium and association mapping in the Triticeae. Genet
Genomics Triticeae 7:655–683. doi:10.1007/978-0-387-77489-3_22
Steele KA, Price AH, Shashidhar HE, Witcombe JR (2006) Marker-assisted selection to introgress
rice QTLs controlling root traits into an Indian upland rice variety. Theor Appl Genet 112:208–
221
Steele KA, Virk DS, Kumar R, Prasad SC, Witcombe JR (2007) Field evaluation of upland rice
lines selected for QTLs controlling root traits. Field Crops Res 101:180–186
Stich B, Melchinger AE, Frisch M, Maurer HP, Heckenberger M, Reif JC (2005) Linkage
disequilibrium in European elite maize germplasm investigated with SSRs. Theor Appl Genet
111:723–730
Tardieu F, Tuberosa R (2010) Dissection and modelling of abiotic stress tolerance in plants. Curr
Opin Plant Biol 13:206–212. doi:10.1016/j.pbi.2009.12.012
Trebbi D,Maccaferri M, de Heer P, Sorensen A, Giuliani S, Salvi S, Sanguineti MC,Massi A, van
der Vossen EAG, Tuberosa R (2011) High-throughput SNP discovery and genotyping in durum
wheat (Triticum durum Desf.). Theor Appl Genet 123:555–569. doi:10.1007/s00122-011-1607-
7

55
Tuberosa R (2012) Phenotyping for drought tolerance of crops in the genomics era. Front Physiol
3:347. doi:10.3389/fphys.2012.00347
Tuberosa R, Salvi S, Sanguineti MC, Landi P, Maccaferri M, Conti S (2002) Mapping QTLs
regulating morpho-physiological traits and yield: case studies, shortcomings and perspectives
in drought-stressed maize. Ann Bot 89:941–963
Tuberosa R, Salvi S, Giuliani S, Sanguineti MC, Bellotti M, Conti S, Landi P (2007) Genome-wide
approaches to investigate and improve maize response to drought. Crop Sci 47(Supplement
3):S120–S141. doi:10.2135/cropsci2007.04.0001IPBS
Uga Y, Sugimoto K, Ogawa S, Rane J, Ishitani M, Hara N, Kitomi Y, Inukai Y, Ono K, Kanno N,
Inoue H, Takehisa H, Motoyama R, Nagamura Y, Wu J, Matsumoto T, Takai T, Okuno K, Yano
M (2013) Control of root system architecture by DEEPER ROOTING 1 increases rice yield
under drought conditions. Nat Genet 45:1097–1102. doi:10.1038/ng.2725
van Poecke RMP, Maccaferri M, Tang J, Truong HT, Janssen A, van Orsouw NJ, Salvi S,
Sanguineti MC, Tuberosa R, van der Vossen EAG (2013) Sequence-based SNP genotyping in
durum wheat. Plant Biotech J 11:809–817. doi:10.1111/pbi.12072
Wasson AP, Richards RA, Chatrath R, Misra SC, Prasad SVS, Rebetzke GJ, Kirkegaard JA,
Christopher J, WattM(2012) Traits and selection strategies to improve root systems and water
uptake in water-limited wheat crops. J Exp Bot 63:3485–3498. doi:10.1093/jxb/ers111
Wasson AP, Rebetzke GJ, Kirkegaard JA, Christopher J, Richards RA, Watt M (2014) Soil coring at
multiple field environments can directly quantify variation in deep root traits to select wheat
genotypes for breeding. J Exp Bot. doi:10.1093/jxb/eru250
Watt M, Moosavi S, Cunningham SC, Kirkegaard JA, Rebetzke GJ, Richards RA (2013) A rapid,
controlled-environment seedling root screen for wheat correlates well with rooting depths at
vegetative, but not reproductive, stages at two field sites. Ann Bot 112:447–455.
doi:10.1093/aob/mct122
White RG, Kirkegaard JA (2010) The distribution and abundance of wheat roots in a dense,
structured subsoil implications for water uptake. Plant Cell Environ 33:133–148.
doi:10.1111/j.1365-3040.2009.02059.x
Yu JM, Pressoir G, Briggs WH, Bi IV, Yamasaki M, Doebley JF, McMullen MD, Gaut BS, Nielsen
DM, Holland JB, Kresovich S, Buckler ES (2006) A unified mixed-model method for
association mapping that accounts for multiple levels of relatedness. Nat Genet 38:203–208.
doi:10.1038/ng1702
Yu G-R, Zhuang J, Nakayama K, Jin Y (2007) Root water uptake and profile soil water as affected

56
by vertical root distribution. Plant Ecol 189:15–30. doi:10.1007/s11258-006-9163-y
Zhu J, Ingram PA, Benfey PN, Elich T (2011) From lab to field, new approaches to phenotyping
root system architecture. Curr Opin Plant Biol 14:310–317. doi:10.1016/j.pbi.2011.03.020

57
FIGURE

58
Fig. 1 Frequency distribution of the RSA traits measured in the collection of 183 elite lines of
durum wheat at the four-leaf growth stage. The red line at the top of each graph represents the
standard deviation calculated on the check cultivar Meridiano. The blue line represents the LSD (P
< 0.05) between accessions
(a) Seminal root angle (SRA, °).
(b) Primary root length (PRL, cm).
(c) Average root length (ARL, cm).
(d) Total root length (TRL, cm).
(e) Total root number (TRN, no.).
(f) Shoot length (SL, cm). (Color figure online)

59
TABLES

60
Table 1 Mean, maximum and minimum values, ANOVA results and repeatability for the RSA
traits and shoot length investigated at the four-leaf stage in seedlings of 183 durum wheat elite
accessions
SRA
(°)
PRL
(cm)
TRL
(cm)
ARL
(cm)
TRN
(no.)
SL
(cm)
Mean 100 21.1 94.6 18.2 5.18 9.70
Max 147 32.9 144.7 26.0 6.46 16.31
Min 48 13.8 52.8 12.0 4.01 7.20
Check (mean
value)(a)
105 20.0 88.6 17.2 5.11 9.82
P accessions (b)
** ** ** ** ** **
P replicates (c)
ns ns ns ns ** **
CV (%) 12.0 17.0 13.0 11.5 6.1 13.0
h2 (%) 72.8 48.6 59.5 61.8 67.0 55.3
LSD (P < 0.05) 18.2 5.8 20.0 3.4 0.51 2.04
SRA seminal root angle, PRL primary root length, TRL total root length, ARL average root length,
TRN total root number, SL shoot length, CV coefficient of variation, h2 repeatability (mean basis),
LSD least significant difference (P < 0.05)
a Meridiano, reference check line
b Significance of the difference between accessions
c Significance of the difference between replicates. ns = non significant
* P < 0.05; ** P < 0.01

61
Table 2 Correlation coefficient values and level of significance between root seminal traits (RSA)
measured at the four leaf stage with the agronomic traits measured in 15 field trials (see ‘‘Materials
and Methods’’), classified according to their average productivity levels, i.e., low, medium and high
yielding environments (LYEsM
, MYEsM
and HYEsM
, respectively), and with the general mean of
environments (GME)
Agronomic traits GY TKW
LYEsM MYEs
M HYEsM GMEs LYEs
M MYEsM HYEs
M GMEs
Correlation values among RSA traits with GY and TKW
RSA traits
SRA [1]a -0.23** [2] -0.21** [3] -0.21*
PRL [1] [1]
TRL [1] [1]
ARL [1]
TRN 0.24**[1] 0.18*
SL [1]
Agronomic traits KPSM TW
LYEsM MYEs
M HYEsM GMEs LYEs
M MYEsM HYEs
M GMEs
Correlation values among RSA traits with KPSM and TW
RSA traits
SRA 0.23** [3] 0.24** [3] 0.23** -0.20*[1] -0.26** [3] [1] -0.22**
PRL [1] [1] [1]
TRL [1]
ARL [1] [1] [1]
TRN 0.18 [1] [1]
SL [1]
Agronomic traits PH PdL
LYEsM MYEs
M HYEsM GMEs LYEs
M MYEsM HYEs
M GMEs
Correlation values among RSA traits with PH and PdL
RSA traits
SRA [1] [1] -0.21*[1] [1] -0.19* [1] -0.20*
PRL [1]
TRL
ARL
TRN
SL 0.19* [1] 0.21** [3] 0.20*
Traits are abbreviated as follows: GY grain yield, TKW thousand kernel weight, KPSM kernels per square mt,
TW test weight, PH plant height, PdL peduncle length, SRA seminal root angle, PRL primary root length,
TRL total root length, ARL average root length, TRN total root number, SL shoot length
a The numbers reported in square brackets indicate in how many environments of each category a significant
correlation was detected

62
Table 3 QTLs with significant concurrent effects on RSA and agronomic traits and number of environments where the association was
significant is reported. Peak positions related to a durum consensus map (see ‘‘Materials and Methods’’ for details)
QTL Trait Marker Chrom. Peak -log10 R2 % effect GY TKW KPSM TW PH PdL
No. envs No. envs No. envs No. envs No. envs No. envs QSRA1-1B SRA wPt-0655-1B 1B 4.4 2.38 5.31 10.17 1 LYE - - 4
(1 LYE,
1MYE,
2HYE)
- -
QPRL1-1B PRL gwm124-1B-a2 1B 109 2.32 6.18 7.91 - - - LYEs, MYEs,
GMEs
- -
QARL1-2A PRL cfa2263-2A-a2 2A 73.7 2.13 5.56 -13.29 - - 7
(3 LYEs, 2
MYEs, 2 HYEs),
GMEs
2 (1 LYE,
1 MYE),
MYEs, GMEs
- MYEs
ARL cfa2263-2A-a2 73.7 3.25 9.41 -13.46 TRL cfa2263-2A-a2 73.7 2.78 7.33 -14.12
QPRL2-2B PRL barc183-2B-a2 2B 67.1 2.88 5.83 -12.80 2 (1 LYE,
1 HYE)
- - 2 HYE,
MYEs, GMEs
- -
ARL barc183-2B-a2 67.1 2.56 5.25 -9.29
TRL barc183-2B-a2 67.1 2.12 4.21 -9.31 QSL1-3A SL wmc388-3A-a2 3A 20.2 2.08 4.14 -5.25 - 1 HYE 1 HYE 1 HYE,
GMEs
- -
QTRN1-3A TRN wmc428-3A-a6 3A 48.4 2.23 5.10 -5.41 - 5 (1 MYE,
4 HYE),
HYEs
8 (1 LYE,
3 MYE, 4
HYE), MYEs,
HYEs,
GMEs
2 (1 MYE,
1 HYE),
HYEs
6 (2 MYE,
4 HYE)
2 (1 MYE,
1 HYE)
QSRA2-3A SRA barc1177-3A-a1 3A 154 2.03 4.86 7.39 - - - 3 (2 MYE,
1 HYE)
- -
QPRL3-4A PRL wPt-2946-4A 4A 88.3 2.19 4.47 10.29 - 1 HYE 2 (1 MYE,
1 HYE)
- - -
QSRA3-4B SRA gwm888-4B-a2 4B 29.6 2.18 4.73 -6.28 3 (2 LYE,
1 MYE),
LYEs, MYEs,
GMEs
1 MYE 1 MYE,
LYEs
- 3 (1 MYE,
2 HYE),
HYEs
1 LYE

63
Table 3 continued … QTL Trait Marker Chrom. Peak -log10 R2 % effect GY TKW KPSM TW PH PdL
No. envs No. envs No. envs No. envs No. envs No. envs QTRN2-4B TRN gwm6-4B-a6 4B 85.4 2.04 5.59 3.54 1 HYE 3 (1 MYE,
2 HYE) 3 (2 MYE, 1 HYE)
- - -
QSRA4-6A SRA gwm427-6A-a4 6A 128 3.13 7.74 -10.00 - 5 (1 LYE, 2 MYE, 2
HYE),
LYEs, HYEs
- 1 LYE, LYEs
- -
QTRL1-6B TRL wPt-7343-6B 6B 14.3 2.13 5.32 6.21 GMEs LYEs 1 MYE, MYEs
- 3 (1 MYE, 2 HYE),
MYEs,
HYEs, GMEs
4 (1 LYE, 1 MYE, 2
HYE),
HYEs, GMEs
QSRA5-6B SRA wPt-6594-6B 6B 21.5 2.31 4.59 6.16 2 HYE LYEs - 2 MYE - -
QSRA6-6B SRA gwm1486-6B-a5 6B 153 3.26 7.43 -8.81 2 (1 LYE,
1 HYE),
HYEs
- 1 LYE - - 3 (1 LYE,
1 MYE,1
HYE),
GEMs
QARL2-7B ARL gwm333-7B-a5 7B 79.1 2.18 4.67 -10.79 4 (1 LYE,
2 MYE, 1
HYE)
1 HYE,
MYEs,
GMEs
2 (1
MYE, 1
LYE)
- LYEs
Traits are abbreviated as follows: GY grain yield, TKW thousand kernel weight, KPSM kernels per square mt, TW test weight, PH plant height,
PdL peduncle length, SRA seminal root angle, PRL primary root length, TRL total root length, ARL average root length, TRN total root number,
SL shoot length
For each agronomic trait, the number (no. envs) and category of environments (i.e., low, medium or high-yielding environment: LYE, MYE
and HYE, respectively) in which the QTL was detected is reported. Additionally, the acronyms LYEs, MYEs, HYEs and GMEs (in bold)
indicate when an RSA QTL co-located with a QTL for agronomic traits based on the analysis of the mean values in low, medium and high-
yielding environments and across all 15 environments, respectively. The allele effect has been computed as detailed in the last sentence of
‘‘Materials and Methods’’

64
CHAPTER 4. LINKAGE MAPPING FOR ROOT SYSTEM ARCHITECTURE
IN DURUM WHEAT MERIDIANO × CLAUDIO MAPPING POPULATION
4.1 ABSTRACT
Root system architecture (RSA) is of great agronomic importance and it has emerged
in recent years as an important focus for plant genetics and breeding study. The
genetic basis of variation for RSA traits were investigated using a population of 176
recombinant inbred lines (RILs) derived from the cross between two Italian elite
durum wheat cvs. Meridiana and Claudio, in order to identify QTLs for RSA and
compare their overlaps with other QTLs identified in other experiments and
environments. The following seedling-stage RSA and seed traits were: seminal root
angle, primary root length, total root length, root number, thousand kernel weight,
shoot length, root and shoot dry weight. The results indicated a wide range of
variation for RSA traits. The largest heritability was observed for thousand kernel
weight (78.6%) and seminal root angle (65.4%). In total, 48 novel QTLs for RSA
traits were identified on all chromosomes, with the exception of chromosome 4A.
Both parents contributed favorable alleles at QTLs. Among the considered RSA traits,
seminal root angle appears the most promising for undertaking further studies on the
role of RSA traits. The most important QTLs for seminal root angle identified in this
study mapped on chromosomes 4B and 6B.
Key words: Durum wheat, Root system architecture, QTL, Linkage mapping

65
4.2 INTRODUCTION
Durum wheat (Triticum turgidum L. var. durum, 2n = 4x = 28; AABB genomes) is an
important crop for the agriculture and economy of Mediterranean countries including
Italy, Spain, France, Greece and the West Asian and North African (WANA)
countries, where this cereal has received special attention as an important commodity
throughout history (Elias and Manthey, 2005; Habash et al. 2009; Azizi et al. 2014).
Throughout its life cycle, root system architecture (RSA) is finely tuned to the
requirements of the whole plant. Roots play several essential roles in the plant life
cycle, including anchoring to the soil, mechanical support to stems, uptake of
nutrients and water, sensing of variation in water and nutrient levels and others
(Osmont et al. 2007; Smith and De Smet, 2012; Orman-Ligeza et al. 2013). Because
of the tight connection between roots and soil, RSA plays a key role in environmental
stress tolerance and are by definition extremely developmentally and physiologically
plastic (Grossman and Rice, 2012). However, RSA traits are also characterized by
constitutive genetic inheritance components which may enable to predict the root
phenotypes based on genetic information. Additionally, in some cases, expression of
RSA at adult plant stage are correlated with RSA at seedling stage, making highly
valuable the genetic information gathered at the seedling stage.
Root system architecture (RSA) is of great agronomic importance and it has emerged
in recent years as an important focus for plant genetics and breeding study. Although
the key impediment to genetic analysis of cereal RSA has been the ability to study
roots in situ, phenotypic observation protocols have been developed for adult plants
under field conditions (Manschadi et al. 2006; Wojciechowski et al., 2009) and, more
frequently, for young and/or adult plants grown in rizothrons under controlled
environmental conditions (Bengough et al. 2004; Sanguineti et al. 2007; Liu et al.,
2013).
Analyses of genetic factors contributing to RSA are however still very limited, partly
because of the difficulty of observing the distribution of roots in field conditions, and
partly because of the complexity of the effects of environmental conditions on root
system architecture. Moreover, field screening is usually destructive and leads to a
substantial loss of the geometry of the root (Nagel et al., 2009). In this respect, it has
been reported that adult geometry of the root is strongly related to seminal root angle
66
(SRA), with deep-rooted wheat genotypes showing a narrower SRA, while genotypes
with a shallower root system tend to grow their SRA wider (Manschadi et al., 2008).
So, given that the trait measured in the early phases of plantlets’ life might determine
the root system later in the season, different systems have been adopted to allow early
screening of high numbers of wheat plantlets for the investigation of RSA traits under
controlled conditions (Zhu et al., 2005; Kubo et al, 2007; Sanguineti et al., 2007;
Nagel et al., 2009; Yang et al., 2010; Ren et al., 2012; Bai et al., 2013; Christopher et
al., 2013; Liu et al., 2013; Wasson et al. 2014). Among others, laboratory-based root
culture systems have been developed to investigate root morphology, mainly at the
seedling stage, e.g. in hydroponic systems, in glass or plastic rizothrons filled with
soil, sand or artificial substrates, and paper systems. The paper culture system
provides a high-throughput screening method to investigate RSA on large scale, albeit
limited to young seedlings (Bai et al., 2013).
Quantitative trait loci (QTL) detection based on high-density molecular markers
genetic maps and association mapping has improved the understanding of the
complex genetic control of cereal root traits. Many of these studies have observed an
overlap between QTL for root traits and those for nutrient uptake and productivity in
maize (Tuberosa et al. 2002), wheat (An et al. 2006) and rice (Steele et al. 2007).
However, for reported wheat QTLs, genome or gene-content sequence data is not
currently available to allow confirmation of any relationship with root QTL in other
crop species.
In common wheat, molecular mapping of root trait QTLs have been reported by a
number of studies (Landjeva et al. 2008; Sharma et al. 2011; Hamada et al. 2012; Ren
et al. 2012; Bai et al. 2013; Christopher et al. 2013; Liu et al. 2013). Collectively,
these studies have demonstrated the presence of multiple QTLs for several major root
traits, such as seminal root angle (SRA), primary root length (PRL), seminal root
number (SRN), maximum root length (MRL), lateral root length (LRL), total root
length (TRL), and root surface area (RSA). Furthermore, it has been generally
realized that the development and morphological characteristics of seminal roots at
seedling stage have important influences on the function of the root system in mature
wheat plants. For example, the number of seminal roots has been found to correlate
strongly with seed size and grain yield (MacKey 1979; Liu et al. 2013) and to

67
contribute significantly to water uptake (Manschadi et al. 2008) in common wheat.
Thus, identifying and analyzing QTLs controlling seminal root traits will likely
provide important information and resources for improving root function and its
contribution to increase wheat yield.
However, the genetic mechanisms controlling root system architecture and function
are still not well understood, especially in durum wheat, which possesses a complex
and unsequenced tetraploid genome. Sanguineti et al. (2007) have reported the first
results about genetic dissection of seminal root architecture in 57 elite durum wheat
germplasm.
In accordance with this realization, we have previously carried out an association
mapping study in 183 durum wheat elite accessions characterized at the seedling
stage, in order to identify QTLs for root system architecture. The QTLs identified
were compared with QTLs detected for grain yield and its component traits, plant
height and peduncle length measured in a previous study where the same accessions
were evaluated in 15 field trials. Out of the 48 QTLs detected for RSA, fifteen
overlapped with QTLs for agronomic traits and/or grain yield in two or more
environments (Canè et al. 2014).
In this study RSA traits were evaluated on the recombinant inbred line (RILs)
population from the cross between the cvs. Meridiano and Claudio as a focus for
studies on root trait architecture in durum wheat in an elite biparental durum wheat
population. This study therefore fully complements the RSA analysis and QTL
mapping efforts based on the germplasm collection and as reported in Chapter 3 (and
Canè et al. 2014).
4.3 MATERIALS AND METHODS
4.3.1 Plant material
The plant material utilized for this study was a population of 176 recombinant inbred
lines (RILs) originally developed in collaboration between University of Bologna and
Società Produttori Sementi (Bologna, Italy), from the cross between the two Italian
elite durum wheat cvs. Meridiano (Simeto/WB881//Duilio/F21) and Claudio
(CIMMYT’ selection/Durango//IS139b/Grazia)(Maccaferri et al. 2011). Both cvs. are
currently extensively cultivated across Southern Europe. Meridiano is a high-yielding

68
early to medium-early heading genotype with broad adaptation, whereas Claudio is
medium-early to medium-late depending on the environments and show good
adaptation to drought areas.
4.3.2 Root system architecture evaluation
In order to study the genetic bases of RSA, durum wheat seedlings were grown in a
randomized complete block design with two replications. The paper culture system at
RSA traits was evaluated according to a protocol first described by Bengough et al.
(2004) then modified by Sanguineti et al. (2007) and improved in the present work. In
particular, for each genotype (RILs), 15 seeds were prepared and weighted exactly.
Then, selected seeds were moved in the pre-germination step, in Petri dishes with a
wet filter paper at 28 °C for 24 h. Then, seven germinated seeds for each genotype
were placed on flat plastic rhizotrons covered with imbibed filter paper where
seedlings were let to grow per one week, in the dark, at constant temperature of 25°C.
Five well developed and homogeneous seedlings were utilized for phenotypic scoring.
Examples of images of the root apparatus are shown in Fig. 1.
Due to the high number of the genotypes under evaluation, the accessions were
operatively divided into sets of 40 accessions each (blocks), in order to be included in
the ANOVA analysis to account for differences among the different sets with two
parents cvs. Meridiano and Claudio parents were also included in every set as checks.
Seventeen root system architecture traits were collected and traits, abbreviations and
explanations are shown in Table 1. All traits were manually measured and/or recorded
by plantlets’ images using the software SmartRoot® (Lobet et al. 2011), after
recording digital images of each seedling.
One of the most important traits that was measured in this study was seminal root
angle (SRA), that is the angle of the root apparatus according to the following:
SRA (rad) = 2* ASIN [ (x/2)/a ]
where x and a measured by SmartRoot software (Fig. 1).
4.3.3 Molecular profiling
Phenotypic data collected from the RILs was subjected to ANOVA, adjusted for
block effects and used as phenotypic data for QTL mapping with the goal of detecting

69
QTL associated between root system architecture traits. In total, 899 markers
including 487 single nucleotide polymorphisms (SNP), 261 diversity array technology
(DArT), 142 simple sequence repeat loci (SSR), and nine additional sequence tagged
site (STS) markers were used for the molecular profiling of the 176 recombinant
inbred lines (RIL) of durum wheat.
The markers were ordered according to a consensus map developed at the University
of Bologna in the framework of an international cooperation for that purpose
(Maccaferri et al. 2014). The mapping population, Meridiano × Claudio (MC RIL,
Maccaferri et al. 2011) was developed by the University of Bologna in collaboration
with Produttori Sementi Bologna SpA (Argelato, BO, Italy). Additional maps
provided by international partners were used to assemble a common consensus map,
used to order the markers available for genotyping the experimental materials herein
presented. A linkage map including 27 linkage groups, for a total length of 2238.16
cM was assembled and marker grouping was performed using the independence LOD
method with LOD threshold range from 2.0 to 10.0 (Maccaferri et al. in preparation).
Mapping analysis were carried out in Joinmap v4.0 and Carthagene softwares.
4.3.4 Statistical analysis and QTL analysis
Frequency distributions of the phenotypic data were inspected to assess the
consistency of data and to investigate the complexity of the genetic control of the
traits. The analysis of variance (ANOVA) for each trait was performed using the
software Genstat V.15. and RIL means were used to calculate Pearson’s correlation
coefficients of RSA traits. Heritability (h2) was calculated on a mean basis across two
replications according to the following:
r
hE
G
G
22
22
where G2 and E
2 represent the genotypic and the environmental components of the
phenotypic variance, respectively, and r the number of replications. Heritability
should be considered as being ‘narrow sense’ because the genetic variance included
only the additive component and, possibly, the additive × additive epistatic interaction
(Sanguineti, et al. 2007).

70
In total, 899 markers (487 SNPs, 261 DARTs, 142 SSRs and 9 STSs) was utilized for
QTL analysis. Single-marker analysis using linear regression, composite interval
mapping (CIM) and multiple interval mapping (MIM) were carried out in Windows
QTL Cartographer version 2.5 (WINQTL) (Wang et al. 2007). Initially, single marker
analysis was used to identify genetic markers significantly associated with phenotypic
traits. Composite interval mapping (CIM) and multiple interval mapping (MIM) were
then used to determine the most likely QTL positions and the LOD threshold for each
trait. Final results from the more precise MIM analysis are reported.
The reported QTLs were identified as having a threshold LOD ≥ 2.0 through
composite, and multiple interval mapping. Confidence intervals of QTL (CL) were
calculated by the following formula (95% CI of each QTL):
CI = 163/(N x R2),
where N is the number of lines in the mapping population and R2 is the percentage of
phenotypic variation explained by the identifyed QTLs (Liu et al. 2009).
4.4 RESULTS
4.4.1 Phenotypic analysis of root system architecture
A large range of variation was observed for all traits among RILs. In detail, TKW and
SRA of the samples, ranged from 39.8 to 63.4 g, with mean value of 48.3 g and 68.3°
to 128.5°, with mean value of 97.9°, respectively. TRL was the trait that showed the
largest range of variation, from 95.8 to 142.39 cm, with a mean value of 122.5 cm and
diamSR indicated the lowest range of variation, from 0.07 to 0.09 cm, with a mean
value of 0.08 cm. Additionally, PRL ranged from 24.7 to 34.5 cm, with a mean value
of 30.7 cm. The treatment effect and genetic variation within the 176 RIL population
for RSA traits are reported in Table 2. Results of ANOVA showed significant
differences among durum wheat RILs for all RSA traits except for SurPR, SurSR,
VolPR and VolSR.
Coefficient of variation (CV) ranged from 5.0% for diamPR to 13.8% for RDW and
heritability values ranged from 11.0% to 78.6% among traits and VolPR and TKW
with the smallest and largest values, respectively (Table 2).

71
4.4.2 Correlations and distributions of the root system architecture traits
The correlation coefficients among RSA traits are reported in Table 3. Many traits
correlated with one another. For conciseness, highly significant and negatively
correlations were detected between TKW and most of the traits, including PRL (r = -
0.45), TRL (r = -0.36), RDW (r = -0.35), SRL (r = -0.33), RSR (r = -0.26) and SL (r =
-0.24). Also SRA showed negative correlation with TKW (r = -0.12).
RSR was high significantly and positively correlated with RDW (r = 0.47) and with
SDW, albeit negatively (r = -0.52). Additionally, highly significant and positively
correlations were identified between SDW and most of the traits, including SL (r =
0.70), RDW (r = 0.51), TRL (r = 0.36), SRL (r = 0.34), PRL (r = 0.30), SurSR (r =
0.26) and SurPR (r = 0.19).
Frequency distributions for RSA traits are shown in Fig. 2. All the RSA traits
exhibited continuous variation in the RIL population with approximately normal
distributions, indicating a polygenic control underlying these traits.
4.4.3 Identification of QTL for root system architecture traits
A total of 899 markers, were mapped to 27 linkage groups with a total map length of
2,238.16 cM. The linkage groups were assigned to durum wheat chromosomes 1A
through to 7B.
For the seventeen RSA traits examined, 48 QTLs were identified using QTL
Cartographer with a LOD score significant at P ≥ 2. The results of QTL detection are
presented in Table 4. In total, we identified 3 QTLs for TKW, 3 for SRA, 3 for TNR,
2 for R6, 3 for PRL, 3 for SRL, 3 for TRL, 2 for diamPR, 3 for diamSR, 3 for SurPR,
3 for SurSR, 3 for VolPR, 3 for VolSR, 3 for SL, 2 for RDW, 3 for SDW and 3 for
RSR. The QTLs were identified on all chromosomes, except chromosome 4A and
more than 38% of these QTLs were located on chromosomes 4B and 7A (21% and
17%, respectively). QTLs for several root traits co-mapped within a 15 cM interval.
According to this, the 48 QTLs were organized into 12 QTL clusters and 36 QTLs for
individual RSA traits. The QTLs belonging to QTL clusters most probably share the
same genetic basis. Both parents contributed favorable alleles to the population, with
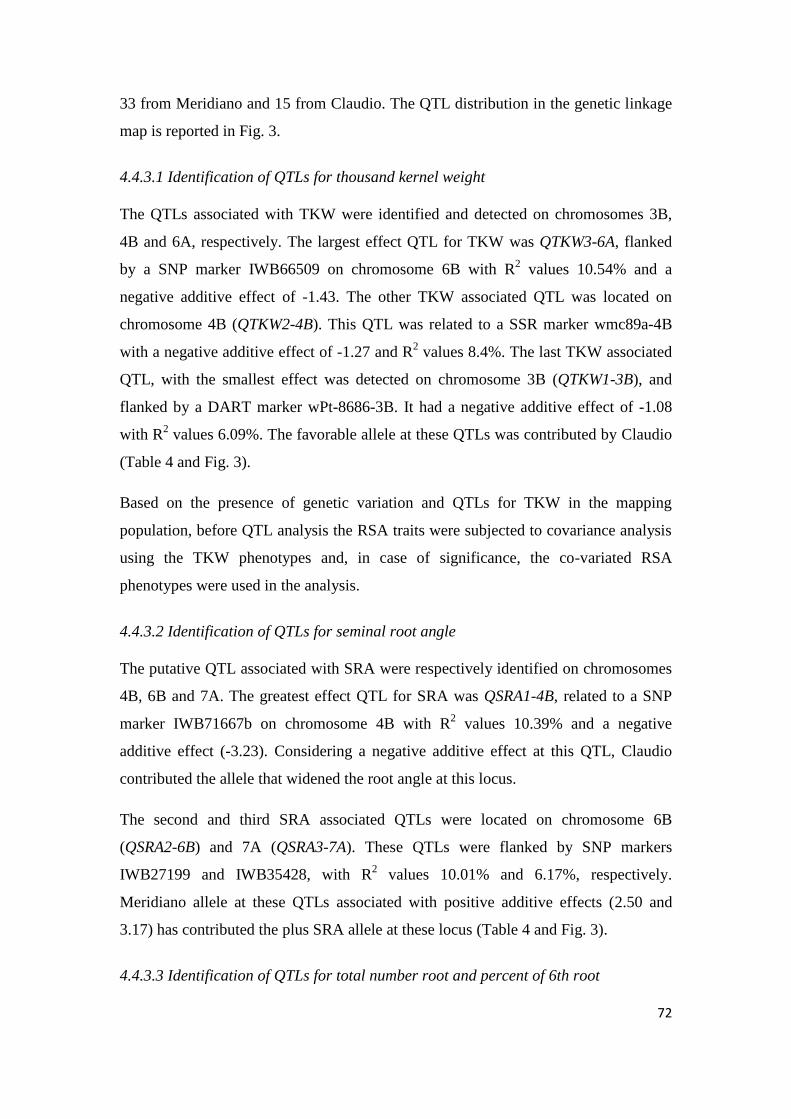
72
33 from Meridiano and 15 from Claudio. The QTL distribution in the genetic linkage
map is reported in Fig. 3.
4.4.3.1 Identification of QTLs for thousand kernel weight
The QTLs associated with TKW were identified and detected on chromosomes 3B,
4B and 6A, respectively. The largest effect QTL for TKW was QTKW3-6A, flanked
by a SNP marker IWB66509 on chromosome 6B with R2 values 10.54% and a
negative additive effect of -1.43. The other TKW associated QTL was located on
chromosome 4B (QTKW2-4B). This QTL was related to a SSR marker wmc89a-4B
with a negative additive effect of -1.27 and R2 values 8.4%. The last TKW associated
QTL, with the smallest effect was detected on chromosome 3B (QTKW1-3B), and
flanked by a DART marker wPt-8686-3B. It had a negative additive effect of -1.08
with R2 values 6.09%. The favorable allele at these QTLs was contributed by Claudio
(Table 4 and Fig. 3).
Based on the presence of genetic variation and QTLs for TKW in the mapping
population, before QTL analysis the RSA traits were subjected to covariance analysis
using the TKW phenotypes and, in case of significance, the co-variated RSA
phenotypes were used in the analysis.
4.4.3.2 Identification of QTLs for seminal root angle
The putative QTL associated with SRA were respectively identified on chromosomes
4B, 6B and 7A. The greatest effect QTL for SRA was QSRA1-4B, related to a SNP
marker IWB71667b on chromosome 4B with R2 values 10.39% and a negative
additive effect (-3.23). Considering a negative additive effect at this QTL, Claudio
contributed the allele that widened the root angle at this locus.
The second and third SRA associated QTLs were located on chromosome 6B
(QSRA2-6B) and 7A (QSRA3-7A). These QTLs were flanked by SNP markers
IWB27199 and IWB35428, with R2 values 10.01% and 6.17%, respectively.
Meridiano allele at these QTLs associated with positive additive effects (2.50 and
3.17) has contributed the plus SRA allele at these locus (Table 4 and Fig. 3).
4.4.3.3 Identification of QTLs for total number root and percent of 6th root

73
Among the five RSA-QTLs that were identified, three (QTNR1-2A, QTNR2-2B and
QTNR3-4B) co-located for TNR, and two (QR6-1-4B and QR6-2-6B) were detected
for R6.
The major QTLs for TNR and R6 were located on chromosome 4B (QTNR3-4B and
QR6-1-4B), flanked by SNP markers IWB72368 and IWB9672 with R2 values of
12.65% and 10.08%, respectively. Considering the positive additive effects of all five
QTLs for TNR and R6, Meridiano contributed the favorable allele among them (Table
4 and Fig. 3). The percentage of plants with the sixth root (R6) varied from 0% (in 49
RILs) to 60% (i.e. presence of the sixth root in 60% of seedlings, on average).
4.4.3.4 Identification of QTLs for primary, seminal and total root length
Out of the nine RSA-QTLs that were detected, three (QPRL1-6A, QPRL2-6B and
QPRL3-7B) co-located for PRL, three (QSRL1-1B, QSRL1-2B and QSRL1-6B) for
SRL and three (QTRL1-1B, QTRL2-3B and QTRL3-4B) for TRL.
The largest effect of QTL for PRL was QPRL2-6B, related to a SSR marker wmc182-
6B on chromosome 6B with R2 value 7.05%. The SRL and TRL associated QTLs
with the greatest effects were located on chromosome 1B (QSRL1-1B and QTRL1-1B)
and flanked by a DART marker wPt-733882-1B with R2 values of 10.25% and
11.85%, respectively. According to the results of additive effects, the favorable alleles
in QPRL2-6B, QSRL1-1B and QTRL1-1B have been contributed by Claudio and the
other QTLs contributed by Meridiano (Table 4 and Fig. 3).
4.4.3.5 QTLs for diameter, surface and volume of primary and seminal roots
Among the RSA-QTLs that were identified, two (QdiamPR1-1A and QdiamPR2-7A)
co-located for diamPR, three (QdiamSR1-1A, QdiamSR2-2A and QdiamSR3-7A) for
diamSR, three (QSurPR1-4B, QSurPR2-6A and QSurPR3-7B) for SurPR, three
(QSurSR1-1B, QSurSR2-4B and QSurSR3-7A) for SurSR, three (QVolPR1-1A,
QVolPR2-6A and QVolPR3-7A) for VolPR and three (QVolSR1-1B, QVolSR2-4B and
QVolSR3-7A) for VolSR.
The diamPR and diamSR associated QTLs with the highest effects were located on
chromosome 1A (QdiamPR1-1A) and 7A (QdiamSR3-7A) with R2 values of 9.02%

74
and 8.79%, respectively. The favorable alleles of all QTLs associated with diamPR
and diamSR were contributed by Meridiano.
The SurPR and SurSR associated QTLs with the largest effects were located on
chromosome 6A (QSurPR2-6A) and 1B (QSurSR1-1B) with R2 values of 7.49% and
11.65%, respectively. Except in, QSurSR1-1B that had a negative additive effect by
Claudio, the favorable alleles in the other QTLs associated with SurPR and SurSR
were contributed by Meridiano.
The VolPR and VolSR associated QTLs with the greatest effects were located on
chromosome 7A (QVolPR3-7A and QVolSR3-7A) and flanked by a SNP marker
IWB73246 with R2 values of 6.51% and 10.99%, respectively. Except in QVolSR1-1B
that had a negative additive effect by Claudio, the favorable alleles in the other QTLs
associated with VolPR and VolSR were contributed by Meridiano (Table 4 and Fig.
3).
4.4.3.6 QTLs for shoot length
The QTLs associated with SL were identified and detected respectively on
chromosomes 3A, 4B and 7A. The largest effect QTL for SL was QSL2-4B, related to
a SNP marker IWB70674 on chromosome 4B with a positive additive effect of 0.32
and R2 values 13.52%. The favorable allele at this QTL was contributed by
Meridiano.
The second and third SL associated QTLs were located on chromosome 3A (QSL1-
3A) and 7A (QSL3-7A). These QTLs were related by a SSR marker wmc505-3A and a
SNP marker IWB73857 with R2 values 9.16% and 6.56%, respectively. The Claudio
allele at these QTLs associated with negative additive effects (-0.27 and -0.22) and
contributed the favorable allele (Table 4 and Fig. 3).
4.4.3.7 QTLs for root and shoot dry weight and root shoot ratio
Among of the considering RSA-QTLs that were detected, two (QRDW1-6A and
QRDW2-7B) co-located for RDW, three (QSDW1-4B, QSDW2-5A and QSDW3-5B)
for SDW and three (QRSR1-3B, QRSR2-3B and QRSR3-7A) for RSR.

75
The QTL with the largest effect for RDW was located on chromosome 7B (QRDW2-
7B), and related to a DART marker wPt-8040-7B with R2 value 4.12%. The favorable
allele at this QTL has been contributed by Meridiano.
The SDW and RSR associated QTLs with the greatest effects were located on
chromosome 4B (QSDW1-4B) and 7A (QRSR3-7A) respectively, and flanked by SNP
markers IWB13072 and IWB58109 with R2 values of 10.51% and 7.27%,
respectively. Considering a positive additive effects at these QTLs, Meridiano has
contributed the favorable allele (Table 4 and Fig. 3).
4.4.3.8 RSA Features of QTL clusters
Among the QTLs detected for RSA traits, 31 QTLs for individual traits were
organized in 12 main QTL clusters. QTL clusters are reported according to their map
position in Fig. 3. In total, 12 main QTL clusters were identified on some of
chromosomes, including chromosome 1A one QTL cluster, 1B two QTL clusters, 3B
one QTL cluster, 4B three QTL clusters, 6A one QTL cluster, 6B two QTL clusters,
7A one QTL cluster and 7B one QTL cluster.
The largest coincidence between individual traits were observed in QTL cluster
located on chromosome 7A for five traits including diamPR, diamSR, SurSR,VolPR
and VolSR. This QTL cluster flanked by SNP marker IWB73246. Additionally,
coincidence between QTLs for SurSR and VolSR was observed for a few QTLs,
namely on chromosomes 1B (18 cM) and 4B (113 cM). These QTLs were related to
DART markers tPt-5413-1B and wPt-663949-4B, respectively.
Coincidence between QTLs for diamPR and VolPR was observed for only one QTL
region (chromosome 1A, 1 cM). Another QTL cluster for primary root features was
located on chromosome 6A (VolPR, PRL, SurPR, in coincidence to wPt-732328-6A).
Similarly, coincidence between QTLs for TRL and SRL was observed for only one
QTL region (chromosome 1B, 55 cM).
In this study, QTLs forSRA were located on two QTL clusters on chromosomes 4B
(96 cM) and 6B (191 cM) with R2 values of 10.39% and 6.17%, respectively. QSRA1-
4B, QSurPR1-4B and QTRL3-4B co-located on the QTL cluster on chromosome 4B.
QSRA2-6B and QR6-2-6B co-located on QTL cluster of chromosome 6B.

76
4.5 DISCUSSION
The importance of roots in water and nutrient acquisition has been acknowledged by
scientists for a long time however RSA traits have hardly entered breeding programs
so far (Den Herder et al. 2010; Cao et al. 2014). Indeed, mapping QTL for root
system architecture traits will help breeders to select root traits desirable for efficient
acquisition of water and nutrients from soils. The aim of the current study was to
identify the genetic regions controlling root system architecture in the recombinant
inbred line population from the cross between the cvs. Meridiano and Claudio.
The RIL durum wheat tested in this research showed a range and coefficient of
variation suitable for further investigation. Most traits showed normal distributions
among RILs suggesting the presence of polygenic control. High heritability values
were obtained for TKW (78.6%) and SRA (65.4%) prompting to further genetic
investigations. Other RSA traits showed medium to good heritability values (from
11.0% to 64.2%), allowing us to find QTLs for RSA traits.
The results of correlation coefficients indicate that highly significant and negatively
correlations were detected between TKW and the most of the traits, including PRL,
TRL, RDW, SRL, RSR and SL. These observations are in line with the results of
Sanguineti et al. (2007) who reported kernel weight (KW) as negatively correlated
with PRL, TRL and SL.
RSR highly significantly correlated with RDW (positively), and with SDW
(negatively). These findings are in agreement with Bai et al. (2013) on 199 lines of
DH population in wheat seedlings. Among the investigated root traits, SRA showed
negative correlation with TKW. We have previously reported negative correlations
between SRA and TKW in three environmental classes (Chapter 3 and Canè et al.
2014).
In this study, 48 quantitative trait loci (QTL) were identified for 17 RSA traits across
a RIL population from the cross between two durum wheat cvs. Meridiano and
Claudio. The QTLs were identified on all chromosomes, except on chromosome 4A.
Both parents contributed favorable alleles to QTLs. QTLs mapped in 12 main QTL
clusters (including more QTLs for more than one trait) and 31 QTLs for individual
traits.

77
SRA (collected as the widest angle of the root apparatus) appears a trait of particular
interest in both durum and bread wheat. Accordingly with Christopher et al. (2013),
the angle of roots at their emergence from the seeds could be a good proxy for deep
rooting potential. Roots with narrower root angle would enable the root system to
grow deeper in the soil since root growth would direct downwards. If this prediction
will be confirmed, this would be a good example of a breeding-useful correlation
between an early expressed traits and the finally expressed important agronomic trait.
(Kato et al. 2006; Omori and Mano. 2007; Manschadi et al. 2008; Christopher et al.
2013).
In rice, Kato et al. (2006) indicated that a nodal root angle can serve as a useful tool
for rough estimation of vertical root distribution. In maize, Omori and Mano. (2007)
evaluated variation in nodal root angle in two sets of F2 populations and reported a
QTL related to root angle to be located on maize chromosome 7. Manschadi et al.
(2008) demonstrated that selection for root growth angle may help to identify
genotypes with root system architecture adapted to drought tolerance of wheat
varieties. Additionally, Christopher et al. (2013) identified QTLs for root angle in a
population developed from bread wheat and reported the QTLs associated with
seminal root angle detected on chromosomes 2A, 3D, 6A and 6B. Sanguineti et al.
(2007) have reported the first results about spread of root angle in 57 elite durum
wheat germplasm and identified QTLs related to root angle to be located on
chromosomes 3A, 4A, 5B and 6A.
In the present study, we successfully identified three QTLs for SRA in Meridiano ×
Claudio population that are located on chromosomes 4B, 6B and 7A (QSRA1-4B,
QSRA2-6B and QSRA3-7A; Table 4). Analysis of genetic effect showed that both
parents, Meridiano and Claudio, contributed favorable alleles. Detection of these
QTLs further show that they are still segregating in cultivars adapted to the target
production region and could potentially be responsive to the conventional or marker-
assisted selection. In accordance with these results, we have previously investigated
association mapping for root architectural traits in a set of 183 durum wheat seedlings
and identified six QTLs for seminal root angle (SRA) on chromosomes 1B, 3A, 4B,
6A and 6B (Canè et al. 2014). According to these two results, the coincidence of
chromosomes for SRA observed on chromosomes 4B and 6B. Based on the results

78
herein presented and our previously results, it is clear that two SRA controlled genes
were located most likely on chromosomes 4B and 6B, whose effects were validated
on a panel of genotypes independent from the Meridiano × Claudio population.
In our study, an important fraction (>38%) of identified RSA QTLs located on
chromosomes 4B and 7A. Chromosome 4B had the largest number of QTLs (ten)
including TKW, SRA, TNR, R6, TRL, SurPR, SurSR, VolSR, SL and SDW QTLs.
At just two QTLs Claudio provided the favorable allele while for all others QTLs the
positive allele originated from Meridiano. Eight QTLs were found on chromosome
7A for traits such as SRA, diamPR, diamSR, SurSR,VolPR, VolSR, SL and RSR.
One SL QTL (QSL3-7A) was characterized by a favorable additive effect of Claudio’s
allele, while Meridiano contributed the favorable allele at all other QTLs. The
alternation of favorable alleles originating from either Claudio or Meridiano at
different QTLs for the same traits likely explains the commonly observed
transgression of RIL values over parental phenotypic values.
Finally, we observed an intriguingly high concentration of QTLs on chromosome 7A
near marker IWB73246. Traits with QTLs in this region were diamPR, diamSR,
SurSR,VolPR and VolSR. We hypothesized that a single gene with pleiotropic effects
underpins this QTL.
4.6 CONCLUSIONS
In the present study, a root phenotyping protocol based on paper culture system
coupled with software-assisted image analysis enabled us to investigate variation for
RSA traits at the seedling stage in a RIL population of durum wheat. Most RSA traits
showed normal distribution suggesting that traits expression was under highly
polygenic control. However, significant differences were identified among lines for
most of traits indicating the presence of genetic variation potentially exploitable in
breeding. These results are noteworthy especially considering that the tested materials
were derived from the cross of highly productive elite Italian cvs, notoriously
considered depleted in genetic variability. Among the considered RSA traits, seminal
root angle (the angle of spread of the root apparatus) appeared the most promising for
further investigations aimed at testing the implications of root angle variation on yield
under stress conditions and/or gene cloning. In this direction, our study enabled us to

79
map two major QTLs controlling seminal root angle on chromosomes 4B and 6B. For
these two QTLs, along with others, we provided molecular markers associated to the
favorable allele.

80
4.7 REFERENCES
An DG, Su JY, Liu QY, Li B, Jing RL, Li JY, Li ZS (2006) Mapping QTLs for
nitrogen uptake in relation to the early growth of wheat (Triticum aestivum L.).
Plant Soil 284:73–84
Azizi L, Mohammadi R, Etminan A, Shooshtari L (2014) Molecular discrimination of
the advanced breeding lines of durum wheat (Triticum turgidum L.) based on
inter simple sequence repeat markers. International Journal of Biosciences 5:12,
130-135
Bai C, Liang Y, Hawkesford MJ (2013) Identification of QTLs associated with
seedling root traits and their correlation with plant height in wheat. J Exp Bot 64:
1745–1753
Belaid A (2000) Durum wheat in WANA: production, trade and gains from
technological change. Proceedings of the seminar ‘Durum wheat improvement in
the Mediterranean region: new challenges. Zaragoza, Spain, 12–14 April 2000.
Options Me´diterrane´ennes, Se´rie A, Se´minaires Me´diterrane ´ens, 40, 35–49
Bengough AG, Gordon DC, Al-Menaie H, Ellis RP, Allan D, Keith R, Thomas WTB,
Forster BP (2004) Gel observation chamber for rapid screening of root traits in
cereal seedlings. Plant and Soil, 262: 63–70
Canè MA, Maccaferri M, Nazemi G, Salvi S, Francia R, Colalongo C, Tuberosa R
(2014) Association mapping for root architectural traits in durum wheat seedlings
as related to agronomic performance. Mol Breed 34:1629-1645
Cao P, Ren Y, Zhang K, Teng W, Zhao X, Dong Z, Liu X, Qin H, Li Z, Wang D, Tong
Y (2014) Further genetic analysis of a major quantitative trait locus controlling
root length and related traits in common wheat. Molecular Breeding 33: 975-985
Christopher J, Christopher M, Jennings R, Jones S, Flecher S, Borrell A, Manschadi
AM, Jordan D, Mace E, Hammer G (2013) QTL for root angle and number in a
population developed from bread wheats (Triticum aestivum) with contrasting
adaptation to water-limited environments. Theor Appl Genet 126: 1563–1574
Den Herder G, Van Isterdael G, Beeckman T, De Smet I (2010) The roots of a new
green revolution. Trends Plant Sci 15:600–607
Elias EM, Manthey FA (2005) End products. In: Royo C, Nachit MM, Fonzo N,
Araus JL, Pfeiffer WH, Slafer GA, editors. Durum wheat breeding: current
approaches and future strategies. New York: Food Products Press; pp. 939–962

81
Grossman JD, Rice KJ (2012) Evolution of root plasticity responses to variation in
soil nutrient distribution and concentration. Evolutionary Applications 5: 850-857
Habash DZ, Kehel Z, Nachit M (2009) Genomic approaches for designing durum
wheat ready for climate change with a focus on drought. J Exp Bot 60: 2805–
2815
Hamada A, Nitta M, Nasuda S, Kato K, Fujita M, Matsunaka H, Okumoto Y (2012)
Novel QTLs for growth angle of seminal roots in wheat (Triticum aestivum L.).
Plant Soil 354:395–405
Kato Y, Abe J, Kamoshita A, Yamagishi J (2006) Genotypic variation in root growth
angle in rice (Oryza sativa L.) and its association with deep root development in
upland fields with different water regimes. Plant Soil 287:117–129.
doi:10.1007/s11104-006-9008-4
Kubo K, Elouafi I, Watanabe N, Nachit MM, Inagaki MN, Iwama K, Jitsuyama Y
(2007) Quantitative trait loci for soil-penetrating ability of roots in durum wheat.
Plant Breeding Volume 126, Issue 4, pages 375–378
Landjeva S, Neumann K, Lohwasser U, Bo¨rner A (2008) Molecular mapping of
genomic regions associated with wheat seedling growth under osmotic stress.
Biol Plant 52:259–266
Liu S, Marla D.H, Carl A, Griffey LM, Anne LM (2009) Meta-analysis of QTL
associated with fusarium head blight resistance in wheat. Crop Sci. 49:1955–1968
Liu X, Li R, Chang X, Jing R (2013) Mapping QTLs for seedling root traits in a
doubled haploid wheat population under different water regimes. Euphytica: 189:
51–66.
Lobet G, Pages L, Draye X (2011) A novel image analysis toolbox enabling
quantitative analysis of Root System Architecture. Plant Physiol 157: 29–39
Lynch JP (2013) Steep, cheap and deep: an ideotype to optimize water and N
acquisition by maize root systems. Ann Bot 112:347–357.
doi:10.1093/aob/mcs293
Lynch JP, Chimungu JG, Brown KM (2014) Root anatomical phenes associated with
water acquisition from drying soil: targets for crop improvement. J Exp Bot.
doi:10.1093/jxb/eru162
Maccaferri M, Ratti C, Rubies C, Vallega V, Demontis A, Stefanelli S, Tuberosa R,
Sanguineti MC (2011) Resistance to Soil-borne cereal mosaic virus in durum
82
wheat is controlled by a major QTL on chromosome arm 2BS and minor loci.
Theor Appl Genet 123:527–544
Maccaferri M, Cane MA, Salvi S, Noli E, Colalongo C,Massi A, Clarke F, Pozniak C,
Korol A, Fahima T, Dubcovsky J, Xu S, Karsai I, Knox R, Clarke J, Tuberosa R
(2014) A consensus framework map of durum wheat (Triticum durum Desf.)
suitable for linkage disequilibrium analysis and genome-wide association
mapping. BMC Genomics 15:873
MacKey J (1979) Genetic potentials for improved yield. Acta Agron Hung 28:121–
143
Manschadi AM, Christopher J, Devoil P, Hammer GL (2006) The role of root
architectural traits in adaptation of wheat to water-limited environments. Funct
Plant Biol 33:823–837
Manschadi AM, Hammer GL, Christopher JT, deVoil P (2008) Genotypic variation in
seedling root architectural traits and implications for drought adaptation in wheat
(Triticum aestivum L.). Plant and Soil 303:115–129
Manschadi AM, Christopher JT, Hammer GL, Devoil P (2010) Experimental
andmodelling studies of drought-adaptive root architectural traits in wheat
(Triticum aestivum L.). Plant Biosyst 144:458–462.
doi:10.1080/11263501003731805
Morancho J (2000) Production and marketing of durum wheat worldwide.
Proceedings of the seminar ‘Durum wheat improvement in the Mediterranean
region: new challenges. Zaragoza, Spain, 12–14 April 2000. Options
Me´diterrane´ennes, Se´rie A, Se´minaires Me´diterrane´ens, 40, 35–49
Nagel KA, Kastenholz B, Jahnke S, van Dusschoten D, Aach T, Mühlich M, Truhn D,
Scharr H, Terjung S, WalterA, Schurr U (2009) Temperature responses of roots:
impact on growth, root system architecture and implications for phenotyping.
Funct Plant Biol 36: 947–959
Omori F, Mano Y (2007) QTL mapping of root angle in F2 populations from maize
‘B73’ × teosinte ‘Zea luxurians’. Plant Root 1:57–65. doi:10.3117/plantroot.1.57
Orman-Ligeza B, Parizot B, Gantet PP, Beeckman T, Bennett MJ, Draye X (2013)
Post-embryonic root organogenesis in cereals: branching out from model plants.
Trends Plant Sci. 18: 459–467
Osmont KS, Sibout R, Hardtke CS (2007) Hidden branches: developments in root

83
system architecture. Annu Rev Plant Biol 58:93–113
Ren Y, He X, Liu D, Li J, Zhao X, Li B, Tong Y, Zhang A, Li Z (2012) Major
quantitative trait loci for seminal root morphology of wheat seedlings. Mol Breed
30:139–148
Sanguineti MC, Li S, Maccaferri M, Corneti S, Rotondo F, Chiari T, Tuberosa R
(2007) Genetic dissection of seminal root architecture in elite durum wheat
germplasm. Ann Appl Biol 151: 291-305
Sharma S, Xu S, Ehdaie B, Hoops A, Clsoe TJ, Lukaszewski AJ, Waines JG (2011)
Dissection of QTL effects for root traits using a chromosome arm-specific
mapping population in bread wheat. Theor Appl Genet 122:759–769
Smith S, De Smet I (2012) Root system architecture: insights from Arabidopsis and
cereal crops. Philos Trans R Soc Lond B Biol Sci. 367:1441-1452
Steele KA, Virk DS, Kumar R, Prasad SC, Witcombe JR (2007) Field evaluation of
upland rice lines selected for QTLs controlling root traits. Field Crop Res
101:180–186
Tuberosa R, Sanguineti MC, Landi P, Giuliani MM, Salvi S, Conti S (2002)
Identification of QTLs for root characteristics in maize grown in hydroponics and
analysis of their overlap with QTLs for grain yield in the field at two water
regimes. Plant Molecular Biology 48: 697-712
Wang S, Basten CJ, Zeng ZB (2007) Windows QTL Cartographer 2.5. Department of
Statistics, North Carolina State University, Raleigh, NC
Wasson AP, Richards RA, Chatrath R, Misra SC, Sai Prasad SV, Rebetzke GJ,
Kirkegaard JA, Christopher J, Watt M (2012) Traits and selection strategies to
improve root systems and water uptake in water-limited wheat crops. Journal of
Experimental Botany 63- 9:3485–3498. doi:10.1093/jxb/ers111
Wasson AP, Rebetzke GJ, Kirkegaard JA, Christopher J, Richards RA, Watt M (2014)
Soil coring at multiple field environments can directly quantify variation in deep
root traits to select wheat genotypes for breeding. J Exp Bot.
doi:10.1093/jxb/eru250
Wojciechowski T, Gooding MJ, Ramsay L, Gregory PJ (2009) The effects of dwarfing
genes on seedling root growth of wheat. Journal of Experimental Botany 60,
2565–2573
Yang M, Ding G, Shi L, Feng J, Xu F, Meng J (2010) Quantitative trait loci for root

84
morphology in response to low phosphorus stress in Brassica napus. Theoretical
and Applied Genetics 121, 181–193
Zhu J, Kaeppler SM, Lynch JP (2005) Mapping of QTL controlling root hair length in
maize (Zea mays L.) under phosphorus deficiency. Plant and Soil 270, 299–310

85
FIGURES

86
Fig. 1 Examples of images (digital photos) of the root system architecture in seedlings
of the two parents (Meridiano and Claudio) of the cross population utilized in this
study. Commonly, durum wheat has five or six roots, including a primary root and
four or five seminal roots. The trait ‘seminal root angle’ (SRA), measured as the
widest angle of the root apparatus is illustrated

87
Fig. 2 Frequency distribution for the RSA traits in 176 Meridiano x Claudio RILs
collected at seedling stage. Arrows indicate mean values for Meridiano (M), and
Claudio (C)
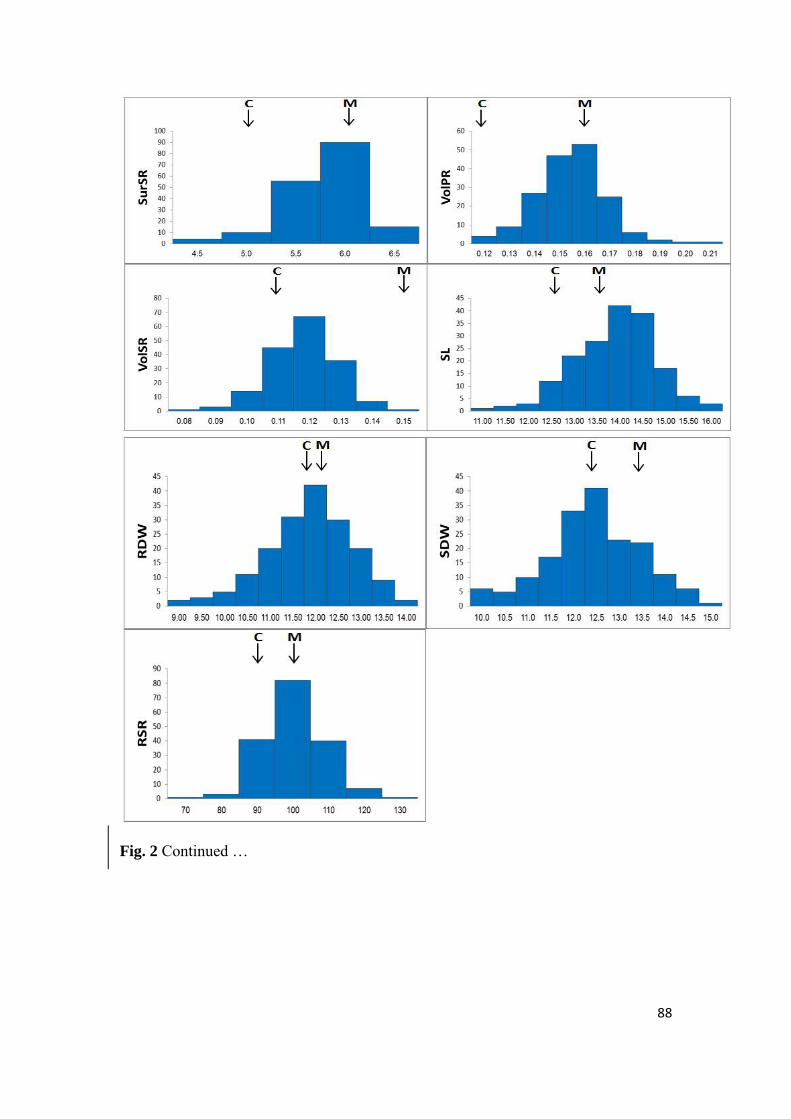
88
Fig. 2 Continued …

89
Fig. 3 Linkage map and quantitative trait loci (QTL) for RSA traits in 176 Meridiano x Claudio RILs of durum wheat

90
Fig. 3 Continued …

91
Fig. 3 Continued …

92
TABLES
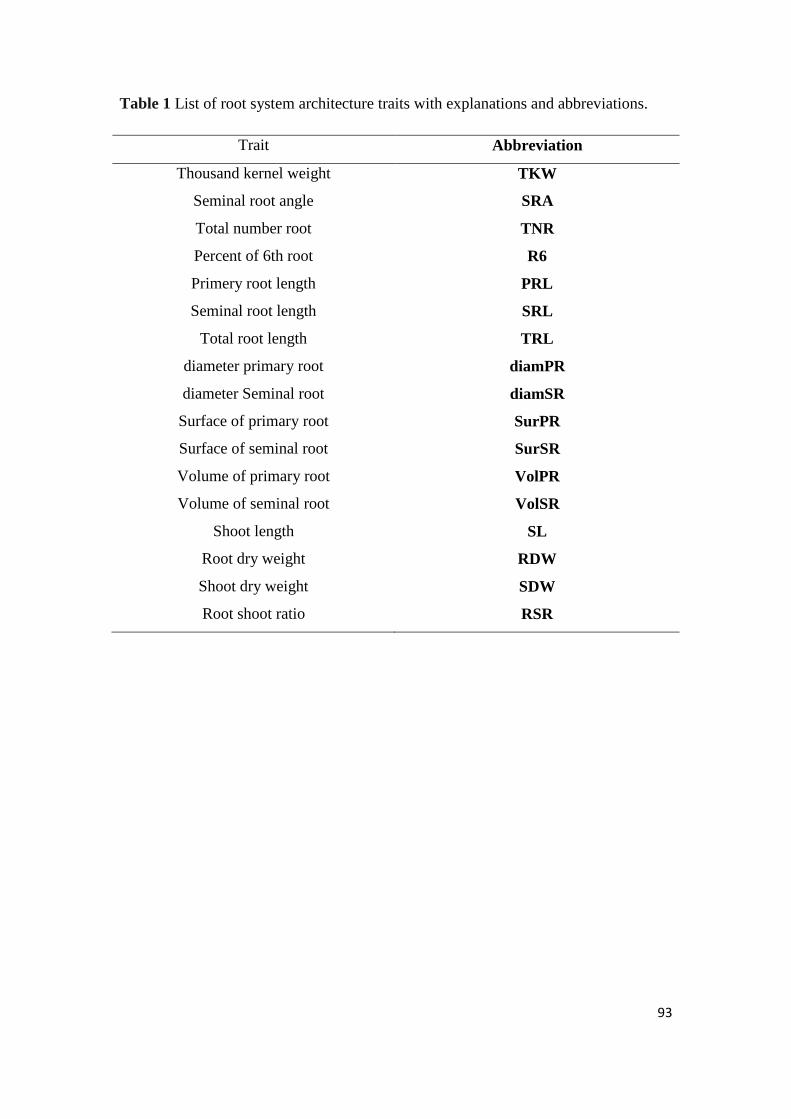
93
Table 1 List of root system architecture traits with explanations and abbreviations.
Trait Abbreviation
Thousand kernel weight TKW
Seminal root angle SRA
Total number root TNR
Percent of 6th root R6
Primery root length PRL
Seminal root length SRL
Total root length TRL
diameter primary root diamPR
diameter Seminal root diamSR
Surface of primary root SurPR
Surface of seminal root SurSR
Volume of primary root VolPR
Volume of seminal root VolSR
Shoot length SL
Root dry weight RDW
Shoot dry weight SDW
Root shoot ratio RSR

94
Table 2 Summary of traits heritability, coefficient of variation and genetic differences as obtained in the analysis of 176 Meridiano x Claudio
RILs at the seedling stage
Trait TKW SRA TNR R6 PRL SRL TRL diamPR diamSR SurPR SurSR VolPR VolSR SL RDW SDW RSR
Mean 48.3 97.9 5.0 6.0 30.7 22.9 122.5 0.08 0.08 7.5 5.6 0.2 0.11 13.7 11.6 12.2 95.5
Max 63.4 128.5 5.7 58.1 34.5 26.2 142.4 0.10 0.09 9.0 6.3 0.2 0.15 15.6 13.7 14.7 122.4
Min 39.8 68.3 4.4 0.0 24.7 17.7 95.8 0.07 0.07 5.8 4.0 0.1 0.08 10.9 8.6 9.6 69.7
F (P) ** ** ** ** ** ** ** * * ns ns ns ns ** * ** **
CV (%) 6.35 13.5 13.4 13.5 5.68 6.56 7.12 5.02 5.22 8.74 9.55 13.31 13.69 7.0 13.8 12.6 13.02
h2 (%) 78.62 65.35 44.30 64.20 29.70 27.51 30.72 26.29 14.35 16.66 29.62 11.04 15.70 49.06 20.56 29.88 26.30
Comparison among mean values significant at nonsignificant (ns), *P <0.05 and **P < 0.01 (F Test)

95
Table 3 Correlation coefficients between RSA traits in 176 Meridiano x Claudio RILs at the seedling stage
Trait TKW SRA TNR R6 PRL SRL TRL diamPR diamSR SurPR SurSR VolPR VolSR SL RDW SDW
TKW -
SRA -0.12
TNR -0.13 0.12
R6 -0.14 0.07 0.71**
PRL -0.45** 0.04 0.15* 0.20**
SRL -0.33** -0.14 0.07 0.01 0.71**
TRL -0.36** -0.03 0.59** 0.42** 0.75** 0.83**
diamPR 0.09 0.06 0.14 0.09 -0.01 0.05 0.10
diamSR 0.13 0.03 0.13 0.09 0.01 0.08 0.12 0.87**
SurPR -0.35** 0.07 0.20** 0.22** 0.79** 0.58** 0.64** 0.59** 0.55**
SurSR -0.19** -0.10 0.12 0.07 0.58** 0.83** 0.72** 0.51** 0.60** 0.77**
VolPR -0.18* 0.06 0.19* 0.19* 0.50** 0.39** 0.45** 0.84** 0.76** 0.92** 0.74**
VolSR 0.15* -0.07 0.08 0.05 0.30** 0.50** 0.43** 0.74** 0.85** 0.69** 0.88** 0.80**
SL -0.24** 0.08 0.21** 0.17* 0.36** 0.30** 0.38** -0.09 -0.05 0.24** 0.22** 0.12 0.08
RDW -0.35** 0.06 0.30** 0.12 0.47** 0.51** 0.58** 0.13 0.14* 0.46** 0.48** 0.36** 0.30** 0.39**
SDW -0.08 0.03 0.14 0.11 0.30** 0.34** 0.36** -0.05 -0.03 0.19** 0.26** 0.10 0.15* 0.70** 0.51**
RSR -0.26** 0.03 0.15* 0.01 0.15* 0.14 0.19** 0.17* 0.16* 0.25** 0.19** 0.24** 0.13 -0.33** 0.47** -0.52**
* and ** statistically different from zero at 0.05 and ≤ 0.01 respectively

96
Table 4 QTL detected for RSA traits in 176 Meridiano x Claudio RILs of durum wheat collected at the seedling stage (with exclusion of TKW)
Trait
QTL Chromosome Marker LOD Position Position-CL/2 Position+CL/2 R2 %
Additive
effect*
Parent
TKW QTKW1-3B
QTKW2-4B
QTKW3-6A
3B wPt-8686-3B 2.82 68 61 76 6.09 -1.08 Claudio
4B wmc89a-4B 3.26 60 55 66 8.40 -1.27 Claudio
6A IWB66509 4.48 8 4 12 10.54 -1.43 Claudio
SRA QSRA1-4B
QSRA2-6B
QSRA3-7A
4B IWB71667b 4.41 96 91 100 10.39 -3.23 Claudio
6B IWB27199 2.57 191 183 198 6.17 2.50 Meridiano
7A IWB35428 3.27 31 26 35 10.01 3.17 Meridiano
TNR QTNR1-2A
QTNR2-2B
QTNR3-4B
2A IWB12312 3.06 17 12 22 9.07 0.05 Meridiano
2B IWA5658 2.54 100 912 109 5.29 0.04 Meridiano
4B IWB72368 5.63 81 77 84 12.65 0.06 Meridiano
R6 QR6-1-4B
QR6-2-6B
4B IWB9672 4.24 79 74 83 10.08 3.13 Meridiano
6B gwm219-6B 3.42 170 164 176 7.83 2.75 Meridiano
PRL QPRL1-6A
QPRL2-6B
QPRL3-7B
6A wPt-732328 3 83 76 90 6.78 0.42 Meridiano
6B wmc182-6B 2.9 135 129 142 7.05 -0.44 Claudio
7B wPt-4300b-7B 2.85 202 195 209 6.88 0.44 Meridiano
SRL QSRL1-1B
QSRL1-2B
QSRL1-6B
1B wPt-733882-1B 3.69 55 51 60 10.25 -0.42 Claudio
2B wPt-2430-2B 2.98 139 132 146 6.46 -0.33 Claudio
6B IWA8011 2.88 129 123 134 8.4 -0.38 Claudio
TRL QTRL1-1B
QTRL2-3B
QTRL3-4B
1B wPt-733882-1B 3.84 50 46 54 11.85 -2.72 Claudio
3B-1 IWB72454 2.42 108 99 117 5.17 1.79 Meridiano
4B kbo-0236-4B 5.16 97 93 101 10.93 2.60 Meridiano
diamPR QdiamPR1-1A
QdiamPR2-7A
1A wPt-4676-1A 3.88 0 0 5 9.02 0.01 Meridiano
7A IWB73246 2.56 7 0 14 6.59 0.01 Meridiano
diamSR QdiamSR1-1A
QdiamSR2-2A
QdiamSR3-7A
1A wmc336-1A 3.05 18 11 25 6.77 0.01 Meridiano
2A wmc658-2A 2.09 23 12 33 4.6 0.01 Meridiano
7A IWB73246 3.22 8 2 13 8.79 0.01 Meridiano
*Additive effects, Calculated as half of the difference between the mean value of the RILs homozygous for the Claudio allele and the mean value of the RILs
homozygous for the Meridiano allele. Allelic effects positive in sign indicate that the allele increasing the trait originates from Meridiano

97
Table 4 Continued …
Trait
QTL Chromosome Marker LOD Position Position-CL/2 Position+CL/2 R2 %
Additive
effect
Parent
SurPR QSurPR1-4B
QSurPR2-6A
QSurPR3-7B
4B IWB28273 2.4 95 87 103 5.86 0.18 Meridiano
6A wPt-732328-6A 3.32 83 77 89 7.49 0.14 Meridiano
7B wPt-5646-7B 2.46 204 195 212 5.75 0.12 Meridiano
SurSR QSurSR1-1B
QSurSR2-4B
QSurSR3-7A
1B tPt-5413-1B 5.01 18 14 22 11.65 -0.13 Claudio
4B wPt-663949-4B 3.15 113 106 120 6.82 0.10 Meridiano
7A IWB73246 3.5 6 0 12 8.12 0.11 Meridiano
VolPR QVolPR1-1A
QVolPR2-6A
QVolPR3-7A
1A wPt-4676-1A 2.19 0 0 9 4.98 0.01 Meridiano
6A gwm1089-6A 2.12 81 72 91 4.77 0.01 Meridiano
7A IWB73246 2.73 6 0 13 6.51 0.01 Meridiano
VolSR QVolSR1-1B
QVolSR2-4B
QVolSR3-7A
1B tPt-5413-1B 4.32 18 13 22 10.31 -0.01 Claudio
4B wPt-663949-4B 2.94 113 105 120 6.30 0.01 Meridiano
7A IWB73246 4.36 7 3 11 10.99 0.01 Meridiano
SL QSL1-3A
QSL2-4B
QSL3-7A
3A wmc505-3A 4.08 24 19 29 9.16 -0.27 Claudio
4B IWB70674 4.17 25 22 28 13.52 0.32 Meridiano
7A IWB73857 2.51 47 40 54 6.56 -0.22 Claudio
RDW QRDW1-6A
QRDW2-7B
6A gwm334-6A 2.47 11 0 24 3.56 -0.18 Claudio
7B wPt-8040-7B 2.64 211 199 222 4.12 0.20 Meridiano
SDW QSDW1-4B
QSDW2-5A
QSDW3-5B
4B IWB13072 2.98 3 0 8 10.51 0.34 Meridiano
5A wPt-730410-5A 3.05 32 26 39 7.37 -0.28 Claudio
5B IWA2610 2.46 0 0 6 7.48 0.28 Meridiano
RSR QRSR1-3B 3B wPt-7264-3B 3.08 0 0 7 6.54 2.07 Meridiano QRSR2-3B 3B IWB59348 2.78 127 119 134 6.59 2.08 Meridiano QRSR3-7A 7A IWB58109 3.11 4 0 11 7.27 2.19 Meridiano

98
CHAPTER 5. GENETIC VARIATION FOR AERENCHYMA AND OTHER ROOT
ANATOMICAL TRAITS IN DURUM WHEAT
5.1 ABSTRACT
Variation in root anatomical traits influences whole plant physiology and crop adaptation to adverse
soil conditions and thus impacts yield and its stability. Typical components of anatomical root traits
are the arrangement of cells and tissues as observed by microscopy sections. In this study, we
investigated the phenotypic variation of eleven root anatomical traits including aerenchyma features
in ten elite durum wheat cultivars and found significant differences among cultivars for several
traits. Trait heritability ranged from 0.12 (number of xylem vessels) to 0.72 (number of aerenchyma
lacunae). While area and number of aerenchyma lacunae were highly correlated, neither trait
correlated with other root features, suggesting an independent physiological and/or genetic control in
respect to the other root anatomical traits. The old Italian founder cultivar Cappelli was shown to
have a significantly higher portion of root aerenchyma of all the modern cultivars. These results
show for the first time the presence of sizeable genetic variation in aerenchyma-related root
anatomical traits in cultivated tetraploid wheats, prompting for additional studies aimed at mapping
the quantitative trait loci governing such variation and to test their role in the adaptive response of
durum wheat to abiotic stresses as related to soil conditions.
Key words: Aerenchyma; Anatomical root traits; Durum wheat; Root stele; Triticum turgidum
Submitted to the journal of Genetic Resources and Crop Evolution (GRES)

99
5.2 INTRODUCTION
Among cereals, durum wheat (Triticum turgidum L. var. durum, 2n = 4x = 28; AABB genomes) is
one of the oldest cultivated species and is an important crop for Mediterranean countries where more
than half of the global acreage of this crop is grown (Key 2005; Maccaferri et al. 2008; Shewry
2009).
Traditionally, efforts in plant breeding have focused on shoot characteristics rather than on roots,
owing in part to the challenges of in situ examination of roots and the complex influence of the
environment on their growth (Tuberosa et al. 2002). Roots play several essential roles in the plant
life cycle, including anchoring to the soil, mechanical support to stems, uptake of water and nutrients
(Osmont et al. 2007; Smith and De Smet 2012) and, more in general, governing the adaptive
response of the plant to unfavourable soil conditions (De Dorlodot et al. 2007; Reynolds and
Tuberosa 2008). In view of this and the continuous improvement in high-throughput phenotyping,
root system architecture is receiving increasing attention in terms of genetic dissection and
physiology (Gregory et al. 2009; Trachsel et al. 2011; Lobet et al. 2014) including small grain
cereals (Habash et al. 2009; Naz et al. 2014; Cané et al. 2014; Petrarulo et al. 2014).
Much less is known about genetic variation of internal anatomical structures of roots, including the
arrangement of cells (number, dimension and orientation) and tissues (features of cortex, stele, etc.),
and their developmental dynamics and physiology (Burton et al. 2013). This notwithstanding, a
number of studies have already linked root anatomy with adaptation and tolerance to abiotic stress
(Wahl and Ryser, 2000; Setter and Water 2003; Gowda et al. 2011; Lynch 2013). The root cortex is
thought to play an important role in storage and transport, based on its considerable vacuolar space
and the collective absorptive surface area of its cells (Lopez Bucio et al. 2003). It has been suggested
that large cortical cell size improves drought tolerance in maize by reducing root metabolic costs
(Chimungo et al. 2014) and that xylem vessels features affect axial water conductance (Lynch et al.
2014). Aerenchyma, i.e. the presence of empty spaces in the roots has been linked to increased
tolerance to waterlogging in barley, maize, rice and wheat (Thomson et al. 1990; Setter and Waters,
2003; Saqib et al. 2005; Yamauchi et al. 2013). Aerenchyma has also been associated with deeper
rooting under drought and increased drought tolerance in maize by reducing metabolic cost (Zhu et
al. 2010; Lynch et al. 2014), although it may inhibit radial nutrient transport (Hu et al. 2014). In

100
summary, root anatomy appears to play a major role in root physiology, eventually influencing crop
performance particularly under adverse environmental conditions.
We report the results of a phenotypic screening for anatomical root traits in durum wheat cultivars
with emphasis on root aerenchyma. To our best knowledge, this is the first investigation of this type
in durum wheat. The presence of genetic variation for root anatomical traits and the possibility to
rapidly phenotype them could provide novel opportunities for durum wheat breeding programs
aiming to enhance yield potential and yield stability.
5.3 MATERIALS AND METHODS
Ten durum wheat cultivars (Cappelli, Claudio, Colosseo, Levante, Lloyd, Meridiano, Normanno,
Rascon/2*Tarro, Saragolla and Simeto) were utilized in this study. Pedigrees and additional
information are reported in Table 1. These ten cultivars well represent the genetic diversity present
in the cultivated durum wheat gene pool, as described elsewhere (Maccaferri et al. 2005).
Root samples were collected from plants at early stem-elongation phase grown in an openfield
experiment (in Cadriano, near Bologna, Italy) in 2-m-long plots with eight rows 0.15 m apart and
0.70 m between each double row, at a density of 400 seeds m-2, in a randomized complete block
design with two replications. Two representative plants per plot and two roots per plant were utilized
for microscopical sections. Attention was given in sampling nodal (i.e. crown) roots, at the base of
the 2nd
whorl. Root sections were always taken at 2 cm from the insertion to the crown. Sections
were visualized using a Nikon Eclipse 50i microscope integrated with a Video Camera Module
(Nikon, DS Camera Head DS-5M). A camera control unit (DS camera control unit DA-L1) was used
to capture and save the images. Analysis of root digital images was performed with the program
RootScan (Burton et al. 2012a). Based on the analysis of digital images, eleven anatomical root traits
were considered (Table 2). The following traits were measured: area of aerenchyma (AA), cortex
cell wall area (CCWA), root cross-sectional area (RXSA), stele cell wall area (SCWA), total cortical
area (TCA) and cross-sectional cell wall area (XSCWA). Traits values were calibrated from pixels
using an image of a 1 mm micrometer taken at the same magnification as the analyzed images (1
linear mm = 295 pixels). The area of cells in the cortex (CCA) was obtained as secondary
measurements as follows: CCA = cortical area - aerenchyma area. Count-based traits included count
of cortex cell (CCC), number of aerenchyma lacunae (NAL), number of cell files in the cortex
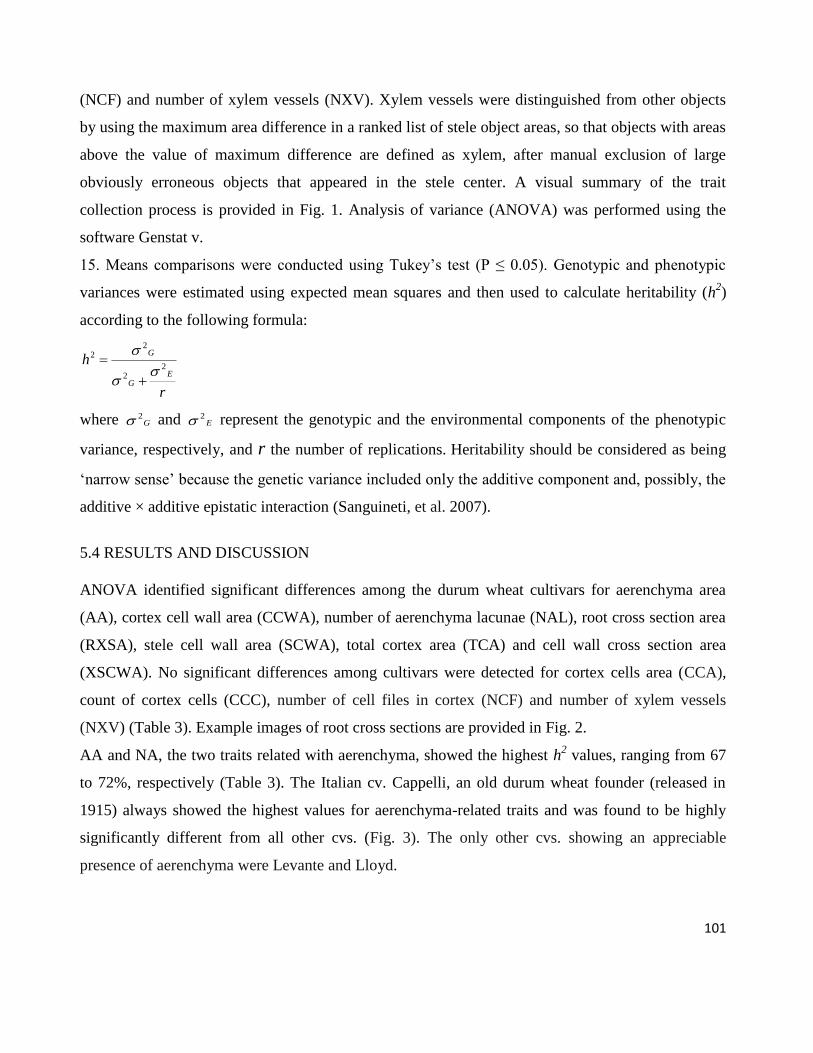
101
(NCF) and number of xylem vessels (NXV). Xylem vessels were distinguished from other objects
by using the maximum area difference in a ranked list of stele object areas, so that objects with areas
above the value of maximum difference are defined as xylem, after manual exclusion of large
obviously erroneous objects that appeared in the stele center. A visual summary of the trait
collection process is provided in Fig. 1. Analysis of variance (ANOVA) was performed using the
software Genstat v.
15. Means comparisons were conducted using Tukey’s test (P ≤ 0.05). Genotypic and phenotypic
variances were estimated using expected mean squares and then used to calculate heritability (h2)
according to the following formula:
r
hE
G
G
22
22
where G2 and E
2 represent the genotypic and the environmental components of the phenotypic
variance, respectively, and r the number of replications. Heritability should be considered as being
‘narrow sense’ because the genetic variance included only the additive component and, possibly, the
additive × additive epistatic interaction (Sanguineti, et al. 2007).
5.4 RESULTS AND DISCUSSION
ANOVA identified significant differences among the durum wheat cultivars for aerenchyma area
(AA), cortex cell wall area (CCWA), number of aerenchyma lacunae (NAL), root cross section area
(RXSA), stele cell wall area (SCWA), total cortex area (TCA) and cell wall cross section area
(XSCWA). No significant differences among cultivars were detected for cortex cells area (CCA),
count of cortex cells (CCC), number of cell files in cortex (NCF) and number of xylem vessels
(NXV) (Table 3). Example images of root cross sections are provided in Fig. 2.
AA and NA, the two traits related with aerenchyma, showed the highest h2 values, ranging from 67
to 72%, respectively (Table 3). The Italian cv. Cappelli, an old durum wheat founder (released in
1915) always showed the highest values for aerenchyma-related traits and was found to be highly
significantly different from all other cvs. (Fig. 3). The only other cvs. showing an appreciable
presence of aerenchyma were Levante and Lloyd.
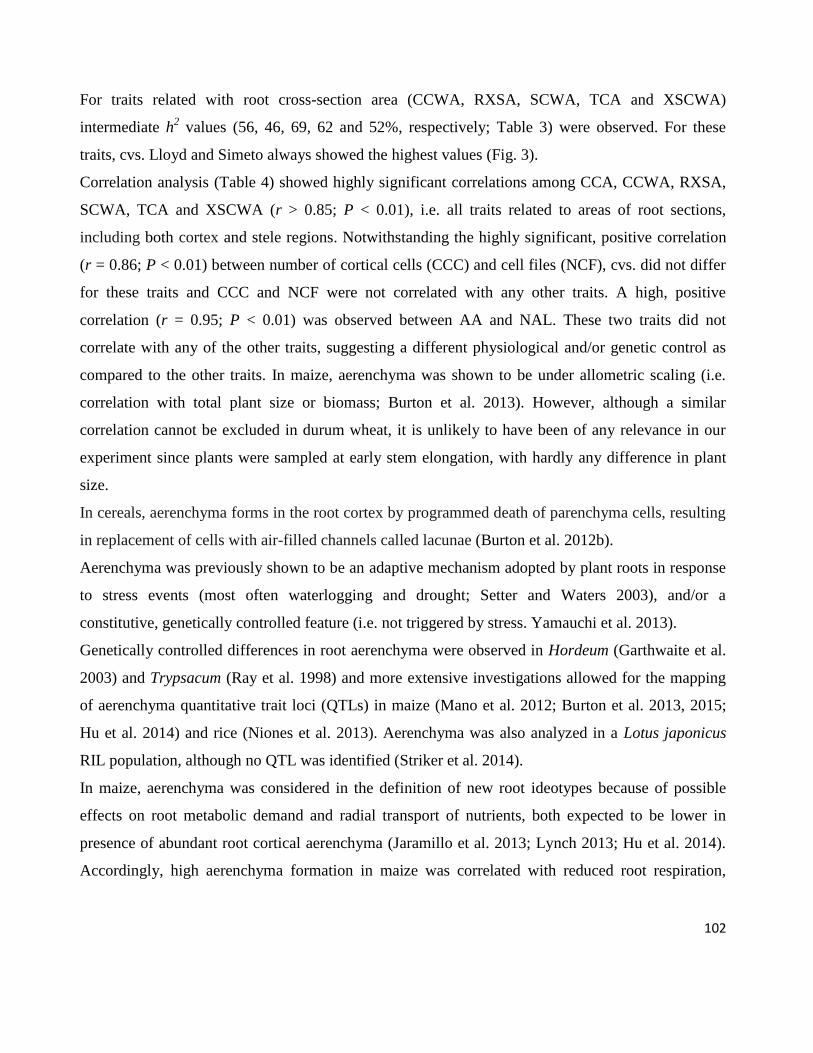
102
For traits related with root cross-section area (CCWA, RXSA, SCWA, TCA and XSCWA)
intermediate h2 values (56, 46, 69, 62 and 52%, respectively; Table 3) were observed. For these
traits, cvs. Lloyd and Simeto always showed the highest values (Fig. 3).
Correlation analysis (Table 4) showed highly significant correlations among CCA, CCWA, RXSA,
SCWA, TCA and XSCWA (r > 0.85; P < 0.01), i.e. all traits related to areas of root sections,
including both cortex and stele regions. Notwithstanding the highly significant, positive correlation
(r = 0.86; P < 0.01) between number of cortical cells (CCC) and cell files (NCF), cvs. did not differ
for these traits and CCC and NCF were not correlated with any other traits. A high, positive
correlation (r = 0.95; P < 0.01) was observed between AA and NAL. These two traits did not
correlate with any of the other traits, suggesting a different physiological and/or genetic control as
compared to the other traits. In maize, aerenchyma was shown to be under allometric scaling (i.e.
correlation with total plant size or biomass; Burton et al. 2013). However, although a similar
correlation cannot be excluded in durum wheat, it is unlikely to have been of any relevance in our
experiment since plants were sampled at early stem elongation, with hardly any difference in plant
size.
In cereals, aerenchyma forms in the root cortex by programmed death of parenchyma cells, resulting
in replacement of cells with air-filled channels called lacunae (Burton et al. 2012b).
Aerenchyma was previously shown to be an adaptive mechanism adopted by plant roots in response
to stress events (most often waterlogging and drought; Setter and Waters 2003), and/or a
constitutive, genetically controlled feature (i.e. not triggered by stress. Yamauchi et al. 2013).
Genetically controlled differences in root aerenchyma were observed in Hordeum (Garthwaite et al.
2003) and Trypsacum (Ray et al. 1998) and more extensive investigations allowed for the mapping
of aerenchyma quantitative trait loci (QTLs) in maize (Mano et al. 2012; Burton et al. 2013, 2015;
Hu et al. 2014) and rice (Niones et al. 2013). Aerenchyma was also analyzed in a Lotus japonicus
RIL population, although no QTL was identified (Striker et al. 2014).
In maize, aerenchyma was considered in the definition of new root ideotypes because of possible
effects on root metabolic demand and radial transport of nutrients, both expected to be lower in
presence of abundant root cortical aerenchyma (Jaramillo et al. 2013; Lynch 2013; Hu et al. 2014).
Accordingly, high aerenchyma formation in maize was correlated with reduced root respiration,

103
increased rooting depth, improved leaf water status, increased plant biomass and substantially
improved yield under drought conditions (Zhu et al. 2010).
It is intriguing that the old durum wheat cv. Cappelli, a direct selection from a landrace (‘Jennah
Khetifa’. Laidò et al. 2013) originating from a North African drought-prone environment showed the
strongest difference in root anatomy as far as aerenchyma is concerned. Cappelli had already shown
relatively high water-use efficiency (Rizza et al. 2012). Based on these observations, it can be
hypothesized that Cappelli’s relatively extreme aerenchyma phenotype is the result of the adaptation
of the original landrace to dry and/or low-fertility growing conditions. In these conditions, root
growth and rooting depth could be sustained in aerenchyma-rich roots thanks to their reduced
metabolic cost (Lynch et al. 2014). This hypothesis is also in line with previous observations that
have recognized the considerable potential of exotic germplasm to provide traits for drought-
adaptive mechanisms in wheat (Reynolds et al. 2007).
5.5 CONCLUSIONS
Variation for anatomical root traits, i.e the ontogenetic arrangement of root cells and tissues, has
been correlated with crop performance in terms of both yield potential and stability (Lynch et al.
2014). Here, we showed for the first time the presence of highly significant genetic differences
among durum wheat cultivars for area and number of aerenchyma lacunae, which are traits
previously shown to be associated to crop performance in response to abiotic stress, and for
additional traits related with root anatomy. Notably, among the ten cvs. considered in our study, the
old Italian founder Cappelli, derived from a North African landrace, was shown to be particularly
rich in aerenchyma, while only two other cvs. showed a modest presence of aerenchyma. The
evaluation of mapping populations developed starting from the cross of Cappelli with other cvs.
herein investigated will provide a means to identify the QTLs involved in aerenchyma formation in
durum wheat while assessing their role in regulating the adaptive response of the crop to an excess
or lack of water in the soil.

104
5.6 REFERENCES
Burton AL, Lynch JP, Brown KM (2012a) RootScan: software for high-throughput analysis of root
anatomical traits. Plant Soil 357:189-203
Burton AL, Lynch JP, Brown KM (2012b) Spatial distribution and phenotypic variation in root
cortical aerenchyma of maize (Zea mays L.) Plant Soil 357:1453-1457
Burton AL, Brown KM, Lynch JP (2013) Phenotypic diversity of root anatomical and architectural
traits in Zea species. Crop Sci 53:1042-1055
Burton AL, Johnson J, Foerster J, Hanlon MT, Kaeppler SM, Lynch JP, Brown KM (2015) QTL
mapping and phenotypic variation of root anatomical traits in maize (Zea mays L.). Theor Appl
Genet 128:93-106
Canè MA, Maccaferri M, Nazemi G, Salvi S, Francia R, Colalongo C, Tuberosa R (2014)
Association mapping for root architectural traits in durum wheat seedlings as related to
agronomic performance. Mol Breed 34:1629-1645
Chimungu JG, Brown KM, Lynch JP (2014) Large root cortical cell size improves drought tolerance
in maize. Plant Physiol 166:2166-2178
De Dorlodot S, Forster B, Pagès L, Price A, Tuberosa R, Draye X (2007) Root system architecture:
opportunities and constraints for genetic improvement of crops. Trends Plant Sci 12: 474-481
Garthwaite AJ, von Bothmer R, Colmer TD (2003) Diversity in root aeration traits associated with
waterlogging tolerance in the genus Hordeum. Funct Plant Biol 30:875-889
Gowda VRP, Henry A, Yamauchi A, Shashidhar HE, Serraj R (2011) Root biology and genetic
improvement for drought avoidance in rice. Field Crops Research 122:1-13
Gregory PJ, Bengough AG, Grinev D, Schmidt S, Thomas WTB, Wojciechowski T, Young IM
(2009) Root phenomics of crops: opportunities and challenges. Funct Plant Biol 36:922-929
Habash DZ, Kehel Z, Nachit M (2009) Genomic approaches for designing durum wheat ready for
climate change with a focus on drought. J Exp Bot 60:2805-2815
Hu B, Henry A, Brown KM, Lynch JP (2014) Root cortical aerenchyma inhibits radial nutrient
transport in maize (Zea mays). Ann Bot 113:181-189
Jaramillo RE, Nord EA, Chimungu JG, Brown KM, Lynch JP (2013) Root cortical burden
influences drought tolerance in maize. Ann Bot 112:429-437
Key JM (2005) Wheat: its concept, evolution, and taxonomy. In: Royo C, Nachit MM, Di Fonzo N,

105
Araus JL, Pfeiffer WH, Slafer GA (eds.) Durum wheat breeding: current approaches and future
strategies, Vol. 1. New York, London, Oxford: Food Products Press, an imprint of the Haworth
Press Inc., pp 3-61
Laidò G, Mangini G, Taranto F, Gadaleta A, Blanco A, Cattivelli L, Marone D, Mastrangelo AM,
Papa R, De Vita P (2013) Genetic diversity and population structure of tetraploid wheats
(Triticum turgidum L.) estimated by SSR, DART and pedigree data. PLoS One 8:e67280
Lobet G, Couvreur V, Meunier F, Javaux M, Draye X (2014) Plant water uptake in drying soils.
Plant Physiol 164:1619-1627
Lopez-Bucio J, Cruz-Ramirez A, Herrera-Estrella L, 2003. The role of nutrient availability in
regulating root architecture. Curr Opin Plant Biol 6: 280-287
Lynch JP (2013) Steep, cheap and deep: an ideotype to optimize water and N acquisition by maize
root systems. Ann Bot 112:347-357
Lynch JP, Chimungu JG, Brown KM (2014) Root anatomical phenes associated with water
acquisition from drying soil: targets for crop improvement. J Exp Bot 65:6155-6166
Maccaferri M, Sanguineti MC, Noli E, Tuberosa R (2005) Population structure and long-range
linkage disequilibrium in a durum wheat elite collection. Mol Breed 15:271-289
Maccaferri M, Sanguineti MC, Corneti S, Ortega JLA, Ben Salem M, Bort J, DeAmbrogio E, del
Moral LFG, Demontis A, El-Ahmed A, Maalouf F, Machlab H, Martos V, Moragues M,
Motawaj J, Nachit M, Nserallah N, Ouabbou H, Royo C, Slama A, Tuberosa R (2008)
Quantitative trait loci for grain yield and adaptation of durum wheat (Triticum durum Desf.)
across a wide range of water availability. Genetics 178:489-511
Mano Y, Omori F, & Takeda K (2012) Construction of intraspecific linkage maps, detection of a
chromosome inversion, and mapping of QTL for constitutive root aerenchyma formation in the
teosinte Zea nicaraguensis. Mol Breed 29:137-146
Naz A, Arifuzzaman M, Muzammil S, Pillen K, Léon J (2014) Wild barley introgression lines
revealed novel QTL alleles for root and related shoot traits in the cultivated barley (Hordeum
vulgare L.). BMC Genet 15:107
Niones JM, Suralta R, Inukai Y, & Yamauchi A (2013) Roles of root aerenchyma development and
its associated QTL in dry matter production under transient moisture stress in rice. Plant Prod
Sci 16:205-216
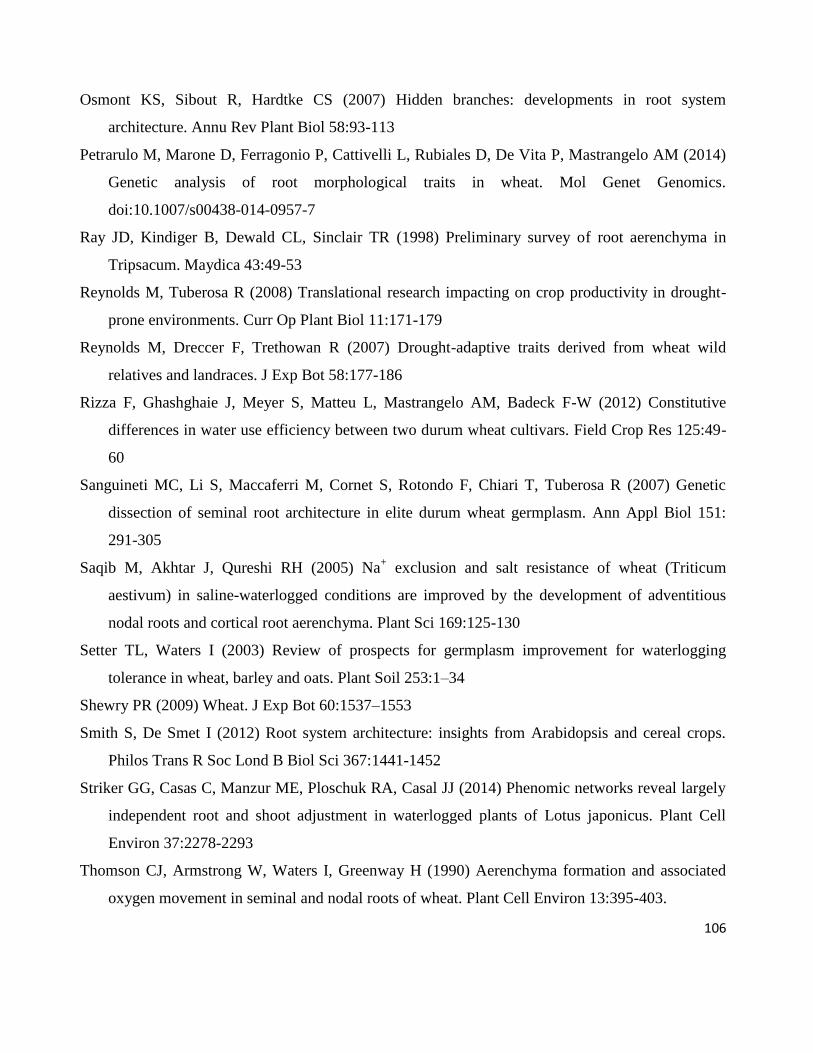
106
Osmont KS, Sibout R, Hardtke CS (2007) Hidden branches: developments in root system
architecture. Annu Rev Plant Biol 58:93-113
Petrarulo M, Marone D, Ferragonio P, Cattivelli L, Rubiales D, De Vita P, Mastrangelo AM (2014)
Genetic analysis of root morphological traits in wheat. Mol Genet Genomics.
doi:10.1007/s00438-014-0957-7
Ray JD, Kindiger B, Dewald CL, Sinclair TR (1998) Preliminary survey of root aerenchyma in
Tripsacum. Maydica 43:49-53
Reynolds M, Tuberosa R (2008) Translational research impacting on crop productivity in drought-
prone environments. Curr Op Plant Biol 11:171-179
Reynolds M, Dreccer F, Trethowan R (2007) Drought-adaptive traits derived from wheat wild
relatives and landraces. J Exp Bot 58:177-186
Rizza F, Ghashghaie J, Meyer S, Matteu L, Mastrangelo AM, Badeck F-W (2012) Constitutive
differences in water use efficiency between two durum wheat cultivars. Field Crop Res 125:49-
60
Sanguineti MC, Li S, Maccaferri M, Cornet S, Rotondo F, Chiari T, Tuberosa R (2007) Genetic
dissection of seminal root architecture in elite durum wheat germplasm. Ann Appl Biol 151:
291-305
Saqib M, Akhtar J, Qureshi RH (2005) Na+ exclusion and salt resistance of wheat (Triticum
aestivum) in saline-waterlogged conditions are improved by the development of adventitious
nodal roots and cortical root aerenchyma. Plant Sci 169:125-130
Setter TL, Waters I (2003) Review of prospects for germplasm improvement for waterlogging
tolerance in wheat, barley and oats. Plant Soil 253:1–34
Shewry PR (2009) Wheat. J Exp Bot 60:1537–1553
Smith S, De Smet I (2012) Root system architecture: insights from Arabidopsis and cereal crops.
Philos Trans R Soc Lond B Biol Sci 367:1441-1452
Striker GG, Casas C, Manzur ME, Ploschuk RA, Casal JJ (2014) Phenomic networks reveal largely
independent root and shoot adjustment in waterlogged plants of Lotus japonicus. Plant Cell
Environ 37:2278-2293
Thomson CJ, Armstrong W, Waters I, Greenway H (1990) Aerenchyma formation and associated
oxygen movement in seminal and nodal roots of wheat. Plant Cell Environ 13:395-403.

107
Trachsel S, Kaeppler SM, Brown KM, Lynch JP (2011) Shovelomics: high throughput phenotyping
of maize (Zea mays L.) root architecture in the field. Plant Soil 341:75-78
Tuberosa R, Sanguineti MC, Landi P, Giuliani MM, Salvi S, Conti S (2002) Identification of QTLs
for root characteristics in maize grown in hydroponics and analysis of their overlap with QTLs
for grain yield in the field at two water regimes. Plant Mol Biol 48:697-712
Wahl S, Ryser P (2000) Root tissue structure is linked to ecological strategies of grasses. New
Phytol 148:459-471
Yamauchi T, Shimamura S, Nakazono M, & Mochizuki T (2013) Aerenchyma formation in crop
species: a review. Field Crops Res 152:8-16
Zhu JM, Brown KM, Lynch JP (2010) Root cortical aerenchyma improves the drought tolerance of
maize (Zea mays L.). Plant Cell Environ 33:740-

108
FIGURES

109
Fig. 1 Description of the main root anatomical features collected in this study using the software
Rootscan. A) The whole root cross section is isolated from the background (blue line). B) The stele
is separated from the cortex (yellow line). C) The aerenchyma is identified (in red). D) Within the
stele portion, the xylem (in yellow) and protoxylem vessels (in blue) are identified. E) Final
elaboration with all anatomical parts highlighted

110
Fig. 2 Sample images of root cross sections of the durum wheat cultivars
collected in this study

111
Fig. 3 Mean values of area of aerenchyma (AA), number of aerenchyma lacunae (NAL), cortex cell
wall area (CCWA), root cross-sectional area (RXSA), stele cell wall area (SCWA), total cortical
a
b b
c c c
c
d d d
a
b
c c
c c c
d d d
bc b
a
bc
c
bc c d
bc
ab
bc b
a
bc c bc bc
c bc
ab
b b
a
b
c
b
c c
b
b
bc b
a
bc
c
bc bc c
bc
a
bc b
a
bc bc bc bc c
bc
a

112
area (TCA) and cross-sectional cell wall area (XSCWA). Bars represent standard deviations. Letters
report statistically different comparisons based on Tukey’s test (P < 0.05)
TABLES

113
Table 1 Details about the durum wheat cultivars utilized in this study
Cultivar Registration Pedigree
Country Year
Cappelli Italy 1930 selection (by Strampelli) from Jennah
Khetifa
Claudio Italy 1998 CIMMYT
selection/Durango//ISI938/Grazia
Colosseo Italy 1995 Mexa’s mutant/Creso
Levante Italy 2002 G80/Picemo//10M10
Lloyd USA 1983 Cando/Edmore
Meridiano Italy 1999 Simeto/WB881//Duilio/F21
Normanno Italy 2002 Simeto/F22//L35
Rascon /*2Tarro Mexico - Rascon-37/2*Tarro
Saragolla Italy 2004 Iride/0114
Simeto Italy 1988 Capeiti 8/Valnova

114
Table 2 Anatomical root traits investigated in this study and corresponding acronyms
Acronym Trait Unit
AA Area of aerenchyma mm2
CCA Area of cells in the cortex mm2
CCC Count of cortex cells no.
CCWA Cortex cell wall area mm2
NAL Number of aerenchyma lacunae no.
NCF Number of cell files in the cortex no.
NXV Number of xylem vessels no.
RXSA Root cross-sectional area mm2
SCWA Stele cell wall area mm2
TCA Total cortical area mm2
XSCWA Cross-sectional cell wall area mm2

115
Table 3 Results of ANOVA and heritability for root anatomical traits investigated in this study
Trait AA CCA CCC CCWA NAL NCF NXV RXSA SCWA TCA XSCWA
h2 0.67 0.31 0.45 0.56 0.72 0.57 0.12 0.46 0.69 0.52 0.62
F (P) ** ns Ns * ** ns ns * * * *
Min 0 0.10 281.2 0.23 0 2.50 4.50 0.55 0.05 0.45 0.25
Max 0.068 0.25 741.2 0.55 6 22.75 8.75 1.28 0.18 0.98 0.70
Mean 0.012 0.16 507.1 0.37 1.73 11.15 6.61 0.87 0.11 0.68 0.48
HSD 1
0.025 - - 0.08 0.90 - - 0.19 0.03 0.15 0.10
ns, * and **: comparison among mean values not significant , significant at P < 0.05 and significant
at P < 0.01 (F Test), respectively
1 Tukey’s Honest Significant Difference

116
Table 4 Correlation coefficients (r) among root anatomical traits
Trait CCA CCWA NCF CCC AA NAL RXSA SCWA TCA XSCWA
CCWA 0.87**
NCF 0.02 -0.30
CCC 0.32 -0.02 0.86**
AA -0.02 0.18 0.09 0.13
NAL -0.07 0.15 0.12 0.15 0.95**
RXSA 0.86** 0.99** -0.29 -0.05 0.21 0.18
SCWA 0.93** 0.94** -0.06 0.16 0.14 0.08 0.92**
TCA 0.85** 0.98** -0.33 -0.10 0.21 0.16 0.99** 0.91**
XSCWA 0.89** 0.99** -0.30 0.03 0.16 0.15 0.97** 0.92** 0.95**
NXV 0.52 0.78** -0.25 -0.06 0.45 0.47 0.72* 0.75* 0.70* 0.76*
* and ** statistically different from zero at P ≤ 0.05 and 0.01, respectively

117
CHAPTER 6. MAPPING QUANTITATIVE TRAIT LOCI FOR RESPONSE TO HEAT
STRESS USING CELL MEMBRANE STABILITY (CMS) IN A COLLECTION OF DURUM
WHEAT
6.1 ABSTRACT
Heat stress due to increased temperature is an agricultural problem in many areas of the world. In
this study, the association mapping (AM) strategy based on a panel of 183 elite of durum wheat
accessions (Maccaferri et al., 2006) was deployed in order to dissect the genetic control and identify
QTLs for response to heat stress. The experiment was conducted using a randomized complete block
design with two replications in greenhouse environmental conditions. Cell membrane stability
(CMS) was recorded as a proxy index to evaluate the response to heat stress in a three-step
experiment: constitutive heat stress response, acquired heat stress response and constitutive-acquired
heat stress response. Significant differences among genotypes were observed for all measured CMS
traits. The highest heritability (h2 = 0.86) was recorded for constitutive-acquired heat stress response.
The panel was profiled with simple sequence repeat, Diversity Arrays Technology and sequence-
tagged site markers (957 markers in total). Thirty four single marker/QTL regions were located in all
chromosomes; four major QTLs (LOD ≥ 3) for constitutive heat stress response were detected on
chromosome 5A, 6A, 7B, while one QTL for constitutive-acquired heat stress response was detected
on chromosome 6B. The wide range of genetic variation and the limited influence of population
structure support the reliability of our results and prompt for additional finer investigations of the
physiological bases underlying these QTLs, towards their exploitation in breeding.
Key words: Heat stress response, Cell membrane stability, Durum wheat

118
6.2 INTRODUCTION
Durum wheat (Triticum turgidum L. var. durum, 2n = 4x = 28) is one of the most important crop for
the agriculture and economy of Mediterranean countries where durum is cultivated on more than half
of the available acreage, sharing the cultivation with other small grain cereals as bread wheat and
barley (Marti and Slafer 2014). The Mediterranean basin climate is characterized by warm to hot dry
summers strongly affecting yield and performance of winter-cereals. Drought and high-temperature
often occurs simultaneously in the terminal part of the growing season when can hardly impairs mid
or late reproductive stages, including grain filling (Belaid 2000; Morancho 2000; Habash et al.
2009).
In particular, heat-stress adversely affects wheat production in many regions of the world and is
particularly detrimental during reproductive development. Heat-stress is often defined as the rise in
temperature beyond a threshold level for a period of time sufficient to cause irreversible damage to
plant growth and development. Short-term heat stress (acute heat stress) provokes heat shock
response, in contrast, long-term heat exposure (chronic heat stress) induces larger scale adaptations.
Yield penalties are associated with high temperatures for an extended period of time (mean
temperature of the growth cycle being 18°C–25°C, and maximum day temperatures even more than
35°C during grain filling). Moreover, waves of high temperature, usually 10–15 °C above optimal, is
considered as heat shock stress and may cause serious reductions in wheat performances (Wahid et
al. 2007).
So far, various conventional breeding-based attempts have been adopted to develop heat-tolerant
cultivars (Lobell et al. 2012; Pradhan et al. 2012; Gourdji et al. 2013; Deryng et al. 2014).
Furthermore, the screening of genetic diversity (both elite and landraces collections), coupled with
the recent development of sophisticated molecular tools, has provided additional possibilities to
breeders to improve crops for heat response (Ehlers and Hall 1998; Camejo et al. 2005).
In a well-planned breeding program, the knowledge of the genetic diversity among the species will
facilitate the selection for key traits. The DNA-based Markers Assisted Selection (MAS) has several
advantages over the traditional phenotypic selection and its potential benefits has been widely
discussed (Melchinger 1990; Paterson et al. 1991; Young 1996; Mohan et al. 1997; Anderson 2003;
Varshney and Tuberosa 2007). Molecular markers are a useful complement to morphological and
physiological characterization because they are abundant and randomly distributed in the genome,

119
not influenced by tissue or environment and allow genotyping early in plant development. Molecular
characterization of cultivars is also useful to evaluate potential genetic erosion, defined here as a
reduction of genetic diversity in time (Manifesto et al. 2001). Molecular makers can be very useful
to better understand the genetic basis of phenotypic variability and might support the breeding
process for the development of improved cultivars especially for traits which are difficult or
expensive to measure, that exhibit low heritability and are expressed at late stages in plant
development.
The present work aims to carry out a comprehensive phenotypic analysis of a durum wheat
collection for the response to high-temperature followed by an association mapping study to detect
Quantitative Trait Loci (QTLs) associated with heat tolerance. The response to chronic heat stress
(Tashiro and Wardlaw 1989; Wardlaw et al. 1989; Yang et al. 2002a, b, c) and short-term heat shock
(Tashiro and Wardlaw 1990; Plaut et al. 2004; Hays et al. 2007) has been studied in controlled
environments where specific heat treatments may be applied.
Cell membrane stability (CMS; Sullivan 1972) is a trait often exploited as an indirect measurement
for both heat and drought tolerance in various crops and it is considered a valuable index within
breeding programs (Ibrahim and Quick 2001a, b; Ottaviano et al. 1991; Tripathy et al. 2000).
Electrolyte leakage from leaf tissue after an “in vitro” or “in vivo” heat shock treatment at the
seedling stage has been demonstrated to be associated with wheat performance at a range of heat-
stressed field locations worldwide (Reynolds et al. 1994). Cell membrane stability is strictly related
to denaturation of proteins and increments of unsaturated fatty acids that disrupt water, ion, and
organic solute movement across membranes. Furthermore, disorders in thylakoid membranes trigger
the physical separation of the chlorophyll light harvesting complex II from the PSII core complex,
and disruption of PSII-mediated electron transfer (Ristic et al. 2008). The general protocol of CMS
involves the application of stress to the leaf after it has been subjected to hardening, followed by the
measurement of electrolyte leakage using the conductimetry method. When tissues are subjected to
high temperature, electrical conductivity increases due to damage to the cell membrane and
consequent increased permeability and leakage of ions out. Electrical conductivity has been already
largely used as an index of membrane stability to identify heat-tolerant genotypes in wheat (Blum
and Ebercon 1981) and for screening of heat-tolerant genotypes in different crops (Blum 1988).

120
Association mapping (AM), based on linkage disequilibrium, is a complementary strategy to
traditional QTL mapping for describing associations between genotypes and phenotypes in crop
plants (Ersoz et al. 2008; Sorrells and Yu 2009; Maccaferri et al. 2011).
In this research study, we investigated the results of an association mapping study aimed at mapping
genes/QTLs for heat stress tolerance in durum wheat. In particular, the CMS trait under heat stress
was chosen as an indicator trait for heat tolerance in a panel of durum wheat accessions well-suited
for AM studies (Maccaferri et al. 2006, 2010 and 2011).
6.3 MATERIALS AND METHODS
6.3.1 Plant material
The panel of 183 elite accessions of durum wheat included cultivars and breeding lines developed in
Mediterranean countries (Italy, Morocco, Spain, Syria, and Tunisia), Southwestern USA and Mexico
that were released from the early 1970s up to the late 1990s (Appendix 1). The panel included also
‘founder genotypes’ used as parents in breeding programs throughout the Mediterranean Basin and
at International CGIAR Centers (CIMMYT and ICARDA). The accessions were chosen according
to their pedigree and highly related accessions were excluded. Accessions showing large differences
in heading date were excluded to avoid possible bias of phenology in the interpretation of the results
pertaining to the agronomic traits. A detailed phenotypic and molecular characterization of the panel
was previously reported in Maccaferri et al. (2006, 2010 and 2011).
6.3.2 Heat stress response evaluation using cell membrane stability (CMS)
In this study, a panel of 183 elite accessions of durum wheat (Maccaferri et al. 2006) were
germinated in petri dishes and vernalized for two weeks at 6°C. Seedlings were transplanted at four
plants per pot filled with a substrate of Peat, sand and vermiculite in a 6:3:1 ratio. The experiment
was conducted using a randomized complete block design with two replications in greenhouse
environmental conditions. In the first step of experiment, 4-cm long leaf segments were sampled
from leaves of four seedlings. The leaves were cut in 2-cm long segments, divided in a “control-
sample” and a “treated-sample”, washed in deionized water and placed in a plastic vial containing 15
ml of deionized water. The “treated-samples” were heat-treated in the incubator for 1 h at 45 °C.

121
After treatment, the samples (treated and control) were left at 4 °C for 24 h to allow the leakage of
ions in the water solution. Ion leakage was then measured with a conductivity meter. After the
measurements were taken, all samples were autoclaved for 15 min at 121°C and their conductance
measured again. The CMS was calculated using the following formula (Blum and Ebercon 1981):
CMS (%) = [1-(T1/T2)/1–(C1/C2)] x100
where T is treatment samples, C is control samples, and 1 and 2 refer to the first and second readings
of conductance, i.e., before and after autoclaving. This trait has been named ‘‘constitutive heat stress
response‘‘ (CON).
In the second step of the experiment, heat stress was applied directly to plants at the booting stage by
transferring the pots into the growth chamber at 37 °C for 24 h. Before applying the heat stress to
plants, the “control-sample” was collected. Afterwards, the whole plant were heated for 5 h at 45 °C
and the “treated-samples” collected. All samples were kept at 4 °C in darkness for 24 h. Solution
conductance was then measured with a conductivity meter. After the measurements were taken, all
samples were autoclaved for 15 min at 121°C and their conductance measured again. The CMS has
been calculated using the formula previously described. This trait was named ‘‘acquired heat stress
response‘‘ (AQU).
In the third step of experiment, samples collected from plants moved in growth chamber at 37 °C for
24 h (hardening), were heated in the incubator for 1 h at 45 °C. After the treatment all samples
remained at the 4 °C in the darkness for 24 h. Solution conductance was then measured with a
conductivity meter. After the measurements were taken, all samples were autoclaved for 15 min at
121°C and their conductance measured again. In this step of the experiment, we calculated CMS by
using as control the value of the ions leakage measured on the samples used for the calculation of
AQU_CMS before the heat-treatment. This trait was named ‘‘constitutive-acquired heat stress
response‘‘ (CON_AQU).
6.3.3 Molecular profiling
In the present study, the SSR-based map (334 SSRs) reported in Maccaferri et al. (2011) after
enrichment with DArT marker was utilized as reference for markers positions. In total, 957 markers
(334 SSRs and 623 DArT markers) were used for the molecular profiling of the 183 accessions.

122
DArT markers were generated by Triticarte Pty. Ltd. (Canberra, Australia;
http://www.triticarte.com.au). A durum wheat PstI/TaqI array v 2.0, containing 7,600 single DArT
clones obtained as described in Mantovani et al. (2008), was used for genotyping the panel. The
locus designation used by Triticarte Pty. Ltd. was adopted (‘wPt’, ‘rPt’ and ‘tPt’ loci corresponding
to wheat, rye and triticale clones, respectively), and alleles at polymorphic loci were scored as
hybridization positive (1) or negative (0).
Markers were ordered according to a consensus map developed at the University of Bologna in the
framework of an international cooperation (Maccaferri et al. 2014). Four mapping populations, i.e.
Kofa × Svevo (KS RIL population, Maccaferri et al. 2008), Colosseo × Lloyd (CL RIL, Mantovani
et al. 2008), Meridiano × Claudio (MC RIL, Maccaferri et al. 2011) and Simeto × Levante (SL RIL,
Maccaferri et al. unpublished) were developed by the University of Bologna in collaboration with
Produttori Sementi Bologna SpA (Argelato, BO, Italy). Ten additional maps provided by
international partners were used to assemble a common consensus map, used to order the markers
available for genotyping the experimental materials herein presented (Maccaferri et al. 2014).
6.3.4 Statistical analysis and association mapping analysis
The genotypic and phenotypic coefficient of variation and heritability were calculated according to
Singh and Chaudhary (1985). Heritability should be considered as being ‘narrow sense’ because the
genetic variance included only the additive component and, possibly, the additive × additive epistatic
interaction (Sanguineti et al. 2007).
For AM analysis, a total of 957 informative markers (i.e., 334 SSR and 623 DArT markers) which
was possible to project on the consensus linkage map were utilized. The presence of significant
population structure in the panel had been previously shown by Maccaferri et al. (2011) with a
combination of model- and distance-based analyses using the program STRUCTURE v. 2 (Pritchard
et al. 2000). The population structure model optimum was identified in five hypothetical subgroups,
that led to the Q matrix of membership coefficients of each accession to all subgroups (for details
see Maccaferri et al. 2011).
A co-ancestry kinship (K) matrix was obtained for the mapped SSR and DArT markers by pairwise
genetic similarity values (GSij) that were calculated for all accession pairs using the simple matching
coefficient for multi-state markers. Linkage disequilibrium (LD) was estimated using the program

123
TASSEL, v. 2.1 (www. maizegenetics.net, Yu et al. 2006); D’ and r2 values are a function of the
corresponding inter-marker distances and the comparison-wise significance was computed with
10,000 permutations. The r2 LD value was estimated for intra-chromosomal loci and related to
genetic distances between loci (cM). When all pairs of adjacent loci were in LD (arbitrarily set at r2
> 0.3), this region was referred to as a LD block (Stich et al. 2005). Genome-wide scans for AM for
heat stress response traits were conducted using the TASSEL program, ver. 5.1.0 (Bradbury et al.
2007). The 334 SSR and 623 DArT markers were tested for significance of marker-trait association
under the fixed general linear model (GLM) including the Q population structure results as
covariates (Q GLM), and the mixed linear model (MLM) including the Q population structure
results plus the K kinship matrix (Q+K MLM).
For GLM analysis, besides the marker-wise association probability values, the experiment-wise
association significance probability was obtained based on a permutation test implemented in
TASSEL (10,000 permutations in total). The experiment-wise test provides a much more stringent
threshold for significance as compared to the marker-wise test (Bradbury et al. 2007). Three
significance levels of marker-trait association were considered, i.e. marker-wise at P = 0.01 (-
log(P)) = 2.0) and P = 0.001 (- log10(P)) = 3.0) and experiment-wise at P = 0.1 (- log10(P)) = 4.0,
Bonferroni's correction).
6.4 RESULTS AND DISCUSSION
Breeding for complex traits needs to take into account various factors, such as understanding the
genetic, physiological and molecular bases of the traits, including interactions among the component
traits and with the environments. Recently, progresses have been made in mapping and tagging
many agriculturally important genes with molecular markers, which forms the basis for MAS in crop
plants (Aneja et al. 2012). Molecular markers linked to the heat tolerance trait represent a more
reliable tool for selecting heat tolerance genotypes in durum wheat breeding programs (Yang et al.
2002c; Kumar et al. 2013; Talukder et al. 2014). The purpose of this present study was the
identification of QTLs in a set of elite durum wheat accessions in order to dissect the genetic control
of heat-tolerance in durum wheat, using as index of resistance CMS at the seedling stage.
6.4.1 Phenotypic variation of the accessions’ panel for heat stress response

124
Analysis of variance revealed highly significant differences (P <0.01) among durum wheat
genotypes for all three measured traits (Table 1, Table 2). The experimental material showed a wide
range of variation for the three traits. In detail, CON ranged from 1.8 to 133.5, with mean value of
39.26, AQU ranged from 60.7 to 133.6, with mean value of 98.2, and CON_AQU ranged from 18.7
to 115.5, with mean value of 71.2 (Table 1).
Coefficient of variation (CV) ranged from 4.8% for AQU, 6.1% for CON and 20.9% for
CON_AQU. Heritability values ranged from 31% to 86% among traits and AQU and CON_AQU
with the smallest and largest values, respectively (Table 1), indicating that the genetic to
environmental control ratio was different among traits. As expected, the treatment carried out on the
detached leaves (CON) showed higher heritability than the treatment on whole plants (AQU). It was
also expected that the strongest treatment combining both protocols (CON_AQU) showed the
highest heritability value among the three treatments.
Significant differences among wheat genotypes for CMS traits had been formerly observed (Shafeeq
et al. 2006; Elshafei et al. 2013). Indeed, electrical conductivity has already been used as an index of
membrane stability to identify heat-tolerant genotypes in wheat (Blum and Ebercon 1981) and for
screening of heat-tolerant genotypes in different crops (Blum 1988). When tissues are subjected to
high temperature, electrical conductivity increases due to damages to the cell membrane and
consequent cytosolic leakage.
Histograms and cumulative distributions of the phenotypic data were inspected to assess the
consistency of data and to investigate the complexity of the genetic control of the three heat response
traits (Fig. 1 and 2). All the three traits, after square-root transformation, exhibited continuous
variation with approximately normal distributions, suggesting a likely a polygenic quantitative
control. Normality was confirmed with a Shapiro-Wilk test (data not shown).
6.4.2 Relationship between population structure and heat stress response
The genetic relationships among the accessions had been already investigated using both a genetic-
similarity and a model-based Bayesian clustering method (Maccaferri et al. 2006, 2011; Letta et al.
2013). Results are reported in Fig. 3. Both methods pointed out that the minimum and optimum
number of hypothetical well-distinct subgroups present in the panel were five. It was shown that the
five subgroups corresponded to clearly distinct breeding lineages: 1) the ICARDA germplasm bred

125
for the dryland areas (subgroup S1); 2) the ICARDA germplasm bred for the temperate areas
(subgroup S2); 3) the Italian and early ’70s CIMMYT germplasm (subgroup S3); 4) the late ’70s
CIMMYT germplasm, widely adapted to Mediterranean conditions (subgroup S4); 5) the late ’80s,
to early ’90s CIMMYT germplasm, with increased yield potential (subgroup S5). Based on the
molecular assignment of each accession to the subgroup with the highest Bayesian probability, the
five subgroups included 11, 55, 26, 56 and 35 accessions, respectively. The range values for the three
heat response traits accounted for by population structure ranged from a minimum of 7.7% for CON
to a maximum of 12.1% for AQU. These values can be considered rather low as compared to the
reported influence of population structure on other important adaptive and agronomic traits in other
species, such as maize and rice (Flint-Garcia et al. 2003; Zhao et al. 2011).
The mean of phenotypic variation for the constitutive, constitutive-acquired and acquired heat stress
response of the 183 durum wheat accessions subdivided into the five main population structure
groups are reported in Fig. 4. These values clearly show that all five sub-groups included accessions
with a wide range of responses, thus indicating that all subgroups are equally informative and well-
suited for AM purposes. For all three heat response traits, subgroups 1, 3 and 5 (CIMMYT
germplasm of late 80s, early 90s) had the highest frequency of the phenotypic variation accessions.
No significant relationship between phenotypic values of CMS traits and population structure was
detected (data not shown), indicating that the variation observed here was not influenced by the
coefficient of membership of the tested material to the five germplasm subgroups.
6.4.3 QTL analysis for heat stress response
QTL analysis results indicated the presence of QTLs for the investigated heat response traits in all
chromosome groups (complete list of the QTLs are reported in Table 2). Overall, we identified 19
QTLs for CON, 5 for AQU and 10 for CON_AQU. Among these 34 QTLs, four QTLs (i.e.,
QCON12_5A, QCON15_6A, QCON_AQU8_6B and QCON18_7B) were significant at marker-wise
significance level of P < 0.001 (-log10 > 3.0). Major QTLs (LOD ≥ 3) for CON were detected on
chromosome 5A (R2
value 8.0%), 6A (R2
value 7.3%) and 7B (R2
value 8.3%) and also for
CON_AQU was detected only on chromosome 6B (R2
value 7.7%). These four QTLs were therefore
considered as high-confidence QTLs.

126
Table 3 lists the most representative durum varieties of the panel well-distributed to the five
subgroups (Maccaferri et al. 2006) and some of the founders of the mapping populations available at
the facilities of the University of Bologna. For each of the 16 genotypes the genetic contribution at
the four major QTL is shown. Note that some genotypes from the CIMMYT or Italian breeding
programs cumulate beneficial alleles at all four QTLs (Gallareta and Meridiano).
It is interesting that a higher number (nearly double) of QTLs were detected for CON heat response
trait (heat shock applied to detached leaves) as compared to the two traits involving acquired
responses (AQU and CON_AQU) measured on living plants pre-adapted to high temperatures. The
reason for this result could be that the constitutive response on detached leaves has a less complex
genetic basis and higher heritability than acquired resistance observed on intact plants.
Coincidence between QTLs for CON and CON_AQU was observed for a few QTLs, namely on
chromosomes 5B (43.3 cM) and 7B (172.9 cM). Coincidence between QTLs for CON and AQU
response was observed for only one QTL region (chromosome 3B, 86.3 cM).
6.5 CONCLUSIONS
Measurement of CMS is one such a technique that has been used to obtain a proxy index for both
heat and drought tolerance in various crops. It is therefore a potentially interesting tool to help in the
selection phase of breeding programs addressing increased heat tolerance. In this research study, we
showed that assessing the response to heat stress based on cell membrane stability in durum wheat
elite germplasm is feasible and informative in terms of QTL identification. The wide range of
genetic variation found for the tested traits and the limited influence of population structure on the
traits allow us to consider with confidence the possibility to use the QTL information identified in
this study for subsequent validation of the physiological bases underlying the QTLs and their
breeding value.

127
6.6 REFERENCES
Anderson JA (2003) Plant genomics and its impact on wheat breeding. In: Plant molecular breeding
(H.J.Newbury, Ed.), Blackwell Publ., Boca Raton, 184-215
Aneja B, Yadav NR, Chawla V, Yadav RC (2012) Sequence-related amplified polymorphism
(SRAP) molecular marker system and its applications in crop improvement. Mol Breeding
30:1635–1648
Belaid A (2000) Durum wheat in WANA: production, trade and gains from technological change.
Proceedings of the seminar ‘Durum wheat improvement in the Mediterranean region: new
challenges. Zaragoza, Spain, 12–14 April 2000. Options Mediterraneennes, Serie A, Seminaires
Mediterraneens, 40, 35–49
Blum, A (1988) Plant breeding for stress environments. CRC Press, Inc., Boca Raton, Florida, pp.
223
Blum A, Ebercon A (1981) Cell membrane stability as a measure of drought and heat tolerance in
wheat. Crop Science 21: 43-47
Bradbury PJ, Zhang Z, Kroon DE, Casstevens TM, Ramdoss Y, Buckler ES (2007) TASSEL:
software for association mapping of complex traits in diverse samples. Bioinformatics 23:2633–
2635. doi:10.1093/bioinformatics/btm308
Camejo D, Rodríguez P, Morales MA, Dell’amico JM, Torrecillas A, Alarcón JJ (2005) High
temperature effects on photosynthetic activity of two tomato cultivars with different heat
susceptibility. J. Plant Physiol. 162: 281-289
Deryng D, Conway D, Ramankutty N, Price J, Warren R (2014) Global crop yield response to
extreme heat stress under multiple climate change futures Environ. Res. Lett. 9-034011
Ehlers JD, Hall AE (1998) Heat tolerance of contrasting cowpea lines in short and long days. Field
Crops Res. 55: 11-21
Elshafei AA, Saleh M, Al-Doss AA, Moustafa KA, Al-Qurainy FH, Barakat MN (2013)
Identification of new SRAP markers linked to leaf chlorophyll content, flag leaf senescence and
cell membrane stability traits in wheat under water-stressed condition. Aust. J. Crop Sci. 7: 887–
893
Ersoz ES, Yu J, Buckler ES (2007) Applications of linkage disequilibrium and association mapping.
In: Varshney RK, Tuberosa R (eds) Genomics-assisted crop improvementvol 1: genomics

128
approaches and platforms, vol 1. Springer, New York, pp 97–120
Flint-Garcia SA, Thronsberry JM, Buckler IV ES (2003) Structure of linkage disequilibrium in
plants. Annu. Rev. Plant Biol. 2003. 54:357–74
Gourdji SM, Sibley AM, Lobell DB (2013) Global crop exposure to critical high temperatures in the
reproductive period: historical trends and future projections Environ. Res. Lett. 8-024041
Habash DZ, Kehel Z, Nachit M (2009) Genomic approaches for designing durum wheat ready for
climate change with a focus on drought. J Exp Bot 60: 2805–2815
Hays DB, Do JH, Mason RE, Morgan G, Finlayson SA (2007) Heat stress induced ethylene
production in developing wheat grains induces kernel abortion and increased maturation in a
susceptible cultivar. Plant Science 172:1113-1123
Kumar S, Kumari P, Kumar U, Grover M, Kumar Singh A, Singh R, Sengar RS (2013) Molecular
approaches for designing heat tolerant wheat. J. Plant Biochem. Biotechnol. DOI
10.1007/s13562-013-0229-3
Ibrahim A, Quick JS (2001a) Heritability of heat tolerance in winter and spring wheat. Crop Sci.
41:1401–1405.
Ibrahim A, Quick JS (2001b) Genetic control of high temperature tolerance in wheat as measured by
membrane thermal stability. Crop Sci. 41:1405–1407
Letta T, Maccaferri M, Ammar K, Badebo A, Ricci A, Crossa J, Tuberosa R (2013) Searching for
novel sources of field resistance to Ug99 and Ethiopian stem rust races in durum wheat via
association mapping. Theor. Appl. Genet. DOI: 10.1007/s00122-013-2050-8
Lobell DB, Sibley A, Ortiz-Monasterio JI (2012) Extreme heat effects on wheat senescence in India
Nat. Clim. Change 2, 186–9
Maccaferri M, Sanguineti MC, Natoli V, Ortega JLA, Ben Salem M, Bort J, Chenenaoui C, De
Ambrogio E, del Moral LG, De Montis A, El-Ahmed A, Maalouf F, Machlab H, Moragues M,
Motawaj J, Nachit M, Nserallah N, Ouabbou H, Royo C, Tuberosa R (2006) A panel of elite
accessions of durum wheat (Triticum durum Desf.) suitable for association mapping studies.
Plant Gen Res 4: 79–85
Maccaferri M, Sanguineti MC, Corneti S, Ortega JLA, Ben Salem M, Bort J, DeAmbrogio E, del
Moral LFG, Demontis A, El-Ahmed A, Maalouf F, Machlab H, Martos V, Moragues M,
Motawaj J, Nachit M, Nserallah N, Ouabbou H, Royo C, Slama A, Tuberosa R (2008)

129
Quantitative trait loci for grain yield and adaptation of durum wheat (Triticum durum Desf.)
across a wide range of water availability. Genetics 178: 489-511
Maccaferri M, Sanguineti MC, Mantovani P, Demontis A, Massi A, Ammar K, Kolmer J, Czembor
J, Ezrati S, Tuberosa R (2010) Association mapping of leaf rust response in durum wheat. Mol
Breeding 26: 189-228
Maccaferri M, Sanguineti MC, del Moral LFG, Demontis A, El-Ahmed A, Maalouf F, Machlab H,
Martos V, Moragues M, Motawaj J, Nachit M, Nserallah N, Ouabbou H, Royo C, Slama A,
Tuberosa R (2011) Association mapping in durum wheat grown across a broad range of water
regimes and yield potential. J Exp Bot 62: 409-438
Maccaferri M, Cane MA, Salvi S, Noli E, Colalongo C,Massi A, Clarke F, Pozniak C, Korol A,
Fahima T, Dubcovsky J, Xu S, Karsai I, Knox R, Clarke J, Tuberosa R (2014) A consensus
framework map of durum wheat (Triticum durum Desf.) suitable for linkage disequilibrium
analysis and genome-wide association mapping. BMC Genomics 15:873
Manifesto MM, Schlatter A, Hopp HE, Suarez EY, Dubcovsky J (2001) Quantitative evaluation of
genetic diversity in wheat germplasm using molecular markers. Crop Sci. 41: 682-690
Mantovani P, Maccaferri M, Sanguineti MC, Tuberosa R, Catizone I, Wenzl P, Thomson B, Carling
J, Huttner E, DeAmbrogio E, Kilian A (2008) An integrated DArT-SSR linkage map of durum
wheat. Mol Breed 22: 629–648
Marti J, Slafer GA (2014) Bread and durum wheat yields under a wide range of environmental
conditions. Field Crops Research 156, 258–271
Melchinger AE (1990) Use of molecular markers in breeding for oligogenic disease resistance. Plant
Breed 104: 1-19
Mohan M, Nair S, Bhagwat A, Krishna TG, Yano M, Bhatia CR, Sasaki T (1997) Genome mapping,
molecular markers and marker assisted selection in crop plants. Mol Breed 3:87-93
Morancho J (2000) Production and marketing of durum wheat worldwide. Proceedings of the
seminar ‘Durum wheat improvement in the Mediterranean region: new challenges. Zaragoza,
Spain, 12–14 April 2000. Options Mediterraneennes, Serie A, Seminaires Mediterraneens, 40,
35–49
Ottaviano E, Gorla MS, Pe E, Frova C (1991) Molecular markers (RFLPs and HSPs) for the genetic
dissection of thermotolerance in maize. Theor. Appl. Genet. 81:713–719

130
Paterson AH, Tanksley SD, Sorrells ME (1991) DNA markers in plant improvement. Adv. Agron.
46:39-90
Plaut Z, Butow BJ, Blumenthal CS, Wrigley CW (2004) Transport of dry matter into developing
wheat kernels and its contribution to grain yield under post-anthesis water deficit and elevated
temperature. Field Crops Research 86:185-198
Pradhan GP, Vara Prasad PV, Fritz AK, Kirkham MB, Gill BS (2012) Effects of drought and high
temperature stress on synthetic hexaploid wheat. Functional Plant Biology 39(3) 190-198
Pritchard JK, Stephens M, Rosenberg NA, Donnelly P (2000) Association mapping in structured
populations. Am J Hum Genet 67:170–181
Reynolds M, Balota M, Delgado M, Amani I, Fischer R (1994) Physiological and morphological
traits associated with spring wheat yield under hot, irrigated conditions. Funct Plant Biol 21:
717–730
Ristic Z, Bukovnik U, Vara Prasad PV, West M (2008) A model for prediction of heat stability of
photosynthetic membranes. Crop Sci 48: 1513–1522
Sanguineti MC, Li S, Maccaferri M, Corneti S, Rotondo F, Chiari T, Tuberosa R (2007) Genetic
dissection of seminal root architecture in elite durum wheat germplasm. Ann Appl Biol
151:291–305. doi:10.1111/j.1744-7348.2007. 00198.x
Shafeeq S, Rahman M, Zafar Y (2006) Genetic variability of different wheat (Triticum aestivum L.).
Pak. J. Bot. 38: 1671–1678
Singh RK, Chaudhary BD (1985) Biometrical Methods in Quantitative Genetic Analysis. Kalyani
Publishers Ludhiana, New Delhi. pp. 102-164
Sorrells ME, Yu J (2009) Linkage disequilibrium and association mapping in the Triticeae. Genet
Genomics Triticeae 7:655–683. doi:10.1007/978-0-387-77489-3-22
Stich B, Melchinger AE, Frisch M, Maurer HP, Heckenberger M, Reif JC (2005) Linkage
disequilibrium in European elite maize germplasm investigated with SSRs. Theor Appl Genet
111:723–730
Sullivan CY (1972) Mechanism of heat and drought resistance in grain sorghum and methods of
measurement. In: Rao NGP, House LR, editors. Sorghum in the seventies. New Delhi, India:
Oxford & IBH publ Co.; p. 247–64
Talukder S, Babar M, Vijayalakshmi K, Poland J, Prasad P, Bowden R, Fritz A (2014) Mapping

131
QTL for the traits associated with heat tolerance in wheat ( Triticum aestivum L.). BMC Genet.
15:97
Tashiro T, Wardlaw IF (1989) A comparison of the effect of high-temperature on grain development
in wheat and rice. Annals of Botany 64:59-65
Tashiro T, Wardlaw IF (1990) The response to high-temperature shock and humidity changes prior
to and during the early stages of grain development in wheat. Australian Journal of Plant
Physiology 17:551-561
Tripathy JN, Zhang J, Robin S, Nguyen HT (2000) QTLs for cell-membrane stability mapped in rice
(Oryza sativa L.) under drought stress. Theor. Appl. Genet.100:1197–1202
Varshney RK, Tuberosa R (2007) Application of linkage disequilibrium and association mapping in
crop plants. Genomics Approaches and Platforms, Vol 1: 97-119
Wahid A, Gelani S, Ashraf M, Foolad M (2007) Heat tolerance: an overview. Environ. Exp. Bot. 61,
199–223
Wardlaw IF, Dawson IA, Munibi P, Fewster R (1989) The tolerance of wheat to hightemperatures
during reproductive growth: 1. survey procedures and general response patterns. Australian
Journal of Agricultural Research 40:1-13
Young ND (1996) QTL mapping and quantitative disease resistance in plants. Annu Rev
Phytopathol 34:479-501
Yang J, Sears RG, Gill BS, Paulsen GM (2002a) Genotypic differences in utilization of assimilate
sources during maturation of wheat under chronic heat and heat shock stresses - Utilization of
assimilate sources by wheat under heat stresses. Euphytica 125:179-188
Yang J, Sears RG, Gill BS, Paulsen GM (2002b) Growth and senescence characteristics associated
with tolerance of wheat-alien amphiploids to high temperature under controlled conditions.
Euphytica 126:185-193
Yang J, Sears RG, Gill BS, Paulsen GM (2002c) Quantitative and molecular characterization of heat
tolerance in hexaploid wheat. Euphytica 126:275-282
Yu JM, Pressoir G, Briggs WH, Bi IV, Yamasaki M, Doebley JF, McMullen MD, Gaut BS, Nielsen
DM, Holland JB, Kresovich S, Buckler ES (2006) A unified mixed-model method for
association mapping that accounts for multiple levels of relatedness. Nat Genet 38:203–208.
doi:10.1038/ ng1702

132
Zhao K, Tung CW, Eizenga GC, Wright MH, Ali ML, Price AH, Norton GJ, Islam MR, Reynolds
A, Mezey J, McClung AM, Bustamante CD, McCouch SR (2011) Genome-wide association
mapping reveals a rich genetic architecture of complex traits in Oryza sativa. Nature
communications. DOI: 10.1038/ncomms1467

133
FIGURES

134
Fig. 1 Histogram distribution for the constitutive, constitutive-acquired and acquired heat stress
response of the 183 durum wheat accessions

135
Fig. 2 Cumulative distribution for the constitutive, constitutive-acquired and acquired heat stress
response of the 183 durum wheat accessions
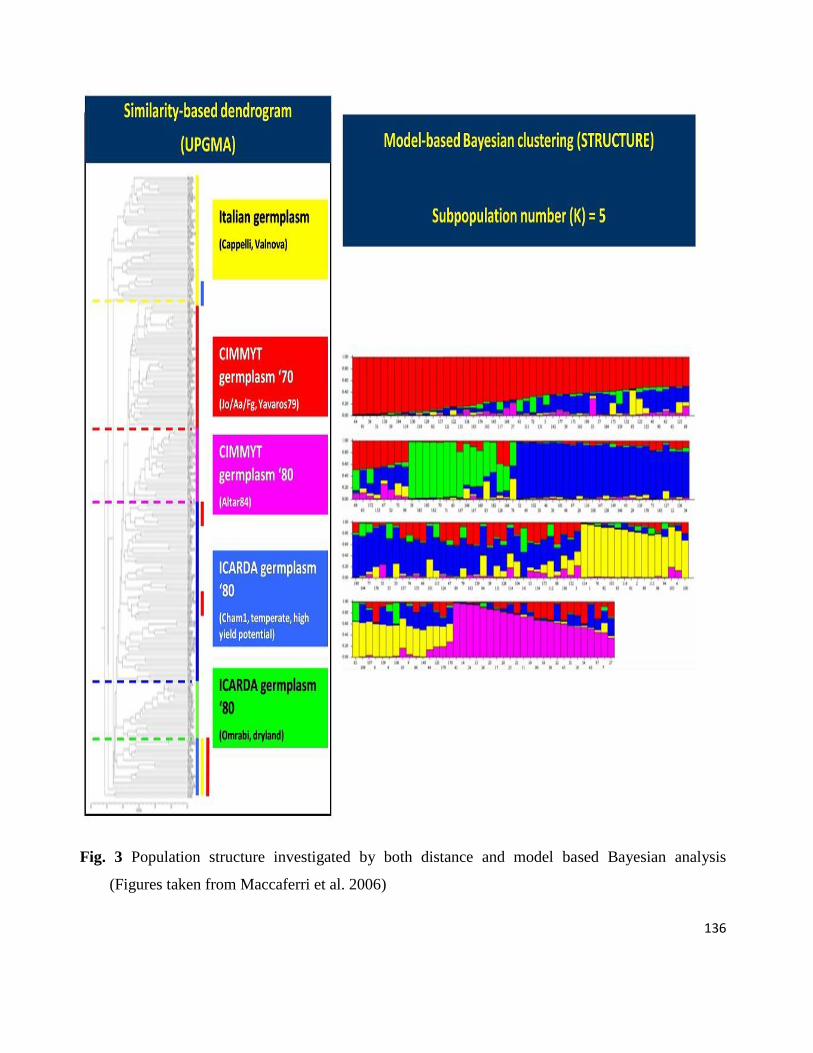
136
Fig. 3 Population structure investigated by both distance and model based Bayesian analysis
(Figures taken from Maccaferri et al. 2006)

137
Fig. 4 The mean of phenotypic variation for the constitutive, constitutive-acquired and acquired heat
stress response of the 183 durum wheat accessions subdivided into the five main population structure
groups

138
TABLES

139
Table 1 Mean, minimum, maximum values for the constitutive, constitutive-acquired and acquired
heat stress response of the 183 durum wheat accessions. Coefficient of variation and heritability
values for each trait are reported
Trait CON AQU CON_ AQU
Mean 39.26 98.2 71.2
Max 133.5 133.6 115.5
Min 1.8 60.7 18.7
P accessions a
** ** **
P replicates b ns ns **
CV (%) 6.1 4.8 20.9
h2 (%) 59 31 86
a Significance of the difference between accessions
b Significance of the difference between replicates. ns = non significant, ** P<0.01

140
Table 2 Complete list of the QTLs identified with significant concurrent effects for the constitutive,
constitutive-acquired and acquired heat stress response
QTL Trait Chr. Marker
Peak
(cM)
P(−log10)
*
R2
% Effect
Effect%
of mean
QCON1_1A CON. 1A wmc95-1A1-a1 18.6 2.09 3.92 -12.10 30.81
QCON_AQU1_1B CON_AQU. 1B gpw3013-1B-a4 26.7 2.71 5.44 9.57 13.44
QCON2_1B CON. 1B wmc85-1B-a2 0.5 2.13 4.02 -10.77 27.42
QCON3_1B CON. 1B wmc500-1B-a4 20.8 2.06 3.87 11.81 30.07
QCON_AQU2_2A CON_AQU. 2A wmc658-2A-a1 17.5 2.72 5.47 7.20 10.11
QCON_AQU3_2B CON_AQU. 2B wmc361-2B-a3 225.7 1.67 2.98 -6.59 9.26
QCON4_2B CON. 2B wPt-5513-2B 45.2 1.47 2.51 -5.58 14.22
QCON5_2B CON. 2B barc55-2B-a6 65.5 2.88 5.84 -4.08 10.38
QCON6_3A CON. 3A wPt-2810-3A 2.1 2.22 4.24 -9.43 24.02
QAQU1_3A AQU. 3A barc1113-3A-a1 146.4 2.22 4.50 -2.44 2.49
QCON_AQU4_3B CON_AQU. 3B wPt-3536-3B 17.2 2.27 4.38 10.35 14.54
QCON_AQU5_3B CON_AQU. 3B ksm45-3B-a4 44.5 2.85 5.80 -11.78 16.54
QCON7_3B CON. 3B rPt-5396-3B 86.3 2.59 5.13 9.03 23.01
QCON8_3B CON. 3B wmc418-3B-a4 113.8 2.71 5.42 13.39 34.10
QAQU2_3B AQU. 3B wPt-9432-3B 87.8 2.41 4.98 2.91 2.97
QAQU3_3B AQU. 3B wPt-7145-3B 147.3 2.01 3.97 -2.17 2.21
QAQU4_3B AQU. 3B wPt-8959-3B 204.1 1.55 2.85 2.48 2.52
QCON_AQU6_4A CON_AQU. 4A wmc617-4A-a1 37.9 2.01 3.75 10.65 14.96
QCON9_4A CON. 4A barc155-4A-a3 54 2.01 3.74 8.90 22.67
QCON10_4A CON. 4A wPt-7289-4A 96.1 1.87 3.43 -9.05 23.06
QAQU5_4A AQU. 4A wPt-1262-4A 88.4 1.73 3.27 -3.03 3.08
QCON11_4B CON. 4B wPt-8543-4B 66.9 2.80 5.64 -12.05 30.69
QCON12_5A CON. 5A gwm126-5A-a3 155.1 3.73 8.00 -11.50 29.28
QCON_AQU7_5B CON_AQU. 5B barc74-5B-a4 43.3 2.46 4.84 5.62 7.89
QCON13_5B CON. 5B barc74-5B-a4 43.3 2.11 3.99 -2.90 7.39
QCON14_5B CON. 5B wPt-5604-5B 111.5 1.64 2.90 17.49 44.55
QCON15_6A CON. 6A gwm1089-6A-a6 131 3.46 7.30 14.53 37.00
QCON_AQU8_6B CON_AQU. 6B wPt-8336-6B 5.1 3.59 7.67 7.00 9.83
QCON_AQU9_6B CON_AQU. 6B wPt-1325-6B 157.9 2.06 3.87 5.97 8.38
QCON16_7A CON. 7A wPt-7053-7A 172.1 1.74 3.12 8.01 20.40
QCON_AQU10_7B CON_AQU. 7B gwm611-7B2-a4 172.9 2.63 5.25 9.52 13.37
QCON17_7B CON. 7B gwm3019-7B-a2 62.8 2.13 4.02 -15.59 39.72
QCON18_7B CON. 7B wmc526-7Ba-a3 190.8 3.85 8.32 -15.56 39.62
QCON19_7B CON. 7B gwm611-7B2-a8 172.9 2.25 4.57 2.13 2.17
*QTLs with (−log10) <2 are considered as low- confidence QTLs

141
Table 3 Results of four major QTLs (LOD ≥ 3) were detected for the constitutive, constitutive-
acquired heat stress response among the 183 tested durum wheat accessions
QCON12_5A QCON15_6A QCON18_7B QCON_AQU8_6B
P(−log10) >3.0 3.73 3.46 3.85 3.59
Effect -11.50 (A) 14.53 (T) -15.56 (T) 7.0 (A)
CAPEITI A(-) T(+) T(-) T(-)
CAPPELLI T(+) T(+) T(-) T(-)
CHAM-1 A(-) A(-) T(-) T(-)
CLAUDIO A(-) T(+) T(-) T(-)
COLOSSEO T(+) T(+) T(-) A(+)
CRESO T(+) T(+) T(-) A(+)
GALLARETA T(+) T(+) A(+) A(+)
HAURANI A(-) T(+) T(-) T(-)
IRIDE A(-) T(+) T(-) A(+)
KARIM T(+) T(+) T(-) A(+)
KOFA A(-) T(+) T(-) T(-)
MERIDIANO T(+) T(+) A(+) A(+)
MEXICALI 75 A(-) A(-) T(-) A(+)
MOHAWK T(+) T(+) T(-) T(-)
SVEVO T(+) A(-) A(+) A(+)
VALNOVA T(+) A(-) T(-) A(+)

142
Appendix
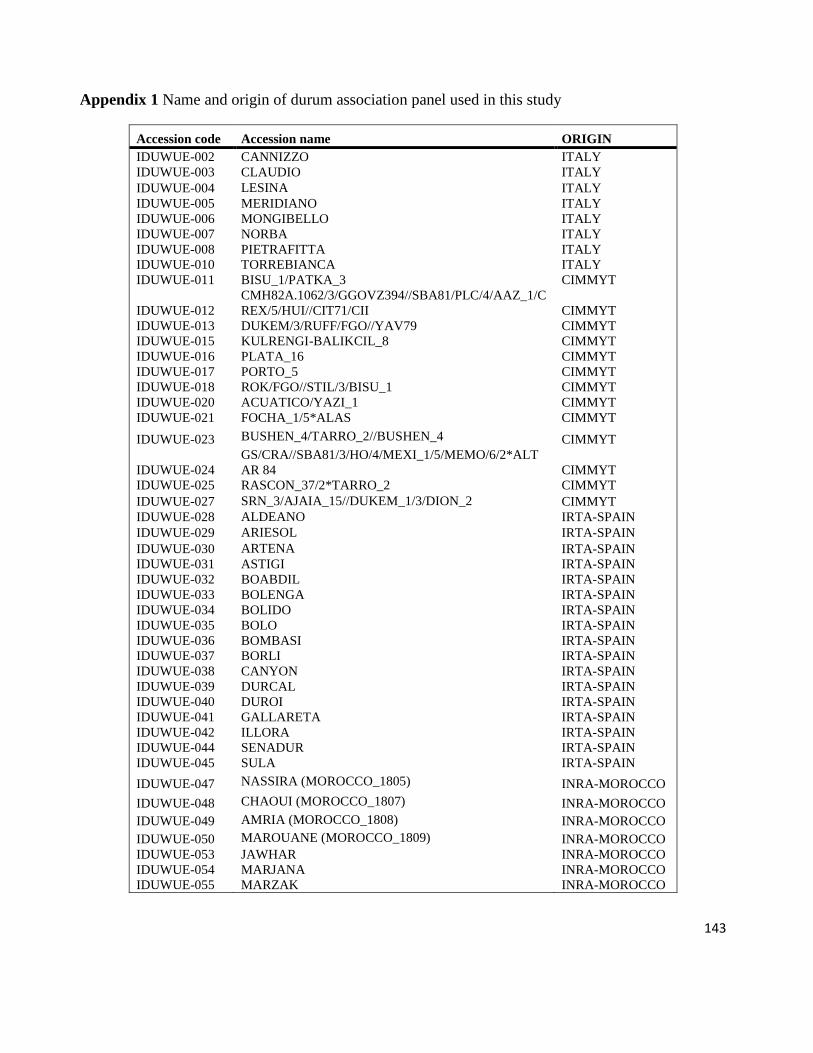
143
Appendix 1 Name and origin of durum association panel used in this study
Accession code Accession name ORIGIN
IDUWUE-002 CANNIZZO ITALY
IDUWUE-003 CLAUDIO ITALY
IDUWUE-004 LESINA ITALY
IDUWUE-005 MERIDIANO ITALY
IDUWUE-006 MONGIBELLO ITALY
IDUWUE-007 NORBA ITALY
IDUWUE-008 PIETRAFITTA ITALY
IDUWUE-010 TORREBIANCA ITALY
IDUWUE-011 BISU_1/PATKA_3 CIMMYT
IDUWUE-012
CMH82A.1062/3/GGOVZ394//SBA81/PLC/4/AAZ_1/C
REX/5/HUI//CIT71/CII CIMMYT
IDUWUE-013 DUKEM/3/RUFF/FGO//YAV79 CIMMYT
IDUWUE-015 KULRENGI-BALIKCIL_8 CIMMYT
IDUWUE-016 PLATA_16 CIMMYT
IDUWUE-017 PORTO_5 CIMMYT
IDUWUE-018 ROK/FGO//STIL/3/BISU_1 CIMMYT
IDUWUE-020 ACUATICO/YAZI_1 CIMMYT
IDUWUE-021 FOCHA_1/5*ALAS CIMMYT
IDUWUE-023 BUSHEN_4/TARRO_2//BUSHEN_4 CIMMYT
IDUWUE-024
GS/CRA//SBA81/3/HO/4/MEXI_1/5/MEMO/6/2*ALT
AR 84 CIMMYT
IDUWUE-025 RASCON_37/2*TARRO_2 CIMMYT
IDUWUE-027 SRN_3/AJAIA_15//DUKEM_1/3/DION_2 CIMMYT
IDUWUE-028 ALDEANO IRTA-SPAIN
IDUWUE-029 ARIESOL IRTA-SPAIN
IDUWUE-030 ARTENA IRTA-SPAIN
IDUWUE-031 ASTIGI IRTA-SPAIN
IDUWUE-032 BOABDIL IRTA-SPAIN
IDUWUE-033 BOLENGA IRTA-SPAIN
IDUWUE-034 BOLIDO IRTA-SPAIN
IDUWUE-035 BOLO IRTA-SPAIN
IDUWUE-036 BOMBASI IRTA-SPAIN
IDUWUE-037 BORLI IRTA-SPAIN
IDUWUE-038 CANYON IRTA-SPAIN
IDUWUE-039 DURCAL IRTA-SPAIN
IDUWUE-040 DUROI IRTA-SPAIN
IDUWUE-041 GALLARETA IRTA-SPAIN
IDUWUE-042 ILLORA IRTA-SPAIN
IDUWUE-044 SENADUR IRTA-SPAIN
IDUWUE-045 SULA IRTA-SPAIN
IDUWUE-047 NASSIRA (MOROCCO_1805) INRA-MOROCCO
IDUWUE-048 CHAOUI (MOROCCO_1807) INRA-MOROCCO
IDUWUE-049 AMRIA (MOROCCO_1808) INRA-MOROCCO
IDUWUE-050 MAROUANE (MOROCCO_1809) INRA-MOROCCO
IDUWUE-053 JAWHAR INRA-MOROCCO
IDUWUE-054 MARJANA INRA-MOROCCO
IDUWUE-055 MARZAK INRA-MOROCCO

144
Appendix 1 Continued…
Accession code Accession name ORIGIN
IDUWUE-056 OURGH INRA-MOROCCO
IDUWUE-057 TAREK INRA-MOROCCO
IDUWUE-060 AWALBIT ICARDA
IDUWUE-061 BCR/3/CHAM_1//GTA/STR ICARDA
IDUWUE-062 CHHB88/DERAA ICARDA
IDUWUE-063 CHACAN ICARDA
IDUWUE-064 KARIM ICARDA
IDUWUE-065 HML/CHHB88 ICARDA
IDUWUE-066 KRS/HCN ICARDA
IDUWUE-067 MURLAGOST-3 ICARDA
IDUWUE-068 MOULSABIL_2 ICARDA
IDUWUE-069 OMBAR ICARDA
IDUWUE-071 MRB589_5 ICARDA
IDUWUE-072
QUADALETE//ERP/MAL/3/UNKNOWN(VSGI,ODES
SA) ICARDA
IDUWUE-073 SEBAH ICARDA
IDUWUE-074 STOJOCRI_3 ICARDA
IDUWUE-075 ZEINA_1 ICARDA
IDUWUE-076 ANTON ICARDA
IDUWUE-077 APPIO ITALY
IDUWUE-079 ARCANGELO ITALY
IDUWUE-080 ARCOBALENO ITALY
IDUWUE-081 BRAVADUR DESERT
IDUWUE-082 BRONTE ITALY
IDUWUE-083 CAPEITI 8 ITALY
IDUWUE-084 CAPPELLI ITALY
IDUWUE-085 CICCIO ITALY
IDUWUE-086 COLORADO-DW DESERT
IDUWUE-087 COLOSSEO ITALY
IDUWUE-088 CORTEZ DESERT
IDUWUE-089 CRESO ITALY
IDUWUE-090 DON PEDRO ITALY
IDUWUE-091 DUILIO ITALY
IDUWUE-093 FLAMINIO ITALY
IDUWUE-094 FORTORE ITALY
IDUWUE-095 GARGANO ITALY
IDUWUE-096 GRAZIA ITALY
IDUWUE-097 IRIDE ITALY
IDUWUE-098 ITALO ITALY
IDUWUE-099 IXOS ITALY
IDUWUE-100 KRONOS DESERT
IDUWUE-102 MESSAPIA ITALY
IDUWUE-103 MEXICALI 75 ITALY
IDUWUE-104 MOHAWK ITALY
IDUWUE-105 OFANTO ITALY
IDUWUE-106 PLATANI ITALY
IDUWUE-107 PLINIO ITALY
IDUWUE-108 PRODURA ITALY
IDUWUE-109 REVA ITALY
IDUWUE-110 ROQUENO ITALY

145
Appendix 1 Continued…
Accession code Accession name ORIGIN
IDUWUE-111 SVEVO ITALY
IDUWUE-112 TRINAKRIA ITALY
IDUWUE-113 VALBELICE ITALY
IDUWUE-114 VALNOVA ITALY
IDUWUE-116 WESTBRED 881 DESERT
IDUWUE-117 WESTBRED TURBO DESERT
IDUWUE-118 AGHRASS_1 ICARDA
IDUWUE-119 AINZEN_1 ICARDA
IDUWUE-120 ANGRE ICARDA
IDUWUE-121 AMEDAKUL-1 ICARDA
IDUWUE-122 AMMAR-1 ICARDA
IDUWUE-123 ARISLAHN-5 ICARDA
IDUWUE-124 ATLAST-1 ICARDA
IDUWUE-125 AUS1 ICARDA
IDUWUE-126 AWALI_1 ICARDA
IDUWUE-127 RADIOSO ITALY
IDUWUE-128 AZEGHAR_2 ICARDA
IDUWUE-130 BICRE ICARDA
IDUWUE-131 BICREDERAA_1 ICARDA
IDUWUE-132 BIGOST-1 ICARDA
IDUWUE-133 BELIKH 2 ICARDA
IDUWUE-134 BRACHOUA ICARDA
IDUWUE-135 CHAHBA88 ICARDA
IDUWUE-136 CHAM_1 ICARDA
IDUWUE-137 DERAA ICARDA
IDUWUE-139 GEROMTEL-1 ICARDA
IDUWUE-140 GEZIRA-17 ICARDA
IDUWUE-141 GIDARA_2 ICARDA
IDUWUE-142 GUEROU_1 ICARDA
IDUWUE-144 HAURANI ICARDA
IDUWUE-145 HEIDER ICARDA
IDUWUE-146
OSL_1/4/BUC/CHRC//PRL/3/PVN/5/HEL/3/YAV/COR
M//SHWA ICARDA
IDUWUE-147 SEBOU ICARDA
IDUWUE-148 BLK2//134XS-69-186/368-1/3/MRB589_5/4/ALBT_3 ICARDA
IDUWUE-149 ARIC31708.70/3/BO-DW//CDECH/BR-DW/4/CIT71/GT ICARDA
IDUWUE-150 JORDAN ICARDA
IDUWUE-151 KABIR 1 ICARDA
IDUWUE-153 KHABUR_1 ICARDA
IDUWUE-154 KORIFLA ICARDA
IDUWUE-155 LAGONIL-2 ICARDA
IDUWUE-156 LAHN ICARDA
IDUWUE-157 LOUKOS_1 ICARDA
IDUWUE-158 MAAMOURI-1 ICARDA
IDUWUE-159 MARSYR-1 ICARDA
IDUWUE-160 MASSARA_1 ICARDA
IDUWUE-161 MIKI-1 ICARDA
IDUWUE-163 MURLAGOST-1 ICARDA
IDUWUE-164 NILE ICARDA
IDUWUE-166 OMGENIL_3 ICARDA
IDUWUE-167 OMLAHN-3 ICARDA

146
Appendix 1 Continued….
Accession code Accession name ORIGIN
IDUWUE-168 OMRUF-2 ICARDA
IDUWUE-169 OMSNIMA-1 ICARDA
IDUWUE-170 ORONTE 1 ICARDA
IDUWUE-171 OTB-6 ICARDA
IDUWUE-172 OUASERL_1 ICARDA
IDUWUE-173 OUASLAHN-1 ICARDA
IDUWUE-175 QUABRACH-1 ICARDA
IDUWUE-176 QUADALETE ICARDA
IDUWUE-177 RAZZAK INRAT
IDUWUE-178 SAADA3/DDS//MTL-1 ICARDA
IDUWUE-179 SAJUR ICARDA
IDUWUE-181 SHABHA ICARDA
IDUWUE-182 TELSET_5 ICARDA
IDUWUE-183 TENSIFT_1 ICARDA
IDUWUE-184 TERBOL 97_3 ICARDA
IDUWUE-185 TUNSYR-1 ICARDA
IDUWUE-186 WADALMEZ_1 ICARDA
IDUWUE-187 YOUNES-1 ICARDA
IDUWUE-188 YOUSEF_1 ICARDA
IDUWUE-189 KOFA ITALY
CIMMYT-251 1A.1D 5+10-6/3*MOJO//RCOL CIMMYT
CIMMYT-252 SOOTY_9/RASCON_37 CIMMYT
CIMMYT-253 STOT//ALTAR 84/ALD CIMMYT
CIMMYT-254 SOMAT_4/INTER_8 CIMMYT
CIMMYT-255
CHEN_1/TEZ/3/GUIL//CIT71/CII/4/SORA/PLATA_12/5/ST
OT//ALTAR 84/ALD CIMMYT
CIMMYT-256 MALMUK_1//LOTUS_5/F3LOCAL(SEL.ETHIO.135.85) CIMMYT
CIMMYT-257
1A.1D 5+10-6/2*WB881//1A.1D 5+10-
6/3*MOJO/3/BISU_1/PATKA_3 CIMMYT
CIMMYT-258 HESSIAN-F_2/3/STOT//ALTAR 84/ALD CIMMYT
CIMMYT-259
AJAIA_12/F3LOCAL(SEL.ETHIO.135.85)//PLATA_13/3/S
OMAT_3/4/SOOTY_9/RASCON_37 CIMMYT
CIMMYT-260
USDA595/3/D67.3/RABI//CRA/4/ALO/5/HUI/YAV_1/6/AR
DENTE/7/HUI/YAV79/8/POD_9 CIMMYT
CIMMYT-261 CNDO/PRIMADUR//HAI-OU_17/3/SNITAN CIMMYT
CIMMYT-262
GEDIZ/FGO//GTA/3/SRN_1/4/TOTUS/5/ENTE/MEXI_2//H
UI/3/YAV_1/GEDIZ/6/SOMBRA_20/7/STOT//ALTAR
84/ALD CIMMYT
CIMMYT-263 VANRRIKSE_6.2//1A-1D 2+12-5/3*WB881 CIMMYT
CIMMYT-264
RANCO//CIT71/CII/3/COMDK/4/TCHO//SHWA/MALD/3/
CREX/5/SNITAN CIMMYT
CIMMYT-265
PLATA_10/6/MQUE/4/USDA573//QFN/AA_7/3/ALBA-
D/5/AVO/HUI/7/PLATA_13/8/THKNEE_11/9/CHEN/ALTA
R 84/3/HUI/POC//BUB/RUFO/4/FNFOOT CIMMYT
CIMMYT-266
EUDO//CHEN_1/TEZ/3/TANTLO_1/4/PLATA_6/GREEN_1
7 CIMMYT
CIMMYT-267
ROLA_5/3/AJAIA_12/F3LOCAL(SEL.ETHIO.135.85)//PLA
TA_13/4/MALMUK_1/SERRATOR_1 CIMMYT
CIMMYT-268 ARMENT//SRN_3/NIGRIS_4/3/CANELO_9.1 CIMMYT
CIMMYT-269 SOMAT_3/PHAX_1//TILO_1/LOTUS_4 CIMMYT