Embed Size (px)
Citation preview
FACOLTÀ DI SCIENZE AGRARIE E ALIMENTARI Department of Food, Environmental and Nutritional Sciences (DeFENS)
Graduate School in Molecular Sciences and Plant, Food and
Environmental Biotechnology
PhD programme in Food Science, Technology and Biotechnology
XXV cycle
Lactococcus garvieae and Morganella morganii: two bacterial models to study quality and safety of fish products
Scientific field AGR/16
CHIARA FERRARIO
Tutor: Prof. Maria Grazia Fortina
Co-tutor: Prof. Matteo Scampicchio
PhD Coordinator: Prof. Maria Grazia Fortina
2011/2012

Contents
3
CONTENTS CONTENTS............................................................................................................................................ 3 ABSTRACT............................................................................................................................................ 5 RIASSUNTO .......................................................................................................................................... 6 PREFACE ............................................................................................................................................... 7 REFERENCES........................................................................................................................................ 9 1. AQUACULTURE SECTOR MODEL: Lactococcus garvieae................................................. 10 1.1. STATE OF THE ART.................................................................................................................... 11
1.1.1.Problems in the aquaculture sector....................................................................................... 11 1.1.2.Lactococcosis in aquaculture sector ..................................................................................... 11 1.1.3. Who is Lactococcus garvieae?............................................................................................ 12 1.1.4. Antigenic characteristics of L. garvieae .............................................................................. 12 1.1.5. Genome analysis of L. garvieae .......................................................................................... 13
1.2.AIM OF THE STUDY.................................................................................................................... 15 1.3. MATERIALS AND METHODS ................................................................................................... 16
1.3.1. Sampling, selection, culturing and identification of L. garvieae isolates............................ 16 1.3.2. DNA extraction and quantification ..................................................................................... 16 1.3.3. PCR amplification ............................................................................................................... 16 1.3.4. Multi-locus restriction typing (MLRT) ............................................................................... 16 1.3.5. Genomic fingerprinting of L. garvieae strains .................................................................... 16 1.3.6. PCR-ribotyping ................................................................................................................... 17 1.3.7. Data analysis ....................................................................................................................... 17 1.3.8. Genomes analyses and comparison ..................................................................................... 17 1.3.9. Multi Locus Sequence Typing (MLST) loci amplification ................................................. 17 1.3.10. MLST Data analysis.......................................................................................................... 17 1.3.11. Detection of virulence factors ........................................................................................... 18 1.3.12. RNA extraction and rewriting into cDNA......................................................................... 18 1.3.13. RT-PCR............................................................................................................................. 18
1.4. RESULTS AND DISCUSSIONS .................................................................................................. 22 1.4.1. L. garvieae diffusion in food matrices................................................................................. 22 1.4.2. lacG presence ...................................................................................................................... 22 1.4.3. Plasmid profile .................................................................................................................... 22 1.4.4. Genomic fingerprinting ....................................................................................................... 23 1.4.5. MLRT.................................................................................................................................. 25 1.4.6. PCR-Ribotyping .................................................................................................................. 28 1.4.7. MLST .................................................................................................................................. 30 1.4.8. Preliminary genomes comparison ....................................................................................... 37 1.4.8. Virulence Gene detection .................................................................................................... 41
1.5. CONCLUSIONS............................................................................................................................ 43 1.6. REFERENCES............................................................................................................................... 44 2. FISHING SECTOR MODEL: Morganella morganii ................................................................... 49 2.1. STATE OF THE ART.................................................................................................................... 50
2.1.1. Health hazards in seafood.................................................................................................... 50 2.1.2. Histamine Fish Poisoning.................................................................................................... 51 2.1.3. Regulatory limits and analytical procedures........................................................................ 52 2.1.4. Bacterial origins of histamine in fish................................................................................... 52 2.1.5. Morganella morganii as a model of histamine producing bacteria ..................................... 53
2.2. AIM OF THE STUDY................................................................................................................... 55 2.3. MATERIALS AND METHODS ................................................................................................... 56
2.3.1. Bacterial strains, plasmids and growth conditions .............................................................. 56 2.3.2. Fish sampling ...................................................................................................................... 56
Contents
4
2.3.3. Microbiological examinations and isolation of bacteria...................................................... 56 2.3.4. Chemical analyses ............................................................................................................... 57 2.3.5. DNA extraction and amplification ...................................................................................... 57 2.3.6. hdc and M. morganii detection and 16S rDNA sequencing analysis .................................. 58 2.3.7. Primer design and PCR assay for Morganella morganii detection and quantification........ 58 2.3.8. Quantitative PCR assay ....................................................................................................... 58 2.3.9. Sensitivity studies with pure cultures .................................................................................. 59 2.3.10. Detection studies with seeded and naturally contaminated fish samples........................... 59 2.3.11. DNA manipulation and library.......................................................................................... 59 2.3.12. Heterologous expression of hdc in E. coli ......................................................................... 59 2.3.13. Protein production, purification and activity ..................................................................... 60 2.3.14. RNA isolation.................................................................................................................... 60 2.3.15. RT-PCR experiments ........................................................................................................ 60 2.3.16. Genomic fingerprinting of M. morganii strains................................................................. 61 2.3.17. Statistical analysis ............................................................................................................. 61
2.4. RESULTS AND DISCUSSIONS .................................................................................................. 64 2.4.1. Microbiota in fresh filleted tuna and microbiological changes during storage.................... 64 2.4.2. Histamine content in fish..................................................................................................... 64 2.4.3. Isolation and identification of potential histamine-forming bacteria................................... 66 2.4.4. Histamine formation by bacterial isolates ........................................................................... 67 2.4.5. Fish quality evaluation by PCR........................................................................................... 67 2.4.6. Specificity of primers for M. morganii identification ......................................................... 68 2.4.7. Development of qPCR assay............................................................................................... 70 2.4.8. Sensitivity and detection limits in pure culture ................................................................... 71 2.4.9. Quantification of M. morganii in seeded and naturally contaminated fish.......................... 72 2.4.10. Sequence analysis of the hdc cluster of M. morganii ........................................................ 74 2.4.11. Expression of hdc gene in E. coli ...................................................................................... 76 2.1.12. Expression of the histamine biosynthetic locus................................................................. 77 2.4.13. Molecular fingerprinting ................................................................................................... 79
2.5. CONCLUSIONS............................................................................................................................ 84 2.6. REFERENCES............................................................................................................................... 85 APPENDIX 1. COPIES OF ABSTRACTS OF PAPERS, ORAL COMMUNICATIONS AND POSTERS.............................................................................................................................................. 88 APPENDIX 2. INDEX OF TABLES.................................................................................................. 100 APPENDIX 3. INDEX OF FIGURES ................................................................................................ 101
Abstract
5
ABSTRACT This PhD thesis research project aims to improve the current systems of management and control of food safety, focusing the attention on the study of two contaminating emerging pathogens in fish products: Lactococcus garvieae, the etiological agent of a hemorrhagic septicemia in aquaculture sector, and Morganella morganii, the most active histamine-producing species. In the first part of the research the molecular characterization and genetic polymorphism of L. garvieae strains coming from different food niches were carried out revealing an early separation of L. garvieae population into two independent genetic lineages. Subsequent phylogenetic analyses through a MLST approach confirms the significant genetic heterogeneity in this species, the separation into two principal evolution lineages, and the presence of a third lineage totally separated from the others, that could be the ancestor branch of the main lineages. Genome sequencing of representative selected strains and the comparison with other L. garvieae sequences already present in databases, confirmed the subdivision in the three different subgroups. Within each subgroup the nucleotide similarity was 99%, while comparing subgroups the similarity decreased (94-95%). Moreover, this preliminary comparison reveals that the core genome of L. garvieae contains, in additions to genes codifying for the main metabolic pathways, genes encoding putative virulence factors, such as hemolysins and adhesin. Genes related to carbohydrate fermentation (such as lactose and sucrose) seemed part of the dispensable genome, as well as the gene cluster related to the capsule formation. Experiments carried out to evaluate the expression of virulence-related genes in representative L garvieae strains, indicated an adaptive response to different environmental conditions, specific at the strain-level. Regarding the second part of the research, we started exploring the bacterial population of fresh tuna samples and evaluated the histamine content. Despite low levels of histamine were detected (<10 ppm), many samples showed high total viable counts after temperature abuse. The 10% of the 141 enteric bacteria isolated from samples were identified by 16S rDNA sequence analysis, as M. morganii, the most active histamine-producing species. Subsequently a new quantitative PCR assay for the detection of M. morganii in potentially contaminated fish products before histamine accumulates was developed, with a detection limit of 0.563 pg of pure DNA, corresponding to DNA extracted from approximately nine cells. To improve the knowledge at genome level of the histidine decarboxylase of M. morganii (hdc gene), a region of 7681 bp was sequenced. Results showed the presence of genes encoding two putative histidine/histamine antiporters upstream and downstream the hdc gene, followed by an histidyl-tRNA synthetase. Gene expression analysis indicates that in M. morganii hdc was inducible, showing the highest expression under acidic conditions, mainly in presence of histidine supplementation. Finally, with the aim to prepare a significant collection of different M. morganii strains from different ecological niches, we compared several clinical biotypes, in addition to strains isolated from fish through REP and RAPD PCR analysis. The cluster analysis confirmed the existence of two main branches related to the habitat of isolation, which were separated at a level of similarity of 19%.
Riassunto
6
RIASSUNTO
Lactococcus garvieae e Morganella morganii: due modelli batterici per studiare la qualità e la sicurezza dei prodotti ittici.
Con questo progetto di tesi di dottorato si intende contribuire ad implementare gli attuali sistemi di gestione e controllo della salubrità dei prodotti alimentari, focalizzando l’attenzione sullo studio di due potenziali patogeni emergenti dei prodotti ittici: Lactococcus garvieae, un batterio che causa setticemia nei pesci d’acquacoltura e Morganella morganii la specie maggior produttrice d’istamina. Nella prima parte della ricerca sono stati effettuati esperimenti di caratterizzazione molecolare e polimorfismo genetico di ceppi di L. garvieae provenienti da diverse nicchie alimentari, rivelando una separazione della popolazione di L. garvieae in due indipendenti linee evolutive. Successive verifiche filogenetiche tramite analisi MLST hanno confermato la notevole eterogeneità genetica di questa specie, la separazione in due principali linee evolutive, e la presenza di un terzo raggruppamento totalmente separato dagli altri, che potrebbe rappresentare il ramo antenato delle due linee principali. Il sequenziamento dei genomi di ceppi rappresentativi della collezione e il confronto con altre sequenze di L. garvieae già presenti in banca dati, hanno confermato la suddivisione in tre differenti sottogruppi. Ciascun sottogruppo mostrava un’omologia nucleotidica del 99%, mentre comparando i raggruppamenti, la similarità era inferiore (94-95%). Questo confronto preliminare indicava anche che il “core genome” di L. garvieae contiene, oltre ai geni codificanti per le principali vie metaboliche, anche geni codificanti putativi fattori di virulenza, come emolisine e adesine. I geni relativi alla fermentazione di carboidrati come il lattosio e il saccarosio sembravano invece parte del “dispensable genome”, così come il cluster genico relativo alla formazione di una capsula. Esperimenti condotti per valutare l'espressione di geni correlati alla virulenza in ceppi rappresentativi della collezione di L. garvieae, hanno evidenziato una risposta adattativa in differenti condizioni ambientali, specifica a livello di ceppo. Per quanto riguarda la seconda parte della ricerca, si è iniziato ad esplorare la popolazione batterica di campioni di tonno fresco e valutarne il contenuto di istamina. Nonostante i bassi livelli di istamina detectati (<10 ppm), molti campioni mostravano elevate cariche batteriche vitali, dopo un abuso di temperatura. Il 10% dei 141 enterobatteri isolati dai campioni di tonno sono stati identificati, mediante analisi della sequenza del gene 16S rDNA, come M. morganii, la specie maggior produttrice d’istamina. Successivamente è stata sviluppata una nuova metodica di PCR quantitativa per la rilevazione di M. morganii in prodotti ittici potenzialmente contaminati, avente un limite di rilevamento di 0,563 pg di DNA puro, corrispondente al DNA estratto da circa nove cellule. Per migliorare la conoscenza genetica del gene codificante per l’istidina decarbossilasi (hdc) di M. morganii, è stata sequenziata una regione di 7681 bp. I risultati mostravano la presenza di due geni codificanti per due putativi istidina / istamina antiporters a monte e a valle del gene hdc, seguiti da un istidil-tRNA sintetasi. L’analisi dei livelli di espressione genica ha evidenziato che in M. morganii il gene hdc è inducibile e mostra la più alta espressione in condizioni di acidità, soprattutto in presenza di istidina. Infine, allo scopo di creare una collezione significativa di ceppi di M. morganii provenienti da diverse nicchie ecologiche, sono stati confrontati diversi biotipi clinici, con i ceppi isolati da pesce, attraverso esperimenti di REP e RAPD PCR. Le analisi hanno confermato l'esistenza di due gruppi principali in funzione dell’habitat di isolamento, che mostravano un livello di somiglianza del 19%.
Preface
7
PREFACE Fish is one of the most important foods for its high nutritional value. In fact, it contains a great source of high-quality protein (a portion of 150 g of fish provides about 50–60 % of the daily protein requirements for an adult), vitamins and healthful polyunsaturated fatty acids. The demands of a growing population, particularly in poorer countries, now far outstrip the sustainable yield of the seas. At the same time as fishing has become more industrialised (considerably influenced by globalization in food systems and by innovations and improvements in processing, transportation, distribution, marketing and food science and technology), and wild fish stocks increasingly depleted, aquaculture production—fish and shellfish farming—has grown rapidly to address the shortfalls in capture fisheries (Tidwell & Allan, 2001). During the last two decades the general picture of international trade in seafood (fish and shellfish harvested from capture fisheries and aquaculture production) has changed in size and structure. Seafood is traded within a porous and complex international market that is changing at an impressive pace and scale as compared to other commodities (FAO, 2010). Seafood contributes at least 15% of average animal protein consumption to 2.9 billion people (United Nations Department of Economic and Social Affairs/Population Division, 2009). Capture fisheries and aquaculture supplied the world with about 148 million tonnes of fish in 2010. World aquaculture production attained another all-time high in 2010, at 60 million tonnes (FAO, 2012). Fish it is a very high perishable product with a shelf life limited by microbial growth, due to the presence of native and external bacteria. The producers demand, and, above all the request of the consumers, to have a foodstuff with good quality and safe, is very strong, in relation with the diffusion of new food models that provide the consume of raw fish, typical of Japanese tradition (FAO, 2005). This implies a strong regulatory action combined with a depth control along the entire food chain to ensure the respect of quality and safety parameters of the final product, at local level in the free trade (Ababouch, 2006). Health hazards in seafood can be roughly classified into two categories: pre-harvest and post-harvest risks. Pre-harvest risks are those originating in the environment (Opara et al., 2007). These include chemicals accumulated in fish tissues in the environment, ‘‘natural’’ toxins, and pathogenic microorganisms. Regarding biological components, it is an accepted fact that fish products are in general considered to be safe but they can cause illness when fished from contaminated waters. Vibrio spp., Listeria monocytogenes and Clostridium botulinum can be part of the native microbial population in fish (Huss et al., 2003). Other micro-organisms and viral components, among which Salmonella spp., Shigella spp., Escherichia coli, Norwalk and Calicivirus, may arise from the aquatic contaminated environment (Martinez et al., 2005). Further microbiological risks are related to the stages of transport, processing and distribution of fish, above all when the food is processed under conditions that do not respect hygiene standards, or as a result of insufficient maintenance of the cold chain (De Silva, 2011). Moreover, fish can contain potentially harmful substances, such as biogenic amines, low molecular weight organic bases, formed by microbial decarboxylation of amino acids (Visciano et al., 2012). Biogenic amines are characterized by vasoactive and psychoactive properties that make them able to interact with human metabolism. The most known intoxication is due to histamine, that causes the “scombroid fish poisoning” (Prester, 2011). The true incidence of diseases transmitted by foods is not known. Seafood is at least as significant a source of food-borne illness as other animal protein products. The source of risk in seafood is, on the whole, however, quite different from other protein commodities and requires a significantly richer regulatory approach to ensure effective risk mitigation. Despite numerous efforts to improve the quality of the production process of fish, and to develop more suitable methods for assessing product freshness, quality and healthfulness, there are still some limitations, typically microbiological, related to several factors, among which the incidence and
Preface
8
diffusion in fish of new microbial species, potential emerging pathogens, or new biovars of known bacterial species (Mor-Mur & Yuste, 2010). In this context, the traditional food inspection systems are insufficient, because knowledge of the emerging pathogens is still incomplete. To determine the concept of healthy food, it is crucially important expend efforts for a comprehensive study of new emerging pathogens present in food products for which studies related to their dissemination, impact and role are insufficient. This PhD thesis reports the study of two bacterial species, Lactococcus garvieae and Morganella morganii, that represent models of contaminating emerging pathogens in fish products (Ferrario, 2010, 2011, 2012). During the last decades, one of the most remarkable problems in aquaculture is the contamination with a pathogen typical of the fisheries sector, Lactococcus garvieae, the etiological agent of an hemorrhagic septicemia, known as Lactococcosis (Vendrell et al., 2006), which causes important economic losses, considering the high rate of mortality in fishes, reaching 70%. Despite numerous studies to reduce such contamination, little is yet known about the origin of contamination, the factors related to pathogenicity and the possible interventions to control the development of this emerging pathogen. As Lactococcus garvieae has been associated to human infections and founded in other food sectors, overall in dairy products (Fortina et al., 2003), it could represent a potential emerging pathogen for human. L. garvieae could be a model of Gram positive potential dangerous bacteria, whose knowledge deserves to be thoroughly investigated. In the fishing sector problems are related to find quality and freshness indicators and are more complex because due to type of fish, fishing areas, water contamination and type of fishing. Tuna trades is strongly increased in the last few years (primarily related to its raw consumption) and its healthiness is linked to the limitation of bacterial spoilage, and to the absence of specific pathogenic bacteria that can decarboxylate amino acids producing biogenic amines. In particular, among these compounds histamine, can cause the scombroid syndrome after consumption of spoiled alterated fish products (Economou et al., 2007). Among enterobacteria implicated in the tuna fish contamination, Morganella morganii could be considered a species model: it is one of the most detected species and one of the main histamine producer bacteria (Kim et al, 2003). Until today, there are not methods that can significantly evaluate food freshness and healthiness compatible with the processing time and product marketing. Moreover, for this pathogen the dynamic of growth in terms of intrinsic and extrinsic parameters is not yet investigated.
Preface
9
REFERENCES 1. Ababouch L, 2006, Assuring fish safety and quality in International fish trade. Mar Pollut Bull
53:561-568. 2. De Silva DAM, 2011, Value chain of Fish and Fishery products: Origin, Functions and
Application in Developed and Developing country markets, FAO. 3. Economu V, Brett MM, Papadopoulou C, Frillingos S, Nichols T, 2007, Changes in histamine and
microbiological analyses in fresh and frozen tuna muscle during temperature abuse. Food Addit Contam 24:820-832.
4. FAO, 2005, Report and papers presented at the FAO Workshop on Fish Technology, Utilization and Quality Assurance Bagamoyo, United Republic of Tanzania, 14–18 November 2005.
5. FAO, 2010, The State of World Fisheries and Aquaculture 2010. Rome. 6. FAO, 2012, The State of World Fisheries and Aquaculture 2012. Rome. 7. Ferrario C, 2010, Safety and quality of fish products: a methodological polyphasic approach to
study contaminating emerging pathogens. 15th Workshop on the Developments in the Italian PhD Research on Food Science Technology and Biotechnology, 15-17 September, 2010 (Portici, Italy).
8. Ferrario C, 2011, Lactococcus garvieae and Morganella morganii: two bacterial models to study quality and safety of fish products. 16th Workshop on the Developments in the Italian PhD Research on Food Science Technology and Biotechnology, 21-23 September, 2011 (Lodi, Italy).
9. Ferrarrio C, 2012, Lactococcus garvieae and Morganella morganii as models to study safety and quality of fish products, 17th Workshop on the Developments in the Italian PhD Research on Food Science Technology and Biotechnology, 19-21 September, 2012 (Cesena, Italy).
10. Fortina MG, Ricci G, Acquati A, Zeppa G, Gandini L, Manachini PL, 2003, Genetic characterization of some lactic acid bacteria occurring in an artisanal protected de nomination origin (PDO) Italian cheese, the Toma piemontese. Food Microbiol 20: 397-404.
11. Huss HH, Ababouch L, Gram L, 2003, Assessment and management of seafood safety and quality. FAO Fisheries Technical Paper No 444. Rome.
12. Kim SH, An H, Wei CI, Visessanguan W, Benjakul S, Morrisey MT, Su YC, Pitta TP, 2003, Detection of Morganella morganii, a prolific histamine former, by the polymerase chain reaction assay with 16S rDNA-targeted primers. J Food Prot 66:1385-1392.
13. Martinez I, James D, Loréal H, 2005, Application of modern analytical techniques to ensure seafood safety and authenticity. FAO Fisheries Technical Paper No 455. Rome.
14. Opara LU, Al-Jufaili SM, Rahman MS, 2007, Handbook of Food Preservation, Second Edition, Edited by Rahman MS. CRC Press, Pages 151–172.
15. Prester L, 2011, Biogenic amines in fish, fish products and shellfish: a review. Food Addit Contam Part A Chem Anal Control Expo Risk Assess 28:1547-1560.
16. Tidwell JH, Allan GL, 2001, Fish as food: aquaculture's contribution. EMBO Rep 2: 958–963. 17. United Nations Department of Economic and Social Affairs/Population Division, 2009, World
Population Prospects: The 2008 Revision. New York, USA. 18. Vendrell D, Balcalzar JL, Ruiz-Zarzuela I, de Blas I, Girones O, Muzquiz JL, 2006, Lactococcus
garvieae in fish: a review. Comp Immun Microbiol & Inf Dis 29: 177-198. 19. Visciano P, Schirone M, Tofalo R, Suzzi G, 2012, Biogenic Amines in Raw and Processed
Seafood, Front Microbiol 3: 188. .
1. AQUACULTURE SECTOR MODEL: Lactococcus garvieae
1. Aquaculture sector model: Lactococcus garvieae
11
1.1. STATE OF THE ART
1.1.1.Problems in the aquaculture sector With the rapid and ongoing development of aquaculture sector, the need of a better health management and improved capacity to face new health challenges, is required. During the last three decades, aquaculture has expanded based on movements of live aquatic animals and animal products. New outlooks and directions have accelerated the accidental spread and incursion of diseases into new populations and geographic regions, for example, through movements of hatchery produced stocks, new species for culture, enhancement and development of the ornamental fish trade (Vendrell et al., 2006). Transmission of pathogenic microorganisms to fish is mainly due to horizontal mechanisms. Among co-habiting fish, direct transmission of pathogens through the water is the principal way, especially when macroscopic and microscopic injuries occur on fish body surfaces, becoming potential portals of entry for bacterial pathogens (Amaro et al., 1995). Several causes of fish infections could be identified. Viral diseases cause serious problems in every aspect of aquaculture, with severe economic losses. Infectious hematopoietic necrosis, infectious pancreatic necrosis, and viral hemorrhagic septicemia are the major viral diseases of trout and salmon (Meyer, 1991). Bacterial pathogens probably cause more disease problems overall than all other causes combined. Septicemias, cutaneous lesions, and destruction of the shell are among the manifestations of bacterial infections. Gram-negative bacilli are the most frequent cause of bacterial diseases in finfish: furunculosis (Aeromonas salmonicida), bacterial hemorrhagic septicemia (A. hydrophila), vibriosis (Vibrio spp.), enteric redmouth disease (Yersinia ruckerii) and others caused by Pseudomonas spp., Flavobacterium sp. and Pasteurella sp. Only a few of Gram-positive affect fish, among which Lactococcus garvieae. Since its first occurrence in yellowtail (Kusuda et al., 1976), this species has been considered an important etiological agent of Lactococcosis in various fish species, including yellowtail (Seriola quinqueradiata) and rainbow trout (Onchorrrynchus mykiss).
1.1.2.Lactococcosis in aquaculture sector Lactococcosis is an emerging pathology affecting a variety of fish species all over the world, and it is particularly devastating in the freshwater culture of salmonid fish and marine cultured species, especially when water temperature increases over 16 °C in summer months. Pathogenicity and clinical signs of Lactococcosis has been defined as a hyper acute and hemorrhagic septicemia (Bercovier et al., 1997). It has been observed in several experimental tests that incubation period of the disease is very short and the microorganism acts with high virulence: symptoms are visible 2–3 days post-inoculation (Itami et al., 1996). L. garvieae is the causative agent of this infection: outbreaks affecting rainbow trout have been reported in several countries, such as Australia, South Africa, Japan, Taiwan, England and countries of the Mediterranean area. The losses produced can exceed approximately 50–80% of the total production (Ghittino & Prearo, 1992). A strain of L. garvieae, previously described as Streptococcus garvieae, was originally isolated in the United Kingdom from a mastitic udder and was identified as the reference strain (ATCC43921) for this species (Collins et al., 1983). In 1991, it was proposed as a new species, Enterococcus seriolicida, in order to bring together a number of Gram-positive isolates recovered from Lactococcosis outbreaks in Japanese yellowtail (Seriola quinqueradiata) over the preceding 20 years (Kusuda et al., 1991). The first outbreak of Lactococcosis in rainbow trout from Spanish fish farms occurred in 1988 (Palacios et al., 1993). Initially, the agent was described as an Enterococcus sp. until it was definitely identified as L. garvieae, which showed biochemical characteristics very similar to E. seriolicida (Prieta et al., 1993). In the following years, L. garvieae has been isolated from several septicemic processes in fish. Phenotypical and molecular taxonomic studies confirmed the same agent as E. seriolicida. This species was reclassified as a junior synonym of L. garvieae (Eldar et al., 1996). From this time on, Lactococcosis was progressively spread in several countries and aquatic organisms. It was isolated in Italy (Ghittino & Prearo, 1992), Australia and South Africa (Carson et al., 1993), Taiwan (Chen et al.,
1. Aquaculture sector model: Lactococcus garvieae
12
2001) and in Turkey (Diler et al., 2002).
1.1.3. Who is Lactococcus garvieae? L. garvieae is a facultative anaerobic, non-motile, non-spore forming, Gram positive coccoid, occurring in pairs and short chains. It produces α-hemolysis on blood agar. This species is able to grow in a wide range of temperature (4–45 °C), with optimal growth at 37°C, in presence of NaCl, bile salts, at pH 9.6 and in methylene blue-milk (Vendrell et al., 2006). Several studies have been carried out to demonstrate the phenotypic heterogeneity of L. garvieae isolated from fish. The researchers have proposed biotyping schemes based on phenotypic characteristics (acidification of tagatose, ribose and sucrose) and have recognized three biotypes of L. garvieae (Ravelo et al., 2001). Some of these biochemical characteristics can differ depending on the strain. Over the last few years, the use of more discriminating molecular methods permitted to correlate the high degree of biodiversity to the geographical origin of the pathogen (Vela et al., 2000; Schmidtke & Carson, 2003; Eyngor et al., 2004; Michel et al., 2007). The host range of L. garvieae is not limited to aquatic species. The pathogen has been found in domestic animals such as cows, from subclinical intramammary infections (Devriese et al., 1999) cat and dog tonsils (Pot et al., 1996), bullfrog (Mendoza et al., 2012). In addition, the agent has been isolated from humans as an opportunistic pathogen (Fihman et al., 2006; Russo et al., 2012) as well as a component of the intestinal biota (Kubota et al., 2010). L. garvieae can also be isolated from several food matrices. One of the most important sources are artisanal cheeses made with goat and cow raw milk, where it is present sometimes as a major component (Fortina et al., 2003; Foschino et al., 2006; Fernández et al., 2010). L. garvieae has also been isolated from vegetables (Kawanishi et al., 2007) and meat (Santos et al., 2005). Despite the growing importance of L. garvieae in human and veterinary medicine and in the food sector, little research data are available on this pathogen in matrices other than fish products. Various typing methods have been applied for studying genetic variation among L. garvieae populations, including random amplified polymorphic DNA (RAPD)-PCR (Ravelo et al., 2003), Sau-PCR and amplified fragment length polymorphism (AFLP) (Foschino et al., 2008), restriction fragment length polymorphism (RFLP) ribotyping and serotyping (Eyngor et al., 2004), pulsed-field gel electrophoresis (PFGE) typing (Kawanishi et al., 2005) and amplified rRNA gene restriction analysis (ARDRA) (Michel et al., 2007). Another important differentiation in this species is the utilization of lactose (Lac) related to the presence of the phospho-β-galactosidase (lacG) gene. This tool was considered as marker for distinguishing between fish (Lac-/lacG-) and dairy isolates (Lac+/lacG+) of L. garvieae (Fortina et al., 2009). Recently, L. garvieae has been isolated from different ecological niches (Aguado-Urda et al., 2010); in these strains, lacG seemed heterogeneously scattered.
1.1.4. Antigenic characteristics of L. garvieae Many studies are available about the pathogenicity of L. garvieae in fish. The serological characterization of this bacterium has been carried out in several studies identifying an antigen denominated KG from the cellular wall. There are two antigenic types of this pathogen, KG+ and KG- type strains. The KG+ type strain agglutinates with antiserum of KG 7409 strain and the KG- type strain possesses a specific envelope-like substance, which inhibits agglutination with anti-KG 7409 serum. The KG- type strain was more virulent than the KG+ in causing infection in yellowtail (Kitao, 1983). Barnes and Ellis (2004) compared 17 geographically distinct strains of L. garvieae isolated from diseased fish, using antiserum raised against the pathogen in rainbow trout. These results indicate that L. garvieae can be distinguished serologically into three different serotypes: an European capsulated serotype, a Japanese capsulated serotype and a non-capsulated serotype from both regions. Several virulence experiments have been performed in order to determine the possible correlation between pathogenicity of L. garvieae for rainbow trout and the two antigenic profiles (KG- and KG+). Its virulence seems to be associated with the ability to produce capsule, but it is unknown which
1. Aquaculture sector model: Lactococcus garvieae
13
factors can influence the synthesis of this extramural layer, nor the genetic parameters that are responsible of the specific phenotypical expression. The results revealed that capsulated strains (KG-) were more virulent than non-capsulated (KG+) (Barnes et al., 2002).
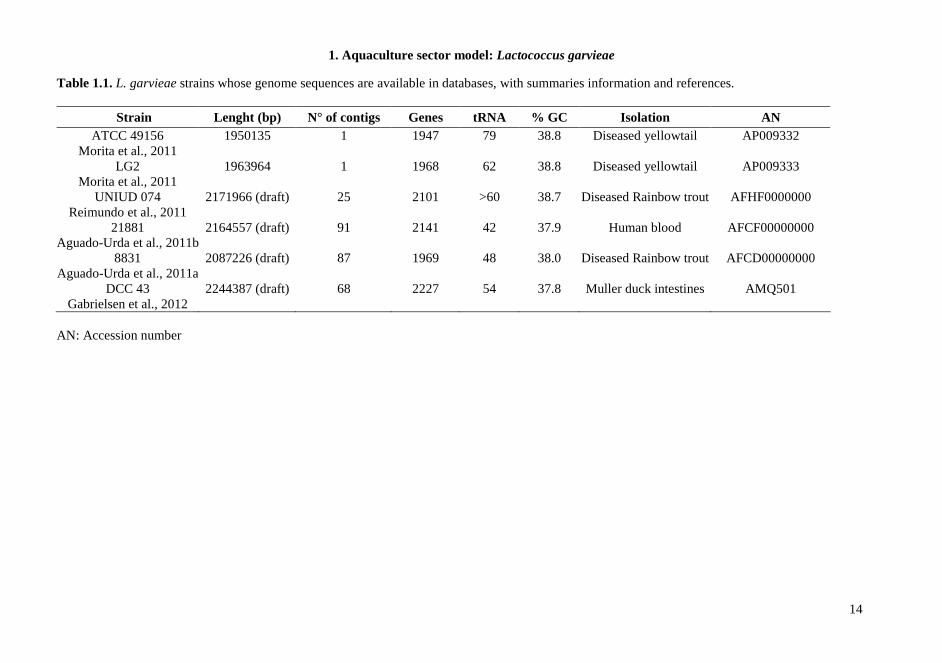
1.1.5. Genome analysis of L. garvieae With the increasing availability of genome sequences, comparison studies on the genetic content of different bacteria are easily feasible. Recently the complete genome sequence of 7 L. garvieae becomes available in databases: four clinical strains of L. garvieae isolated from yellowtail and trout (8831, Lg2, ATCC 49156, UNIUD074) (Aguado-Urda et al., 2011a; Morita et al., 2011; Reimundo et al., 2011), one human clinical strain (21881) (Aguado-Urda et al., 2011b), one dairy strain (IPLA 31405) (Floréz et al., 2012) and one strain isolated from mallard duck intestines (DCC 43) (Gabrielsen et al., 2012) have been published. The analysis of the genome of a fish-isolated virulent strain (Morita et al., 2011) revealed the presence of a capsule gene cluster composed of 15 genes that was not found in a no virulent strain used for comparison. However, strains isolated from human with endocarditis, seemed able to show pathogenicity in human, even if they did not show the presence of genes encoding extracellular envelope. The comparative genome analysis of these strains indicates that the presence of a capsule gene cluster is not the only factor leads pathogenicity. Other potential virulence factors can be found in L. garvieae genome, such as adhesion surface proteins, haemolysins, NADH oxidase, resistance to antibiotics, that could play a more important role in the pathogenicity both in humans and animals. The real involvement of these genes in virulence remains to be elucidated as well as their association to strains isolated in specific environments and their specificity at the strain-level. Moreover another study on comparative genome analysis (Miyauchi et al., 2012) did not permit to group strains associated with infection both in animals and humans. The data obtained suggest that this species is characterized by a high degree of genetic diversity, that also comprises distribution and functionality of genes related to virulence factors. Several information about preliminary genome comparison is reported in Table 1.1.
1. Aquaculture sector model: Lactococcus garvieae
14
Table 1.1. L. garvieae strains whose genome sequences are available in databases, with summaries information and references.
Strain Lenght (bp) N° of contigs Genes tRNA % GC Isolation AN ATCC 49156
Morita et al., 2011 1950135 1 1947 79 38.8 Diseased yellowtail AP009332
LG2 Morita et al., 2011
1963964 1 1968 62 38.8 Diseased yellowtail AP009333
UNIUD 074 Reimundo et al., 2011
2171966 (draft) 25 2101 >60 38.7 Diseased Rainbow trout AFHF0000000
21881 Aguado-Urda et al., 2011b
2164557 (draft) 91 2141 42 37.9 Human blood AFCF00000000
8831 Aguado-Urda et al., 2011a
2087226 (draft) 87 1969 48 38.0 Diseased Rainbow trout AFCD00000000
DCC 43 Gabrielsen et al., 2012
2244387 (draft) 68 2227 54 37.8 Muller duck intestines AMQ501
AN: Accession number
1. Aquaculture sector model: Lactococcus garvieae
15
1.2.AIM OF THE STUDY This PhD thesis research project aims to improve the current systems of management and control of food safety, focusing the attention on the study of Lactococcus garvieae that represent a valid model of contaminating emerging pathogens in fish products. This PhD thesis objectives are: - Creation of a strains collection, through the research and specific selection of L. garvieae from
different food habitat;
- Molecular typing, by using method that can assemble isolates in function of their source of isolation, to underline a specific molecular fingerprint for every ecotype and gave a detailed framework about the degree of biodiversity in the species;
- Research of extracromosomal DNA molecules;
- Genome sequencing of representative L. garvieae strains coming from different food matrices;
- Study of specific genes or genetic cluster encoding virulence and pathogenicity factors;
- Phylogenetic study through the research and the sequencing of particular conserved genes, called molecular clocks, and the use of bioinformatics software to building detailed phylogenetic tree.
1. Aquaculture sector model: Lactococcus garvieae
16
1.3. MATERIALS AND METHODS
1.3.1. Sampling, selection, culturing and identification of L. garvieae isolates A total of 40 food samples purchased in different supermarkets or collected from different mills of Northern Italy, were analysed for the presence of L. garvieae. The products consisted of raw meat (beef, poultry and turkey), processed meat products (salami and sausages), several vegetables and cereals (wheat flour, wheat bran, soybean and barley) (Table 1.2). All samples were aseptically collected and transported in isothermal boxes to the laboratory. For L. garvieae isolation, food samples (25 g) were enriched in 1:9 (w/w) M17 broth (Difco, Detroit, Michigan, USA) supplemented with 1g/L glucose (M17-G) at 37 °C for 24 h. After enrichment, total DNA was extracted as reported below and the presence of L. garvieae was established through a species-specific PCR assay, as reported by Zlotkin et al. (1998). For each sample positive to the species-specific amplification, L. garvieae selection was attempted on M17-G agar. Appropriate dilutions in 0.1% peptone solution of positive enriched cultures were plated and incubated at 37 °C for 24 h; after incubation randomly selected colonies were purified and then submitted to taxonomic identification, as above reported. The new isolates were studied in comparison with representative dairy and fish L. garvieae ecotypes previously isolated. Stock cultures were maintained at -80 °C in M17-G with 15% glycerol.
1.3.2. DNA extraction and quantification For strains grown in pure culture, DNA was extracted as previously described by Borgo et al. (2012). Plasmid DNA was extracted as previously described (Fortina et al., 2009). For the extraction of DNA from food samples, the UltracleanTM Microbial DNA Isolation Kit (Mo Bio Laboratories Inc., Carlsbad, CA) was used according to the manufacturer’s instructions. The concentration and purity of the DNAs were determined with a UV-Vis spectrophotometer (SmartSpecTM Plus, Biorad, Milan, Italy).
1.3.3. PCR amplification PCRs were performed in a 25 µL reaction mixture contained 100 ng of bacterial DNA, 2.5 µL of 10x reaction buffer (Fermentas, Vilnius, Lithuania), 200 µM of each dNTP, 2.5 mM MgCl2, 0.5 µM of each primer, and 0.5 U of Taq polymerase (Fermentas). After incubation for 2 min at 94 °C, samples were subjected to 35 cycles of 60 s at the annealing temperature (Table 1.3), followed by 1 min at 72 °C; the reaction was completed by 7 min at 72 °C and kept at 4 °C using a PCR-Mastercycler 96 (Eppendorf, Hamburg, Germany). Amplification products were separated on a 1.5% agarose gel stained with ethidium bromide in 1x TAE (40 mM Tris-acetate, 1 mM EDTA, pH 8.2) buffer and photographed.
1.3.4. Multi-locus restriction typing (MLRT) Internal fragments of seven loci, atpA (α-subunit of ATP synthase), tuf (bacterial elongation factor EF-Tu), dltA (D-alanine-D-alanyl carrier protein ligase), als (α-acetolactate synthase), gapC (glyceraldehyde-3-phosphate dehydrogenase), galP (galactose permease), lacG (phospho-β-galactosidase) were amplified using primers and conditions reported in Table 1.3. Products from each amplified locus were tested to select a suitable discriminating restriction enzyme, i.e. a panel of two or five enzymes that cut frequently along each of the amplified fragments was examined in order to clearly identify allelic variations. Overnight restriction digestion was carried out at 37 °C in a 20 µL reaction mixture containing 4 µL of the PCR product, 2 µL of 10x incubation buffer and 10 U of each enzyme (Amersham Pharmacia Biotech., Milan, Italy). Restriction digests were subsequently analyzed by agarose electrophoresis (2% agarose gel).
1.3.5. Genomic fingerprinting of L. garvieae strains L. garvieae strains were typed by combined analysis of repetitive element (REP) typing using primers (GTG)5 and BOXA1R (Versalovic et al., 1994; De Urraza et al., 2000) and random amplification of polymorphic DNA-PCR (RAPD) typing with primer M13 (Rossetti & Giraffa, 2005). The PCR products were analyzed by electrophoresis and photographed as reported above. The digitized image
1. Aquaculture sector model: Lactococcus garvieae
17
was analyzed and processed using the Gel Compare software (Applied Maths, Kortrijk, Belgium). The value for the reproducibility of the assay, evaluated by analysis of repeated DNA extracts of representative strains was greater than 93%.
1.3.6. PCR-ribotyping The genomic DNA of L. garvieae strains (ca 10 µg) was digested by incubation with 30 U of PstI endonuclease (Fermentas) according to manufacturer’s instruction. A 20 µL aliquot of the digestion mixture was combined with 5 µL of loading buffer and the preparation was electrophoresed on 0.8% (w/v) agarose gel at 100 V for 2 h. DNA fragments were subsequently transferred to a nylon membrane (Roche Diagnostics GmbH, Mannheim, Germany) by Southern blot. Hybridization was performed at 60 °C using the 16S rDNA of L. garvieae DSM 20684T. The probe was amplified using the universal primers: 16SF and 16SR. PCR cycle was 2 min at 94 °C, then 5 cycles of 45 s at 94 °C, 45 s at 50 °C, 1 min at 72 °C, followed by 30 cycles of 45 s at 94 °C, 45 s at 55 °C, 1 min at 72 °C, with a 7 min final extension at 72 °C. The DIG DNA Labeling and Detection kit (Roche) was used for digoxigenin labeling of the 1513 bp fragment. Prehybridization and hybridization overnight were performed in 50% (w/v) formamide at 42 °C and stringency washes in 0.1x SSC buffer at 65 °C (10x SSC is 1.5 M NaCl, 150 mM sodium citrate). The probe was detected by chemiluminescent detection using CSPD (Roche), and the signals were visualized by exposure to X-ray film for 2 h.
1.3.7. Data analysis Banding pattern similarity was evaluated by construction of dendrograms using the NTSYSpc software, version 2.11 (Applied Biostatics Inc., NY, USA), employing the Jaccard similarity coefficient. A dendrogram was deduced from a similarity matrix by using the unweighted pair group method with arithmetic average (UPGMA) clustering algorithm. The faithfulness of the cluster analysis was estimated by calculating the cophenetic correlation value for each dendrogram.
1.3.8. Genomes analyses and comparison Sequencing analyses were performed employing ABI Prism Big Dye Terminator Kit and the reaction products were analyzed with the ABI PrismTM310 DNA Sequencer. A whole-genome shotgun strategy with an Illumina Genome Analyzer Hiseq 1000 was used. Quality-filtered reads were assembled using the Velvet software (version 1.1.04). Open reading frames (ORFs) were predicted using Glimmer 3.02, functional annotation was done by merging the results obtained from the RAST (Rapid Annotation using Subsystem Technology) Server, BLAST, tRNAscan-SE 1.21, and RNAmmer 1.2. Genome alignments were performed using Mauve and the phylogenetic tree obtained was visualized in Splitstree v4.1 (Huson & Bryant, 2006).
1.3.9. Multi Locus Sequence Typing (MLST) loci amplification Internal fragments of seven loci, als, atpA, tuf, gapC, gyrB, rpoC and galP were amplified as reported in section 1.3.3. Nucleo Spin Extract II (Macherey-Nagel GmbH & Co., Düren, Germany) was used to purify PCR products that were sequenced employing ABI Prism Big Dye Terminator Kit (Applied Biosystems, Foster, CA, USA). The reaction products were analyzed with the ABI PrismTM310 DNA Sequencer (Applied Biosystems). Sequence similarities searches were carried out using Basic Local Alignment Search Tool (BLAST, Altschul et al., 1997) on the EMBL/GenBank databases.
1.3.10. MLST Data analysis Forward and reverse DNA sequences obtained from PCR amplification were trimmed and added with sequences from seven L. garvieae genomes deposited in database (8831, 21881, ATCC 49156, LG2, UNIUD074, IPLA 31405 and DCC43). After selecting most polymorphic regions of 800-850 bp, these were analysed using MEGA v5 (Takamura et al., 2011). Isolate dataset creation, arbitrary allele assignation were done using mlstdbNet software. Each unique allelic profile, as defined by the allele numbers of the seven loci, was assigned a Sequence Type (ST) number. The same ST number was used for more than one strain if they shared the same allelic profile. The number of segregating or polymorphic site (S), nucleotide diversity (π), Tajima’s D, Fu & Li’s D and F were calculated using
1. Aquaculture sector model: Lactococcus garvieae
18
DnaSP v5.10 (Librado & Rozas, 2009). πMAX values were extracted from the squared similarity matrix calculated with the DNADIST program (D option set to “similarity table”) in the PHYLIP v.3.69 package. For phylogenetic analysis, concatenated sequences were aligned and analyzed with MEGA v5. Genetic distances were computed by the Kimura two-parameter model, and the phylogenetic tree was constructed using the neighbor-joining method. Strains relationships were analyzed using eBURST program (Feil et al., 2004) to identify potential clonal complexes and founders. eBURST analysis was performed using the default stringent (conservative) definition. To investigate the population structure, the Clonal Frame method was used. The recombination to mutation rate (r/m) was calculated as reported by Vos and Didelot (2009). For each dataset, two runs of the Clonal Frame MCMC were performed each consisting of 200000 iterations. The first half of the chains was discarded, and the second half was sampled every hundred iterations. Split decomposition trees were constructed with 1000 bootstraps replicates based on parsimony splits as implemented in SplitsTree v4.1. The standardized Index of Association (IA
S) was calculated using LIAN 3.5, using a Monte Carlo randomization test with 1000 resampling.
1.3.11. Detection of virulence factors Internal fragments of two loci, hly and fbp, identified through BLAST and codifying for an haemolysin and a cell wall adhesion protein respectively, were amplified using primers developed in this study and reported in Table 1.3. PCRs and electrophoresis were performed as reported in section 1.3.3.
1.3.12. RNA extraction and rewriting into cDNA To study differential gene expression in different conditions, selected strains were grown in M17-G, as reference media for all experiments, M17-G with addition of 0.2 % bile salts (Sigma-Aldrich Chemie GmbH, Steinheim, Germany) (M17-GBS), Brain Heart Infusion (BHI) broth (Sigma) and Meat Simulation medium (MSM) broth (Verluyten et al., 2003). The exponentially growing cell cultures in M17-G (OD600 =0.9) were collected through centrifugation (9600 x g at 4 °C for 10 min), washed three times with phosphate saline buffer (PBS), resuspended in sterile water and distributed into the selected pre-warmed media. These conditions were applied for 1 h at 30°C for MSM and at 37°C for BHI and M17-GBS. Samples were taken subsequently, centrifuged and the pellets obtained used for RNA extraction. L. garvieae cells were washed three times with PBS buffer and resuspended in 1.5 mL RNase-free water (Mackery-Nagel, Germany). RNA was extracted using NucleoSpin RNA II (Mackery-Nagel), following the manufacturer’s instructions. RNA concentration and purity were optically determined using a UV-Vis spectrophotometer (SmartSpecTM Plus, Bio-Rad) and RNA integrity was assessed by electrophoresis. Residual contaminating DNA was hydrolyzed with Dnase1 Rnase-Free Kit (Fermentas) at 37°C for 1h. Subsequently, 1 µg of RNA was rewritten into cDNA using RevertAid First Strand cDNA Syntheis Kit (Fermentas) according to the manufacture’s instructions.
1.3.13. RT-PCR A master mix containing, per sample, 7.5 µL EvaGreen (Bio-Rad), 0.38 µL water and 0,5 µM of each primer, was combined with 7 µL of each cDNA sample. The qPCR temperature procedure was performed according to the manufacture’s recommendations and corresponds to an initial cycle of denaturation at 94°C for 5 min, followed by 40 cycles of denaturation 95°C for 30 sec, annealing and extension 60°C for 30 sec. Fluorescence acquisition was done at the end of each amplification. After real time PCR a melting curve analysis was performed by measuring fluorescence during heating from 72°C to 95°C at a transition rate of 0.5°C/s. Amplifications were performed in triplicate. The gyrB gene was used as internal control to which all other virulence gene expression was normalized. The primers used are reported in Table 1.4. Samples were examined for differences in gene expression using relative quantification in which relevant gene expression is normalized to a housekeeping gene and the relative expression related to specific environment. These values were calculated according with Pfaffl (2001) equations.
1. Aquaculture sector model: Lactococcus garvieae
19
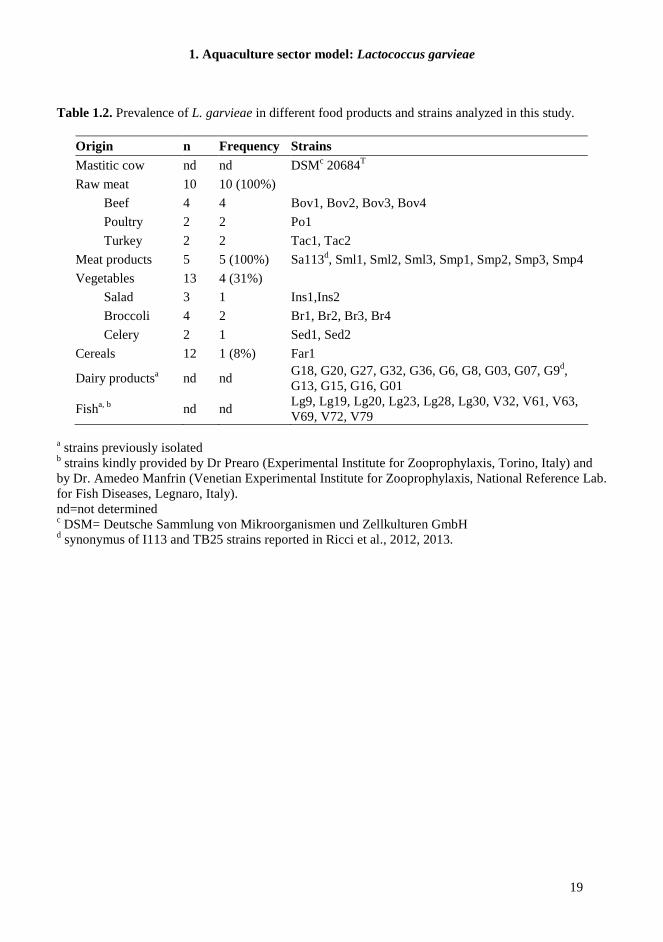
Table 1.2. Prevalence of L. garvieae in different food products and strains analyzed in this study.
Origin n Frequency Strains
Mastitic cow nd nd DSMc 20684T
Raw meat 10 10 (100%)
Beef 4 4 Bov1, Bov2, Bov3, Bov4
Poultry 2 2 Po1
Turkey 2 2 Tac1, Tac2
Meat products 5 5 (100%) Sa113d, Sml1, Sml2, Sml3, Smp1, Smp2, Smp3, Smp4
Vegetables 13 4 (31%)
Salad 3 1 Ins1,Ins2
Broccoli 4 2 Br1, Br2, Br3, Br4
Celery 2 1 Sed1, Sed2
Cereals 12 1 (8%) Far1
Dairy productsa nd nd G18, G20, G27, G32, G36, G6, G8, G03, G07, G9d, G13, G15, G16, G01
Fisha, b nd nd Lg9, Lg19, Lg20, Lg23, Lg28, Lg30, V32, V61, V63, V69, V72, V79
a strains previously isolated b strains kindly provided by Dr Prearo (Experimental Institute for Zooprophylaxis, Torino, Italy) and by Dr. Amedeo Manfrin (Venetian Experimental Institute for Zooprophylaxis, National Reference Lab. for Fish Diseases, Legnaro, Italy). nd=not determined c DSM= Deutsche Sammlung von Mikroorganismen und Zellkulturen GmbH d synonymus of I113 and TB25 strains reported in Ricci et al., 2012, 2013.
1. Aquaculture sector model: Lactococcus garvieae
20
Table 1.3. PCR primers and conditions used for the detection of genes in L. garvieae strains.
Gene /Product Primer pairs (5′-3′) Annealing
temperature (°C) Amplicon
(bp) (GTG)5 GTGGTGGTGGTGGTG 42 BOXA1R CTACGGCAAGGCGACGCTGACG 48 M13 GAGGGTGGCGGTTCT 38
16S F: AGAGTTTGATCCTGGCTCAG R: CTACGGCTACCTTGTTACGA
Section 1.3.6 1500
hly (haemolysin) F: ATGGAAAAGCCAGCTTCTCGa R: AACCATAGATGGAGAACCAC
56 640
fbp (cell wall adhesion protein) F: ACAGACTTCCAAAATCCTCAa R: TCACCTTTACGACTGAGTTT
54 1236
atpA (α-subunit of ATP synthase) (Naser et al., 2005)
F: TAYRTYGGKGAYGGDATYGC R: CCRCGRTTHARYTTHGCYTG
56 1180
tuf (elongation factor EF-Tu) (Ludwig et al., 1993)
F: ATATGCGGCCGCCATYGGHCACGTBGACCA R: AAAATATGCGGCCGCTCNCCNGGCATNACCAT
56 1080
dltA (D-alanine-D-alanyl carrier protein ligase) (Reimundo et al., 2010)
F: ATCCGGAGCAACAAAATACCa
R: TTACCTCCAAGGACTTGCTT 58 1473
als (α-acetolactate synthase) (Menéndez et al., 2007)
F: ATTCGGCTCAGACTTAGTTGa R: TTCAGCTGCTTCAACATCAA
58 1076
gapC (glyceraldehyde-3-phosphate dehydrogenase)
F: AAGTTGGTATTAACGGTTTCGa
R: AAGTGTACGAACGAGGTTAG 56 974
galP (galactose permease) (Fortina et al., 2009)
F: TGGGGAAAATTTAAACCTTGGa
R: ATCATCAGAACGGCTGGAAG 58 1070
lacG (phospho-β-galactosidase) (Fortina et al., 2009)
F: GCTACAGCTGCTTATCAAGC
R: AGGATAAATAATCCAATCCCA 58 1014
gyrB (DNA gyrase β- subunit) F: CATGCTGGTGGTAAATTTGG a R: GTCATCCATTTCTCCTAAACC
58 1464
rpoC (RNA polymerase β’-subunit) F: TTGGTCCACAAAAGGACTGG a R: TCACGTCCTTTTGCTTCCAT
58 1377 a this study
1. Aquaculture sector model: Lactococcus garvieae
21
Table 1.4. RT-PCR primers and conditions used for the gene expression experiments, designed for this study.
Gene/product Primer-pair (5’-3’) Annealing
temperature (°C) Amplicon
(bp)
hly F: TAGCACTTGTTTGGCTTTGTGC R: CCATAGATGGAGAACCACATCA
60 301
fbp F: CGGTTCGTTCAGGAAGAACATC R: CGGTCATTGCCTACTTGCTCAA
60 181
gyrB F: TGGTAAACTTGCGGACTGCTCT R: TCCACGTTCAAGATTTTACCACG
60 150
1. Aquaculture sector model: Lactococcus garvieae
22
1.4. RESULTS AND DISCUSSIONS To contribute to the characterization of the natural variability of the species Lactococcus garvieae, we evaluated the genetic diversity of a collection of strains isolated from different sources. L. garvieae is mainly known for its presence in aquatic environments and as component of milk and many artisanal cheeses. In this work, we studied new isolates from other sources, in order to give a comprehensive indication of the diversity found within the species.
1.4.1. L. garvieae diffusion in food matrices We focused our attention on food matrices not yet or poorly investigated for the presence of L. garvieae, particularly, meat, vegetables and cereals. Out of 40 food samples tested, 20 (50%) were found to contain L. garvieae (Table 1.2). Raw meat and meat products showed the highest prevalence of contamination with L. garvieae: all samples analyzed were positive for the presence of this bacterial species. A high rate of L. garvieae was also found in vegetables (31%), while cereals do not seem an important reservoir for the species. From these sources we selected 24 new ecotypes that were studied in comparison with previously isolated dairy and fish ecotypes (Table 1.2). All new isolates were properly identified by specific PCR, giving the expected amplification product of 1100 bp belonging to the 16S rDNA gene (Zlotkin et al., 1998).
1.4.2. lacG presence The strains were screened for the presence of the lac operon. In previous studies (Fortina et al., 2007, 2009) carried out on dairy and fish isolates, we observed that only the isolates of dairy origin were able to utilize lactose, since they harbored a lac operon, which shares a high sequence homology to that found in Lactococcus lactis. As a conclusion, we hypothesized a gene gain by lateral gene transfer, which provided dairy L. garvieae strains of a key physiological property contributing to adaptation to milk/dairy niche. When lacG was tested on new isolates, we found that the ability to metabolize lactose was not exclusively related to dairy isolates, but was heterogeneously scattered among L. garvieae meat isolates. Indeed, three meat isolates (strains Smp2, Smp3 and Smp4) were positive for the presence of the lacG gene. The remaining strains from meat and the isolates from vegetables and cereals did not show any amplification signal. These results indicate that lac operon cannot be considered a suitable genetic marker for associating strains to their niche of isolation.
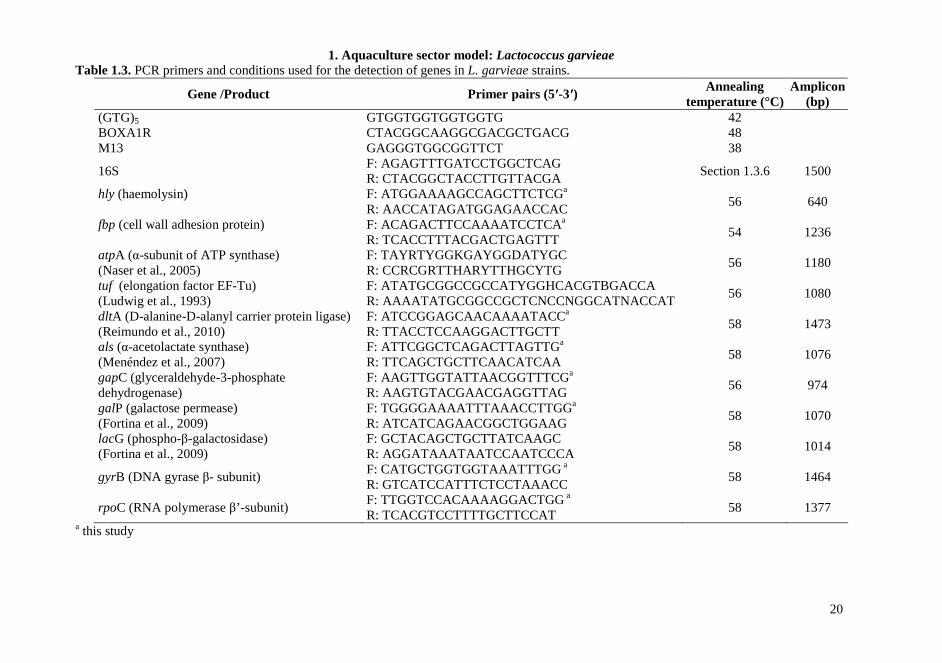
1.4.3. Plasmid profile Another molecular characterization was performed studying the presence and distribution of plasmid DNA: a high degree of biodiversity was observed, with strains coming from fish, plasmid free and strains coming from other sources containing a variable number of plasmids, ranging from 2 to 8 molecules of different molecular weight, as reported in Figure 1.1. These data show a genetic heterogeneity within L. garvieae population.
1. Aquaculture sector model: Lactococcus garvieae
23
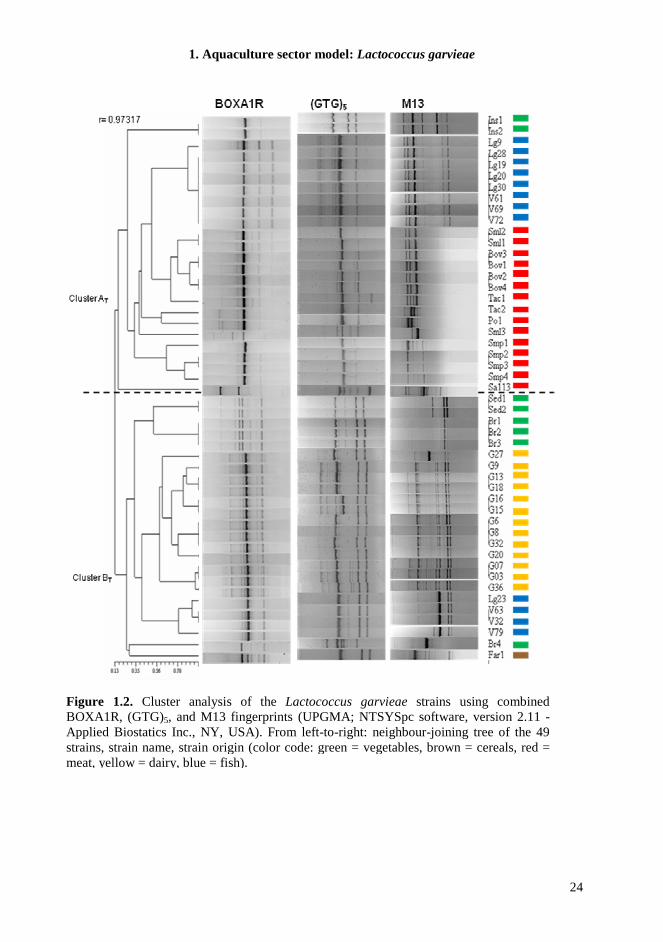
1.4.4. Genomic fingerprinting The genomic fingerprinting of L. garvieae strains was determined using RAPD and REP-PCR with BOXA1R and (GTG)5 primers. These methods, which use primers targeting noncoding random or repetitive sequences interspersed throughout the genome are an established approach for delineation of bacteria at the species and strain-level (Randazzo et al., 2009). The discriminatory power of these primer sets was similar, with 20 different profiles obtained by BOXA1R and (GTG)5 and 23 different profiles obtained by M13 for a collection of 49 strains. Although isolated at different times, some strains had identical fingerprints with all tested primers; on the contrary, most of the strains grouped at low similarity values. Independently from the primer used, the 49 strains grouped in two distinct clusters, which we named AT and BT (Figure 1.2): one cluster (AT) contained all meat isolates (with the exception of BOXA1R experiment where the meat isolate Sa113 showed a unique fingerprint at a very low similarity value), whereas the other cluster (BT) included all dairy isolates. Unexpectedly, four out of 12 strains isolated from fish (V32, V63, Lg23 and V79), always grouped with dairy isolates, whereas the others grouped with meat isolates. Likewise, strains isolated from vegetables allocated between the two main groups. The cluster analysis resulting from the combined profiles of the three primer sets employed, confirmed the existence of two major divisions, which were separated at a level of similarity of 0.13 (Figure 1.2), and did not coincide with the ecological niche of isolation. In particular, the low correlation value between the two clusters, suggested the existence of a marked genomic divergence.
Figure 1.1. Plasmid profiles of L. garvieae strains.
1. Aquaculture sector model: Lactococcus garvieae
24
Figure 1.2. Cluster analysis of the Lactococcus garvieae strains using combined BOXA1R, (GTG)5, and M13 fingerprints (UPGMA; NTSYSpc software, version 2.11 -Applied Biostatics Inc., NY, USA). From left-to-right: neighbour-joining tree of the 49 strains, strain name, strain origin (color code: green = vegetables, brown = cereals, red = meat, yellow = dairy, blue = fish).
1. Aquaculture sector model: Lactococcus garvieae
25
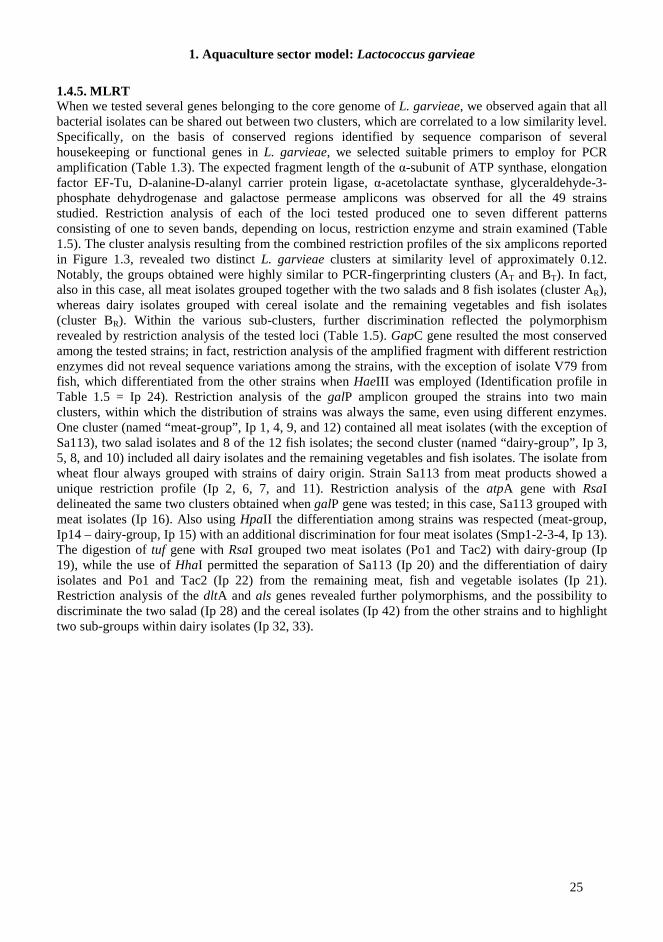
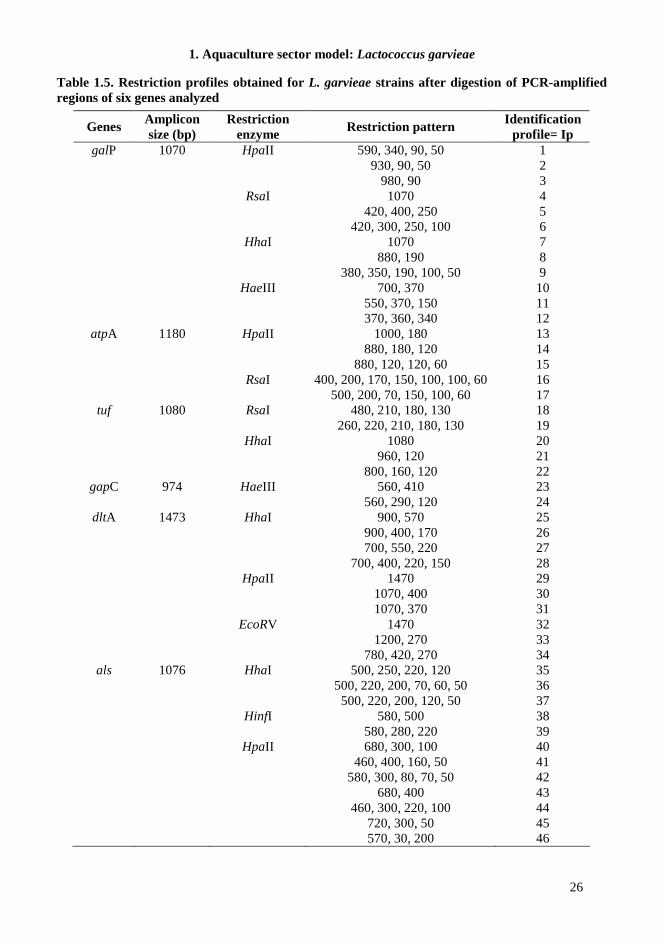
1.4.5. MLRT When we tested several genes belonging to the core genome of L. garvieae, we observed again that all bacterial isolates can be shared out between two clusters, which are correlated to a low similarity level. Specifically, on the basis of conserved regions identified by sequence comparison of several housekeeping or functional genes in L. garvieae, we selected suitable primers to employ for PCR amplification (Table 1.3). The expected fragment length of the α-subunit of ATP synthase, elongation factor EF-Tu, D-alanine-D-alanyl carrier protein ligase, α-acetolactate synthase, glyceraldehyde-3-phosphate dehydrogenase and galactose permease amplicons was observed for all the 49 strains studied. Restriction analysis of each of the loci tested produced one to seven different patterns consisting of one to seven bands, depending on locus, restriction enzyme and strain examined (Table 1.5). The cluster analysis resulting from the combined restriction profiles of the six amplicons reported in Figure 1.3, revealed two distinct L. garvieae clusters at similarity level of approximately 0.12. Notably, the groups obtained were highly similar to PCR-fingerprinting clusters (AT and BT). In fact, also in this case, all meat isolates grouped together with the two salads and 8 fish isolates (cluster AR), whereas dairy isolates grouped with cereal isolate and the remaining vegetables and fish isolates (cluster BR). Within the various sub-clusters, further discrimination reflected the polymorphism revealed by restriction analysis of the tested loci (Table 1.5). GapC gene resulted the most conserved among the tested strains; in fact, restriction analysis of the amplified fragment with different restriction enzymes did not reveal sequence variations among the strains, with the exception of isolate V79 from fish, which differentiated from the other strains when HaeIII was employed (Identification profile in Table 1.5 = Ip 24). Restriction analysis of the galP amplicon grouped the strains into two main clusters, within which the distribution of strains was always the same, even using different enzymes. One cluster (named “meat-group”, Ip 1, 4, 9, and 12) contained all meat isolates (with the exception of Sa113), two salad isolates and 8 of the 12 fish isolates; the second cluster (named “dairy-group”, Ip 3, 5, 8, and 10) included all dairy isolates and the remaining vegetables and fish isolates. The isolate from wheat flour always grouped with strains of dairy origin. Strain Sa113 from meat products showed a unique restriction profile (Ip 2, 6, 7, and 11). Restriction analysis of the atpA gene with RsaI delineated the same two clusters obtained when galP gene was tested; in this case, Sa113 grouped with meat isolates (Ip 16). Also using HpaII the differentiation among strains was respected (meat-group, Ip14 – dairy-group, Ip 15) with an additional discrimination for four meat isolates (Smp1-2-3-4, Ip 13). The digestion of tuf gene with RsaI grouped two meat isolates (Po1 and Tac2) with dairy-group (Ip 19), while the use of HhaI permitted the separation of Sa113 (Ip 20) and the differentiation of dairy isolates and Po1 and Tac2 (Ip 22) from the remaining meat, fish and vegetable isolates (Ip 21). Restriction analysis of the dltA and als genes revealed further polymorphisms, and the possibility to discriminate the two salad (Ip 28) and the cereal isolates (Ip 42) from the other strains and to highlight two sub-groups within dairy isolates (Ip 32, 33).
1. Aquaculture sector model: Lactococcus garvieae
26
Table 1.5. Restriction profiles obtained for L. garvieae strains after digestion of PCR-amplified regions of six genes analyzed
Genes Amplicon size (bp)
Restriction enzyme
Restriction pattern Identification
profile= Ip galP 1070 HpaII 590, 340, 90, 50 1
930, 90, 50 2 980, 90 3 RsaI 1070 4 420, 400, 250 5 420, 300, 250, 100 6 HhaI 1070 7 880, 190 8 380, 350, 190, 100, 50 9 HaeIII 700, 370 10 550, 370, 150 11 370, 360, 340 12
atpA 1180 HpaII 1000, 180 13 880, 180, 120 14 880, 120, 120, 60 15 RsaI 400, 200, 170, 150, 100, 100, 60 16 500, 200, 70, 150, 100, 60 17
tuf 1080 RsaI 480, 210, 180, 130 18 260, 220, 210, 180, 130 19 HhaI 1080 20 960, 120 21 800, 160, 120 22
gapC 974 HaeIII 560, 410 23 560, 290, 120 24
dltA 1473 HhaI 900, 570 25 900, 400, 170 26 700, 550, 220 27 700, 400, 220, 150 28 HpaII 1470 29 1070, 400 30 1070, 370 31 EcoRV 1470 32 1200, 270 33 780, 420, 270 34
als 1076 HhaI 500, 250, 220, 120 35 500, 220, 200, 70, 60, 50 36 500, 220, 200, 120, 50 37 HinfI 580, 500 38 580, 280, 220 39 HpaII 680, 300, 100 40 460, 400, 160, 50 41 580, 300, 80, 70, 50 42 680, 400 43 460, 300, 220, 100 44 720, 300, 50 45 570, 30, 200 46
1. Aquaculture sector model: Lactococcus garvieae
27
-----------------------------------------------------
Cluster AR
Cluster BR
r = 0.98213
Figure 1.3. Dendrogram showing the relatedness of the Lactococcus garvieae strains based on analysis of their restriction profiles generated by MLRT analysis, constructed using the UPMGA algorithm in the NTSYSpc software, version 2.11 (Applied Biostatics Inc.), employing the Jaccard similarity coefficient. From left-to-right: neighbour-joining tree of the 49 strains, strain name, strain origin (color code: green = vegetables, brown = cereals, red = meat, yellow = dairy, blue = fish).
1. Aquaculture sector model: Lactococcus garvieae
28
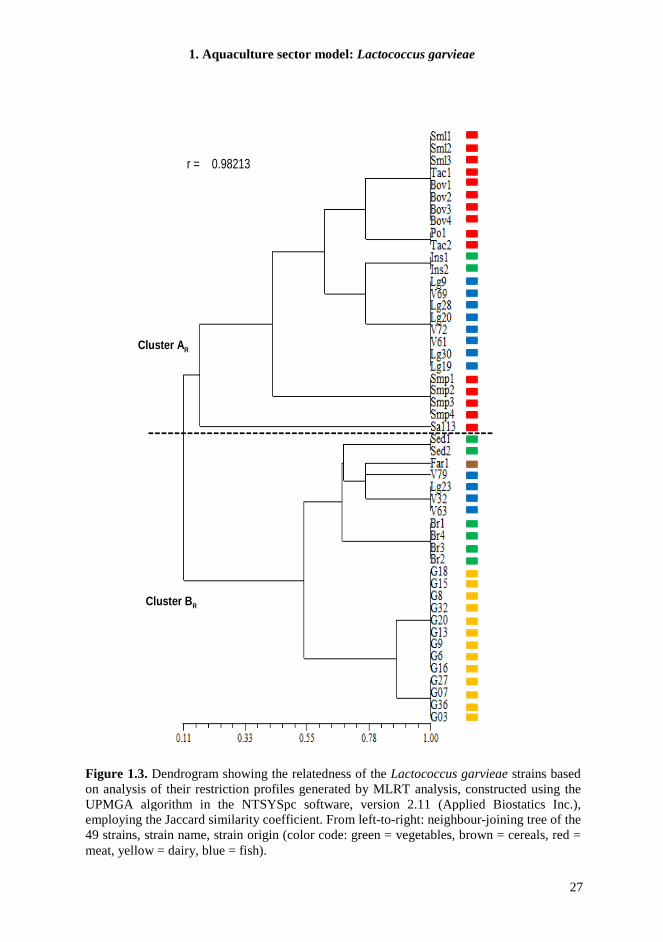
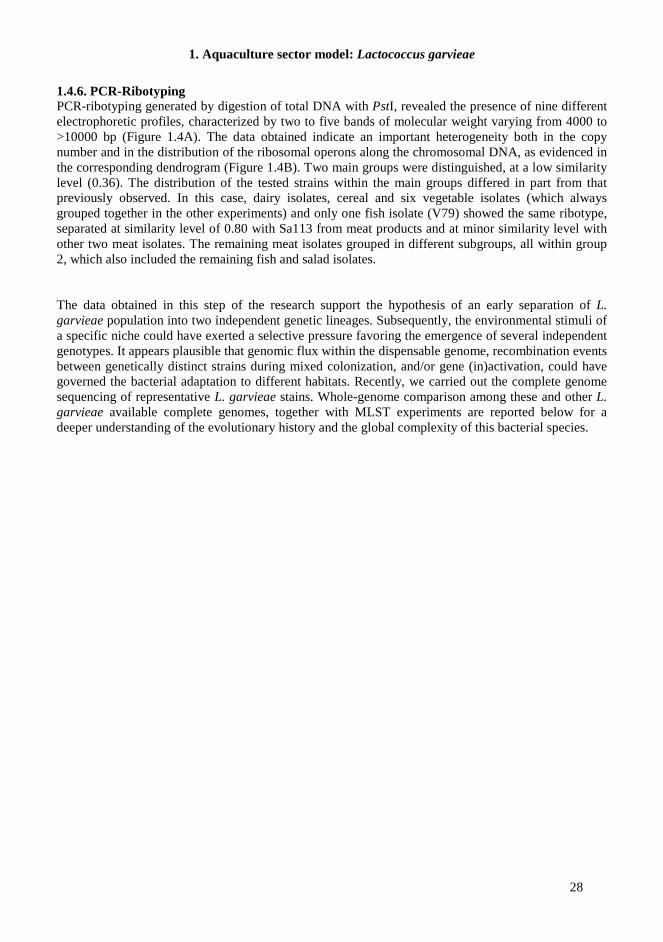
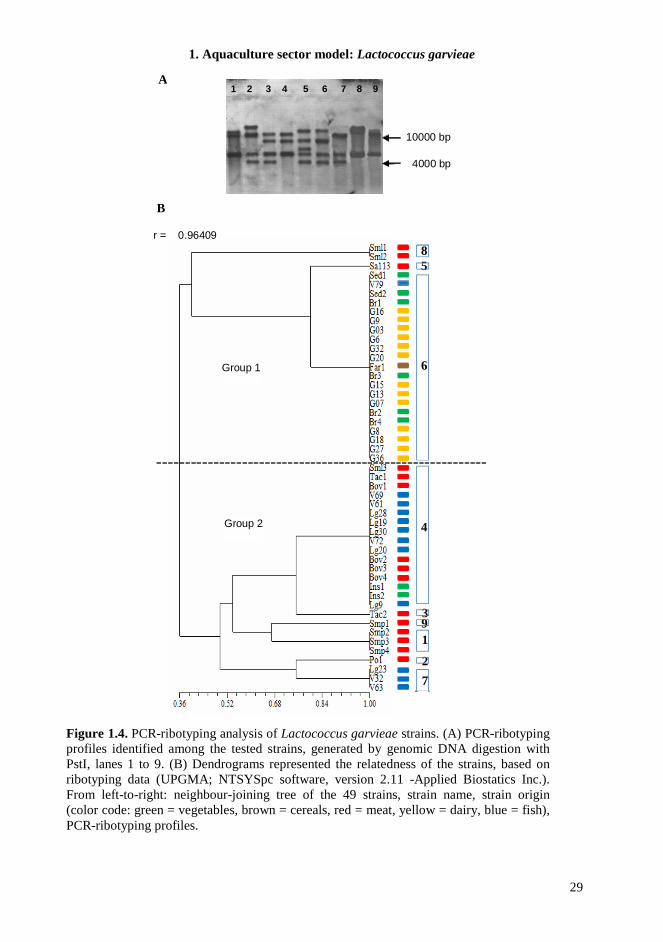
1.4.6. PCR-Ribotyping PCR-ribotyping generated by digestion of total DNA with PstI, revealed the presence of nine different electrophoretic profiles, characterized by two to five bands of molecular weight varying from 4000 to >10000 bp (Figure 1.4A). The data obtained indicate an important heterogeneity both in the copy number and in the distribution of the ribosomal operons along the chromosomal DNA, as evidenced in the corresponding dendrogram (Figure 1.4B). Two main groups were distinguished, at a low similarity level (0.36). The distribution of the tested strains within the main groups differed in part from that previously observed. In this case, dairy isolates, cereal and six vegetable isolates (which always grouped together in the other experiments) and only one fish isolate (V79) showed the same ribotype, separated at similarity level of 0.80 with Sa113 from meat products and at minor similarity level with other two meat isolates. The remaining meat isolates grouped in different subgroups, all within group 2, which also included the remaining fish and salad isolates.
The data obtained in this step of the research support the hypothesis of an early separation of L. garvieae population into two independent genetic lineages. Subsequently, the environmental stimuli of a specific niche could have exerted a selective pressure favoring the emergence of several independent genotypes. It appears plausible that genomic flux within the dispensable genome, recombination events between genetically distinct strains during mixed colonization, and/or gene (in)activation, could have governed the bacterial adaptation to different habitats. Recently, we carried out the complete genome sequencing of representative L. garvieae stains. Whole-genome comparison among these and other L. garvieae available complete genomes, together with MLST experiments are reported below for a deeper understanding of the evolutionary history and the global complexity of this bacterial species.
1. Aquaculture sector model: Lactococcus garvieae
29
Figure 1.4. PCR-ribotyping analysis of Lactococcus garvieae strains. (A) PCR-ribotyping profiles identified among the tested strains, generated by genomic DNA digestion with PstI, lanes 1 to 9. (B) Dendrograms represented the relatedness of the strains, based on ribotyping data (UPGMA; NTSYSpc software, version 2.11 -Applied Biostatics Inc.). From left-to-right: neighbour-joining tree of the 49 strains, strain name, strain origin (color code: green = vegetables, brown = cereals, red = meat, yellow = dairy, blue = fish), PCR-ribotyping profiles.
8 5
6
7
2
1 9 3
r = 0.96409
10000 bp
4000 bp
1 2 3 4 5 6 7 8 9 A
Group 2 4
----------------------------------------------------------
B
Group 1
1. Aquaculture sector model: Lactococcus garvieae
30
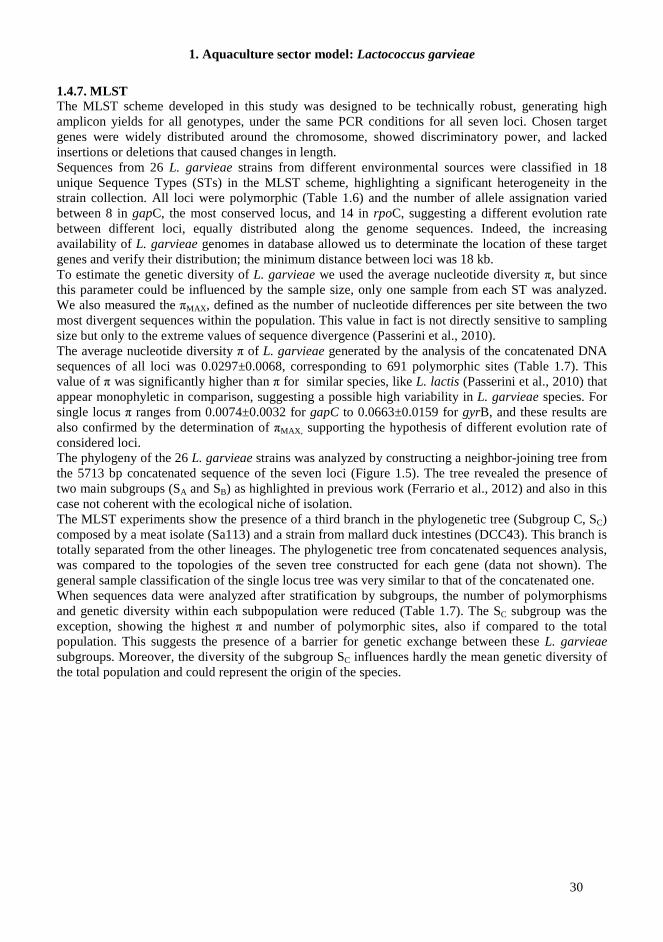
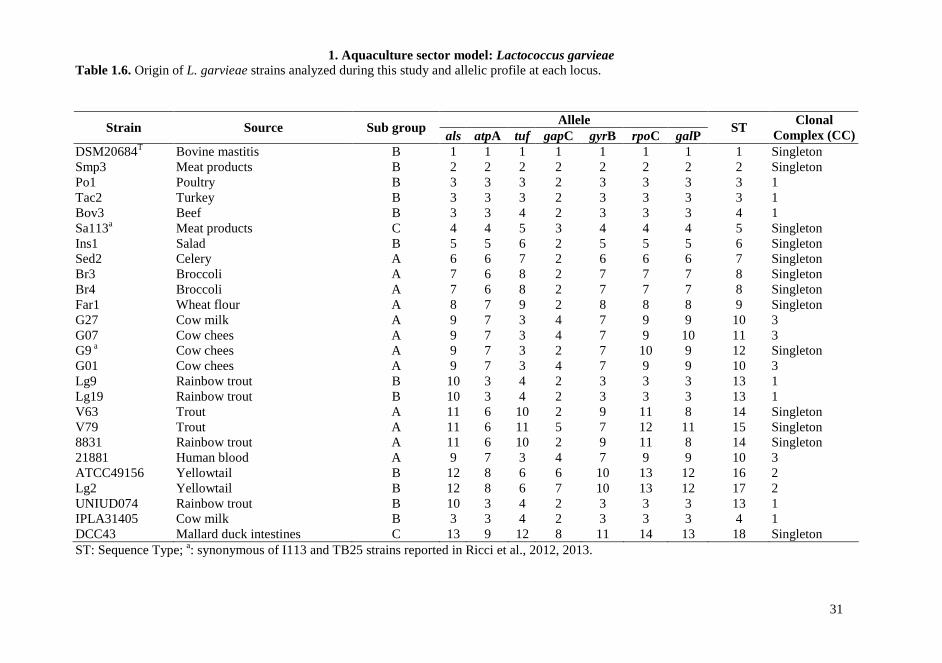
1.4.7. MLST The MLST scheme developed in this study was designed to be technically robust, generating high amplicon yields for all genotypes, under the same PCR conditions for all seven loci. Chosen target genes were widely distributed around the chromosome, showed discriminatory power, and lacked insertions or deletions that caused changes in length. Sequences from 26 L. garvieae strains from different environmental sources were classified in 18 unique Sequence Types (STs) in the MLST scheme, highlighting a significant heterogeneity in the strain collection. All loci were polymorphic (Table 1.6) and the number of allele assignation varied between 8 in gapC, the most conserved locus, and 14 in rpoC, suggesting a different evolution rate between different loci, equally distributed along the genome sequences. Indeed, the increasing availability of L. garvieae genomes in database allowed us to determinate the location of these target genes and verify their distribution; the minimum distance between loci was 18 kb. To estimate the genetic diversity of L. garvieae we used the average nucleotide diversity π, but since this parameter could be influenced by the sample size, only one sample from each ST was analyzed. We also measured the πMAX , defined as the number of nucleotide differences per site between the two most divergent sequences within the population. This value in fact is not directly sensitive to sampling size but only to the extreme values of sequence divergence (Passerini et al., 2010). The average nucleotide diversity π of L. garvieae generated by the analysis of the concatenated DNA sequences of all loci was 0.0297±0.0068, corresponding to 691 polymorphic sites (Table 1.7). This value of π was significantly higher than π for similar species, like L. lactis (Passerini et al., 2010) that appear monophyletic in comparison, suggesting a possible high variability in L. garvieae species. For single locus π ranges from 0.0074±0.0032 for gapC to 0.0663±0.0159 for gyrB, and these results are also confirmed by the determination of πMAX, supporting the hypothesis of different evolution rate of considered loci. The phylogeny of the 26 L. garvieae strains was analyzed by constructing a neighbor-joining tree from the 5713 bp concatenated sequence of the seven loci (Figure 1.5). The tree revealed the presence of two main subgroups (SA and SB) as highlighted in previous work (Ferrario et al., 2012) and also in this case not coherent with the ecological niche of isolation. The MLST experiments show the presence of a third branch in the phylogenetic tree (Subgroup C, SC) composed by a meat isolate (Sa113) and a strain from mallard duck intestines (DCC43). This branch is totally separated from the other lineages. The phylogenetic tree from concatenated sequences analysis, was compared to the topologies of the seven tree constructed for each gene (data not shown). The general sample classification of the single locus tree was very similar to that of the concatenated one. When sequences data were analyzed after stratification by subgroups, the number of polymorphisms and genetic diversity within each subpopulation were reduced (Table 1.7). The SC subgroup was the exception, showing the highest π and number of polymorphic sites, also if compared to the total population. This suggests the presence of a barrier for genetic exchange between these L. garvieae subgroups. Moreover, the diversity of the subgroup SC influences hardly the mean genetic diversity of the total population and could represent the origin of the species.
1. Aquaculture sector model: Lactococcus garvieae
31
Table 1.6. Origin of L. garvieae strains analyzed during this study and allelic profile at each locus.
ST: Sequence Type; a: synonymous of I113 and TB25 strains reported in Ricci et al., 2012, 2013.
Allele Strain Source Sub group
als atpA tuf gapC gyrB rpoC galP ST
Clonal Complex (CC)
DSM20684T Bovine mastitis B 1 1 1 1 1 1 1 1 Singleton Smp3 Meat products B 2 2 2 2 2 2 2 2 Singleton Po1 Poultry B 3 3 3 2 3 3 3 3 1 Tac2 Turkey B 3 3 3 2 3 3 3 3 1 Bov3 Beef B 3 3 4 2 3 3 3 4 1 Sa113a Meat products C 4 4 5 3 4 4 4 5 Singleton Ins1 Salad B 5 5 6 2 5 5 5 6 Singleton Sed2 Celery A 6 6 7 2 6 6 6 7 Singleton Br3 Broccoli A 7 6 8 2 7 7 7 8 Singleton Br4 Broccoli A 7 6 8 2 7 7 7 8 Singleton Far1 Wheat flour A 8 7 9 2 8 8 8 9 Singleton G27 Cow milk A 9 7 3 4 7 9 9 10 3 G07 Cow chees A 9 7 3 4 7 9 10 11 3 G9 a Cow chees A 9 7 3 2 7 10 9 12 Singleton G01 Cow chees A 9 7 3 4 7 9 9 10 3 Lg9 Rainbow trout B 10 3 4 2 3 3 3 13 1 Lg19 Rainbow trout B 10 3 4 2 3 3 3 13 1 V63 Trout A 11 6 10 2 9 11 8 14 Singleton V79 Trout A 11 6 11 5 7 12 11 15 Singleton 8831 Rainbow trout A 11 6 10 2 9 11 8 14 Singleton 21881 Human blood A 9 7 3 4 7 9 9 10 3 ATCC49156 Yellowtail B 12 8 6 6 10 13 12 16 2 Lg2 Yellowtail B 12 8 6 7 10 13 12 17 2 UNIUD074 Rainbow trout B 10 3 4 2 3 3 3 13 1 IPLA31405 Cow milk B 3 3 4 2 3 3 3 4 1 DCC43 Mallard duck intestines C 13 9 12 8 11 14 13 18 Singleton
1. Aquaculture sector model: Lactococcus garvieae
32
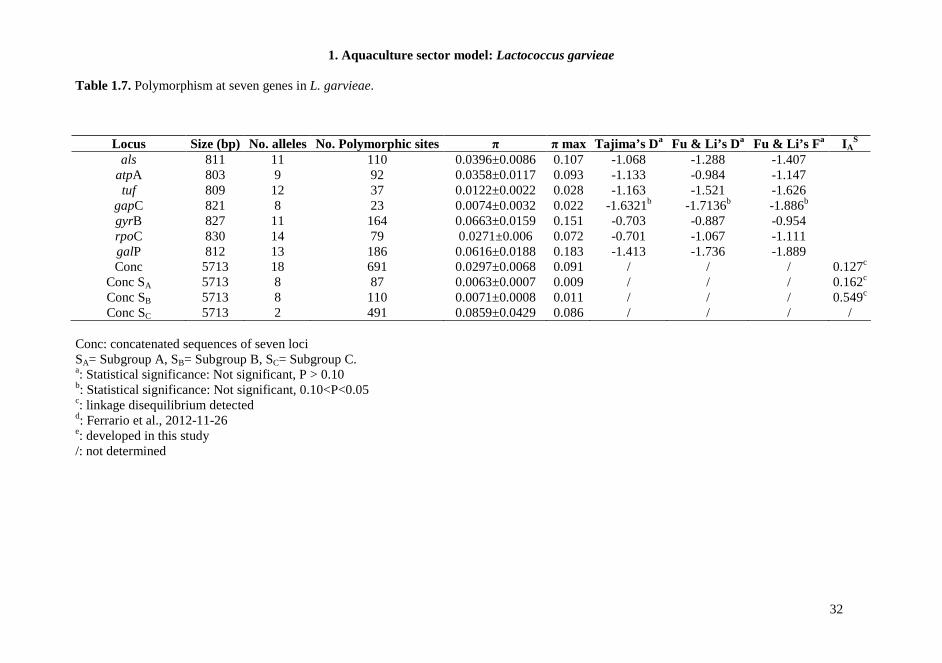
Table 1.7. Polymorphism at seven genes in L. garvieae.
Conc: concatenated sequences of seven loci SA= Subgroup A, SB= Subgroup B, SC= Subgroup C. a: Statistical significance: Not significant, P > 0.10 b: Statistical significance: Not significant, 0.10<P<0.05 c: linkage disequilibrium detected d: Ferrario et al., 2012-11-26 e: developed in this study /: not determined
Locus Size (bp) No. alleles No. Polymorphic sites π π max Tajima’s Da Fu & Li’s D a Fu & Li’s F a IAS
als 811 11 110 0.0396±0.0086 0.107 -1.068 -1.288 -1.407 atpA 803 9 92 0.0358±0.0117 0.093 -1.133 -0.984 -1.147 tuf 809 12 37 0.0122±0.0022 0.028 -1.163 -1.521 -1.626
gapC 821 8 23 0.0074±0.0032 0.022 -1.6321b -1.7136b -1.886b gyrB 827 11 164 0.0663±0.0159 0.151 -0.703 -0.887 -0.954 rpoC 830 14 79 0.0271±0.006 0.072 -0.701 -1.067 -1.111 galP 812 13 186 0.0616±0.0188 0.183 -1.413 -1.736 -1.889 Conc 5713 18 691 0.0297±0.0068 0.091 / / / 0.127c
Conc SA 5713 8 87 0.0063±0.0007 0.009 / / / 0.162c Conc SB 5713 8 110 0.0071±0.0008 0.011 / / / 0.549c Conc SC 5713 2 491 0.0859±0.0429 0.086 / / / /
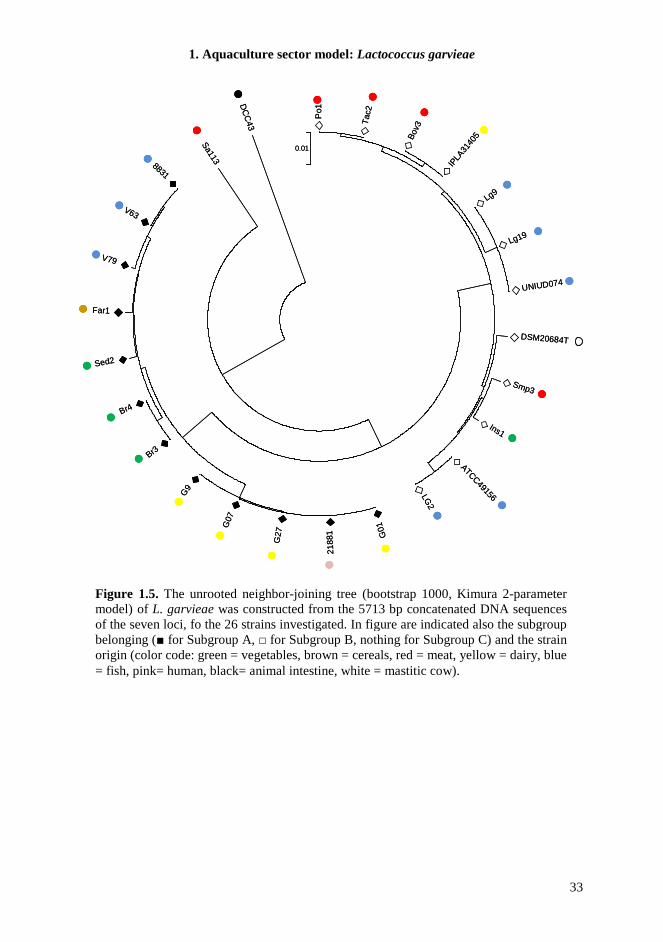
1. Aquaculture sector model: Lactococcus garvieae
33
Figure 1.5. The unrooted neighbor-joining tree (bootstrap 1000, Kimura 2-parameter model) of L. garvieae was constructed from the 5713 bp concatenated DNA sequences of the seven loci, fo the 26 strains investigated. In figure are indicated also the subgroup belonging (■ for Subgroup A, □ for Subgroup B, nothing for Subgroup C) and the strain origin (color code: green = vegetables, brown = cereals, red = meat, yellow = dairy, blue = fish, pink= human, black= animal intestine, white = mastitic cow).
Po1
Tac
2
Bov
3
IPLA
3140
5
Lg9
Lg19
UNIUD074
DSM20684T
Smp3
Ins1
ATCC49156LG2
G01
2188
1
G27
G07
G9
Br3
Br4
Sed2
Far1
V79
V63
8831
Sa113
DC
C43
0.01
Po1
Tac
2
Bov
3
IPLA
3140
5
Lg9
Lg19
UNIUD074
DSM20684T
Smp3
Ins1
ATCC49156LG2
G01
2188
1
G27
G07
G9
Br3
Br4
Sed2
Far1
V79
V63
8831
Sa113
DC
C43
0.01
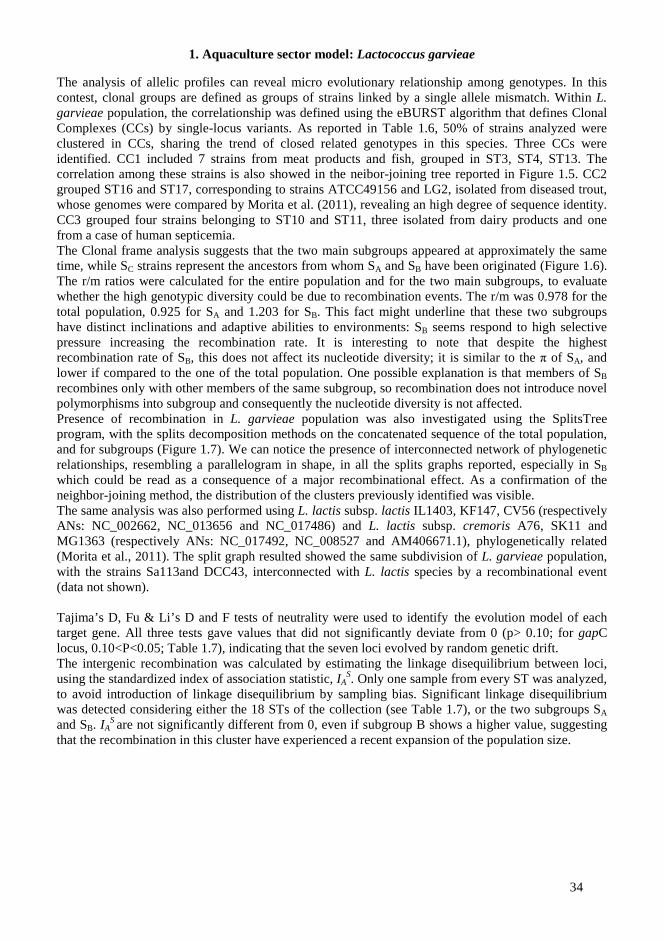
1. Aquaculture sector model: Lactococcus garvieae
34
The analysis of allelic profiles can reveal micro evolutionary relationship among genotypes. In this contest, clonal groups are defined as groups of strains linked by a single allele mismatch. Within L. garvieae population, the correlationship was defined using the eBURST algorithm that defines Clonal Complexes (CCs) by single-locus variants. As reported in Table 1.6, 50% of strains analyzed were clustered in CCs, sharing the trend of closed related genotypes in this species. Three CCs were identified. CC1 included 7 strains from meat products and fish, grouped in ST3, ST4, ST13. The correlation among these strains is also showed in the neibor-joining tree reported in Figure 1.5. CC2 grouped ST16 and ST17, corresponding to strains ATCC49156 and LG2, isolated from diseased trout, whose genomes were compared by Morita et al. (2011), revealing an high degree of sequence identity. CC3 grouped four strains belonging to ST10 and ST11, three isolated from dairy products and one from a case of human septicemia. The Clonal frame analysis suggests that the two main subgroups appeared at approximately the same time, while SC strains represent the ancestors from whom SA and SB have been originated (Figure 1.6). The r/m ratios were calculated for the entire population and for the two main subgroups, to evaluate whether the high genotypic diversity could be due to recombination events. The r/m was 0.978 for the total population, 0.925 for SA and 1.203 for SB. This fact might underline that these two subgroups have distinct inclinations and adaptive abilities to environments: SB seems respond to high selective pressure increasing the recombination rate. It is interesting to note that despite the highest recombination rate of SB, this does not affect its nucleotide diversity; it is similar to the π of SA, and lower if compared to the one of the total population. One possible explanation is that members of SB recombines only with other members of the same subgroup, so recombination does not introduce novel polymorphisms into subgroup and consequently the nucleotide diversity is not affected. Presence of recombination in L. garvieae population was also investigated using the SplitsTree program, with the splits decomposition methods on the concatenated sequence of the total population, and for subgroups (Figure 1.7). We can notice the presence of interconnected network of phylogenetic relationships, resembling a parallelogram in shape, in all the splits graphs reported, especially in SB which could be read as a consequence of a major recombinational effect. As a confirmation of the neighbor-joining method, the distribution of the clusters previously identified was visible. The same analysis was also performed using L. lactis subsp. lactis IL1403, KF147, CV56 (respectively ANs: NC_002662, NC_013656 and NC_017486) and L. lactis subsp. cremoris A76, SK11 and MG1363 (respectively ANs: NC_017492, NC_008527 and AM406671.1), phylogenetically related (Morita et al., 2011). The split graph resulted showed the same subdivision of L. garvieae population, with the strains Sa113and DCC43, interconnected with L. lactis species by a recombinational event (data not shown). Tajima’s D, Fu & Li’s D and F tests of neutrality were used to identify the evolution model of each target gene. All three tests gave values that did not significantly deviate from 0 (p> 0.10; for gapC locus, 0.10<P<0.05; Table 1.7), indicating that the seven loci evolved by random genetic drift. The intergenic recombination was calculated by estimating the linkage disequilibrium between loci, using the standardized index of association statistic, IA
S. Only one sample from every ST was analyzed, to avoid introduction of linkage disequilibrium by sampling bias. Significant linkage disequilibrium was detected considering either the 18 STs of the collection (see Table 1.7), or the two subgroups SA and SB. IA
S are not significantly different from 0, even if subgroup B shows a higher value, suggesting that the recombination in this cluster have experienced a recent expansion of the population size.
1. Aquaculture sector model: Lactococcus garvieae
35
Figure 1.6. Major rule consensus tree generated by Clonal Frame analysis of concatenated sequences of all loci, for the total population.
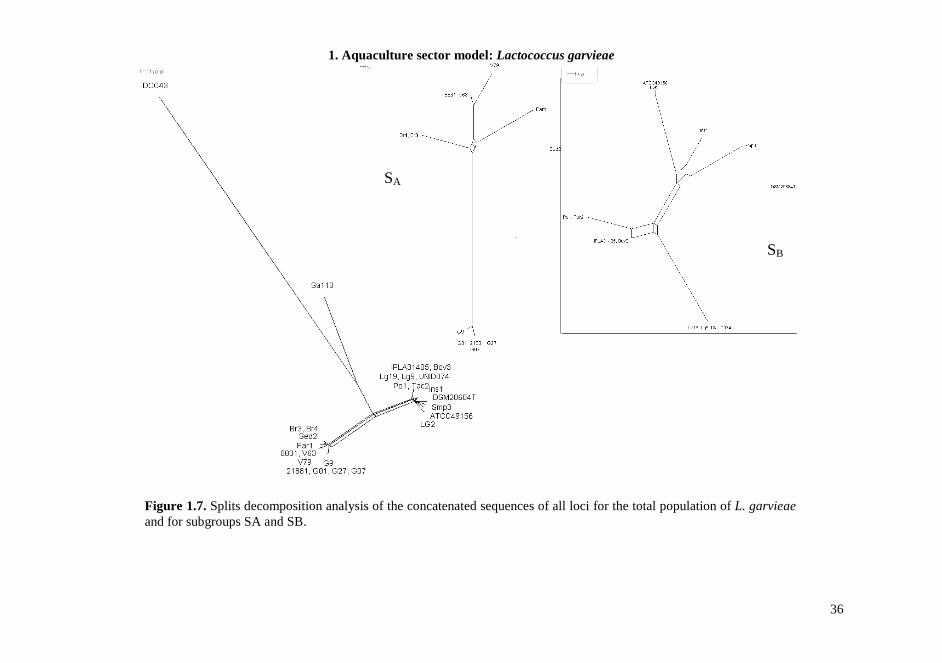
1. Aquaculture sector model: Lactococcus garvieae
36
Figure 1.7. Splits decomposition analysis of the concatenated sequences of all loci for the total population of L. garvieae and for subgroups SA and SB.
SA
SB
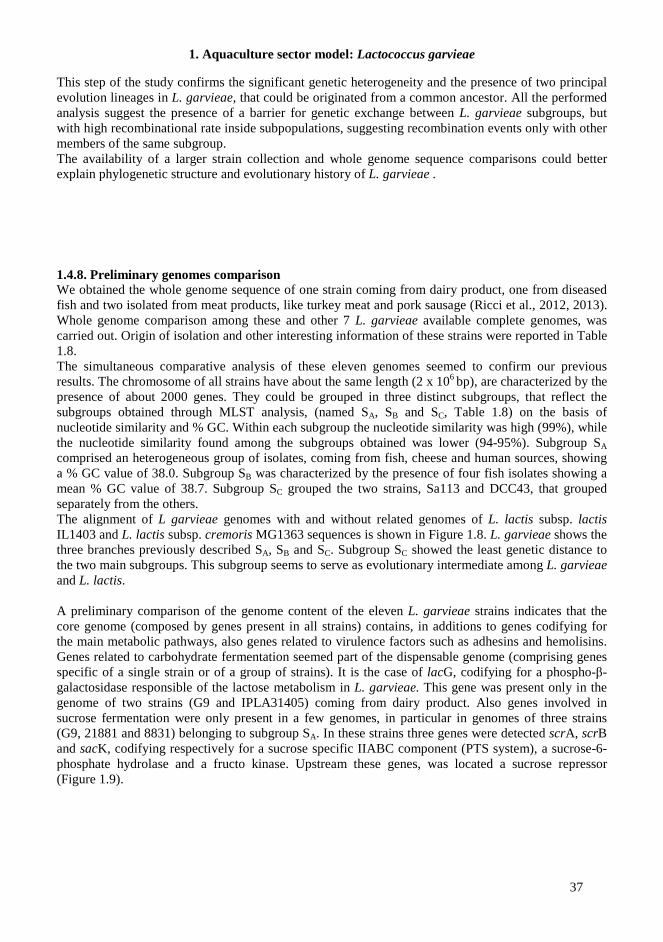
1. Aquaculture sector model: Lactococcus garvieae
37
This step of the study confirms the significant genetic heterogeneity and the presence of two principal evolution lineages in L. garvieae, that could be originated from a common ancestor. All the performed analysis suggest the presence of a barrier for genetic exchange between L. garvieae subgroups, but with high recombinational rate inside subpopulations, suggesting recombination events only with other members of the same subgroup. The availability of a larger strain collection and whole genome sequence comparisons could better explain phylogenetic structure and evolutionary history of L. garvieae .
1.4.8. Preliminary genomes comparison We obtained the whole genome sequence of one strain coming from dairy product, one from diseased fish and two isolated from meat products, like turkey meat and pork sausage (Ricci et al., 2012, 2013). Whole genome comparison among these and other 7 L. garvieae available complete genomes, was carried out. Origin of isolation and other interesting information of these strains were reported in Table 1.8. The simultaneous comparative analysis of these eleven genomes seemed to confirm our previous results. The chromosome of all strains have about the same length (2 x 10⁶ bp), are characterized by the presence of about 2000 genes. They could be grouped in three distinct subgroups, that reflect the subgroups obtained through MLST analysis, (named SA, SB and SC, Table 1.8) on the basis of nucleotide similarity and % GC. Within each subgroup the nucleotide similarity was high (99%), while the nucleotide similarity found among the subgroups obtained was lower (94-95%). Subgroup SA comprised an heterogeneous group of isolates, coming from fish, cheese and human sources, showing a % GC value of 38.0. Subgroup SB was characterized by the presence of four fish isolates showing a mean % GC value of 38.7. Subgroup SC grouped the two strains, Sa113 and DCC43, that grouped separately from the others. The alignment of L garvieae genomes with and without related genomes of L. lactis subsp. lactis IL1403 and L. lactis subsp. cremoris MG1363 sequences is shown in Figure 1.8. L. garvieae shows the three branches previously described SA, SB and SC. Subgroup SC showed the least genetic distance to the two main subgroups. This subgroup seems to serve as evolutionary intermediate among L. garvieae and L. lactis. A preliminary comparison of the genome content of the eleven L. garvieae strains indicates that the core genome (composed by genes present in all strains) contains, in additions to genes codifying for the main metabolic pathways, also genes related to virulence factors such as adhesins and hemolisins. Genes related to carbohydrate fermentation seemed part of the dispensable genome (comprising genes specific of a single strain or of a group of strains). It is the case of lacG, codifying for a phospho-β-galactosidase responsible of the lactose metabolism in L. garvieae. This gene was present only in the genome of two strains (G9 and IPLA31405) coming from dairy product. Also genes involved in sucrose fermentation were only present in a few genomes, in particular in genomes of three strains (G9, 21881 and 8831) belonging to subgroup SA. In these strains three genes were detected scrA, scrB and sacK, codifying respectively for a sucrose specific IIABC component (PTS system), a sucrose-6-phosphate hydrolase and a fructo kinase. Upstream these genes, was located a sucrose repressor (Figure 1.9).
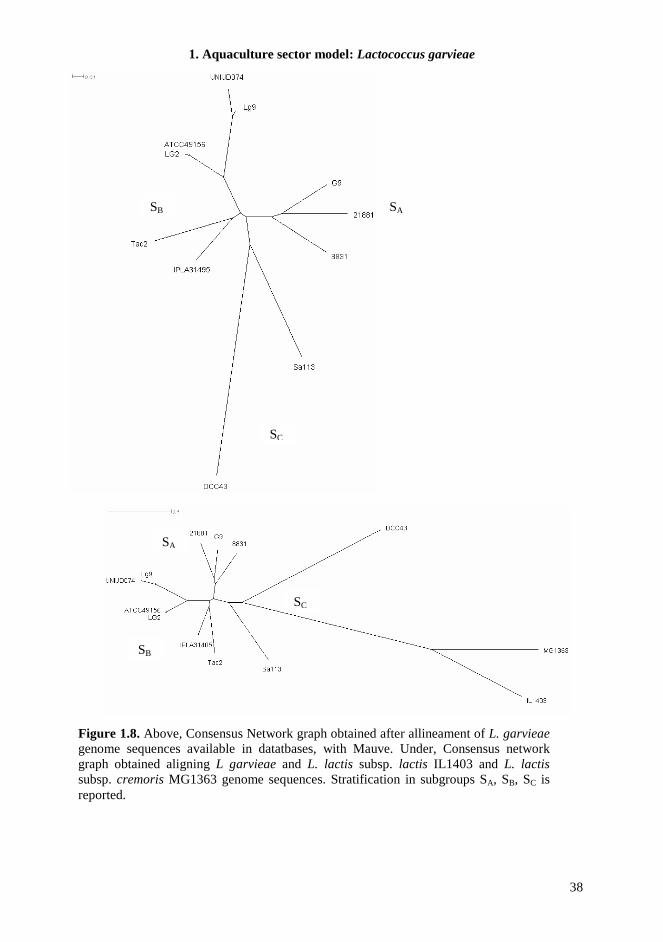
1. Aquaculture sector model: Lactococcus garvieae
38
Figure 1.8. Above, Consensus Network graph obtained after allineament of L. garvieae genome sequences available in datatbases, with Mauve. Under, Consensus network graph obtained aligning L garvieae and L. lactis subsp. lactis IL1403 and L. lactis subsp. cremoris MG1363 genome sequences. Stratification in subgroups SA, SB, SC is reported.
SC
SA SB
SC
SA
SB
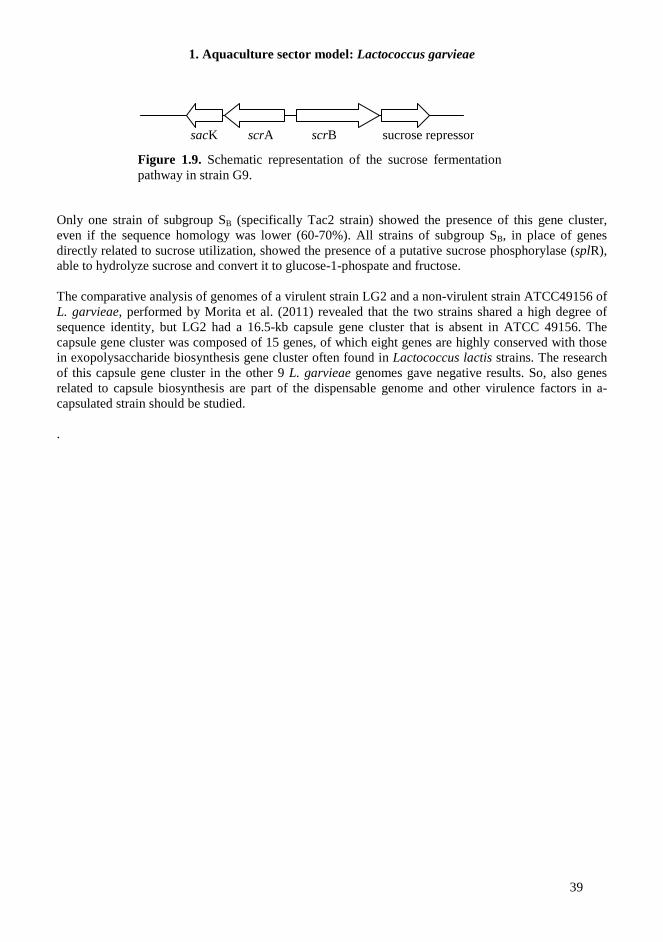
1. Aquaculture sector model: Lactococcus garvieae
39
Only one strain of subgroup SB (specifically Tac2 strain) showed the presence of this gene cluster, even if the sequence homology was lower (60-70%). All strains of subgroup SB, in place of genes directly related to sucrose utilization, showed the presence of a putative sucrose phosphorylase (splR), able to hydrolyze sucrose and convert it to glucose-1-phospate and fructose. The comparative analysis of genomes of a virulent strain LG2 and a non-virulent strain ATCC49156 of L. garvieae, performed by Morita et al. (2011) revealed that the two strains shared a high degree of sequence identity, but LG2 had a 16.5-kb capsule gene cluster that is absent in ATCC 49156. The capsule gene cluster was composed of 15 genes, of which eight genes are highly conserved with those in exopolysaccharide biosynthesis gene cluster often found in Lactococcus lactis strains. The research of this capsule gene cluster in the other 9 L. garvieae genomes gave negative results. So, also genes related to capsule biosynthesis are part of the dispensable genome and other virulence factors in a-capsulated strain should be studied. .
sacK scrA scrB sucrose repressor
Figure 1.9. Schematic representation of the sucrose fermentation pathway in strain G9.
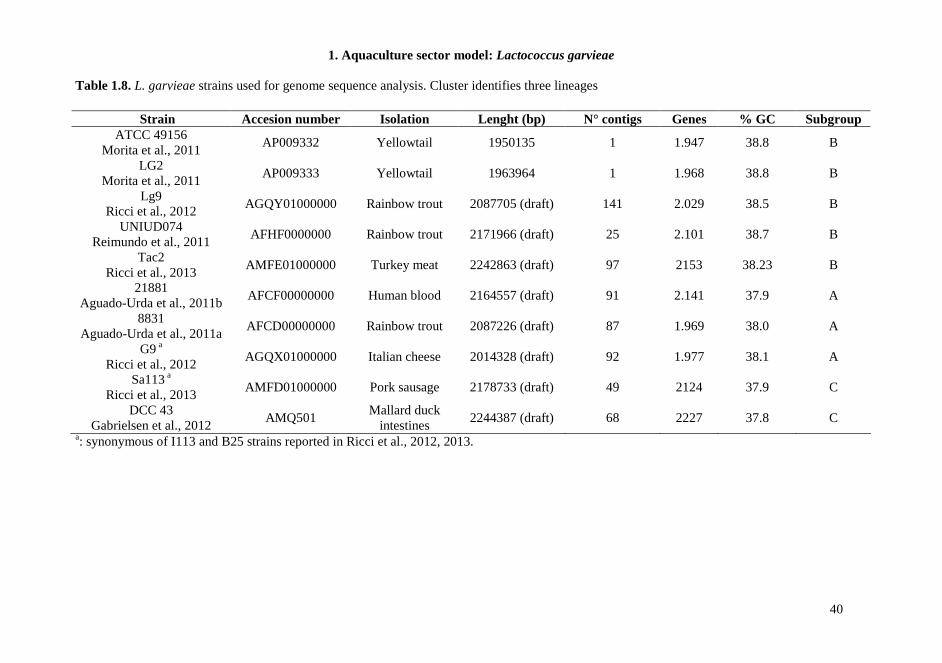
1. Aquaculture sector model: Lactococcus garvieae
40
Table 1.8. L. garvieae strains used for genome sequence analysis. Cluster identifies three lineages
a: synonymous of I113 and B25 strains reported in Ricci et al., 2012, 2013.
Strain Accesion number Isolation Lenght (bp) N° contigs Genes % GC Subgroup ATCC 49156
Morita et al., 2011 AP009332 Yellowtail 1950135 1 1.947 38.8 B
LG2 Morita et al., 2011
AP009333 Yellowtail 1963964 1 1.968 38.8 B
Lg9 Ricci et al., 2012
AGQY01000000 Rainbow trout 2087705 (draft) 141 2.029 38.5 B
UNIUD074 Reimundo et al., 2011
AFHF0000000 Rainbow trout 2171966 (draft) 25 2.101 38.7 B
Tac2 Ricci et al., 2013
AMFE01000000 Turkey meat 2242863 (draft) 97 2153 38.23 B
21881 Aguado-Urda et al., 2011b
AFCF00000000 Human blood 2164557 (draft) 91 2.141 37.9 A
8831 Aguado-Urda et al., 2011a
AFCD00000000 Rainbow trout 2087226 (draft) 87 1.969 38.0 A
G9 a Ricci et al., 2012
AGQX01000000 Italian cheese 2014328 (draft) 92 1.977 38.1 A
Sa113 a Ricci et al., 2013
AMFD01000000 Pork sausage 2178733 (draft) 49 2124 37.9 C
DCC 43 Gabrielsen et al., 2012
AMQ501 Mallard duck
intestines 2244387 (draft) 68 2227 37.8 C
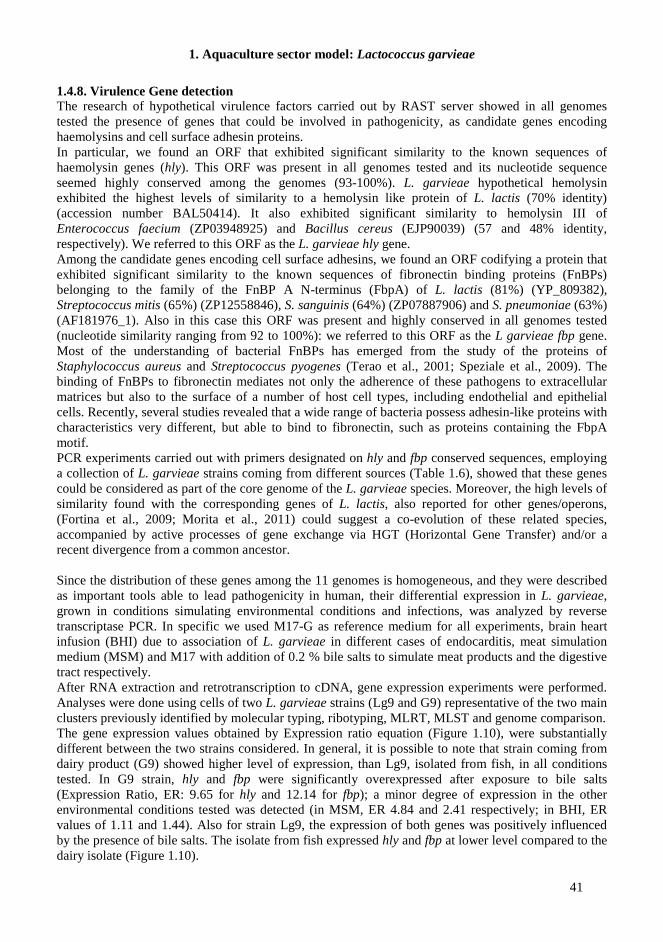
1. Aquaculture sector model: Lactococcus garvieae
41
1.4.8. Virulence Gene detection The research of hypothetical virulence factors carried out by RAST server showed in all genomes tested the presence of genes that could be involved in pathogenicity, as candidate genes encoding haemolysins and cell surface adhesin proteins. In particular, we found an ORF that exhibited significant similarity to the known sequences of haemolysin genes (hly). This ORF was present in all genomes tested and its nucleotide sequence seemed highly conserved among the genomes (93-100%). L. garvieae hypothetical hemolysin exhibited the highest levels of similarity to a hemolysin like protein of L. lactis (70% identity) (accession number BAL50414). It also exhibited significant similarity to hemolysin III of Enterococcus faecium (ZP03948925) and Bacillus cereus (EJP90039) (57 and 48% identity, respectively). We referred to this ORF as the L. garvieae hly gene. Among the candidate genes encoding cell surface adhesins, we found an ORF codifying a protein that exhibited significant similarity to the known sequences of fibronectin binding proteins (FnBPs) belonging to the family of the FnBP A N-terminus (FbpA) of L. lactis (81%) (YP_809382), Streptococcus mitis (65%) (ZP12558846), S. sanguinis (64%) (ZP07887906) and S. pneumoniae (63%) (AF181976_1). Also in this case this ORF was present and highly conserved in all genomes tested (nucleotide similarity ranging from 92 to 100%): we referred to this ORF as the L garvieae fbp gene. Most of the understanding of bacterial FnBPs has emerged from the study of the proteins of Staphylococcus aureus and Streptococcus pyogenes (Terao et al., 2001; Speziale et al., 2009). The binding of FnBPs to fibronectin mediates not only the adherence of these pathogens to extracellular matrices but also to the surface of a number of host cell types, including endothelial and epithelial cells. Recently, several studies revealed that a wide range of bacteria possess adhesin-like proteins with characteristics very different, but able to bind to fibronectin, such as proteins containing the FbpA motif. PCR experiments carried out with primers designated on hly and fbp conserved sequences, employing a collection of L. garvieae strains coming from different sources (Table 1.6), showed that these genes could be considered as part of the core genome of the L. garvieae species. Moreover, the high levels of similarity found with the corresponding genes of L. lactis, also reported for other genes/operons, (Fortina et al., 2009; Morita et al., 2011) could suggest a co-evolution of these related species, accompanied by active processes of gene exchange via HGT (Horizontal Gene Transfer) and/or a recent divergence from a common ancestor. Since the distribution of these genes among the 11 genomes is homogeneous, and they were described as important tools able to lead pathogenicity in human, their differential expression in L. garvieae, grown in conditions simulating environmental conditions and infections, was analyzed by reverse transcriptase PCR. In specific we used M17-G as reference medium for all experiments, brain heart infusion (BHI) due to association of L. garvieae in different cases of endocarditis, meat simulation medium (MSM) and M17 with addition of 0.2 % bile salts to simulate meat products and the digestive tract respectively. After RNA extraction and retrotranscription to cDNA, gene expression experiments were performed. Analyses were done using cells of two L. garvieae strains (Lg9 and G9) representative of the two main clusters previously identified by molecular typing, ribotyping, MLRT, MLST and genome comparison. The gene expression values obtained by Expression ratio equation (Figure 1.10), were substantially different between the two strains considered. In general, it is possible to note that strain coming from dairy product (G9) showed higher level of expression, than Lg9, isolated from fish, in all conditions tested. In G9 strain, hly and fbp were significantly overexpressed after exposure to bile salts (Expression Ratio, ER: 9.65 for hly and 12.14 for fbp); a minor degree of expression in the other environmental conditions tested was detected (in MSM, ER 4.84 and 2.41 respectively; in BHI, ER values of 1.11 and 1.44). Also for strain Lg9, the expression of both genes was positively influenced by the presence of bile salts. The isolate from fish expressed hly and fbp at lower level compared to the dairy isolate (Figure 1.10).
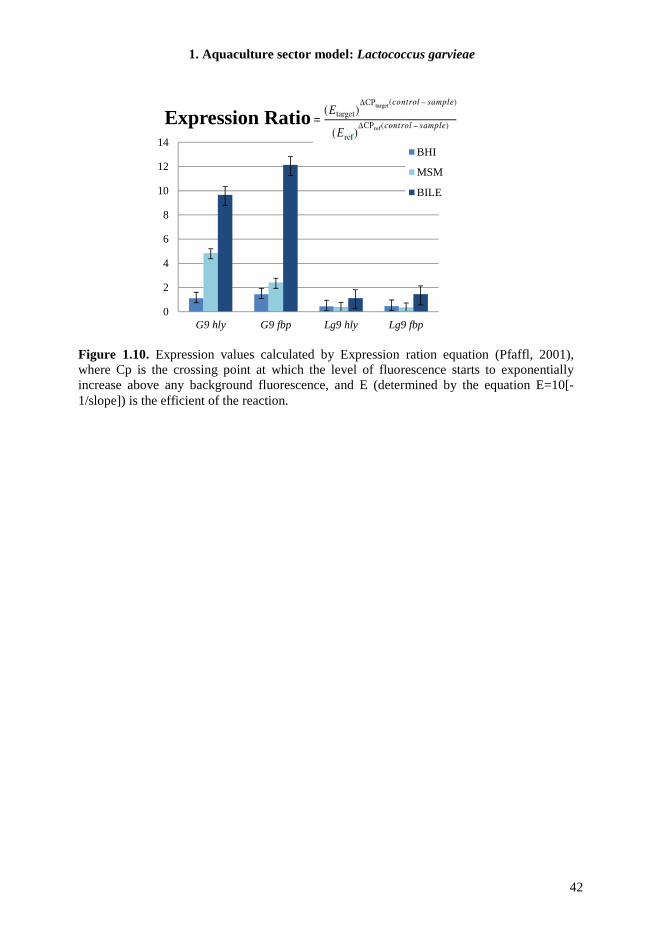
1. Aquaculture sector model: Lactococcus garvieae
42
Figure 1.10. Expression values calculated by Expression ration equation (Pfaffl, 2001), where Cp is the crossing point at which the level of fluorescence starts to exponentially increase above any background fluorescence, and E (determined by the equation E=10[-1/slope]) is the efficient of the reaction.
0
2
4
6
8
10
12
14
G9 hly G9 fbp Lg9 hly Lg9 fbp
Expression Ratio
BHI
MSM
BILE
1. Aquaculture sector model: Lactococcus garvieae
43
1.5. CONCLUSIONS According to the objectives reported in section 1.2, the following conclusions were drawn: - L. garvieae seems widely distributed in all food matrices, particularly in dairy and meat products;
- L. garvieae ability to metabolize lactose was not exclusively related to dairy isolates, but was heterogeneously scattered among L. garvieae meat isolates;
- DNA fingerprinting, MLRT and PCR-ribotyping results support the hypothesis of an early separation of L. garvieae population into two independent genetic lineages, not coherent with the niche of origin of the strains;
- MLST study confirmed the separation of L. garvieae population in two main subgroups and also reveals the presence of a third lineage which includes two isolates that could be considered the ancestors strains from which the others have been originated;
- Comparative analysis of 11 L. garvieae genomes permitted a first elucidation of the history of this species, through the research of genes belonging to core/dispensable genome;
- Experiments carried out to evaluate the expression of virulence-related genes in L garvieae represent the first approaches necessary to clarify the pathogenicity potential of this species, especially for food safety.
Publications related to this part of the PhD project: o Ferrario C, Ricci G, Borgo F, Rollando A, Fortina MG, 2012, Genetic investigation within
Lactococcus garvieae revealed two genomic lineages. FEMS Microbiol Lett 332:153-161.
o Ricci G, Ferrario C, Borgo F, Rollando A, Fortina MG, 2012, Genome sequences of Lactococcus garvieae TB2.5, isolated from Italian cheese, and Lactococcus garvieae LG9, isolated from Italian rainbow trout. J Bacteriol 194:1249-50.
o Ferrario C, Borgo F, Ricci G, Fortina MG, 2012, Variability at gene and genome levels revealed different genomic lineages in Lactococcus garvieae. Presented at 23rd International ICFMH Symposium: Food Micro 2012, Istanbul, Turkey.
o Ricci G, Ferrario C, Borgo F, Eraclio G, Fortina MG, 2013, Genome sequences of two Lactococcus garvieae strains Isolated from meat. Genome Announc, 1: in press.
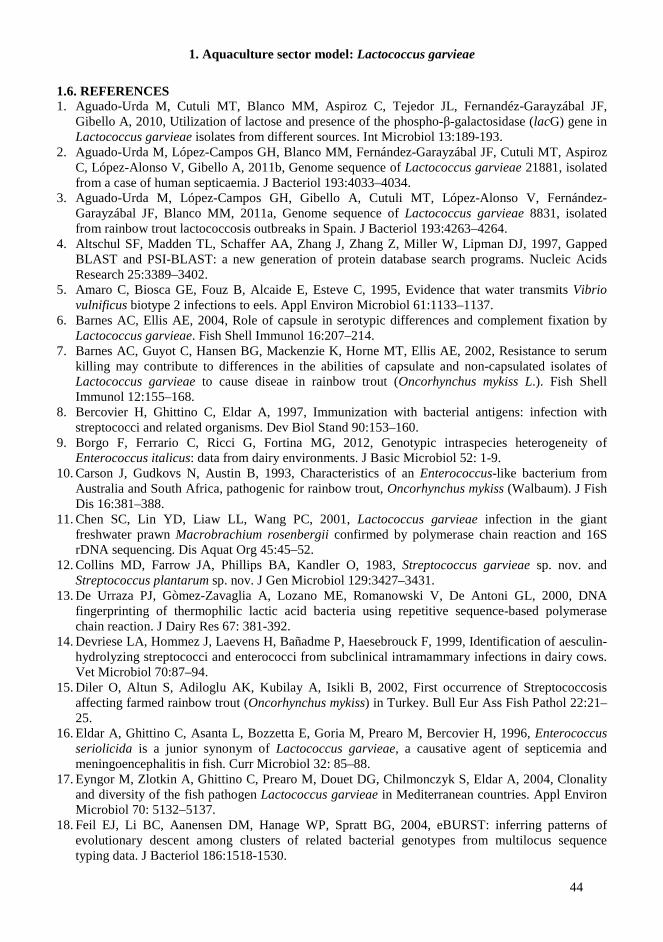
1. Aquaculture sector model: Lactococcus garvieae
44
1.6. REFERENCES 1. Aguado-Urda M, Cutuli MT, Blanco MM, Aspiroz C, Tejedor JL, Fernandéz-Garayzábal JF,
Gibello A, 2010, Utilization of lactose and presence of the phospho-β-galactosidase (lacG) gene in Lactococcus garvieae isolates from different sources. Int Microbiol 13:189-193.
2. Aguado-Urda M, López-Campos GH, Blanco MM, Fernández-Garayzábal JF, Cutuli MT, Aspiroz C, López-Alonso V, Gibello A, 2011b, Genome sequence of Lactococcus garvieae 21881, isolated from a case of human septicaemia. J Bacteriol 193:4033–4034.
3. Aguado-Urda M, López-Campos GH, Gibello A, Cutuli MT, López-Alonso V, Fernández-Garayzábal JF, Blanco MM, 2011a, Genome sequence of Lactococcus garvieae 8831, isolated from rainbow trout lactococcosis outbreaks in Spain. J Bacteriol 193:4263–4264.
4. Altschul SF, Madden TL, Schaffer AA, Zhang J, Zhang Z, Miller W, Lipman DJ, 1997, Gapped BLAST and PSI-BLAST: a new generation of protein database search programs. Nucleic Acids Research 25:3389–3402.
5. Amaro C, Biosca GE, Fouz B, Alcaide E, Esteve C, 1995, Evidence that water transmits Vibrio vulnificus biotype 2 infections to eels. Appl Environ Microbiol 61:1133–1137.
6. Barnes AC, Ellis AE, 2004, Role of capsule in serotypic differences and complement fixation by Lactococcus garvieae. Fish Shell Immunol 16:207–214.
7. Barnes AC, Guyot C, Hansen BG, Mackenzie K, Horne MT, Ellis AE, 2002, Resistance to serum killing may contribute to differences in the abilities of capsulate and non-capsulated isolates of Lactococcus garvieae to cause diseae in rainbow trout (Oncorhynchus mykiss L.). Fish Shell Immunol 12:155–168.
8. Bercovier H, Ghittino C, Eldar A, 1997, Immunization with bacterial antigens: infection with streptococci and related organisms. Dev Biol Stand 90:153–160.
9. Borgo F, Ferrario C, Ricci G, Fortina MG, 2012, Genotypic intraspecies heterogeneity of Enterococcus italicus: data from dairy environments. J Basic Microbiol 52: 1-9.
10. Carson J, Gudkovs N, Austin B, 1993, Characteristics of an Enterococcus-like bacterium from Australia and South Africa, pathogenic for rainbow trout, Oncorhynchus mykiss (Walbaum). J Fish Dis 16:381–388.
11. Chen SC, Lin YD, Liaw LL, Wang PC, 2001, Lactococcus garvieae infection in the giant freshwater prawn Macrobrachium rosenbergii confirmed by polymerase chain reaction and 16S rDNA sequencing. Dis Aquat Org 45:45–52.
12. Collins MD, Farrow JA, Phillips BA, Kandler O, 1983, Streptococcus garvieae sp. nov. and Streptococcus plantarum sp. nov. J Gen Microbiol 129:3427–3431.
13. De Urraza PJ, Gòmez-Zavaglia A, Lozano ME, Romanowski V, De Antoni GL, 2000, DNA fingerprinting of thermophilic lactic acid bacteria using repetitive sequence-based polymerase chain reaction. J Dairy Res 67: 381-392.
14. Devriese LA, Hommez J, Laevens H, Bañadme P, Haesebrouck F, 1999, Identification of aesculin-hydrolyzing streptococci and enterococci from subclinical intramammary infections in dairy cows. Vet Microbiol 70:87–94.
15. Diler O, Altun S, Adiloglu AK, Kubilay A, Isikli B, 2002, First occurrence of Streptococcosis affecting farmed rainbow trout (Oncorhynchus mykiss) in Turkey. Bull Eur Ass Fish Pathol 22:21–25.
16. Eldar A, Ghittino C, Asanta L, Bozzetta E, Goria M, Prearo M, Bercovier H, 1996, Enterococcus seriolicida is a junior synonym of Lactococcus garvieae, a causative agent of septicemia and meningoencephalitis in fish. Curr Microbiol 32: 85–88.
17. Eyngor M, Zlotkin A, Ghittino C, Prearo M, Douet DG, Chilmonczyk S, Eldar A, 2004, Clonality and diversity of the fish pathogen Lactococcus garvieae in Mediterranean countries. Appl Environ Microbiol 70: 5132–5137.
18. Feil EJ, Li BC, Aanensen DM, Hanage WP, Spratt BG, 2004, eBURST: inferring patterns of evolutionary descent among clusters of related bacterial genotypes from multilocus sequence typing data. J Bacteriol 186:1518-1530.
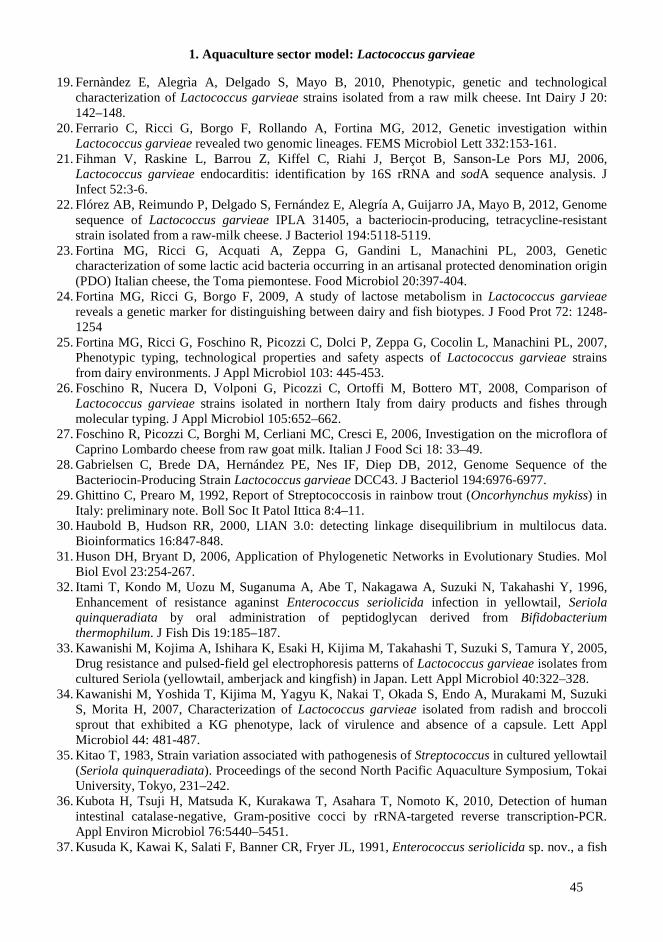
1. Aquaculture sector model: Lactococcus garvieae
45
19. Fernàndez E, Alegrìa A, Delgado S, Mayo B, 2010, Phenotypic, genetic and technological characterization of Lactococcus garvieae strains isolated from a raw milk cheese. Int Dairy J 20: 142–148.
20. Ferrario C, Ricci G, Borgo F, Rollando A, Fortina MG, 2012, Genetic investigation within Lactococcus garvieae revealed two genomic lineages. FEMS Microbiol Lett 332:153-161.
21. Fihman V, Raskine L, Barrou Z, Kiffel C, Riahi J, Berçot B, Sanson-Le Pors MJ, 2006, Lactococcus garvieae endocarditis: identification by 16S rRNA and sodA sequence analysis. J Infect 52:3-6.
22. Flórez AB, Reimundo P, Delgado S, Fernández E, Alegría A, Guijarro JA, Mayo B, 2012, Genome sequence of Lactococcus garvieae IPLA 31405, a bacteriocin-producing, tetracycline-resistant strain isolated from a raw-milk cheese. J Bacteriol 194:5118-5119.
23. Fortina MG, Ricci G, Acquati A, Zeppa G, Gandini L, Manachini PL, 2003, Genetic characterization of some lactic acid bacteria occurring in an artisanal protected denomination origin (PDO) Italian cheese, the Toma piemontese. Food Microbiol 20:397-404.
24. Fortina MG, Ricci G, Borgo F, 2009, A study of lactose metabolism in Lactococcus garvieae reveals a genetic marker for distinguishing between dairy and fish biotypes. J Food Prot 72: 1248-1254
25. Fortina MG, Ricci G, Foschino R, Picozzi C, Dolci P, Zeppa G, Cocolin L, Manachini PL, 2007, Phenotypic typing, technological properties and safety aspects of Lactococcus garvieae strains from dairy environments. J Appl Microbiol 103: 445-453.
26. Foschino R, Nucera D, Volponi G, Picozzi C, Ortoffi M, Bottero MT, 2008, Comparison of Lactococcus garvieae strains isolated in northern Italy from dairy products and fishes through molecular typing. J Appl Microbiol 105:652–662.
27. Foschino R, Picozzi C, Borghi M, Cerliani MC, Cresci E, 2006, Investigation on the microflora of Caprino Lombardo cheese from raw goat milk. Italian J Food Sci 18: 33–49.
28. Gabrielsen C, Brede DA, Hernández PE, Nes IF, Diep DB, 2012, Genome Sequence of the Bacteriocin-Producing Strain Lactococcus garvieae DCC43. J Bacteriol 194:6976-6977.
29. Ghittino C, Prearo M, 1992, Report of Streptococcosis in rainbow trout (Oncorhynchus mykiss) in Italy: preliminary note. Boll Soc It Patol Ittica 8:4–11.
30. Haubold B, Hudson RR, 2000, LIAN 3.0: detecting linkage disequilibrium in multilocus data. Bioinformatics 16:847-848.
31. Huson DH, Bryant D, 2006, Application of Phylogenetic Networks in Evolutionary Studies. Mol Biol Evol 23:254-267.
32. Itami T, Kondo M, Uozu M, Suganuma A, Abe T, Nakagawa A, Suzuki N, Takahashi Y, 1996, Enhancement of resistance aganinst Enterococcus seriolicida infection in yellowtail, Seriola quinqueradiata by oral administration of peptidoglycan derived from Bifidobacterium thermophilum. J Fish Dis 19:185–187.
33. Kawanishi M, Kojima A, Ishihara K, Esaki H, Kijima M, Takahashi T, Suzuki S, Tamura Y, 2005, Drug resistance and pulsed-field gel electrophoresis patterns of Lactococcus garvieae isolates from cultured Seriola (yellowtail, amberjack and kingfish) in Japan. Lett Appl Microbiol 40:322–328.
34. Kawanishi M, Yoshida T, Kijima M, Yagyu K, Nakai T, Okada S, Endo A, Murakami M, Suzuki S, Morita H, 2007, Characterization of Lactococcus garvieae isolated from radish and broccoli sprout that exhibited a KG phenotype, lack of virulence and absence of a capsule. Lett Appl Microbiol 44: 481-487.
35. Kitao T, 1983, Strain variation associated with pathogenesis of Streptococcus in cultured yellowtail (Seriola quinqueradiata). Proceedings of the second North Pacific Aquaculture Symposium, Tokai University, Tokyo, 231–242.
36. Kubota H, Tsuji H, Matsuda K, Kurakawa T, Asahara T, Nomoto K, 2010, Detection of human intestinal catalase-negative, Gram-positive cocci by rRNA-targeted reverse transcription-PCR. Appl Environ Microbiol 76:5440–5451.
37. Kusuda K, Kawai K, Salati F, Banner CR, Fryer JL, 1991, Enterococcus seriolicida sp. nov., a fish
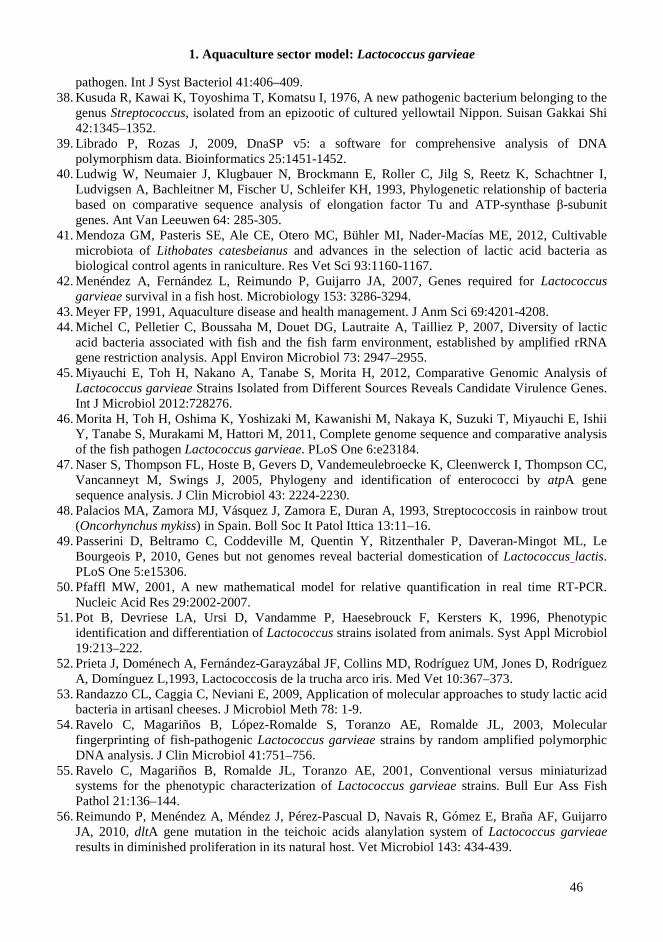
1. Aquaculture sector model: Lactococcus garvieae
46
pathogen. Int J Syst Bacteriol 41:406–409. 38. Kusuda R, Kawai K, Toyoshima T, Komatsu I, 1976, A new pathogenic bacterium belonging to the
genus Streptococcus, isolated from an epizootic of cultured yellowtail Nippon. Suisan Gakkai Shi 42:1345–1352.
39. Librado P, Rozas J, 2009, DnaSP v5: a software for comprehensive analysis of DNA polymorphism data. Bioinformatics 25:1451-1452.
40. Ludwig W, Neumaier J, Klugbauer N, Brockmann E, Roller C, Jilg S, Reetz K, Schachtner I, Ludvigsen A, Bachleitner M, Fischer U, Schleifer KH, 1993, Phylogenetic relationship of bacteria based on comparative sequence analysis of elongation factor Tu and ATP-synthase β-subunit genes. Ant Van Leeuwen 64: 285-305.
41. Mendoza GM, Pasteris SE, Ale CE, Otero MC, Bühler MI, Nader-Macías ME, 2012, Cultivable microbiota of Lithobates catesbeianus and advances in the selection of lactic acid bacteria as biological control agents in raniculture. Res Vet Sci 93:1160-1167.
42. Menéndez A, Fernández L, Reimundo P, Guijarro JA, 2007, Genes required for Lactococcus garvieae survival in a fish host. Microbiology 153: 3286-3294.
43. Meyer FP, 1991, Aquaculture disease and health management. J Anm Sci 69:4201-4208. 44. Michel C, Pelletier C, Boussaha M, Douet DG, Lautraite A, Tailliez P, 2007, Diversity of lactic
acid bacteria associated with fish and the fish farm environment, established by amplified rRNA gene restriction analysis. Appl Environ Microbiol 73: 2947–2955.
45. Miyauchi E, Toh H, Nakano A, Tanabe S, Morita H, 2012, Comparative Genomic Analysis of Lactococcus garvieae Strains Isolated from Different Sources Reveals Candidate Virulence Genes. Int J Microbiol 2012:728276.
46. Morita H, Toh H, Oshima K, Yoshizaki M, Kawanishi M, Nakaya K, Suzuki T, Miyauchi E, Ishii Y, Tanabe S, Murakami M, Hattori M, 2011, Complete genome sequence and comparative analysis of the fish pathogen Lactococcus garvieae. PLoS One 6:e23184.
47. Naser S, Thompson FL, Hoste B, Gevers D, Vandemeulebroecke K, Cleenwerck I, Thompson CC, Vancanneyt M, Swings J, 2005, Phylogeny and identification of enterococci by atpA gene sequence analysis. J Clin Microbiol 43: 2224-2230.
48. Palacios MA, Zamora MJ, Vásquez J, Zamora E, Duran A, 1993, Streptococcosis in rainbow trout (Oncorhynchus mykiss) in Spain. Boll Soc It Patol Ittica 13:11–16.
49. Passerini D, Beltramo C, Coddeville M, Quentin Y, Ritzenthaler P, Daveran-Mingot ML, Le Bourgeois P, 2010, Genes but not genomes reveal bacterial domestication of Lactococcus lactis. PLoS One 5:e15306.
50. Pfaffl MW, 2001, A new mathematical model for relative quantification in real time RT-PCR. Nucleic Acid Res 29:2002-2007.
51. Pot B, Devriese LA, Ursi D, Vandamme P, Haesebrouck F, Kersters K, 1996, Phenotypic identification and differentiation of Lactococcus strains isolated from animals. Syst Appl Microbiol 19:213–222.
52. Prieta J, Doménech A, Fernández-Garayzábal JF, Collins MD, Rodríguez UM, Jones D, Rodríguez A, Domínguez L,1993, Lactococcosis de la trucha arco iris. Med Vet 10:367–373.
53. Randazzo CL, Caggia C, Neviani E, 2009, Application of molecular approaches to study lactic acid bacteria in artisanl cheeses. J Microbiol Meth 78: 1-9.
54. Ravelo C, Magariños B, López-Romalde S, Toranzo AE, Romalde JL, 2003, Molecular fingerprinting of fish-pathogenic Lactococcus garvieae strains by random amplified polymorphic DNA analysis. J Clin Microbiol 41:751–756.
55. Ravelo C, Magariños B, Romalde JL, Toranzo AE, 2001, Conventional versus miniaturizad systems for the phenotypic characterization of Lactococcus garvieae strains. Bull Eur Ass Fish Pathol 21:136–144.
56. Reimundo P, Menéndez A, Méndez J, Pérez-Pascual D, Navais R, Gómez E, Braña AF, Guijarro JA, 2010, dltA gene mutation in the teichoic acids alanylation system of Lactococcus garvieae results in diminished proliferation in its natural host. Vet Microbiol 143: 434-439.
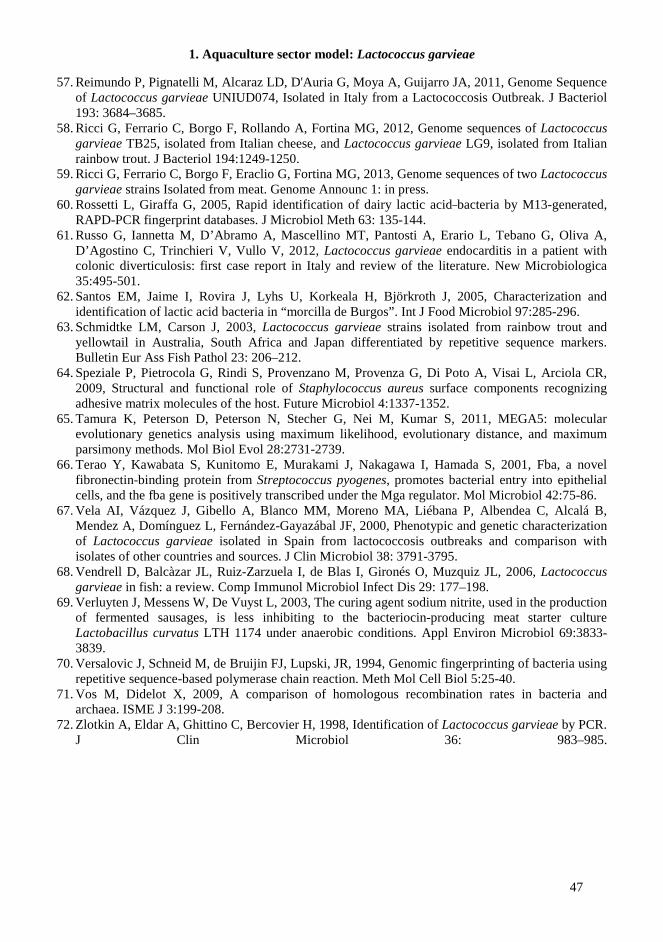
1. Aquaculture sector model: Lactococcus garvieae
47
57. Reimundo P, Pignatelli M, Alcaraz LD, D'Auria G, Moya A, Guijarro JA, 2011, Genome Sequence of Lactococcus garvieae UNIUD074, Isolated in Italy from a Lactococcosis Outbreak. J Bacteriol 193: 3684–3685.
58. Ricci G, Ferrario C, Borgo F, Rollando A, Fortina MG, 2012, Genome sequences of Lactococcus garvieae TB25, isolated from Italian cheese, and Lactococcus garvieae LG9, isolated from Italian rainbow trout. J Bacteriol 194:1249-1250.
59. Ricci G, Ferrario C, Borgo F, Eraclio G, Fortina MG, 2013, Genome sequences of two Lactococcus garvieae strains Isolated from meat. Genome Announc 1: in press.
60. Rossetti L, Giraffa G, 2005, Rapid identification of dairy lactic acid bacteria by M13-generated, RAPD-PCR fingerprint databases. J Microbiol Meth 63: 135-144.
61. Russo G, Iannetta M, D’Abramo A, Mascellino MT, Pantosti A, Erario L, Tebano G, Oliva A, D’Agostino C, Trinchieri V, Vullo V, 2012, Lactococcus garvieae endocarditis in a patient with colonic diverticulosis: first case report in Italy and review of the literature. New Microbiologica 35:495-501.
62. Santos EM, Jaime I, Rovira J, Lyhs U, Korkeala H, Björkroth J, 2005, Characterization and identification of lactic acid bacteria in “morcilla de Burgos”. Int J Food Microbiol 97:285-296.
63. Schmidtke LM, Carson J, 2003, Lactococcus garvieae strains isolated from rainbow trout and yellowtail in Australia, South Africa and Japan differentiated by repetitive sequence markers. Bulletin Eur Ass Fish Pathol 23: 206–212.
64. Speziale P, Pietrocola G, Rindi S, Provenzano M, Provenza G, Di Poto A, Visai L, Arciola CR, 2009, Structural and functional role of Staphylococcus aureus surface components recognizing adhesive matrix molecules of the host. Future Microbiol 4:1337-1352.
65. Tamura K, Peterson D, Peterson N, Stecher G, Nei M, Kumar S, 2011, MEGA5: molecular evolutionary genetics analysis using maximum likelihood, evolutionary distance, and maximum parsimony methods. Mol Biol Evol 28:2731-2739.
66. Terao Y, Kawabata S, Kunitomo E, Murakami J, Nakagawa I, Hamada S, 2001, Fba, a novel fibronectin-binding protein from Streptococcus pyogenes, promotes bacterial entry into epithelial cells, and the fba gene is positively transcribed under the Mga regulator. Mol Microbiol 42:75-86.
67. Vela AI, Vázquez J, Gibello A, Blanco MM, Moreno MA, Liébana P, Albendea C, Alcalá B, Mendez A, Domínguez L, Fernández-Gayazábal JF, 2000, Phenotypic and genetic characterization of Lactococcus garvieae isolated in Spain from lactococcosis outbreaks and comparison with isolates of other countries and sources. J Clin Microbiol 38: 3791-3795.
68. Vendrell D, Balcàzar JL, Ruiz-Zarzuela I, de Blas I, Gironés O, Muzquiz JL, 2006, Lactococcus garvieae in fish: a review. Comp Immunol Microbiol Infect Dis 29: 177–198.
69. Verluyten J, Messens W, De Vuyst L, 2003, The curing agent sodium nitrite, used in the production of fermented sausages, is less inhibiting to the bacteriocin-producing meat starter culture Lactobacillus curvatus LTH 1174 under anaerobic conditions. Appl Environ Microbiol 69:3833-3839.
70. Versalovic J, Schneid M, de Bruijin FJ, Lupski, JR, 1994, Genomic fingerprinting of bacteria using repetitive sequence-based polymerase chain reaction. Meth Mol Cell Biol 5:25-40.
71. Vos M, Didelot X, 2009, A comparison of homologous recombination rates in bacteria and archaea. ISME J 3:199-208.
72. Zlotkin A, Eldar A, Ghittino C, Bercovier H, 1998, Identification of Lactococcus garvieae by PCR. J Clin Microbiol 36: 983–985.


2. FISHING SECTOR MODEL: Morganella morganii
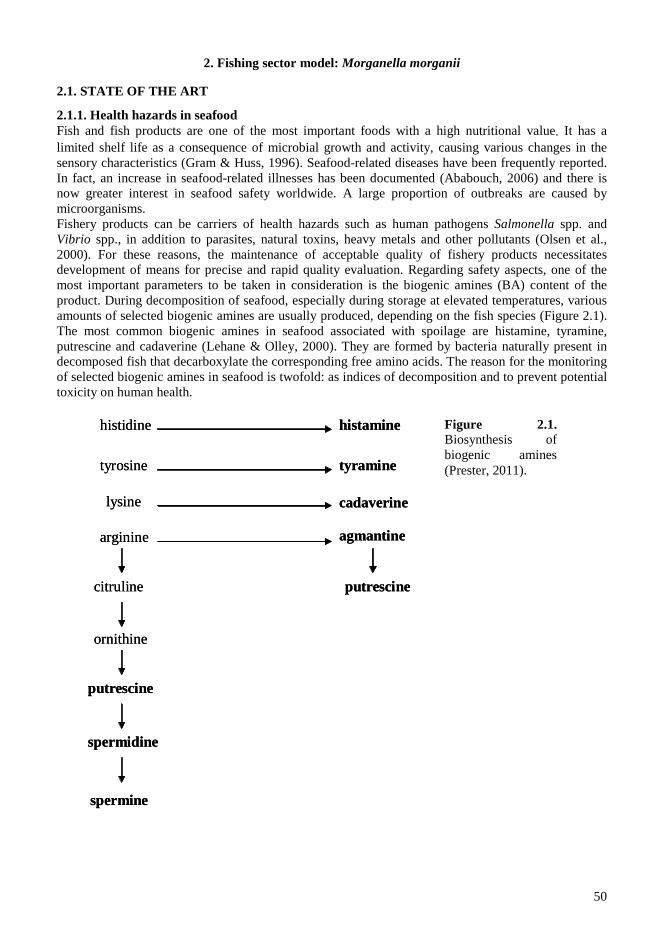
2. Fishing sector model: Morganella morganii
50
2.1. STATE OF THE ART
2.1.1. Health hazards in seafood Fish and fish products are one of the most important foods with a high nutritional value. It has a limited shelf life as a consequence of microbial growth and activity, causing various changes in the sensory characteristics (Gram & Huss, 1996). Seafood-related diseases have been frequently reported. In fact, an increase in seafood-related illnesses has been documented (Ababouch, 2006) and there is now greater interest in seafood safety worldwide. A large proportion of outbreaks are caused by microorganisms. Fishery products can be carriers of health hazards such as human pathogens Salmonella spp. and Vibrio spp., in addition to parasites, natural toxins, heavy metals and other pollutants (Olsen et al., 2000). For these reasons, the maintenance of acceptable quality of fishery products necessitates development of means for precise and rapid quality evaluation. Regarding safety aspects, one of the most important parameters to be taken in consideration is the biogenic amines (BA) content of the product. During decomposition of seafood, especially during storage at elevated temperatures, various amounts of selected biogenic amines are usually produced, depending on the fish species (Figure 2.1). The most common biogenic amines in seafood associated with spoilage are histamine, tyramine, putrescine and cadaverine (Lehane & Olley, 2000). They are formed by bacteria naturally present in decomposed fish that decarboxylate the corresponding free amino acids. The reason for the monitoring of selected biogenic amines in seafood is twofold: as indices of decomposition and to prevent potential toxicity on human health.
Figure 2.1. Biosynthesis of biogenic amines (Prester, 2011).
histidine
tyrosine tyramine
lysine
arginine
cadaverine
agmantine
citruline
ornithine
spermidine
putrescine
spermine
putrescine
histaminehistidine
tyrosine tyramine
lysine
arginine
cadaverine
agmantine
citruline
ornithine
spermidine
putrescine
spermine
putrescine
histamine
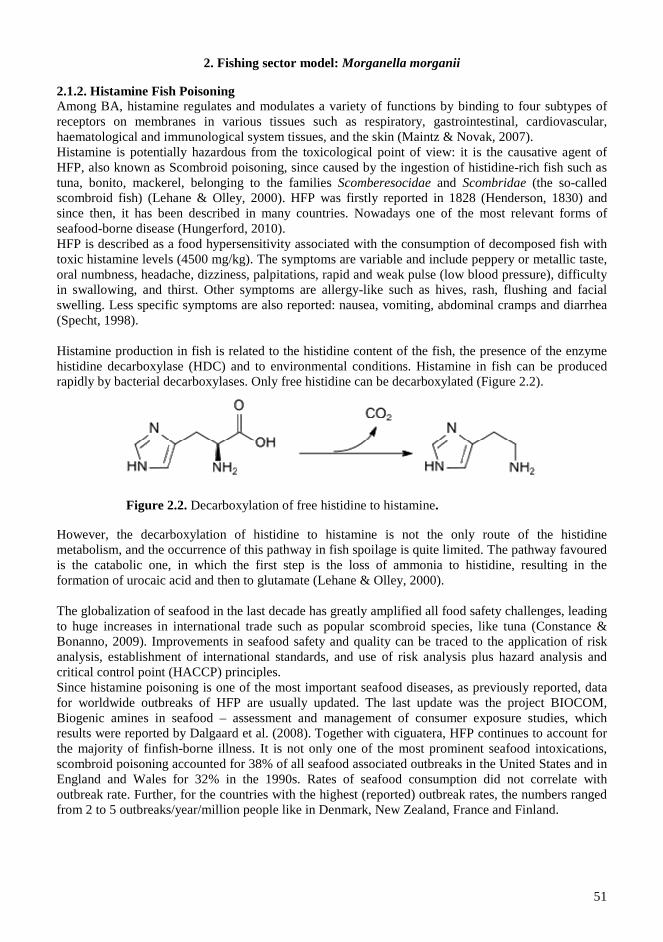
2. Fishing sector model: Morganella morganii
51
2.1.2. Histamine Fish Poisoning Among BA, histamine regulates and modulates a variety of functions by binding to four subtypes of receptors on membranes in various tissues such as respiratory, gastrointestinal, cardiovascular, haematological and immunological system tissues, and the skin (Maintz & Novak, 2007). Histamine is potentially hazardous from the toxicological point of view: it is the causative agent of HFP, also known as Scombroid poisoning, since caused by the ingestion of histidine-rich fish such as tuna, bonito, mackerel, belonging to the families Scomberesocidae and Scombridae (the so-called scombroid fish) (Lehane & Olley, 2000). HFP was firstly reported in 1828 (Henderson, 1830) and since then, it has been described in many countries. Nowadays one of the most relevant forms of seafood-borne disease (Hungerford, 2010). HFP is described as a food hypersensitivity associated with the consumption of decomposed fish with toxic histamine levels (4500 mg/kg). The symptoms are variable and include peppery or metallic taste, oral numbness, headache, dizziness, palpitations, rapid and weak pulse (low blood pressure), difficulty in swallowing, and thirst. Other symptoms are allergy-like such as hives, rash, flushing and facial swelling. Less specific symptoms are also reported: nausea, vomiting, abdominal cramps and diarrhea (Specht, 1998). Histamine production in fish is related to the histidine content of the fish, the presence of the enzyme histidine decarboxylase (HDC) and to environmental conditions. Histamine in fish can be produced rapidly by bacterial decarboxylases. Only free histidine can be decarboxylated (Figure 2.2). However, the decarboxylation of histidine to histamine is not the only route of the histidine metabolism, and the occurrence of this pathway in fish spoilage is quite limited. The pathway favoured is the catabolic one, in which the first step is the loss of ammonia to histidine, resulting in the formation of urocaic acid and then to glutamate (Lehane & Olley, 2000). The globalization of seafood in the last decade has greatly amplified all food safety challenges, leading to huge increases in international trade such as popular scombroid species, like tuna (Constance & Bonanno, 2009). Improvements in seafood safety and quality can be traced to the application of risk analysis, establishment of international standards, and use of risk analysis plus hazard analysis and critical control point (HACCP) principles. Since histamine poisoning is one of the most important seafood diseases, as previously reported, data for worldwide outbreaks of HFP are usually updated. The last update was the project BIOCOM, Biogenic amines in seafood – assessment and management of consumer exposure studies, which results were reported by Dalgaard et al. (2008). Together with ciguatera, HFP continues to account for the majority of finfish-borne illness. It is not only one of the most prominent seafood intoxications, scombroid poisoning accounted for 38% of all seafood associated outbreaks in the United States and in England and Wales for 32% in the 1990s. Rates of seafood consumption did not correlate with outbreak rate. Further, for the countries with the highest (reported) outbreak rates, the numbers ranged from 2 to 5 outbreaks/year/million people like in Denmark, New Zealand, France and Finland.
Figure 2.2. Decarboxylation of free histidine to histamine.
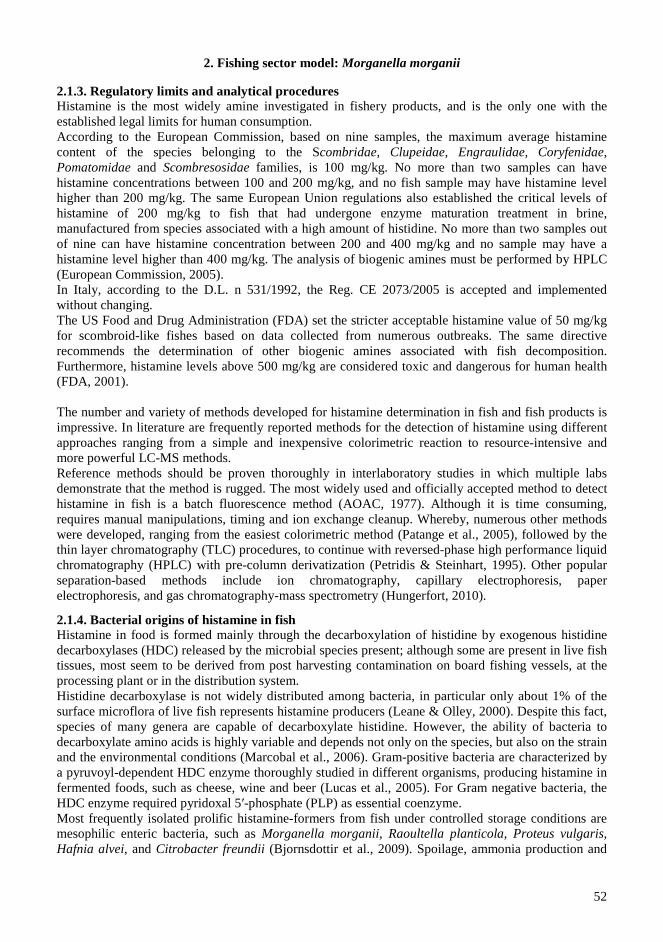
2. Fishing sector model: Morganella morganii
52
2.1.3. Regulatory limits and analytical procedures Histamine is the most widely amine investigated in fishery products, and is the only one with the established legal limits for human consumption. According to the European Commission, based on nine samples, the maximum average histamine content of the species belonging to the Scombridae, Clupeidae, Engraulidae, Coryfenidae, Pomatomidae and Scombresosidae families, is 100 mg/kg. No more than two samples can have histamine concentrations between 100 and 200 mg/kg, and no fish sample may have histamine level higher than 200 mg/kg. The same European Union regulations also established the critical levels of histamine of 200 mg/kg to fish that had undergone enzyme maturation treatment in brine, manufactured from species associated with a high amount of histidine. No more than two samples out of nine can have histamine concentration between 200 and 400 mg/kg and no sample may have a histamine level higher than 400 mg/kg. The analysis of biogenic amines must be performed by HPLC (European Commission, 2005). In Italy, according to the D.L. n 531/1992, the Reg. CE 2073/2005 is accepted and implemented without changing. The US Food and Drug Administration (FDA) set the stricter acceptable histamine value of 50 mg/kg for scombroid-like fishes based on data collected from numerous outbreaks. The same directive recommends the determination of other biogenic amines associated with fish decomposition. Furthermore, histamine levels above 500 mg/kg are considered toxic and dangerous for human health (FDA, 2001). The number and variety of methods developed for histamine determination in fish and fish products is impressive. In literature are frequently reported methods for the detection of histamine using different approaches ranging from a simple and inexpensive colorimetric reaction to resource-intensive and more powerful LC-MS methods. Reference methods should be proven thoroughly in interlaboratory studies in which multiple labs demonstrate that the method is rugged. The most widely used and officially accepted method to detect histamine in fish is a batch fluorescence method (AOAC, 1977). Although it is time consuming, requires manual manipulations, timing and ion exchange cleanup. Whereby, numerous other methods were developed, ranging from the easiest colorimetric method (Patange et al., 2005), followed by the thin layer chromatography (TLC) procedures, to continue with reversed-phase high performance liquid chromatography (HPLC) with pre-column derivatization (Petridis & Steinhart, 1995). Other popular separation-based methods include ion chromatography, capillary electrophoresis, paper electrophoresis, and gas chromatography-mass spectrometry (Hungerfort, 2010).
2.1.4. Bacterial origins of histamine in fish Histamine in food is formed mainly through the decarboxylation of histidine by exogenous histidine decarboxylases (HDC) released by the microbial species present; although some are present in live fish tissues, most seem to be derived from post harvesting contamination on board fishing vessels, at the processing plant or in the distribution system. Histidine decarboxylase is not widely distributed among bacteria, in particular only about 1% of the surface microflora of live fish represents histamine producers (Leane & Olley, 2000). Despite this fact, species of many genera are capable of decarboxylate histidine. However, the ability of bacteria to decarboxylate amino acids is highly variable and depends not only on the species, but also on the strain and the environmental conditions (Marcobal et al., 2006). Gram-positive bacteria are characterized by a pyruvoyl-dependent HDC enzyme thoroughly studied in different organisms, producing histamine in fermented foods, such as cheese, wine and beer (Lucas et al., 2005). For Gram negative bacteria, the HDC enzyme required pyridoxal 5′-phosphate (PLP) as essential coenzyme. Most frequently isolated prolific histamine-formers from fish under controlled storage conditions are mesophilic enteric bacteria, such as Morganella morganii, Raoultella planticola, Proteus vulgaris, Hafnia alvei, and Citrobacter freundii (Bjornsdottir et al., 2009). Spoilage, ammonia production and
2. Fishing sector model: Morganella morganii
53
BA production by these bacteria are enhanced at elevated storage temperatures. However, once a large bacterial population has been established, residual enzyme activity continues slowly at refrigeration temperatures, although bacterial growth ceases (Lehane & Olley 2000). Once formed, histamine is resistant to commonly used food preservation methods, including freezing and cooking (Prester, 2011). For these reasons, the quantification of histamine in foods is a crucial task, as well as the detection of spoiling bacteria able to produce amines in order to establish the potential risk of histamine generation. For the identification of histamine producing bacteria, many different analytical procedures have been developed. Commonly used traditional methods for the detection of spoiling bacteria, based on differential growth media and enzymatic pathways (Tao et al., 2009) are often tedious and unreliable. Molecular methods detecting the gene responsible for production of HDC are becoming more widely accepted as an alternative to traditional culture methods (Takahashi et al., 2003; Bjornsdottir-Butler et al., 2011). PCR techniques are fast, reliable and can be successfully used for the routine detection of bacterial strains potentially producers of BA.
2.1.5. Morganella morganii as a model of histamine producing bacteria Several enteric bacteria, such as Morganella morganii, Raoultella planticola, Enterobacter aerogenes, Photobacterium phosphoreum and P. damselae subsp. damselae are reported to be dominant histamine-producing bacteria in fish (Kanki et al., 2007). Among these species, M. morganii is considered the most prolific histamine former, and the main responsible of histamine accumulation during storage of fish belonging to the family of Scombridae (tuna, mackerel) (Bjornsdottir et al., 2009). The genus Morganella comprises two species, M. morganii and M. psychrotolerans. The first one includes two subspecies (M. morganii subsp. morganii and M. morganii subsp. sibonii), which can be distinguished from one another on the basis of trehalose fermentation (Jensen et al., 1992). M. morganii is often found in the intestines of humans and animals. It is also associated to urinary tract infections (O’Hara et al., 2000). It grows between 4° and 45 °C and has the ability to produce toxic concentrations of histamine in seafood (Janda & Abbott, 2005). The hdc gene coding for the M. morganii HDC was expressed in E. coli (Vaaler & Snell, 1989). The enzyme contains 378 amino acids, and the active sites present were reported below: the lysine that binds pyridoxal phosphate (PLP) is the residue 233 and the conserved region Ser – Gly – His – Lys were residues 230 – 233.
MTLSINDQNKLDAFWAYCVKNQYFNIGYPESADFDYTNLERFLRFSINNCGDWGEYCNYL 60
LNSFDFEKEVMEYFADLFKIPFEQSWGYVTNGGTEGNMFGCYLGREIFPDGTLYYSKDTH 120
YSVAKIVKLLRIKSQVVESQPNGEIDYDDLMKKIADDKEAHPIIFANIGTTVRGAIDDIA 180
EIQKRLKAAGIKREDYYLHADAALSGMILPFVDDAQPFTFADGIDSIGVSGHKMIGSPIP 240
CGIVVAKKENVDRISVEIDYISAHDKTITGSRNGHTPLMLWEAIRSHSTEEWKRRITRSL 300
DMAQYAVDRMQKAGINAWRNKNSITVVFPCPSERVWREHCLATSGDVAHLITTAHHLDTV 360
QIDKLIDDVIADFNLHAA 378
Figure 2.3. Amino acid sequenze of the HDC of M. morganii. Conserved residues Ser – Gly – His – Lys were underlined; residue 233 that binds pyridoxal phosphate (PLP) is in bold.
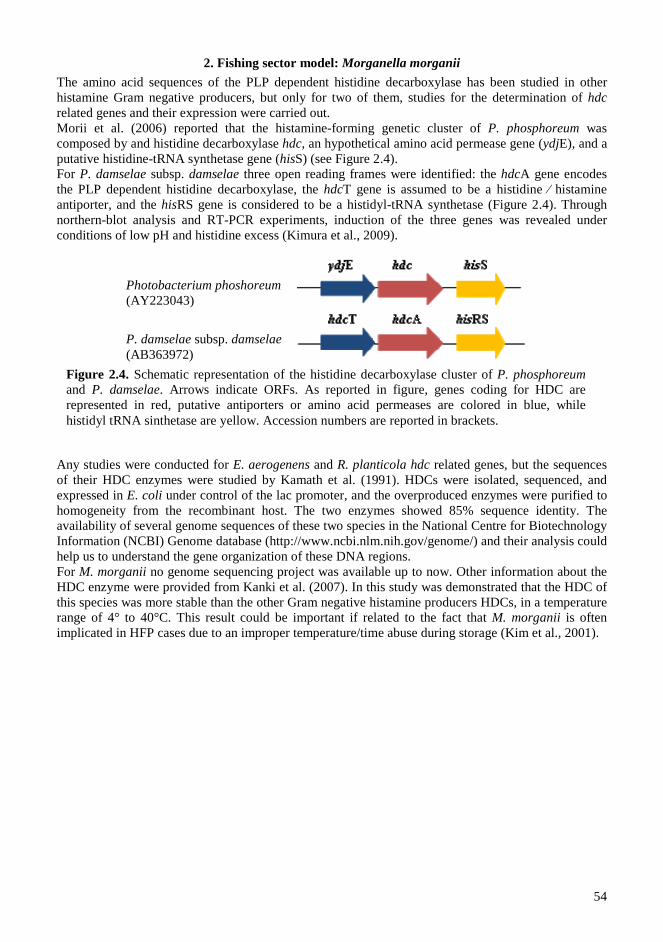
2. Fishing sector model: Morganella morganii
54
The amino acid sequences of the PLP dependent histidine decarboxylase has been studied in other histamine Gram negative producers, but only for two of them, studies for the determination of hdc related genes and their expression were carried out. Morii et al. (2006) reported that the histamine-forming genetic cluster of P. phosphoreum was composed by and histidine decarboxylase hdc, an hypothetical amino acid permease gene (ydjE), and a putative histidine-tRNA synthetase gene (hisS) (see Figure 2.4). For P. damselae subsp. damselae three open reading frames were identified: the hdcA gene encodes the PLP dependent histidine decarboxylase, the hdcT gene is assumed to be a histidine ⁄ histamine antiporter, and the hisRS gene is considered to be a histidyl-tRNA synthetase (Figure 2.4). Through northern-blot analysis and RT-PCR experiments, induction of the three genes was revealed under conditions of low pH and histidine excess (Kimura et al., 2009). Any studies were conducted for E. aerogenens and R. planticola hdc related genes, but the sequences of their HDC enzymes were studied by Kamath et al. (1991). HDCs were isolated, sequenced, and expressed in E. coli under control of the lac promoter, and the overproduced enzymes were purified to homogeneity from the recombinant host. The two enzymes showed 85% sequence identity. The availability of several genome sequences of these two species in the National Centre for Biotechnology Information (NCBI) Genome database (http://www.ncbi.nlm.nih.gov/genome/) and their analysis could help us to understand the gene organization of these DNA regions. For M. morganii no genome sequencing project was available up to now. Other information about the HDC enzyme were provided from Kanki et al. (2007). In this study was demonstrated that the HDC of this species was more stable than the other Gram negative histamine producers HDCs, in a temperature range of 4° to 40°C. This result could be important if related to the fact that M. morganii is often implicated in HFP cases due to an improper temperature/time abuse during storage (Kim et al., 2001).
Figure 2.4. Schematic representation of the histidine decarboxylase cluster of P. phosphoreum and P. damselae. Arrows indicate ORFs. As reported in figure, genes coding for HDC are represented in red, putative antiporters or amino acid permeases are colored in blue, while histidyl tRNA sinthetase are yellow. Accession numbers are reported in brackets.
Photobacterium phoshoreum (AY223043)
P. damselae subsp. damselae (AB363972)
2. Fishing sector model: Morganella morganii
55
2.2. AIM OF THE STUDY The aims of the present study were several: to study and monitoring the development of microbial spoilage associations in tuna fish, to evaluate the diffusion of Morganella morganii and to develop a methodological polyphasic approach suitable for the obtainment of a quality and safety indicator, specific at strain- and/or metabolite- level. These objectives were developed through different steps reported below. - Evaluation of quality of filleted tuna fish, through the study of the relationship among bacteriological
quality, histamine content and occurrence of histamine-forming bacteria; - development of a specific molecular tool for the quantification of M. morganii, suitable for both
classic and real time PCR; - functional expression in E. coli of M. morganii DSM30164T histidine decarboxylase; - sequencing of the hdc gene cluster and comparison with other Gram negative histamine producing
bacteria; - transcriptional analysis of the identified genes of M. morganii simulating different environmental
conditions; - molecular typing of strains coming from fish products, in comparison with clinical isolates of M.
morganii. These experiments were applied to understand the effect of different ecological sources in the species variability.
2. Fishing sector model: Morganella morganii
56
2.3. MATERIALS AND METHODS
2.3.1. Bacterial strains, plasmids and growth conditions Nineteen M. morganii strains, including 13 isolated from filleted tuna fish samples and six clinical isolated (kindly provided from Professor Rossolini of Laboratory of Physiology and Biotechnology of Microorganisms, Department of Biotechnology, University of Siena), were studied in comparison with the type strain of the species M. morganii DSM30164T (purchased from the Deutsche Sammlung von Mikroorganismen und Zellkulturen GmbH). In addition, 32 relevant strains belonging to species other than M. morganii were also analyzed, as negative controls for M. morganii specific amplification (Table 2.1). Gram negative strains were grown in Tryptic Soy Broth/agar (TSB/TSA) plates; coccoid and spore-forming bacteria were grown in Nutrient Broth/agar plates; lactic acid bacteria were grown in MRS broth/agar plates or M17 broth/agar plates. Strains were incubated at 30°C for 24 h. All media and reagents were purchased from Difco (Difco Laboratories, Detroit, USA). Escherichia coli DH5αF’[F’/endA1 hsdR17(rk-mk+) supE44 thi-1 recA1 gyrA(- Na1r) relA1 ∆(lacIZYA-argF)U169 deoR (Φ80dlac∆(lacZ)M15); Promega, Madrid, Spain] was used for all DNA manipulations. E. coli BL21 (DE3) pLysS (Promega) competent cells, were used for expression in pURI3 vector. E. coli strains were grown in LB medium at 37 °C by shacking at 200 rpm. When required ampicillin was added to the medium at 100 µg/mL. For the sequencing of the flanking regions of the hdc gene, a DNA library was build, using the vector pUC19 (Takara Bio Inc., Shiga, Japan). For the protein expression we used plasmid pURI3 that encodes expression of a leader sequence consisting of a N-terminal methionine followed by three spacer amino acids, a six histidine affinity tag, a spacer glycine residue, and the five amino acid enterokinase (EK) recognition size, under control of the T7 RNA polymerase φ promoter, which can be induced at high levels of isopropyl-β-D-thiogalactopyranoside (IPTG) (Curiel et al., 2011). All these strains were conserved at -80°C in glycerol stock 15 %. Plasmids were conserved at -20°C.
2.3.2. Fish sampling Different filleted yellowfin tuna fish (Thunnus albacares) were purchased from wholesale fish market (WM) and different local supermarkets (SM) in Milan, Italy. The study was conducted between April and June 2010, visiting the markets during their usual working hours (WM, 4 to 6 a.m.; SM, 7 to 10 a.m.). For each SM tested, two filleted tuna sampled at different times, were analyzed, while for WM samples, two different sellers were considered (Table 2.3). All fillets acquired, were immediately transported to the laboratory in refrigerated bags and processed within 1 h. Each tuna fillet was aseptically cut into three parts (about 30 g) removed from adjacent areas to ensure uniformity in initial values of histamine content and microbial population. Samples were placed in sterile bags. The first piece was immediately used for histamine determination and microbiological tests. The second, has been preserved to 6-8 ° C for 1 day to simulate storage in a home refrigerator. The third piece was temperature-abused for 3 h at 25 °C and then stored at 6-8 °C for 1 day, to mimic the house-supermarket journey of a common consumer. At the end of these steps, microbiological changes during storage were determined.
2.3.3. Microbiological examinations and isolation of bacteria Tuna pieces were homogenized with ten volumes of sterile saline solution (SS; 0.9% NaCl) in a laboratory blender (Stomacher 400, Seward, London, UK). The homogenates were serially diluted with sterile SS and 1 mL aliquots were inoculated into aerobic Plate Count Agar (PCA; Difco). Plates were incubated at 25 °C for 72 h, to recover both psychrotrophic and mesophilic bacteria, and then colonies were counted. Enterobacteriaceae were enumerated on violet red bile glucose agar (VRBG, Sigma-Aldrich, GmbH, Steinheim, Germany) incubated for 24 h at 37 °C. All red colonies with a diameter ≥ 0.5 mm were considered as Enterobacteriaceae. For all performed experiments, bacterial numbers were expressed as CFU/g of tuna piece. The experiments were carried out in triplicate. Selection of colonies for further studies was restricted to Enterobacteriaceae that, as reported before, includes species known as histamine producing bacteria in fish products. Randomly selected colonies were
2. Fishing sector model: Morganella morganii
57
picked from VRBG, pure-cultured and characterized by cell morphology, motility, Gram staining, catalase and oxidase production (Oxidase identification sticks, Oxoid, Milan, Italy), glucose fermentation, production of gas from glucose, indole and acetoin production (Voges-Proskauer). These standard tests were performed as described by Barrow & Feltham (1999). The ability of the selected bacteria to produce histamine was measured in tuna fish infusion (TFI) supplemented with 1% glucose, at pH 5.7, as reported by Taylor et al. (1979). The isolates were pre-incubated in TSB (Difco) containing 1 mg/mL of histidine (Sigma) at pH 6.8 and incubated for 16 h. Then, 2 mL of culture were inoculated into 50 mL TFI broth and incubated at 25 °C under aeration. Aliquots of 1 mL of the culture broth were analised at different incubation times for histamine quantification, as described below.
2.3.4. Chemical analyses The histamine content was quantified by HPLC, as described by Gosetti et al. (2007). For the quantification of the biogenic amine directly in tuna samples, pieces of 10 g were homogenized in 50 mL of methanol (100%), incubated at 60 °C for 20 min and filtered. The filtrate was subjected to the derivatization reaction in tubes: 0.5 mL of the obtained solutions were mixed with 5 mL of 21 g/L NaHCO3, 1 mL of 5.4 g/L dansyl chloride and acetone up to 10.5 mL. Hermetically sealed tubes were kept at 60 °C for 20 min and then refrigerated to 25 °C before analysis. Histamine production by bacterial isolates was measured using 0.5 mL aliquots of TSI culture supernatants, obtained as described above; these aliquots were subjected to derivatization as previously reported. Each sample was analyzed in duplicate. The chromatographic system consisted of a Hitachi L-7400 HPLC instrument with UV-VIS detector (Hitachi, Tokyo, Japan). The stationary phase was a Purospher Star RP-18 LichroCART HPLC-Cartridge (5 µm, 250 x 4.6 mm) (Merck, Darmstadt, Germany). The mobile phase contained methanol 65% and water 35%, with a flow rate of 0.7 mL/min. Derivatives were detected spectrophotometrically at 254 nm. The concentration of histamine was calculated by interpolation in the corresponding linear calibration curve (amine peak area/amine concentration) between 0.05 and 1.00 mg/mL.
2.3.5. DNA extraction and amplification DNA was extracted using a phenol-chloroform extraction procedure (Ferrario et al., 2012a). For each strain, DNA was extracted from 100 µL of an overnight broth culture in TSB. For tuna samples, pieces of 1 g were homogenized in 2 mL of TSB, and different aliquots were analysed at different times: 100 µL of homogenate was immediately subjected to DNA extraction (t=0). The remaining homogenate was incubated at 30 °C. After 8 and 16 h of incubation aliquots of 100 µL were taken for DNA extraction (t=8 and t=16). The concentration and purity of the DNAs were determined with a UV-Vis spectrophotometer (SmartSpecTM Plus, Biorad, Milan, Italy). PCR reactions were conducted in 25 µL mixtures: 100 ng of template DNA were added with 2.5 µL 10 X reaction buffer, 200 µM of each dNTP, 0.5 µM of primer forward and reverse, and 0.5 U Dream Taq DNA polymerase (Fermentas, Vilnius, Lithuania). Amplifications were carried out in a PCR-Mastercycler 96 (Eppendorf, Hamburg, Germany), with an initial denaturation of 94 °C for 4 min, followed by 35 cycles of 94 °C for 1 min, selected annealing temperature (Ta) for 1 min, and 72 °C for 1 min. All reactions ends with a final extension of 72 °C for 7 min. Primers sequences, annealing temperature used and applications were reported in Table 2.2. Different amplification protocols were reported where necessary. All amplification products were separated in 1.5% (w/v) agars gel in 1 x TAE buffer (7 g/L Tris-acetate, 0.3 g/L EDTA, pH 8.0). Gene-Ruler DNA ladder mix (Fermentas) was used as a size marker.
2. Fishing sector model: Morganella morganii
58
2.3.6. hdc and M. morganii detection and 16S rDNA sequencing analysis For amplification of the bacterial 16S/23S rRNA internal transcribed spacer (ITS) region, primer set G1 and L1 (Jensen et al., 1993) was used. The hdc gene was amplified using primers designed by Takahashi et al. (2003), using the primer set hdc-fw and hdc-rv. For specific M. morganii detection, the 16S rDNA-targeted primers Mm208F and Mm1017R (Kim et al., 2003) were used. In this last case amplification cycles were 30. To identify representative isolate from tuna samples and for DNA sequence analysis a 500 bp region of the 16S rRNA gene was sequenced. Amplification was performed as previously reported (Fortina et al., 2003), using the primer 16SFw and 16SRv. Briefly, the cycle applied is as follow: 2 min at 94 °C, then 5 cycles of 45 s at 94 °C, 45 s at 50 °C, 1 min at 72 °C, and then 30 cycles of 45 s at 94 °C, 45 s at 55 °C, 1 min at 72°C. Nucleo Spin Extract II (Macherey-Nagel GmbH, Düren, Germany) was used to purify PCR products that were sequenced using the dideoxy chain-termination principle (Sanger et al., 1977), employing ABI Prism Big Dye Terminator Kit (Applied Biosystems, Foster City, CA). The reaction products were analyzed with the ABI PrismTM310 DNA Sequencer. The database searches were performed by using the Basic Local Alignment Tool (BLAST) programs (Altschul et al., 1997) from the National Center for Biotechnology Information website (http://www.ncbi.nlm.nih.gov/). Multiple-sequence alignments were constructed by using ClustalW software (Thompson et al., 1994). All primer sequences were reported in Table 2.1.
2.3.7. Primer design and PCR assay for Morganella morganii detection and quantification The 16S rRNA gene sequences obtained for M. morganii strains DSM30164T and MMlx were compared with those obtained from Genbank database for other M. morganii strains (Accession numbers DQ358146, DQ885260, DQ358145, DQ358144, DQ358131, AB089244) and other closely related enteric bacteria (Providencia stuartii NR024848, Raoutella planticola GU329705, Proteus vulgaris EU373433, P. mirabilis GQ205673, Yersinia enterocolitica HM007567, Serratia fonticola NR025339, S. marcescens AB571066, Hafnia alvei AY572428, Erwinia carotovora GU936989, Citrobacter braaki NR028687, C. freundii FN997609, Enterobacter aerogenes GQ337696, E. cloacae HM030748, Pantoea agglomerans HM130697, Escherichia coli HM486679, Salmonella enterica HM099659). Primers Mm453F and Mm631R were designed on the basis of variable regions observed from the alignment and were synthesized by PRIMM (Milan, Italy). The specificity of the primer set was determined using BLAST and testing a total of 32 different Gram positive and negative bacteria (Table 2.2). PCR was performed as reported above, with 30 cycles and an annealing temperature of 65°C.
2.3.8. Quantitative PCR assay Quantitative PCR was performed by using the SYBR Green chemistry in a CFX96 Real-Time PCR thermocycler (Biorad). The primer set Mm453F and Mm631R described above was used to develop the real-time assay. The qPCR reaction mixture was prepared in 15 µL: 7.5 µL of 2x SsoFast™ EvaGreen® Supermix (Biorad), 0.36 µL of each primer (0.3 µmol/L) and 5 µL of DNA. The reaction conditions were initial denaturation step at 95°C for 3 min, followed by 35 cycles of denaturation at 95°C for 30 s, and annealing at 65°C for 30 s. A positive control composed by DNA extracted from a pure culture of M. morganii DSM30164T and a negative control as sterile, PCR-grade DNA-free water (Sigma-Aldrich), were used in each run. The identity of the PCR product was confirmed by performing a melting curve analysis comparing its melting temperature (Tm) with Tm of the product from the positive control. The Tm peaks of the products were calculated based on initial fluorescence curves by plotting negative derivative of fluorescence over temperature, versus temperature. The PCR product was also verified by sequence analysis of the obtained amplicons.
2. Fishing sector model: Morganella morganii
59
2.3.9. Sensitivity studies with pure cultures DNA extracted from an overnight M. morganii DSM30164T culture grown in TSB (9 x 10⁷ CFU/mL) was decimally diluted from 563 ng to 0.056 pg/10 µL in a sterile Tris-EDTA buffer (TE), pH 8.0 and stored at -20 °C until further use. DNA was also prepared from a 10 fold dilution series of M. morganii cells in a concentration range of 9 to 9 x 10⁶ CFU/mL. The number of CFU for each dilution was obtained by the standard plate count method using TSA plates. Standard curves were constructed plotting CFU versus threshold cycle (CT) produced for the target gene. The correlation coefficient (R2) and the efficiency of the amplification were calculated. All experiments were done in duplicate series and repeated three times to evaluate the repeatability of the real-time PCR assay. Results were obtained using the Biorad CFT Manager™ software (Biorad).
2.3.10. Detection studies with seeded and naturally contaminated fish samples Portions of a filleted tuna fish sample (5 g), confirmed M. morganii free by conventional PCR methods was used for the seeding experiments. The sample was blended with 5 mLof buffered peptone water (Difco) in a blender for 2 min. After homogenization, each mixture obtained was seeded with 500 µL of 101 to 106 CFU/mL of M. morganii grown overnight in TSB. One uninoculated portion of fish sample was used as a negative control. For naturally contaminated tuna fillets, samples were purchased from super markets in the Lombardy region. 10 g of each sample were aseptically cut, mixed with 10 mLof buffered peptone water and homogenized as above. Five mLof the homogenate samples of seeded and naturally contaminated tuna were subjected to DNA extraction qPCR. The CT obtained from seeded samples were used to determine the standard curve. CT obtained from naturally contaminated samples, were used to calculate the CFU/mL present in each tuna fillets. Amplicons were confirmed by agarose gel electrophoresis and by sequence analyses.
2.3.11. DNA manipulation and library To sequence the flanking regions of the hdc gene of M. morganii DSM30164T, a plasmid library from E. coli DH5α was constructed. 10 µg of both the M. morganii DNA and the vector pUC19 were digested with different restriction enzymes and incubated at the optimal condition for the enzyme activity as described by suppliers: HindIII, PstI, XbaI, SacI, EcoRI (Roche, Madrid, Spain), BbuI (Promega), SalI, SmaI (Takara), BamHI (BioLabs, Madrid, Spain). After 4 h of incubation, all the reactions were inactivated at 80 °C for 20 min. Digested DNA fragments and vector were incubated with T4 DNA ligase (USB) at room temperature for 16 h, inactivated at 70 °C and conserved at 4 °C. Ligation mixes were used for PCR amplifications. PCR was performed using AmpliTaq Gold DNA polymerase (Roche) in 50 µL, amplification reaction mixture by using an initial denaturation step at 95 °C for 10 s, followed by 30 cycles of 95 °C for 1 min, 60 °C for 1 min, 72 °C for 2 min, followed by a final elongation step at 72 °C for 10 min. All the amplifications were done by using a primer annealing into the plasmid and a primer located at the end of the known region to determine the nucleotide sequence surrounding hdc known region. Resulted bands were visualized in agarose gel and cut with bisturi. After purification using the Quiakit gel extraction kit (Quiagen, Madrid, Spain), DNA was resuspended in 30 µL of TE, and sequenced. Multiple sequence alignment and calculation of the phylogenetic relationships were performed as reported in 2.3.6 section.
2.3.12. Heterologous expression of hdc in E. coli To clone into the pURI3 expression vectors, the histidine decarboxylase gene from M. morganii was amplified by PrimeSTAR HS DNA polymerase (Takara) DNA polymerase using the oligonucleotides 1046 and 1047 reported in Table 2.1. The amplification was made as described before, with an annealing step at 50 °C for 1 min. After amplification, the 1.2 kb PCR products were gel-purified and inserted into pURI3 vectors by using the enzyme restriction- and ligation-free cloning strategy described previously for pURI3 vectors (Curiel et al., 2011). Briefly, the purified PCR products were used as homologous primer pair in a PCR
2. Fishing sector model: Morganella morganii
60
reaction using the corresponding expression vectors as template. The product of this PCR was digested with DpnI, that exclusively restrict methylated DNA and, later, with NotI, an enzyme that only cuts the original copies of pURI vectors. E. coli DH5α cells were transformed directly with the digestion product. The pURI3 expression plasmid carrying the M. morganii hdc gene (pURI3hdc) was sequenced to verify the presence of the gene. The plasmid was then transferred, for protein production, to the host E. coli BL21 (DE3).
2.3.13. Protein production, purification and activity E. coli strain BL21 (DE3) carrying pURI3hdc was grown at 37 °C in LB medium containing 100 µg/mL ampicillin. To evaluate the best condition for the HDC protein production, cells were inducted by adding IPTG (0.4 mM final concentration) when the culture reached 0.5 OD600nm. After this, the culture was incubated at different temperatures (16, 22, 37 °C) for different times (4, 16 h). Cells were harvested by centrifugation (7000 rpm for 15 min at 4 °C), washed with 50 mM phosphate buffer (PB, pH 6.5) and mechanically disrupted by three French Press passages (1000 psi). The insoluble fraction was separated by centrifugation (12000 rpm, 30 min, 4 °C), and the supernatant was quantified using the Bio-Rad protein assay (Biorad). The proteins extracts were then run on SDS gel to check the cleavage, at the different condition tested. For protein purification E. coli BL21 pURI3hdc was incubated at the best production condition. Culture was harvested, resuspended with 50 mM phosphate buffer, NaCl 300 mM (PBS, pH 6.5) and disrupted. The soluble fraction, was applied to a Talon Superflow metal affinity column (Clontech, Torrejon de Ardoz, Spain), equilibrated with PBS. The bound enzyme was eluted by applying a continuous gradient of imidazole concentration, from 10 mM to 150 mM. Fractions containing the eluted HDC were pooled and the protein was then dialyzed against PBS (pH 7.0). Samples were run on SDS gel. The assay to determine HDC activity was performed in PB, in presence of 5 µM histidine and 400 µM PLP. The reaction was incubated at 37 °C for 10 min and 1 h. Afterward, the histamine formed was derivatized and detected by TLC as described by García-Moruno et al. (2005).
2.3.14. RNA isolation Different growth parameters were chosen to simulate several environmental conditions, for the evaluation of the gene expression of M. morganii: nutrients concentration (medium LB or Tx), temperature (37 or 15°C), pH (7.0 or 4.5) and presence or absence of 5 mM histidine (LBH or TxH). LB broth was used as the basic environmental condition to which the gene expression in all other conditions was compared. Aliquots (500 µL) of overnight M. morganii cultures in LB were inoculated into 50 mL of selected medium and conditions, in a shaker set at 200 rpm, until the cultures reached 0.3 OD600nm. Cells were centrifuged at 4°C for 10 min, at 6500 rpm, washed with PBS (pH 7.4), and resuspended in 20 mL of the medium buffered at the chosen conditions, for 3 h. Cells from these cultures were harvested by centrifugation and washed with PBS. Total RNA was isolated using the NucleoSpin RNA II (Macherey-Nagel GmbH) according to manufacturer’s protocol. Once mRNA concentration and purity were optically determined measuring the adsorbance at 260 and 280 nm with a UV-Vis spectrophotometer, mRNA integrity was verified by visualization of the two bands (16S and 23S RNA) by gel electrophoresis. RNA was finally treated with DNase1, Rnase-Free kit (Fermentas) at 37°C for 1h, and after addition of EDTA 50 mM to stop the reaction, was incubated at 65°C for 10 min. RNA was stored at -80°C and subsequently used for cDNA synthesis.
2.3.15. RT-PCR experiments DNase-treated RNA was subjected to reverse transcription into cDNA with RevertAid First strand cDNA Synthesis Kit (Fermentas) in accordance with manufacturer’s instructions. In order to quantitatively measure the expression of the M. morganii genes, amplification of an endogenous control gene was performed simultaneously, and the relative expression level between genes, and the endogenous control gene was assessed. The quantity of 16S rRNA in each sample was used for the
2. Fishing sector model: Morganella morganii
61
endogenous control, assuming that the expression of 16S rRNA is constant for all cells used in this analysis. Specific primer pairs were designed on the nucleotide sequence of the DNA region detected around the hdc gene of M. morganii and reported in Table 2.1. Amplifications were performed in triplicate in a final volume of 15 µL, using 2 µL of appropriate dilution of cDNA template, 0.3 µmol/L each of the corresponding primers, and 7.5 µL of the SsoFast_ EvaGreen_Supermix (Bio-Rad). The reaction conditions were the following: initial denaturation step at 95 °C for 3 min, followed by 40 cycles of denaturation at 95 °C for 30 s and annealing at 60 °C for 30 s. The identity of the PCR product was confirmed by performing a melting curve analysis. As a control, PCR of DNase-treated RNA was performed with the same primers to check for any DNA contamination. Results were analysed using the Bio-Rad CFT Manager_software (Bio-Rad) for relative quantification.
2.3.16. Genomic fingerprinting of M. morganii strains M. morganii strains isolated from different ecological niches were typed by combined analysis of repetitive element (REP) typing using primers (GTG)5 and BOXA1R (Versalovic et al., 1994; De Urraza et al., 2000) and random amplification of polymorphic DNA-PCR (RAPD) typing with primer M13 (Rossetti & Giraffa, 2005). Annealing temperatures of 42°, 48° and 38 °C were used respectively for (GTG)5, BOXA1R and M13. The PCR products were analyzed by electrophoresis and photographed as reported above. The value for the reproducibility of the assay, evaluated by analysis of repeated DNA extracts of representative strains was greater than 93%. Banding pattern similarity was evaluated by construction of dendrograms using the NTSYSpc software, version 2.11 (Applied Biostatics Inc., NY, USA), employing the Jaccard similarity coefficient. A dendrogram was deduced from a similarity matrix by using the unweighted pair group method with arithmetic average (UPGMA) clustering algorithm. The faithfulness of the cluster analysis was estimated by calculating the cophenetic correlation value for each dendrogram.
2.3.17. Statistical analysis All microbial counts were converted to log CFU per g of sample before analysis. Significant differences (P<0.05) among means were determined with a long-way analysis of variance. Relationship between microbial count and histamine level was then assessed using Pearson correlation matrices. A Pearson coefficient (r) from 0 to 0.3 was considered a weak correlation, moderate if it was included between 0.3 and 0.7, strong if r > 0.7.
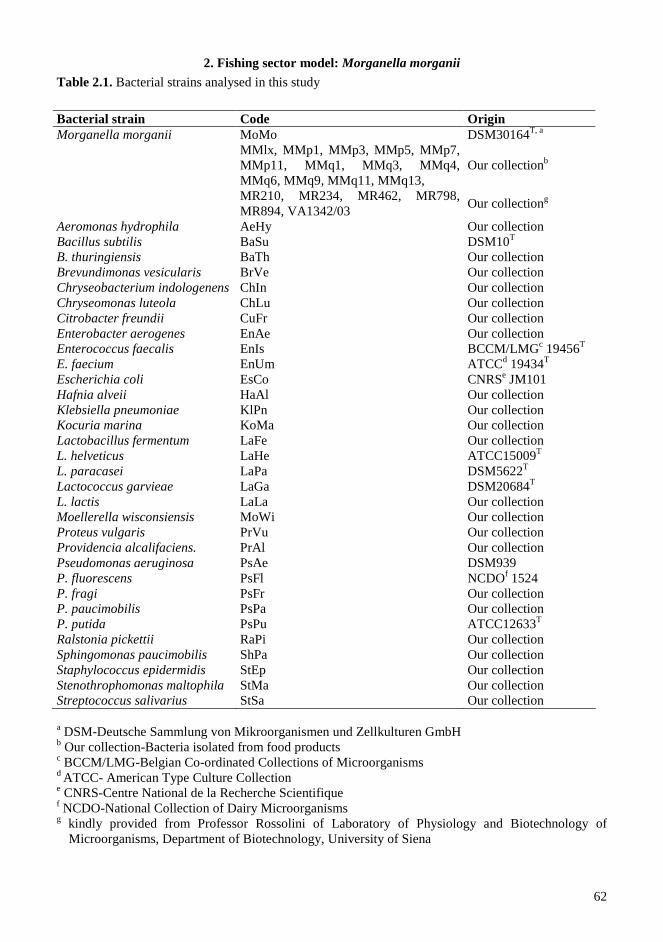
2. Fishing sector model: Morganella morganii
62
Table 2.1. Bacterial strains analysed in this study
a DSM-Deutsche Sammlung von Mikroorganismen und Zellkulturen GmbH b Our collection-Bacteria isolated from food products c BCCM/LMG-Belgian Co-ordinated Collections of Microorganisms d ATCC- American Type Culture Collection e CNRS-Centre National de la Recherche Scientifique f NCDO-National Collection of Dairy Microorganisms g kindly provided from Professor Rossolini of Laboratory of Physiology and Biotechnology of
Microorganisms, Department of Biotechnology, University of Siena
Bacterial strain Code Origin Morganella morganii MoMo DSM30164T, a
MMlx, MMp1, MMp3, MMp5, MMp7, MMp11, MMq1, MMq3, MMq4, MMq6, MMq9, MMq11, MMq13,
Our collectionb
MR210, MR234, MR462, MR798, MR894, VA1342/03
Our collectiong
Aeromonas hydrophila AeHy Our collection
Bacillus subtilis BaSu DSM10T B. thuringiensis BaTh Our collection
Brevundimonas vesicularis BrVe Our collection
Chryseobacterium indologenens ChIn Our collection
Chryseomonas luteola ChLu Our collection Citrobacter freundii CuFr Our collection Enterobacter aerogenes EnAe Our collection Enterococcus faecalis EnIs BCCM/LMGc 19456T E. faecium EnUm ATCCd 19434T Escherichia coli EsCo CNRSe JM101 Hafnia alveii HaAl Our collection Klebsiella pneumoniae KlPn Our collection Kocuria marina KoMa Our collection Lactobacillus fermentum LaFe Our collection L. helveticus LaHe ATCC15009T L. paracasei LaPa DSM5622T Lactococcus garvieae LaGa DSM20684T L. lactis LaLa Our collection Moellerella wisconsiensis MoWi Our collection Proteus vulgaris PrVu Our collection Providencia alcalifaciens. PrAl Our collection Pseudomonas aeruginosa PsAe DSM939 P. fluorescens PsFl NCDOf 1524
P. fragi PsFr Our collection P. paucimobilis PsPa Our collection P. putida PsPu ATCC12633T Ralstonia pickettii RaPi Our collection Sphingomonas paucimobilis ShPa Our collection Staphylococcus epidermidis StEp Our collection Stenothrophomonas maltophila StMa Our collection Streptococcus salivarius StSa Our collection
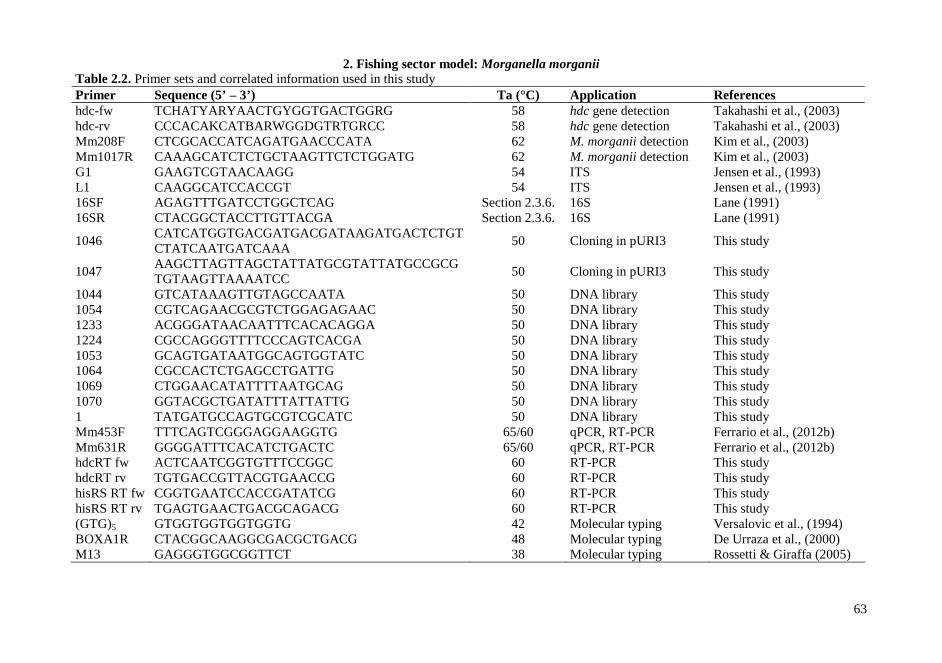
2. Fishing sector model: Morganella morganii
63
Table 2.2. Primer sets and correlated information used in this study Primer Sequence (5’ – 3’) Ta (°C) Application References hdc-fw TCHATYARYAACTGYGGTGACTGGRG 58 hdc gene detection Takahashi et al., (2003) hdc-rv CCCACAKCATBARWGGDGTRTGRCC 58 hdc gene detection Takahashi et al., (2003) Mm208F CTCGCACCATCAGATGAACCCATA 62 M. morganii detection Kim et al., (2003) Mm1017R CAAAGCATCTCTGCTAAGTTCTCTGGATG 62 M. morganii detection Kim et al., (2003) G1 GAAGTCGTAACAAGG 54 ITS Jensen et al., (1993) L1 CAAGGCATCCACCGT 54 ITS Jensen et al., (1993) 16SF AGAGTTTGATCCTGGCTCAG Section 2.3.6. 16S Lane (1991) 16SR CTACGGCTACCTTGTTACGA Section 2.3.6. 16S Lane (1991)
1046 CATCATGGTGACGATGACGATAAGATGACTCTGTCTATCAATGATCAAA
50 Cloning in pURI3 This study
1047 AAGCTTAGTTAGCTATTATGCGTATTATGCCGCGTGTAAGTTAAAATCC
50 Cloning in pURI3 This study
1044 GTCATAAAGTTGTAGCCAATA 50 DNA library This study 1054 CGTCAGAACGCGTCTGGAGAGAAC 50 DNA library This study 1233 ACGGGATAACAATTTCACACAGGA 50 DNA library This study 1224 CGCCAGGGTTTTCCCAGTCACGA 50 DNA library This study 1053 GCAGTGATAATGGCAGTGGTATC 50 DNA library This study 1064 CGCCACTCTGAGCCTGATTG 50 DNA library This study 1069 CTGGAACATATTTTAATGCAG 50 DNA library This study 1070 GGTACGCTGATATTTATTATTG 50 DNA library This study 1 TATGATGCCAGTGCGTCGCATC 50 DNA library This study Mm453F TTTCAGTCGGGAGGAAGGTG 65/60 qPCR, RT-PCR Ferrario et al., (2012b) Mm631R GGGGATTTCACATCTGACTC 65/60 qPCR, RT-PCR Ferrario et al., (2012b) hdcRT fw ACTCAATCGGTGTTTCCGGC 60 RT-PCR This study hdcRT rv TGTGACCGTTACGTGAACCG 60 RT-PCR This study hisRS RT fw CGGTGAATCCACCGATATCG 60 RT-PCR This study hisRS RT rv TGAGTGAACTGACGCAGACG 60 RT-PCR This study (GTG)5 GTGGTGGTGGTGGTG 42 Molecular typing Versalovic et al., (1994) BOXA1R CTACGGCAAGGCGACGCTGACG 48 Molecular typing De Urraza et al., (2000) M13 GAGGGTGGCGGTTCT 38 Molecular typing Rossetti & Giraffa (2005)
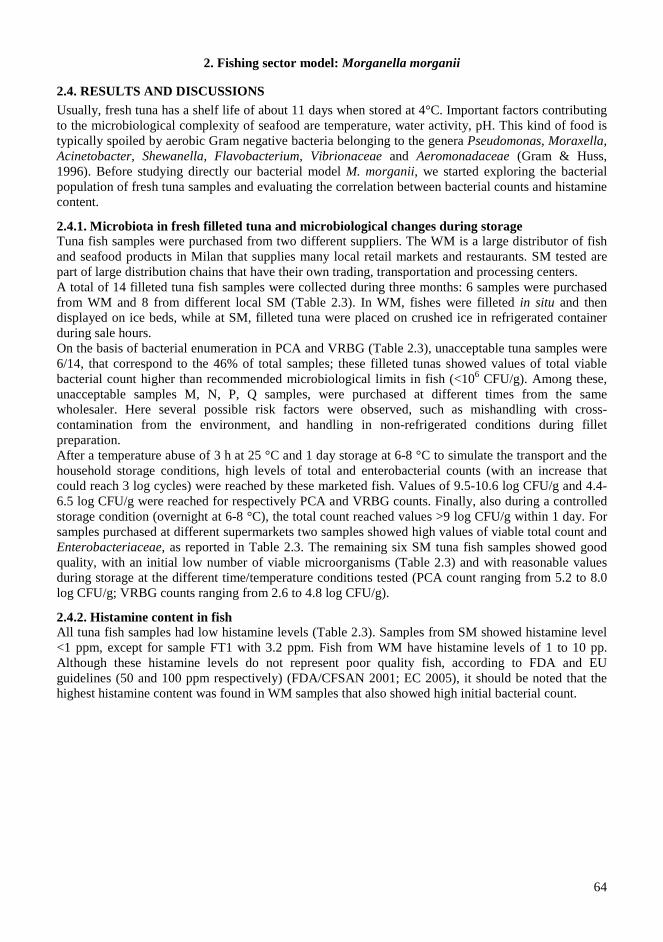
2. Fishing sector model: Morganella morganii
64
2.4. RESULTS AND DISCUSSIONS Usually, fresh tuna has a shelf life of about 11 days when stored at 4°C. Important factors contributing to the microbiological complexity of seafood are temperature, water activity, pH. This kind of food is typically spoiled by aerobic Gram negative bacteria belonging to the genera Pseudomonas, Moraxella, Acinetobacter, Shewanella, Flavobacterium, Vibrionaceae and Aeromonadaceae (Gram & Huss, 1996). Before studying directly our bacterial model M. morganii, we started exploring the bacterial population of fresh tuna samples and evaluating the correlation between bacterial counts and histamine content.
2.4.1. Microbiota in fresh filleted tuna and microbiological changes during storage Tuna fish samples were purchased from two different suppliers. The WM is a large distributor of fish and seafood products in Milan that supplies many local retail markets and restaurants. SM tested are part of large distribution chains that have their own trading, transportation and processing centers. A total of 14 filleted tuna fish samples were collected during three months: 6 samples were purchased from WM and 8 from different local SM (Table 2.3). In WM, fishes were filleted in situ and then displayed on ice beds, while at SM, filleted tuna were placed on crushed ice in refrigerated container during sale hours. On the basis of bacterial enumeration in PCA and VRBG (Table 2.3), unacceptable tuna samples were 6/14, that correspond to the 46% of total samples; these filleted tunas showed values of total viable bacterial count higher than recommended microbiological limits in fish (<106 CFU/g). Among these, unacceptable samples M, N, P, Q samples, were purchased at different times from the same wholesaler. Here several possible risk factors were observed, such as mishandling with cross-contamination from the environment, and handling in non-refrigerated conditions during fillet preparation. After a temperature abuse of 3 h at 25 °C and 1 day storage at 6-8 °C to simulate the transport and the household storage conditions, high levels of total and enterobacterial counts (with an increase that could reach 3 log cycles) were reached by these marketed fish. Values of 9.5-10.6 log CFU/g and 4.4-6.5 log CFU/g were reached for respectively PCA and VRBG counts. Finally, also during a controlled storage condition (overnight at 6-8 °C), the total count reached values >9 log CFU/g within 1 day. For samples purchased at different supermarkets two samples showed high values of viable total count and Enterobacteriaceae, as reported in Table 2.3. The remaining six SM tuna fish samples showed good quality, with an initial low number of viable microorganisms (Table 2.3) and with reasonable values during storage at the different time/temperature conditions tested (PCA count ranging from 5.2 to 8.0 log CFU/g; VRBG counts ranging from 2.6 to 4.8 log CFU/g).
2.4.2. Histamine content in fish All tuna fish samples had low histamine levels (Table 2.3). Samples from SM showed histamine level <1 ppm, except for sample FT1 with 3.2 ppm. Fish from WM have histamine levels of 1 to 10 pp. Although these histamine levels do not represent poor quality fish, according to FDA and EU guidelines (50 and 100 ppm respectively) (FDA/CFSAN 2001; EC 2005), it should be noted that the highest histamine content was found in WM samples that also showed high initial bacterial count.
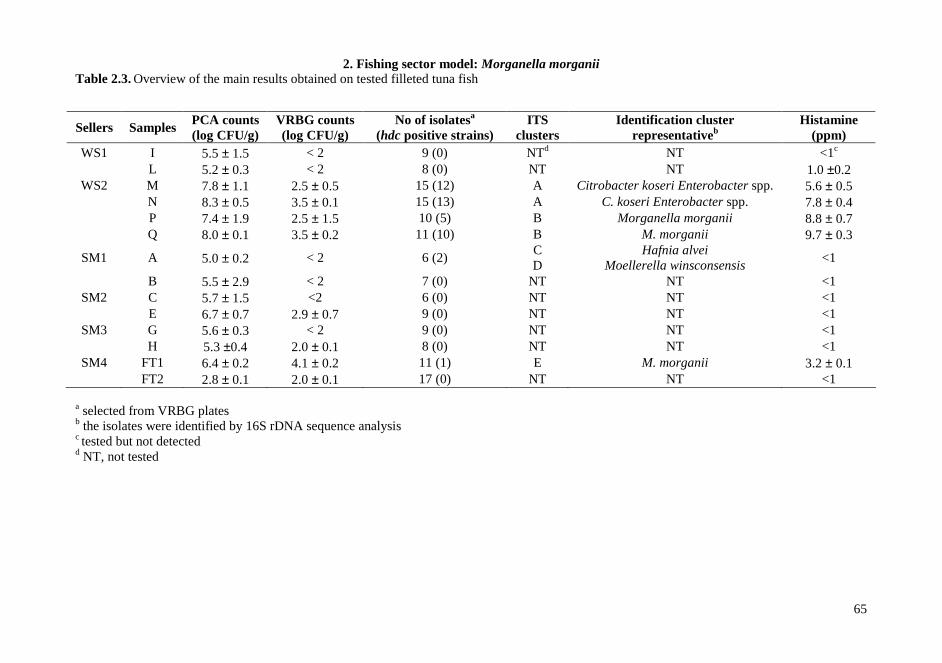
2. Fishing sector model: Morganella morganii
65
Table 2.3. Overview of the main results obtained on tested filleted tuna fish
a selected from VRBG plates
b the isolates were identified by 16S rDNA sequence analysis c tested but not detected d NT, not tested
Sellers Samples PCA counts (log CFU/g)
VRBG counts (log CFU/g)
No of isolatesa
(hdc positive strains) ITS
clusters Identification cluster
representativeb Histamine
(ppm) WS1 I 5.5 ± 1.5 < 2 9 (0) NTd NT <1c
L 5.2 ± 0.3 < 2 8 (0) NT NT 1.0 ±0.2 WS2 M 7.8 ± 1.1 2.5 ± 0.5 15 (12) A Citrobacter koseri Enterobacter spp. 5.6 ± 0.5
N 8.3 ± 0.5 3.5 ± 0.1 15 (13) A C. koseri Enterobacter spp. 7.8 ± 0.4 P 7.4 ± 1.9 2.5 ± 1.5 10 (5) B Morganella morganii 8.8 ± 0.7 Q 8.0 ± 0.1 3.5 ± 0.2 11 (10) B M. morganii 9.7 ± 0.3
SM1 A 5.0 ± 0.2 < 2 6 (2) C D
Hafnia alvei Moellerella winsconsensis
<1
B 5.5 ± 2.9 < 2 7 (0) NT NT <1 SM2 C 5.7 ± 1.5 <2 6 (0) NT NT <1
E 6.7 ± 0.7 2.9 ± 0.7 9 (0) NT NT <1 SM3 G 5.6 ± 0.3 < 2 9 (0) NT NT <1
H 5.3 ±0.4 2.0 ± 0.1 8 (0) NT NT <1 SM4 FT1 6.4 ± 0.2 4.1 ± 0.2 11 (1) E M. morganii 3.2 ± 0.1
FT2 2.8 ± 0.1 2.0 ± 0.1 17 (0) NT NT <1
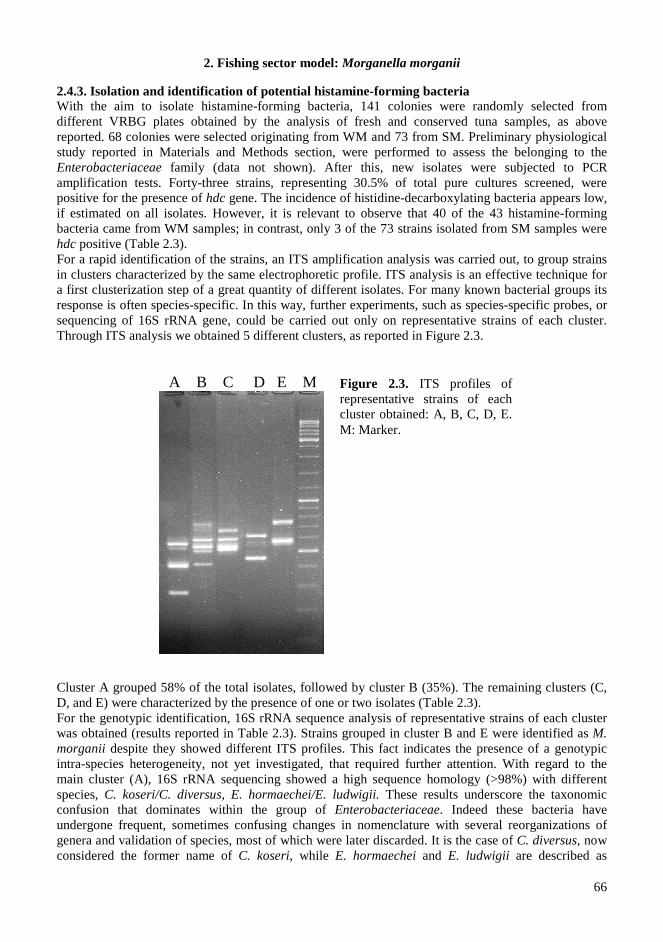
2. Fishing sector model: Morganella morganii
66
2.4.3. Isolation and identification of potential histamine-forming bacteria With the aim to isolate histamine-forming bacteria, 141 colonies were randomly selected from different VRBG plates obtained by the analysis of fresh and conserved tuna samples, as above reported. 68 colonies were selected originating from WM and 73 from SM. Preliminary physiological study reported in Materials and Methods section, were performed to assess the belonging to the Enterobacteriaceae family (data not shown). After this, new isolates were subjected to PCR amplification tests. Forty-three strains, representing 30.5% of total pure cultures screened, were positive for the presence of hdc gene. The incidence of histidine-decarboxylating bacteria appears low, if estimated on all isolates. However, it is relevant to observe that 40 of the 43 histamine-forming bacteria came from WM samples; in contrast, only 3 of the 73 strains isolated from SM samples were hdc positive (Table 2.3). For a rapid identification of the strains, an ITS amplification analysis was carried out, to group strains in clusters characterized by the same electrophoretic profile. ITS analysis is an effective technique for a first clusterization step of a great quantity of different isolates. For many known bacterial groups its response is often species-specific. In this way, further experiments, such as species-specific probes, or sequencing of 16S rRNA gene, could be carried out only on representative strains of each cluster. Through ITS analysis we obtained 5 different clusters, as reported in Figure 2.3.
Cluster A grouped 58% of the total isolates, followed by cluster B (35%). The remaining clusters (C, D, and E) were characterized by the presence of one or two isolates (Table 2.3). For the genotypic identification, 16S rRNA sequence analysis of representative strains of each cluster was obtained (results reported in Table 2.3). Strains grouped in cluster B and E were identified as M. morganii despite they showed different ITS profiles. This fact indicates the presence of a genotypic intra-species heterogeneity, not yet investigated, that required further attention. With regard to the main cluster (A), 16S rRNA sequencing showed a high sequence homology (>98%) with different species, C. koseri/C. diversus, E. hormaechei/E. ludwigii. These results underscore the taxonomic confusion that dominates within the group of Enterobacteriaceae. Indeed these bacteria have undergone frequent, sometimes confusing changes in nomenclature with several reorganizations of genera and validation of species, most of which were later discarded. It is the case of C. diversus, now considered the former name of C. koseri, while E. hormaechei and E. ludwigii are described as
Figure 2.3. ITS profiles of representative strains of each cluster obtained: A, B, C, D, E. M: Marker.
A B C D E M
2. Fishing sector model: Morganella morganii
67
different species, even if they are phylogenetically closely related (Hoffmann et al., 2005). This confusion makes it difficult to clearly differentiate particular species, including our applied molecular methods.
2.4.4. Histamine formation by bacterial isolates Prevalent histamine formers detected in the filleted tuna fish were Citrobacter/Enterobacter isolates. They represent the major portion of total hdc positive strains and the dominant population of samples M and N. These species are usually isolated from various species of scombroid fish and are considered weak histamine-formers, with the exception of E. aerogenes (Bjornsdottir et al., 2009). In our experiments, the ability of these strains to produce histamine was variable, producing from 81 to 259 ppm of histamine. The 16 M. morganii strains, representing the main hdc positive species in samples P and Q, produced from 250 to 700 ppm of histamine and could be considered prolific histamine-formers. Despite this, the low histamine accumulation in fresh tuna indicates that these bacteria constituted a minor portion of the bacterial population. However, it is important to observe that if the products are kept for longer time under temperature abuse, fish could represent a potential danger for consumption, due to a rapid accumulation of histamine, following an increase of histamine-forming bacteria.
2.4.5. Fish quality evaluation by PCR A direct extraction of DNA from fish homogenates, followed by PCR amplification of hdc gene did not reveal positive signals in our samples. These results are in agreement with other published results regarding the high detection limit of the PCR assay (about 104 CFU/mL) (Bjornsdottir-Butler et al., 2011). However, after a 16-h enrichment step of the fish homogenates at 30 °C, positive signals were detected in M, N, P and Q samples. The possibility to carry out rapid and specific PCR assays on food matrices represents an interesting tool for a rapid evaluation of safety and quality of foods. In this context, the detection of hdc gene in fish products can be used as indicator.
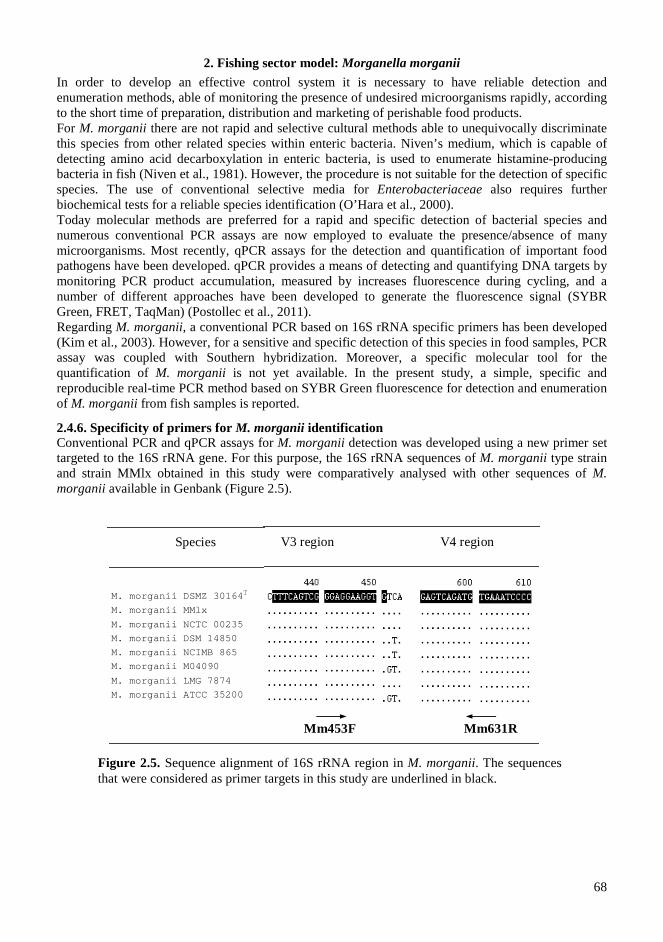
2. Fishing sector model: Morganella morganii
68
In order to develop an effective control system it is necessary to have reliable detection and enumeration methods, able of monitoring the presence of undesired microorganisms rapidly, according to the short time of preparation, distribution and marketing of perishable food products. For M. morganii there are not rapid and selective cultural methods able to unequivocally discriminate this species from other related species within enteric bacteria. Niven’s medium, which is capable of detecting amino acid decarboxylation in enteric bacteria, is used to enumerate histamine-producing bacteria in fish (Niven et al., 1981). However, the procedure is not suitable for the detection of specific species. The use of conventional selective media for Enterobacteriaceae also requires further biochemical tests for a reliable species identification (O’Hara et al., 2000). Today molecular methods are preferred for a rapid and specific detection of bacterial species and numerous conventional PCR assays are now employed to evaluate the presence/absence of many microorganisms. Most recently, qPCR assays for the detection and quantification of important food pathogens have been developed. qPCR provides a means of detecting and quantifying DNA targets by monitoring PCR product accumulation, measured by increases fluorescence during cycling, and a number of different approaches have been developed to generate the fluorescence signal (SYBR Green, FRET, TaqMan) (Postollec et al., 2011). Regarding M. morganii, a conventional PCR based on 16S rRNA specific primers has been developed (Kim et al., 2003). However, for a sensitive and specific detection of this species in food samples, PCR assay was coupled with Southern hybridization. Moreover, a specific molecular tool for the quantification of M. morganii is not yet available. In the present study, a simple, specific and reproducible real-time PCR method based on SYBR Green fluorescence for detection and enumeration of M. morganii from fish samples is reported.
2.4.6. Specificity of primers for M. morganii identification Conventional PCR and qPCR assays for M. morganii detection was developed using a new primer set targeted to the 16S rRNA gene. For this purpose, the 16S rRNA sequences of M. morganii type strain and strain MMlx obtained in this study were comparatively analysed with other sequences of M. morganii available in Genbank (Figure 2.5).
Mm631R Mm453F
V3 region V4 region
Species
M. morganii DSMZ 30164T
M. morganii MMlx
M. morganii NCTC 00235
M. morganii DSM 14850
M. morganii NCIMB 865
M. morganii M04090
M. morganii LMG 7874
M. morganii ATCC 35200
Figure 2.5. Sequence alignment of 16S rRNA region in M. morganii. The sequences that were considered as primer targets in this study are underlined in black.
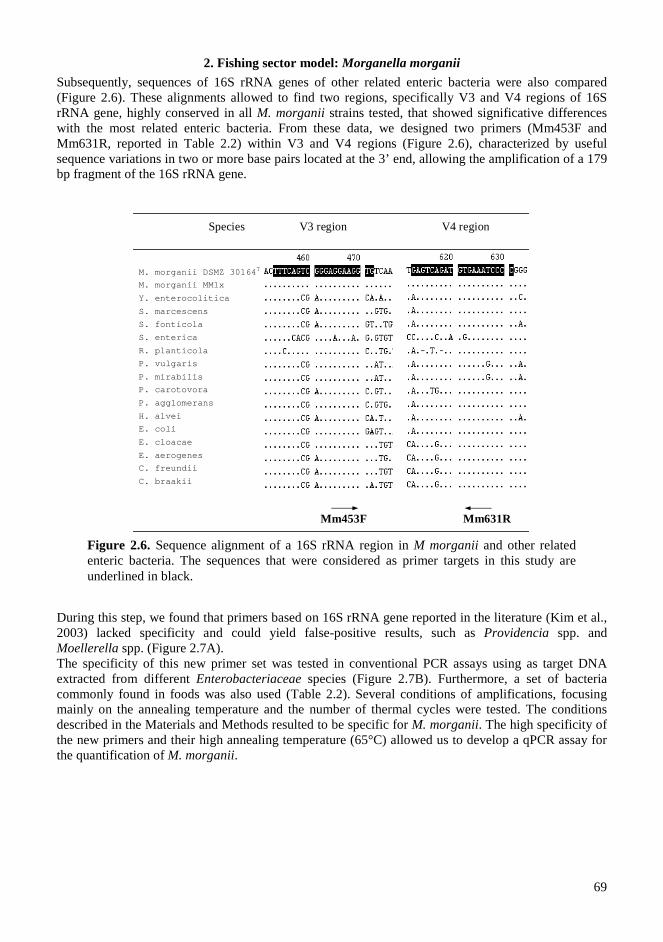
2. Fishing sector model: Morganella morganii
69
Subsequently, sequences of 16S rRNA genes of other related enteric bacteria were also compared (Figure 2.6). These alignments allowed to find two regions, specifically V3 and V4 regions of 16S rRNA gene, highly conserved in all M. morganii strains tested, that showed significative differences with the most related enteric bacteria. From these data, we designed two primers (Mm453F and Mm631R, reported in Table 2.2) within V3 and V4 regions (Figure 2.6), characterized by useful sequence variations in two or more base pairs located at the 3’ end, allowing the amplification of a 179 bp fragment of the 16S rRNA gene.
During this step, we found that primers based on 16S rRNA gene reported in the literature (Kim et al., 2003) lacked specificity and could yield false-positive results, such as Providencia spp. and Moellerella spp. (Figure 2.7A). The specificity of this new primer set was tested in conventional PCR assays using as target DNA extracted from different Enterobacteriaceae species (Figure 2.7B). Furthermore, a set of bacteria commonly found in foods was also used (Table 2.2). Several conditions of amplifications, focusing mainly on the annealing temperature and the number of thermal cycles were tested. The conditions described in the Materials and Methods resulted to be specific for M. morganii. The high specificity of the new primers and their high annealing temperature (65°C) allowed us to develop a qPCR assay for the quantification of M. morganii.
Mm631R Mm453F
V3 region V4 region Species
M. morganii DSMZ 30164T
M. morganii MMlx
Y. enterocolitica
S. marcescens
S. fonticola
S. enterica
R. planticola
P. vulgaris
P. mirabilis
P. carotovora
P. agglomerans
H. alvei
E. coli
E. cloacae
E. aerogenes
C. freundii
C. braakii
Figure 2.6. Sequence alignment of a 16S rRNA region in M morganii and other related enteric bacteria. The sequences that were considered as primer targets in this study are underlined in black.
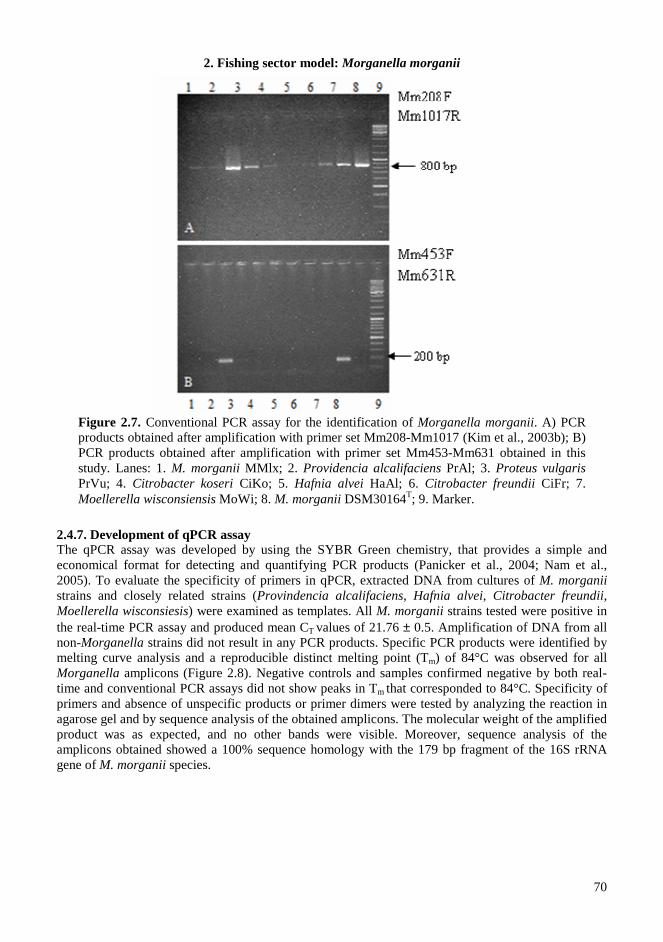
2. Fishing sector model: Morganella morganii
70
2.4.7. Development of qPCR assay The qPCR assay was developed by using the SYBR Green chemistry, that provides a simple and economical format for detecting and quantifying PCR products (Panicker et al., 2004; Nam et al., 2005). To evaluate the specificity of primers in qPCR, extracted DNA from cultures of M. morganii strains and closely related strains (Provindencia alcalifaciens, Hafnia alvei, Citrobacter freundii, Moellerella wisconsiesis) were examined as templates. All M. morganii strains tested were positive in the real-time PCR assay and produced mean CT
values of 21.76 ± 0.5. Amplification of DNA from all non-Morganella strains did not result in any PCR products. Specific PCR products were identified by melting curve analysis and a reproducible distinct melting point (Tm) of 84°C was observed for all Morganella amplicons (Figure 2.8). Negative controls and samples confirmed negative by both real-time and conventional PCR assays did not show peaks in Tm that corresponded to 84°C. Specificity of primers and absence of unspecific products or primer dimers were tested by analyzing the reaction in agarose gel and by sequence analysis of the obtained amplicons. The molecular weight of the amplified product was as expected, and no other bands were visible. Moreover, sequence analysis of the amplicons obtained showed a 100% sequence homology with the 179 bp fragment of the 16S rRNA gene of M. morganii species.
Figure 2.7. Conventional PCR assay for the identification of Morganella morganii. A) PCR products obtained after amplification with primer set Mm208-Mm1017 (Kim et al., 2003b); B) PCR products obtained after amplification with primer set Mm453-Mm631 obtained in this study. Lanes: 1. M. morganii MMlx; 2. Providencia alcalifaciens PrAl; 3. Proteus vulgaris PrVu; 4. Citrobacter koseri CiKo; 5. Hafnia alvei HaAl; 6. Citrobacter freundii CiFr; 7. Moellerella wisconsiensis MoWi; 8. M. morganii DSM30164T; 9. Marker.
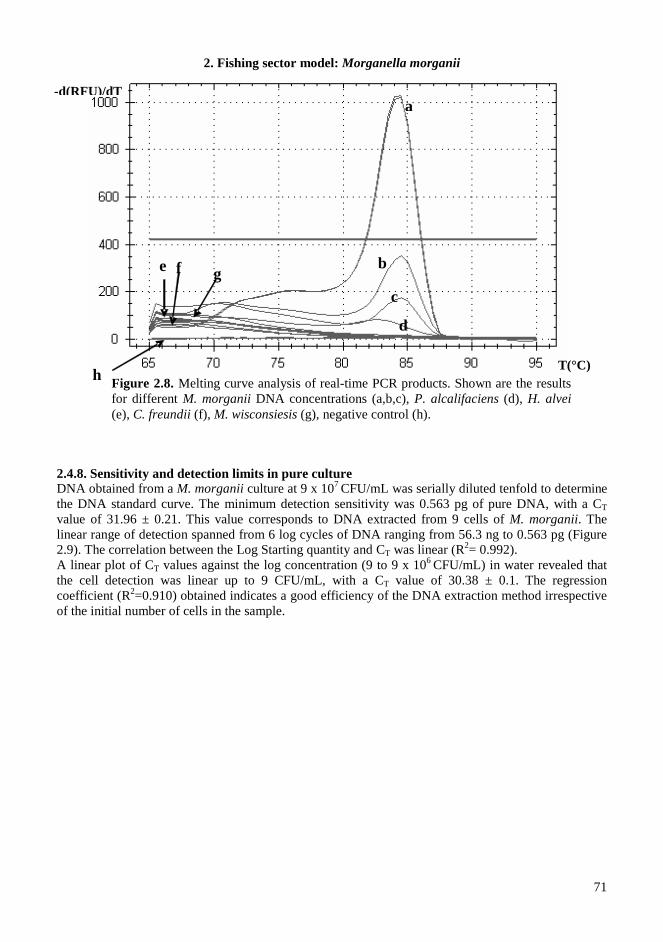
2. Fishing sector model: Morganella morganii
71
2.4.8. Sensitivity and detection limits in pure culture DNA obtained from a M. morganii culture at 9 x 10⁷ CFU/mL was serially diluted tenfold to determine the DNA standard curve. The minimum detection sensitivity was 0.563 pg of pure DNA, with a CT value of 31.96 ± 0.21. This value corresponds to DNA extracted from 9 cells of M. morganii. The linear range of detection spanned from 6 log cycles of DNA ranging from 56.3 ng to 0.563 pg (Figure 2.9). The correlation between the Log Starting quantity and CT was linear (R2= 0.992). A linear plot of CT values against the log concentration (9 to 9 x 10⁶ CFU/mL) in water revealed that the cell detection was linear up to 9 CFU/mL, with a CT value of 30.38 ± 0.1. The regression coefficient (R2=0.910) obtained indicates a good efficiency of the DNA extraction method irrespective of the initial number of cells in the sample.
-d(RFU)/dT
T(°C)
d
c
b
a
h
f g e
Figure 2.8. Melting curve analysis of real-time PCR products. Shown are the results for different M. morganii DNA concentrations (a,b,c), P. alcalifaciens (d), H. alvei (e), C. freundii (f), M. wisconsiesis (g), negative control (h).
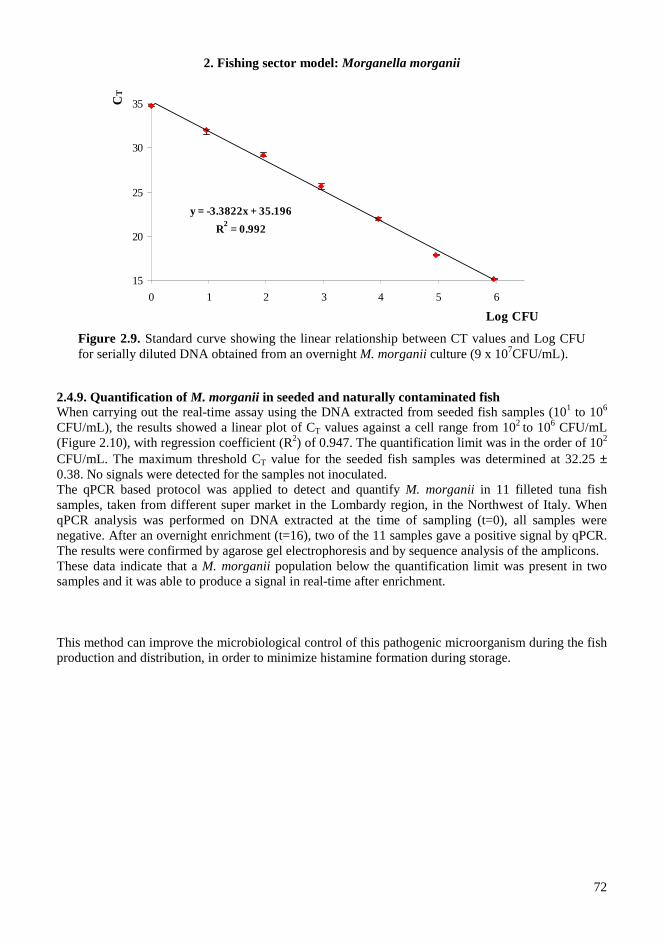
2. Fishing sector model: Morganella morganii
72
2.4.9. Quantification of M. morganii in seeded and naturally contaminated fish When carrying out the real-time assay using the DNA extracted from seeded fish samples (101 to 106 CFU/mL), the results showed a linear plot of CT values against a cell range from 102 to 106 CFU/mL (Figure 2.10), with regression coefficient (R2) of 0.947. The quantification limit was in the order of 102 CFU/mL. The maximum threshold CT value for the seeded fish samples was determined at 32.25 ± 0.38. No signals were detected for the samples not inoculated. The qPCR based protocol was applied to detect and quantify M. morganii in 11 filleted tuna fish samples, taken from different super market in the Lombardy region, in the Northwest of Italy. When qPCR analysis was performed on DNA extracted at the time of sampling (t=0), all samples were negative. After an overnight enrichment (t=16), two of the 11 samples gave a positive signal by qPCR. The results were confirmed by agarose gel electrophoresis and by sequence analysis of the amplicons. These data indicate that a M. morganii population below the quantification limit was present in two samples and it was able to produce a signal in real-time after enrichment. This method can improve the microbiological control of this pathogenic microorganism during the fish production and distribution, in order to minimize histamine formation during storage.
y = -3.3822x + 35.196
R2 = 0.992
15
20
25
30
35
0 1 2 3 4 5 6
Log CFU
CT
Figure 2.9. Standard curve showing the linear relationship between CT values and Log CFU for serially diluted DNA obtained from an overnight M. morganii culture (9 x 10⁷CFU/mL).
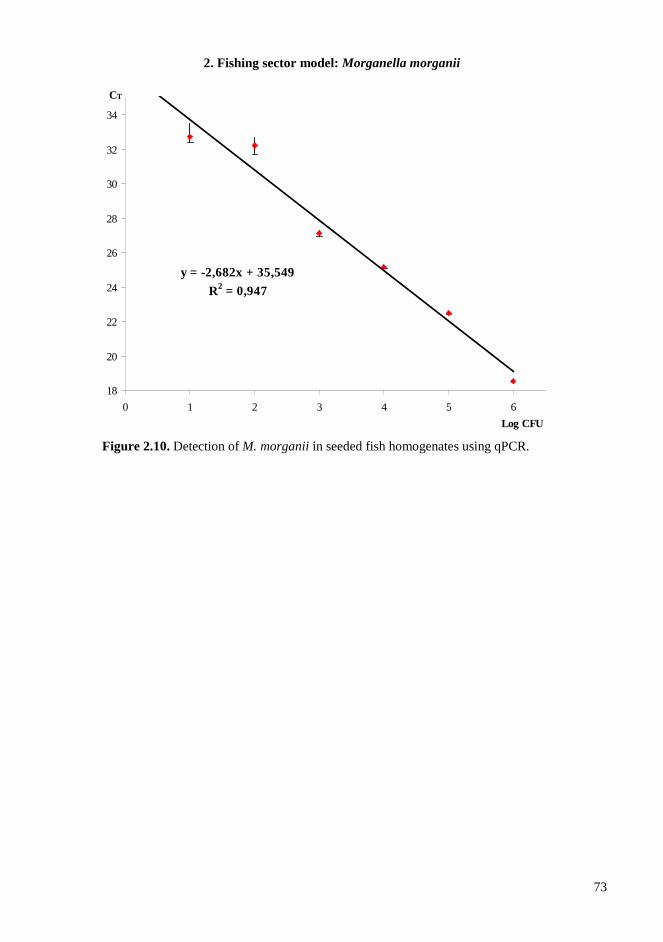
2. Fishing sector model: Morganella morganii
73
y = -2,682x + 35,549
R2 = 0,947
18
20
22
24
26
28
30
32
34
0 1 2 3 4 5 6
Log CFU
CT
Figure 2.10. Detection of M. morganii in seeded fish homogenates using qPCR.
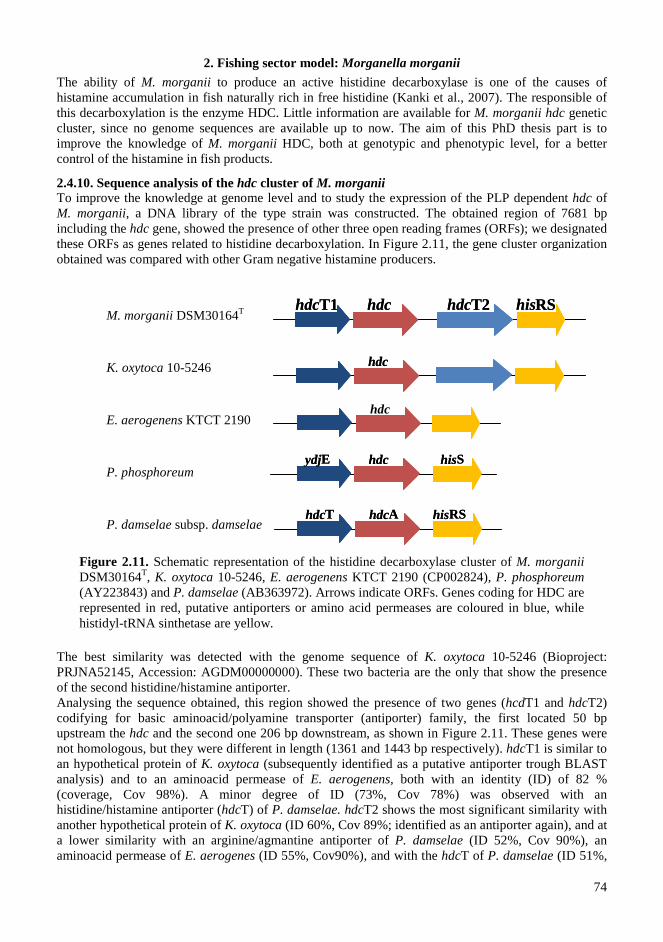
2. Fishing sector model: Morganella morganii
74
The ability of M. morganii to produce an active histidine decarboxylase is one of the causes of histamine accumulation in fish naturally rich in free histidine (Kanki et al., 2007). The responsible of this decarboxylation is the enzyme HDC. Little information are available for M. morganii hdc genetic cluster, since no genome sequences are available up to now. The aim of this PhD thesis part is to improve the knowledge of M. morganii HDC, both at genotypic and phenotypic level, for a better control of the histamine in fish products.
2.4.10. Sequence analysis of the hdc cluster of M. morganii To improve the knowledge at genome level and to study the expression of the PLP dependent hdc of M. morganii, a DNA library of the type strain was constructed. The obtained region of 7681 bp including the hdc gene, showed the presence of other three open reading frames (ORFs); we designated these ORFs as genes related to histidine decarboxylation. In Figure 2.11, the gene cluster organization obtained was compared with other Gram negative histamine producers. The best similarity was detected with the genome sequence of K. oxytoca 10-5246 (Bioproject: PRJNA52145, Accession: AGDM00000000). These two bacteria are the only that show the presence of the second histidine/histamine antiporter. Analysing the sequence obtained, this region showed the presence of two genes (hcdT1 and hdcT2) codifying for basic aminoacid/polyamine transporter (antiporter) family, the first located 50 bp upstream the hdc and the second one 206 bp downstream, as shown in Figure 2.11. These genes were not homologous, but they were different in length (1361 and 1443 bp respectively). hdcT1 is similar to an hypothetical protein of K. oxytoca (subsequently identified as a putative antiporter trough BLAST analysis) and to an aminoacid permease of E. aerogenens, both with an identity (ID) of 82 % (coverage, Cov 98%). A minor degree of ID (73%, Cov 78%) was observed with an histidine/histamine antiporter (hdcT) of P. damselae. hdcT2 shows the most significant similarity with another hypothetical protein of K. oxytoca (ID 60%, Cov 89%; identified as an antiporter again), and at a lower similarity with an arginine/agmantine antiporter of P. damselae (ID 52%, Cov 90%), an aminoacid permease of E. aerogenes (ID 55%, Cov90%), and with the hdcT of P. damselae (ID 51%,
M. morganii DSM30164T
K. oxytoca 10-5246
E. aerogenens KTCT 2190
P. phosphoreum
P. damselae subsp. damselae hdc T hdc A his RS hdc T hdc A his RS
hdc hdc
hdc T1 hdc hdc T2 his RS hdc T1 hdc hdc T2 his RS
hdc
ydj E hdc his S ydj E hdc his S
Figure 2.11. Schematic representation of the histidine decarboxylase cluster of M. morganii DSM30164T, K. oxytoca 10-5246, E. aerogenens KTCT 2190 (CP002824), P. phosphoreum (AY223843) and P. damselae (AB363972). Arrows indicate ORFs. Genes coding for HDC are represented in red, putative antiporters or amino acid permeases are coloured in blue, while histidyl-tRNA sinthetase are yellow.
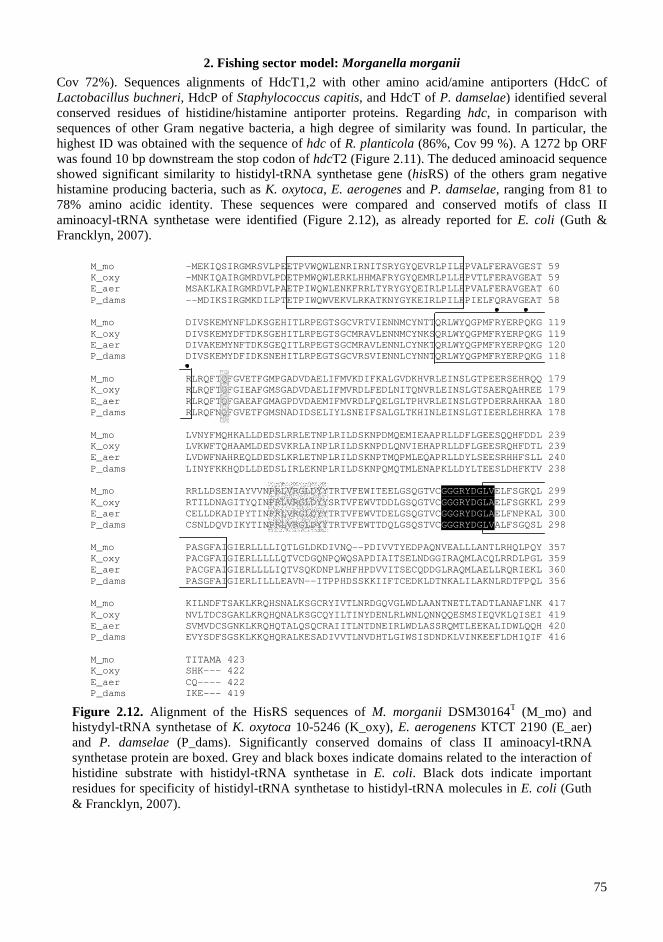
2. Fishing sector model: Morganella morganii
75
Cov 72%). Sequences alignments of HdcT1,2 with other amino acid/amine antiporters (HdcC of Lactobacillus buchneri, HdcP of Staphylococcus capitis, and HdcT of P. damselae) identified several conserved residues of histidine/histamine antiporter proteins. Regarding hdc, in comparison with sequences of other Gram negative bacteria, a high degree of similarity was found. In particular, the highest ID was obtained with the sequence of hdc of R. planticola (86%, Cov 99 %). A 1272 bp ORF was found 10 bp downstream the stop codon of hdcT2 (Figure 2.11). The deduced aminoacid sequence showed significant similarity to histidyl-tRNA synthetase gene (hisRS) of the others gram negative histamine producing bacteria, such as K. oxytoca, E. aerogenes and P. damselae, ranging from 81 to 78% amino acidic identity. These sequences were compared and conserved motifs of class II aminoacyl-tRNA synthetase were identified (Figure 2.12), as already reported for E. coli (Guth & Francklyn, 2007).
M_mo -MEKIQSIRGMRSVLPEETPVWQWLENRIRNITSRYGYQEVRLPILEPVALFERAVGEST 59 K_oxy -MNKIQAIRGMRDVLPDETPMWQWLERKLHHMAFRYGYQEMRLPLLEPVTLFERAVGEAT 59 E_aer MSAKLKAIRGMRDVLPAETPIWQWLENKFRRLTYRYGYQEIRLPLLEPVALFERAVGEAT 60 P_dams --MDIKSIRGMKDILPTETPIWQWVEKVLRKATKNYGYKEIRLPILEPIELFQRAVGEAT 58 M_mo DIVSKEMYNFLDKSGEHITLRPEGTSGCVRTVIENNMCYNTTQRLWYQGPMFRYERPQKG 119 K_oxy DIVSKEMYDFTDKSGEHITLRPEGTSGCMRAVLENNMCYNKSQRLWYQGPMFRYERPQKG 119 E_aer DIVAKEMYNFTDKSGEQITLRPEGTSGCMRAVLENNLCYNKTQRLWYQGPMFRYERPQKG 120 P_dams DIVSKEMYDFIDKSNEHITLRPEGTSGCVRSVIENNLCYNNTQRLWYQGPMFRYERPQKG 118 M_mo RLRQFTQFGVETFGMPGADVDAELIFMVKDIFKALGVDKHVRLEINSLGTPEERSEHRQQ 179 K_oxy RLRQFTQFGIEAFGMSGADVDAELIFMVRDLFEDLNITQNVRLEINSLGTSAERQAHREE 179 E_aer RLRQFTQFGAEAFGMAGPDVDAEMIFMVRDLFQELGLTPHVRLEINSLGTPDERRAHKAA 180 P_dams RLRQFNQFGVETFGMSNADIDSELIYLSNEIFSALGLTKHINLEINSLGTIEERLEHRKA 178 M_mo LVNYFMQHKALLDEDSLRRLETNPLRILDSKNPDMQEMIEAAPRLLDFLGEESQQHFDDL 239 K_oxy LVKWFTQHAAMLDEDSVKRLAINPLRILDSKNPDLQNVIEHAPRLLDFLGEESRQHFDTL 239 E_aer LVDWFNAHREQLDEDSLKRLETNPLRILDSKNPTMQPMLEQAPRLLDYLSEESRHHFSLL 240 P_dams LINYFKKHQDLLDEDSLIRLEKNPLRILDSKNPQMQTMLENAPKLLDYLTEESLDHFKTV 238 M_mo RRLLDSENIAYVVNPRLVRGLDYYTRTVFEWITEELGSQGTVCGGGRYDGLVELFSGKQL 299 K_oxy RTILDNAGITYQINPRLVRGLDYYSRTVFEWVTDDLGSQGTVCGGGRYDGLAELFSGKKL 299 E_aer CELLDKADIPYTINPRLVRGLDYYTRTVFEWVTDELGSQGTVCGGGRYDGLAELFNPKAL 300 P_dams CSNLDQVDIKYTINPRLVRGLDYYTRTVFEWTTDQLGSQSTVCGGGRYDGLVALFSGQSL 298 M_mo PASGFAIGIERLLLLIQTLGLDKDIVNQ--PDIVVTYEDPAQNVEALLLANTLRHQLPQY 357 K_oxy PACGFAIGIERLLLLLQTVCDGQNPQWQSAPDIAITSELNDGGIRAQMLACQLRRDLPGL 359 E_aer PACGFAIGIERLLLLIQTVSQKDNPLWHFHPDVVITSECQDDGLRAQMLAELLRQRIEKL 360 P_dams PASGFAIGIERLILLLEAVN--ITPPHDSSKKIIFTCEDKLDTNKALILAKNLRDTFPQL 356 M_mo KILNDFTSAKLKRQHSNALKSGCRYIVTLNRDGQVGLWDLAANTNETLTADTLANAFLNK 417 K_oxy NVLTDCSGAKLKRQHQNALKSGCQYILTINYDENLRLWNLQNNQQESMSIEQVKLQISEI 419 E_aer SVMVDCSGNKLKRQHQTALQSQCRAIITLNTDNEIRLWDLASSRQMTLEEKALIDWLQQH 420 P_dams EVYSDFSGSKLKKQHQRALKESADIVVTLNVDHTLGIWSISDNDKLVINKEEFLDHIQIF 416 M_mo TITAMA 423 K_oxy SHK--- 422 E_aer CQ---- 422 P_dams IKE--- 419
Figure 2.12. Alignment of the HisRS sequences of M. morganii DSM30164T (M_mo) and histydyl-tRNA synthetase of K. oxytoca 10-5246 (K_oxy), E. aerogenens KTCT 2190 (E_aer) and P. damselae (P_dams). Significantly conserved domains of class II aminoacyl-tRNA synthetase protein are boxed. Grey and black boxes indicate domains related to the interaction of histidine substrate with histidyl-tRNA synthetase in E. coli. Black dots indicate important residues for specificity of histidyl-tRNA synthetase to histidyl-tRNA molecules in E. coli (Guth & Francklyn, 2007).
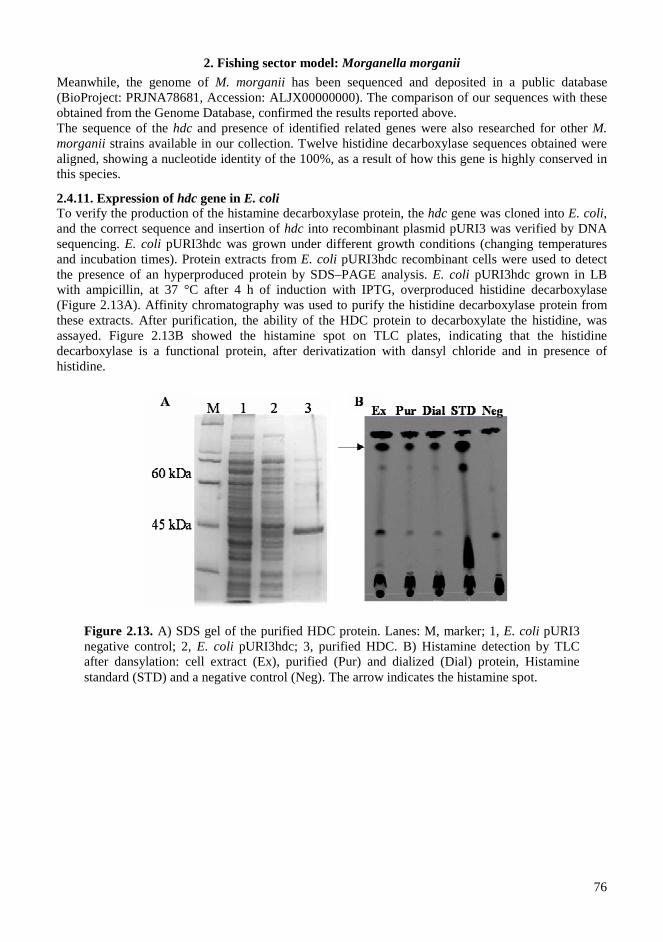
2. Fishing sector model: Morganella morganii
76
Meanwhile, the genome of M. morganii has been sequenced and deposited in a public database (BioProject: PRJNA78681, Accession: ALJX00000000). The comparison of our sequences with these obtained from the Genome Database, confirmed the results reported above. The sequence of the hdc and presence of identified related genes were also researched for other M. morganii strains available in our collection. Twelve histidine decarboxylase sequences obtained were aligned, showing a nucleotide identity of the 100%, as a result of how this gene is highly conserved in this species.
2.4.11. Expression of hdc gene in E. coli To verify the production of the histamine decarboxylase protein, the hdc gene was cloned into E. coli, and the correct sequence and insertion of hdc into recombinant plasmid pURI3 was verified by DNA sequencing. E. coli pURI3hdc was grown under different growth conditions (changing temperatures and incubation times). Protein extracts from E. coli pURI3hdc recombinant cells were used to detect the presence of an hyperproduced protein by SDS–PAGE analysis. E. coli pURI3hdc grown in LB with ampicillin, at 37 °C after 4 h of induction with IPTG, overproduced histidine decarboxylase (Figure 2.13A). Affinity chromatography was used to purify the histidine decarboxylase protein from these extracts. After purification, the ability of the HDC protein to decarboxylate the histidine, was assayed. Figure 2.13B showed the histamine spot on TLC plates, indicating that the histidine decarboxylase is a functional protein, after derivatization with dansyl chloride and in presence of histidine.
Figure 2.13. A) SDS gel of the purified HDC protein. Lanes: M, marker; 1, E. coli pURI3 negative control; 2, E. coli pURI3hdc; 3, purified HDC. B) Histamine detection by TLC after dansylation: cell extract (Ex), purified (Pur) and dialized (Dial) protein, Histamine standard (STD) and a negative control (Neg). The arrow indicates the histamine spot.
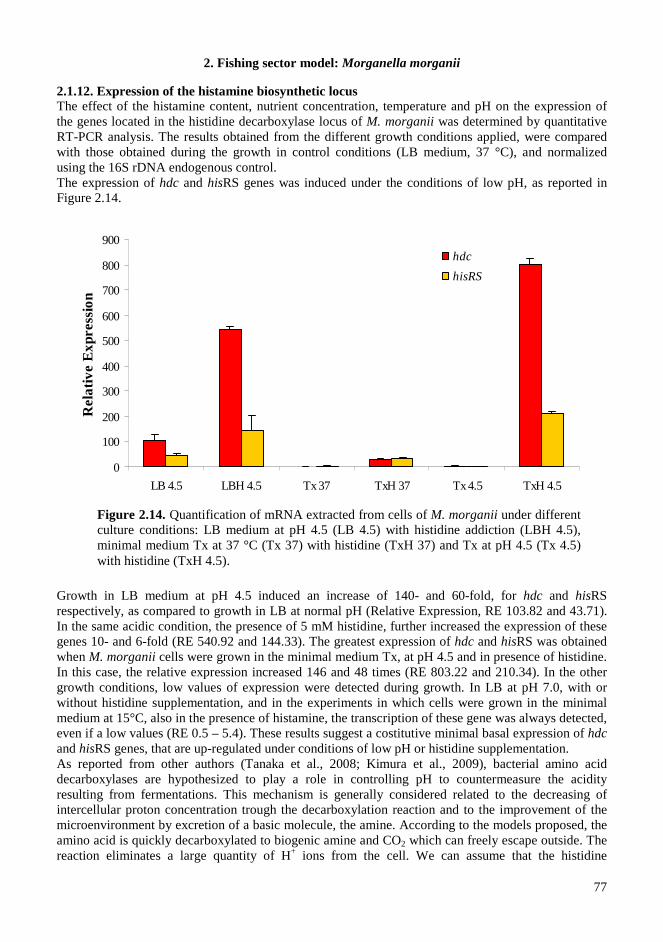
2. Fishing sector model: Morganella morganii
77
2.1.12. Expression of the histamine biosynthetic locus The effect of the histamine content, nutrient concentration, temperature and pH on the expression of the genes located in the histidine decarboxylase locus of M. morganii was determined by quantitative RT-PCR analysis. The results obtained from the different growth conditions applied, were compared with those obtained during the growth in control conditions (LB medium, 37 °C), and normalized using the 16S rDNA endogenous control. The expression of hdc and hisRS genes was induced under the conditions of low pH, as reported in Figure 2.14.
Growth in LB medium at pH 4.5 induced an increase of 140- and 60-fold, for hdc and hisRS respectively, as compared to growth in LB at normal pH (Relative Expression, RE 103.82 and 43.71). In the same acidic condition, the presence of 5 mM histidine, further increased the expression of these genes 10- and 6-fold (RE 540.92 and 144.33). The greatest expression of hdc and hisRS was obtained when M. morganii cells were grown in the minimal medium Tx, at pH 4.5 and in presence of histidine. In this case, the relative expression increased 146 and 48 times (RE 803.22 and 210.34). In the other growth conditions, low values of expression were detected during growth. In LB at pH 7.0, with or without histidine supplementation, and in the experiments in which cells were grown in the minimal medium at 15°C, also in the presence of histamine, the transcription of these gene was always detected, even if a low values (RE 0.5 – 5.4). These results suggest a costitutive minimal basal expression of hdc and hisRS genes, that are up-regulated under conditions of low pH or histidine supplementation. As reported from other authors (Tanaka et al., 2008; Kimura et al., 2009), bacterial amino acid decarboxylases are hypothesized to play a role in controlling pH to countermeasure the acidity resulting from fermentations. This mechanism is generally considered related to the decreasing of intercellular proton concentration trough the decarboxylation reaction and to the improvement of the microenvironment by excretion of a basic molecule, the amine. According to the models proposed, the amino acid is quickly decarboxylated to biogenic amine and CO2 which can freely escape outside. The reaction eliminates a large quantity of H+ ions from the cell. We can assume that the histidine
0
100
200
300
400
500
600
700
800
900
LB 4.5 LBH 4.5 Tx 37 TxH 37 Tx 4.5 TxH 4.5
Re
lativ
e E
xpre
ssio
n
hdc
hisRS
Figure 2.14. Quantification of mRNA extracted from cells of M. morganii under different culture conditions: LB medium at pH 4.5 (LB 4.5) with histidine addiction (LBH 4.5), minimal medium Tx at 37 °C (Tx 37) with histidine (TxH 37) and Tx at pH 4.5 (Tx 4.5) with histidine (TxH 4.5).
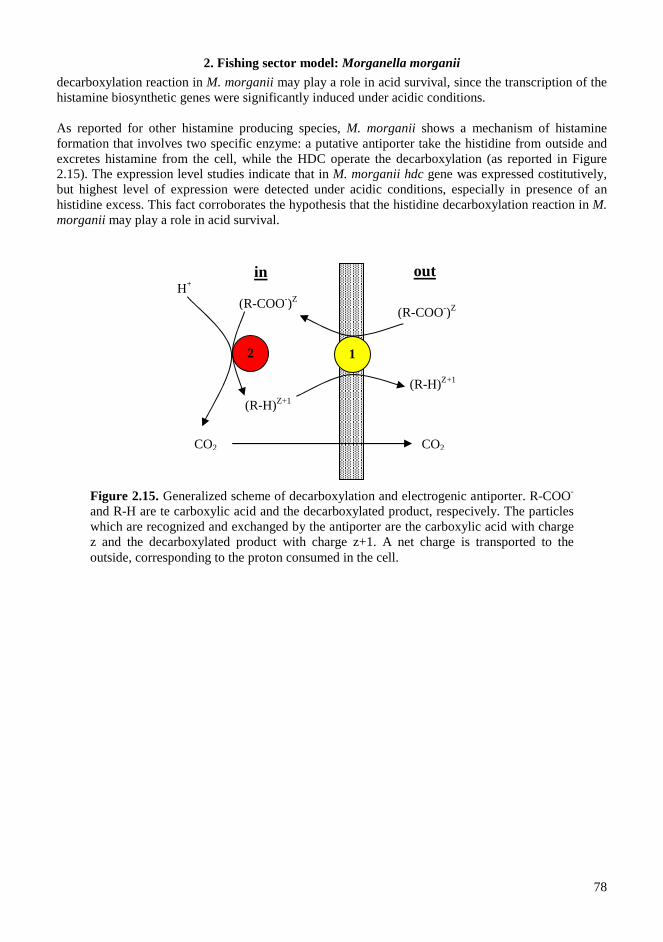
2. Fishing sector model: Morganella morganii
78
decarboxylation reaction in M. morganii may play a role in acid survival, since the transcription of the histamine biosynthetic genes were significantly induced under acidic conditions. As reported for other histamine producing species, M. morganii shows a mechanism of histamine formation that involves two specific enzyme: a putative antiporter take the histidine from outside and excretes histamine from the cell, while the HDC operate the decarboxylation (as reported in Figure 2.15). The expression level studies indicate that in M. morganii hdc gene was expressed costitutively, but highest level of expression were detected under acidic conditions, especially in presence of an histidine excess. This fact corroborates the hypothesis that the histidine decarboxylation reaction in M. morganii may play a role in acid survival.
Figure 2.15. Generalized scheme of decarboxylation and electrogenic antiporter. R-COO- and R-H are te carboxylic acid and the decarboxylated product, respecively. The particles which are recognized and exchanged by the antiporter are the carboxylic acid with charge z and the decarboxylated product with charge z+1. A net charge is transported to the outside, corresponding to the proton consumed in the cell.
H+
2
CO2 CO2
1
(R-COO-)Z (R-COO-)Z
(R-H)Z+1
(R-H)Z+1
in out
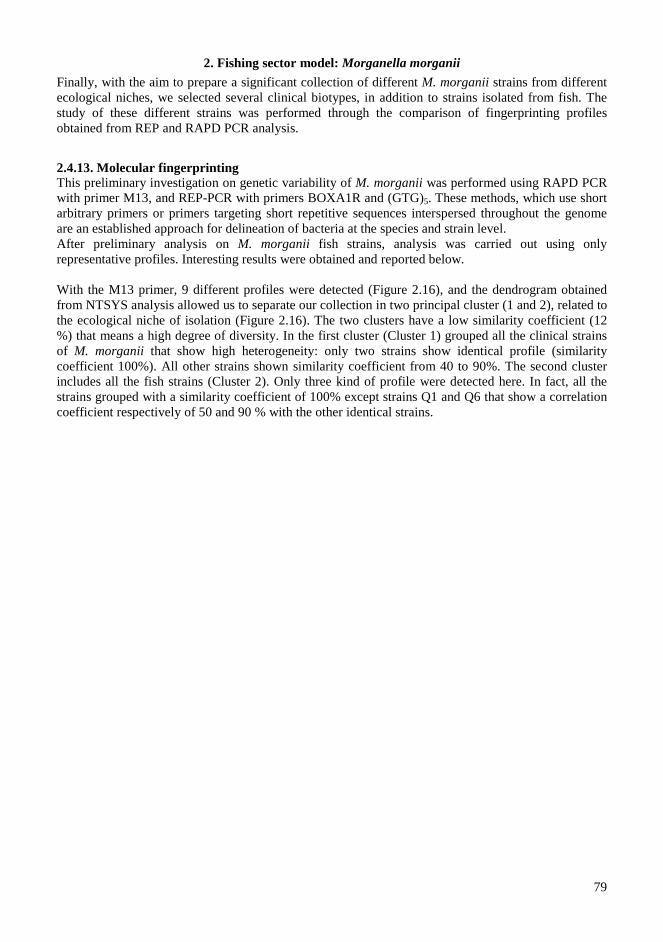
2. Fishing sector model: Morganella morganii
79
Finally, with the aim to prepare a significant collection of different M. morganii strains from different ecological niches, we selected several clinical biotypes, in addition to strains isolated from fish. The study of these different strains was performed through the comparison of fingerprinting profiles obtained from REP and RAPD PCR analysis.
2.4.13. Molecular fingerprinting This preliminary investigation on genetic variability of M. morganii was performed using RAPD PCR with primer M13, and REP-PCR with primers BOXA1R and (GTG)5. These methods, which use short arbitrary primers or primers targeting short repetitive sequences interspersed throughout the genome are an established approach for delineation of bacteria at the species and strain level. After preliminary analysis on M. morganii fish strains, analysis was carried out using only representative profiles. Interesting results were obtained and reported below. With the M13 primer, 9 different profiles were detected (Figure 2.16), and the dendrogram obtained from NTSYS analysis allowed us to separate our collection in two principal cluster (1 and 2), related to the ecological niche of isolation (Figure 2.16). The two clusters have a low similarity coefficient (12 %) that means a high degree of diversity. In the first cluster (Cluster 1) grouped all the clinical strains of M. morganii that show high heterogeneity: only two strains show identical profile (similarity coefficient 100%). All other strains shown similarity coefficient from 40 to 90%. The second cluster includes all the fish strains (Cluster 2). Only three kind of profile were detected here. In fact, all the strains grouped with a similarity coefficient of 100% except strains Q1 and Q6 that show a correlation coefficient respectively of 50 and 90 % with the other identical strains.
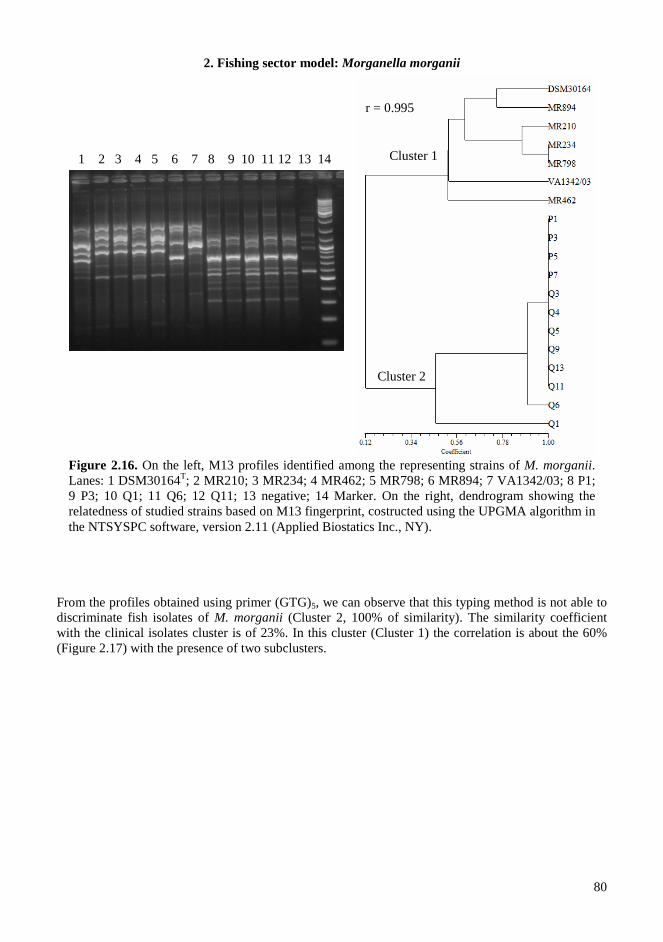
2. Fishing sector model: Morganella morganii
80
From the profiles obtained using primer (GTG)5, we can observe that this typing method is not able to discriminate fish isolates of M. morganii (Cluster 2, 100% of similarity). The similarity coefficient with the clinical isolates cluster is of 23%. In this cluster (Cluster 1) the correlation is about the 60% (Figure 2.17) with the presence of two subclusters.
1 2 3 4 5 6 7 8 9 10 11 12 13 14
r = 0.995
Cluster 2
Cluster 1
Figure 2.16. On the left, M13 profiles identified among the representing strains of M. morganii. Lanes: 1 DSM30164T; 2 MR210; 3 MR234; 4 MR462; 5 MR798; 6 MR894; 7 VA1342/03; 8 P1; 9 P3; 10 Q1; 11 Q6; 12 Q11; 13 negative; 14 Marker. On the right, dendrogram showing the relatedness of studied strains based on M13 fingerprint, costructed using the UPGMA algorithm in the NTSYSPC software, version 2.11 (Applied Biostatics Inc., NY).
2. Fishing sector model: Morganella morganii
81
With the third used primer BOXA1R, the discrimination power is higher than in previous experiments. In this last case, as reported in Figure 2.18 all the fish isolates profiles grouped with a similarity coefficient of 100 % (Cluster 2). Unlike before, two clinical strains, MR462 and MR798 joined the fish cluster with a correlation of 40%. The similarity % of these two strains with other clinical ecotype it is only about 18%. The Cluster 1 that grouped the remaining five clinical strains is quite heterogeneous. In this group, only two strains show a 100% of similarity, while other strains were correlated with a coefficient ranging from 35 to 50%.
1 2 3 4 5 6 7 8 9 10 11 12 13
r = 0.999
Cluster 1
Cluster 2
Figure 2.17. On the left (GTG)5 profiles identified among the representing strains of M. morganii. Lanes: 1 DSM30164T; 2 MR210; 3 MR234; 4 MR462; 5 MR798; 6 MR894; 7 VA1342/03; 8 P1; 9 P7; 10 Q4; 11 Q5; 12 negative; 13 Marker. On the right, dendrogram showing the relatedness of studied strains based on (GTG)5 fingerprint (UPGMA algorithm, NTSYSPC software, version 2.11 - Applied Biostatics Inc., NY).
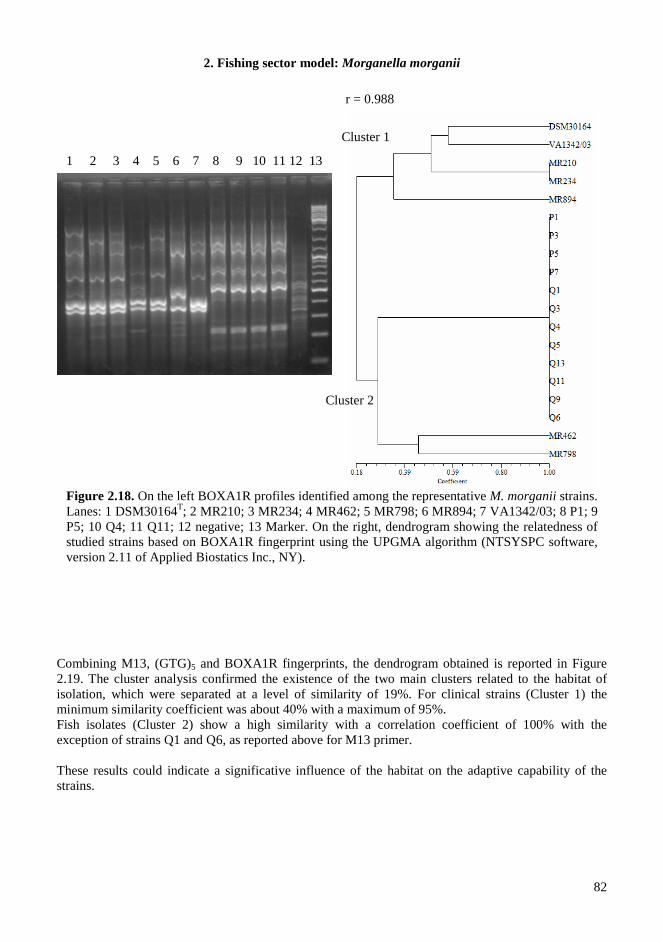
2. Fishing sector model: Morganella morganii
82
Combining M13, (GTG)5 and BOXA1R fingerprints, the dendrogram obtained is reported in Figure 2.19. The cluster analysis confirmed the existence of the two main clusters related to the habitat of isolation, which were separated at a level of similarity of 19%. For clinical strains (Cluster 1) the minimum similarity coefficient was about 40% with a maximum of 95%. Fish isolates (Cluster 2) show a high similarity with a correlation coefficient of 100% with the exception of strains Q1 and Q6, as reported above for M13 primer. These results could indicate a significative influence of the habitat on the adaptive capability of the strains.
1 2 3 4 5 6 7 8 9 10 11 12 13
Cluster 1
r = 0.988
Cluster 2
Figure 2.18. On the left BOXA1R profiles identified among the representative M. morganii strains. Lanes: 1 DSM30164T; 2 MR210; 3 MR234; 4 MR462; 5 MR798; 6 MR894; 7 VA1342/03; 8 P1; 9 P5; 10 Q4; 11 Q11; 12 negative; 13 Marker. On the right, dendrogram showing the relatedness of studied strains based on BOXA1R fingerprint using the UPGMA algorithm (NTSYSPC software, version 2.11 of Applied Biostatics Inc., NY).
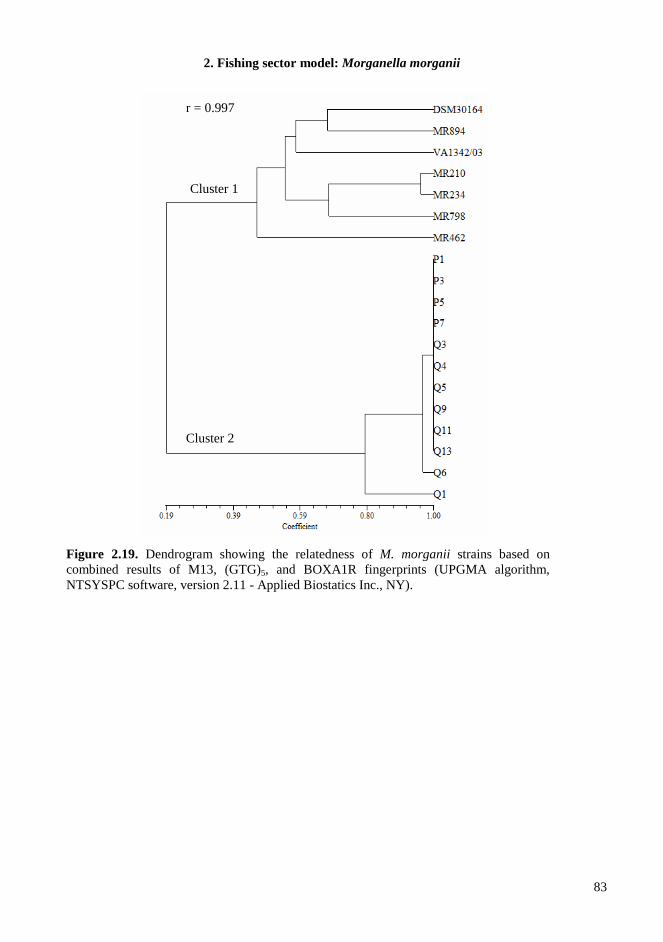
2. Fishing sector model: Morganella morganii
83
r = 0.997
Cluster 1
Cluster 2
Figure 2.19. Dendrogram showing the relatedness of M. morganii strains based on combined results of M13, (GTG)5, and BOXA1R fingerprints (UPGMA algorithm, NTSYSPC software, version 2.11 - Applied Biostatics Inc., NY).
2. Fishing sector model: Morganella morganii
84
2.5. CONCLUSIONS According to the tasks described in the section 2.2, the following conclusions were drawn:
- the incidence of M. morganii strains in different tuna samples was of 37%;
- the development of a specific molecular tool for the detection and quantification of M. morganii could be useful to prevent the presence of this undesiderable species in the food chain;
- as reported for other histamine producing species, M. morganii shows a mechanism of histamine formation that involves two specific enzymes;
- the expression level studies indicate that in M. morganii hdc gene was expressed costitutively, but highest level of expression were detected under acidic conditions, especially in presence of an histidine excess. This fact corroborates the hypothesis that the histidine decarboxylation reaction in M. morganii may play a role in acid survival;
- strains grouped in relation to their niche of origin, suggesting a significative influence of the habitat on the adaptive capability of the strains.
Publications related to this part of PhD thesis are reported below:
o Ferrario C, Pegollo C, Ricci G, Borgo F, Fortina MG, 2012a, PCR detection and identification of histamine-forming bacteria in filleted tuna fish samples. J Food Sci 77:115-120.
o Ferrario C, Ricci G, Borgo F, Fortina MG, 2012b, Species-specific DNA probe and development of a quantitative PCR assay for the detection of Morganella morganii. Lett Appl Microbiol 54:292-298.
o Ferrario C, Ricci G, Fortina MG, de las Rivas B, Muñoz R, 2012, Improved study on the histidine decarboxylase of Morganella morganii - In: 978-975-561-423-6. - (2012 Aug), p. 597. Presented at 23rd International ICMFH Symposium, Food Micro 2012, Istanbul, Turkey, 3-7 September 2012.
o Ferrario C, Borgo F, de las Rivas B, Muñoz R, Ricci G, Fortina MG, Organization of the histamine biosynthetic locus in Morganella morganii and its expression under acidic condition. Submitted to J Appl Microbiol.
2. Fishing sector model: Morganella morganii
85
2.6. REFERENCES 1. Ababouch L, 2006, Assuring fish safety and quality in international fish trade. Marine Poll Bull
53: 561-568. 2. Altschul SF, Madden TL, Schaffer AA, Zhang J, Zhang Z, Miller W, Lipman DJ, 1997, Gapped
BLAST and PSI-BLAST: a new generation of protein database search programs. Nucleic Acids Res 25:3389-3402.
3. AOAC, 1977. OMA 977.13, Histamine in seafood: fluorometric method. Sec. 35.1.32. In: Cunniff, P.A. (Ed.), Official Methods of Analysis of AOAC Int., sixteenth ed.. AOAC Int., Gaithersburg, MD, pp. 6–17.
4. Barrow GI, Feltham RKA, 1999, Cowan and Steel’s manual for the identification of medical bacteria, 3nd ed. New York: Cambridge University Press.
5. Bjornsdottir K, Bolton GE, McClellan-Green PD, Jaykus LA, Green DP, 2009, Detection of Gram-negative histamine-producing bacteria in fish: a comparative study. J Food Prot 72:1987-1991.
6. Bjornsdottir-Butler K, Jones JL, Benner R, Burkhardt III W, 2011, Development of a real-time PCR assay with an internal amplification control for detection of Gram-negative histamine-producing bacteria in fish. Food Microbiol 28:356-363.
7. Constance DH, Bonanno A, 2009, Contested terrain of the global fish- eries: ‘‘dolphin-safe’’ tuna, the Panama declaration, and the Marine Stewardship Council. Rural Sociol 64:597–623.
8. Curiel JA, de las Rivas B, Mancheño JM, Muñoz R, 2011, The pURI family of expression vectors: A versatile set of ligation independent cloning plasmids for producing recombinant His-fusion proteins. Protein Expr Purif 76:44–53.
9. Dalgaard P, Emborg J, Kjølby A, Sørensen ND, Ballin NZ, 2008, Histamine and biogenic amines: formation and importance in sea- food. In: Børresen, T. (Ed.), Improving Seafood Products for the Consumer. Woodhead Publishing Ltd, Cambridge.
10. De Urraza PJ, Gómez-Zavaglia A, Lozano ME, Romanowski V, De Antoni GL, 2000, DNA fingerprinting of thermophilic lactic acid bacteria using repetitive sequence-based polymerase chain reaction. J Dairy Res 67: 381–392.
11. EC 2005. Commission regulation (EC) No 2073/2005 of 15 November 2005 on microbiological criteria for foodstuffs. Official Journal of the European Union 338:1-25.
12. FDA/CFSAN 2001. Scombrotoxin (histamine) formation. Fish and fishery products hazards and controls guidance, p. 83-102. 3nd ed, Food and Drug Administration, Center for Food Safety and Applied Nutrition, Office of Seafood, Washington, DC, USA.
13. Ferrario C, Ricci G, Borgo F, Fortina MG, 2012b, Species-specific DNA probe and development of a quantitative PCR assay for the detection of Morganella morganii. Lett Appl Microbiol 54:292-298.
14. Ferrario,C, Pegollo C, Ricci G, Borgo F, Fortina MG, 2012a, PCR detection and identification of histamine-forming bacteria in filleted tuna fish samples. J Food Sci 77:115-120.
15. Fortina MG, Ricci G, Acquati A, Zeppa G, Gandini A, Manachini PL, 2003, Genetic characterization of some lactic acid bacteria occurring in an artisanal protected denomination origin (PDO) Italian cheese, the Toma Piemontese. Food Microbiol 20:397-404.
16. García-Moruno E, Carrascosa A, Muñoz R, 2005, A rapid and inexpensive method for the determination of biogenic amines from bacterial cultures by thin-layer chromatography. J Food Prot 68:625-629.
17. Gosetti F, Mazzucco E, Gianotti V, Polati S, Gennaro MC, 2007, High performance liquid chromatography/tandem mass spectrometry determination of biogenic amines in typical Piedmont cheeses. J Chromat 1149:151-157.
18. Gram L, Huss HH, 1996, Microbiological spoilage of fish and fish products. Int J Food Microbiol 33:121-137.
19. Guth EC, Francklyn CS, 2007, Kinetic discrimination of tRNA identity by the conserved motif 2 loop of a class II aminoacyl-tRNA synthetase. Mol Cell 25:531–542.
2. Fishing sector model: Morganella morganii
86
20. Henderson PB, 1830, Case of poisoning from the bonito (Scomber pelamis). Edinburgh Med J 34:317–318.
21. Hoffmann H, Stindl S, Stumpf A, Mehlen A, Monget D, Heesemann J, Schleifer KH, Roggenkam A, 2005, Description of Enterobacter ludwigii sp. nov., a novel Enterobacter species of clinical relevance. Syst Appl Microbiol 28:206-212.
22. Hungerford JM, 2010, Scombroid poisoning: A review. Toxicon 56:231 -243. 23. Janda JM, Abbott SL, 2005, Genus XXl. Morganella Fulton 1943, 81AL. In Bergey’s Manual of
Systematic Bacteriology, 2nd edn, vol. 2, part B, pp. 707–709. Edited by DJ Brenner, NR Krieg, JT Staley. New York: Springer.
24. Jensen KT, Frederiksen W, Hickman-Brenner FW, Steigerwalt AG, Riddle CF, Brenner DJ, 1992, Recognition of Morganella subspecies, with proposal of Morganella morganii subsp. morganii subsp. nov. and Morganella morganii subsp. sibonii subsp. nov. Int J Syst Bacteriol 42:613–620.
25. Jensen MA, Webster JA, Strauss N, 1993, Rapid identification of bacteria on the basis of polymerase chain reaction-amplified ribosomal DNA spacer polymorphisms. Appl Environ Microbiol 59:945-952.
26. Kamath AV, Vaaler GL, Snell EE, 1991, Pyridoxal phosphate-dependent histidine decarboxylases. Cloning, sequencing, and expression of genes from Klebsiella planticola and Enterobacter aerogenes and properties of the overexpressed enzymes. J Biol Chem 266:9432–9437.
27. Kanki M, Yoda T, Tsukamoto T, Baba E, 2007, Histidine decarboxylases and their role in accumulation of histamine in tuna and dried saucy. Appl Environ Microbiol 73:1467-1473.
28. Kim SH, An H, Wei CI, Visessanguan W, Benjakul S, Morrissey MT, Su YC, Pitta TP, 2003, Molecular detection of a histamine former, Morganella morganii, in albacore, mackerel, sardine and a processing plant. J Food Sci 68:453-457.
29. Kim SH, Field KG, Chang DS, Wei CI, An H, 2001, Identification of bacteria crucial to histamine accumulation in pacific mackerel during storage. J Food Prot 64:1556-1564.
30. Kimura B, Takahashi H, Hokimoto S, Tanaka Y, Fujii T, 2009, Induction of the histidine decarboxylase genes of Photobacterium damselae subsp. damselae (formally P. histaminum) at low pH. J Appl Microbiol 107:485-497.
31. Lane DJ, 1991, 16S/23S rRNA sequencing. In Stackebrandt E, Goodfellow M, editors. Nucleic acid techniques in bacterial systematics. New York: Wiley. p 115-175.
32. Lehane L, Olley J, 2000, Histamine fish poisoning revisited. Int J Food Microbiol 58:1-37. 33. Lucas P, Wolken WAM, Claisse O, Lolkema JS, Lonvaud-Funel A, 2005, Histamine-producing
pathway encoded on an unstable plasmid in Lactobacillus hilgardii 0006. Appl Environ Microbiol 71:1417–1424.
34. Maintz L, Novak N, 2007, Histamine and histamine intolerance. Am J Clin Nutr 85:1185-1196. 35. Marcobal A, de las Rivas B, Muñoz R, 2006, Methods for the detection of bacteria producing
biogenic amines on foods: A survey. J Verbr Lebensm 1:187–196. 36. Morii H, Kasama K, Herrera-Espinoza R, 2006, Cloning and sequencing of the histidine
decarboxylase gene from Photobacterium phosphoreum and its functional expression in Escherichia coli. J Food Prot 69:1768–1776.
37. Nam HM, Srinivasan V, Gillespie BE, Murinda SE, Oliver SP, 2005, Application of SYBR green real-time PCR assay for specific detection of Salmonella spp. in dairy farm environmental samples. Int J Food Microbiol 102:161-171.
38. Niven CF, Jeffrey MB, Corlett DA, 1981, Differential plating medium for quantitative detection of histamine-producing bacteria. Appl Environ Microbiol 41:321–322.
39. O’Hara CM, Brenner FW, Miller JM, 2000, Classification, identification and clinical significance of Proteus, Providencia, and Morganella. Clin Microbiol Rev 13:534-546.
40. Olsen SJ, MacKinnon LC, Goulding JS, Bean NH, Slukter L, 2000, Surveillance for food-borne disease outbreaks. United States 1993-1997. Report CDC surveillance summary, Morbid Mortal Wkly Rep 49:1-62.
41. Panicker G, Myers ML, Bej AK, 2004, Rapid detection of Vibrio vulnificus shelffish and Gulf of
2. Fishing sector model: Morganella morganii
87
Mexico water by real-time PCR. Appl Environ Microbiol 70:498-507. 42. Patange SB, Mukundan MK, Ashok Kumar K, 2005, A simple and rapid method for colorimetric
determination of histamine fish flesh. Food Control 16:465-472. 43. Petridis KD, Steinhart H, 1995, Automation of pre-column derivatiza- tion with OPA – A new
HPLC method for the regulation of biogenic amines in food. Z Lebensm Unters Forsch 201:256–260.
44. Postollec F, Falentin H, Pavan S, Combrisson J, Sohier D, 2011, Recent advances in quantitative PCR (q-PCR) applications in food microbiology. Food Microbiol 28:848-861.
45. Prester L, 2011, Biogenic amines in fish, fish products and shellfish: a review. Food Addit Contam Part A Chem Anal Control Expo Risk Assess 28:1547-1560.
46. Rossetti L, Giraffa G, 2005, Rapid identification of dairy lactic acid bacteria by M13-generated, RAPD-PCR fingerprint databases. J Microbiol Methods 63: 135–144.
47. Sambrook J, Fritsch EF, Maniatis T, 1989, Molecular Cloning: A Laboratory Manual, 2nd edn. Cold Spring Harbor, NY: Cold Spring Harbor Laboratory Press.
48. Sanger F, Nicklen S, Coulson AR, 1977, DNA sequencing with chain terminating inhibitors. Proc Natl Acad Sci USA 74:5463-5467.
49. Specht D, 1998, Scombroid fish poisoning. J Emerg Nurs 24:118–119. 50. Takahashi H, Kimura B, Yoshikawa M, Fujii T, 2003, Cloning and sequencing of the histidine
decarboxylase genes of gram-negative, histidine producing bacteria and their application in detection and identification of these organisms in fish. Appl Environ Microbiol 69:2568-2579.
51. Tanaka Y, Kimura B, Takahashi H, Watanabe T, Obata H, Kai A, Morozumi S, Fujii T, 2008, Lysine decarboxylase of Vibrio parahaemolyticus: kinetics of transcription and role in acid resistance. J Appl Microbiol 104:1283–1293.
52. Tao Z, Sato M, Abe N, Yamaguchi T, Nakano T, 2009, Simple and rapid detection of histamine-forming bacteria by differential agar medium. Food Control 20:903-906.
53. Taylor SL, Guthertz LS, Leatherwood M, Lieber ER, 1979, Histamine production by Klebsiella pneumoniae and an incident of scombroid fish poisoning. Appl Environ Microbiol 37:274-278.
54. Thompson JD, Higgins DG, Gibson TJ, 1994, Clustal W: improving the sensitivity of progressive multiple sequence alignment through sequence weighting, positions-specific gap penalties and weight matrix choice. Nucleic Acids Res 22:4673–4680.
55. Vaaler GL, Snell EE, 1989, Pyridoxal 5’-phosphate dependent histidine decarboxylase: overproduction, purification, byosynthesis of soluble site-directed mutant proteins, and replacement of conserved residues. Biochemistry 28:7306–7313.
56. Versalovic J, Schneid M, de Bruijin FJ, Lupski JR, 1994, Genomic fingerprinting of bacteria using repetitive sequence-based polymerase chain reaction. Methods Mol Cell Biol 5: 25–40.
Appendix 1
88
APPENDIX 1. COPIES OF ABSTRACTS OF PAPERS, ORAL COMMUNICATIONS AND POSTERS
1. Ferrario,C, Pegollo C, Ricci G, Borgo F, Fortina MG, 2012a, PCR detection and identification of
histamine-forming bacteria in filleted tuna fish samples. J Food Sci 77:115-120.
2. Ferrario C, Ricci G, Borgo F, Fortina MG, 2012b, Species-specific DNA probe and development of a quantitative PCR assay for the detection of Morganella morganii. Lett Appl Microbiol 54:292-298.
3. Ricci G, Ferrario C, Borgo F, Rollando A, Fortina MG, 2012, Genome sequences of Lactococcus garvieae TB2.5, isolated from Italian cheese, and Lactococcus garvieae LG9, isolated from Italian rainbow trout. J Bacteriol 194:1249-1250.
4. Ferrario C, Ricci G, Borgo F, Rollando A, Fortina MG, 2012, Genetic investigation within Lactococcus garvieae revealed two genomic lineages. FEMS Microbiol Lett 332:153-161.
5. Ricci G., Ferrario C, Borgo F, Eraclio G, Fortina MG, 2013, Genome sequences of two Lactococcus garvieae strains Isolated from meat. Genome Announc, 1: in press.
6. Ferrario C, Borgo F, de las Rivas B, Muñoz R, Ricci G, Fortina MG, Organization of the histamine biosynthetic locus in Morganella morganii and its expression under acidic condition. Submitted to J Appl Microbiol.
7. Ferrario C, Ricci G, Fortina MG, de las Rivas B, Muñoz R, 2012, Improved study on the histidine decarboxylase of Morganella morganii. 23rd International ICMFH Symposium, Food Micro 2012, Istanbul, Turkey.
8. Ferrario C, Borgo F, Ricci G, Fortina MG, 2012, Variability at gene and genome levels revealed different genomic lineages in Lactococcus garvieae. 23rd International ICFMH Symposium: Food Micro 2012, Istanbul, Turkey.
9. Ferrario C, 2010, Safety and quality of fish products: a methodological polyphasic approach to study contaminating emerging pathogens. 15th Workshop on the Developments in the Italian PhD Research on Food Science Technology and Biotechnology, 15-17 September, 2010 (Portici, Italy).
10. Ferrario C, 2011, Lactococcus garvieae and Morganella morganii: two bacterial models to study quality and safety of fish products. 16th Workshop on the Developments in the Italian PhD Research on Food Science Technology and Biotechnology, 21-23 September, 2011 (Lodi, Italy).
11. Ferrarrio C, 2012, Lactococcus garvieae and Morganella morganii as models to study safety and quality of fish products. 17th Workshop on the Developments in the Italian PhD Research on Food Science Technology and Biotechnology, 19-21 September, 2012 (Cesena, Italy).
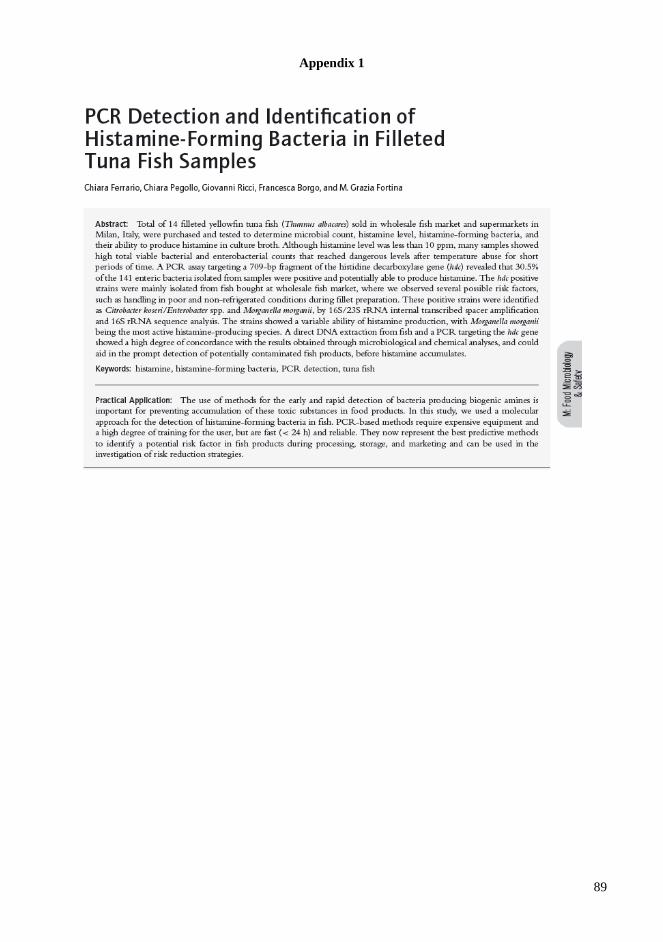
Appendix 1
89
Appendix 1
90

Appendix 1
91
Appendix 1
92

Appendix 1
93
Original paper accepted by Genome Announcement, in press Genome Sequences of Two Lactococcus garvieae Strains Isolated from Meat Lactococcus garvieae is an important fish pathogen and an emerging opportunistic human pathogen, as well as a component of natural microbiota in dairy and meat products. We present the first report of genome sequences of L. garvieae I113 and Tac2 strains isolated from a meat source
Appendix 1
94
Original paper submitted to Journal of Applied Micr obiology Organization of the histamine biosynthetic locus in Morganella morganii and its expression under acidic condition Ferrario C, Borgo F, de las Rivas B, Muñoz R, Ricci G, Fortina MG The aim of this study was to improve the genetic knowledge of histamine production by Morganella morganii, and to study the expression of the histidine decarboxylase gene (hdc), for a better control of the accumulation of this toxic substance in food products. The sequence of the histidine decarboxylase chromosomal region showed the presence of two putative histidine/histamine antiporters located upstream and downstream the hdc gene. The second transporter is followed by a histidyl-tRNA synthetase. This genetic organization was confirmed by PCR amplifications of this region in different strains of M. morganii isolated from tuna samples available in our collection. Sequence comparisons with other gram negative histamine producer bacteria, showed a similar genetic organization in Klebsiella oxytoca. This work represents the first description and identification of the hdc-related genes in M. morganii. To study the M. morganii histidine decarboxylase enzyme and its expression, the corresponding hdc gene was cloned into Escherichia coli and recombinant cells grown at 37°C after 4 h of isopropyl-β-D-thiogalactopyranoside induction, were shown to over-produce histidine decarboxylase. Finally, hdc expression in M. morganii was studied by RT-PCR experiments in different growth conditions. The highest level of expression was detected under acidic conditions, with an histidine excess. This result supports the hypothesis that the histidine decarboxylation reaction in M. morganii may play a role in acid survival.
Appendix 1
95
23rd International ICMFH Symposium, Food Micro 2012, Istanbul, Turkey, 3-7 September 2012. Improved study on the histidine decarboxylase of Morganella morganii Chiara Ferrario, Giovanni Ricci, Maria Grazia Fortina, Blanca de las Rivas, Rosario Muñoz
The hdc gene, coding for the enzyme histidine decarboxylase (HDC), is responsible of the decarboxylation of the amine histidine to histamine, a biogenic amine that can cause a chemical intoxication called Scombroid syndrome. This gene is present in the genome of different bacterial species, both of gram negative and positive bacteria. One of these is Morganella morganii, a gram negative rod considered one of the most prolific histamine former in seafood, especially in tuna fish. The aim of this study was to improve the knowledge at genome level and to study the expression of the pyridoxal phosphate dependent hdc of M. morganii, for a better control of the accumulation of this toxic substance in food products. Firstly, the nucleotidic sequence of the gene hdc and its flanking regions was determined by the development of a plasmid library of M. morganii in E. coli strain. After sequencing, the obtained region of 7681 bp showed the presence of two amino acids permease (potE) located one before and one after the hdc gene, usually coded next to decarboxylases, for the histidine/histamine transport. The second permease is followed by a second histidyl - tRNA synthetase (hisS). These results were confirmed also by PCR amplifications of all these genes in different strains of M. morganii isolated from tuna samples. This is the first indication and localization of these genes in M. morganii. A comparison with other gram negative histamine producers, showed a difference for the presence of the aminoacid permease after the hdc. To study the HDC enzyme and its expression, the corresponding gene was cloned into Escherichia coli, grown in different cultural conditions. Proteins were extracted, the HDC specific enzyme was purified and its activity was determined by TLC methods. Finally, hdc gene expression in M. morganii was studied by RT - PCR experiments after grow of the strain tested in different conditions of temperature, pH, presence of O2 and adding different amount of histidine.
Appendix 1
96
23rd International ICMFH Symposium, Food Micro 2012, Istanbul, Turkey, 3-7 September 2012. Variability at gene and genome levels revealed different genomic lineages in Lactococcus garvieae Chiara Ferrario, Francesca Borgo, Giovanni Ricci, Maria Grazia Fortina. Lactococcus garvieae is a pathogen that causes septicemia in fish and serious damage to fish aquaculture worldwide, but recently has been isolated from human, ruminant, water sources and several food matrices. In the present work we monitored the population structure of L. garvieae strains, including isolates of dairy, fish, meat, vegetable and cereal origin. This bacterial collection was explored using molecular polyphasic approach comprising PCR-ribotyping, Rep and RAPD-PCR analyses and multilocus restriction typing (MLRT) carried out on six partial genes. This approach allowed high-resolution cluster analysis in which two major groups were distinguishable: one group included dairy isolates, the other group meat isolates. Unexpectedly, some strains coming from fish grouped with dairy isolates whereas the other with meat isolates. Likewise, strains isolated from vegetables allocated between the two main groups. These findings revealed high variability within the species at both gene and genome levels. The observed genetic heterogeneity among Lactococcus garvieae strains was not entirely coherent with the ecological niche of origin of the strains, but rather supports the idea of an early separation of L. garvieae population into independent genomic lineages. To better define this result, a multilocus sequence typing (MLST) scheme was developed for L. garvieae, based on the sequence analysis of eight genes (α-acetolactate synthase als, α-subunit of ATP synthase atpA, bacterial elongation factor EF-Tu tuf, glyceraldehyde-3-phosphate dehydrogenase gapC, β-subunit DNA gyrase gyrB, β’-subunit RNA polymerase rpoC, D-alanine-D-alanyl carrier protein ligase dltA, galactose permease galP). On the 17 sequence types determined, to estimate intraspecific genetic diversity of data samples and to detect particular population structures several statistical analyses were carried out. The average nucleotide diversity, numbers of synonymous and nonsynonymous mutations, the measure of contribution of recombination and mutation in the creation of sample population were determined to delineate a phylogenetic framework of our collection of L. garvieae.

Appendix 1
97
15th Workshop on the Developments in the Italian PhD Research on Food Science Technology and Biotechnology, 15-17 September, 2010 (Portici, Italy)
Safety and quality of fish products: a methodological polyphasic approach to study contaminating emerging pathogens
Chiara Ferrario This PhD thesis research project aims to improve the current systems of management and control of food safety, focusing the attention on the study of two bacterial species, Lactococcus garvieae and Morganella morganii that represent valid models of contaminating emerging pathogens in fish products.
Appendix 1
98
16th Workshop on the Developments in the Italian PhD Research on Food Science Technology and Biotechnology, 21-23 September, 2011 (Lodi, Italy) Lactococcus garvieae and Morganella morganii: two bacterial models to study quality and safety of fish products Chiara Ferrario This paper reports the results obtained for two bacterial species, Lactococcus garvieae and Morganella morganii, that represent models of contaminating emerging pathogens in fish products: i) molecular characterization and genetic polymorphism of L. garvieae strains coming from different food niches; ii) detection of the histamine-forming M. morganii in tuna fish samples and its quantification through the development of a new real-time PCR assay.
Appendix 1
99
17th Workshop on the Developments in the Italian PhD Research on Food Science Technology and Biotechnology, 19-21 September, 2012 (Cesena, Italy) Lactococcus garvieae and Morganella morganii as models to study safety and quality of fish products Chiara Ferrario This PhD thesis reports the study of two bacterial species, Lactococcus garvieae and Morganella morganii, that represent models of contaminating emerging pathogens in fish products: i) molecular characterization and genetic polymorphism of L. garvieae strains coming from different food niches; ii) quantification of M. morganii through the development of a new real-time PCR assay and study of the gene responsible of histamine production during storage of fish belonging to the Scombridae’s family.
Appendix 2
100
APPENDIX 2. INDEX OF TABLES Table 1.1. L. garvieae strais whose genome sequences is available in databases, with summarian informations and references. ................................................................................................................. 14 Table 1.2. Prevalence of L. garvieae in different food products and strains analyzed in this study...... 19 Table 1.3. PCR primers and conditions used for the detection of genes in L. garvieae strains............. 20 Table 1.4. RT-PCR primers and conditions used for the gene expression experiments, designed for this study. ..................................................................................................................................................... 21 Table 1.5. Restriction profiles obtained for L. garvieae strains after digestion of PCR-amplified regions of six genes analyzed............................................................................................................................. 26 Table 1.6. Origin of L. garvieae strains analyzed during this study and allelic profile at each locus. .. 31 Table 1.7. Polymorphism at seven genes in L. garvieae. ...................................................................... 32 Table 1.8. L. garvieae strains used for genome sequence analysis. Cluster identifies three lineages ... 40 Table 2.1. Bacterial strains analized in this study................................................................................. 62 Table 2.2. Primer sets and correlated informations used in this study. ................................................. 63 Table 2.3. Overview of the main results obtained on tested filleted tuna fish ....................................... 65
Appendix 3
101
APPENDIX 3. INDEX OF FIGURES Figure 1.1. Plasmid profiles of L. garvieae strains.................................................................................23 Figure 1.2. Cluster analysis of the Lactococcus garvieae strains using combined BOXA1R, (GTG)5, and M13 fingerprints...............................................................................................................................24 Figure 1.3. Dendrogram showing the relatedness of the Lactococcus garvieae strains based on analysis of their restriction profiles generated by MLRT analysis.......................................................................27 Figure 1.4. PCR-ribotyping analysis of Lactococcus garvieae strains...................................................29 Figure 1.5. The unrooted neighbor-joining tree of L. garvieae...............................................................33 Figure 1.6. Major rule consensus tree generated by Clonal Frame analysis of concatenated sequences of all loci, for the total population...........................................................................................................35 Figure 1.7. Splits decomposition analysis of the concatenated sequences of all loci for the total population of L. garvieae and for subgroups SA and SB........................................................................36 Figure 1.8. Consensus Network graph obtained after allineament of L. garvieae genome sequences available in datatbases.............................................................................................................................38 Figure 1.9. Schematic representation of the sucrose fermentation pathway in strain G9.......................39 Figure 1.10. Expression values calculated by Expression ration equation..............................................42 Figure 2.1. Biosynthesis of biogenic amines (Prester, 2011)..................................................................50 Figure 2.2. Decarboxylation of free histidine to histamine.....................................................................51 Figure 2.3. Amino acid sequenze of the HDC of M. morganii...............................................................53 Figure 2.4. Schematic representation of the histidine decarboxylase cluster of P. phosphoreum and P. damselae..................................................................................................................................................54 Figure 2.3. ITS profiles of representative strains of each cluster obtained: A, B, C, D, E. M: Marker..66 Figure 2.5. Sequence alignment of 16S rRNA region in M. morganii....................................................68 Figure 2.6. Sequence alignment of a 16S rRNA region in M morganii and other related enteric bacteria....................................................................................................................................................69 Figure 2.7. Conventional PCR assay for the identification of Morganella morganii.............................70 Figure 2.8. Melting curve analysis of real-time PCR products...............................................................71 Figure 2.9. Standard curve showing the linear relationship between CT values and Log CFU for serially diluted DNA obtained from an overnight M. morganii culture..................................................72 Figure 2.10. Detection of M. morganii in seeded fish homogenates using qPCR..................................73 Figure 2.11. Schematic representation of the histidine decarboxylase cluster of M. morganii DSM30164T.............................................................................................................................................74 Figure 2.12. Alignment of the hisRS amino acid sequence of M. morganii DSM30164T......................75 Figure 2.13. A) SDS gel of the purified HDC protein. B) Histamine detection by TLC .......................76 Figure 2.14. Quantification of mRNA extracted from cells of M. morganii under different culture conditions................................................................................................................................................77 Figure 2.15. Generalized scheme of decarboxylation and electrogenic antiporter.................................78 Figure 2.16. M13 profiles identified among the representing strains of M. morganii............................80 Figure 2.17. (GTG)5 profiles identified among the representing strains of M. morganii........................81 Figure 2.18. BOXA1R profiles identified among the representative M. morganii strains.....................82 Figure 2.19. Dendrogram showing the relatedness of M. morganii strains based on combined results of M13, (GTG)5, and BOXA1R fingerprints...............................................................................................83