Embed Size (px)
Citation preview

AAllmmaa MMaatteerr SSttuuddiioorruumm ndashndash UUnniivveerrssiittagraveagrave ddii BBoollooggnnaa
DOTTORATO DI RICERCA IN
Scienze Agroambientali
Ciclo XXV
Settore Concorsuale di afferenza 07E1
Settore Scientifico disciplinare AGR07
Association mapping of stem rust resistance in durum wheat at the
seedling and adult stages
Presentata da Dr TESFAYE LETTA DUGO
Coordinatore Dottorato
Chiarmo Prof Giovanni Dinelli
Relatore
Dott Silvio Salvi
Correlatore
Chiarmo Prof Roberto Tuberosa
Esame finale anno 2013
ALMA MATER STUDIORUM- UNIVERSITA` DI BOLOGNA
Association mapping of stem rust resistance in durum wheat at the
seedling and adult plant stages
A dissertation
Presented to the Department of Agricultural Sciences
University of Bologna
In fulfillment of the requirements for the degree of doctor of philosophy
By
Tesfaye Letta Dugo
April 2013
i
Table of Contents
ACRONYMS 1
ACKNOWLEDGMENTS 2
SUMMARY 4
CHAPTER 1 INTRODUCTION 6
11 DURUM WHEAT IMPORTANCE AND FUTURE PERSPECTIVES 6
12 WHEAT STEM RUST HISTORICAL AND CONTEMPORARY SIGNIFICANCE 7
13 MOLECULAR MARKERS AND THEIR USE IN BREEDING FOR DISEASE
RESISTANCE IN WHEAT 8
14 OVERVIEW OF ASSOCIATION MAPPING IN PLANTS 10
141 Linkage disequilibrium 12
142 Population structure 14
143 Approaches for association mapping 16
1431 Genome-wide association mapping 16
1432 Candidate gene association mapping 17
15 LITERATURE CITED 19
FIGURES 32
CHAPTER 2 IMPROVING STEM RUST RESISTANCE IN WHEAT 35
21 INTRODUCTION 35
22 LIFE CYCLE OF WHEAT STEM RUST 35
23 PHYSIOLOGIC RACES AND VARIATION OF STEM RUST 36
24 MECHANISMS OF STEM RUST RESISTANCE 37
241 Breeding for Hypersensitivity Response (HR) 38
242 Breeding for Adult Plant Resistance (APR) 40
25 STEM RUST UG99 AND ITS IMPACT ON WHEAT PRODUCTION 41
251 Distribution of Ug99 lineages 42
26 LITERATURE CITED 43
FIGURES 48
TABLE 55
CHAPTER 3 RESEARCH AIMS 57
CHAPTER 4 SEARCHING FOR NOVEL SOURCES OF FIELD
RESISTANCE TO UG99 AND ETHIOPIAN STEM RUST RACES IN DURUM
WHEAT VIA ASSOCIATION MAPPING 58
ii
41 ABSTRACT 58
42 INTRODUCTION 59
43 MATERIALS AND METHODS 61
431 Plant materials 61
432 Stem rust response evaluation under field conditions 62
433 Molecular profiling 63
434 SSR and STS markers 64
435 DArT markers 64
436 Construction of the consensus map 65
437 Association mapping 65
438 Genetic structure and linkage disequilibrium analysis 66
439 Marker-phenotype association analysis 67
44 RESULTS 68
441 Response to stem rust 68
442 Relationship between population structure and response to stem rust 69
443 Association mapping for stem rust response 70
45 DISCUSSION 74
451 Response of the elite durum wheat germplasm to stem rust under field conditions 74
452 Genetic basis of the resistance to stem rust in durum wheat and relevance to breeding 77
453 QTLs identified through association mapping and relationship with previously
described QTLs and Sr loci 79
46 CONCLUSIONS 84
47 LITERATURE CITED 85
FIGURES 94
TABLES 103
CHAPTER 5 GENOME-WIDE SEARCH OF STEM RUST RESISTANCE
LOCI AT THE SEEDLING STAGE IN DURUM WHEAT 111
51 ABSTRACT 111
52 INTRODUCTION 112
53 MATERIALS AND METHODS 114
531 Plant materials 114
532 Stem rust evaluation at seedling stage 114
533 Inoculation incubation and disease assessment 114
534 Statistical analysis 115
535 Molecular profiling 116
536 SSR markers 116
iii
537 DArT markers 116
538 Association mapping 117
539 Genetic structure and linkage disequilibrium analysis 118
5310 Marker-phenotype association analysis 118
54 RESULTS 119
541 Seedling evaluations 119
542 Relationship between population structure and seedling response to stem rust 120
543 Association mapping for seedling response to stem rust 121
55 DISCUSSION 123
551 Relationship between QTLs for resistance at seedling and field evaluations 123
552 significant markers linked to previously identified Sr genes 124
553 Significant markers for putatively novel stem rust resistance at seedling stage 126
554 Reaction of race-specific resistance genes 127
555 QTLs with minor effects 128
556 Breeding perspectives 129
56 CONCLUSIONS 130
57 LITERATURE CITED 132
FIGURES 140
TABLES 143
GENERAL CONCLUSIONS AND PERSPECTIVES 149
APPENDICES 151
1
ACRONYMS
AFLP Amplified Fragment Length Polymorphism
AM Association Mapping
APR Adult Plant Resistance
CI Coefficient of Infection
CIMMYT International Maize and Wheat Improvement Center
cM centiMorgan
DArT Diversity Array Technology
DSS Disease Severity Score
DZARC Debre Zeit Agricultural Research Center
DZm Debre Zeit main season
DZo Debre Zeit off season
FDR False Discovery Rate
GWA Genome Wide Association
GLM General Linear Model
HR Hypersensitivity Reaction
ICARDA International Center for Agricultural Research in the Dry Areas
IT Infection Type
MAS Marker Assisted Selection
LD Linkage Disequilibrium
MLM Multiple Linear Model
NTSYS Numerical Taxonomy and Multivariate Analysis System
Pgt Puccinia graminis f sp tritici
QTL Quantitative Trait Loci
RIL Recombinant Inbred Line
SNP Single Nucleotide Polymorphism
SSR Simple Sequence Repeat
Sr Stem rust resistance
STS Sequence Tagged Site
TASSEL Trait Analysis by aSSociation Evolution and Linkage
UPGMA Unweighted pair group method with arithmetic average
2
ACKNOWLEDGMENTS
I would like to express my sincerest gratitude appreciation and special thanks to
various institutes and individuals who were involved during the course of my PhD
studies and research at the University of Bologna
First of all I would like to thank my supervisor Prof Roberto Tuberosa for accepting
me as his student for his keen interest most valuable and inspiring guidance constant
criticism throughout the research work and preparation of manuscripts and this
dissertation In general without his help the thesis would not have been possible to
present by now I have learned not only science but also the attitude of doing science
from him I always say thank you very much Prof Tuberosa for your unreserved and
unflagging help
I owe my profound thanks to my assistant supervisor Prof Maria Corinna Sanguneti
and Dr Marco Maccaferri for their availability to discuss result their valuable
suggestiions and their unfailing help during the course of the research In particular I
would like to thank Prof Maria Corinna Sanguneti for her personal kindness and the
immediate solutions to my administrative-related requests I am thankful to Dr Silvio
Salvi for helping me to be my official tutor at the Department of Agricultural Sciences
(DipSA) and being willing to discuss any of my questions or ideas It is also my
pleasure to thank Kay Stuart for her kindness encouragement and support during my
study period I express my cordial thanks to all my labmates in the laboratory of Prof
Tuberosa for helping me in many ways during my studies
I would like to thank Dr Ayele Badebo for all his technical help during the fieldwork
and scientific inputs encouragement and support throughout the duration of my study
I would also like to thank Dr Karim Ammar Dr Yue Jin and Dr Pablo Olivera for
all their suggestions and valuable inputs to improve the manuscripts generated from
this study In all without their active support guidance and encouragement this
dissertation would not have been possible
The financial support provided through Monsantorsquos Beachell-Borlaug International
scholarship by Monsanto to cover all my expenses for three years and Oromia
3
Agricultural Research Institute who covered my salary for completing my research
during the last six months and also giving me leave of absence and helping me in
some logistics for my study is gratefully acknowledged My sincerest thanks also
extend to Prof Ed Runge coordinator of the Monsantorsquos Beachell-Borlaug
International Scholarship for smooth communication and excellent guidance to my
scholarship related cases
It is my pleasure also to convey my appreciation for Dr Bedada Girma Dr Bekele
Abeyou Dr Firdisa Eticha Tafa Jobie Tadele Tadesse and Genene Gezu for their
contributions in my study in various ways and friendship During my PhD research
many experiments have been carried out both in the laboratory and in the field I am
grateful for the technical help and support provided to me by Tilahun Bayisa Ayalneh
Tilahun Mohammed Abinasa Tamiru Tadesse Wubshet Alemu Tesfaye Tadesse
Habtamu Tadesse Debele Tsegaye Habtamu Goro Siraj Defo Gezahegn Tadesse
and Gosaye Gizawu at Sinana and Gebre Behailu Ketema Betelhem Haregua at
Debre Zeit
Thanks to Dr Zeleke Eresso his friendly heart is always happy to help new students
when they have problems in Bologna I am full of gratitude to him and his family for
the assistance and help they gave to me His friendship to me contributed to make my
stay in Bologna memorable
I cannot eschew to express my wholehearted sense of reverence to my beloved wife
and family members who were instrumental in providing this opportunity for building
up my educational carrier encouragement and inspiration throughout the study I
would like to thank my family particularly my wife Etifwork Tadesse for her
constant love and support to help me walk through a lot of frustrations in the past few
years I would like to thank you truly for taking care of our kids in place of me I
could not have made it to the end without her Furthermore I would like to be in awe
of my son and daughter Abel and Ruth for refreshing me from my tiresome research
work with their sweet smile and affectionate cuddle
At last but not least I would be remiss if I did not thank my God There were many
times that I called on his name for help comfort and guidance he was always right at
my side
4
SUMMARY
Diseases are the main factors that cause yield loss in wheat and are best controlled
through the development of resistant cultivars Puccinia graminis f sp tritici the
causative agent of stem rust in wheat is known to rapidly evolve new virulence to
resistance genes While more than 50 stem rust resistance (Sr) loci have been
identified in wheat only a few remain effective particularly against the highly
virulent Ug99 (TTKSK) race and a mixture of durum-specific races An association
mapping (AM) approach based on 183 diverse durum wheat accessions was utilized
to identify resistance loci for stem rust response in Ethiopia over four evaluation
seasons by artificial inoculating with Ug99 and a mixture of durum-specific races
under field conditions as well as in the greenhouse test at the seedling growth stage
under controlled conditions for resistance to four highly virulent stem rust races
TRTTF TTTTF TTKSK (Ug99) and JRCQC The panel was profiled with simple
sequence repeat diversity array technology and sequence tagged site markers (1253
markers) Five subpopulations mostly comprised of lines of individual breeding
programs were identified LD decayed across a range between 5 to 10 cM as
determined by the pairwise r2 (squared value of the correlation coefficient between
two loci) method AM using the MLM method was then conducted to reveal the
genetic architecture of stem rust resistance in durum wheat breeding germplasm The
results under field conditions showed the oligogenic basis of resistance with 12 QTL-
tagging markers that were significant (P lt 005) across three to four seasons and with
R2 values from 11 to 113 Twenty-four additional single markerQTL regions were
found to be significant over two seasons The AM results confirmed the role of Sr13
previously described in bi-parental mapping studies and the role of chromosome
regions putatively harboring Sr9 Sr14 Sr17 and Sr28 Additionally 13 single
markerQTL regions were located in chromosome regions where no Sr genesQTLs
have been previously reported
The results under controlled conditions showed that 15 20 19 and 19 chromosome
regions harbored markers that showed significant effects for races TRTTF TTTTF
TTKSK and JRCQC respectively These genomic regions showed marker R2 values
ranging from 113 to 834 192 to 1764 175 to 2312 and 151 to 1533 for races
TRTTF TTTTF TTKSK and JRCQC respectively The study demonstrates that stem
5
rust resistance in durum wheat is governed in part by shared loci and in part by race-
specific ones The QTLs identified in this study through AM will be useful in the
marker-assisted development of durum wheat cultivars with durable stem rust
resistance
6
CHAPTER 1 INTRODUCTION
11 DURUM WHEAT IMPORTANCE AND FUTURE PERSPECTIVES
Durum wheat (Triticum turgidum L var durum 2n = 4x = 28 AABB genomes) is an
important crop mainly used for human consumption Recently this cereal has been
the object of renewed interest because of its valuable production and adaptation to
low rainfall and semi-arid environments More than half of the durum acreage lies in
the Mediterranean Basin mainly Italy Spain France Greece and the West Asian and
North African (WANA) countries where through history this cereal has received
special attention as an important commodity (Royo et al 2000) In Ethiopia about
60 of the wheat area is currently covered by bread wheat and 40 by durum wheat
(Badebo et al 2009) However the estimate for 1967 indicated that about 15 of the
wheat area was covered by bread wheat and 85 by durum wheat (Hailu 1991) In
Ethiopia durum wheat is traditionally grown by smallholder farmers on heavy black
clay soils (vertisol) of the highlands at altitude ranging from 1800-2800 m above sea
level exclusively under rain-fed agriculture (Tesfaye and Getachew 1991) Owing to
its long history of cultivation by farmers in varied agrosystems of the country
Ethiopia has an amazing wealth of genetic variability for different desirable economic
traits including disease resistance that can be utilized for improving the quality and
productivity of durum wheat Importantly Ethiopia is also recognized as one of the
Vavilovian centres of genetic diversity for this crop (Vavilov 1951)
In Ethiopia durum wheat is mainly utilized for the preparation of local traditional
recipes such as dabo (Ethiopian bread) injera (thin flattened bread) kolo (roasted
grain) nifro (boiled whole grain sometimes mixed with pulses) and kinche (crushed
kernels cooked with milk or water and mixed with spiced butter) and to some extent
for manufacturing of different pasta products (Solomon et al 2006) However in
view of the current rapidly growing rate of urbanization coupled with the increased
expansion of existing as well as newly emerging food processing industries durum
wheat products such as macaroni and spaghetti are highly demanded in the local
markets and have become an important part of the daily diet in the urban and peri-
urban areas of Ethiopia Importantly almost all local pasta manufacturers depend on
imported durum wheat At present the demand for imported durum is showing a
7
rising trend and annually the local pasta factories import thousands of tons of durum
wheat from abroad thus requiring tens of millions of dollars in foreign exchange The
rapidly increasing demand for more durum wheat both in global and domestic
markets combined with the availability of proven technologies and practices in the
country offer an excellent opportunity for commercialization of the crop so that the
Ethiopian smallholder farmers can significantly participate in the production of high
quality durum wheat to improve their income and livelihood (Newai 2006)
12 WHEAT STEM RUST HISTORICAL AND CONTEMPORARY
SIGNIFICANCE
Wheat stem rust caused by Puccinia graminis f sp tritici is the most destructive of
all the wheat rust pathogens due to its ability to decimate a healthy wheat crop late in
the season and is capable of causing up to 100 yield loss from lodging and by
damaging the stem of the plant as shown in Figure 1 and disrupting water and
photosynthate movement (Roelfs et al 1992) For as long as agrarian societies have
cultivated wheat stem rust has been a threat to food security The Bible refers to rust
epidemics as punishments on the Israelites from God for their sins (Chester 1946)
Around 700 AD the Roman festival of Robigalia was celebrated annually to pacify
the rust god Rubigus to ensure a healthy crop (Chester 1946 Peterson 2001)
During the last century stem rust has caused major epidemics in all wheat-producing
countries In the 1940rsquos and 1950rsquos China experienced major stem rust epidemics due
to higher than average temperatures and rainfall leading to ideal conditions for the
pathogen that flourishes under high temperature and moisture (Roelfs and Martens
1987) Severe epidemics took place in North America in the first half of the 20th
century (Roelfs and Bushnell 1985 Hodson 2011) In North America the spring
wheat-growing regions are most affected by stem rust epidemics causing yield losses
up to 50 (Leonard 2001)
Stem rust is potentially the most destructive of the three wheat rusts which include
stem (black) stripe (yellow) and leaf (brown) rusts Stripe rust epidemics have been
more frequent and widespread in recent years and under severe epidemics yield
losses are generally higher than usually recorded in large-scale production statistics
8
because the cool and wet conditions favorable for disease development are also
favorable for wheat productivity Stem rust in contrast is a biological firestorm with
the potential to completely devastate an otherwise healthy crop just three weeks
before harvest (Singh et al 2006 Herrera-Foessel et al 2011) at warmer temperatures
less conducive for wheat productivity It is arguably the most feared disease of wheat
on all continents where wheat is grown
In Ethiopia where over 30 fungal diseases of wheat have been identified stem rust is
a major production constraint in most wheat-growing areas of the country and causes
up to 100 yield loss in epidemic outbreaks (Figure 1 Admassu et al 2004) The
country also considered as one of the hot spot areas for the development of the present
wheat stem rust complex (Leppik 1970) The disease has become a major threat of
wheat production after the epidemics of 1974 and 1993 that drove out of production
the two bread wheat (Triticum aestivum L) varieties lsquoLacketchrsquo and lsquoEnkoyrsquo
(Badebo 2002 Beteselassie et al 2007) The discovery of the Ug99 race with
virulence to Sr31 in Uganda in 1999 (Pretorius et al 2000) represented a real threat to
wheat production in the world including Ethiopia where stem rust epidemics had not
occurred since the resistant cultivar Enkoy lost its resistance in 1993 (Badebo 2002)
Since the first report in Uganda race Ug99 has been detected in other parts of East
Africa (Singh et al 2006) and beyond in Yemen (Global Rust Initiative 2007) and
Iran (SeedQuest 2008) In Ethiopia Ug99 was first detected in 2003 at six dispersed
sites (Singh et al 2006) It was more dominant in the Southeast and Central parts of
the country than in Northwest Ethiopia Therefore Ug99 is a real threat to wheat
growers of Ethiopia requiring very close attention
13 MOLECULAR MARKERS AND THEIR USE IN BREEDING FOR DISEASE
RESISTANCE IN WHEAT
DNA-based molecular markers have several advantages over the traditional
phenotypic selection and their potential benefits as marker-assisted selection (MAS)
have been widely discussed (Melchinger 1990 Paterson et al 1991 Young 1996
Mohan et al 1997 Anderson 2003 Varshney and Tuberosa 2007) especially to
provide solutions to overcome some of the problems faced by classical phenotypic
screening approaches in plant breeding programs Molecular markers can be used to
9
tag rust resistance genes and further their use can serve for the improvement of the
efficiency of selection in plant breeding by MAS Marker-assisted selection can be
used at an early stage of plant development when multiple DNA markers are used to
screen a segregating population for one or more genes simultaneously
Even though single-gene resistance may be overcome by rapidly evolving races the
use of resistant cultivars is still the most effective and economical method of reducing
yield losses due to stem rust (McIntosh 1988) One way to increase the durability of
stem rust resistance genes is to pyramid several Sr genes to increase broad-spectrum
resistance to several races (Pederson and Leath 1988 Admasu et al 2011) With
conventional methods in wheat breeding programs the continuous pyramiding of
genes in a single genotype will become difficult or even impossible when one or more
genes in the background are effective against many races of the pathogen and also
when different resistance genes produce similar infection types In this case
identification of molecular markers linked to disease resistance genes facilitates MAS
for pyramiding resistant alleles (Sharp et al 2001 Babu et al 2004 Haile et al 2012
Miedaner and Korzun 2012)
To date more than 50 stem rust resistance (Sr) genes have been identified against
different races of stem rust fungus (McIntosh et al 2003 2008) and molecular
markers are available for some of them such as Sr2 (Mago et al 2011) Sr13
(Admassu et al 2011 Simons et al 2011) Sr22 (Olson et al 2010 Periyannan et al
2011) Sr25 (Liu et al 2010) Sr26 (Liu et al 2010) Sr32 (Bariana et al 2001) Sr33
(Sambasivam et al 2008) Sr35 (Zhang et al 2010) Sr39 (Mago et al 2009 Niu et al
2011) Sr40 (Wu et al 2009) Sr44 (Liu et al 2012) Sr45 (Sambasivam et al 2008)
Sr47 (Faris et al 2008) Sr50 (Anugrahwati et al 2008) Sr51 (Liu et al 2011a) Sr52
(Qi et al 2011) Sr53 (Liu et al 2011b) SrCad (Hiebert et al 2011) Sr57(synonym
Lr34Yr18) (Pumphrey et al 2012) and SrWeb (Hiebert et al 2010) Although some
of the markers have been used in MAS some of them are not diagnostic and require
improvement
10
14 OVERVIEW OF ASSOCIATION MAPPING IN PLANTS
Elucidating the genetic basis of beneficial traits is the fundamental aim of many
studies involving crop plants Surprisingly relatively little is known about the genetic
architecture of several key traits (Mackay et al 2009) particularly those
quantitatively inherited This notwithstanding the introduction of genomics
approaches now allows for an accurate dissection of the genetic basis of quantitative
traits (Tuberosa et al 2002 Semagn et al 2010 Liu et al 2012) There are two
quantitative genetic approaches that are mainly used to identify associations between
a genotype and phenotype One of those is linkage mapping or linkage analysis This
method is based on the co-segregation of marker alleles with phenotypic observations
on families of a segregating population to identify quantitative trait loci (QTLs) that
contain causal variants In a linkage or bi-parental mapping population the studied
progeny are usually just a few generations away from the two common ancestors
which results in high linkage disequilibrium (LD) ie the non-random association of
alleles between two loci (Rafalski 2002) Thus even rather distant markers are found
to co-segregate with the causal variant Although linkage mapping has proven
successful in identifying QTL for hundreds of traits in many plant species (Mauricio
2001 Doerge 2002 Maccaferri et al 2008 2011 Mackay et al 2009 Pasam et al
2012) the identified QTL region can extend over several centiMorgans (cM) or more
and contains hundreds of genes making the identification of suitable candidates a
very difficult task Therefore beneficial QTL alleles introgressed via marker-assisted
selection are likely to suffer from linkage drag ie the hitchhiking of deleterious loci
with selected target loci In addition the construction of mapping populations of
recombinant inbred lines (RILs) through controlled crosses followed by several
generations of selfing is rather time-consuming which further limits the use of
linkage mapping
An alternative method for identifying loci (genes and QTLs) is association mapping
(AM) or LD mapping (Risch and Merikangas 1996) which seeks to identify specific
causal variants linked to phenotypic polymorphisms in populations of unrelated
genotypes much more diverse than those derived from biparental crosses
Consequently AM populations are usually many generations away from a common
ancestor Recombination events occurring throughout the evolutionary history of the
11
AM population contribute to the breakage of LD blocks within the genome
(Nachman 2002 Rafalski 2002) Thus LD decays much faster in AM populations
than linkage mapping populations AM can therefore achieve a higher resolution of
causal trait polymorphism than linkage mapping In addition to achieving higher
resolution mapping this method can also accommodate germplasm with broader
genetic variation (ie from breeding lines to landraces and even wild progenitors) and
allow for the mapping of many traits simultaneously Thus there is no need to
develop expensive and time-consuming biparental populations for each target trait
However because of the much reduced LD extent in AM populations compared to
linkage mapping populations a significantly greater number of genetic markers are
needed to cover the whole genome and perform a genome-wide association scan
(Nordborg and Weigel 2008 Neuman et al 2010) With the number of available
robust genetic markers such as SSRs and Single Nucleotide Polymorphisms (SNPs)
increasing and the cost of genotyping decreasing AM has become a more attractive
approach for revealing the genetic architecture of various traits in crop species
(Rafalski 2002 Oraguzie et al 2007 Zhu et al 2008 Ingvarsson and Street 2010
Maccaferri et al 2011) including also disease resistance in wheat (Maccaferri et al
2011 Liu et al 2012)
Generally association mapping includes six steps as outlined in Figure 2 (1) a
collection of diverse genotypes are selected that may include landraces elite
cultivars wild relatives and exotic accessions (2) a comprehensive and precise
phenotyping is performed over the traits such as yield stress tolerance or quality-
related traits of the selected genotypes in multiple replicates and yearsenvironments
(3) the genotypes are then scanned with suitable molecular markers (AFLP SSRs
SNPs) (4) population structure and kinships are determined to avoid false positives
followed by (5) quantification of LD extent using different statistics like D D or r2
Finally (6) genotypic and phenotyping data are correlated using appropriate statistical
software allowing tagging of molecular marker positioned in close proximity of
gene(s) underlying a specific trait Consequently the tagged gene can be mobilized
between different genotypes andor cloned and annotated for a precise biological
function
12
141 Linkage disequilibrium
In AM studies the hypothesis of interest is to test whether a marker is associated with
the phenotype of interest Despite a declared significant marker may or may not be
within the functional gene it is likely to be associated with the particular phenotype
because it is in LD with the functional gene (Rafalski 2002) LD is defined as the
non-random association of alleles at different loci (Weir 1979) In other words
alleles are co-inherited either more or less often than expected by chance Three of the
most common measures for describing LD are D Drsquo and r2 (Weir 1979 Jorde
2000) Pairwise LD measured by the value of D according to Lewontin (1964) is as
follows Assume two diallelic loci are linked and let Pij be the proportion of
chromosomes that have allele i at the first locus and allele j at the second locus For
example p12 is the frequency of the haplotype with allele 1 at the first locus and allele
2 at the second locus The disequilibrium coefficient D is the difference between the
observed haplotype frequency p12 and the haplotype frequency expected under linkage
equilibrium the latter being the product of the two allele frequencies ie p1 and p2 It
may be written as follows
D = p12 ndash (p1x p2)
A more commonly quoted measure of LD is Drsquo (Lewontin 1964) This is a
normalized form with a numerator equal to D and the denominator equal to the
absolute maximum D that could be achieved given the allele frequencies at the two
loci Drsquo can take values from -1 to +1 but in general its absolute value is presented
and discussed A value of 1 indicates the absence of recombination event whereas
values less than 1 indicate that two loci have been separated through recombination
Intermediate values of Drsquo may be difficult to interpret as the measure tends to be
inflated when sample size is small or allele frequencies are low The squared
correlation coefficient r2 is sometimes preferred to quantify and compare the amount
of LD between pairs of loci In particular r2 is determined by dividing Drsquo by the
product of the four allele frequencies When r2 = 1 two markers provide identical
information not only having Drsquo = 1 but also having equal allele frequencies The
main advantage of r2 is its inverse relationship with the sample size required to detect
genetic association between markers that are in complete LD (Pritchard and
Przeworski 2001) For instance if cases and controls have only been genotyped for
13
markers in the vicinity of a functional variant the sample size should be increased by
a factor 1r2 in order to achieve the same power as would have been achieved by
generating data at the susceptible locus itself However r2 is more sensitive to allele
frequencies that Drsquo and can be difficult to interpret when the two loci in question
differ in allele frequencies
LD can be influenced by many factors Mutation and recombination are the two main
ones impacting LD Mutation provides the raw material for generating LD between
two loci Recombination however is the main mechanism by which these ancestral
haplotypes are broken down and LD is reduced Because the recombination rate can
vary across a chromosome the extent of LD is also expected to vary in inverse
relation to the local recombination rate (Nachman 2002) Other factors that can
influence the LD extent include inbreeding small population size genetic isolation
between lineages population subdivision founder effects population admixture and
selection (Flint-Garcia and Thornsberry 2003 Oraguzie et al 2007)
The average extent of LD in a species determines the density of molecular markers
needed in AM If LD extends over a longer distance as for example in many self-
pollinated species such as barley (Malysheva-Otto et al 2006) and Arabidopsis
(Nordborg et al 2002) then fewer markers are needed to cover the entire genome On
the other hand if LD extends over a very short distance as in the out-crossing species
of maize (Remington et al 2001) many more markers are needed to cover the entire
genome In addition because of the uneven distribution of recombination hotspots in
both animal and plant systems (Lichten and Goldman 1995 Mezard 2006) LD will
not only vary in different species but also across different chromosomes in the same
species and even in different regions on the same chromosome (Nachman 2002
Rafalski and Morgante 2004) If the marker density is not sufficiently high the extent
of LD across the entire genome cannot be rigorously assessed and thus portions of
the genome will remain poorly described (Rafalski 2002) Thus understanding the
extent of LD both globally and locally in the studied population is necessary for the
interpretation of AM results
14
142 Population structure
Because of non-random mating isolation or artificial selection patterns exist more or
less in any plant population When population structure is present an association may
be found between a phenotype and one or more markers that have no physical linkage
to the causal variants (Ewens and Spielman 1995) Population structure results from
selection and high levels of admixture (individual accession membership proportion
found in multiple subpopulations) in a population and results in increased LD between
unlinked markers (Farnir et al 2000 Nordborg and Tavare 2002 Cardon and Palmer
2003 Rostoks et al 2006 Zhu et al 2008) The occurrence of such spurious
associations is due to different phenotype frequencies across subpopulations
Population structure is often used in genetic studies to summarize relationships
between individuals within and among populations and can provide insights into
evolutionary relationships The probability of a Type I error increases in AM studies
if the population structure is not appropriately accounted for (Flint-Garcia and
Thornsberry 2003 Gupta et al 2005 Maccaferri et al 2011 Letta et al 2013)
Several methods have been proposed for estimating population structure and
modelling population structure in AM studies including distance and model-based
methods (Pritchard et al 2000a Ahmad 2002 Lu et al 2005 Maccaferri et al 2005
Yu et al 2006 Camus-Kulandaivelu et al 2007 Peleg et al 2008) Distance-based
estimates of population structure are generally based on clustering of individuals
based on pair-wise genetic distance estimates between individuals (Nei 1972 Rogers
1972 Nei 1978 Maccaferri et al 2005) Although visually appealing distance-based
methods are not suitable for statistical inference (Pritchard et al 2000a) In contrast
model-based methods assign individuals probabilistically to one or more
subpopulations (Pritchard et al 2000a) The most common model-based approach is
Bayesian modelling where allele frequencies are used to estimate the likelihood of an
individual belonging to a particular subpopulation This approach allows assignment
of individuals to respective populations that can be integrated into statistical models to
account for population structure in AM studies (Pritchard et al 2000a) With Bayesian
modelling the number of subpopulations is usually estimated a priori Often known
relationships (pedigree origin of the individual) andor genetic distance methods are
used to estimate a realistic number of subpopulations for calculation of model-based
15
assignments (Liu et al 2003 2005 Agrama et al 2007 Chao et al 2007 Hai et al
2007) Hai et al (2007) found that when assigning population structure among 69
bread wheat accessions both methods led to similar assignments of individuals to
subpopulations Maccaferri et al (2005) reported similar findings in 183 durum
accessions In contrast distance- and model-based methods were conflicting in a
collection of US wheat cultivars and breeding lines with model-based assignments
detecting population structure missed by distance-based analysis (Chao et al 2007)
The software STRUCTURE (Pritchard et al 2000a) has been developed to account
for population structure (Pritchard et al 2000a) and has been implemented in AM
studies in a number of crop species including barley (Rostoks et al 2006) wheat
(Breseghello and Sorrells 2006 Crossa et al 2007 Tommasini et al 2007) durum
wheat (Maccaferri et al 2010) and rice (Agrama et al 2007) Structure utilizes a
Bayesian modelling approach to assign individuals to a subpopulation to minimize the
LD among unlinked markers among subpopulations Yu et al (2006) proposed a
unified mixed-model method to determine relatedness of samples in populations
resulting in a reduction in both Type I and Type II errors by combining population
structure (Q) with relative kinship (K) accounting for multiple levels of relatedness
In an association study by Zhao et al (2007) when used alone or when combined
with estimates of population structure inclusion of the kinship matrix resulted in a
reduced false-positive rate Pedigree information has been proposed as a means to
estimate K but factors such as missingincorrect pedigree information selection and
genetic drift can make interpretation of pedigree information difficult (Liu et al
2003)
Rare alleles (commonly defined as occurring at frequencies lower than 5-10)
(Tenaillon et al 2001 Barnaud et al 2006 Caldwell et al 2006 Ravel et al 2006a
Chao et al 2007 Rhoneacute et al 2007) inflate estimates of LD reducing statistical
power in AM studies (Wilson et al 2004 Maccaferri et al 2005 Crossa et al 2007
Somers et al 2007) The presence of rare alleles can also increase LD between
unlinked markers and increase the Type I error rate in AM studies Removal of rare
alleles or subsequently pooling rare alleles into their own class (Pritchard et al
2000a Pritchard et al 2000b Maccaferri et al 2005 Somers et al 2007) is a common
practice prior to conducting AM studies Tightly linked markers may result in
16
increased LD among unlinked markers and are best avoided when assessing structure
(Falush et al 2003)
Closely related individuals are more easily assigned to related populations which may
result in overestimating the number of subpopulations as a result of background LD
(Pritchard et al 2000a Falush et al 2003) which reduces the statistical power of AM
studies (Yu et al 2006) In addition Camus-Kulandaivelu et al (2007) noted that
assignment of individuals to subpopulations was variable when closely related
individuals were present in the AM population However removal of highly related
individuals to estimate the number of subpopulations has been suggested as an
approach to minimize overestimation of the number of subpopulations (Liu et al
2003 Breseghello and Sorrells 2006 Camus-Kulandaivelu et al 2007)
143 Approaches for association mapping
Recently several AM studies have been published on a variety of crops including
common wheat (Breseghello and Sorrells 2006 Ravel et al 2006b Roy et al 2006
Crossa et al 2007 Jing et al 2007 Tommasini et al 2007 Peng et al 2008 Liu et al
2012) barley (Kraakman et al 2004 Kraakman et al 2006 Rostoks et al 2006
Cockram et al 2008) potato (Solanum tuberosum L) (Malosetti et al 2007) maize
(Remington et al 2001 Wilson et al 2004 Weber et al 2007) rice (Agrama et al
2007) and durum wheat (Sanguineti et al 2007 Maccaferri et al 2010 2011)
Several studies provided support for the potential of AM with a number of the
associations identified in their study in QTL regions previously identified through
linkage analysis in barley (Kraakman et al 2006) and wheat (Crossa et al 2007 Jing
et al 2007 Tommasini et al 2007 Yu et al 2012) Two approaches are used for AM
studies whole-genome scans and candidate gene analysis (Thornsberry et al 2001
Rafalski 2002 Kraakman et al 2004 Rostoks et al 2006 Pasam et al 2012)
1431 Genome-wide association mapping
Genome-wide association (GWA) mapping also known as whole genome scanning
approach is a comprehensive approach in which genotyping is done for all possible
genetic markers across the genome to systematically search the genome for causal
17
genetic variation affecting the target trait(s) (Hirschhorn and Daly 2005) GWA
identifies genomic regions throughout the genome associated with the trait of interest
A large number of markers are tested for association with various complex traits and
prior information regarding candidate genes is not required For many traits such
prior knowledge may not exist or may be very vague thus for these cases genome-
wide AM is often used in association studies The first association study to attempt a
genome scan in plants was conducted in wild beet (Beta vulgaris ssp maritima) for
the requirement of vernalization prior to bolting a feature determined by a single gene
(Hansen et al 2001)
The basis of genome-wide AM is to genotype a sufficient number of markers across
the genome so the causal variants (ie the underlying gene(s) that control the trait)
will likely be in LD with at least one marker This approach is favoured in situations
where LD extends for large distances allowing for potential candidate regions
associated with a trait of interest to be identified for further study (Remington et al
2001) The extent of LD therefore is a critical factor in determining the number of
markers needed to cover the genome and the mapping resolution that can be achieved
Association studies with high-density marker coverage large sample size and
minimum population structure offer great promise in complex trait dissection To
date candidate-gene association studies have searched only a tiny fraction of the
genome The debate of candidate genes versus genome scans traces back to the
original milestone paper of Risch and Merikangas (1996) As genomic technologies
continue to evolve more genome-wide association analyses conducted in different
plant species are expected
1432 Candidate gene association mapping
A candidate gene is a coding sequence located in a chromosome region suspected of
being involved in the expression of a trait whose protein product suggests that it could
be the gene in question Although the candidate gene approach has in some cases led
to the identification of a few causal genes (Werner et al 2005 Harjes et al 2008
Zheng et al 2008 Ramsay et al 2011) It relies on some prior knowledge about the
gene location and function Candidate genes are selected based on prior knowledge of
mutational analysis biochemical pathway or linkage and genome-wide association
18
analysis of the trait of interest However this low-cost hypothesis-driven and trait-
specific approach will inevitably miss the role of other unknown non-coding loci that
may actually be the primary cause of the observed phenotypic variability (Zhu et al
2008) A remarkable example for this is provided by the work of Salvi et al (2007)
with Vgt1 a major QTL in maize that controls the transition from the vegetative to the
reproductive stage ie flowering time The candidate gene approach directly tests the
effects of genetic variants of a gene that may affect a particular trait However the
candidate gene approach is limited by existing knowledge about the biology of the
trait of interest and the genes underlying the QTL interval This notwithstanding the
candidate gene approach is useful for quickly determining the association of a genetic
variant with a trait and also for identifying genes of modest effect Additionally the
increased availability of well-annotated genomes and the drastic reduction in
sequencing costs are expected to facilitate the adoption of the candidate gene
approach in future studies aimed to identify the loci governing the variability in traits
of breeding interest
Association analysis has the potential to identify the single polymorphism within a
gene that is responsible for the differences in the phenotype In addition many plant
species have a high level of diversity for which association approaches are well suited
to evaluate the numerous alleles available (Flint-Garcia and Thornsberry 2003)
Several studies showed the use of this approach to identify causal molecular
polymorphism responsible for several traits As an example SNPs in dwarf8 were
evaluated for association with flowering time and plant height in 92 maize inbred
lines (Thornsberry et al 2001) nine polymorphisms including a miniature
transposable element (MITE) insertion in the promoter were associated with
flowering time (Thornsberry et al 2001) and this gene has since been validated as a
causal factor influencing flowering time in maize (Andersen et al 2005) In maize
molecular differences at Y1 were associated with phenotypic variation in grain
carotenoid concentration (Palaisa et al 2003) and this gene has since been identified
as the causal factor for elevated carotenoids in maize However the association of
SNPs with a trait still requires validation as the SNP could be in disequilibrium with
the causal factor particularly if LD is high in the genomic region surrounding the
gene Thus candidate gene approaches are generally utilized to eliminate putative
candidates from more detailed functional studies
19
15 LITERATURE CITED
Admassu B Emebet F Zerihun K (2004) Physiological races and virulence diversity
of Puccinia graminis f sp tritici on wheat in Ethiopia In 12th
regional wheat
workshop for Eastern Central and Southern Africa Nakuru Kenya 22-26
November 2004 pp 145-150
Admassu B Perovic D Friedt W Ordon F (2011) Genetic mapping of the stem rust
(Puccinia graminis f sp tritici Eriks amp E Henn) resistance gene Sr13 in
wheat (Triticum aestivum L) Theor Appl Genet 122 643-648
Ahmad M (2002) Assessment of genomic diversity among wheat genotypes as
determined by simple sequence repeats Genome 45 646-651
Agrama HA Eizenga GC Yan W (2007) Association mapping of yield and its
components in rice cultivars Mol Breed 19 341-356
Al-Maskri AY Sajjad M Khan SH (2012) Association mapping a step forward to
discovering new alleles for crop improvement Int J Agric Biol 14 153-160
Andersen JR Schrag T Melchinger AE Zein I Luumlbberstedt T (2005) Validation of
Dwarf8 polymorphisms associated with flowering time in elite European
inbred lines of maize (Zea mays L) Theor Appl Genet 111 206-217
Anderson JA (2003) Plant genomics and its impact on wheat breeding In Plant
molecular breeding (HJNewbury Ed) Blackwell Pub Boca Raton 184-215
Anugrahwati DR Shepherd KW Verlin DC Zhang P Mirzaghaderi G Walker E
Francki MG Dundas IS (2008) Isolation of wheat-rye 1RS recombinants that
break the linkage between the stem rust resistance gene SrR and secalin
Genome 51 341-349
Babu RC Shanmugasundaram P Chezhian P Jeyaprakash P Balasubramanian P
Chararerk V Pathan MS Babu V Nguyen HT (2004) Mapping quantitative
trait loci for drought tolerance in rice comparison across environments
genetic backgrounds and validation In Poland D Sawkins JM Ribaut M
Hoisington D (Eds) Proceedings of a Workshop Held at Cuernavaca on
Resilient Crops for Water Limited Environments Mexico May 24-28
International Maize and Wheat Improvement Center Mexico pp 204-205
Badebo Ayele (2002) Breeding Bread Wheat with Multiple Disease Resistance and
High Yield for the Ethiopian Highlands Broadening the Genetic Basis of
Yellow Rust and Tan Spot Resistance Goettingen Germany Goettingen
20
University PhD thesis
Badebo A Gelalcha S Ammar K Nachit M Abdalla O (2009) Durum wheat research
in Ethiopia In Proceedings of the 2009 BGRI Technical Workshop
CIMMYT Cd Obregon Sonora Mexico March 17-20 2009 pp 28
Bariana HS Hayden MJ Ahmed NU Bell JA Sharp PJ McIntosh RA (2001)
Mapping of durable adult plant and seedling resistances to stripe rust and stem
rust diseases in wheat Aust J Agric Res 52 1247-1255
Barnaud A Lacombe T Doligez A (2006) Linkage disequilibrium in cultivated
grapevine Vitis vinifera L Theor Appl Genet 112 708-716
Beteselassie N Fininsa C Badebo A (2007) Sources of resistance to stem rust
(Puccinia graminis f sp tritici) in Ethiopian tetraploid wheat accessions
Genet Resour Crop Evol 54337-343
Breseghello F and Sorrells ME (2006) Association mapping of kernel size and milling
quality in wheat (Triticum aestivum L) cultivars Genetics 172 1165-1177
Caldwell KS Russell J Langridge P Powell W (2006) Extreme population-dependent
linkage disequilibrium detected in an inbreeding plant species Hordeum
vulgare Genetics 172 557-567
Camus-Kulandaivelu L Veyrieras JB Gouesnard B Charcosset A Manicacci D
(2007) Evaluating the Reliability of Structure Outputs in Case of Relatedness
between Individuals Crop Science 47 887-892
Cardon LR Palmer LJ (2003) Population stratification and spurious allelic
association The Lancet 361 598-604
Chao S Zhang W Dubcovsky J Sorrells M (2007) Evaluation of Genetic Diversity
and Genome-wide linkage disequilibrium among US wheat (Triticum aestivum
L) germplasm representing different market classes Crop Science 47 1018-
1030
Chester K (1946) The nature and prevention of the cereal rusts as exemplified in the
leaf rust of wheat Chronica Botanica Co Waltham MA
Cockram J White J Leigh FJ Lea VJ Chiapparino E Laurie DA Mackay IJ Powell
W OSullivan DM (2008) Association mapping of partitioning loci in barley
BMC Genetics 9 16
Crossa J Burguentildeo J Dreisigacker S Vargas M Herrera-Foessel SA Lillemo M
Singh RP Trethowan R Warburton M Franco J Reynolds M Crouch JH and
Ortiz R (2007) Association analysis of historical bread wheat germplasm
21
additive genetic covariance of relatives and population structure Genetics 177
1889-1913
Doerge RW (2002) Mapping and analysis of quantitative trait loci in experimental
populations Nat Rev Genet 3 43-52
Ewens WJ Spielman RS (1995) The transmissiondisequilibrium test history
subdivision and admixture Am J Hum Genet 57 455-464
Falush D Stephens M Pritchard JK (2003) Inference of population structure using
multilocus genotype data Linked loci and correlated allele frequencies
Genetics 1641567-1587
Faris JD Xu SS Cai X Friesen TL Jin Y (2008) Molecular and cytogenetic
characterization of a durum wheat-Aegilops speltoides chromosome
translocation conferring resistance to stem rust Chromosome Res 16 1097-
1105
Farnir F Coppieters W Arranz JJ Berzi P Cambisano N Grisart B Karim L Marcq
F Moreau L Mni M Nezer C Simon P Vanmanshoven P Wagenaar D
Georges M (2000) Extensive Genome-wide Linkage Disequilibrium in Cattle
Genome Research 10 220-227
Flint-Garcia SA Thornsberry JM Buckler ES (2003) Structure of linkage
disequilibrium in plants Annu Rev Plant Biol 54 357-374
Global Rust Initiative (2007) Dangerous Wheat Disease Jumps Red Sea http www
eurekalert org pub_releases2007-01imaw-dwd011607php
Gupta PK Rustgi S Kulwal PL (2005) Linkage disequilibrium and association
studies in higher plants present status and future prospects Plant Mol Biol
57 461-485
Hai L Wagner C Friedt W (2007) Quantitative structure analysis of genetic diversity
among spring bread wheats (Triticum aestivum L) from different geographical
regions Genetica 130 213-225
Haile JK (2012) Genetic mapping of resistance to race Ug99 of Puccinia graminis f
sp tritici diversity analysis and identification of stem rust resistance genes in
Ethiopian tetraploid wheats PhD thesis Kassel University Germany
Hailu Gebre-Mariam (1991) Wheat production and research in Ethiopia In Hailu
GebreMariam DG Tanner and Mengistu Hulluka (eds) lsquoWheat Research in
Ethiopia A historical perspectiversquo IARCIMMYT Addis Ababa Ethiopia
Harjes CE Rocheford TR Bai L Brutnell TP Kandianis CB Sowinski SG Stapleton
22
AE Vallabhaneni R Williams M Wurtzel ET Yan J Buckler ES (2008)
Natural genetic variation in lycopene epsilon cyclase tapped for maize
biofortification Science 319330-333
Herrera-Foessel SA Lagudah ES Huerta-Espino J Hayden MJ Bariana HS et al
(2011) New slow rusting leaf rust and stripe rust resistance genes Lr67 and
Yr46 in wheat are pleiotropic or closely linked Theor Appl Genet 122 239-
49
Hiebert CW Fetch TG Zegeye T (2010) Genetics and mapping of stem rust resistance
to Ug99 in the wheat cultivar Webster Theor Appl Genet 12165-69
Hiebert CW Fetch TG Zegeye T Thomas JB Somers DJ Humphreys DG
McCallum BD Cloutier S Singh D Knott DR (2011) Genetics and mapping
of seedling resistance to Ug99 stem rust in Canadian wheat cultivars `Peacersquo
and `AC Cadillac Theor Appl Genet 122 143-149
Hirschhorn JN Daly MJ (2005) Genome wide association studies for common
diseases and complex traits Nat Rev Genet 6 95-108
Hodson D (2011) Shifting boundaries challenges for rust monitoring Euphytica 179
93-104
Ingvarsson PK Street NR (2011) Association genetics of complex traits in
plants New Phytol 189 909 PK Street NR 922
Jing HC Kornyukhin D Kanyuka K Orford S Zlatska A Mitrofanova OP Koebner
R and Hammond-Kosack K (2007) Identification of variation in adaptively
important traits and genome-wide analysis of trait-marker associations in
Triticum monococcum J Exp Bot 58 3749-3764
Jorde LB Watkins WS Kere J Nyman D Eriksson AW (2000) Gene mapping in
isolated populations New roles for old friends Hum Hered 50 57-65
Kraakman ATW Niks RE Van den Berg PMM Stam P Van Eeuwijk FA (2004)
Linkage Disequilibrium Mapping of Yield and Yield Stability in Modern
Spring Barley Cultivars Genetics 168 435-446
Kraakman ATW Martinez F Mussiraliev B Eeuwijk FA Niks RE (2006) Linkage
disequilibrium mapping of morphological resistance and other agronomically
relevant traits in modern spring barley cultivars Mol Breed 1741-58
Leonard K (2001) Stem Rust- Future Enemy In Peterson P (ed) Stem Rust of
Wheat Ancient Enemy to Modern FoeThe American Phytopathological
Society St Paul MN pp 1-11
23
Leppik EE (1970) Gene centers of plants as sources of resistance Annu Rev
Phytopathol 8 323-344
Letta T Maccaferri M Badebo A Ammar K Ricci A Crossa J Tuberosa R (2013)
Searching for novel sources of field resistance to Ug99 and Ethiopian stem
rust races in durum wheat via association mapping Theor Appl Genet DOI
101007s00122-013-2050-8
Lewontin RC (1964) The interaction of selection and linkage I General
considerations heterotic models Genetics 49 49-67
Lichten M Goldman AS (1955) Meiotic recombination hotspots Annu Rev Genet
29 423-444
Liu K Goodman M Muse S Smith JS Buckler E Doebley J (2003) Genetic
Structure and Diversity Among Maize Inbred Lines as Inferred from DNA
Microsatellites Genetics 165 2117-2128
Liu S Yu L-X Singh RP Jin Y Sorrells ME Anderson JA (2010) Diagnostic and co-
dominant PCR markers for wheat stem rust resistance genes Sr25 and Sr26
Theor Appl Genet 120 691-697
Liu W Jin Y Rouse M Friebe B Gill B Pumphrey MO (2011a) Development and
characterization of wheat-Ae searsii Robertsonian translocations and a
recombinant chromosome conferring resistance to stem rust Theor Appl
Genet 122 537-45
Liu W Rouse M Friebe B Jin Y Gill B and Pumphrey MO (2011b) Discovery and
molecular mapping of a new gene conferring resistance to stem rust Sr53
derived from Aegilops geniculata and characterization of spontaneous
translocation stocks with reduced alien chromatin Chromosome Research 19
669-682
Liu WX Danivola TV Rouse MN Bowden RL Friebe B Gill BS Pumphrey MO
(2013) Development and characterization of a compensating wheat-
Thinopyrum intermedium Robertsonian translocation with Sr44 resistance to
stem rust (Ug99) Theor Appl Genet (In press)
Lu H Redus MA Coburn JR Rutger JN McCouch SR and Tai TH (2005) Population
Structure and Breeding Patterns of 145 US Rice Cultivars Based on SSR
Marker Analysis Crop Science 45 66-76
Maccaferri M Sanguineti MC Noli E Tuberosa R (2005) Population structure and
long-range linkage disequilibrium in a durum wheat elite collection Mol
24
Breed 15 271-289
Maccaferri M Sanguineti MC Corneti S Ortega JLA Ben Salem M Bort J
DeAmbrogio E del Moral LFG Demontis A El-Ahmed A Maalouf F
Machlab H Martos V Moragues M Motawaj J Nachit M Nserallah N
Ouabbou H Royo C Slama A Tuberosa R (2008) Quantitative trait loci for
grain yield and adaptation of durum wheat (Triticum durum Desf) across a
wide range of water availability Genetics 178 489-511
Maccaferri M Sanguineti MC Mantovani P Demontis A Massi A Ammar K
Kolmer J Czembor J Ezrati S Tuberosa R (2010) Association mapping of
leaf rust response in durum wheat Mol Breed 26 189-228
Maccaferri M Sanguineti MC del Moral LFG Demontis A El-Ahmed A Maalouf F
Machlab H Martos V Moragues M Motawaj J Nachit M Nserallah N
Ouabbou H Royo C Slama A Tuberosa R (2011) Association mapping in
durum wheat grown across a broad range of water regimes and yield potential
J Exp Bot 62 409-438
Mackay TFC Stone EA Ayroles JF (2009) The genetics of quantitative traits
challenges and prospects Nature Reviews Genetics 10 565-677
Mago R Zhang P Bariana HS Verlin DC Bansal UK Ellis JG Dundas IS (2009)
Development of wheat lines carrying stem rust resistance gene Sr39 with
reduced Aegilops speltoides chromatin and simple PCR markers for marker-
assisted selection Theor Appl Genet 119 1441-1450
Mago R Lawrence GJ Ellis JG (2011) The application of DNA marker and doubled-
haploid technology for stacking multiple stem rust resistance genes in wheat
Mol Breed 27 329-335
Malosetti M van der Linden CG Vosman B van Eeuwijk FA (2007) A mixed-model
approach to association mapping using pedigree information with an
illustration of resistance to phytophthor infestans in potato Genetics 175
879-889
Malysheva-Otto LV Ganal MW Roumlder MS (2006) Analysis of molecular diversity
population structure and linkage disequilibrium in a worldwide survey of
cultivated barley germplasm (Hordeum vulgare L) BMC Genet 7 1-14
Mauricio R (2001) Mapping quantitative trait loci in plants Uses and caveats for
evolutionary biology Nature Reviews Genetics 2 370-381
McIntosh RA (1988) Catalogue of gene symbols for wheat Proc Int Wheat Genet
25
Symp 7th
pp 225-1323
McIntosh RA Yamazaki Y Devos KM Dubcovsky J Rogers WJ Appels R (2003)
Catalogue of gene symbols for wheat In Pogna NE Romano M Pogna A
Galterio G (eds) Proceedings of the 10th international wheat genetics
symposium Paestum Italy
McIntosh RA Yamazaki Y Dubcovsky J Rogers WJ Morris CF Somers D Appels
R Devos KM (2008) Catalogue of gene symbols for wheat Gene Symbols In
McIntosh RA (ed) httpwheatpwusdagovGG2TriticumwgcGene Symbolpdf
Melchinger AE (1990) Use of molecular markers in breeding for oligogenic disease
resistance Plant Breed 104 1-19
Meacutezard C (2006) Meiotic recombination hotspots in plants Biochem Soc Trans 34
531-534
Miedaner T Korzun V (2012) Marker-assisted selection for disease resistance in wheat and
barely breeding Phytopathology 102 560-566
Mohan M Nair S Bhagwat A Krishna TG Yano M Bhatia CR Sasaki T (1997)
Genome mapping molecular markers and marker assisted selection in crop
plants Mol Breed 3 87-93
Nachman MW (2002) Variation in recombination rate across the genome evidence
and implications Curr Op Genet Devel 12 657-663
Nei M (1972) Genetic Distance between Populations The American Naturalist 106
283-292
Nei M (1978) Estimation of Average Heterozygosity and Genetic Distance from a
Small Number of Individuals Genetics 89 583-590
Neumann K Kobiljski B Dencic S Varshney RK Borner A (2010) Genome wide
association mapping A case study in bread wheat (Triticum aestivum L) Mol
breed DOI 101007s11032-010-9411-7
Newai Gebre-ab (2006) Commercialization of smallholder agriculture in Ethiopia
Ethiopian Development Research Institute Addis Ababa 22pp
Niu Z Klindworth DL Friesen TL Chao S Jin Y Cai X Xu SS (2011) Targeted
introgression of a wheat stem rust resistance gene by DNA marker-assisted
chromosome engineering Genetics 187 1011-21
Nordborg M Tavare S (2002) Linkage disequilibrium What history has to tell us
Trends Genet 18 83-90
26
Nordborg M Borevitz JO Bergelson J Berry CC Chory J Hagenblad J Kreitman
M Maloof JN Noyes T Oefner PJ Stahl EA Weigel D (2002) The extent of
linkage disequilibrium in Arabidopsis thaliana Nature Genetics 30 190-193
Nordborg M Weigel D (2008) Next-generation genetics in plants Nature 456 720-
723
Olson EL Brown-Guedira G Marshall DS Jin Y Mergoum M Lowe I Dubcovsky J
(2010) Genotyping of US wheat germplasm for presence of stem rust
resistance genes Sr24 Sr36 and Sr1RSAmigo Crop Sci 50 668-675
Oraguzie NC Wilcox PL Rikkerink EHA Silva HN (2007) Linkage disequilibriumrdquo
In Oraguzie NC EHA Rikkerink SE Gardiner and HN De Silva (eds)
Association Mapping in Plants pp 11-39 Springer New York USA
Palaisa KA Morgante M Williams M Rafalski A (2003) Contrasting Effects of
Selection on Sequence Diversity and Linkage Disequilibrium at Two Phytoene
Synthase Loci The Plant Cell 15 1795-1806
Pasam RK Sharma R Malosetti M Eeuwijk F Haseneyer G Kilian B Garner A
(2012) Genome wide association studies for agronomical traits in a world wide
spring barely collection BMC Plant Biol 12 1-16
Paterson AH Tanksley SD Sorrells ME (1991) DNA markers in plant improvement
Adv Agron 46 39-90
Pederson WL Leath S (1988) Pyramiding major genes for resistance to maintain
residual effects Ann Rev Phytopathol 26 368-378
Peleg Z Fahima T Abbo S Krugman T Saranga Y (2008) Genetic structure of wild
emmer wheat populations as reflected by transcribed versus anonymous SSR
markers Genome 51 187-195
Peng JH Bai Y Haley SD Lapitan NLV (2008) Microsatellite-based molecular
diversity of bread wheat germplasm and association mapping of wheat
resistance to the Russian wheat aphid Genetica 135 95-122
Periyannan SK Bansal UK Bariana HS Pumphrey M Lagudah ES (2011) A robust
molecular marker for the detection of shortened introgressed segment carrying
the stem rust resistance gene Sr22 in common wheat Theor Appl Genet 122
1-7
Peterson P (2001) Stem rust of wheat From ancient enemy to modern foe APS Press
St Paul MN
Pretorius ZA Singh RP Wagoire WW Payne TS (2000) Detection of virulence to
27
wheat stem rust resistance gene Sr31 in Puccinia graminis f sp tritici in
Uganda Plant Dis 84 203
Pritchard JK Stephens M Donnelly P (2000a) Inference of population structure using
multilocus genotype data Genetics 155 945-959
Pritchard JK Stephens M Rosenberg NA Donnelly P (2000b) Association mapping
in structured populations Am J Hum Genet 67 170-181
Pritchard JK Przewprski M (2001) Linkage disequilibrium in humans models and
data Am J Hum Genet 69 1-14
Pumphrey MO (2012) Stocking the Breedersrsquos toolbox an update on the status of
resistance to stem rust in wheat In Proceedings of BGRI 2012 Technical
Workshop ed R McIntosh Beijing China September 1-4 pp 23-29
Qi LL Pumphrey MO Friebe B Zhang P Qian C Bowden RL Rouse MN Jin Y
Gill BS (2011) A novel Robertsonian translocation event leads to transfer of a
stem rust resistance gene (Sr52) effective against race Ug99 from Dasypyrum
villosum into bread wheat Theor Appl Genet 123 159-67
Rafalski A (2002) Applications of single nucleotide polymorphisms in crop genetics
Curr Opin Plant Biol 5 94
Rafalski A Morgante M (2004) Corn and humans recombination and linkage
disequilibrium in two genomes of similar size Trends Genet 2 103-111
Ramsay L Comadran J Druka A Marshall DF Thomas WTB et al (2011)
INTERMEDIUM-C a modifier of lateral spikelet fertility in barely is an
ortholog of the maize domestication gene TEOSINTE BRANCHED 1 Nat
Genet 43 169-173
Ravel C Praud S Murigneux A Canaguier A Sapet F Samson D Balfourier F
Dufour P Chalhoub B Brunel D Beckert M Charmet G (2006a) Single-
nucleotide polymorphism frequency in a set of selected lines of bread wheat
(Triticum aestivum L) Genome 49 1131-1139
Ravel C Praud S Murigneux A Linossier L Dardevet M Balfourier F Dufour P
Brunel D Charmet G (2006b) Identification of Glu-B1-1 as a candidate gene
for the quantity of high-molecular-weight glutenin in bread wheat (Triticum
aestivum L) by means of an association study Theor Appl Genet 112 738-
743
Remington DL Thornsberry JM Matsuoka Y Wilson LM Whitt SR Doebley J
Kresovich Goodman MM Buckler ES (2001) Structure of linkage
28
disequilibrium and phenotypic associations in the maize genome PNAS 98
11479 -11484
Rhoneacute B Raquin AL Goldringer I (2007) Strong linkage disequilibrium near the
selected Yr17 resistance gene in a wheat experimental population Theor Appl
Genet 114 787-802
Risch N Merikangas K (1996) The future of genetic studies of complex human
diseases Science 273 1516-1517
Roelfs A Bushnell W (Eds) (1985) Epidemiology in North America In The Cereal
Rusts Vol II Diseases Distribution Epidemiology and Control Academic
Press Orlando FL
Roelfs AP Martens JW (1987) An International System of Nomenclature for Puccinia
graminis fsp tritici Phytopathol 78 526-533
Roelfs AP Singh RP Saari EE (1992) Rust diseases of wheat concepts and methods
of disease management CIMMYT Mexico DF
Rogers JS (1972) Measures of genetic similarity and genetic distance Studies in
genetics VII Univ Texas Publ 7213 145-153
Rostoks N Ramsay L MacKenzie K Cardle L Bhat PR Roose ML Svensson JT
Stein N Varshney R K Marshall DF Graner A Close TJ Waugh R (2006)
Recent history of artificial outcrossing facilitates whole-genome association
mapping in elite inbred crop varieties PNAS 103 18656-18661
Royo C Di Fonzo N Nachit MM Araus JL (eds) (2000) Durum wheat improvement
in the Mediterranean region new challenges Proceedings of a Seminar
Zaragoza Spain 12-14 April 2000 Options-Mediterraneennes
Roy JK Bandopadhyay R Rustgi S Balyan HS Gupta PK (2006) Association
analysis of agronomically important traits using SSR SAMPL and AFLP
markers in bread wheat Current Sci 90 683-689
Salvi S Sponza G Morgante M Tomes D Niu X Fengler KA Meeley R Ananiev
EV Svitashev S Bruggemann E Li B Hainey CF Radovic S Zaina G
Rafalski JA Tingey SV Miao GH Phillips RL Tuberosa R (2007) Conserved
noncoding genomic sequences associated with a flowering-time quantitative
trait locus in maize PNAS 104 11376-11381
Sambasivam PK Bansal UK Hayden MJ Dvorak J Lagudah ES Bariana HS (2008)
Identification of markers linked with stem rust resistance genes Sr33 and Sr45
In Appels R Eastwood R Lagudah E Langridge P Mackay M McIntyre L
29
Sharp P (eds) Proceedings of 11th international wheat genetics symposium
Sydney University Press Sydney Australia pp 351-353
Sanguineti MC Li S Maccaferri M Corneti S Rotondo F Chiari T Tuberosa R
(2007) Genetic dissection of seminal root architecture in elite durum wheat
germplasm Annals of Applied Biology 151 291-305
SeedQuest (2008) Ug99 wheat killer detected in Iran ndashdangerous fungus on the move
from East Africa to the Middle East SeedQuest News [http wwwseedquest
comNews] releases 2008 march21996htm
Semagn K Bjornstad A Xu Y (2010) The genetic dissection of quantitative traits in
crops Electronic J Biotechnol 1-45
Sharp PJ Johnston S Brown G McIntosh RA Pellota M Carter M Bariana HS
Khatkar S Lagudah ES Singh RP Kairallah M Potter R Jones MGK (2001)
Validation of molecular markers for wheat breeding Aust J Agric Res 52
1357-1366
Simons K Abate Z Chao S Zhang W Rouse M Jin Y Elias E Dubcovsky J (2011)
Genetic mapping of stem rust resistance gene Sr13 in tetraploid wheat
(Triticum turgidum ssp durum L) Theor Appl Genet 122 649-658
Singh RP Hodson DP Jin Y Huerta-Espino J Kinyua MG Wanyera R Njau P Ward
RW (2006) Current status likely migration and strategies to mitigate the threat
to wheat production from race Ug99 (TTKS) of stem rust pathogen In CAB
reviews perspectives in agriculture veterinary science nutrition and natural
resources 1 No 054
Solomon A Bemnet G Sherif A Amha Y Jemanesh H Alemayehu Z and Bekele M
(2006) Commercialization of durum wheat Approaches in Technology
generation scaling up and marketing through partnership In Tsedeke A (ed)
rsquoSuccesses with value chainrsquo Proceedings of scaling up and scaling out
agricultural technologies in Ethiopia An international conference 9-11 May
2006 Addis Ababa Ethiopia pp 66-75
Somers DJ Banks T DePauw R Fox S Clarke J Pozniak C McCartney C (2007)
Genome-wide linkage disequilibrium analysis in bread wheat and durum
wheat Genome 50 557-567
Tenaillon MI Sawkins MC Long AD Gaut RL Doebley JF Gaut BS (2001) Patterns
of DNA sequence polymorphism along chromosome 1 of maize (Zea mays
ssp mays L) PNAS 98 9161-9166
30
Tesfaye T Getachew B (1991) Aspects of Ethiopian tetraploid wheats with emphasis
on durum wheat genetics and breeding In Hailu GebreMariam DG Tanner
and Mengistu Hulluka (eds) lsquoWheat Research in Ethiopia A historical
perspectiversquo IARCIMMYT Addis Ababa Ethiopia pp 41-71
Thornsberry JM Goodman MM Doebley J Kresovich S Nielsen D Buckler ES
(2001) Dwarf8 polymorphisms associate with variation in fl owering time
Nat Genet 28 286-289
Tommasini L Schnurbusch T Fossati D Mascher F Keller B (2007) Association
mapping of Stagonospora nodorum blotch resistance in modern European
winter wheat varieties Theor Appl Genet 115 697-708
Tuberosa R Gill BS Quarrie SA (2002) Cereal genomics Ushering in a brave new
world Plant Mol Biol 48 744-755
Varshney RK Tuberosa R (2007) Application of linkage disequilibrium and
association mapping in crop plants Genomics Approaches and Platforms 1
97-119
Vavilov NI (1951) The origin variation immunity and breeding of cultivated plants
Chron Bot 13 1-36
Weber A Clark RM Vaughn L Saacutenchez-Gonzalez JdJ Yu J Yandell BS Bradbury
P Doebley J (2007) Major Regulatory Genes in Maize Contribute to Standing
Variation in Teosinte (Zea mays ssp parviglumis) Genetics 177 2349-2359
Weir BS (1979) Inferences about linkage disequilibrium Biometrics 35 235-254
Werner JD Borevitz JO Uhlenhaut NH Ecker JR Chory J and Weigel D (2005)
FRIGIDA-independent variation in flowering time of natural Arabidopsis
thaliana accessions Genetics 170 1197-1207
Wilson LM Whitt SR Rocheford TR Goodman MM Buckler ES (2004) Dissection
of maize kernel composition and starch production by candidate gene
association The Plant Cell 16 2719-2733
Wu S Pumphrey M Bai G (2009) Molecular mapping of stem-rustresistance gene
Sr40 in wheat Crop Sci 49 1681-1686
Young ND (1996) QTL mapping and quantitative disease resistance in plants Annu
Rev Phytopathol 34 479-501
Yu J Pressoir G Briggs WH Bi IV Yamasaki M Doebley JF McMullen MD Gaut
BS Nielsen DM Holland JB Kresovich S Buckler ES (2006) A unified
31
mixed-model method for association mapping that accounts for multiple levels
of relatedness Nature Genetics 38 203-208
Yu L-X Morgounov A Wanyera R Keser M Singh SK Sorrells M (2012)
Identification of Ug99 stem rust resistance loci in winter wheat germplasm
using genome-wide association analysis Theor Appl Genet DOI 101007
s00122-012-1867-x
Zhang W Olson E Saintenac C Rouse M Abate Z Jin Y Akhunov E Pumphrey M
Dubcovsky J (2010) Genetic maps of stem rust resistance gene Sr35 in diploid
and hexaploid wheat Crop Sci 50 2464-2474
Zhao K Aranzana MJ Kim S Lister C Shindo C Tang C Toomajian C Zheng H
Dean C Marjoram P Nordborg M (2007) An Arabidopsis example of
association mapping in structured samples PloS Genet 3e4
Zheng P Allen WBlt Roesler K Williams ME Zhang S Li J Glassman K Ranch J
Nubel D Solawetz W Bhattramakki D Llaca V Deschamps S Zhong GY
Tarczynski MC Shen B (2008) A phenylalanine in DGAT is a key
determinant of oil content and composition in maize Nat Genet 40 367-372
Zhu C Gore M Buckler SE Yu J (2008) Status and Prospects of Association
Mapping in Plants The Plant Genome 1 5-20
32
FIGURES
33
Figure 1 High disease epidemic caused by stem rust on wheat (Source http
wwwarsusdagov Maindocshtm docid-9910)
34
Figure 2 A simplified flow chart showing different stages of association mapping for
tagging a gene of interest using germplasm accessions (Adapted from Al-Maskri et al
2012)
35
CHAPTER 2 IMPROVING STEM RUST RESISTANCE IN WHEAT
21 INTRODUCTION
Resistance to stem rust was a top priority in the ldquoGreen Revolutionrdquo wheat varieties
bred by the late Norman Borlaug and co-workers beginning in the 1950s and the
combinations of resistance genes they created remained effective until the appearance
of a new strain of stem rust identified from Africa that overcomes the major resistance
genes used to combat stem rust (http 2bladesorgwheat-stem-rustphp) Improving
stem rust resistance in wheat requires knowledge of the pathogen including its life
cycle physiologic races and variation
22 LIFE CYCLE OF WHEAT STEM RUST
The wheat stem rust fungus Puccinia graminis Pers f sp tritici Eriks E Henn (Pgt)
has a complex life cycle consisting of both sexual and asexual reproductive cycles
different sexual and asexual hosts multiple spore stages and nuclear conditions
(Figure 1) Pgt is a heteroecious fungus requiring two hosts to complete the entire life
cycle Wheat stem rust is a biotrophic fungus and does not exist in nature apart from
the primary host wheat or the secondary host common barberry (Berberis vulgaris
L) (Leonard and Szabo 2005)
Teliospores from wheat stem infected with Pgt are produced late in the growing
season These abiotic stress-tolerant spores are capable of overwintering on infected
straw Upon formation of the two cells of teliospores two haploid nuclei (n+n) are
present in each cell These nuclei undergo karyogamy and form a single nucleus (2n)
Meiosis takes place after karyogamy but is arrested until germination the following
spring season (Boehm et al 1992) Germination of teliospores is synchronized with
new growth of the alternate host barberry (Berberis vulgaris) Each teliospore
produces a basidium from which four basidiospores are produced Each basidiospore
is haploid (n) and contains one of the four products of meiosis from the fusion of the
haploid nuclei The meiotic products are of different mating types two basidiospores
will be + and two will be - A mitotic division in the basidiospores produces two
haploid nuclei in each basidiospore The basidiospores are products of recombination
36
and it is through meiosis in teliospores that novel variation in Pgt can be produced
The basidiospores ejected from the basidia infect the adaxial surface of barberry
leaves (Roelfs 1985)
The hyphae of basidiospores grow within the leaf mesophyll as haploid hyphae and
produce a pycnium on the adaxial leaf surface Haploid pycniospores (n) of + and ndash
mating types are exuded from the top of the pycnium Serving as male gametes
pycniospores are brought into contact with haploid female (n) flexuous hyphae of the
opposite mating type that extrude from the top of the pycnium (Anikster et al 1999)
A dikaryon (n+n) consisting of two haploid nuclei is formed and the resulting hype
grows throughout the leaf mesophyll to produce an aecium on the abaxial leaf surface
From the aecium single celled dikaryotic (n+n) aeciospores are produced which can
then infect the wheat host
The primary infection of wheat is by aeciospores that infect and produce hyphae
within the host These hyphae then produce uredinia that yield dikaryotic
urediniospores (n+n) that represent the asexual stage of the life cycle Urediniospores
re-infect the host during the growing season and cause the principle damage to wheat
plants resulting in yield losses Upon maturity of the host teliospores (n+n) are
produced which will overwinter and begin the cycle the following growing season
23 PHYSIOLOGIC RACES AND VARIATION OF STEM RUST
Puccinia graminis f sp tritici is divided into physiologic races based on virulence
and avirulence specificities of isolates as related to a differential set of stem rust
resistance genes (Roelfs and Martens 1987) The differentials consist of five sets of
genes each comprised of four genes per set To discriminate races a letter code for
each set is assigned The specific pattern of high and the low infection type of genes
within each set determines the letter code with a higher letter indicating virulence to
more genes within the set
Host genotype and spatial scale can dramatically affect the population structure of
Pgt The cultivation of a wheat variety carrying a single major gene for resistance to
stem rust places an intense directional selection of existing avirulent Pgt genotypes
37
(Van der Plank 1968) In the case of major genes encoding for NB-LRR type
receptors that function in the detection of specific Pgt effector activity the selective
pressure on Pgt populations is for the loss of detection of effector activity which can
simply be achieved through allelic changes by mutation or recombination during the
sexual stage (McDonald and Linde 2002) As only Pgt genotypes carrying the loss of
avirulence are virulent on the host carrying the major resistance gene these genotypes
increases in frequency The result of this virulence shift is a widespread disease on the
newly-susceptible and widely cultivated variety As the frequency of virulence
increases in Pgt populations and epidemics worsen the susceptible variety is planted
on fewer acres usually replaced by a new variety with a different source of major
gene resistance thereby perpetuating the boom-and-bust cycle (Sun and Yang 1999)
Virulence shifts in Pgt populations take place during both sexual and asexual cycles
Sexual recombination allows the opportunity to bring virulence to multiple resistance
genes together in a single genotype The absence of the sexual cycle removes the
possibility of sexual recombination and most common genotypes of Pgt have lost the
ability to produce teliospores (Zambino et al 2000) The barberry eradication
program undertaken in the United States in the 20th
century served to limit the
diversity of Pgt populations by removing the impact of sexual reproduction and
limiting evolutionary potential The greatest diversity in aeciospore and urediniospore
collections from Minnesota is from prior the large-scale barberry eradication efforts
(Peterson et al 2005)
24 MECHANISMS OF STEM RUST RESISTANCE
Stem rust resistance genes generally operate under two mechanisms Of the
designated Sr genes 53 of them are single-locus major genes (McIntosh et al 1995)
conferring resistance at all stages of plant development sometimes with varying
effectiveness at the adult plant stage (Singh et al 2011a) Resistance can also be
quantitative conferred by multiple minor genes that individually contribute small
effects but together contribute significantly to the resistance phenotype (Poland et al
2008) In particular Sr2 and Sr55 confer quantitative adult plant resistance to stem
rust and are pleiotropic (McIntosh et al 1995 Krattinger et al 2009) conferring
resistance to other diseases such as leaf rust stripe rust and powdery mildew
38
The breeding methodology for developing wheat rust-resistant varieties varies greatly
but usually includes mass screening of (i) seedlings for their reaction to specific rust
pathotypes early in the breeding cycle and (ii) adult plants at a later date under field
conditions
241 Breeding for Hypersensitivity Response (HR)
Most of the resistance genes discovered and deployed in defence against the wheat
rusts are classified as major resistance genes also known as seedling resistance
vertical resistance all-stage resistance or race-specific resistance genes Major genes
confer effective levels of resistance against specific physiologic races of the pathogen
generally throughout the life cycle of the host In terms of disease phenotype major
resistance genes are often associated with a rapid programmed death of infected cells
a so-called lsquolsquohypersensitive responsersquorsquo (HR) thought to play a role in limiting the
expansion of biotrophic pathogens in the host tissue
The race-specific resistance genes are also known as lsquolsquoRrsquorsquo genes and follow the gene-
for-gene model (Flor 1956) Host resistance requires the simultaneous presence of the
resistance allele in the host and the corresponding avirulence allele in the pathogen A
race-specific ldquomajorrdquo gene can be easily deployed due to their large phenotypic
effects and hence are useful especially for short-term control options Routine
deployment of HR genes in combinations or pyramids has been less practical in the
past due to the small number of broadly effective genes available at any given time
and the lack of diagnostic markers needed to pyramid genes A first step in achieving
wheat lines with multiple sources of resistance is to have more genes at hand to work
with Stem rust resistance genes that are effective against Ug99 based on seedling
andor field testing (Singh et al 2011b) and have been tagged by molecular markers
include Sr2 (Mago et al 2011) Sr13 (Admassu et al 2011 Simons et al 2011) Sr22
(Olson et al 2010 Periyannan et al 2011) Sr25 (Liu et al 2010) Sr26 (Liu et al
2010) Sr32 (Bariana et al 2001) Sr33 (Sambasivam et al 2008) Sr35 (Zhang et al
2010) Sr39 (Mago et al 2009 Niu et al 2011) Sr40 (Wu et al 2009) Sr44 (Liu et
al 2012) Sr45 (Sambasivam et al 2008) Sr47 (Faris et al 2008) Sr50 (Anugrahwati
et al 2008) Sr51 (Liu et al 2011a) Sr52 (Qi et al 2011) Sr53 (Liu et al 2011b)
39
SrCad (Hiebert et al 2011) Sr57 (synonym Lr34Yr18) (Pumphrey et al 2012) and
SrWeb (Hiebert et al 2010)
Seedling reactions are assessed under controlled conditions on a 0 to 4 scale (Stakman
and Levine 1922 as reported by McIntosh et al 1995 Figure 2) Plants are
considered to be immune to the race used if the seedling leaf showed no reaction to
the rust (designated lsquo0rsquo) or there is only a slight clearing of the chlorophyll to produce
a fleck (designated as lsquorsquo) The seedling is classified as resistant when the reaction is a
small lesion surrounded by a necrotic area or by a halo of chlorosis These are
classified as lsquo1rsquo and lsquo2rsquo type reactions respectively The plant is predicted to be
susceptible if it produces a lsquo3rsquo (large healthy lesion surrounded by an area of
chlorosis) or lsquo4rsquo where the lesion is large and surrounded by little or no chlorosis A
mixed or mesothetic reaction may also be produced and designated as lsquoXrsquo This
methodology has been chosen as the heritability of rust resistance is quite high and it
is much more cost effective for screening the very large populations associated with
the early stages of the breeding cycle Also seedling screening for rust resistance can
readily and effectively be undertaken in the off season
The traditional emphasis on major gene resistance is understandable for many
reasons
1 Major genes are effective such genes have without question provided significant
economic benefits to wheat growers as illustrated by the decades-long protection
provided by the now defeated stem rust resistance gene Sr31
2 They are relatively easy to identify and deploy breeding for single-gene resistance is
much simpler than breeding for oligopolygenic resistance
3 They are historically easier to combine in the absence of clear additivity of the
resistance conferred by different genes and in the absence of good molecular markers
race-specific disease phenotypes facilitate the efficient introgression and stacking of
major genes using panels of different rust races
4 They provide clear levels of protection lsquolsquoresistancersquorsquo rather than lsquolsquotolerancersquorsquo has
long been held as an agronomic goal
Despite these clear historic advantages however major resistance genes frequently
lacked lsquolsquodurabilityrsquorsquo that is the ability of a widely deployed resistance gene to provide
40
an economic level of protection over an extended period of time (Johnson 1984)
Hence recent epidemics have reinvigorated interest within the wheat breeding and
research communities in partial resistance genes as sources of potentially more
durable resistance
242 Breeding for Adult Plant Resistance (APR)
Sources of resistance based on multiple genes often termed quantitative resistance
which delay infection and also growth and reproduction of the pathogen in adult
plants but not in seedlings have been described as lsquolsquoadult plant resistancersquorsquo (APR)
(Gustafson and Shaner 1982) The APR is usually more durable than resistance based
on single R genes and can be identified in cultivars with defeated or no race-specific
resistance genes In most countries especially developing countries that lack a
competitive seed sector variety turnover is slow which makes APR and durable
resistance particularly valuable for breeding purposes These are compelling reasons
for adopting an APR strategy in which wheat lines are by necessity bred for genetic
complexity of resistance The danger posed by inadequate monitoring of rapidly
mutating and migrating stem rust races further supports the APR approach Lastly the
use of resistance based on minor genes provides opportunities to other breeding
programs to utilize race-specific resistance and further enhance the diversity for
resistance in farmersrsquo fields
Sr2 is one of the best characterized APR genes that confer resistance to stem rust It is
arguably the most important stem rust resistance gene and is closely associated with
pseudo black chaff which offers a morphological marker for breeders working with
Sr2 Sr2 was introduced from Triticum turgidum into hexaploid wheat in the 1920s
and has remained durable since now (McIntosh et al 1995) Less is known about
other genes that contribute to adult plant resistance but widely used APR genes
Lr34Yr18 (recently designated Sr57) and Lr46Yr29 also contribute to stem rust APR
(Bhavani et al 2011) in bread wheat in combination with QTLs at other genomic
locations identified through biparental and association mapping (Bhavani et al 2011
Yu et al 2011) However early work by Knott and revisited by Singh indicates how
the accumulation of four or five minor effect genes can provide an almost perfect
immunity (Singh et al 2000 Figure 3)
41
APR is assessed under field conditions based upon severity (percentage of rust
infection on the plants Figure 4) and field response (type of disease reaction Figure
5) as described by Loegering (1966) Severity is recorded as a percentage according
to modified Cobb scale (Peterson et al 1948) This recording process relies upon
visual observations and it is common to use the following intervals Trace 5 10 20
40 60 100 infection Field response is recorded using the following letters
R = resistant visible chlorosis or necrosis no uredia are present
MR = moderately resistant small uredia are present and surrounded by either
chlorotic or necrotic areas
MS = moderately susceptible medium size uredia are present and possibly
surrounded by chlorotic areas
S = susceptible large uredia are present generally with little or no chlorosis and no
necrosis Severity and field response readings are usually combined
25 STEM RUST UG99 AND ITS IMPACT ON WHEAT PRODUCTION
Ug99 (Ug stands for Uganda and 99 for the year in which the race was named) more
formally known in the scientific literature as TTKSK (Jin et al 2007 2008) was
remarkable in that at the time of its discovery it was the only known race of P
graminis to overcome the race-specific stem rust resistant gene Sr31 after more than
30 years of widespread deployment leading to a wrong sense of ldquodurabilityrdquo
associated with this resistance gene Ug99 was uniquely virulent on Sr31 as well as
most of the resistance genes of wheat origin and other important genes found in
CIMMYT European North American and Australian wheat germplasm (Reynolds
and Borlaug 2006 Jin et al 2007) (Table 1) Today the area under immediate threat
along the projected migration pathway in North Africa the Middle East and Asia
(excluding China) amounts to 50 million hectares of wheat ie approximately 25 of
the worldrsquos wheat area responsible for 19 of global wheat production (Reynolds and
Borlaug 2006) An epidemic in this region would have a serious impact on the 1
billion people living within this zone Subsequent estimates warned that over 90 of
the worldrsquos wheat varieties are at risk imposed by Ug99 (Singh et al 2006)
42
251 Distribution of Ug99 lineages
There is some evidence that Ug99 may have been present in Kenya as early as 1993
prior to its identification in Uganda (Davidson et al 2012) By 2001 its presence was
confirmed in Kenya where it is now epidemic In 2003 it was widely reported in
Ethiopia and was poised to move across the Red Sea to the Arabian Peninsula and
beyond to the worldrsquos breadbasket in South Asia That jump happened in 2006 when
virulence to Sr31 was identified in Yemen By 2007 it was carried into Iran
apparently by a tropical storm To date there are no reports that the pathogen has
moved further into South Asia However the Ug99 family has also moved south
from Kenya and is now present as far as South Africa Other countries where Ug99 is
present are Eritrea Sudan Tanzania Mozambique and Zimbabwe totalling 11
countries The pathogen is not only moving but it is evolving overcoming additional
stem rust resistance genes across the eastern areas of Africa In total the Ug99 family
now has eight members (Hodson and Nazari 2012) Surveillance data indicate that
Ug99 variants with combined virulence to Sr31 and Sr24 are spreading rapidly An
update of the occurrence of the Ug99 family was compiled by Hodson and Nazari
(2012) and is reproduced in Figure 6
43
26 LITERATURE CITED
Admassu B Perovic D Friedt W Ordon F (2011) Genetic mapping of the stem rust
(Puccinia graminis f sp tritici Eriks amp E Henn) resistance gene Sr13 in
wheat (Triticum aestivum L) Theor Appl Genet 122 643-6
Anikster Y Eilam T Mittelman L Szabo LJ and Bushnell WR (1999) Pycnial nectar
of rust fungi induces cap formation on pycniospores of opposite mating type
Mycologia 91 858-870
Anugrahwati DR Shepherd KW Verlin DC Zhang P Mirzaghaderi G Walker E
Francki MG Dundas IS (2008) Isolation of wheat-rye 1RS recombinants that
break the linkage between the stem rust resistance gene SrR and secalin
Genome 51 341-349
Bariana HS Hayden MJ Ahmed NU Bell JA Sharp PJ McIntosh RA (2001)
Mapping of durable adult plant and seedling resistances to stripe rust and stem
rust diseases in wheat Aust J Agric Res 521247-1255
Bhavani S Singh RP Argillier O Huerta-Espino J Singh S Njau P Brun S Lacam S
Desmouceaux N (2011) Mapping durable adult plant stem rust resistance to
the race Ug99 group in six CIMMYT wheats In McIntosh RA (ed) BGRI
2011 Technical Workshop Borlaug Global Rust Initiative St Paul MN USA
pp 43-53
Boehm EWA Wenstrom JC McLaughlin DJ Szabo LJ Roelfs AP Bushnell WR
(1992) An ultrastructural pachytene karyotype for Puccinia graminis f sp
tritici Canadian Journal of Botany-Revue Canadienne de Botanique 70 401-
413
Davdson SE Singh RP Coffman R and Pumphrey M (2012) The Borlaug Global Rust
Initiative Reducing the genetic vulnerability of wheat to rust Gen Res Crop
Evol (In press)
Faris JD Xu SS Cai XW Friesen TL Jin Y (2008) Molecular and cytogenetic
characterization of a durum wheat-Aegilops speltoides chromosome
translocation conferring resistance to stem rust Chromosome Res 16 1097-
1105
Flor HH (1956) The complementary genic systems in flax and flax rust Adv Genet
8 29-54
Gustafson GD Shaner G (1982) Influence of plant age on the expression of slow
44
mildewing resistance in wheat Phytopathol 72 746-749
Harjes CE Rocheford TR Bai L Brutnell TP Kandianis CB Sowinski SG Stapleton
AE Vallabhaneni R Williams M Wurtzel ET Yan J Buckler ES (2008)
Natural genetic variation in lycopene epsilon cyclase tapped for maize
biofortification Science 319 330-333
Hiebert CW Fetch TG Zegeye T (2010) Genetics and mapping of stem rust resistance
to Ug99 in the wheat cultivar Webster Theor Appl Genet 121 65-69
Hiebert CW Fetch TG Zegeye T Thomas JB Somers DJ Humphreys DG
McCallum BD Cloutier S Singh D Knott DR (2011) Genetics and mapping
of seedling resistance to Ug99 stem rust in Canadian wheat cultivars Peace
and AC Cadillac Theor Appl Genet 122 143-149
Hodson D and Nazari K (2012) Rust bowl or breadbasket Keeping track of wheat
rust pathogens in Africa International Conference on lsquoWheat for food security
in Africarsquo Science and policy dialogue about the future of wheat in Africa
October 8-12 2012 Addis Ababa Ethiopia
Jin Y Pretorius ZA Singh RP (2007) New virulence within race TTKS (Ug99) of the
stem rust pathogen and effective resistance genes Phytopathol97 S137-S137
Jin Y Szabo LJ Pretorius ZA Singh RP Ward R Fetch T (2008) Detection of
virulence to resistance gene Sr24 within race TTKS of Puccinia graminis f sp
tritici Plant Disease 92 923-926
Johnson R (1984) A critical analysis of durable resistance Annu Rev Phytopathol
22 309-330
Krattinger SG Lagudah ES Spielmeyer W Singh RP Huerta-Espino J McFadden H
Bossolini E Selter LL and Keller B (2009) A putative ABC transporter confers
durable resistance to multiple fungal pathogens in wheat Science 323 1360-
1363
Leonard KJ and Szabo LJ (2005) Stem rust of small grains and grasses caused by
Puccinia graminis Molecular Plant Pathol 6 99-111
Liu SX Yu LX Singh RP Jin Y Sorrells ME Anderson JA (2010) Diagnostic and co-
dominant PCR markers for wheat stem rust resistance genes Sr25 and Sr26
Theor Appl Genet 120 691-697
Liu WX Jin Y Rouse M Friebe B Gill B Pumphrey MO (2011a) Development and
characterization of wheat-Aesearsii Robertsonian translocations and a
recombinant chromosome conferring resistance to stem rust Theor Appl
45
Genet 122 1537-1545
Liu WX Rouse M Friebe B Jin Y Gill B Pumphrey MO (2011b) Discovery and
molecular mapping of a new gene conferring resistance to stem rust Sr53
derived from Aegilops geniculata and characterization of spontaneous
translocation stocks with reduced alien chromatin Chromosome Res 19 669-
682
Liu WX Danivola TV Rouse MN Bowden RL Friebe B Gill BS Pumphrey MO
(2013) Development and characterization of a compensating wheat-
Thinopyrum intermedium Robertsonian translocation with Sr44 resistance to
stem rust (Ug99) Theor Appl Gen (In press)
Loegering WQ (1966) The relationship between host and pathogen in stem rust of
wheat Proc 2nd
Int Wheat Genetics Symp Lund 1963 Hereditas supp 2
167-177
Mago R Zhang P Bariana HS Verlin DC Bansal UK Ellis JG Dundas IS (2009)
Development of wheat lines carrying stem rust resistance gene Sr39 with
reduced Aegilops speltoides chromatin and simple PCR markers for marker-
assisted selection Theor Appl Genet 119 1441-1450
Mago R Brown-Guedira G Dreisigacker S Breen J Jin Y Singh R Appels R
Lagudah ES Ellis J Spielmeyer W (2011) An accurate DNA marker assay for
stem rust resistance gene Sr2 in wheat Theor Appl Genet 122 735-744
McDonald BA and Linde C (2002) Pathogen population genetics evolutionary
potential and durable resistance Annu Revof Phytopathol 40 349-379
McIntosh RA Wellings CR Park RF (1995) Wheat Rusts an Atlas of Resistance
Genes CSIRO Publications Victoria Australia
Niu ZX Klindworth DL Friesen TL Chao SM Jin Y Cai XW Xu SS (2011)
Targeted Introgression of a Wheat Stem Rust Resistance Gene by DNA
Marker-Assisted Chromosome Engineering Genetics 187 1011-1068
Olson EL Brown-Guedira G Marshall D Stack E Bowden RL Jin Y Rouse M
Pumphrey MO (2010) Development of Wheat Lines Having a Small
Introgressed Segment Carrying Stem Rust Resistance Gene Sr22 Crop Sci
50 1823-1830
Periyannan SK Bansal UK Bariana HS Pumphrey M Lagudah ES (2011) A robust
molecular marker for the detection of shortened introgressed segment carrying
the stem rust resistance gene Sr22 in common wheat Theor Appl Genet 122
46
1-7
Peterson RF Campbell AB Hannah AE (1948) A diagrammatic scale for estimating
rust intensity of leaves and stem of cereals Can J Res Sect C 26 496-500
Peterson PD Leonard KJ Pathology P Paul S Roelfs AP and De US (2005) Effect of
Barberry Eradication on Changes in Populations of Puccinia graminis in
Minnesota Plant Dis 89 935-940
Poland JA Balint-kurti PJ Wisser RJ Pratt RC and Nelson RJ (2008) Shades of gray
The world of quantitative disease resistance Trends in Plant Sci 14 21-29
Pumphrey MO (2012) Stocking the Breedersrsquos toolbox an update on the status of
resistance to stem rust in wheat In Proceedings of BGRI 2012 Technical
Workshop ed R McIntosh Beijing China September 1-4 pp 23-29
Qi LL Pumphrey MO Friebe B Zhang P Qian C Bowden RL Rouse MN Jin Y
Gill BS (2011) A novel Robertsonian translocation event leads to transfer of a
stem rust resistance gene (Sr52) effective against race Ug99 from Dasypyrum
villosum into bread wheat Theor Appl Genet 123 159-167
Reynolds MP Borlaug NE (2006) Applying innovations and new technologies for
international collaborative wheat improvement J Agric Sci 144 95-110
Roelfs A (1985) Wheat and rye stem rust In Roelfs A Bushnell W (eds) The
Cereal Rusts Vol 2 Academic Press Orlando FL pp 3-37
Roelfs AP Martens JW (1987) An International System of Nomenclature for Puccinia
graminis fsp tritici Phytopathol 78 526-533
Roelfs AP Singh RP Saari EE (1992) Rust diseases of wheat concepts and methods
of disease management CIMMYT Mexico DF
Sambasivam PK Bansal UK Hayden MJ Dvorak J Lagudah ES Bariana HS (2008)
Identification of markers linked with stem rust resistance genes Sr33 and Sr45
Proceedings of the 11th
International Wheat Genetics Symposium Brisbane
Australia
Simons K Abate Z Chao SM Zhang WJ Rouse M Jin Y Elias E Dubcovsky J
(2011) Genetic mapping of stem rust resistance gene Sr13 in tetraploid wheat
(Triticum turgidum ssp durum L) Theor Appl Genet 122 649-658
Singh RP Huerta-Espino J Rajaram S (2000) Achieving near-immunity to leaf and
stripe rusts in wheat by combining slow rusting resistance genes Acta
Phytopathologica et Entomologica Hungarica 35133-139
Singh RP Hodson DP Jin Y Huerta-Espino J Kinyua M Wanyera R Njau P Ward R
47
(2006) Current Status likely migration and strategies to mitigate the threat to
wheat production from race Ug99 (TTKS) of stem rust pathogen CAB
Reviews Perspectives in Agriculture Veterinary Science Nutrition and
Natural Resources 1 1-13
Singh RP Hodson DP Huerta-Espino J Jin Y Bhavani S Njau P Herrera-Foessel S
Singh PK Singh S Govindan V (2011a) The Emergence of Ug99 Races of the
Stem Rust Fungus is a Threat to World Wheat Production In VanAlfen NK
Bruening G Leach JE (eds) Annu Rev Phytopathol 49 465-81
Singh RP Huerta-Espino J Bhavani S Herrera-Foessel S Jin Y Njau P Velu G
Singh S Pentildea RJ Crossa J (2011b) High yielding CIMMYT spring wheats
with resistance to Ug99 and other rusts developed through targeted breeding
In McIntosh RA (ed) BGRI 2011 Technical Workshop Borlaug Global Rust
Initiative St Paul MN USA pp 98-104
Stakman EC Levine MN (1922) The determination of biologic forms of Puccinia
gamninis on Triticum spp Minn Agric Exp Stn Tech BUll pp 8
Sun P and Yang X (1999) Two properties of a gene-for-gene co-evolution system
under human perturbations Phytopathol 89 811-816
Van der Plank J (1968) Disease resistance in plants Academic Press New York NY
Wu SY Pumphrey M Bai GH (2009) Molecular Mapping of Stem-Rust-Resistance
Gene Sr40 in Wheat Crop Sci 49 1681-1686
Yu LX Lorenz A Rutkoski J Singh RP Bhavani S Huerta-Espino J Sorrells ME
(2011) Association mapping and gene-gene interaction for stem rust resistance
in CIMMYT spring wheat germplasm Theor Appl Genet 123 1257-1268
Zambino P Kubelik A Szabo L (2000) Gene action and linkage of avirulence genes
to DNA markers in the rust fungus Puccinia graminis Phytopathol 90 819-
826
Zhang WJ Olson E Saintenac C Rouse M Abate Z Jin Y Akhunov E Pumphrey M
Dubcovsky J (2010) Genetic Maps of Stem Rust Resistance Gene Sr35 in
Diploid and Hexaploid Wheat Crop Sci 50 2464-2474
48
FIGURES
49
Figure 1 Life and disease cycles for Puccinia graminis fsp tritici (wheat stem rust)
(Roelfs et al1992)
50
--------------------------Resistant--------------------------------Susceptible =
Figure 2 Seedling scoring of infection types on wheat differential using 0-4
evaluation scale Photo credit R F Park
51
Figure 3 Effect of accumulating a different number of minor genes in wheat cultivar
in reducing the level of disease infection (Adapted from Singh et al 2010)
52
Figure 4 Stem rust severity scores (From Rust scoring guide booklet)
53
Figure 5 Adult plant field responses to stem rust disease (From Rust scoring guide
booklet)
54
Figure 6 Distribution of Ug99 and its lineages (Hodson and Nazari 2012)
55
TABLE
56
Table 1 Origin and Sr genes in conferring seedling andor adult plant resistance to
Puccinia graminis f sp tritici races belonging to the Ug99 lineage
Origin of Sr genes
Stem rust resistance (Sr) genes
Ineffective Effective
Triticum aestivum 5 6 7a 7b 8a 8b 9a 9b
9f 10 15 16 18 19 20
23 30 41 42 49 McN
Wid-1
28a 29
bc 48 Tmp
a
AC-Cadillac Sha7b
Huw234b ND643
b
Triticum turgidum 9d 9e 9g 11 12 17 2b 13
ab 14
a
Triticum monococcum 21 22 35
Triticum timopheevi 36 37c
Aegilops speltoides - 32c 39
c 47
d
Aegilops tauschii - 33b 45
ab 46
ad
Triticum comosum 34 -
Triticum ventricosum 38 -
Triticum urarticum - 40c
Thinopyrum elongatum 24 25a 26 43
c
Thinopyrum intermedium - 44c
Secale cereale 31 27a 50 1A1R
ab
a Virulence for the gene is known to occur in other races
b Level of resistance conferred in the field usually inadequate under high disease
pressure
c Unsuitable for utilization due to linkage with undesirable traits in the translocation
(adapted from Singh et al 2011a)
57
CHAPTER 3 RESEARCH AIMS
Stem rust continues to cause huge losses worldwide in wheat production due to
reliance on cultivars with narrow genetic basis for resistance and the high level of
virulence variation in stem rust pathogens Therefore successful breeding relies on
the identification of new resistance sources via gene mapping and incorporation of
these resistance sources into breeding lines to release new resistant varieties
Furthermore it is useful to identify stem rust resistance genes against highly virulent
races of stem rust in durum wheat germplasm in order to increase the possibilities of
broadening the genetic base of resistance by crossing elite varieties of durum wheat
Hence the objectives of this study were
1 To survey virulence of stem rust races TRTTF TTTTF TTKSK (Ug99) and
JRCQC in a set of durum wheat accessions suitable for an association mapping
approach in order to identify genomic regions associated to seedling-based
resistance to these virulent races of stem rust
2 To evaluate the same set of durum wheat accessions under field conditions at an
adult plant growth stage in order to identify genomic regions associated to field-
based resistance to the combination of Ug99 with Ethiopian races of stem rust
58
CHAPTER 4 SEARCHING FOR NOVEL SOURCES OF FIELD
RESISTANCE TO UG99 AND ETHIOPIAN STEM RUST RACES IN DURUM
WHEAT VIA ASSOCIATION MAPPING
Tesfaye Letta14
Marco Maccaferri1 Ayele Badebo
2 Karim Ammar
3 Andrea Ricci
1
Jose Crossa3 Roberto Tuberosa
1
Pulished on Theoretical and Applied Genetics (2013) DOI 101007s00122-013-
2050-8
1 DiSTA University of Bologna Viale Fanin 44 40127 Bologna Italy
2 Debre Zeit Agricultural Research Center Debre Zeit Ethiopia
3 CIMMYT Int Apdo Postal 6-641 Mexico DF Mexico 06600
4 Sinana Agricultural Research Center Bale-Robe Ethiopia
41 ABSTRACT
Puccinia graminis f sp tritici the causative agent of stem rust in wheat is a
devastating disease of durum wheat While more than 50 stem rust resistance (Sr) loci
have been identified in wheat only a few of them remained effective against Ug99
and other durum-specific Ethiopian races An association mapping (AM) approach
based on 183 diverse durum wheat accessions was utilized to identify resistance loci
for stem rust response in Ethiopia over four field-evaluation seasons and artificial
inoculation with Ug99 (TTKSK race) and a mixture of durum-specific races The
panel was profiled with simple sequence repeat diversity array technology and
sequence tagged site markers (1253 markers) The resistance turned out to be
oligogenic with twelve QTL-tagging markers that were significant (P lt 005) across
three to four seasons R2 values ranged from 11 to 113 Twenty-four additional
single markerQTL regions were found to be significant over two seasons The AM
results confirmed the role of Sr13 previously described in bi-parental mapping
studies and the role of chromosome regions putatively harboring Sr9 Sr14 Sr17 and
Sr28 Three minor QTLs were coincident with those reported in hexaploid wheat and
five overlapped with those recently reported in the Sebatel times Kristal durum mapping
population Thirteen single markerQTL regions were located in chromosome regions
where no Sr genesQTLs have been previously reported The allelic variation
identified in this study is readily available and can be exploited for marker-assisted
selection thus providing additional opportunities for a more durable stem rust
resistance under field conditions
59
42 INTRODUCTION
Durum wheat (Triticum durum Desf) is an important crop in the Mediterranean
Basin a region accounting for approximately 75 of global worldwide production
(Belaid 2000 Habash et al 2009) In Sub-Saharan Africa Ethiopia is the largest
wheat-growing country and is considered one of the centers of diversity for tetraploid
wheat (Vavilov 1929 1951) Durum wheat is grown on approximately 40 of the
total wheat area in Ethiopia with a tendency to increase due to the growing internal
demand for pasta products (Badebo et al 2009) Among the factors that negatively
affect durum production and kernel quality rust diseases play an important role
(Singh et al 2005) Historically stem rust infections due to Puccinia graminis Pers f
sp tritici have caused severe losses to wheat production (Zwer et al 1992 McIntosh
and Brown 1997 Eversmeyer and Kramer 2000 Singh et al 2011) Until the
appearance of Ug99 stem rust control through the use of genetic resistance was
considered a remarkable success story worldwide Although more than 50 stem rust
resistance (Sr) loci have been identified in wheat (Singh et al 2006) including those
introgressed from its wild relatives only a few remain effective against Ug99 or its
variants and even fewer are useful against the durum-specific Ethiopian races
(Admassu et al 2009) Susceptibility in some CIMMYT-derived germplasm was first
noted in Uganda (Pretorius et al 2000) and soon after was observed in all germplasm
groups This new race designated as Ug99 or TTKS (Wanyera et al 2006) spread to
Kenya in 2001 and to Ethiopia in 2003 (Singh et al 2006) By 2006 TTKS was
identified in Sudan and Yemen (httpwwwfaoorg) and in 2008 its presence was
confirmed in Iran (Nazari et al 2009) Ug99 is projected to spread further into the
major wheat growing regions of Asia (Singh et al 2008) In Ethiopia Ug99 and its
variants were added to previously existing races the latter specifically virulent on
durum wheat Two such races have been characterized as TRTTF and JRCQC with a
combined virulence to Sr9e and Sr13 two genes present at high frequency in the
durum wheat germplasm (Olivera et al 2012) These races are predominant in durum-
growing areas of Ethiopia and effective resistance to them (52 of the lines tested)
was found in a collection of 996 tetraploid genotypes evaluated for field resistance at
the Debre-Zeit Research Station in Ethiopia in 2009 (Olivera et al 2010) Therefore
the combination of Ug99 + Sr13-virulent Ethiopian races currently poses a major
threat to durum wheat production in Ethiopia and represents a tangible potential
60
danger elsewhere should these virulent races reach distant durum-growing areas such
as central India where conditions are known to be conducive to the epidemic
development of this pathogen Three different races from the TTKS or Ug99 lineage
were identified in Kenya which led to the re-designation of the original race as
TTKSK and the other two races as TTKST (with additional virulence on Sr24) (Jin et
al 2008) and TTTSK (with additional virulence on Sr36) (Jin et al 2009) The
effectiveness and durability of the genetic resistance approach to control the disease
require the availability of many sources of resistance preferably involving genes that
act on adult plant field resistance to counter the continuing evolution of new
virulence in pathogen populations
Selecting for the resistant phenotypes conferred by major race-specific loci are
relatively straightforward and initially rewarding though eventually becomes
ineffective due to the fast evolution and selection of virulent strains of the pathogen
as seen with Ug99 Although a number of resistance genes have been introgressed
into cultivated wheat from wild relatives (Ceoloni et al 2005 Feuillet et al 2008) the
successful utilization of such materials has often been hampered by the inherent
difficulties of operating with alien genomes
Marker-based approaches allow us to identify genesquantitative trait loci (QTL)
governing plant response to diseases The effective deployment of stem rust resistance
alleles from different sources requires a thorough genetic characterization of the
available germplasm The standard approach is to use bi-parental mapping
populations to relate phenotypic information to genotypic data obtained from
molecular markers in order to determine the number and the chromosomal location of
resistance loci (Gupta et al 1999 Maccaferri et al 2008 Simons et al 2011) An
alternative to the use of bi-parental mapping is association mapping (AM) or linkage
disequilibrium (LD -based mapping in which genotype-phenotype relationships are
explored in germplasm collections or natural populations (Rafalski 2002 2011 Flint-
Garcia et al 2003) The underlying principle of this approach is that LD tends to be
maintained over many generations between loci that are genetically linked With AM
statistical assessments are made for associations between genotypes based on
molecular markers and phenotypes for various traits in reference germplasm sets
(Buntjer et al 2005) Since its first use in plants a decade ago (Thornsberry et al
61
2001) AM has been used in many important crops thanks to advances in high-
throughput genotyping technologies increased interest in identifying useful andor
novel alleles and improvements in statistical methods (Gupta et al 2005 Yu et al
2006 Zhu et al 2008) In both tetraploid and hexaploid wheat AM has already
proven to be an effective strategy to identify marker-trait associations for
agronomically valuable traits (Breseghello and Sorrells 2006 Crossa et al 2007
Maccaferri et al 2010 2011) including resistance to stem rust (Yu et al 2011)
Stagonospora nodorum Blotch (Tommasini et al 2007) Fusarium head blight
(Miedaner et al 2011) in bread wheat and leaf rust (Maccaferri et al 2010) and
SBMCV (Maccaferri et al 2011) in durum wheat
The objective of this study was to evaluate a panel of durum wheat accessions well-
suited for AM studies (Maccaferri et al 2006 2010 2011) in order to identify
genomic regions associated to field-based resistance to the combination of Ug99 with
Ethiopian races of stem rust
43 MATERIALS AND METHODS
431 Plant materials
A collection of 183 elite durum genotypes including cultivars released or breeding
lines developed in Italy Morocco Spain Syria Tunisia Southwestern USA and
Mexico was assembled to represent different spring durum germplasm groups
(Appendix 1) The genotypes included in the AM panel were chosen from a larger
pool of 330 accessions obtained from various sources and evaluated in a field trial in
2003 in Cadriano near Bologna Italy (Maccaferri et al 2006) The accessions of this
panel were chosen based on their pedigrees and morpho-physiological traits critical to
adaptation such as plant height and heading date Highly related accessions (eg sibs
from the same cross backcross lines etc) andor with excessively large differences in
heading date a feature that could have biased the phenotypic evaluation of traits
influenced by flowering time were excluded Most of the accessions were semi-
dwarf short- to medium-cycle elite cultivars and breeding lines released from the
early lsquo70s up to the late lsquo90s The collection comprises also lsquofounder genotypesrsquo
widely used as parents in breeding programs throughout the Mediterranean Basin and
62
at International CGIAR Centers (CIMMYT and ICARDA) The accessions were
assembled for conducting AM studies and are hitherto collectively referred to as the
lsquoAM durum panelrsquo A detailed phenotypic and molecular characterization of the panel
was previously reported in Maccaferri et al (2006 and 2010) Briefly the panel
included accessions belonging to one of five main population subgroups accessions
from ICARDA bred for the dryland areas (subgroup 1) from ICARDA bred for
temperate areas (subgroup 2) from the Italian and early rsquo70 CIMMYT breeding
programs (subgroup 3) from CIMMYT in the late rsquo70s-early rsquo80s (subgroup 4) and
from CIMMYT in the late rsquo80s-early rsquo90s (subgroup 5) As compared to the panel of
accessions described in Maccaferri et al (2010) 25 accessions were dropped due to
their relatively high relatedness while 19 additional accessions from the CIMMYT
breeding programs mainly classified as belonging to subgroup 5 were added to the
panel Based on their molecular profiles the accessions clustered into the five
subgroups with balanced frequencies
432 Stem rust response evaluation under field conditions
Field experiments were conducted in Ethiopia at the Debre-Zeit Agricultural Research
Center (DZARC) located at an altitude of approximately 1900 m above sea level
with latitude of 80 44rsquo N and longitude of 38
0 85rsquo E DZARC is a hot spot for wheat
stem rust during the main cropping season (July to November) as well as during the
off-season (mid-January to May) if irrigation is provided to ensure proper plant
development DZARC has been identified as an international durum wheat screening
site as part of the Borlaug Global Rust Initiative
The AM durum panel was evaluated during four consecutive growing seasons in 2009
and 2010 In both years the evaluation was carried out both in the off-season under
supplementary irrigation and in the main season under rain-fed conditions The off-
season is warmer than the main season and as a result stem rust disease pressure is
often higher than in the main season depending on the moisture availability for
disease development The accessions were evaluated in non-replicated field trials
using an augmented design with plots consisting of 1-m-long twin rows flanked by
spreader rows that were sown with a seed mixture of PBW343 Morocco (bread wheat
susceptible to Ug99) and Local Red or Arendeto (susceptible durum) accessions in
63
211 proportion respectively Spreader rows were artificially inoculated with Ug99
(TTKSK race) and a mixture of durum-specific races prevalent in Ethiopia The Ug99
(TTKSK) stem rust race was isolated and maintained on the variety PBW343 under
greenhouse conditions Race purity was regularly checked on the North American
stem rust differential lines Additionally bulk spores were collected directly from the
durum wheat nurseries in the field and temporarily stored at 4 oC after drying Field
inoculation was carried out following the methodology described in Roelfs et al
(1992) Inoculation was carried out on spreader rows starting at stem elongation
growth stage and was repeated two-three times at weekly intervals The cultural
practices including fertilizer weeds and insect control were applied according to the
local site recommendations
Stem rust disease severity was recorded two to three times during the epidemics
development using a modified Cobbrsquos scale (Peterson et al 1948) Disease severity
score (DSS) was calculated as the percentage of the infected stem area covered with
pustules (visually estimated over the whole canopy) at the same time the major
infection type was also recorded (Roelfs et al 1992) Infection types were categorized
into four discrete classes resistant (R) moderately resistant (MR) moderately
susceptible (MS) and susceptible (S) The DSS and the corresponding infection types
were used to compute the values of the Coefficients of Infection (Stubbs et al 1986)
For each evaluation season the terminal disease severity at the soft-dough stage
(Zadoks scale 85 Zadoks et al 1974) in coincidence with the peak of disease
severity was considered as the most informative disease score and was therefore used
to carry out the molecular-phenotype association tests
433 Molecular profiling
A bulk of 25 seeds from the original pure stock of each accession was germinated and
grown in a growth chamber at 20 oC After 2 weeks seedling leaves were collected
freeze-dried ground and used for genomic DNA extraction as previously described in
Maccaferri et al (2010) The accessions were profiled with 350 simple sequence
repeat loci (SSR) 900 Diversity Array Technology (DArT) markers and three
additional sequence tagged site (STS) markers including those previously reported as
markers associated to major stem rust resistance genes (Yu et al 2010)
64
434 SSR and STS markers
The SSR primers were chosen among the publicly available sets catalogued in the
GrainGenes database (httpwheatpwusdagov) as BARC (barc marker loci) CFA
CFD and GPW from INRA (cfa cfd and gpw respectively) KSUM (ksum) WMC
(wmc) and WMS (gwm) an additional subset of private genomic WMS primers from
TraitGenetics (supplied by M Ganal TraitGenetics Gatersleben Germany) were also
considered The SSR loci used to genotype the accessions were preselected for (i)
clarity and repeatability of the amplicons profile (ii) polymorphism level and (iii)
even distribution on all the A- and B-genome chromosomes (chrs) The choice was
carried out based on the results of a survey of SSR primer pairs conducted on a small
subset of eight founder accessions and lines used as parents of mapping populations
As described in Maccaferri et al (2008) a unique thermo-cycling protocol was used
for all primer sets and SSR profiles of the accessions were obtained using the
automated LI-COR 4200 IR2 System (LiCor Lincoln NE USA) Genotyping was
performed for most SSR markers using the M13-labeled primers and amplification
protocol (Schuelke 2000) Alleles were scored using founder genotypes as an allele
reference set Most markers produced only one band assigned to a unique wheat
chromosome in previous mapping studies For SSR primer pairs amplifying two or
more loci each locus was independently scored and assigned to the respective linkage
group based on either the score of the parental lines or the LD with adjacent markers
435 DArT markers
In addition to SSR and STS markers the panel was profiled with DArT markers
DArT markers were generated by Triticarte Pty Ltd (Canberra Australia http
wwwtriticartecomau) a whole-genome profiling service company as described by
Akbari et al (2006) The Durum wheat PstI TaqI array v 20 containing 7600 single
DArT clones obtained as described in Mantovani et al (2008) was used for
genotyping the panel The locus designation used by Triticarte Pty Ltd was adopted
(lsquowPtrsquo lsquorPtrsquo and lsquotPtrsquo loci corresponding to wheat rye and triticale clones
65
respectively) and alleles at polymorphic loci were scored as hybridization positive (1)
or negative (0)
436 Construction of the consensus map
The majority of the SSR markers considered herein were previously mapped in five
intra-specific durum recombinant inbred line (RIL)-based linkage maps whose
genotypic data were used to obtain a consensus durum wheat specific-linkage map
Four mapping populations ie Kofa times Svevo (KS RIL population Maccaferri et al
2008) Colosseo times Lloyd (CL RIL Mantovani et al 2008) Meridiano times Claudio (MC
RIL Maccaferri et al 2011) and Simeto times Levante (SL RIL Maccaferri et al
unpublished) were developed by DiSTA in collaboration with Produttori Sementi
Bologna SpA (Argelato BO Italy) a fifth linkage map obtained from the cross Kofa
times UC1113 (KU RIL population Zhang et al 2008) was considered for consensus
mapping and the genotypic data were downloaded from the GrainGenes web
database
The consensus linkage map was obtained from the five datasets using the Carthagene
v40 software (de Givry et al 2005) Merging was performed with the dsmergen
command after checking for marker order consistency across maps so that for each
marker pair a single recombination rate was estimated based on all available meioses
A framework-mapping method was applied Non-framework markers were
incorporated in the framework map by building a complete map using the framework
map as a fixed order The marker order and inter-marker genetic distances from the
consensus map were used to report the LD and association results The consensus map
included a total of 2031 markers (mostly SSR and DArT markers) Of those 861 had
genotypic scores available in the durum accessions (320 SSRs 3 STSs and 538 DArT
markers)
437 Association mapping
For association mapping analysis only markers with non-rare alleles (allelic
frequencies greater than 010) were considered for the LD and marker-trait association
analyses thus reducing the false-positive rate and the LD inflation effects that have
66
frequently been associated with the consideration of rare alleles (Myles et al 2009)
Similarly to rare alleles data-points showing residual allelic heterogeneity within
accession were considered as missing data In total 1211 markers were used for
marker-phenotype association tests Among these 320 SSRs 3 STSs and 538 DArT
markers were projected onto the consensus linkage map The remaining 332
polymorphic and informative DArT markers and 18 SSRs that could not be integrated
into the final map were not considered further
438 Genetic structure and linkage disequilibrium analysis
Prior knowledge suggested the presence of significant population structure in the
panel To decrease the false-positive rate this structure was accounted for in the
association test models The genetic structure of the panel has been investigated with
a combination of model- and distance-based analyses Model-based population
structure using a selection of 96 loosely linked highly informative and evenly spread
SSRs was assessed using the program STRUCTURE v 2 (Pritchard et al 2000)
Structure parameter settings were linkage model allele frequencies correlated burn-
in length 10000 and 10000 MCMC repetitions An optimum number of five
hypothetical subgroups were chosen to obtain the Q matrix of membership
coefficients of each accession to all subgroups (for details see Maccaferri et al 2011)
In the distance-based analysis pairwise genetic similarity values (GSij) were
calculated for all possible pairs of accessions using the simple matching coefficient
for multi-state markers a co-ancestry K (kinship) matrix was thus obtained for SSRs
(for details see Maccaferri et al 2010) Similarly the kinship matrix was also
calculated for DArT markers separately
Estimating LD between markers measures whether markers segregate independently
or not The program TASSEL ver 21 (www maizegeneticsnet Yu et al 2006) was
used to estimate the LD parameters Drsquo and r2 values as a function of the
corresponding inter-marker distances and the comparison-wise significance was
computed with 10000 permutations The r2 parameter was estimated for loci on the
same chromosome and compared based on genetic distances measured in cM If
within a chr region all pairs of adjacent loci were in LD this region was referred to
as an LD block (Stich et al 2005)
67
439 Marker-phenotype association analysis
Genome-wide scans for AM of loci governing stem rust resistance were conducted
using the coefficient of infection (CI) as reference phenotypic data AM analysis was
conducted using the TASSEL program ver 21 The 320 SSRs 3 STSs and the 538
DArT markers were tested for significance of marker-trait associations under (1) the
fixed general linear model (GLM) including the Q population structure results as
covariates (Q GLM) (2) the mixed linear model (MLM) including the Q population
structure results plus the K kinship matrix (Q + K MLM) For GLM analysis besides
the marker-wise association probability values the experiment-wise association
significance probability was obtained based on a permutation test implemented in
TASSEL (10000 permutations in total) The experiment-wise test provides a much
more severe threshold for significance as compared to the marker-wise test (Bradbury
et al 2007 2011) In the MLM analysis experiment-wise significance was inspected
using the false discovery rate (FDR) approach according to Storey and Tibshirani
(2003) and implemented in Qvalue program Multiple adjacent co-segregating
significant markers were assigned to a unique QTL region upon satisfaction of the
following conditions less than 20 cM of inter-marker genetic distance the presence
of significant and strong LD among markers (possibly with r2 values ge 06)
consistency of the marker allelic effects in sign (Massman et al 2011)
Prior to analyzing the phenotype data the homogeneity of experimental variance
across experiments was verified through the Bartlettrsquos test Chr regions with markers
that were repeatedly associated to stem rust response over two or more seasons as
well as using the mean data averaged across seasons were considered as putative
QTLs even though the experiment-wise significance threshold was not reached For
each putative QTL the most significant marker associated to stem rust response was
considered as the main QTL-tagging marker further results on the allelic distribution
and effects have been reported for the QTL-tagging markers only Linear regression
was used to investigate the fit of the accessionsrsquo haplotypes at the main QTLs
(significant over three to four seasons) to the corresponding phenotypic responses
(CIs averaged across seasons) Based on the results of the GLM and MLM tests the
non-rare alleles at the QTL-tagging markers significant over three to four seasons
68
were qualitatively classified as beneficial intermediate or deleterious and the
cumulative number of beneficial and deleterious alleles was counted for each
accession The accessionsrsquo disease response averaged across the four seasons was
regressed on the cumulative numbers of both beneficial and deleterious alleles The
significance of the regression was estimated with an F test
44 RESULTS
441 Response to stem rust
Stem rust infection was high in all four testing seasons allowing for clear and
unambiguous scoring of field reaction The mean CI values of the panel accessions
ranged from 336 for DZm-2010 to 493 for DZo-2010 In both years the off-season
experiment showed a disease pressure significantly (P le 001) higher than that
recorded in the main-season (Table 1) In all seasons a broad and continuous
variation within the panel was noted from close-to-immune highly resistant reactions
to highly susceptible ones as indicated by the observed disease response ranges
reported in Table 1 and by the CI frequency distribution in each season and across
seasons (reported in Figures 1-5)
The analysis of variance for stem rust reaction showed highly significant differences
(P le 00001) among accessions and seasons (results not reported) the accession times
season interaction was also significant (P le 001) The heritability coefficient of stem
rust response calculated across seasons using the data from the non-replicated
experiments was equal to 080 while the coefficient of variation reached 261 The
Pearson correlation coefficients between the stem rust responses recorded in the four
seasons (data not reported) were always highly significant (P le 0001) with values
ranging from 040 (DZo-2010 vs DZm-2010) to 058 (DZm-2009 vs DZo-2010)
Based on the distribution of the stem rust responses averaged over the four seasons
(Table 2) about 5 of the accessions (nine in total) were highly resistant (mean DSS
lt 10) and 19 (36 accessions) were categorized as moderately resistant (mean DSS
comprised between 10 and 30) Additionally 11 accessions (ie 6) were classified
as susceptible or highly susceptible (DSS equal to or higher than 70) their number
69
increased to 51 (ie 30 of accessions) when considering the single DZo-2010 season
that was characterized by an infection level significantly (higher than that reached in
the other three seasons
442 Relationship between population structure and response to stem rust
The genetic relationships among the accessions were investigated using both a
genetic-similarity and a model-based Bayesian clustering method and the results have
been reported in Figure 6 Both methods pointed out that the minimum and optimum
number of hypothetical well-distinct subgroups present in the panel were equal to
five It was shown that the five subgroups corresponded to clearly distinct breeding
lineages 1) the ICARDA germplasm bred for the dryland areas (subgroup S1) 2) the
ICARDA germplasm bred for the temperate areas (subgroup S2) 3) the Italian and
early rsquo70s CIMMYT germplasm (subgroup S3) 4) the late rsquo70s CIMMYT
germplasm widely adapted to Mediterranean conditions (subgroup S4) 5) the late
rsquo80s to early rsquo90s CIMMYT germplasm with increased yield potential (subgroup
S5) Based on the molecular assignment of each accession to the subgroup with the
highest Bayesian probability the five subgroups included 11 55 26 56 and 35
accessions respectively The membership coefficient for each of the five subgroups
averaged over all the accessions was equal to 009 029 014 029 and 019 from S1
to S5 respectively The differences for stem rust response among the five subgroups
were highly significant (P le 00001 results not reported) with the differences among
subgroups explaining 155 of the total variance Although differences among
subgroups were found significant the within-group component of variance prevailed
accounting for 532 of the total variation The effect of population structure on the
stem rust response was also investigated by means of regression analysis Using data
of each season separately a modest population structure effect was detected for the
DZo-2009 and DZm-2010 seasons with R2 values of 89 and 77 respectively
while a greater influence was detected for DZm-2009 and DZo-2010 with R2
values
of 147 and 208 respectively The mean and range of stem rust response values
(CIs) of each of the five subgroups are reported in Table 3 These values clearly show
that all five subgroups included accessions with a wide range of responses from
highly resistant to highly susceptible thus indicating that all subgroups are equally
informative and well-suited for AM purposes Considering the mean subgroup values
70
across seasons and based on the least significant difference among subgroups S4 and
S5 which mainly included CIMMYT elite germplasm showed significantly higher
stem rust susceptibility than S1 S2 and S3 The complete data set of phenotypic
response and population structure membership coefficients for each of the 183
accessions included in the association panel is reported as Appendix 2
443 Association mapping for stem rust response
In view of the strong genotype by season interaction marker-phenotype association
tests were conducted separately for each season as well as for the responses averaged
over the four seasons The association mapping (AM) analysis was conducted by
performing single-marker F tests using both the General Linear Model with Q
covariate matrix (population structure correction Q GLM) and the mixed linear
model with Q + K matrices (population structure and familial relatedness correction
Q + K MLM) The genome-wide scan revealed chromosome regions harboring
putative QTLs for stem rust response on all chromosomes except for 3B Overall 45
chr regions harbored markers that were significant (P le 005) in at least two seasons
under the Q GLM model as well as across the averaged data of the four seasons 36 of
these 45 chr regions showed significant effects also using the Q + K MLM model
Introducing the experiment-wise correction eight chr regions showed significant (P le
005) effects in the Q GLM model while in the Q + K MLM model the significance
was limited to one region on chr 6A which showed the strongest association with
stem rust response Based on these findings we decided to present detailed results of
the 36 chr regions which were detected in the marker-wise analysis and considered as
putative QTLs
Figure 7 summarizes the results of the Q + K MLM genome scan for the disease
response averaged across the four seasons In several cases the presence of a QTL
was evidenced by multiple significant associations at linked SSR and DArT markers
with inter-marker distances always comprised within 10 cM as estimated from the
durum consensus map and in most cases LD r2
values higher than 06 For each of
the QTLs that were identified as linkage-blocks of adjacent markers all the markers
significantly associated to the phenotype were checked for consistency of their effects
71
and the marker with the most significant association to the trait was considered as the
QTL-tagging marker
For 12 of the 36 chr regions considered as putatively harboring QTLs the
significance of the effects on stem rust response was confirmed across three to four
seasons (QTL features reported in Table 4 see also Figure 7) while the 24 additional
regions showed significant consistent effects in two seasons (Table 5 and Figure 7)
The QTLs with consistent effects across three to four seasons (Table 4) were also
those with the highest overall R2 values based on the season-mean data (in most cases
comprised between 40 and 70) as well as for single seasons (values ranging from
10 to 113) In particular regions on chromosomes 1BS (QTL-tagging marker
barc8) 2AS (gwm1045) 3AS (wPt-7972) 6AL (gwm427 and CD926040) and 7AS
(wPt-2799) showed the highest R2
values and all these QTLs were tagged by a series
of adjacent markers that supported the primary QTL effect Regions on chromosomes
2BL 3AL and 5AL had consistently high R2 values but were identified by single
markers
The QTL tagged by barc8 on chr 1BS at 320 cM showed strong LD (r2
range of
060-067) along a 90 cM interval that included nine DArT markers (following the
mapping order of the consensus map wPt-2999 wPt-4605 wPt-3582 tPt-8831 wPt-
9864 wPt-4133 wPt-1876 wPt-5899 and wPt-4729) and one SSR marker
(gwm1100) In the distal region of chr 6AL highly significant effects were detected
at three closely adjacent chr regionslinkage that overall spanned 158 cM on the
durum consensus linkage map but showed low LD as to each others Each of these
three chr regions were identified respectively by i) the marker pair gwm427-wmc580
(at chro position 1395 cM r2 LD value between the two markers = 098) ii) the
EST-derived marker CD926040 (chr position 1440 cM) associated to wPt-9474
wPt-4229 wPt-5654 wPt-3247 and wPt-4663 (spanning a 93 cM interval with
moderate LD among markers and r2 values ranging from 012 to 058) and iii)
barc104 (chr position 1553 cM)The marker pair gwm427-wmc580 showed low LD
values with all the other markers in the region (r2 values from 001 to 020) while LD
was detected between the linkage block of markers associated to CD926040 and
barc104 (r2 from 026 to 055)
72
As compared to the QTLs identified across three to four seasons those (24 in total)
with significant effects in only two seasons (Table 5) showed in general lower effects
and R2 values both on a mean- (values from 10 to 38) and single-season basis
Nonetheless some of these QTLs (eg those on chrs 1AS 1BL 2B 3AL 6A and
7B) showed relatively high R2 values in specific seasons (from 36 to 80)
The least square phenotypic means (based on CIs) of non-rare alleles at the QTL-
tagging markers with significant effects in three to four seasons are reported in Table
6 The SSR marker gwm427 (chr 6AL) showed two common alleles (molecular
weight equal to 212 and 188 bp) that differed significantly (P le 005) for the
associated stem rust response with the 188 bp allele being associated with lower CI
values The EST-derived marker CD926040 (chr 6AL) carried three common alleles
with phenotypic effects that were estimated to be beneficial for one allele (855 bp)
over all seasons and detrimental (ie associated to increased susceptibility) for the
other two alleles (851 and 845 bp) At barc104 (chr 6AL) the 202 and 206 bp alleles
were both considered as beneficial as compared to the 172 bp allele (detrimental)
Table 7 reports the frequencies in the five main germplasm subgroups of the non-rare
alleles at the QTL-tagging markers that were significant in three to four seasons
Inspection of allele frequencies as reported in Table 7 indicates that allele fixation
within subgroups was rare and further suggests that in most cases the frequency of
the resistant alleles and of the other common alleles can be considered as balanced (gt
020) hence informative In general common alleles were present with balanced
frequencies - the best condition to maximize the reliability of the association assay -
in two to three subgroups while barc104 (chr 6AL) wPt-2799 (chr 7AS) and wPt-
7785 (chr 7AS) showed balanced allele frequencies across four or five subgroups
For each QTL-tagging marker the frequency of the beneficial alleles across the five
germplasm subgroups was highly variable As an example in five cases beneficial
alleles were observed at relatively high frequencies (gt 050) in more than one
subgroup ie in all the five subgroups (wPt-7992 chr 3AS) in four subgroups
(barc8 and gwm1045 chr 1BS and 2AS respectively) in three subgroups (barc104
chr 6AL) and in two subgroups (wmc388 chr 3AL)
73
Overall subgroup 1 (ICARDA accessions bred for drylands) had higher frequencies
of resistance allele at the QTLs on chr 5A subgroup 5 (CIMMYT accessions
released in the late rsquo80s - early rsquo90s) though characterized by mean phenotypic
responses higher than those showed by the other groups had higher frequencies of
resistance allele at QTLs on chr 6A compared with the other subgroups
For each locus consistently associated to stem rust resistance over seasons in addition
to reporting the allelic effects estimated as phenotypic least squared means over the
whole association panel and the consistency of their significant differences (Table 6)
were further inspected within panel subgroups Markers associated to the main stem
rust resistance on chrs 1B (barc8) 6A (CD926040 and barc104) and 7A (wPt-2799)
were considered for the comparison of the allelic phenotypic values in the entire panel
and its subpopulations as these markers accounted for the largest proportion of
phenotypic variation Accessions carrying the 255 bp allele at barc8 the 855 bp allele
at CD926040 the 202 or 206 bp allele at barc104 as well as the presence of the band
at wPt-2799 had significantly (P le 005) lower stem rust infection than the other
accessions across three or more of the five subgroups that composed the panel
The relevance of the QTL-tagging markers significant over three or four seasons in
predicting the accessionsrsquo stem rust response was further investigated by regressing
CI values on the cumulated number of beneficial alleles of the accessions The scatter
plot thus obtained is reported in Figure 8 Although the significance of the linear
regression was high (P le 0001) the R2 value of the regression was very low (56)
As expected the regression coefficient was negative (b = -175) The increase in
resistance associated to the cumulative effects of the beneficial alleles is also revealed
by the comparison between the response values predicted for zero beneficial alleles
(CI = 483) and the maximum number (9) of cumulated beneficial alleles (CI = 325)
The significance of the regression was also tested for the pool of QTL-tagging
markers when considering only the accessions with the susceptible allele at
CD926040 the maker most associated to the Sr13 region also in this case the
regression on the number of beneficial alleles was highly significant (P le 0001) with
the b coefficient and the R2 value equal to -352 and 161 respectively
74
45 DISCUSSION
A better understanding of the genetic basis underlying the durum wheat response to
Ug99 and durum-specific Ethiopian races of stem rust will help enhance disease
resistance of this crop globally while shedding light on the evolution of durum wheat-
stem rust relationships in East Africa To this end association mapping (AM) is a
useful approach as indicated by the growing interest in its application to identify
disease-resistance genesQTLs in a wide range of crops (Ersoz et al 2009 Hall et al
2010 Maccaferri et al 2010 Haile et al 2012)
The AM durum panel evaluated in the present study encompasses a large portion of
the genetic variation present in the elite germplasm pools commonly used by durum
breeders Only very few landracespre-Green Revolution genotypes were kept because
of their ldquofoundersrdquo role and significant contribution to the development of some of the
modern germplasm groups The predominance of elite germplasm in this panel was
justified for several reasons First the presence in the elite germplasm of LD which
extends over rather long distances as shown in Maccaferri et al (2005 2006 and
2011) enabled us to conduct a genome-wide scan with an average marker density
matching the genotyping capacity allowed by the marker systems currently available
for durum wheat mainly SSR and DArT markers (Maccaferri et al 2003 Mantovani
et al 2008) Second very little information about useful loci for quantitative stem rust
field resistance is available in durum wheat and thus the modern germplasm pool was
considered as the primary target for such investigation Finally the high homogeneity
in phenology of the elite materials herein considered (Maccaferri et al 2006) as
compared to the higher heterogeneity in phenology observed in other AM collections
particularly those including landraces (Wang et al 2012) allowed for a more
meaningful assessments of the disease responses
451 Response of the elite durum wheat germplasm to stem rust under field
conditions
Highly significant genotype times season interactions were detected within the AM panel
used in this study These interactions were due not only to magnitude effects since
the stem rust response of some accessions varied from resistant in one season to
75
clearly susceptible in another season This finding was confirmed by the values of
correlation coefficients between accession responses in different seasons that even if
highly significant were quite low (r lt 058) These interactions could be explained in
part by the different growing conditions prevailing in different seasons which are
known to affect disease incidence and intensity Such inter-season effect on disease
intensity is clearly seen in the increase in average intensity in the warmer off-seasons
compared to the more temperate conditions during the main-seasons Most
importantly perhaps genotype times season interactions may have been due to the use of
a mixture of races with different virulence spectra rather than a single race The
different races especially the least characterized durum-specific ones may have
impacted differently on final reaction in different seasons due to different starting
relative quantities fitness or interactions with season-specific environmental andor
inoculation conditions However the use of such mixture rather than single race
inoculum while predictably complicating the interpretation of the results was
essential for this study to address comprehensively stem rust threats that are relevant
to durum wheat breeding under field conditions
The use of Ug99 or its more recent variants alone all avirulent on Sr13 would have
had limited relevance to global durum wheat breeding as resistance to them is present
in the most germplasm groups worldwide On the other hand the exclusive use of the
Ethiopian races as single isolates or mixtures because of their unclear virulence
spectrum would have likely provided incomplete information as to the global
usefulness of sources of resistance or genomic regions involved in controlling such
resistance Also the presence of Ug99 in the mixture was important since this is the
only race that so far has migrated out of Africa into Asia and could therefore become
the first threat to the South Asian durum-growing areas Whatever the reason for the
highly significant genotype times season interaction its effects were mitigated and the
robustness of our conclusions was supported by the analysis of single season data in
addition to the results averaged over the seasons Genotypes were considered resistant
or susceptible only when they performed as such consistently across seasons and
phenotype-marker associations as discussed below were considered relevant only
when they were significant in at least three of the four seasons Nevertheless clear
trends in the distribution of genetic resistance present in this AM panel were observed
and reliable conclusions could be drawn First is the very low frequency (5 of all
76
accessions) of high-level resistance expressed as reactions that are consistently close-
to-immune or always below 10 DSS supporting the conclusions from previous
studies that elite durum wheat germplasm is relatively poor in genes with major
effects providing complete field resistance to stem rust (Singh et al 1992 Bonman et
al 2007) This is also in agreement with results from evaluations conducted in
Ethiopia at the onset of the Borlaug Global Rust Initiative in 2007-08 which showed
only 3 of resistant lines within the CIMMYT elite germplasm tested in that year
(Ammar and Badebo unpublished) This trend seems to extend to wider germplasm
groups as shown by Olivera et al (2010) who reported 52 of field resistance in a
worldwide collection of 996 durum wheat accessions and other tetraploid relatives
under conditions and with races similar to those used in the present study
Another interesting reaction group includes genotypes showing DSS between 10 and
20 mostly with R-MR to MS type pustules with a reaction type very similar to that
of local Ethiopian cultivars such as Boohai or Ude considered adequately resistant to
be competitive in most areas of Ethiopia In the present study 9 of the genotypes
were consistently classified in this group and therefore could be considered as
resistance sources for breeding programs possibly providing usable resistance genes
In contrast to the low frequency of accessions with high levels of resistance a
sizeable portion (at least 28) showed a DSS consistently between 30 and 40 Such
intermediate albeit susceptible values can indicate when accompanied by seedling
susceptibility to the races investigated in this study the presence in the durum
germplasm in relatively high frequency of minor genes conferring quantitative and
partial field resistance to both Ug99 and the Ethiopian durum races of stem rust The
accumulation of such genes in a single genotype provided their effects are additive
and seedling susceptibility confirmed should result in an improved resistance
comparable to that conferred by major gene-based resistance but otherwise race non-
specific and thus more likely to be durable (Skovmand et al 1978 Lagudah 2011
Singh et al 2011) Alternatively the low rust response observed in some accessions
included in the present study may be due to the presence and possible accumulation of
race-specific seedling genes which exhibit moderate resistance to moderate
susceptibility at the adult plant growth stage Genotypes useful as sources of minor
gene-based resistance to leaf rust have been identified in durum wheat (Herrera-
77
Foessel et al 2007) and the improvement of resistance through the accumulation of
such genes has been demonstrated (Herrera-Foessel et al 2009)
452 Genetic basis of the resistance to stem rust in durum wheat and relevance to
breeding
Based on the observation that complete immunity to the Ethiopian races was seldom
observed in the field under heavy infection conditions it has been suggested that
resistance in durum wheat was likely to be based on additivity ie resulting from the
cumulative effect of additive beneficial alleles from multiple loci (major and minor)
of variable effect (Osman Abdallah personal communication Ayele Badebo
personal communication) This finding is clearly supported in the present study by the
fact that resistance was always associated with several genomic regions each
contributing a small fraction of the variability associated with field reaction while
none of them was individually capable of providing a high level of resistance When
estimated in single seasons each QTL identified in this study explained not more than
13 of the phenotypic variation for stem rust resistance unlike previous QTL studies
based on wide crosses where QTL with R2
values as high as 37 have been reported
(Bansal et al 2008) Even though QTL effects estimated via AM are usually lower
than those estimated through biparental mapping the fact that even the most resistant
close-to-immune genotypes did not owe their resistance to a single major QTL
indicates the marginal role of classical major genes as often seen in bread wheat
Furthermore it is also known that most of the seedling major genes described for
stem rust resistance in wheat including Sr13 native of tetraploid wheat at the adult
plant stage confer medium-resistance to medium-susceptiblity rather than complete
resistanceimmunity The oligogenic nature of the resistance is also supported by the
negative albeit low relationship between the number of accumulated favorable
alleles and field reaction whether or not the genomic region corresponding to Sr13 a
major gene known to provide complete resistance to Ug99 was included in the
analysis Recently this hypothesis has been strengthened by the results obtained from
the genetic mapping of the factors responsible for the resistant response of the
ICARDA elite cultivar lsquoSebatelrsquo (Haile et al 2012) also included in this study The
genetic basis of Sebatelrsquo resistance turned out to be oligogenic with nine major and
minor QTLs identified in the RIL population and R2
values ranging from 50 to
78
340 Another aspect that can contribute to explain the different results found
between durum and bread wheat is that the elite breeding germplasm of durum wheat
has not been improved in the past decades by means of an extensive use of wide-
crosses to introgress alleles with strong phenotypic effects (Maccaferri et al 2005) as
has been the case with hexaploid wheat
In the absence of single-race analysis at the seedling and adult stages with a wide
collection of races conclusive evidence cannot be drawn as to the nature of the
resistance observed in the present study Nevertheless this report on the oligogenic
nature and likely minor-gene basis of stem rust resistance in durum wheat has
important implications for breeding activities It suggests that deploying the sources
identified in this study in a resistance-breeding program would result in an increase in
resistance that would likely be more durable as compared to a monogenic major-gene
resistance However unlike the large-effect QTLs that are easily identified and
maintained in breeding populations through phenotypic selection and can be easily
managed via marker-assisted selection (MAS) the simultaneous handling of small-
effect QTLs is much more complex In fact an effective phenotypic selection for
small-effect loci requires well-planned populations and intense uniform epidemics at
every cycle of visual selection in order to readily detect and accurately score
transgressive segregants Under these conditions the availability of useful markers
reliably tagging the minor QTLs and the ready access to MAS facility becomes
critical In the near future the availability of high-density single nucleotide
polymorphism (SNP) platforms including thousands of highly multiplexed assays will
allow for a nearly complete genome coverage and the possibility to switch from
single-marker to haplotype-based analyses thus enabling a full exploitation of the
potential of AM (Akhunov et al 2009 Kaur et al 2011 Trebbi et al 2011 You et al
2011 van Poecke et al 2013) The use of the same SNP assays in applied breeding
programs will also facilitate the simultaneous selection of multiple beneficial alleles
for partial resistance Thus MAS strategies that can effectively deal with a relatively
high number of markers and haplotypes are required to accumulate and maintain the
beneficial alleles at these small-effect QTLs in order to achieve an acceptable and
durable level of resistance for stem rust within durum breeding populations (Kuchel et
al 2007) With this aim recent advances in the implementation of genomic selection
in crop species in particular to improve stem rust resistance in hexaploid wheat
79
(Rutkoski et al 2010) indicate that this could be the most efficient approach to
exploit the potential of high-density molecular marker screening tools
453 QTLs identified through association mapping and relationship with previously
described QTLs and Sr loci
The joint Q GLM and Q + K MLM association analyses highlighted several chr
regions putatively harboring QTLs with main effects of varying magnitudes on field
stem rust response As expected multiple-test correction drastically reduced the
number of significant regions a condition not well-suited for an exploratory analysis
like the present one In addition our goal was to keep a reasonable power to identify
loci conferring partial resistance with alleles characterized by relatively small effects
Therefore also the most significant chr regions based on the less stringent marker-
wise significance test has been considered provided that the associations were
significant on the season average data and in at least two of the four seasons
Several QTLs identified in this study co-located with previously reported major Sr
loci as well as with a number of QTLs recently identified through AM in hexaploid
wheat (Yu et al 2011) and in tetraploid wheat (Haile et al 2012) Others namely
those discovered on chrs 1A 1B 3A 4A 4B 5A5B 7A and 7B were not reported
elsewhere These results highlight the effectiveness of AM to dissect the genetic basis
of moderately complex traits while showing its potential to unveil the presence of
previously unknown QTLs provided that an appropriately balanced and
phenologically suitable set of accessions are evaluated
In chr 1A significant effects were identified in the distal end and near the centromere
of chr 1AS In both cases significant effects were reported in hexaploid and
tetraploid wheat respectively within 10 cM distance from the significant markers
with associated R2 values of ca 50 Highly significant effects were detected near
the centromere of chr 1B This region is known to harbor Sr14 as well as the 1B1R
translocation-based Sr31 (Zeller 1973) However due to the absence of the 1B1R
translocation in the present panel the effect herein detected is likely due to Sr14 A
recent AM study in hexaploid wheat (Yu et al 2011) showed the presence of a QTL
associated to stem rust response in this same region precisely on the chr arm 1BS
80
Moreover three DArT markers significantly associated to stem rust response were
reported in the same region by Crossa et al (2007) Significant markers on the
proximal region of chr arm 1BL such as cfd65 wPt-8168 and gwm947 are located in
the same region as Sr14 which is effective against Ug99 races (Singh et al 2006)
The presence of the Sr14 resistance allele in the durum wheat germplasm can be
traced back to Triticum dicoccum Schrank accessions such as Khapli emmer which is
known to carry Sr14 and is also considered as one of the few founders of the modern
durum wheat germplasm (Autrique et al 1996) Sr14 has been considered as one of
the causes of stem rust resistance in some synthetic wheat-derived lines (Njau et al
2010)
Overlap of the QTL location in our study and a minor QTL described by Haile et al
(2012) in the durum wheat RIL population was found on chr 2AS On chr arm 2BL
gwm1300 and wmc356 (509 cM apart) were significantly associated with stem rust
resistance for two and three seasons respectively These markers mapped to regions
corresponding to the putative locations of Sr9SrWeb and Sr28Sr16 respectively At
the Sr9 region two alleles are known Sr9e which was reported to be ineffective
against Ug99 at the seedling stage while showing MR to MS infection types in the
field nurseries (Jin et al 2007) and Sr9g which provides field resistance to Ug99 and
to the Ethiopian races Sr9e is present in many durum wheat genotypes including the
CIMMYT landmark Yavaros C79 and its sister line Karim 80 which were classified
as moderately resistant to moderately susceptible under the present studyrsquos conditions
Sr9g is one of the resistance alleles reported to be present in the durum cultivar
Iumillo (McIntosh et al 1995)
Several regions with significant associations to field reaction to stem rust were
detected on chr 3A where Sr27 and Sr35 both effective against Ug99 have been
reported (McIntosh et al 1995 Singh et al 2006) However as Sr27 originated from
a wheat-rye translocation engineered exclusively in bread wheat and Sr35 from
Triticum monococcum transferred to some tetraploids of Canadian origin none of
which was present in this study or in the pedigree of the accessions of the AM panel
the chr 3A related associations detected herein are likely to involve novel loci or
alleles The distal region of chr 3BS is known to harbor Sr2 a gene that confers
partial resistance to Ug99 at the adult plant stage In hexaploid wheat the beneficial
81
Sr2 allele selected by MAS originates from the tetraploid wheat germplasm (Yaroslav
emmer) Although the Sr2 locus has been reported as the major component of
resistance in the durum wheat RIL population Sebatel times Kristal (R2 value equal to
340 Haile et al 2012) in the durum elite germplasm considered in this study it
was irrelevant The SSR markers used to provide information on the Sr2-associated
haplotype (gwm533 and barc133) showed that this haplotype was very rare in the
sample of elite durum wheat accessions herein considered under the allele frequency
cutoff threshold used for the AM test (100)
On chr 6A the AM analysis highlighted six QTLs with significant effects on field
stem rust reaction One of these regions (approximately 8 cM wide) tagged by wPt-
7330 in the distal portion of chr arm 6AS co-locates with the region known to harbor
Sr8 a gene known to be ineffective against Ug99 (Singh et al 2006) Interestingly
this region completely overlapped with a QTL for stem rust resistance recently
reported in an AM study in hexaploid wheat (Yu et al 2011) A wide region on chr
arm 6AL about 40 cM wide plays a major role in controlling stem rust response in
the durum wheat germplasm tested herein This region includes two distinct sub-
regions harboring effective but most probably distinct genes
The first proximal sub-region tagged by tPt-4209 gwm1150 and gwm169 and
associated with stem rust resistance in this study co-locates with Sr26 a gene
effective against Ug99 (Singh et al 2006) and the Ethiopian races (Ayele and Ammar
unpublished results) However the presence of the known Sr26 allele in the AM panel
or in the durum wheat germplasm at large is unlikely the Sr26-resistant allele having
been introgressed from the wild relative Thinopirum ponticum exclusively into bread
wheat A novel geneallelic variant other than Sr26 should be located in this sub-
region Remarkably this QTL region has been independently confirmed in the Sebatel
times Kristal durum population and reported as QSrIPK-6A (Haile et al 2012) a QTL
with R2 value equal to 93 and tagged by the SSR markers gwm494-gwm1150 The
second distal sub-region of chr 6AL includes three further sub-regions (tagged by
gwm427 CD926040 and barc104) strongly associated to stem rust response These
sub-regions co-locate with Sr13 mapped in tetraploid wheat to chr 6AL within a 12
to 28 cM interval flanked by the EST-derived markers CD926040 and BE471213
(Simons et al 2011) In our study CD926040 showed the maximum R2 value and was
82
consistently significant across all four seasons Sr13 is effective against the TTKS
complex of Puccinia graminis ssp tritici namely TTKSK (Ug99) TTKST and
TTTSK However virulence for Sr13 within Ethiopian stem rust populations has been
suspected for some time and recently confirmed by the characterization of the
TRTTF and JRCQC isolates collected from the Ethiopian site in Debre-Zeit (Olivera
et al 2010 and 2012) Therefore while very effective against the TTKSK or Ug99
lineage (the only ones so far to have migrated out of Africa) its presence alone is not
sufficient for adequate protection in Ethiopia This is clearly seen when comparing the
field reaction and the long-range haplotype in the extended Sr13 chr region of two
US desert-durum cultivars namely Kronos and Kofa which were considered in the
present study While both cultivars exhibited the haplotype of Khapli Emmer known
to carry Sr13 (Knott 1962) Kronos had one of the most consistently resistant
reactions over seasons while Kofa was regularly susceptible Taking into account all
of the above information the presence of the resistant allele(s) in the Sr13 region is
valuable for breeding activities and should be pursued for pyramiding multiple useful
alleles Specifically for the Sr13 locus Simons et al (2011) found different linked
marker alleles among the Sr13 donors suggesting that breeding programs used
different sources of Sr13 or that independent recombination event occurred between
loci In our study the durum wheat accessions Khapli Kofa and Kronos were the
donors of resistant Sr13 alleles (Simons et al 2011) The LD decay among the three
main linkage blocks (tagged by gwm427-wmc580 CD926040 and barc104) near Sr13
and the variation in band sizes of the marker alleles indicate that the current markers
are not fully diagnostic in a wide range of backgrounds and therefore cannot be used
to predict with high confidence the presence of Sr13 in unknown sets of germplasm
This notwithstanding these markers can be used to follow the Sr13 resistant alleles in
segregating populations involving parental lines (eg Khapli Kofa and Kronos)
related to any of the known Sr13 sources The future availability of high-density SNP
platforms (Trebbi et al 2011 van Poecke et al 2012) will likely provide much better
haplotype resolution
The significant effects identified in chrs 6BS 7AS and 7BS are specific of the durum
germplasm herein considered Accordingly these regions have not been reported as
QTL locations neither in t bread wheat germplams nor in the Sebatel times Kristal
population On the distal portion of chr 7AL DArT markers with significant effects
83
on stem rust resistance in our study overlapped with the locations of Sr22 and
QSripk-7AL (Haile et al 2012) This is additional independent evidence for the
relevance of this QTL region for stem rust response Finally AM detected QTLs at
the distal end of chr arm 7BL (QTL-tagging marker wPt-8615) with several DArT
markers associated with stem rust resistance This region co-locates with that known
to harbor Sr17 a gene linked to Lr14a and Pm5 in bread wheat (Crossa et al 2007) It
also is consistent with a region reported to include a stem rust QTL in the Arina x
Forno RIL population (Bansal et al 2008) Sr17-related resistance to stem rust has
been reported in tetraploid wheat as well as synthetic bread wheat (Bariana et al
2009) In the present study there was no relationship either in coupling or repulsion
between stem rust resistance and the presence of Lr14a (known from previous studies
on the same panel) present in the same region This may indicate that both genes are
widely spaced so no linkage could be detected Further research is underway to
confirm the presence of known resistancesusceptibility alleles for the aforementioned
designated stem rust genes at the seedling stage
Based on the results herein presented it is clear that quantitative additive variation is
present in the elite germplasm at chromosome regions known to carry well-
characterized resistance genes (Sr14 Sr28-Sr16 Sr8 and particularly Sr13) whose
alleles are tagged by known molecular markers and are known to be frequently
defeated by specific races or non-effective at the seedling stage Nevertheless our
results show that the same genes may have residual appreciable effects (though of
quantitative and additive nature) at the adult open field stage particularly when
present in multiple combinations
It is also known that most of the seedling stem rust resistance genes produce medium-
susceptible to medium-resistant responses thus more quantitative in nature as
compared to classical resistant responses and more subjected to genotype times
environment interaction at the adult plant stage (including Sr13 and with the
exception of Sr6 Sr9e Sr17 Sr19 Sr21 and Sr31) The low rust response phenotypes
observed in the present study can therefore be ascribed to the presence of
combinations of resistance genes including major designated genes and additional
novel genesQTLs
84
46 CONCLUSIONS
Association mapping in elite germplasm has the potential to accelerate the translation
of basic genetic information towards applications in crop improvement and cultivar
release Our study shows that AM effectively complement bi-parental mapping
studies by providing independent validation of previously detected QTLs and
discovering new QTLs Additionally our study highlighted the presence of valuable
genetic variation that could be exploited to sustainably enhance stem rust resistance in
durum wheat The oligogenic nature or minor-gene basis of resistance to Ug99 and
the Ethiopian races of stem rust in durum wheat have been clearly documented
Several chr regions harboring putative QTLs involved in the stem rust response in the
field under high infection were consistently detected across seasons the allelic
variation at these QTLs can be exploited for further validation studies and utilization
in MAS programs The AM results reported herein confirm the important role of the
Sr13 region but also its limitation in individually addressing the presence of the
Ethiopian races Our analysis also highlighted the role of chr regions putatively
harboring Sr14 and Sr9 Sr17 to be further dissected as providing alleles with
beneficial effects on final resistance but again not sufficiently strong individually
Additionally the AM analysis strengthen the role of five QTLs recently described in
the Sebatel times Kristal durum mapping population and located in chromosome regions
where no designated resistance genes were mapped New regions so far not reported
to be associated with stem rust resistance either in durum or bread wheat have been
detected These regions contribute minor genes that can be accumulated through MAS
towards a more durable resistance to stem rust in durum wheat
85
47 LITERATURE CITED
Admassu B Lind V Friedt W Ordon F (2009) Virulence analysis of Puccinia
graminis f sp tritici populations in Ethiopia with special consideration of
Ug99 Plant Pathol 58 362-369
Akbari M Wenzl P Caig V Carling J Xia L et al (2006) Diversity arrays
technology (DArT) for high-throughput profiling of the hexaploid wheat
genome Theor Appl Genet 113 1409-1420
Akhunov E Nicolet C Dvorak J (2009) Single nucleotide polymorphism genotyping
in polyploid wheat with the Illumina GoldenGate assay Theor Appl Genet
119 507-517
Autrique E Nachit MM Monneveux P Tanksley SD Sorrells ME (1996) Genetic
diversity in durum wheat based on RFLPs morphophysiological traits and
coefficient of parentage Crop Sci 36 735-742
Badebo A Gelalcha S Ammar K Nachit M M Abdalla O (2009) Durum wheat
research in Ethiopia In Proceedings of the 2009 BGRI Technical Workshop
CIMMYT Cd Obregon Sonora Mexico March 17-20 2009 pp 28
Bansal UK Bossolini E Miah H Keller B Park RF Bariana HS (2008) Genetic
mapping of seedling and adult plant stem rust resistance in two European
winter wheat cultivars Euphytica 164 821-828
Beavis WD (1998) ETL analysis power precision and accuracy In Paterson AH
(ed) Molecular analysis of complex traits CRC Boca Raton pp 145-161
Belaid A (2000) Durum wheat in WANA (West Asia and North Africa) production
trade and gains from technological change In Royo C Nachit MM Di Fonzo
N Araus JL (eds) Durum wheat improvement in the Mediterranean region
new challenges vol 40 Options Mediterraneennes CIHEAM-IAMZ
Zaragoza pp 35-39
Bonman JM Bockelman HE Jin Y Hijmans RJ Gironella AIN (2007) Geographic
distribution of stem rust resistance in wheat landraces Crop Sci 47 1955-
1963
Bradbury PJ Zhang Z Kroon DE Casstevens TM Ramdoss Y Buckler ES (2007)
TASSEL software for association mapping of complex traits in diverse
samples Bioinformatics 23 2633-2635
86
Bradbury P Parker T Hamblin MT Jannink JL (2011) Assessment of Power and
False Discovery Rate in Genome-Wide Association Studies using the Barley
CAP Germplasm Crop Sci 51 52-59
Breseghello F Sorrells ME (2006) Association mapping of kernel size and milling
quality in wheat (Triticum aestivum L) cultivars Genetics 172 1165-1177
Buntjer JB Sorensen AP Peleman JD (2005) Haplotype diversity the link between
statistical and biological association Trends Plant Sci 10 466-471
Ceoloni C Forte P Gennaro A Micali S Carozza R Bitti A (2005) Recent
developments in durum wheat chromosome engineering Cytogenet Genome
Res 109 328-334
Crossa J Burgueno J Dreisigacker S Vargas M Herrera-Foessel SA Lillemo M et al
(2007) Association analysis of historical bread wheat germplasm using
additive genetic covariance of relatives and population structure Genetics 177
1889-1913
de Givry S Bouchez M Chabrier P Milan D Schiex T (2005) CAR (H) (T) A Gene
multipopulation integrated genetic and radiation hybrid mapping
Bioinformatics 21 1703-1704
Ersoz ES Yu J Buckler ES (2009) Application of linkage disequilibrium and
association mapping in maize In Kriz A Larkins B (eds) Molecular genetic
approaches to maize improvement Springer Berlin pp 173-195
Eversmeyer MG Kramer CL (2000) Epidemiology of wheat leaf and stem rust in the
central Great Plains of the USA Annu Rev Phytopathol 38 491-513
Feuillet C Langridge P Waugh R (2008) Cereal breeding takes a walk on the wild
side Trends Genet 24 24-32
Flint-Garcia SA Thornsberry JM Buckler ES (2003) Structure of linkage
disequilibrium in plants Annu Rev Plant Biol 54 357-374
Gupta PK Varshney RK Sharma PC Ramesh B (1999) Molecular markers and their
applications in wheat breeding Plant Breed 118 369-390
Gupta PK Rustgi S Kulwal PL (2005) Linkage disequilibrium and association
studies in higher plants present status and future prospects Plant Mol Biol
57 461-485
Habash DZ Kehel Z Nachit M (2009) Genomic approaches for designing durum
wheat ready for climate change with a focus on drought J Exp Bot 60 2805-
2815
87
Haile JK Nachit MM Hammer K Badebo A Roumlder MS (2012) QTL mapping of
resistance to race Ug99 of Puccinia graminis f sp tritici in durum wheat
(Triticum durum Desf) Mol Breed DOI 101007s1032-012-9734-7
Hall D Tegstrom C Ingvarsson PK (2010) Using association mapping to dissect the
genetic basis of complex traits in plants Brief Funct Genom 9 157-165
Heffner EL Sorrells ME Jannink J (2009) Genomic selection for crop improvement
Crop Sci 49 1-12
Herrera-Foessel SA Singh RP Huerta-Espino J Crossa J Djurle A Yue J (2007)
Evaluation of slow rusting resistance components to leaf rust in CIMMYT
durum wheats Euphytica 155 361-369
Herrera-Foessel SA Singh RP Huerta-Espino J Ammar K (2009) Pyramiding Slow
Rusting Genes for Durable Resistance to Leaf Rust in Durum Wheat Borlaug
Global Rust Initiative Technical Workshop 2009 Ciudad Obregon Sonora
Mexico March 17-20 2009
Jin Y Singh RP Ward RW Wanyera R Kinyua M Njau P Pretorius ZA (2007)
Characterization of seedling infection types and adult plant infection responses
of monogenic Sr gene lines to race TTKS of Puccinia graminis f sp tritici
Plant Dis 91 1096-1099
Jin Y Szabo LJ Pretorius ZA Singh RP Ward R Fetch T Jr (2008) Detection of
virulence to resistance gene Sr24 within race TTKS of Puccinia graminis f sp
tritici Plant Dis 92 923-926
Jin Y Szabo L Rouse M Fetch T Jr Pretorius ZA Wanyera R Njau P (2009)
Detection of virulence to resistance gene Sr36 within race TTKS lineage of
Puccinia graminis f sp tritici Plant Dis 93 367-370
Kaur S Franki MG Forster JW (2011) Identification characterization and
interpretation of single-nucleotide sequence variation in allopolyploid crop
species Plant Biotechnol J 2011 Aug 10 doi 101111 j 1467-76522011
00644 x
Klindworth DL Miller JD Jin Y Xu SS (2007) Chromosomal locations of genes for
stem rust resistance in monogenic lines derived from tetraploid wheat
accession ST464 Crop Sci47 1441-1450
Knott DR (1962) The inheritance of resistance to races 15B and 56 of stem rust in the
wheat variety Khapstein Can J Agric Sci 42 415-419
88
Kuchel H Ye GY Fox R Jefferies S (2005) Genetic and economic analysis of a
targeted marker-assisted wheat breeding strategy Mol Breed 16 67-78
Kuchel H Langridge P Eagles HA Jefferies SP (2007) Genetic dissection of grain
yield in bread wheat I QTL analysis Theor Appl Genet 115 1029-1041
Lagudah ES (2011) Molecular genetics of race non-specific rust resistance in wheat
Euphytica 179 81-91
Maccaferri M Sanguineti MC Donini P Tuberosa R (2003) Microsatellite analysis
reveals a progressive widening of the genetic basis in the elite durum wheat
germplasm Theor Appl Genet 107 783-797
Maccaferri M Sanguineti MC Noli E Tuberosa R (2005) Population structure and
long-range linkage disequilibrium in a durum wheat elite collection Mol
Breed 15 271-289
Maccaferri M Sanguineti MC Natoli V Ortega JLA Ben Salem M Bort J
Chenenaoui C De Ambrogio E del Moral LG De Montis A El-Ahmed A
Maalouf F Machlab H Moragues M Motawaj J Nachit M Nserallah N
Ouabbou H Royo C Tuberosa R (2006) A panel of elite accessions of durum
wheat (Triticum durum Desf) suitable for association mapping studies Plant
Gen Res 4 79-85
Maccaferri M Sanguineti MC Corneti S Ortega JLA Ben Salem M Bort J
DeAmbrogio E del Moral LFG Demontis A El-Ahmed A Maalouf F
Machlab H Martos V Moragues M Motawaj J Nachit M Nserallah N
Ouabbou H Royo C Slama A Tuberosa R (2008) Quantitative trait loci for
grain yield and adaptation of durum wheat (Triticum durum Desf) across a
wide range of water availability Genetics 178 489-511
Maccaferri M Sanguineti MC Mantovani P Demontis A Massi A Ammar K
Kolmer J Czembor J Ezrati S Tuberosa R (2010) Association mapping of
leaf rust response in durum wheat Mol Breed 26 189-228
Maccaferri M Sanguineti MC del Moral LFG Demontis A El-Ahmed A Maalouf F
Machlab H Martos V Moragues M Motawaj J Nachit M Nserallah N
Ouabbou H Royo C Slama A Tuberosa R (2011) Association mapping in
durum wheat grown across a broad range of water regimes and yield potential
J Exp Bot 62 409-438
Maccaferri M Ratti C Rubies-Autonell C Vallega V Demontis A Stefanelli S
Tuberosa R Sanguineti MC (2011) Resistance to Soil-borne cereal mosaic
89
virus in durum wheat is controlled by a major QTL on chromosome arm 2BS
and minor loci Theor Appl Genet 123 527-544
Mago R Lawrence GJ Ellis JG (2011) The application of DNA marker and doubled-
haploid technology for stacking multiple stem rust resistance genes in wheat
Mol Breed 27 329-335
Mantovani P Maccaferri M Sanguineti MC Tuberosa R Catizone I Wenzl P
Thomson B Carling J Eric H De-Ambrogio E Kilian A (2008) An integrated
DArT-SSR linkage map of durum wheat Mol Breed 22 629-648
Massman J Cooper B Horsley R Neate S Dill-Macky R Chao S Dong Y Schwarz
P Muehlbauer GJ Smith KP (2011) Genome wide association mapping of
fusarium head blight resistance in contemporary barely breeding germplasm
Mol Breed 27 439-454
McIntosh RA Wellings CR Park RF (1995) Wheat rusts an atlas of resistance genes
CSIRO Canberra
McIntosh RA Brown GN (1997) Anticipatory breeding for resistance to rust diseases
in wheat Annu Rev Phytol 35 311-326
Melchinger AE Utz HF Schon CC (1998) Quantitative trait locus (QTL) mapping
using different testers and independent population samples in maize reveals
low power of QTL detection and large bias in estimates of QTL effects
Genetics 149 383-403
Miedaner T Wurschum T Maurer HP Korzun V Ebmeyer E Reif JC (2011)
Association mapping for Fusarium head blight resistance in European soft
winter wheat Mol Breed 28 647-655
Myles S Peiffer J Brown PJ Ersoz ES Zhang ZW Costich DE Buckler ES (2009)
Association mapping critical considerations shift from genotyping to
experimental design The Plant Cell 21 2194-2202
Nazari K Mafi M Yahyaoui A Singh RP Park RF (2009) Detection of wheat stem
rust (Puccinia graminis f sp tritici) race TTKSK (Ug99) in Iran Plant Dis
93 317
Njau PN Jin Y Huerta-Espino J Keller B Singh RP 2010 Identification and
evaluation of sources of resistance to stem rust race Ug99 in wheat Plant Dis
94 413-419
Olivera PD Jin Y Badebo A Singh D (2010) Races of Puccinia graminis fsp tritici
with virulence on Sr13 and Sr9e in durum screening nursery in Ethiopia In
90
Proceedings of BGRI 2010 Technical Workshop ed R McIntosh Z
Pretorious St Petersburg Russia May 30-31 pp 7-8
Peterson RF Campbell AB Hannah AE (1948) A diagrammatic scale for estimating
rust intensity of leaves and stem of cereals Can J Res Sect C 26 496-500
Pretorius ZA Singh RP Wagoire WW Payne TS (2000) Detection of virulence to
wheat stem rust resistance gene Sr31 in Puccinia graminis f sp tritici in
Uganda Plant Dis 84 203
Pritchard JK Stephens M Donnelly P (2000) Inference of population structure using
multilocus genotype data Genetics 155 945-959
Rafalski JA (2002) Novel genetic mapping tools in plants SNPs and LD-based
approaches Plant Sci 162 329-333
Rafalski JA (2011) Genomic tools for the analysis of genetic diversity Plant Gen
Res Characterization and Utilization 9 159-162
Robertson A (1967) The nature of quantitative genetic variation In Brink (ed)
Heritage from Mendel University of Wisconsin Madison pp 265-280
Roelfs AP Singh RP Saari EE (1992) Rust diseases of wheat concepts and methods
of disease management CIMMYT Mexico DF
Rutkoski JE Heffner EL Sorrells ME (2010) Genomic selection for durable stem rust
resistance in wheat Euphytica 179161-173
Schuelke M (2000) An economic method for the fluorescent labelling of PCR
fragments Nat Biotechnol 18 233-234
Simons K Abate Z Chao S Zhang W Rouse M Jin Y Elias E Dubcovsky J (2011)
Genetic mapping of stem rust resistance gene Sr13 in tetraploid wheat
(Triticum turgidum ssp durum L) Theor Appl Genet 122 649-658
Singh RP Bechere E Abdalla O (1992) Genetic analysis of resistance to stem rust in
10 durum wheats Phytopathol 82 919-922
Singh RP Huerta-Espino J Fuentes G Duveiller E Gilchrist L Henry M Nicol MJ
(2005) Resistance to diseases In Royo C Nachit MM Di Fonzo N Araus JL
Pfeiffer WH Slafer GA (eds) Durum wheat breeding current approaches and
future strategies Food Product Press Binghamton pp 291-315
Singh RP Hodson DP Jin Y Huerta-Espino J Kinyua MG Wanyera R Njau P
Ward RW (2006) Current status likely migration and strategies to mitigate the
threat to wheat production from race Ug99 (TTKS) of stem rust pathogen In
91
CAB reviews perspectives in agriculture veterinary science nutrition and
natural resources 1 No 054
Singh D Girma B Njau P Wanyera R Badebo A Bhavani S Singh RP Huerta-
Espino J Woldeab G Ward R (2008) Screening for stem rust resistance in
East Africa In Proceedings of the 2009 BGRI Technical Workshop
CIMMYT Cd Obregon Sonora Mexico March 17-20 2009 pp 33-38
Singh RP Hodson DP Huerta-Espino J Jin Y Bhavani S Njau P Herrera-Foessel S
Singh PK Singh S and Govindan V (2011) The Emergence of Ug99 Races of
the Stem Rust Fungus is a Threat to World Wheat Production Annu Rev
Phytopathol 49 465-81
Skovmand B Wilcoxson RD Shearer BL Stucker RE (1978) Inheritance of slow
rusting to stem rust in wheat Euphytica 27 95-107
Stich B Melchinger AE Frisch M Maurer HP Heckenberger M Reif JC (2005)
Linkage disequilibrium in European elite maize germplasm investigated with
SSRs Theor Appl Genet 111 723-730
Stich B Melchinger AE (2010) An introduction to association mapping in plants
CAB Rev 5 039Storey JD Tibshirani R (2003) Statistical significance for genome
wide studies Proc Natl Acad Sci USA 100 9440-9445
Stubbs RW Prescott JM Saari EE Dubin HJ (1986) Cereal Dis Methodol Manual
pp 45-46
Thornsberry JM Goodman MM Doebley J Kresovich S Nielsen D Buckler ES IV
(2001) Dwarf8 polymorphisms associate with variation in flowering time Nat
Genet 28 286-289
Tommasini L Schnurbusch T Fossati D Mascher F Keller B (2007) Association
mapping of Stagonospora nodorum blotch resistance in modern European
winter wheat varieties Theor Appl Genet 115 697-708
Trebbi D Maccaferri M de Heer P Sorensen A Giuliani S Salvi S Sanguineti MC
Massi A van der Vossen EAG Tuberosa R (2011) High-throughput SNP
discovery and genotyping in durum wheat (Triticum durum Desf) Theor
Appl Genet 123 555-569
van Poecke RMP Maccaferri
M Tang
J Truong HT Janssen A van Orsouw NJ
Salvi S Maria C Sanguineti
MC Tuberosa R van der Vossen EAG
(2013)
Sequence-based SNP genotyping in durum wheat Pl Biotech J (in press)
92
Vavilov NI 1951 The origin variation immunity and breeding of cultivated plants
Chron Bot 131-36
Vavilov NI 1929 Wheat of Ethiopia Bulletin of Applied Botany Genetics and
Plant Breed 20 224-356
Wang M Jiang N Jia T Leach L Cockram J Comadran J Shaw P Waugh R Luo Z
(2012) Genome-wide association mapping of agronomic and morphologic
traits in highly structured populations of barley cultivars Theor Appl Genet
124 233-246
Wanyera R Kinyua MG Jin Y Singh R (2006) The spread of stem rust caused by
Puccinia graminis f sp tritici with virulence on Sr31 in wheat in Eastern
Africa Plant Dis 90 113
You FM Huo NX Deal KR Gu YQ Luo MC McGuire PE Dvorak J Anderson OD
(2011) Annotation-based genome-wide SNP discovery in the large and
complex Aegilops tauschii genome using next-generation sequencing without
a reference genome sequence BMC Genomics 12 DOI 1011861471-2164-
12-59
Yu JM Pressoir G Briggs WH Bi IV Yamasaki M Doebley JF McMullen MD
Gaut BS Nielsen DM Holland JB Kresovich S Buckler ES (2006) A unified
mixed-model method for association mapping that accounts for multiple levels
of relatedness Nat Genet 38 203-208
Yu L-X Liu S Anderson JA Singh RP Jin Y Dubcovsky J BrownGuidera G
Bhavani S Morgounov A He Z Huerta-Espino J Sorrells ME (2010)
Haplotype diversity of stem rust resistance loci in uncharacterized wheat lines
Mol Breed 26 667-680
Yu L-X Lorenz A Rutkoski J Singh RP Bhavani S Huerta-Espino J Sorrells ME
(2011) Association mapping and gene-gene interaction for stem rust resistance
in CIMMYT spring wheat germplasm Theor Appl Genet 123 1257-1268
Zadoks JC Chang TT Konzak CF (1974) A decimal code for the growth stages of
cereals Weed Research 14 415-421
Zeller F J (1973) 1B1R wheat-rye chromosome substitutions and translocations In
Sears E R and Sears L M S (eds) Proc 4th
Int Wheat Genetics Symposium
Columbia Missouri pp 209-221
93
Zhang W Chao S Manthey F Chicaiza O Brevis JC Echenique V Dubcovsky J
(2008) QTL analysis of pasta quality using a composite microsatellite and
SNP map of durum wheat Theor Appl Genet117 1361-1377
Zhu C Gore M Buckler ES Yu J (2008) Status and prospects of association mapping
in plants Plant Genome 1 5-20
Zwer PK Park RF McIntosh RA (1992) Wheat-Stem rust in Australia- 1969-1985
Aust J Agric Res 43 399-432
94
FIGURES
95
Figure 1 Frequency distribution of the Coefficient of Infection of the elite accessions
tested at Debrezeit 2009 off cropping season
Nu
mb
er
of
accessio
ns
(n
o)
0-10 11-20 31-40 41-50 51-60 61-70 71-8021-30
0
10
20
40
30
50
60
DZo_2009
81-90 91-100
Disease rating scale (Coefficient of Infection)
Frequency distribution of the Coefficient of Infection
of the elite accessions tested in the four seasons
96
Figure 2 Frequency distribution of the Coefficient of Infection of the elite accessions
tested at Debrezeit 2009 main cropping season
0-10 11-20 31-40 41-50 51-60 61-70 71-8021-30
0
10
20
40
30
50
60
81-90 91-100
Nu
mb
er
of
ac
ce
ss
ion
s(n
o)
DZm_2009
Disease rating scale (Coefficient of Infection)
97
Figure 3 Frequency distribution of the Coefficient of Infection of the elite accessions
tested at Debrezeit 2010 off-cropping season
0-10 11-20 31-40 41-50 51-60 61-70 71-8021-30
0
10
20
40
30
50
60
81-90 91-100
Nu
mb
er
of
accessio
ns
(n
o)
DZo_2010
Disease rating scale (Coefficient of Infection)
98
Figure 4 Frequency distribution of Coefficient of Infection of the elite accessions
tested at Debrezeit 2010 main cropping season
0-10 11-20 31-40 41-50 51-60 61-70 71-8021-30
0
10
20
40
30
50
60
81-90 91-100
Nu
mb
er
of
accessio
ns
(n
o)
DZm_2010
Disease rating scale (Coefficient of Infection)
99
Figure 5 Frequency distribution of Coefficient of Infection of the elite accessions
tested at Debrezeit mean over four seasons cropping season
0-10 11-20 31-40 41-50 51-60 61-70 71-8021-30
0
10
20
40
30
50
60
Mean over four seasons
81-90 91-100
Nu
mb
er
of
accessio
ns
(n
o)
Disease rating scale (Coefficient of Infection)
100
Figure 6 Population structure investigated by both distance and model-based
Bayesian analysis
Model-based Bayesian clustering (STRUCTURE)
Subpopulation number (K) = 5
Similarity-based dendrogram
(UPGMA)
Italian germplasm
(Cappelli Valnova)
CIMMYT germplasm lsquo70
(JoAaFg Yavaros79)
CIMMYT germplasm lsquo80
(Altar84)
ICARDA germplasm lsquo80
(Cham1 temperate high yield potential)
ICARDA germplasm lsquo80
(Omrabi dryland)
101
Figure 7 Association mapping probabilities reported as -log (p) of the mapped
markers tested for association to stem rust response of 183 elite accessions of durum
wheat Results are shown for the stem rust response averaged over four evaluation
seasons reported on a chromosome-by-chromosome basis The -log 005 significance
threshold value is equal to 135 Centromeres have been indicated as solid filled
triangles Vertical dashed lines indicate the 12 markers with significant effects (P lt
005) in three or four seasons vertical dotted lines indicate the 24 markers tagging
QTL regions with significant effects (P lt 005) in two seasons only Chromosome
intervals corresponding to the locations of stem rust (Sr) resistance loci reported by
previous studies in hexaploid and tetraploid wheat have been reported as black bars
above the graph of each chromosome Chromosome linkage blocks associated to stem
rust response in hexaploid wheat (Crossa et al 2007 Yu et al 2011) and in tetraploid
wheat (Haile et al 2012) have been reported as gray and crossed-bars respectively
102
Figure 8 Scatter plot of the coefficient of infection values of the elite accessions of
durum wheat on the cumulated number of beneficial alleles at the QTL-tagging
markers significant (P lt 005) in three or four seasons Results are shown for the stem
rust response averaged over four evaluation seasons of the 183 accessions (a) and of
the 67 accessions (b) with the susceptible allele at CD926040 the marker most
associated to the Sr13 region
103
TABLES
104
Table 1 Descriptive statistics for field stem rust response (reported as Coefficient of Infection) of the 183 elite durum wheat accessions
evaluated in four growing seasons in Ethiopia
Season a
CI
Mean Min Max
DZo-2009 422 02 800
DZm-2009 369 00 800
DZo-2010 493 00 900
DZm-2010 336 79 682
Mean 405 35 720
a stem rust response evaluation carried out in Debre Zeit (DZ) Agricultural Research Center DZo-2009 off season field trial evaluation
carried out in 2009 (January to May) DZm-2009 main season evaluation in 2009 (July to November) DZo-2010 off season evaluation
in 2010 DZm-2010 main season evaluation in 2010
105
Table 2 Frequency distribution of stem rust responses averaged over four growing seasons in Ethiopia for the 183 elite durum wheat
accessions included in the association mapping durum panel
Season Stem rust response a
(DSS lt 10) (DSS 10-20) (DSS 30) (DSS 40) (DSS 50-60) (DSS 70-100)
DZo-2009 006 (10) b 006 (10) 012 (20) 026 (43) 045 (75) 005 (8)
DZm-2009 011 (16) 012 (17) 019 (27) 018 (26) 028 (40) 013 (19)
DZo-2010 005 (9) 006 (10) 010 (17) 016 (27) 034 (58) 030 (51)
DZm-2010 015 (22) 010 (14) 017 (25) 022 (31) 030 (43) 006 (8)
Mean 005 (9) 009 (17) 010 (19) 018 (33) 051 (94) 006 (11) a classification of response based on the Disease Severity Score (DSS) as reported in Singh et al (2009)
b frequencies values values within brackets report the actual accession numbers
Table 3 Mean and range of stem rust response (reported as Coefficient of Infection) in the five main germplasm subgroups of the association
mapping durum wheat panel
Environment
Subgroup 1 (S1)
ICARDA drylands
(11)a
Subgroup 2 (S2) ICARDA
temperate (55)
Subgroup 3 (S3) Italian and
early rsquo70s CIMMYT (26)
Subgroup 4 (S4) late rsquo70s
CIMMYT (56)
Subgroup 5 (S5) late rsquo80s
CIMMYT (35)
Mean Min Ma
x
Mean Min Max Mean Min Max Mean Min Max Mean Min Max
DZo-2009 406 9 70 416 02 70 323 02 60 449 6 80 454 4 70
DZm-2009 274 6 54 345 2 80 227 0 63 427 3 80 44 3 80
DZo-2010 457 27 70 445 3 80 383 0 80 49 9 90 662 12 80
DZm-2010 435 94 60
5
322 79 605 274 79 605 337 11 527 362 79 682
Mean 396 146 58 386 35 675 294 38 587 427 75 662 475 95 72
Least significant difference (LSD) among subgroups = 499 (P 005)
a number of accessions belonging to each subgroup
106
Table 4 Quantitative trait loci (QTLs) for stem rust response identified through association mapping in a panel of 183 elite durum wheat
accessions evaluated in Ethiopia with significant effects observed over three to four evaluation seasons For each QTL the chromosome
position the associated markers and the QTL features are reported
Chr
Most associated
marker
Position
(cM)a
Seasons with significant marker-
trait associations R2 range ()
b
R2
()c Associated markers in the QTL region
Interval
width
(cM)a
1BS barc8 32 DZm-2009 DZo-2010 DZm-
2010
32 - 56 46 gwm1100 wPt-2999 wPt-4605 tPt-8831
wPt-9864 wPt -3582 wPt-4133 wPt-1876
wPt-5899 wPt-4729
9
2AS gwm1045 877 DZm-2009 DZo-2010 DZm-
2010
33 - 58 39 gwm425 cfa2263 125
2BL wmc356 220 DZo-2009 DZm-2009 DZo-
2010
32 - 66 41 - 0
3AS wPt-7992 8 DZo-2009 DZm-2009 DZo-
2010 DZm-2010
17 - 47 33 wPt-6854 barc12 wPt-1111 35
3AL wmc388 856 DZo-2009 DZo-2010 DZm-
2010
19 -41 4 - 0
5AL gwm126 933 DZo-2009 DZo-2010 DZm-
2010
18 -48 41 - 0
5AL gwm291 1117 DZo-2009 DZm-2009 DZo-
2010
27 -57 44 - 0
6AL gwm427 1395 DZo-2009 DZm-2009 DZm-
2010
17 -68 35 wmc580 01
6AL CD926040 144 DZo-2009 DZm-2009 DZo-
2010 DZm-2010
35 - 113 71 wPt-9474 wPt-4229 wPt-5654 wPt-3247
wPt-4663
93
6AL barc104 1553 DZo-2009 DZm-2009 DZm-
2010
61 - 97 45 - 0
7AS wPt-2799 382 DZo-2009 DZm-2009 DZo-
2010 DZm-2010
17 - 49 52 barc70 gwm1187 wmc479 63
7AS wPt-7785 948 DZo-2009 DZo-2010 DZm-
2010
11 - 23 15 - 0
a position of the QTL most associated marker as from the durum consensus map used as reference
b range of R
2 value across the three to four evaluation seasons with significant marker-trait association
c R
2 value for the marker most associated to the QTL (averaged over the four evaluation seasons)
107
Table 5 Quantitative trait loci (QTLs) for stem rust response identified through association mapping in a panel of 183 elite durum wheat
accessions evaluated during four seasons in Ethiopia with significant effects observed in two out of four evaluation seasons For each
QTL the chromosome position the associated markers and QTL features are reported
Chr
Most associated
marker Position (cM)a
Seasons with significant marker-trait
associations
R2 range
()b R
2 ()
c
Associated markers
in the QTL region
Interval
width
(cM)a
1AS gpw2246 0 DZo-2009 DZm-2009 23 - 47 31 - 0
1AS wPt-5411 696 DZm-2009 DZo-2010 14 - 16 13 gwm164 1
1BL cfd65 408 DZm-2009 DZm-2010 35 - 38 24 wPt-8168 gwm947 11
1BL wPt-0202 857 DZo-2009 DZm-2009 14 - 20 1 wPt-0506 wPt-3227 06
2AS wPt-7049 269 DZo-2010 DZm-2010 17 - 32 16 barc212 4
2BS wPt-8404 757 DZm-2009 DZm-2010 22 - 61 16 wmc257 wmc243
wmc25
2
2BL wmc361 29 DZm-2009 DZo-2010 25 - 43 2 - 0
2BL gwm1300 1691 DZo-2009 DZm-2010 16 - 80 17 wPt-5242 1
3AL wPt-1923 464 DZm-2009 DZm-2010 22 - 45 22 wPt-3348 wPt-1652 0
3AL wmc428 1105 DZo-2009 DZm-2009 44 - 68 38 - 0
3AL wPt-8203 2003 DZo-2009 DZm-2009 19 - 25 18 barc1177 59
4AL wPt-9196 1024 DZo-2010 DZm-2010 10 - 15 1 wPt-2985 wPt-8886
wPt-8271 wPt-8167
wPt-3108 wPt-3796
wPt-6502 wPt-7821
69
a position of the QTL most associated marker as from the durum consensus map used as reference
b range of R
2 value across the evaluation seasons with significant marker-trait association
c R
2 value for the marker most associated to the QTL (average over the four evaluation seasons)
108
Table 5 Continuedhellip
Chr
Most associated
marker Position (cM)a
Seasons with significant marker-trait
associations
R2 range
()b R
2 ()
c
Associated markers
in the QTL region
Interval
width
(cM)a
4AL wPt-0798 1110 DZo-2009 DZm-2010 28 - 29 19 wPt-5055 00
4BL wPt-8543 1019 DZo-2009 DZo-2010 12 - 29 14 - 00
5BL wPt-9300 1189 DZm-2009 DZo-2010 12 - 19 11 wPt-2453 wPt-1733 00
6AS wPt-7330 186 DZm-2009 DZo-2010 12 - 36 16 wPt-1742 wPt-
5395 wPt-5633 tPt-
6710 wPt-1377
wPt-9075 wPt-6520
wPt-7754 wPt-
4016wPt-4017 wPt-
3468
75
6AL tpt-4209 1096 DZm-2009 DZo-2010 23 - 26 15 gwm1150 84
6AL gwm169 1266 DZo-2009 DZm-2010 20 - 30 15 00
6BS wPt-1437 419 DZo-2009 DZo-2010 22 - 23 13 wPt-2095 wPt-7935 24
7AS wPt-5489 00 DZo-2009 DZo-2010 15 - 18 20 00
7AL wPt-0745 2484 DZo-2009 DZm-2010 17 - 22 13 wPt-7763 00
7BS gwm573 666 DZo-2009 DZm-2009 29 - 57 34 gwm1184wmc182 62
7BL wmc517 1556 DZm-2009 DZm-2010 35 - 36 23 - 00
7BL wPt-8615 1759 DZo-2010 DZm-2010 23 - 27 21 wPt-5343 wPt-
1715 wPt-4298
wPt-4869 wPt-
7362 wPt-4010
wPt-7191 wPt-
7351 Pt-8417 wPt-
4045 gwm611
21
0
a position of the QTL most associated marker as from the durum consensus map used as reference
b range of R
2 value across the evaluation seasons with significant marker-trait association
c R
2 value for the marker most associated to the QTL (average over the four evaluation seasons)
109
Table 6 Allele frequencies and phenotypic coefficients of infection (CI) least square means for the markers most associated to the QTLs
consistently observed over three to four evaluation seasons Data are reported for the common allelic variants only (frequency ge 010)
CI least square means
Chromosome Marker Allele a b Allele frequency DZo-2009 DZm-2009 DZo-2010 DZm-2010 Mean over four seasons
1BS barc8 257 023 527 70 872 483 636 b
255 077 469 464 679 363 494 a
2AS gwm1045 Null 012 523 609 848 519 621 b
180 076 505 475 744 391 529 a
172 012 565 641 952 481 659 c
2BL wmc356 180 012 224 20 611 233 324 a
178 069 402 342 743 337 455 b
176 019 476 379 899 275 499 c
3AS wPt-7992 1 021 599 641 809 478 623 b
0 079 502 499 733 404 533 a
3AL wmc388 250 029 614 533 757 434 574 b
258 038 602 559 816 446 608 c
275 033 479 459 707 355 496 a
5AL gwm126 nu11 046 51 488 748 413 537 b
214 042 418 41 672 329 448 a
208 012 498 449 772 423 525 b
5AL gwm291 166 045 499 483 718 391 519 b
160 04 546 592 819 432 596 c
139 015 429 449 607 397 473 a
6AL gwm427 212 072 551 536 764 451 575 b
188 028 458 436 699 334 485 a
6AL CD926040 855 032 501 498 731 398 534 a
851 04 689 613 838 557 669 b
845 028 618 678 896 486 673 b
6AL barc104 206 021 506 686 766 329 562 b
202 03 50 489 737 379 524 a
172 049 629 684 819 491 638 c
7AS wPt-2799 1 042 482 447 705 366 499 a
0 058 556 593 782 453 596 b
7AS wPt-7785 1 078 486 46 718 387 509 b
0 012 409 419 649 313 451 a a molecular weight (bp) of the alleles at SSR markers presence (1) or absence (0) of the band at DArT markers (wPt-) b ldquordquo indicates the most resistant allele
Least square means reported with bold font refer to the marker-environment pairs showing significant associations For each locus the least significant
difference between the allele means over four seasons was calculated means followed by different letters are significantly different (P le 005)
110
Table 7 Allele frequency within each of the five germplasm subgroups (S1 to S5) for the markers most associated to the QTLs
consistently observed over three to four evaluation seasons
Frequency with in
subgroups
Chromosome Marker Allele a b Subgroup 1 (S1) ICARDA
drylands ((11) a)
Subgroup 2 (S2) ICARDA
temperate (55)
Subgroup 3 (S3) Italian and
earlyrsquo70s CIMMYT (26)
Subgroup 4 (S4) Late
70s CIMMYT (56)
Subgroup 5 (S5) late
rsquo80s CIMMYT (35)
1BS barc8 257 0 02 073 012 015
255 1 08 027 089 085
2AS gwm1045 Null 02 018 013 01 007
180 08 079 025 088 093
172 0 003 069 002 0
2BL wmc356 180 0 03 0 005 0
178 1 062 017 084 1
176 0 008 083 011 0
3AS wPt-7992 1 009 033 029 017 006
0 091 067 071 083 094
3AL wmc388 250 0 037 065 028 006
258 0 043 025 052 025
275 1 02 01 02 069
5AL gwm126 nu11 018 043 02 043 085
214 082 041 048 048 015
208 01 016 032 009 0
5AL gwm291 166 01 047 013 042 077
160 0 039 063 054 02
139 09 014 024 004 002
6AL gwm427 212 0 063 087 08 058
188 1 037 013 02 042
6AL CD926040 855 018 024 008 022 079
851 072 044 065 036 012
845 01 032 027 042 009
6AL barc104 206 033 028 024 02 006
202 033 024 005 012 084
172 033 048 071 067 01
7AS wPt-2799 1 03 037 045 025 073
0 07 063 055 075 027
7AS wPt-7785 1 05 078 073 08 1
0 05 022 027 02 0 a molecular weight (bp) of the alleles at SSR markers presence (1) or absence (0) of the band at DArT markers (wPt-) b ldquordquo indicates the most resistant allele
Least square means reported with bold font refer to the marker-environment pairs showing significant associations
111
CHAPTER 5 GENOME-WIDE SEARCH OF STEM RUST RESISTANCE LOCI AT
THE SEEDLING STAGE IN DURUM WHEAT
Tesfaye Letta15
Pablo Olivera2 Marco Maccaferri
1 Yue Jin
2 Karim Ammar
3 Ayele
Badebo4 Enrico Noli
1 Jose Crossa
3 Roberto Tuberosa
1
1DiSTA University of Bologna Viale Fanin 44 40127 Bologna Italy
2United States Department of Agriculture-Agricultural Research Service (USDA-ARS)
Cereal Disease Laboratory 1551 Lindig Street St Paul MN 55108 USA
3CIMMYT CIMMYT Carretera Mexico-Veracruz KM 45 56130 Texcoco Mexico
4Debre Zeit Agricultural Research Center Debre Zeit Ethiopia
5Sinana Agricultural Research Center Bale-Robe Ethiopia
51 ABSTRACT
Stem rust caused by Puccinia graminis f sp tritici (Pgt) is one of the most destructive
diseases of both durum and bread wheat Recently emerged races in East African such as
TTKSK (or Ug99) possess broad virulence to durum cultivars and only a limited number of
known genes were effective Association mapping (AM) was used to identify quantitative
trait loci (QTLs) for resistance to stem rust races in a panel of 183 elite durum wheat
accessions tested under controlled conditions at seedling stage The panel was genotyped
with 1250 SSR and DArTreg markers Overall 15 20 19 and 19 chromosome regions were
significantly associated to the response to TRTTF TTTTF TTKSK (Ug99) and JRCQC
races respectively QTL R2 values ranged from 113 to 2312 One QTL on chromosome
5A and two on chromosome 6A provided resistance to all tested races whilst the majority
showed significant effects to one or two races Some QTLs were co-located with known Sr
genes (eg Sr9 Sr13 and Sr14) while others mapped in chromosome regions where no Sr
genes have previously been reported Two major QTLs on chromosome arm 6AL mapped in
the region known to harbour Sr13 and showed major effects on TTTTF TTKSK and JRCQC
(R2 up to 2312) and a minor effect on TRTTF The combined analysis of the results of this
study with those on adult plant resistance in Ethiopia where such races are present provide
valuable indications to identify suitable parental lines for further improving stem rust
resistance of durum wheat
112
52 INTRODUCTION
Durum wheat (Triticum turgidum ssp durum Desf) is an important crop for tens of millions
in the Mediterranean Basin particularly in West Asia and North Africa (WANA) where
durum wheat is grown annually over more than 13 million hectares Mediterranean countries
account for approximately 75 of global worldwide durum wheat production (Belaid 2000
Habash et al 2009) In Sub-Saharan Africa Ethiopia is the largest wheat-growing country
and is one of the centers of diversity for tetraploid wheat Durum wheat represents
approximately 40 of the total wheat area in Ethiopia with a tendency to increase in
response to the growing internal demand for pasta (Badebo et al 2009)
Durum production and kernel quality can be negatively affected by rust diseases (Singh et al
2005) Historically stem rust infections of Puccinia graminis Pers f sp tritici (Pgt) have
caused severe losses to wheat production (McIntosh and Brown 1997 Eversmeyer and
Kramer 2000 Singh et al 2011) While more than 50 stem rust resistance (Sr) loci have been
identified in cultivated wheat and wild relatives only a few of them remained effective
against the new emerging races in East Africa including TTKSK = Ug99 (Pretorious et al
2000) and its variants and even fewer are effective against the durum-specific Ethiopian
races (Admassu et al 2009 Rouse et al 2012) In Ethiopia Ug99 was in fact added to
previously existing races several of them specifically virulent on durum wheat (Admassu and
Fekedu 2005 Haile et al 2012) Two such races have been characterised as TRTTF and
JRCQC with a combined virulence on stem rust resistance genes Sr9e and Sr13 (Olivera et al
2012) and virulence on Sr13 appears to be widespread in Ethiopia (Admassu et al 2009)
Very limited effective resistance (52) to races TRTTF and JRCQC was found in a highly
diverse collection of 996 tetraploid genotypes evaluated for field reaction at the Debre Zeit
Research Station in Ethiopia (Olivera et al 2012) Therefore the combination of Ug99 and
Sr13- and Sr9e-virulent Ethiopian races represents a major threat to the viability of the
Ethiopian durum wheat production Achieving higher and more durable stem rust resistance
requires the characterisation of the genetic basis underlying the resistance present in
improved germplasm or in exotic sources used for introgression in breeding Only then can
breeding programmes develop strategies to pre-emptively counter the emerging new
virulence types in the pathogen populations Whereas field resistance is the ultimate goal
113
sought in breeding programmes seedling tests are a good complement for resistance
characterisation as they allow large number of lines to be screened for reaction to multiple
races one race at a time in a short period and with modest space requirements (Sun and
Steffenson 2005) Seedling screening provides information allowing postulating the presence
of certain genes based on the series of races available without confounding effects of having
several races acting at the same time as it is often the case in field experiments
Marker-based approaches can be used to identify genesquantitative trait loci (QTLs)
governing plant response to diseases The standard approach is to use biparental mapping
populations to relate phenotypic information to genotypic data obtained from molecular
markers in order to determine the number and chromosomal location of resistance loci
(Maccaferri et al 2008 Simons et al 2011 Singh et al 2013) An alternative to the use of
biparental mapping is association mapping (AM) or linkage disequilibrium (LD)-based
mapping in which genotype-phenotype relationships are explored in germplasm collections or
natural populations (Rafalski 2002 Flint-Garcia et al 2003) Since its first use in plants a
decade ago (Thornsberry et al 2001) AM has been used in many crops due to advances in
high-throughput genotyping technologies increased interest in identifying useful andor
novel alleles and improvements in statistical methods (Gupta et al 2005 Yu et al 2006 Zhu
et al 2008) In both tetraploid and hexaploid wheat AM has already proven to be an effective
strategy to identify marker-trait associations for agronomically valuable traits (Breseghello
and Sorrells 2006 Crossa et al 2007 Maccaferri et al 2010 2011) including resistance to
stem rust (Yu et al 2011) and leaf rust (Maccaferri et al 2010) in durum wheat Linkage
disequilibrium (LD) in the cultivated durum wheat germplasm ranges from 5 to 10 cM
(Maccaferri et al 2005) thus enabling a whole-genome scan analysis for marker-trait
associations with a relatively modest number of markers as compared to species with lower
LD
The objectives of this study were a genome-wide search in durum wheat for resistance loci to
races TRTTF TTTTF TTKSK and JRCQC of P graminis f sp tritici at the seedling stage
and the identification of genomic regions suitable for marker-assisted selection and further
genetic dissection
114
53 MATERIALS AND METHODS
531 Plant materials
One hundred eighty-three accessions from different durum wheat-growing regions of
Mediterranean countries (Italy Morocco Spain Syria and Tunisia) Southwestern USA and
Mexico already used in previous AM analysis for stem rust resistance under field conditions
(Letta et al 2013) were analysed in this study (Appendix 1) A detailed description of the
accessions at the molecular and phenotypic level is reported in Maccaferri et al (2006 and
2010)
532 Stem rust evaluation at seedling stage
Pathogen races
The AM panel was evaluated for reaction to four Pgt races TRTTF TTTTF TTKSK and
JRCQC The race designation is based on the letter code nomenclature system (Roelfs and
Martens 1988 Roelfs et al 1993) modified to further delineate races in the TTKS lineage
(Jin et al 2008) These races were selected based on their differential virulence pattern andor
importance for durum wheat Race TTKSK (Ug99) has a wide virulence spectrum and is
rapidly evolving in East Africa Race TTTTF is the most widely virulent race known in the
United States producing high infection types on the majority of stem rust differential lines
(Jin et al 2007) Races TRTTF and JRCQC both present in Ethiopia possess a virulence
combination that overcomes both the resistance genes Sr13 and Sr9e two genes present at
high frequency in durum wheat (Klindworth et al 2007) Information about the stem rust
isolates used in the disease phenotyping tests is summarised in Table 1
533 Inoculation incubation and disease assessment
The AM panel was evaluated under controlled conditions using a completely randomised
design with two replications (over time) for each of the four races Five to six seedlings per
line were inoculated on the fully expanded primary leaves 8 to 9 days after planting This
work was conducted at the Cereal Disease Laboratory St Paul MN USA and the
115
experimental procedures in inoculation and disease assessment were done as described by Jin
et al (2007) Wheat cultivar McNair 701 (CItr 15288) was used as susceptible control Plants
were evaluated for their infection types (ITs) 14 days post-inoculation using the 0-4 scale
according to Stakman et al (1962) where ITs of 0 - - 1 - 2 or X are considered as low IT
and ITs of 3 or 4 are considered as high ITs Lines giving variable reactions between
experiments were repeated again to confirm the most likely reactions
534 Statistical analysis
Stakmanrsquos ITs were converted to a linear scale using a conversion algorithm proposed by
Zhang et al (2011) Briefly infection types are converted as follows 0 1- 1 1+ 2- 2 2+ 3-
3 and 3+ are coded as 0 1 2 3 4 5 6 7 8 and 9 respectively The symbol for
hypersensitive flecks () is converted to 0 and IT 4 is converted to 9 Special annotation codes
C and N are ignored Double minus and double plus annotations are converted to single
minus and single plus respectively Complex ranges such as 12+ are first collapsed to 2+
Then the first and last ITs of the ranges are converted and averaged with the first IT double-
weighted because the most prevalent IT is listed first Infection types X- X and X+ are
converted to linearised scores of 4 5 and 6 respectively These linearised 0-9 scale values
were used for subsequent statistical analysis
The heritability of linearised infection type responses was calculated for each of the four
races on a mean basis across two replications according to the following h2 =
2G (
2G +
2
Er) where r = number of replicates 2
G = genotypic component of the MS among
accessions and 2
E = MSerror with MS indicating the mean square values as from the ANOVA
results
The dendrogram analysis was carried out using NTSYS-pc software version 20 (Rohlf
1997) and was based on the virulence phenotypes (Infection Types estimated with a 0-4
scale) of the races the distances among races have been computed using the standardised
Manhattan distances (lsquocity-blockrsquo method)
116
535 Molecular profiling
Genomic DNA extraction and other molecular procedures were carried out as described in
Maccaferri et al (2010) The accessions were profiled with 350 simple sequence repeat loci
(SSR) 900 Diversity Array Technology (DArT) markers and three additional sequence
tagged site (STS) markers including those previously reported to be associated to major stem
rust resistance genes (Yu et al 2010)
536 SSR markers
The SSR primers were chosen among the publicly available sets catalogued in the
GrainGenes database (httpwheatpwusdagov) as BARC (barc marker loci) CFA-CFD-
GPW from INRA (cfa cfd and gpw respectively) KSUM (ksum) WMC (wmc) and WMS
(gwm) an additional subset of private genomic WMS primers from Trait Genetics (supplied
by M Ganal TraitGenetics Gatersleben Germany) were also used The SSR loci used to
genotype the accessions were preselected for (i) clarity and repeatability of the amplicons (ii)
polymorphism level and (iii) even distribution on the A- and B-genome linkage groups The
choice was carried out based on the results of a survey of SSR primer pairs conducted on a
small subset of eight germplasm founder accessions and lines used as parents of mapping
populations A unique thermo-cycling protocol (Maccaferri et al 2008) was implemented for
all primer sets and SSR profiles using an automated LI-COR 4200 IR2 System (LiCor
Lincoln NE USA) Genotyping was performed for most SSR markers using the M13-labeled
primers and amplification protocol (Schuelke 2000) Alleles were scored using founder
genotypes as an allele reference set
537 DArT markers
DArT markers were generated by Triticarte Pty Ltd (Canberra Australia http
wwwtriticarte com au) as described by Akbari et al (2006) The Durum wheat PstI TaqI
array v 20 containing 7600 single DArT clones (Mantovani et al 2008) was used for
genotyping the panel The locus designation used by Triticarte Pty Ltd was adopted (lsquowPtrsquo
117
lsquorPtrsquo and lsquotPtrsquo loci corresponding to the respective clones of the genomic representation) and
alleles at polymorphic loci were scored as hybridisation positive (1) or negative (0)
538 Association mapping
For AM analysis only markers with non-rare alleles (frequency gt 010) in the AM Durum
Panel were considered for the LD and marker-trait association analysis thus reducing the
false positives and the LD inflation effects which have frequently been attributed to the use of
rare alleles (Myles et al 2009) Rare alleles were considered as missing data Data-points
showing residual allelic heterogeneity within accession were also considered as missing data
In total 1211 markers were used for marker-phenotype association tests Among these 323
SSRs and STSs and 538 DArT markers were projected onto a consensus linkage map
obtained from the genotypic data of five recombinant inbred line (RIL) mapping populations
using the Carthagene v 40 software (de Givry et al 2005) The RIL mapping populations
included four populations from the crosses Kofa times Svevo (KS RIL Maccaferri et al 2008)
Colosseo times Lloyd (CL RIL Mantovani et al 2008) Meridiano times Claudio (MC RIL
Maccaferri et al 2011) and Simeto times Levante (SL RIL Maccaferri et al unpublished)
developed by a joint effort of Produttori Sementi Bologna SpA (Argelato BO Italy) and
DipSA Bologna Italy and one population obtained from the cross Kofa times UC1113 (KU RIL
population Zhang et al 2008) whose genotypic data were downloaded from the GrainGenes
web database The consensus linkage map was obtained from the five data-sets using the
Carthagene v40 software (de Givry et al 2005) Merging was performed with the dsmergen
command after checking for marker order consistency across maps so that for each marker
pair a single recombination rate was estimated based on all available meioses A framework-
mapping method was applied Non-framework markers were incorporated in the framework
map by building a complete map using the framework map as a fixed order The marker order
and inter-marker genetic distances from the consensus map were used to report the LD and
association results The remaining 332 polymorphic and informative DArT markers and 17
SSRs that could not be integrated into the final map were not further considered Details on
the consensus map are reported in Letta et al (2013)
118
539 Genetic structure and linkage disequilibrium analysis
The genetic structure of the panel has been investigated with a combination of model- and
distance-based analyses Model-based population structure was assessed deploying a
selection of 96 loosely linked highly informative and evenly spaced SSRs and using the
program STRUCTURE v 2 (Pritchard et al 2000) Details for structure and kinship analysis
were reported in Maccaferri et al (2010 2011) The program TASSEL
(httpwwwmaizegenetics net) was used to estimate the LD parameters Drsquo and r2 values as
a function of the corresponding inter-marker distances and the comparison-wise significance
was computed with 10000 permutations The r2 parameter was estimated for all loci on the
same chromosome and compared based on the genetic distances measured in cM If all pairs
of adjacent loci within a given chromosomal region were in LD this region was referred to as
an LD block (Stich et al 2005)
5310 Marker-phenotype association analysis
Genome-wide scan for loci governing stem rust resistance at the seedling stage was
conducted using phenotypic data converted to a linear scale AM analysis was carried out
with TASSEL ver 21 (www maizegeneticsnet Yu et al 2006) The 323 SSRs and STSs
and 538 DArT markers were tested for significance of marker-trait associations under (i) the
fixed general linear model (GLM) including the Q population structure results as covariates
(Q GLM) (ii) the mixed linear model (MLM) including the Q population structure results
plus the K kinship matrix (Q + K MLM)
For GLM analysis besides the marker-wise association probability values the experiment-
wise association significance probability was obtained based on a permutation test
implemented in TASSEL (10000 permutations were used) The experiment-wise P-value
provides a much more severe test of significance (adjusted P-value) that corresponds to the
experiment-wise error and was used to make decisions about the significance of marker
effects (Bradbury et al 2007) In the MLM analysis experiment-wise significance was
119
inspected using the False Discovery Rate (FDR) approach according to Storey and Tibshirani
(2003) and implemented in Qvalue program
Multiple adjacent co-segregating significant markers were assigned to a unique QTL region
upon meeting the following conditions less than 20 cM of inter-marker genetic distance
presence of significant and strong LD among the markers (with r2 values ge 04) within the
QTL region and consistency of allelic effects across significant markers (Massman et al
2011)
54 RESULTS
541 Seedling evaluations
Seedling ITs for each of the 183 durum accessions are presented in the Appendix 3 The ITs
frequency distribution presented in Figure 1 depicts a continuous variation for all four races
with that for JRCQC being skewed toward susceptibility scores (3 and 4) The analysis of
variance for stem rust seedling response showed highly significant differences (P le 00001)
among races and accessions with highly significant effects of subgroups of accessions and
subgroup times race interaction (results not reported) The highly variable classification and
ranking of the accessions (Appendix 3) based on their responses to the different races
supports the significance of the race times accession interaction Heritability of the linearised IT
values was high for all four races ranging from h2 = 930 for race TTTTF to h
2 = 989 for
TTKSK
The frequencies of accessions categorised as resistant susceptible and heterogeneous in their
reaction to the four races varied markedly depending on the race (Table 2) Seedling
resistance to TRTTF TTTTF TTKSK and JRCQC was observed in 149 (814) 117
(639) 106 (579) and 87 (475) accessions respectively (Table 2) with the race
TRTTF from Yemen showing the lowest degree of virulence and the Ethiopian race JRCQC
showing the highest degree of virulence among the four races Sixty-six (361) accessions
were resistant (IT = 0 to 23) to all four races Figure 2 reports the pattern of diversity among
the four stem rust races based on the UPGMA-cluster analysis of the avirulencevirulence
patterns on the 183 durum accessions The dendrogram clearly shows that the races grouped
120
into three well-distinct groups with TTTTF and TTKSK that clearly clustered together while
TRTTF and JRCQC showed independent virulence patterns Highly significant correlations
of ITs among genotypes were observed for all the four races In particular relatively high r-
values were observed for the pair-correlations of TTKSK vs TTTTF (072) TTTTF vs
JRCQC (057) TRTTF vs TTTTF (051) TTKSK vs TRTTF (046) The correlation of ITs
between JRCQC and TTKSK or JRCQC and TRTTF was rather weak (036 and 015
respectively)
542 Relationship between population structure and seedling response to stem rust
The genetic relationships among the accessions were investigated using both a genetic-
similarity and a model-based Bayesian clustering method and the results have been reported
elsewhere (Maccaferri et al 2006 2011 Letta et al 2013) Both methods pointed out that the
minimum and optimum number of hypothetical well-distinct subgroups present in the panel
was equal to five corresponding to clearly distinct breeding lineages (from S1 to S5) Each
subgroup contains 11 55 26 56 and 35 accessions respectively The differences for seedling
stem rust response among the five subgroups were highly significant (P le 0001 data not
shown) The coefficients of membership to the five main subgroups as estimated with
STRUCTURE were used to assess the effect of population structure to single race responses
by means of multiple regressions The percentage of phenotypic variation accounted for by
population structure ranged from a minimum of 909 for race TTKSK to a maximum of
1215 for race JRCQC
The percentages of resistant and susceptible accessions for each of the five main subgroups
are reported in Table 3 This clearly shows that all five subgroups included accessions with
different responses thus indicating that all subgroups are equally informative for AM
purposes The complete dataset of seedling phenotypic response and population structure
membership coefficients for each of the 183 accessions included in the association panel is
reported as Appendix 3
The ranking values of the four races based on their frequencies of avirulence virulence
interactions considering the germplasm collection as a whole (with TRTTF showing the
121
highest degree of avirulent interactions followed by TTTTF TTKSK and finally JRCQC
which showed the highest frequency of virulent interactions) was roughly confirmed when
considering each of the five different subgroups of germplasm accessions separately (Table
3) One exception was observed for the race virulence spectrum to accessions of subgroup 3
(including the Italian and early lsquo70s CIMMYT germplasm) where race TTTTF showed the
highest frequency of avirulence and race TTKSK resulted the most virulent Differences
among subgroups for frequency of resistance were observed in the proportion of accessions
resistant to a given race For all four races subgroup 5 (CIMMYT germplasm of late 80s
early 90s) had the highest frequency of seedling resistant accessions mostly scored as IT = 2
(Table 3) On the other hand subgroup 1 (ICARDA accessions for rainfed environments)
which is also the least represented within the panel had the highest frequency of susceptible
accessions except when considering TRTTF for which only subgroup 3 showed a higher
frequency of susceptible accessions Overall more accessions in subgroups 4 and 5 showed
resistance to all the four races than in the other subgroups
543 Association mapping for seedling response to stem rust
The results of AM are reported in Table 4 AM revealed several putative QTLs for stem rust
resistance at the seedling stage using the four races In total 41 distinct QTLs represented by
either single markers or sets of closely linked markers were found to be significantly
associated to the seedling response to the four tested races under the Q + K MLM models
with 15 20 19 and 19 QTLs for the response to TRTTF (marker R2 from 113 to 834)
TTTTF (R2 from 192 to 1764) TTKSK (R
2 from 175 to 2312) and JRCQC (R
2 from
151 to 1533) respectively (Table 4) All these regions identified with the Q + K MLM
showed significant effects also with the Q GLM model In some cases the presence of a QTL
was evidenced by multiple significant associations at linked SSR and DArT markers within
10 cM as estimated from the durum consensus map and LD r2 values higher than 04 in most
cases (result not reported) Using a more stringent model including the False Discovery Rate
(FDR) multiple testing correction and Q + K MLM model the number of chromosomal
regions (QTLs) that showed significant (P le 005) associations were 4 3 4 and 4 for races
TRTTF TTTTF TTKSK and JRCQC respectively (Table 4) while the Q GLM model
detected a higher number of significant markers
122
The most important region in terms of significance and R2
effects was observed on
chromosome arm 6AL a 287 cM interval harboring four distinct QTLs with R2 values
ranging from 151 to 2312 Within this large interval noticeable associations across the
four races were found at the two sites tagged by CD926040 (1439 cM on the consensus
linkage group) and barc104 (1553 cM) These two sites (CD926040 and barc104) showed
consistently high R2 values (from 1047 to 2312) for races TTTTF TTKSK and JRCQC
Conversely CD926040 and barc104 showed only a limited effect though still significant for
race TRTTF (R2 values equal to 352 and 284 respectively)
In terms of significance across all four races apart from the two sites on chromosome arm
6AL only one QTL on chromosome 5A (gwm410) showed significant effects in response to
all the four races considered in this study Two genomic regions were identified on
chromosomes 1B (barc61) and 2A (wPt-5839) that were putatively effective across three
races (TRTTF TTTTF and TTKSK but not for race JRCQC at both regions) The R2 values of
marker on chromosome 1B ranged from 227 to 245 while marker on chromosome 2A
explained from 160 to 244 of the phenotypic variation On chromosome 3A marker wPt-
1923 tagged a region significant for TTTTF TTKSK and JRCQC with R2 values from 209 to
398 Race-specific effects (P lt 0001) were observed for each race as following for race
TRTTF putative genomic regions significantly affecting the response were found on
chromosomes 2A 2B and two regions on chromosome 7A The region with the largest effect
(R2 = 834) was tagged by gwm47 on chromosome 2BL The second and third regions with
a sizeable effect to the response to race TRTTF were tagged by markers wPt-6668 and
gwm344 on chromosome 7A with R2
values of 270 and 579 respectively Marker wPt-
2293 on chromosome 2A tagged an additional region with a sizeable effect (R2 = 420) on
this race For race TTTTF marker wmc517 on chromosome 7B showed a significant effect
(R2 = 800) that was shared with race TTKSK (R
2 = 496) A QTL (R
2 = 487 and
275) specific for TTKSK and TTTTF respectively was observed on chromosome 3B
(wmc43) Remarkably up to ten QTLs showed specificity for race JRCQC These ten QTLs
were tagged by wPt-1876 wPt-9049 barc78 gwm1570 barc165 gwm234 wPt-2991
gwm816 gwm573 and gwm333 Among those QTLs the most important in terms of
significance and R2
value was located on chromosome 4A tagged by barc78 (R2 = 936)
123
55 DISCUSSION
There is a growing interest in applying association mapping (AM) to a wide range of crops to
identify genesQTLs responsible for quantitatively inherited variation (Ersoz et al 2009 Hall
et al 2010 Stich and Melchinger 2010 Kollers et al 2013 Li et al 2013) Accordingly a
better understanding of the genetic basis underlying the naturally occurring genetic diversity
for stem rust response in durum wheat could help to accelerate the progress for enhancing
stem rust resistance of this crop while shedding light on the evolution of the host-pathogen
relationships Along this line the panel of accessions herein evaluated surveys the genetic
variation present in elite germplasm pool commonly used by durum breeders a feature that
makes our results more readily transferable to and more valuable for pre-breeding activities
551 Relationship between QTLs for resistance at seedling and field evaluations
A previous study has examined the present collection for resistance to stem rust under field
conditions (Letta et al 2013) in Ethiopia using an inoculum which included three of the four
races (TTKSK TRTTF and JRCQC) tested herein Such study highlighted the presence of 24
QTLs with significant effects in two out of four seasons and 12 QTLs in three out of four
seasons (Letta et al 2013) QTLs detected at seedling stage associated with resistance to the
four races namely those tagged by CD926040 and barc104 were significantly and
consistently (over seasons) associated with resistance under field conditions as well
CD926040 and barc104 located on the long arm of chromosome 6A are linked to Sr13
(Simons et al 2011) Marker gwm410 on chromosome 5AL also showed a significant effect
for three seasons under field conditions and for all four races at the seedling stage QTLs
tagged by gwm1300 gwm169 and wmc517 showed significant effect to race TTKSK as well
as under field conditions for two seasons Among the markers associated with resistance to
this race gwm1300 and gwm169 were in the same regions harbouring SrWeb and Sr26
respectively which are known to be effective against race TTKSK (Ug99) (Yu et al 2011)
The seedling QTL on chromosome 2B tagged by wmc356 which showed a significant effect
with races TTTTF and JRCQC also showed significant effects in the field condition for two
seasons Seedling QTL specific to race JRCQC tagged by marker gwm573 showed significant
124
effect under field conditions for two seasons Other specific QTLs detected for the same race
at loci gwm1620 and barc78 on chromosomes 3A and 4A respectively were located in
regions very close to markers which showed significant effects under field conditions for four
and two seasons respectively
552 significant markers linked to previously identified Sr genes
The analysis of the results obtained with both the Q GLM and Q + K MLM models
highlighted several chromosome regions putatively harboring QTLs with main effects for
stem rust response at the seedling stage To determine whether any known resistance gene
coincides with the putative genomic regions identified in this study the current results were
compared with previous findings for stem rust resistance in wheat Several QTLs identified in
this study co-located at previously reported major Sr loci as well as to a number of QTLs
recently identified through linkage mapping in tetraploid wheat (Haile et al 2012) and AM in
hexaploid wheat (Yu et al 2011 2012) One QTL tagged by wPt-1876 (chromosome 1B) for
response to race JRCQC corresponds to a region previously shown to influence stem rust
resistance in two independent studies (Crossa et al 2007 Yu et al 2011) This region
harbours Sr14 which appears effective against several stem rust races (Singh et al 2006)
However this region did not show significant effects for race TTKSK in accordance to the
Sr14 seedling IT reported by Jin et al (2007) The genomic region on the distal part of
chromosome 1B tagged by wmc44 and associated with seedling resistance to TTTTF and
JRCQC has been shown to harbour genes for multiple diseases Lr46Yr29Pm39 and a yet to
be named gene for APR to stem rust (Bhavani et al 2011 Ravi Singh personal
communication) On chromosome 2A cfa2201 and wPt-5839 co-located with the region
known to host Sr38 and Sr34 respectively However both genes are ineffective against races
of the Ug99 lineage (Jin et al 2007 Singh et al 2011) and originate from Triticum comosum
and Triticum ventricosum which makes their presence in durum wheat highly unlikely
Consequently cfa2201 and wPt-5839 could be linked to putatively new loci Several Sr genes
are located on chromosome arm 2BL including Sr9 Sr16 Sr28 (McIntosh et al 1995) and
SrWeb (Hiebert et al 2010) SrWeb confers resistance to Ug99 while none of the several
alleles of Sr9 confers resistance to the same race (Jin et al 2007) Hence the significant
effects detected by gwm1300 for race TTKSK might be tagging the presence of SrWeb
125
(Hiebert et al 2010) while gwm47 detected for race TRTTF might tag potential new alleles
near or at the Sr9 locus Additionally at the end of chromosome 2B significant effects of
wmc356 to races TTTTF and JRCQC were detected but it is unlikely that Sr16 or Sr28 plays
any role since both genes are ineffective to these races At chromosome arm 3BS several Sr
genes including Sr2 Sr51 Sr12 and SrB (Yu et al 2009) are known Among more than 50
stem rust resistance loci identified so far Sr2 is one of the most widely deployed (McIntosh
et al 1995) and has provided durable adult plant rust resistance for more than 50 years A
previous study suggested that the Sr2 APR allele is rare in the AM panel (Letta et al 2013)
Similarly in the present study none of the markers on chromosome arm 3BS showed
significant effects near the position of Sr2 (Mago et al 2010) The chances of detecting Sr2 at
the seedling stage based on the IT responses were minimal being this gene an APR locus
Nevertheless Sr2 has been reported to be tightly linked to a specific leaf chlorosis (mosaic)
phenotype (Brown 1997) which was not observed in the entire panel (Olivera personal
communication) However the genomic region at wmc43 on chromosome arm 3BS
conferring resistance to races TTKSK and TTTTF is in the same region of a previously
reported QTL region for field stem rust resistance (Yu et al 2011)
Four markers mapped in a 2870 cM-wide region on chromosome arm 6AL with low LD as
to each other (gwm169 gwm427 CD926040 and barc104) showed significant effects in the
same region previously reported to harbour genes for stem rust resistance For instance
gwm427 CD926040 and barc104 correspond to the region reported by Simons et al (2011)
and Letta et al (2013) while gwm169 co-locates with Sr26 a gene effective against Ug99
(Singh et al 2006) and the Ethiopian races (Badebo and Ammar unpublished results)
However Sr26 has been reported to be present exclusively in bread wheat following an
introgression from the wild relative Thynopirum elongatum thus its presence within the elite
durum wheat germplasm included in this study is mostly unlikely
A wide chromosome region including three subregions (marked by gwm427 CD926040 and
barc104) at the end of chromosome arm 6AL was strongly associated with resistance to all
stem rust races This region co-locates with Sr13 mapped in tetraploid wheat to the long arm
of chromosome 6A within a 12 to 28 cM interval flanked by the EST-derived markers
CD926040 and BE471213 (Simons et al 2011 Admassu et al 2011 Dubcovsky et al 2011)
126
In our study CD926040 showed the largest R2 value and significance effects for resistance to
all four races Sr13 is effective against the TTKS complex of Pgt namely TTKSK (Ug99)
TTKST and TTTSK However virulence for Sr13 within Ethiopian stem rust populations has
been reported (Admassu et al 2009) and recently confirmed by the characterisation of two
races (TRTTF and JRCQC) collected at the site near Debre-Zeit (Olivera et al 2012) The
strong association between markers at this location and resistance to stem rust both in
seedlings inoculated with the four races and in field-grown adult plants inoculated with a
mixture including Sr13-virulent inoculum suggests the presence on chromosome arm 6AL of
an additional gene linked to Sr13 Fine mapping and more precise characterisation of allelic
variation present in the germplasm on adequate genetic stocks are needed to sort-out the
precise genetic basis underlying the chromosome 6AL-related resistance to stem rust in
durum wheat Other Sr genes were mapped to chromosome 6A such as Sr5 and Sr8a which
showed to be a highly effective gene for races TRTTF and JRCQC (Yue Jin personal
communication) However their mapping locations did not coincide with the 6AL-distal
region
Two significant QTLs for resistance to stem rust were found on chromosome arm 7AL
where Sr22 and Sr15 are located Sr15 is distally located on chromosome arm 7AL near
gwm344 while wPt-7299 appears to be linked to Sr22 Finally AM detected a QTL at the
distal end of chromosome arm 7BL near wmc517 a region known to harbour Sr17 a gene
linked to Lr14a and Pm5 in bread wheat (Crossa et al 2007) It is also consistent with a
region reported to include a stem rust QTL in the Arina x Forno RIL population (Bansal et al
2008)
553 Significant markers for putatively novel stem rust resistance at seedling stage
Several significant markers tagged regions where no stem rust genes had previously been
reported These regions with significant associations (one for TTKSK one for TRTTF two
for TTTTF and three for race JRCQC) were detected on chromosome 3A where Sr27 and
Sr35 both effective against Ug99 have been reported (McIntosh et al 1995 Singh et al
2006 Jin et al 2007) However as Sr27 originated from a wheat-rye translocation present
mostly in triticales and Sr35 from Triticum monococcum and then transferred to some
127
tetraploids of Canadian origin none of which were present in this study or in the pedigree of
the accessions of the AM panel the chromosome 3A-related associations detected herein are
likely to involve alternative and unknown loci Additionally no Sr gene was reported on
chromosome arm 3BL and thus the significant effects associated with wmc418 and wPt-9049
could be due to putatively novel loci Similarly the QTL on chromosome arm 4AL with a
major effect for race JRCQC and the QTL on chromosome 4BL for race TTTTF could
represent new race-specific loci for stem rust resistance Although the significant markers
identified on chromosomes 5A and 5B did not overlap with any reported major Sr gene
resistance QTLs for response to Ug99 have been mapped in similar locations on chromosome
arm 5BS (Yu et al 2011) The markers on chromosome 5A were located where no Sr gene or
QTL has been previously reported and may represent one or more new QTL for stem rust
resistance All significant markers identified on chromosome arm 6BS did not coincide with
any of the reported major Sr genes and may thus represent new loci Similarly two genomic
regions were detected on chromosome 7AS (wPt-6668 and wPt-7188) and were not
significantly associated with stem rust resistance in previous reports Although no Sr genes
have been reported for chromosome arm 7BS two distinct QTLs were detected for race
JRCQC near gwm573 and gwm333 which could also be considered as novel Sr loci
Following further characterisation and validation diagnostic markers for these resistance loci
would be useful for enhancing APR to stem rust provided they are also associated with broad
range adult plant resistance
554 Reaction of race-specific resistance genes
Although more than 50 different stem rust resistance loci have been cataloged and multiple
alleles are known for three genes (Singh et al 2011) additional resistance loci that are likely
different from designated genes have recently been identified All designated genes except
Sr2 and the recently characterised Sr55 and Sr57 are race specific The majority of stem rust
resistance genes confer varying levels of intermediate resistance both at seedling and adult
stages and some genes did not confer adequate protection in the field if present alone (Singh
et al 2006 2011) In our study several race-specific QTLs associated to resistance to three or
four of the races were detected that upon pyramiding may reduce susceptibility and enhance
durability Most studies in which several races were used to detect QTLs for resistance have
128
reported either race-specific QTLs (Niks et al 2000 Zhu et al 2003) or a combination of
broad-spectrum QTLs and race-specific QTLs with various effects on resistance (Qi et al
1999 Arru et al 2003 Chen et al 2003) Our results are more complex since (i) some of the
race-specific QTLs had strong effects on resistance (for instance the QTL on chromosome 2B
tagged by gwm47 for race TRTTF and the QTL on chromosome 4A tagged by barc78 for race
JRCQC) (ii) some QTLs had strong albeit quantitative effect (QTL on chromosome 7B
tagged by wmc517 for races TTKSK and TTTTF) (iii) some minor QTLs were effective
across all races (QTL on chromosome 5A tagged by gwm410) and (iv) the QTL cluster on
chromosome 6A tagged by CD926040 and barc104 showed broad spectrum resistance with
major effect for races TTKSK TTTTF and JRCQC and relatively minor effects for race
TRTTF The greater complexity observed in our study could partly derive from the evaluation
of a large number of accessions with different genetic background and races with distinct
virulence
555 QTLs with minor effects
Except for the QTLs tagged by CD926040 and barc104 each significant association
identified in this study explained less than 10 of the phenotypic variation for stem rust
resistance at the seedling stage Previous AM studies have also identified QTLs with minor
phenotypic effects (Roy et al 2010 Maccaferri et al 2011 Massman et al 2011) QTL
effects estimated via AM are usually lower in R2 and effect values than those estimated in
biparental populations because of the greater complexity at the effector loci explored in the
AM panels as compared to biparental mapping populations including the presence of more
complex epistatic interactions among loci More importantly the elite breeding germplasm of
durum wheat in the past decades has not been improved by means of an extensive use of
wide-crosses to introgress alleles with strong phenotypic effects (Maccaferri et al 2005)
Lastly the effect of the marker is a function of the QTL effect and of the LD between the
marker and the QTL and insufficient marker density could lead to markers that are in low LD
with the QTL (Massman et al 2011)
129
556 Breeding perspectives
This study shows that the level of seedling resistance to stem rust in elite durum is largely
governed by minor QTLs and one major QTL on chromosome 6A Selection for markers
closely linked to these loci have thus the potential to improve stem rust resistance in
populations generated from this set of accessions Other promising sources of seedling
resistance have been identified and demonstrated their effectiveness under highly conducive
environments for stem rust epidemics Markers are already available for Sr9 (Tsilo et al
2007) Sr13 (Simons et al 2011) Sr26 (Mago et al 2005 Liu et al 2010) and Sr25 (Yu et al
2010) If further confirmed the QTLs reported here for seedling resistance and the
corresponding closely linked molecular markers will contribute to broadening the genetic
basis of seedling and potentially also field resistance to stem rust an important goal of durum
wheat breeding We have identified several loci for resistance to highly virulent stem rust
races that can be used in breeding programmes Notably some of the durum wheat lines that
were tested herein carry resistance to all four races of Pgt
Our results indicate the suitability of AM to provide valuable information to accelerate durum
wheat improvement and cultivar release In particular the results confirm the role of of Sr9
Sr13 and Sr14 previously described in biparental mapping studies while unveiling the
presence of putatively novel loci that could be exploited to enhance stem rust resistance in
durum wheat via marker-assisted selection With proper planning and an accurate deployment
of Sr genes long-term broad-spectrum APR can thus be attained more effectively Attaining
APR is essential for the release of novel cultivars of durum wheat because stem rust
susceptibility is low until heading Therefore stem rust resistance at the seedling stage while
easy and fast to assay may not be indicative of the reaction at the adult plant stage
Combining the results of this study with those on APR in the field where races such as
TTKSK TRTTF and JRCQC prevail (Letta et al 2013) will facilitate the selection of suitable
parental lines for further improving stem rust resistance of durum wheat In summary this
study provides novel information that can be exploited for pre-emptive breeding efforts to
reduce the vulnerability of durum wheat to stem rust The first step would be to identify a
small subset of accessions that carry resistance alleles at different QTLs These accessions
would then be used as donor parents in a marker-assisted backcrossing scheme aimed to
select lines with resistance alleles at different loci in an elite genetic background Further
130
characterisation of these sets of near-isogenic lines would confirm the QTL effects while
providing more accurate estimates of allelic effects and their epistatic interactions In the near
future the availability of high-density SNP platforms including thousands of markers will
allow for studies with almost complete genome coverage and a much more refined resolution
at the haplotype level (Akhunov et al 2009 Kaur et al 2011 Trebbi et al 2011 You et al
2011 van Poeke et al 2013) The use of the same SNP assays in applied breeding
programmes will also facilitate the simultaneous selection of multiple beneficial alleles for
partial resistance Finally the relatively large number and small effects of the QTLs herein
described suggest that a more comprehensive selection strategy such as genomic selection
(Heffner et al 2009 Rutkoski et al 2011) may prove more cost-effective than traditional
MAS strategies at accumulating beneficial alleles in breeding populations
56 CONCLUSIONS
Association mapping has the promising potential to dissect quantitative traits including
disease resistance to generated information that facilitate crop improvement and variety
development As shown in this and other studies AM complements bi-parental mapping for
an independent QTL validation identification of novel QTLs and potentially more precise
QTL location The present study highlighted the presence of novel genetic variation that
could be exploited to enhance stem rust resistance in durum wheat via marker-assisted
selection Our results confirm the role of of Sr9 Sr13 and Sr14 previously described in
biparental mapping studies while unveiling the presence of putatively novel loci thus
supporting the validity of AM
Identifying new sources of resistance to stem rust including Ug99 and other virulent races
provides wheat breeders with an increased diversity of Sr genes to be combined in new
cultivars With proper planning and an accurate selection of Sr genes long-term broad-
spectrum resistance can thus be attained Attaining adult plant resistance is essential for the
release of novel cultivars of durum wheat because stem rust susceptibility is not high until
heading Nonetheless stem rust resistance at the seedling stage while easy and fast to assay
may not be indicative of the reaction at the adult plant stage because some genes are effective
only at specific growth stages Combining the results of this study with those in adult plant
131
resistance in the field at Debrezeit where races such as TTKSK TRTTF and JRCQC are
prevalent will provide valuable indications to select suitable parental lines for further
improving stem rust resistance of durum wheat Additionally accessions carrying putative
novel alleles should be tested against a collection of different stem rust isolates in the
greenhouse to determine whether they possess a broad-based resistance
Acknowledgments
The financial contribution of the Beachell-Borlaug International Scholar Initiative to support
Tesfaye L Dugo is gratefully acknowledged
132
57 LITERATURE CITED
Admassu B Fekadu E (2005) Physiologic races and virulence diversity of Puccinia graminis
f sp tritici on wheat in Ethiopia Phytopathol Mediterr 44 313-318
Admassu B Lind V Friedt W Ordon F (2009) Virulence analysis of Puccinia graminis f sp
tritici populations in Ethiopia with special consideration of Ug99 Plant Pathol 58
362-369
Admassu B Perovic D Friedt W Ordon F (2011) Genetic mapping of the stem rust (Puccinia
graminis f sp tritici Eriks amp E Henn) resistance gene Sr13 in wheat (Triticum
aestivum L) Theor Appl Genet 122 643-648
Akbari M Wenzl P Caig V Carling J Xia L Yang S Uszynski G Mohler V Lehmensiek A
Kuchel H Hayden MJ Howes N Sharp P Vaughan P Rathmell B Huttner E Kilian
A et al (2006) Diversity arrays technology (DArT) for high-throughput profiling of the
hexaploid wheat genome Theor Appl Genet 113 1409-1420
Akhunov E Nicolet C Dvorak J (2009) Single nucleotide polymorphism genotyping in
polyploid wheat with the Illumina GoldenGate assay Theor Appl Genet 119 507-
517
Arru L Francia E Pecchioni N (2003) Isolate-specific QTLs of resistance to leaf stripe
(Pyrenophora graminea) in the lsquoSteptoersquo times lsquoMorexrsquo spring barley cross Theor Appl
Genet 106 668-675
Badebo A Gelalcha S Ammar K Nachit M M Abdalla O et al (2009) Durum wheat research
in Ethiopia In Proceedings of the 2009 BGRI Technical Workshop CIMMYT Cd
Obregon Sonora Mexico March 17-20 2009 pp 28
Bansal UK Bossolini E Miah H Keller B Park RF Bariana HS et al (2008) Genetic
mapping of seedling and adult plant stem rust resistance in two European winter
wheat cultivars Euphytica 164 821-828
Belaid A (2000) Durum wheat in WANA (West Asia and North Africa) production trade and
gains from technological change In Royo C Nachit MM Di Fonzo N Araus JL
(eds) Durum wheat improvement in the Mediterranean region new challenges vol 40
Options Mediterraneennes CIHEAM-IAMZ Zaragoza pp 35-39
Bhavani S Singh RP Argillier O Huerta-Espino J Singh S Njau P Brun S Lacam S
Desmouceaux N et al (2011) Mapping durable adult plant stem rust resistance to the
133
race Ug99 group in six CIMMYT wheats In McIntosh RA (ed) BGRI 2011 Technical
Workshop Borlaug Global Rust Initiative St Paul MN USA pp 43-53
Bradbury PJ Zhang Z Kroon DE Casstevens TM Ramdoss Y Buckler ES et al (2007)
TASSEL software for association mapping of complex traits in diverse samples
Bioinformatics 23 2633-2635
Breseghello F Sorrells ME (2006) Association mapping of kernel size and milling quality in
wheat (Triticum aestivum L) cultivars Genetics 172 1165-1177
Brown GN (1997) The inheritance and expression of leaf chlorosis associated with gene Sr2
for adult plant resistance to wheat stem rust Euphytica 95 67-71
Chen H Wang S Xing Y Xu C Hayes PM Zhang Q et al (2003) Comparative analyses of
genomic locations and race specificities of loci for quantitative resistance to
Pyricularia grisea in rice and barley Proc Natl Acad Sci USA 100 2544-2549
Crossa J Burgueno J Dreisigacker S Vargas M Herrera-Foessel SA Lillemo M et al (2007)
Association analysis of historical bread wheat germplasm using additive genetic
covariance of relatives and population structure Genetics 177 1889-1913
de Givry S Bouchez M Chabrier P Milan D Schiex T et al (2005) CAR(H) (T) A Gene
multipopulation integrated genetic and radiation hybrid mappingBioinformatics 21
1703-1704
Dilbirligi M Erayman M Sanghu D Sidhu D Gill KS et al (2004) Identification of wheat
chromosomal regions containing expressed resistance genes Genetics 166 461-481
Dubcovsky J Ordon F Perovic D Admassu B Friedt W Abate Z Zhang W Chao S (2011)
Conflicting mapping results for stem rust resistance gene Sr13 Theor Appl Genet
122 659-659
Ersoz ES Yu J Buckler ES (2009) Application of linkage disequilibrium and association
mapping in maize In Kriz A Larkins B (eds) Molecular genetic approaches to maize
improvement Springer Berlin pp 173-195
Eversmeyer MG Kramer CL (2000) Epidemiology of wheat leaf and stem rust in the central
Great Plains of the USA Annu Rev Phytopathol 38 491-513
Flint-Garcia SA Thornsberry JM Buckler ES (2003) Structure of linkage disequilibrium in
plants Annu Rev Plant Biol 54357-374
Gupta PK Rustgi S Kulwal PL (2005) Linkage disequilibrium and association studies in
higher plants present status and future prospects Plant Mol Biol 57 461-485
134
Habash DZ Kehel Z Nachit M (2009) Genomic approaches for designing durum wheat
ready for climate change with a focus on drought J Exp Bot 60 2805-2815
Haile JK Nachit MM Hammer K Badebo A Roder MS et al (2012) QTL mapping of
resistance to race Ug99 of Puccinia graminis f sp tritici in durum wheat (Triticum
durum Desf) Mol Breed 30 1479-1493
Hall D Tegstrom C Ingvarsson PK (2010) Using association mapping to dissect the genetic
basis of complex traits in plants Brief Funct Genom 9 157-165
Heffner EL Sorrells ME Jannink J (2009) Genomic selection for crop improvement Crop
Sci 49 1-12
Hiebert CW Fetch TG Zegeye T (2010) Genetics and mapping of stem rust resistance to
Ug99 in the wheat cultivar Webster Theor Appl Genet 121 65-69
Jin Y Singh RP Ward RW Wanyera R Kinyua M Njau P Pretorius ZA et al (2007)
Characterization of seedling infection types and adult plant infection responses of
monogenic Sr gene lines to race TTKS of Puccinia graminis f sp tritici Plant Dis
91 1096-1099
Jin Y Szabo LJ Pretorius ZA Singh RP Ward R Fetch T Jr et al (2008) Detection of
virulence to resistance gene Sr24 within race TTKS of Puccinia graminis f sp tritici
Plant Dis 92 923-926
Kaur S Franki MG Forster JW (2011) Identification characterization and interpretation of
single-nucleotide sequence variation in allopolyploid crop species Plant Biotechnol
J 10 125-138 doi 101111 j1467-7652 2011 00644 x
Klindworth DL Miller JD Jin Y Xu SS (2007) Chromosomal locations of genes for stem
rust resistance in monogenic lines derived from tetraploid wheat accession ST464
Crop Sci 47 1441-1450
Kollers S Rodemann B Ling J Korzun V Ebmeyer E Argillier O Hinze M Plieske J
Kulosa D Ganal MW Roumlder MS (2013) Whole Genome Association Mapping of
Fusarium Head Blight Resistance in European Winter Wheat (Triticum aestivum L)
PLoS One 8 e57500
Li H Peng Z Yang X Wang W Fu J Wang J Han Y Chai Y Guo T Yang N Liu J
Warburton ML Cheng Y Hao X Zhang P Zhao J Liu Y Wang G Li J Yan J (2013)
Genome-wide association study dissects the genetic architecture of oil biosynthesis in
maize kernels Nat Genet 45 43-50
135
Letta T Maccaferri M Ammar K Badebo A Ricci A Crossa J Tuberosa R et al (2013)
Searching for novel sources of field resistance to Ug99 and Ethiopian stem rust races
in durum wheat via association mapping Theor Appl Genet doi 101007 s00122-
013-2050-8
Li H Peng Z Yang X Wang W Fu J Wang J Han Y Chai Y Guo T Yang N Liu J
Warburton ML Cheng Y Hao X Zhang P Zhao J Liu Y Wang G Li J Yan J (2013)
Genome-wide association study dissects the genetic architecture of oil biosynthesis in
maize kernels Nat Genet 45 43-50
Liu S Yu LX Singh RP Jin Y Sorrells ME Anderson JA et al (2010) Diagnostic and co-
dominant PCR markers for wheat stem rust resistance genes Sr25 and Sr26 Theor
Appl Genet 120 691-697
Maccaferri M Sanguineti MC Noli E Tuberosa R (2005) Population structure and long-
range linkage disequilibrium in a durum wheat elite collection Mol Breed15 271-
289
Maccaferri M Sanguineti MC Natoli V Ortega JLA Ben Salem M Bort J Chenenaoui C
De Ambrogio E del Moral LG De Montis A El-Ahmed A Maalouf F Machlab H
Moragues M Motawaj J Nachit M Nserallah N Ouabbou H Royo C Tuberosa R et
al (2006) A panel of elite accessions of durum wheat (Triticum durum Desf) suitable
for association mapping studies Plant Gen Res 4 79-85
Maccaferri M Sanguineti MC Corneti Ortega JLA Ben Salem M Bort J DeAmbrogio E
del Moral LFG Demontis A El-Ahmed A Maalouf F Machlab H Martos V
Moragues M Motawaj J Nachit M Nserallah N Ouabbou H Royo C Slama A
Tuberosa R et al (2008) Quantitative trait loci for grain yield and adaptation of durum
wheat (Triticum durum Desf) across a wide range of water availability Genetics 178
489-511
Maccaferri M Sanguineti MC Mantovani P Demontis A Massi A Ammar K Kolmer J
Czembor J Ezrati S Tuberosa R et al (2010) Association mapping of leaf rust
response in durum wheat Mol Breed26 189-228
Maccaferri M Sanguineti MC del Moral LFG Demontis A El-Ahmed A Maalouf F
Machlab H Martos V Moragues M Motawaj J Nachit M Nserallah N Ouabbou H
Royo C Slama A Tuberosa R et al (2011) Association mapping in durum wheat
136
grown across a broad range of water regimes and yield potential J Exp Bot 62 409-
438
Mago R Bariana HS Dundas IS Spielmeyer W Lawrence GJ Pryor AJ Ellis JG et al (2005)
Development of PCR markers for the selection of wheat stem rust resistance genes
Sr24 and Sr26 in diverse wheat germplasm Theor Appl Genet 111 496-504
Mago R Brown-Guedira G Dreisigacker S Breen J Jin Y Singh R Appels R Lagudah ES
Ellis J Spielmeyer W et al (2010) An accurate DNA marker assay for stem rust
resistance gene Sr2 in wheat Theor Appl Genet 122 735-744 doi101007 s00122-
010- 1482 -7
Mantovani P Maccaferri M Sanguineti MC Tuberosa R Catizone I Wenzl P Thomson B
Carling J Eric H De-Ambrogio E Kilian A et al (2008) An integrated DArT-SSR
linkage map of durum wheat Mol Breed22 629-648
Massman J Cooper B Horsley R Neate S Dill-Macky R Chao S Dong Y Schwarz P
Muehlbauer GJ Smith KP et al (2011) Genome wide association mapping of fusarium
head blight resistance in contemporary barely breeding germplasm Mol Breed27
439-454
McIntosh RA Wellings CR Park RF (1995) Wheat rusts An Atlas of resistance genes
CSIRO Canberra
McIntosh RA Brown GN (1997) Anticipatory breeding for resistance to rust diseases in
wheat Annu Rev Phytol 35 311-326
Myles S Peiffer J Brown Ersoz ES Zhang ZW Costich DE Buckler ESPJ et al (2009)
Association mapping critical considerations shift from genotyping to experimental
designThe Plant Cell 21 2194-2202
Niks RE Fernaacutendez E Van Haperen Bekele Aleye B Martiacutenez FB et al (2000) Specificity of
QTLs for partial and non-host resistance of barley to leaf rust fungi Acta Phytopathol
Hun 35 13-21
Olivera PD Jin Y Rouse Badebo A Fetch T Jr Singh RP and Yahyaoui AM et al (2012)
Races of Puccinia graminis f sp tritici with combined virulence to Sr13 and Sr9e in a
field stem rust screening nursery in Ethiopia Plant Dis 96 623-628
Pretorius ZA Singh RP Wagoire WW Payne TS (2000) Detection of virulence to wheat stem
rust resistance gene Sr31 in Puccinia graminis f sp tritici in Uganda Plant Dis 84
203
137
Pritchard JK Stephens M Donnelly P (2000) Inference of population structure using
multilocus genotype data Genetics 155 945-959
Qi X Jiang G Chen W Niks RE Stam P Lindhout P et al (1999) Isolate-specific QTLs for
partial resistance to Puccinia hordei in barley Theor Appl Genet 99 877-884
Rafalski JA (2002) Novel genetic mapping tools in plants SNPs and LD-based approaches
Plant Sci 162 329-333
Roelfs AP Martens JW (1988) An international system of nomenclature for Puccinia
graminis f sp tritici Phytopathol 78 526-533
Roelf AP Long DL Robert JJ (1993) Races of Puccinia graminis in the United States during
1990 Plant Dis 77 125-128
Rohlf FJ (1997) NTSYS-pc version 20 Exeter Press East Setauket NY USA
Roy JK Smith KP Muehlbauer GJ Chao S Close TJ Steffenson BJ et al (2010) Association
mapping of spot blotch resistance in wild barley Mol Breed 26 243-256
Rouse MN Nava IC Chao S Anderson JA Jin Y (2012) Identification of markers linked to
the race Ug99 effective stem rust resistance gene Sr28 in wheat (Triticum aestivum
L) Theor Appl Genet 125 877-885
Rutkoski JE Heffner EL Sorrells ME (2011) Genomic selection for durable stem rust
resistance in wheat Euphytica 179 161-173
Schuelke M (2000) An economic method for the fluorescent labelling of PCR fragments Nat
Biotechnol 18 233-234
Simons K Abate Z Chao S Zhang W Rouse M Jin Y Elias E Dubcovsky J et al (2011)
Genetic mapping of stem rust resistance gene Sr13 in tetraploid wheat (Triticum
turgidum ssp durum L) Theor Appl Genet 122 649-658
Singh RP Huerta-Espino J Fuentes G Duveiller E Gilchrist L Henry M Nicol MJ et al
(2005) Resistance to diseases In Royo C Nachit MM Di Fonzo N Araus JL
Pfeiffer WH Slafer GA (eds) Durum wheat breeding current approaches and future
strategies Food Product Press Binghamton pp 291-315
Singh RP Hodson DP Jin Y Huerta-Espino J Kinyua MG Wanyera R Njau P Ward RW et
al (2006) Current status likely migration and strategies to mitigate the threat to wheat
production from race Ug99 (TTKS) of stem rust pathogen In CAB reviews
perspectives in agriculture veterinary science nutrition and natural resources 1 No
054
138
Singh RP Hadson DP Huerta-Espino J Jin Y Bhavani S Njau P Herrera-Foessel S Singh
PK Singh S Govindan V et al (2011) The emergence of Ug99 races of the stem rust
fungus is a threat to world wheat production Ann Rev Phytopathol 49 465-481
Singh A Pandey MP Singh AK Knox RE Ammar K Clarke JM Clarke FR Singh RP
Pozniak CJ Depauw RM McCallum BD Cuthbert RD Randhawa HS Fetch TG
(2013) Identification and mapping of leaf stem and stripe rust resistance quantitative
trait loci and their interactions in durum wheat Mol Breed31 405-418
Stakman EC Steward DM Loegering WQ (1962) Identification of physiologic races of
Puccinia graminis var tritici U S Dep Agric Agric Res Serv E-617
Stich B Melchinger AE Frisch M Maurer HP Heckenberger M Reif JC et al (2005)
Linkage disequilibrium in European elite maize germplasm investigated with SSRs
Theor Appl Genet 111 723-730
Stich B Melchinger AE (2010) An introduction to association mapping in plants CAB Rev
5 039
Storey JD Tibshirani R (2003) Statistical significance for genome wide studies Proc Natl
Acad Sci USA 100 9440-9445
Sun Y Steffenson BJ (2005) Reaction of barely seedlings with different stem rust resistance
genes to Puccinia graminis f sp tritici and Puccinia graminis f sp secalis Canad J
Plant Pathol 27 80-89
Thornsberry JM Goodman MM Doebley J Kresovich S Nielsen D Buckler ES IV et al
(2001) Dwarf8 polymorphisms associate with variation in flowering time Nat Genet
28 286-289
Trebbi D Maccaferri M de Heer P Sorensen A Giuliani S Salvi S Sanguineti MC Massi
A van der Vossen EAG Tuberosa R et al (2011) High-throughput SNP discovery and
genotyping in durum wheat (Triticum durum Desf) Theor Appl Genet 123 555-
569
Tsilo TJ Jin Y Anderson JA (2007) Microsatellite markers linked to stem rust resistance
allele Sr9a in wheat Crop Sci 47 2013-2020
van Poecke Remco Maccaferri MarcoTang JifengTruongHoa Janssen Antoine van
Orsouw Nathalie Salvi Silvio Sanguineti Maria Tuberosa Roberto van der Vossen
Edwin (2013) Sequence-based SNP genotyping in durum wheat Plant Biotechnol J
Accepted
139
You FM Huo NX Deal KR Gu YQ Luo MC McGuire PE Dvorak J Anderson OD et al
(2011) Annotation-based genome-wide SNP discovery in the large and complex
Aegilops tauschii genome using next-generation sequencing without a reference
genome sequence BMC Genomics doi 1011861471-2164-12-59
Yu JM Pressoir G Briggs WH Bi IV Yamasaki M Doebley JF McMullen MD Gaut BS
Nielsen DM Holland JB Kresovich S Buckler ES et al (2006) A unified mixed-
model method for association mapping that accounts for multiple levels of
relatedness Nat Genet 38 203-208
Yu L-X Abate Z Anderson JA Bansal UK Bariana HS Bhavani S Dubcovsky J Lagudah
ES Liu SX Sambasivam PK Singh RP Sorrells ME et al (2009) Developing and
optimizing markers for stem rust resistance in wheat Proceedings of 2009 Technical
Workshop Borlaug Global Rust Initiative Cd Obregoacuten Sonora Mexico pp 117-130
Yu L-X Liu S Anderson JA Singh RP Jin Y Dubcovsky J BrownGuidera G Bhavani S
Morgounov A He Z Huerta-Espino J Sorrells ME et al (2010) Haplotype diversity of
stem rust resistance loci in uncharacterized wheat lines Mol Breed 26 667-680
Yu L-X Lorenz A Rutkoski J Singh RP Bhavani S Huerta-Espino J Sorrells ME et al
(2011) Association mapping and gene-gene interaction for stem rust resistance in
CIMMYT spring whear germplasm Theor Appl Genet 123 1257-1268
Yu L-X Morgounov A Wanyera R Keser M Singh S K Sorrells M (2012) Identification of
Ug99 stem rust resistance loci in winter wheat germplasm using genome-wide
association analysis Theor Appl Genet 125 749-758
140
FIGURES
141
Figure 1 Frequency distribution of Infection Types (ITs) within an AM panel of 183 durum
genotypes challenged at seedling stage with 4 stem rust races
142
Figure 2 UPGMA-dendrogram of the 4 stem rust (Puccinia graminis Pers F sp tritici)
races used to characterize the durum germplasm collection
The dendrogram is based on the racesrsquo virulence phenotypes (Infection types estimated with a
0-4 scale) Distances were computed using the standardized Manhattan distances (lsquocity-
blockrsquo method)
TTKSK
TTTTF
JRCQC
TRTTF
Manhattanrsquo distance104 794 1483 2172
143
TABLES
144
Table 1 Isolate designation origin virulence phenotype and infection type (IT) on Sr13 of Puccinia graminis f sp tritici races used to
evaluate the durum panel
Race Isolate Origin Avirulence Virulence
IT on Sr13
1
TRTTF 06YEM34-1 Yemen Sr8a 24 31 Sr5 6 7b 9a 9b 9d 9e 9g 10 11 17 Sr21
30 36 38 McN 3+
TTTTF 01MN84A-1-2 United States Sr24 31
Sr5 6 7b 8a 9a 9b 9d 9e 9g 10 11 Sr17
21 30 36 38 McN 2
TTKSK
(Ug99) 04KEN15604 Kenya Sr24 36 Tmp
Sr5 6 7b 8a 9a 9b 9d 9e 9g 10 11 Sr17
21 30 31 38 McN 22-
JRCQC 09ETH08-3 Ethiopia
Sr5 7b 8a 36 9b 30
Tmp 24 31 38 Sr21 9e 11 6 9g 17 9a 9d McN 3
1Infection types observed on seedlings at 14 days post-inoculation using a 0 to 4 scale according to Stakman et al (1962) where infection types of 1 2 or X are
considered as a low IT and ITs of 3 or higher are considered as a high IT
145
Table 2 Numbers and frequencies of infection types (IT) and resistant susceptible and heterogeneous reactions of the 183 durum
genotypes included in the AM panel to four races of Puccinia graminis f sp tritici and the combined reaction to all races
IT1 Reaction TRTTF TTTTF TTKSK (Ug99) JRCQC All races
Lines Lines Lines Lines Lines
ldquo0rdquo or ldquordquo 10 55 3 16 2 11 4 22 0 0
ldquo1rdquo 1 05 10 55 1 05 5 27 0 0
ldquo2rdquo or ldquo23rdquo or ldquoXrdquo 138 754 104 568 103 563 78 426 66 361
Resistant Reaction 149 814 117 639 106 579 87 475 66 361
ldquo3rdquo 22 120 47 257 53 290 39 213 10 55
ldquo4rdquo 4 22 2 11 13 71 50 273 2 11
Susceptible Reaction 26 142 49 268 66 361 89 486 12 66
Heterogeneous2 8 44 17 93 11 60 7 38 1 05
1Infection types observed on seedlings at 14 days post-inoculation using a 0 to 4 scale according to Stakman et al (1962) where infection types of 1 2 or X are
considered as a low IT and ITs of 3 or higher are considered as a high IT
2Accessions that contained both resistant and susceptible plants
146
Table 3 Numbers and frequencies of reactions of 183 durum genotypes included in the AM panel to 4 races of Puccinia graminis f sp
tritici classified by origin subgroup
Durum Panel
subgroup1
TRTTF TTTTF TTKSK JRCQC Across races
Res2 Sus
3 Res
4 Res Sus Res Res Sus Res Res Sus Res Res Sus Res
no no Rank no no rank no no rank no no rank no no rank
S1
(11 accessions) Lines 9 2 4 5 5 5 3 7 5 2 9 5 2 1 4
818 182 50 50 30 70 182 818 667 333
S2
(55 accessions) Lines 42 9 3 41 11 2 30 21 2 23 28 3 22 6 3
824 176 788 212 588 412 451 549 786 214
S2
(55 accessions) Lines 14 8 5 17 5 3 12 11 4 16 10 2 8 4 5
636 364 773 227 522 478 615 385 667 333
S2
(55 accessions) Lines 53 3 2 32 16 4 31 23 3 21 33 4 19 2 2
946 54 667 333 574 426 389 611 905 95
S2
(55 accessions) Lines 35 0 1 29 5 1 29 5 1 25 9 1 26 0 1
100 0 853 147 853 147 735 265 100 0
1 Durum Panel subgroups S1 ICARDA germplasm for dryland areas S2 ICARDA germplasm for temperate areas S3 Italian and early rsquo70 CIMMYT germplasm
S4 CIMMYT germplasm (late rsquo70-early rsquo80) S5 CIMMYT germplasm (late rsquo80-early rsquo90)
2 Resistant accessions infection types of 1 2 or X
3 Susceptible accessions ITs of 3 or higher
4 Subgroup rank values based on their of resistant accessions
147
Table 4 Most significant markers for each QTL associated with stem rust races TRTTF TTTTF TTKSK and JRCQC resistance in 183
durum association panel at seedling stage
1 P values of markers that showed significant (P le 005) associations at the genome-wise level are reported in bold (continued)
P value (Q+K model)1 R
2 ()
Number of significant
tests over four races
Marker Chr cM TRTTF TTTTF TTKSK JRCQC TRTTF TTTTF TTKSK JRCQC Marker-
wise tests
Genome-
wise tests
wPt-1876 1B 313 - - - 00033 - - - 313 1 0
barc61 1B 872 00306 00393 00328 - 245 227 241 - 3 0
barc81 1B 1199 - 00144 00131 - - 242 237 - 2 0
wmc44 1B 1581 - 00283 - 00093 - 388 - 486 2 0
wPt-5839 2A 0 00165 00098 00155 - 160 244 217 - 3 0
cfa2201 2A 478 00054 - 00137 - 425 - 350 - 2 0
wPt-2293 2A 637 126E-4
- - - 420 - - - 1 1
gwm410 2B 641 0009 - - - 370 - - - 1 0
gwm47 2B 1589 181E-5
- - - 834 - - - 1 1
gwm1300 2B 1691 - 00215 00041 - - 336 466 - 2 0
wmc356 2B 220 - 00421 - 0008 - 244 - 422 2 0
wPt-1923 3A 464 - 00029 0017 694E-4
- 317 209 398 3 1
gwm1620 3A 83 - 00375 - 00152 - 247 - 309 2 0
wmc264 3A 1196 00217 - - 00322 37 - - 349 2 0
wmc43 3B 579 - 00127 00017 - - 275 487 - 2 1
wmc418 3B 122 00116 00143 - - 366 356 - - 2 0
wPt-9049 3B 1825 - - - 00043 - - - 284 1 0
barc78 4A 1106 - - - 687E-7
- - - 936 1 1
gwm1084 4B 919 - 00081 - - - 367 - - 1 0
gwm617 5A 44 - - 00024 - - - 480 - 1 0
gwm1570 5A 326 - - - 0004 - - - 294 1 0
barc165 5A 571 - - - 00248 - - - 350 1 0
gwm410 5A 120 00155 00191 0009 00032 204 192 256 356 4 0
wPt-5514 5B 0 - 0011 00067 - - 248 289 - 2 0
gwm234 5B 272 - - - 0007 - - - 351 1 0
wPt-0566 5B 1891 00415 00021 - - 113 356 - - 2 0
148
Table 4 Continuedhellip
P value (Q+K model) 1 R
2 ()
Number of significant
tests
Marker Chr cM TRTTF TTTTF TTKSK JRCQC TRTTF TTTTF TTKSK JRCQC Marker-
wise tests
Genome-
wise tests
gwm169 6deg 1266 - 0002 00345 - - 368 175 - 2 0
gwm427 6deg 1395 - - 00153 00323 - - 249 151 2 0
CD926040 6deg 1439 00087 343E-12
417E-16
156E-10
352 1764 2312 1533 4 3
barc104 6deg 1553 0037 752E-7
335E-10
402E-6
284 1195 1782 1047 4 3
wPt-2991 6B 194 - - - 00095 - - - 24 1 0
wPt-0470 6B 516 - 00088 00086 - - 245 250 - 2 0
gwm518 6B 841 - - 00032 - - - 431 - 1 0
gwm816 6B 1021 - - - 00307 - - - 260 1 0
wPt-6668 7deg 327 835E-4
- - - 270 - - - 1 1
wPt-7188 7deg 804 00056 - 00341 - 211 - 177 - 2 0
wPt-7299 7deg 1507 - - 00037 - - - 314 - 1 0
gwm344 7deg 2419 525E-4
00088 - - 579 379 - - 2 1
gwm573 7B 666 - - - 00347 - - - 318 1 0
gwm333 7B 997 - - - 00182 - - - 390 1 0
wmc517 7B 1556 - 173E-5
00016 - - 80 496 - 2 2
Total significant regions
Marker-wise test 15 20 19 19
Total Regions after FDR
Genome-wise test 4 3 4 4
1 P values of markers that showed significant (P le 005) associations at the genome-wise level are reported in bold
149
GENERAL CONCLUSIONS AND PERSPECTIVES
Ethiopia is the second largest wheat producer in the sub-Saharan Africa The country is rich
in genetic resources of tetraploid wheat and has suitable environments for wheat production
However the country is a net importer of wheat particularly durum wheat (hard wheat) The
demand for durum wheat is continuously increasing because of the new emerging food
processing industries But the productivity of wheat in Ethiopia is low due to the contrains
caused by biotic and abiotic stresses Among the biotic factors stem rust plays a role of
paramount importance in yield reduction As a result of a recent emergence and spread of
Ug99 a new and highly virulent race of leaf rust and evolution of new durum-specific races
which overcame widely deployed stem rust resistance genes (eg Sr31) that had been
effective for many years stem rust is becoming a serious threat to wheat production in
Ethiopia as well as in other East African and wheat producing countries across the globe
Therefore it is important to identify new resistance sources conferring resistance to stem rust
races including Ug99 and its lineages and to develop codominant molecular markers suitable
for marker-assisted selection towards a more sustainable control of stem rust
To identify loci conferring resistance to stem rust races both at seedling and adult stages in
durum wheat 183 elite accessions representing the broad geographic origin were employed
The accessions were genotyped with 350 SSRs and 900 Diversity Array Technology (DArT)
markers Phenotypic data were collected on these accessions for stem rust resistance at the
adult plant stage in Ethiopia in four evaluation seasons Additionally seedling phenotypic
data on races TRTTF TTTTF TTKSK and JRCQC were collected at the Cereal Disease
Laboratory USDA and University of Minnesota St Paul on the same set of durum panel
Based on field data twelve QTL-tagging markers significant (P lt 005) across three to four
seasons were detected The role of Sr13 Sr9 Sr14 Sr17 and Sr28 was confirmed Thirteen
markers with significant effects on leaf rust resistance were located in regions with no Sr
genesQTLs and thus provide novel opportunities for marker-assisted selection At the
seedling stage and under controlled conditions the number of chr regions with significant
effects on resistance to the TRTTF TTTTF TTKSK and JRCQC races was 15 20 19 and
150
19 respectively Additionally the results of this study show that stem rust resistance in
durum is governed by shared loci and by race-specific ones The QTLs identified in this study
through AM will be useful in the marker-assisted development of durum wheat cultivars with
durable stem rust resistance and for selecting suitable parental lines for further improving
stem rust resistance of durum wheat Additionally accessions carrying putative novel alleles
should be tested against a collection of different stem rust isolates in the greenhouse to
determine whether they possess a broad-based resistance
In conclusion based on the results obtained in this study a short list of elite accessions of
durum wheat carrying beneficial alleles at different QTLs for stem rust resistance has been
identified and can be used as donors to initiate a MAS program to improve stem rust
resistance in the adapted Ethiopian durum wheat germplasm
151
APPENDICES
152
Appendix 1 Name and origin of accessons of durum wheat used in this study
Accession code Accession name ORIGIN
IDUWUE-002 CANNIZZO ITALY
IDUWUE-003 CLAUDIO ITALY
IDUWUE-004 LESINA ITALY
IDUWUE-005 MERIDIANO ITALY
IDUWUE-006 MONGIBELLO ITALY
IDUWUE-007 NORBA ITALY
IDUWUE-008 PIETRAFITTA ITALY
IDUWUE-010 TORREBIANCA ITALY
IDUWUE-011 BISU_1PATKA_3 CIMMYT
IDUWUE-012
CMH82A10623GGOVZ394SBA81PLC4AAZ_1C
REX5HUICIT71CII CIMMYT
IDUWUE-013 DUKEM3RUFFFGOYAV79 CIMMYT
IDUWUE-015 KULRENGI-BALIKCIL_8 CIMMYT
IDUWUE-016 PLATA_16 CIMMYT
IDUWUE-017 PORTO_5 CIMMYT
IDUWUE-018 ROKFGOSTIL3BISU_1 CIMMYT
IDUWUE-020 ACUATICOYAZI_1 CIMMYT
IDUWUE-021 FOCHA_15ALAS CIMMYT
IDUWUE-023 BUSHEN_4TARRO_2BUSHEN_4 CIMMYT
IDUWUE-024
GSCRASBA813HO4MEXI_15MEMO62ALT
AR 84 CIMMYT
IDUWUE-025 RASCON_372TARRO_2 CIMMYT
IDUWUE-027 SRN_3AJAIA_15DUKEM_13DION_2 CIMMYT
IDUWUE-028 ALDEANO IRTA-SPAIN
IDUWUE-029 ARIESOL IRTA-SPAIN
IDUWUE-030 ARTENA IRTA-SPAIN
IDUWUE-031 ASTIGI IRTA-SPAIN
IDUWUE-032 BOABDIL IRTA-SPAIN
IDUWUE-033 BOLENGA IRTA-SPAIN
IDUWUE-034 BOLIDO IRTA-SPAIN
IDUWUE-035 BOLO IRTA-SPAIN
IDUWUE-036 BOMBASI IRTA-SPAIN
IDUWUE-037 BORLI IRTA-SPAIN
IDUWUE-038 CANYON IRTA-SPAIN
IDUWUE-039 DURCAL IRTA-SPAIN
IDUWUE-040 DUROI IRTA-SPAIN
IDUWUE-041 GALLARETA IRTA-SPAIN
IDUWUE-042 ILLORA IRTA-SPAIN
IDUWUE-044 SENADUR IRTA-SPAIN
IDUWUE-045 SULA IRTA-SPAIN
IDUWUE-047 NASSIRA (MOROCCO_1805) INRA-MOROCCO
IDUWUE-048 CHAOUI (MOROCCO_1807) INRA-MOROCCO
IDUWUE-049 AMRIA (MOROCCO_1808) INRA-MOROCCO
IDUWUE-050 MAROUANE (MOROCCO_1809) INRA-MOROCCO
IDUWUE-053 JAWHAR INRA-MOROCCO
IDUWUE-054 MARJANA INRA-MOROCCO
IDUWUE-055 MARZAK INRA-MOROCCO
153
Appendix 1 Continuedhellip
Accession code Accession name ORIGIN
IDUWUE-056 OURGH INRA-MOROCCO
IDUWUE-057 TAREK INRA-MOROCCO
IDUWUE-060 AWALBIT ICARDA
IDUWUE-061 BCR3CHAM_1GTASTR ICARDA
IDUWUE-062 CHHB88DERAA ICARDA
IDUWUE-063 CHACAN ICARDA
IDUWUE-064 KARIM ICARDA
IDUWUE-065 HMLCHHB88 ICARDA
IDUWUE-066 KRSHCN ICARDA
IDUWUE-067 MURLAGOST-3 ICARDA
IDUWUE-068 MOULSABIL_2 ICARDA
IDUWUE-069 OMBAR ICARDA
IDUWUE-071 MRB589_5 ICARDA
IDUWUE-072
QUADALETEERPMAL3UNKNOWN(VSGIODES
SA) ICARDA
IDUWUE-073 SEBAH ICARDA
IDUWUE-074 STOJOCRI_3 ICARDA
IDUWUE-075 ZEINA_1 ICARDA
IDUWUE-076 ANTON ICARDA
IDUWUE-077 APPIO ITALY
IDUWUE-079 ARCANGELO ITALY
IDUWUE-080 ARCOBALENO ITALY
IDUWUE-081 BRAVADUR DESERT
IDUWUE-082 BRONTE ITALY
IDUWUE-083 CAPEITI 8 ITALY
IDUWUE-084 CAPPELLI ITALY
IDUWUE-085 CICCIO ITALY
IDUWUE-086 COLORADO-DW DESERT
IDUWUE-087 COLOSSEO ITALY
IDUWUE-088 CORTEZ DESERT
IDUWUE-089 CRESO ITALY
IDUWUE-090 DON PEDRO ITALY
IDUWUE-091 DUILIO ITALY
IDUWUE-093 FLAMINIO ITALY
IDUWUE-094 FORTORE ITALY
IDUWUE-095 GARGANO ITALY
IDUWUE-096 GRAZIA ITALY
IDUWUE-097 IRIDE ITALY
IDUWUE-098 ITALO ITALY
IDUWUE-099 IXOS ITALY
IDUWUE-100 KRONOS DESERT
IDUWUE-102 MESSAPIA ITALY
IDUWUE-103 MEXICALI 75 ITALY
IDUWUE-104 MOHAWK ITALY
IDUWUE-105 OFANTO ITALY
IDUWUE-106 PLATANI ITALY
IDUWUE-107 PLINIO ITALY
IDUWUE-108 PRODURA ITALY
IDUWUE-109 REVA ITALY
IDUWUE-110 ROQUENO ITALY
154
Appendix 1 Continuedhellip
Accession code Accession name ORIGIN
IDUWUE-111 SVEVO ITALY
IDUWUE-112 TRINAKRIA ITALY
IDUWUE-113 VALBELICE ITALY
IDUWUE-114 VALNOVA ITALY
IDUWUE-116 WESTBRED 881 DESERT
IDUWUE-117 WESTBRED TURBO DESERT
IDUWUE-118 AGHRASS_1 ICARDA
IDUWUE-119 AINZEN_1 ICARDA
IDUWUE-120 ANGRE ICARDA
IDUWUE-121 AMEDAKUL-1 ICARDA
IDUWUE-122 AMMAR-1 ICARDA
IDUWUE-123 ARISLAHN-5 ICARDA
IDUWUE-124 ATLAST-1 ICARDA
IDUWUE-125 AUS1 ICARDA
IDUWUE-126 AWALI_1 ICARDA
IDUWUE-127 RADIOSO ITALY
IDUWUE-128 AZEGHAR_2 ICARDA
IDUWUE-130 BICRE ICARDA
IDUWUE-131 BICREDERAA_1 ICARDA
IDUWUE-132 BIGOST-1 ICARDA
IDUWUE-133 BELIKH 2 ICARDA
IDUWUE-134 BRACHOUA ICARDA
IDUWUE-135 CHAHBA88 ICARDA
IDUWUE-136 CHAM_1 ICARDA
IDUWUE-137 DERAA ICARDA
IDUWUE-139 GEROMTEL-1 ICARDA
IDUWUE-140 GEZIRA-17 ICARDA
IDUWUE-141 GIDARA_2 ICARDA
IDUWUE-142 GUEROU_1 ICARDA
IDUWUE-144 HAURANI ICARDA
IDUWUE-145 HEIDER ICARDA
IDUWUE-146
OSL_14BUCCHRCPRL3PVN5HEL3YAVCORMS
HWA ICARDA
IDUWUE-147 SEBOU ICARDA
IDUWUE-148 BLK2134XS-69-186368-13MRB589_54ALBT_3 ICARDA
IDUWUE-149 ARIC31708703BO-DWCDECHBR-DW4CIT71GTA ICARDA
IDUWUE-150 JORDAN ICARDA
IDUWUE-151 KABIR 1 ICARDA
IDUWUE-153 KHABUR_1 ICARDA
IDUWUE-154 KORIFLA ICARDA
IDUWUE-155 LAGONIL-2 ICARDA
IDUWUE-156 LAHN ICARDA
IDUWUE-157 LOUKOS_1 ICARDA
IDUWUE-158 MAAMOURI-1 ICARDA
IDUWUE-159 MARSYR-1 ICARDA
IDUWUE-160 MASSARA_1 ICARDA
IDUWUE-161 MIKI-1 ICARDA
IDUWUE-163 MURLAGOST-1 ICARDA
IDUWUE-164 NILE ICARDA
IDUWUE-166 OMGENIL_3 ICARDA
IDUWUE-167 OMLAHN-3 ICARDA
IDUWUE-168 OMRUF-2 ICARDA
IDUWUE-169 OMSNIMA-1 ICARDA
155
Appendix 1 Continuedhellip
Accession code Accession name ORIGIN
IDUWUE-170 ORONTE 1 ICARDA
IDUWUE-171 OTB-6 ICARDA
IDUWUE-172 OUASERL_1 ICARDA
IDUWUE-173 OUASLAHN-1 ICARDA
IDUWUE-175 QUABRACH-1 ICARDA
IDUWUE-176 QUADALETE ICARDA
IDUWUE-177 RAZZAK INRAT
IDUWUE-178 SAADA3DDSMTL-1 ICARDA
IDUWUE-179 SAJUR ICARDA
IDUWUE-181 SHABHA ICARDA
IDUWUE-182 TELSET_5 ICARDA
IDUWUE-183 TENSIFT_1 ICARDA
IDUWUE-184 TERBOL 97_3 ICARDA
IDUWUE-185 TUNSYR-1 ICARDA
IDUWUE-186 WADALMEZ_1 ICARDA
IDUWUE-187 YOUNES-1 ICARDA
IDUWUE-188 YOUSEF_1 ICARDA
IDUWUE-189 KOFA ITALY
CIMMYT-251 1A1D 5+10-63MOJORCOL CIMMYT
CIMMYT-252 SOOTY_9RASCON_37 CIMMYT
CIMMYT-253 STOTALTAR 84ALD CIMMYT
CIMMYT-254 SOMAT_4INTER_8 CIMMYT
CIMMYT-255
CHEN_1TEZ3GUILCIT71CII4SORAPLATA_125ST
OTALTAR 84ALD CIMMYT
CIMMYT-256 MALMUK_1LOTUS_5F3LOCAL(SELETHIO13585) CIMMYT
CIMMYT-257
1A1D 5+10-62WB8811A1D 5+10-
63MOJO3BISU_1PATKA_3 CIMMYT
CIMMYT-258 HESSIAN-F_23STOTALTAR 84ALD CIMMYT
CIMMYT-259
AJAIA_12F3LOCAL(SELETHIO13585)PLATA_133S
OMAT_34SOOTY_9RASCON_37 CIMMYT
CIMMYT-260
USDA5953D673RABICRA4ALO5HUIYAV_16AR
DENTE7HUIYAV798POD_9 CIMMYT
CIMMYT-261 CNDOPRIMADURHAI-OU_173SNITAN CIMMYT
CIMMYT-262
GEDIZFGOGTA3SRN_14TOTUS5ENTEMEXI_2H
UI3YAV_1GEDIZ6SOMBRA_207STOTALTAR
84ALD CIMMYT
CIMMYT-263 VANRRIKSE_621A-1D 2+12-53WB881 CIMMYT
CIMMYT-264
RANCOCIT71CII3COMDK4TCHOSHWAMALD3
CREX5SNITAN CIMMYT
CIMMYT-265
PLATA_106MQUE4USDA573QFNAA_73ALBA-
D5AVOHUI7PLATA_138THKNEE_119CHENALTA
R 843HUIPOCBUBRUFO4FNFOOT CIMMYT
CIMMYT-266
EUDOCHEN_1TEZ3TANTLO_14PLATA_6GREEN_1
7 CIMMYT
CIMMYT-267
ROLA_53AJAIA_12F3LOCAL(SELETHIO13585)PLA
TA_134MALMUK_1SERRATOR_1 CIMMYT
CIMMYT-268 ARMENTSRN_3NIGRIS_43CANELO_91 CIMMYT
CIMMYT-269 SOMAT_3PHAX_1TILO_1LOTUS_4 CIMMYT
156
Appendix 2 Complete data set of field phenotypic response and population structure membership coefficients for each of the 183
accessions included in the association panel
Stem rust response Memberships Coefficients
Accession code
Dzo-
2009
DZm-
2009
Dzo-
2010
DZm-
2010 Mean
Subgroup1 (ICARDA
germplasm for dry
areas
Subgroup 2
(ICARDA
germplasm for
temperate areas
Subgroup 3
(Italian and early
70s CIMMYT
germplasm
Subgroup 4
(CIMMYT
germplasm of
late 70s-early
80s)
Subgroup 5
(CIMMYT late
80s-early 90s)
Main
subgroup
IDUWUE-002 20 45 373 329 009 003 08 006 002 3
IDUWUE-003 27 70 45 48 001 036 026 015 022 2
IDUWUE-004 40 50 80 45 537 014 025 057 004 001 3
IDUWUE-005 60 80 373 579 017 013 003 064 003 4
IDUWUE-006 6 6 16 373 163 001 009 072 004 014 3
IDUWUE-007 70 45 567 008 022 018 008 045 5
IDUWUE-008 40 18 20 373 288 001 002 06 037 001 3
IDUWUE-010 50 27 70 605 519 001 027 054 001 017 3
IDUWUE-011 40 40 70 45 487 001 019 004 003 073 5
IDUWUE-012 45 32 80 249 455 005 078 001 013 003 2
IDUWUE-013 70 527 606 003 045 006 033 013 2
IDUWUE-015 45 45 80 202 476 001 002 001 002 094 5
IDUWUE-016 40 36 80 295 464 001 003 001 028 067 5
IDUWUE-017 40 24 60 45 422 002 002 001 01 084 5
IDUWUE-018 36 45 54 272 406 001 018 002 025 054 5
IDUWUE-020 40 60 45 472 001 005 001 012 081 5
IDUWUE-021 30 16 40 373 308 001 001 001 021 078 5
IDUWUE-023 40 24 70 342 42 002 01 001 001 087 5
IDUWUE-024 50 40 70 249 462 001 001 001 003 095 5
IDUWUE-025 50 32 70 527 512 001 016 001 003 079 5
IDUWUE-027 36 27 60 218 362 002 032 003 027 036 5
IDUWUE-028 50 60 503 002 09 006 002 001 2
IDUWUE-029 50 40 458 001 083 005 008 004 2
IDUWUE-030 60 32 60 45 492 001 092 003 001 003 2
157
Appendix 2 Continuedhellip
Stem rust response Memberships Coefficients
Accession code
Dzo-
2009
DZm-
2009
Dzo-
2010
DZm-
2010 Mean
Subgroup1
(ICARDA
germplasm for dry
areas
Subgroup 2
(ICARDA
germplasm for
temperate areas
Subgroup 3
(Italian and early
70s CIMMYT
germplasm
Subgroup 4
(CIMMYT
germplasm of
late 70s-early
80s)
Subgroup 5
(CIMMYT
late 80s-
early 90s)
Main
subgroup
IDUWUE-031 60 54 80 45 597 002 02 001 02 057 5
IDUWUE-032 60 27 60 187 414 005 036 001 04 017 4
IDUWUE-033 6 12 11 122 003 065 026 006 001 2
IDUWUE-034 50 45 70 53 007 077 001 011 004 2
IDUWUE-035 40 60 453 001 069 001 004 025 2
IDUWUE-036 60 36 70 605 566 001 001 001 032 066 5
IDUWUE-037 9 18 36 45 27 001 004 001 072 021 4
IDUWUE-038 30 3 50 11 235 001 029 001 063 006 4
IDUWUE-039 70 70 605 675 003 051 002 041 003 2
IDUWUE-040 40 45 36 342 388 004 038 001 051 006 4
IDUWUE-041 45 72 60 11 47 0 001 0 001 098 5
IDUWUE-042 50 18 70 272 413 001 042 002 003 052 5
IDUWUE-044 60 63 70 342 568 001 04 043 002 014 3
IDUWUE-045 36 8 50 202 286 001 002 004 033 061 5
IDUWUE-047 60 18 60 373 438 01 056 001 031 003 2
IDUWUE-048 30 36 70 156 379 001 091 001 005 001 2
IDUWUE-049 02 6 79 35 002 094 002 002 001 2
IDUWUE-050 70 70 80 45 662 001 093 001 003 002 2
IDUWUE-053 70 70 70 45 637 002 003 005 06 03 4
IDUWUE-054 4 9 79 95 001 003 003 039 054 5
IDUWUE-055 30 60 50 447 028 068 002 001 001 2
IDUWUE-056 27 60 50 437 001 001 0 097 001 4
IDUWUE-057 50 54 36 45 462 002 035 001 059 003 4
IDUWUE-060 30 50 527 431 094 001 003 001 001 1
158
Appendix 2 Continuedhellip
Stem rust response Memberships Coefficients
Accession code
Dzo-
2009
DZm-
2009
Dzo-
2010
DZm-
2010 Mean
Subgroup1
(ICARDA
germplasm for dry
areas
Subgroup 2
(ICARDA
germplasm for
temperate areas
Subgroup 3
(Italian and early
70s CIMMYT
germplasm
Subgroup 4
(CIMMYT
germplasm of
late 70s-early
80s)
Subgroup 5
(CIMMYT
late 80s-
early 90s)
Main
subgroup
IDUWUE-061 400 700 500 450 512 021 004 001 072 002 4
IDUWUE-062 400 400 360 373 383 004 034 003 051 009 4
IDUWUE-063 320 630 300 373 406 002 031 008 048 012 4
IDUWUE-064 600 450 517 001 001 000 098 001 4
IDUWUE-065 400 500 800 547 001 043 002 050 004 4
IDUWUE-066 100 240 40 342 180 002 061 001 034 002 2
IDUWUE-067 500 700 600 373 543 002 023 007 042 027 2
IDUWUE-068 500 800 800 373 618 001 026 007 050 017 4
IDUWUE-069 600 450 505 035 005 002 049 010 4
IDUWUE-071 540 700 450 570 094 001 001 001 002 1
IDUWUE-072 60 90 110 75 027 003 001 067 003 4
IDUWUE-073 300 700 600 514 001 081 001 016 001 2
IDUWUE-074 500 700 500 527 557 012 062 002 023 001 2
IDUWUE-075 300 540 270 527 409 004 031 022 036 007 4
IDUWUE-076 02 30 270 187 122 005 001 091 001 003 3
IDUWUE-077 600 800 600 605 651 016 071 005 002 007 2
IDUWUE-079 270 360 272 307 020 055 017 008 001 2
IDUWUE-080 240 600 700 342 470 001 001 001 030 067 5
IDUWUE-081 200 200 270 204 002 009 083 005 001 3
IDUWUE-082 600 400 373 464 002 002 007 088 001 4
IDUWUE-083 90 180 94 146 060 008 031 001 001 1
IDUWUE-084 500 700 600 527 582 005 052 038 002 003 2
IDUWUE-085 700 202 443 034 001 064 001 001 3
IDUWUE-086 135 600 295 350 001 028 051 019 002 3
159
Appendix 2 Continuedhelliphellip
Stem rust response Memberships Coefficients
Accession code
Dzo-
2009
DZm-
2009
Dzo-
2010
DZm-
2010 Mean
Subgroup1
(ICARDA
germplasm for dry
areas
Subgroup 2
(ICARDA
germplasm for
temperate areas
Subgroup 3
(Italian and early
70s CIMMYT
germplasm
Subgroup 4
(CIMMYT
germplasm of
late 70s-early
80s)
Subgroup 5
(CIMMYT
late 80s-
early 90s)
Main
subgroup
IDUWUE-087 400 500 400 295 399 001 090 001 006 002 2
IDUWUE-088 300 700 373 446 007 042 008 038 005 2
IDUWUE-089 300 500 500 342 410 002 055 002 039 001 2
IDUWUE-090 300 700 700 547 008 035 003 051 004 4
IDUWUE-091 270 500 450 413 001 001 000 097 001 4
IDUWUE-093 500 360 272 366 001 001 043 054 001 4
IDUWUE-094 20 00 110 50 011 013 074 001 001 3
IDUWUE-095 400 80 360 79 230 009 002 087 001 001 3
IDUWUE-096 80 94 134 002 002 077 016 003 3
IDUWUE-097 120 30 110 112 001 019 004 030 046 5
IDUWUE-098 400 600 700 547 009 033 018 035 005 4
IDUWUE-099 160 30 125 94 002 012 079 006 001 3
IDUWUE-100 60 20 270 97 001 012 068 019 001 3
IDUWUE-102 90 360 110 212 001 094 002 002 001 2
IDUWUE-103 120 160 148 002 002 073 004 020 3
IDUWUE-104 600 600 527 564 002 046 029 022 002 2
IDUWUE-105 00 02 94 38 004 004 090 001 002 3
IDUWUE-106 450 300 527 414 039 002 056 001 002 3
IDUWUE-107 500 600 600 272 493 004 021 061 011 004 3
IDUWUE-108 500 600 272 446 001 089 002 008 001 2
IDUWUE-109 400 180 79 208 001 030 058 009 001 3
IDUWUE-110 600 360 300 527 447 003 090 001 004 002 2
IDUWUE-111 500 450 400 249 400 005 022 002 070 002 4
IDUWUE-112 20 40 79 53 022 044 030 003 001 2
160
Appendix 2 Continuedhellip
Stem rust response Memberships Coefficients
Accession code
Dzo-
2009
DZm-
2009
Dzo-
2010
DZm-
2010 Mean
Subgroup1
(ICARDA
germplasm for dry
areas
Subgroup 2
(ICARDA
germplasm for
temperate areas
Subgroup 3
(Italian and early
70s CIMMYT
germplasm
Subgroup 4
(CIMMYT
germplasm of
late 70s-early
80s)
Subgroup 5
(CIMMYT late
80s-early 90s)
Main
subgroup
IDUWUE-113 400 120 270 133 231 026 059 013 001 001 2
IDUWUE-114 300 80 450 265 001 001 097 001 001 3
IDUWUE-116 40 40 60 94 59 001 011 086 001 002 3
IDUWUE-117 400 360 333 014 006 002 075 002 4
IDUWUE-118 320 360 600 407 002 001 003 092 003 4
IDUWUE-119 360 240 400 156 289 001 003 001 094 001 4
IDUWUE-120 600 600 700 450 587 002 025 038 016 019 3
IDUWUE-121 600 600 500 547 002 012 001 084 001 4
IDUWUE-122 600 500 500 514 001 004 009 084 001 4
IDUWUE-123 450 600 180 125 339 007 011 027 053 002 4
IDUWUE-124 500 540 270 373 421 001 058 002 033 006 2
IDUWUE-125 400 225 373 321 003 023 019 050 004 4
IDUWUE-126 360 500 500 434 008 047 012 032 002 2
IDUWUE-127 500 270 160 187 279 003 079 014 003 001 2
IDUWUE-128 400 160 450 362 048 006 005 038 003 1
IDUWUE-130 500 360 320 450 407 002 004 001 093 001 4
IDUWUE-131 600 180 270 450 375 002 027 004 066 001 4
IDUWUE-132 500 360 600 373 458 004 037 001 055 003 4
IDUWUE-133 200 240 156 187 002 062 002 029 006 2
IDUWUE-134 400 400 600 447 003 045 004 036 012 2
IDUWUE-135 400 500 700 450 512 002 010 001 084 003 4
IDUWUE-136 60 120 270 110 140 003 078 003 015 001 2
IDUWUE-137 20 30 272 114 002 063 003 027 005 2
IDUWUE-139 500 120 360 295 319 002 052 003 039 004 2
161
Appendix 2 Continuedhellip
Stem rust response Memberships Coefficients
Accession code
Dzo-
2009
DZm-
2009
Dzo-
2010
DZm-
2010 Mean
Subgroup1 (ICARDA
germplasm for dry
areas
Subgroup 2
(ICARDA
germplasm for
temperate
areas
Subgroup 3
(Italian and early
70s CIMMYT
germplasm
Subgroup 4
(CIMMYT
germplasm of
late 70s-early
80s)
Subgroup 5
(CIMMYT
late 80s-
early 90s)
Main
subgroup
IDUWUE-140 400 381 002 043 049 006 001 2
IDUWUE-141 500 160 180 527 342 043 045 001 010 001 2
IDUWUE-142 400 700 503 001 029 002 064 004 4
IDUWUE-144 400 40 360 450 312 024 071 003 001 001 2
IDUWUE-145 500 270 700 79 387 002 080 001 016 001 2
IDUWUE-146 600 60 160 295 279 001 085 001 009 005 2
IDUWUE-147 500 80 90 249 230 002 088 002 005 003 2
IDUWUE-148 120 60 270 187 159 070 006 018 004 002 1
IDUWUE-149 300 90 270 79 185 006 086 002 004 002 2
IDUWUE-150 400 500 403 002 083 005 009 001 2
IDUWUE-151 300 700 453 003 049 020 026 002 2
IDUWUE-153 400 400 110 292 001 044 007 046 002 4
IDUWUE-154 600 600 527 564 006 046 026 003 019 2
IDUWUE-155 400 270 450 295 354 006 030 010 051 004 4
IDUWUE-156 400 600 453 004 002 001 083 011 4
IDUWUE-157 300 600 202 356 002 006 002 087 003 4
IDUWUE-158 600 400 600 249 462 001 002 001 095 001 4
IDUWUE-159 800 450 900 373 631 023 015 004 057 001 4
IDUWUE-160 700 400 700 580 096 001 001 002 001 1
IDUWUE-161 540 270 400 295 376 003 030 004 062 001 4
IDUWUE-163 500 360 373 399 001 053 001 039 006 2
IDUWUE-164 500 360 383 003 035 002 059 001 4
IDUWUE-166 600 270 500 373 436 042 012 003 042 002 1
IDUWUE-167 400 180 360 527 367 068 013 003 009 007 1
162
Appendix 2 Continuedhellip
Stem rust response Memberships Coefficients
Accession code
Dzo-
2009
DZm-
2009
Dzo-
2010
DZm-
2010 Mean
Subgroup1 (ICARDA
germplasm for dry
areas
Subgroup 2
(ICARDA
germplasm for
temperate areas
Subgroup 3
(Italian and early
70s CIMMYT
germplasm
Subgroup 4
(CIMMYT
germplasm of
late 70s-early
80s)
Subgroup 5
(CIMMYT
late 80s-
early 90s)
Main
subgroup
IDUWUE-168 500 160 400 373 358 001 010 002 075 012 4
IDUWUE-169 500 270 360 605 434 061 020 002 016 002 1
IDUWUE-170 400 700 187 417 004 028 033 006 028 3
IDUWUE-171 300 200 600 187 322 005 030 002 062 001 4
IDUWUE-172 500 500 500 373 468 026 016 005 047 006 4
IDUWUE-173 600 270 225 249 336 002 044 016 029 009 2
IDUWUE-175 360 240 150 230 007 013 021 058 002 4
IDUWUE-176 500 360 383 002 070 020 008 001 2
IDUWUE-177 500 500 453 002 023 001 064 010 4
IDUWUE-178 400 270 120 187 244 001 082 006 008 003 2
IDUWUE-179 400 300 450 364 002 016 037 026 020 3
IDUWUE-181 500 240 700 450 472 002 092 004 001 001 2
IDUWUE-182 450 320 320 605 424 051 044 002 002 001 1
IDUWUE-183 400 270 540 384 004 008 005 082 001 4
IDUWUE-184 400 300 500 380 002 001 001 094 001 4
IDUWUE-185 300 240 270 250 003 013 001 076 007 4
IDUWUE-186 270 320 160 249 250 001 037 025 021 017 2
IDUWUE-187 500 360 400 527 447 079 001 001 017 001 1
IDUWUE-188 500 360 700 450 502 001 035 002 061 002 4
IDUWUE-189 600 400 600 514 003 034 061 001 001 3
CIMMYT-251 600 360 600 500 005 002 003 029 062 5
CIMMYT-252 600 600 700 682 645 002 006 003 002 089 5
CIMMYT-253 700 600 800 342 610 000 002 001 001 096 5
CIMMYT-254 800 600 800 450 662 001 002 001 051 046 4
163
Appendix 2 Continuedhellip
Stem rust response Memberships Coefficients
Accession code
Dzo-
2009
DZm-
2009
Dzo-
2010
DZm-
2010 Mean
Subgroup1 (ICARDA
germplasm for dry
areas
Subgroup 2
(ICARDA
germplasm for
temperate areas
Subgroup 3
(Italian and early
70s CIMMYT
germplasm
Subgroup 4
(CIMMYT
germplasm of
late 70s-early
80s)
Subgroup 5
(CIMMYT
late 80s-
early 90s)
Main
subgroup
CIMMYT-255 600 700 800 450 637 001 002 001 002 094 5
CIMMYT-256 500 600 600 450 537 002 003 002 018 075 5
CIMMYT-257 600 500 800 614 001 001 001 002 096 5
CIMMYT-258 400 600 600 373 493 000 001 000 001 098 5
CIMMYT-259 500 360 700 342 475 003 005 001 003 088 5
CIMMYT-260 700 320 450 470 001 001 001 049 048 4
CIMMYT-261 500 500 360 373 433 001 003 002 057 038 4
CIMMYT-262 600 360 600 295 464 001 003 002 005 091 5
CIMMYT-263 120 120 79 95 011 008 009 011 061 5
CIMMYT-264 700 700 800 682 720 006 008 002 015 069 5
CIMMYT-265 600 700 700 373 593 002 006 001 005 086 5
CIMMYT-266 600 600 553 000 001 000 075 024 4
CIMMYT-267 500 600 700 527 582 010 002 001 002 085 5
CIMMYT-268 450 700 700 597 004 023 011 004 058 5
CIMMYT-269 600 800 800 527 682 010 004 003 007 076 5
Mean 009 029 014 029 019
164
Appendix 3 Complete data set of phenotypic response to four races (TRTTF TTKSK TTTTF and JRCQC) and population structure
membership coefficients for each of the 183 accessions included in the association panel
Stem rust response Memberships Coefficients
Accession
code TRTTF TTKSK TTTTF JRCQC
Subgroup1
(ICARDA
germplasm
for dry areas
Subgroup 2
(ICARDA
germplasm for
temperate areas
Subgroup 3
(Italian and early
70s CIMMYT
germplasm
Subgroup 4
(CIMMYT
germplasm of late
70s-early 80s)
Subgroup 5
(CIMMYT
late 80s-
early 90s)
Main
subgroup
IDUWUE-002 3- 2- 2 3 2- 1 0086 0027 0803 0064 002 3
IDUWUE-003 22- 2 3 2- 2 0009 036 026 0149 0222 2
IDUWUE-004 2 33+ 2- 33+ 1 3+ 0136 0248 0568 0038 0011 3
IDUWUE-005 2- 4 4 4 0173 0131 0031 064 0025 4
IDUWUE-006 3 2+2+3- 2+ 3- 2- 0013 0094 0715 0041 0136 3
IDUWUE-007 2- 2- 2- 3+ 2- 008 0218 0176 0079 0448 5
IDUWUE-008 33+ 3 2+ N 0009 0019 0598 0365 001 3
IDUWUE-010 33+ 33+ 3+ 4 0012 027 0538 0013 0168 3
IDUWUE-011 2- 2- 2- 2- 0008 0192 0042 0025 0733 5
IDUWUE-012 2- 2 2- 4 0047 0784 0014 0127 0029 2
IDUWUE-013 2 3+ 3+ 3+ 0027 0448 0064 0331 013 2
IDUWUE-015 2- 2 2- 2- 0012 0018 0006 002 0944 5
IDUWUE-016 2- 2 2- 2 0011 0029 001 0282 0667 5
IDUWUE-017 2- 2 2- 2 0021 0018 0014 0103 0844 5
IDUWUE-018 2- 2 2- 22+ 0012 0176 0023 0245 0544 5
IDUWUE-020 2- 2- 2- 4 0007 0053 0013 0122 0805 5
IDUWUE-021 2- 2 2- 2 0005 0008 0006 0206 0775 5
IDUWUE-023 2- 22- 2- 2 0015 0099 0007 0013 0865 5
IDUWUE-024 2- 2 2- 2- 0005 001 0007 0028 0951 5
IDUWUE-025 2- 2- 2- 2- 0013 0155 0007 0031 0793 5
IDUWUE-027 N 2- N 22+ 0019 0323 0034 0267 0358 5
IDUWUE-028 2- 2- 2- 0 3+ 0016 0898 006 0016 001 2
IDUWUE-029 2- 2- 2- 001 0827 005 0078 0035 2
IDUWUE-030 3+ 3 3+ 2 4 0014 092 0026 0014 0026 2
165
Appendix 3 Continuedhellip
Stem rust response Memberships Coefficients
Accession code TRTTF TTKSK TTTTF JRCQC
Subgroup1
(ICARDA
germplasm for
dry areas
Subgroup 2
(ICARDA
germplasm for
temperate areas
Subgroup 3
(Italian and early
70s CIMMYT
germplasm
Subgroup 4
(CIMMYT
germplasm of late
70s-early 80s)
Subgroup 5
(CIMMYT
late 80s-
early 90s)
Main
subgroup
166
IDUWUE-031 2- 3 33+ 4 0015 0202 0011 02 0573 5
IDUWUE-032 2- 4 3+ 0 0054 0362 0008 0403 0172 4
IDUWUE-033 N 1- 2+ 0026 0653 0255 006 0006 2
IDUWUE-034 2- 2- 2 2+ 0073 0769 0011 0109 0038 2
IDUWUE-035 2- 2 2- 2- 0013 069 001 0041 0246 2
IDUWUE-036 2- 2 2- 2- 001 0006 0006 0321 0657 5
IDUWUE-037 2- 2- 2- 2- 0009 0044 0012 0723 0212 4
IDUWUE-038 2- 2- 2- 3+1N 001 0286 001 0632 0061 4
IDUWUE-039 22- 3+ 3+ 3+ 0032 0507 0015 0412 0033 2
IDUWUE-040 2- 2- 22- 22+ 0042 0378 0009 051 0062 4
IDUWUE-041 2- 2- 2- 2- 0004 0005 0004 0006 098 5
IDUWUE-042 2- 2- 2- 2- 0013 0416 0019 0033 0518 5
IDUWUE-044 N 0 1 2+3- 0014 0397 043 002 0138 3
IDUWUE-045 2- 2 2+ 2- 2- 001 0018 0035 0327 0609 5
IDUWUE-047 2 3++ 3+ 4 0097 0559 001 0308 0026 2
IDUWUE-048 2 2- 22- 3 0011 0914 0014 0051 001 2
IDUWUE-049 2- 2- 2- 0015 0942 0015 0017 0011 2
IDUWUE-050 33+ 3 3+ 3+ 0012 0934 0011 0025 0018 2
IDUWUE-053 2- 22+ 2- 2- 2- 0022 0034 0047 0599 0298 4
IDUWUE-054 2- 2- 2- 2- 0011 0026 0033 0386 0544 5
IDUWUE-055 2+ 2- 2- 2 0276 0683 0016 0014 0011 2
IDUWUE-056 2 2+3- 3 3+ 3+ 0008 0007 0004 0969 0012 4
IDUWUE-057 2-N 33+ 22- 3+ 0019 035 0009 0591 0032 4
IDUWUE-060 2 3- 3 3+ 094 0013 0031 0009 0006 1
167
Appendix 3 Continuedhellip
Stem rust response Memberships Coefficients
Accession
code TRTTF TTKSK TTTTF JRCQC
Subgroup1
(ICARDA
germplasm for
dry areas
Subgroup 2
(ICARDA
germplasm for
temperate areas
Subgroup 3 (Italian
and early 70s
CIMMYT
germplasm
Subgroup 4
(CIMMYT
germplasm of
late 70s-early
80s)
Subgroup 5
(CIMMYT
late 80s-
early 90s)
Main
subgroup
IDUWUE-061 2- 3+ 2 3 3+ 0207 0043 001 072 0021 4
IDUWUE-062 2- 3 3 4 0038 0339 0028 0506 0089 4
IDUWUE-063 22- 3- 2- 3+ 002 0307 0075 0477 0121 4
IDUWUE-064 22- 3- 3+ 4 0006 0008 0004 0975 0007 4
IDUWUE-065 2 3+ 2- 3 2 3+ 2+ 4 0009 0428 0018 0501 0044 4
IDUWUE-066 2- 2- 1- 2- 0018 0608 0013 034 0021 2
IDUWUE-067 0 1
2+3-
22- 2+3- 3+ 0019 0225 0066 0422 0267 2
IDUWUE-068 4 3 33+ 3+ 0007 0258 0068 0499 0168 4
IDUWUE-069 2 2- 2- 3+ 2- 3 2 0352 0049 0015 0489 0096 4
IDUWUE-071 22+ 3+ 3 4 0944 0012 0011 0012 002 1
IDUWUE-072 2- 2- 2- 2- 0274 0027 0006 0668 0025 4
IDUWUE-073 22- 2- 2- 2+ 001 0809 0011 016 001 2
IDUWUE-074 22- 2- 2 22+ 0122 0617 0023 0228 001 2
IDUWUE-075 3 3 2- N 0039 0314 0216 0363 0069 4
IDUWUE-076 3 3 2- 11+ 0046 0013 0907 0009 0025 3
IDUWUE-077 X 2+ 2+ 4 0164 0706 0046 0015 0069 2
IDUWUE-079 3- 2+3- 3- 33+ 0196 0548 0168 0077 0011 2
IDUWUE-080 2- 22+ 2- 2- 0005 0012 0011 0299 0673 5
IDUWUE-081 2- 2- 2- 3+ 0021 0086 0829 0052 0012 3
IDUWUE-082 2 3 33+ 4 0023 002 0069 088 0008 4
IDUWUE-083 2+3 2+ 22+ 33+ 0598 0076 0314 0005 0007 1
IDUWUE-084 3- 4 2+3 2+ 4 0053 0517 0384 0016 003 2
IDUWUE-085 33+ 3 33+ 4 0338 0014 0639 0005 0005 3
IDUWUE-086 3+ 2 4 2+ 4 0011 0275 0511 0186 0017 3
168
Appendix 3 Continuedhellip
Stem rust response Memberships Coefficients
Accession
code TRTTF TTKSK TTTTF JRCQC
Subgroup1
(ICARDA
germplasm
for dry areas
Subgroup 2
(ICARDA
germplasm for
temperate areas
Subgroup 3 (Italian
and early 70s
CIMMYT
germplasm
Subgroup 4
(CIMMYT
germplasm of
late 70s-early
Subgroup 5
(CIMMYT
late 80s-
early 90s)
Main
subgroup
169
80s)
IDUWUE-087 3+ 3+ 3 4 0012 0902 0007 0063 0015 2
IDUWUE-088 33+ 3 33+ 4 0071 0419 0079 0383 0048 2
IDUWUE-089 23 3 2- 33+ 002 0554 0023 0393 0009 2
IDUWUE-090 2- 2- 2- 4 0078 0353 0025 0507 0036 4
IDUWUE-091 2 3 3 4 0007 0008 0004 0973 0008 4
IDUWUE-093 2 33- 3 4 001 001 0431 0538 0011 4
IDUWUE-094 3+ 2+3 3 33+ 4 0111 0134 0735 0006 0013 3
IDUWUE-095 3+ 3 33+ 3+3 0091 0022 087 0007 001 3
IDUWUE-096 2- 2- 2- 0018 0022 0765 0161 0034 3
IDUWUE-097 2- 2 2- 2 001 0193 0038 0302 0456 5
IDUWUE-098 N 2-N 2- 2 009 0329 0182 0352 0047 4
IDUWUE-099 33+ 3 2+ 2- 0018 0117 079 0063 0012 3
IDUWUE-100 2- 2- 2- 3+ 2- 0008 0115 0679 0193 0006 3
IDUWUE-102 2 2- 2- 2- 001 094 0024 0017 001 2
IDUWUE-103 2- 2- 2- 2 002 0015 0729 0041 0195 3
IDUWUE-104 2- 3 22+ 1 0018 0457 0291 0218 0015 2
IDUWUE-105 33+ 2+ 3+ 2- 2- 0038 004 0895 0008 0019 3
IDUWUE-106 2- 2+2 2 22+ 0389 0019 0561 0009 0021 3
IDUWUE-107 3+3 3 33+ 4 0035 021 0606 0109 0041 3
IDUWUE-108 22+ 22+ 22- 2+ 0007 089 0015 0082 0006 2
IDUWUE-109 2- 2- 3 2- 3+ 001 0304 0584 009 0011 3
IDUWUE-110 32+ 2 2+3 31+ 4 0027 0897 0013 0042 0021 2
IDUWUE-111 2- 2- 2- 4 0047 0216 0017 07 002 4
IDUWUE-112 2+3- 22+ 2+ 3 0224 044 0299 0025 0011 2
170
Appendix 3 Continuedhellip
Stem rust response Memberships Coefficients
171
Accession
code
TRTTF TTKSK TTTTF JRCQC Subgroup1
(ICARDA
germplasm for
dry areas
Subgroup 2
(ICARDA
germplasm for
temperate areas
Subgroup 3 (Italian
and early 70s
CIMMYT
germplasm
Subgroup 4
(CIMMYT
germplasm of
late 70s-early
80s)
Subgroup 5
(CIMMYT
late 80s-
early 90s)
Main
subgroup
IDUWUE-113 2+3- 22+ 2+ 3 0261 0591 0133 001 0006 2
IDUWUE-114 3 2+3- 2 1 0006 001 097 0006 0008 3
IDUWUE-116 2- 2- 22- 2+ 0011 0105 0857 0007 002 3
IDUWUE-117 22- 3 3 3+ 0143 0064 0024 0751 0018 4
IDUWUE-118 2- 2- 2- 3+ 22+ 0021 0008 0026 0919 0025 4
IDUWUE-119 2- 2- 2- 2- 0006 0028 0013 0939 0014 4
IDUWUE-120 2- 2- 2+ 33+ 0022 025 0383 0158 0187 3
IDUWUE-121 2- 2- 2- 4 0022 0115 0011 0842 0011 4
IDUWUE-122 2 2 22+ 22+ 001 0044 0093 084 0013 4
IDUWUE-123 2- 2- 2- 33+ 0071 0106 0274 0526 0023 4
IDUWUE-124 2- 4X 3 4 0014 0583 002 0328 0056 2
IDUWUE-125 3+ 3+ 3+ 4 0027 0234 0194 0501 0044 4
IDUWUE-126 2- 2- 2- 4 0081 0465 0115 0323 0017 2
IDUWUE-127 2 2+ 2- 2- 0029 0787 014 0032 0012 2
IDUWUE-128 2 4 3+ 4 0483 0056 005 0384 0026 1
IDUWUE-130 2 3 2+ 3 4 0018 0038 0009 0927 0009 4
IDUWUE-131 2- 3+ 2- 3+ 0022 027 0037 0661 001 4
IDUWUE-132 2- 2- 2- 2+3- 0041 0372 001 0551 0026 4
IDUWUE-133 2- 2- 2- 2- 0016 0615 002 0287 0062 2
IDUWUE-134 2- 2- 2- 33+ 0032 0448 0042 0359 0118 2
IDUWUE-135 2- 4 3+ 3+ 0024 0101 001 0839 0026 4
IDUWUE-136 22+ 2- 2- 3- 1 4 0028 0779 0033 0149 0011 2
IDUWUE-137 3- 4 2- 2 0017 063 0034 0272 0047 2
IDUWUE-139 2- 3 2- 2+ 0023 0521 0029 0386 0041 2
172
Appendix 3 Continuedhellip
Stem rust response Memberships Coefficients
173
Accession
code
TRTTF TTKSK TTTTF JRCQC Subgroup1
(ICARDA
germplasm for dry
areas
Subgroup 2
(ICARDA
germplasm for
temperate areas
Subgroup 3
(Italian and
early 70s
CIMMYT
germplasm
Subgroup 4
(CIMMYT
germplasm of
late 70s-early
80s)
Subgroup
5
(CIMMYT
late 80s-
early 90s)
Main
subgroup
IDUWUE-140 2-2 3 22+ 3 0022 0427 0487 0055 0009 2
IDUWUE-141 2- 3+ 3+ 4 0429 0449 0014 01 0007 2
IDUWUE-142 2- 2- 2- 3+ 2- 0008 0292 0023 064 0037 4
IDUWUE-144 4 4 4 4 0238 0712 0032 0009 0009 2
IDUWUE-145 2 2+ 2- 2 2+ 002 0804 0006 0155 0014 2
IDUWUE-146 2 3 2- 2- 0007 0847 0011 009 0045 2
IDUWUE-147 N 2 2- N1 2- 3 0022 0884 0016 0048 003 2
IDUWUE-148 2- 2- 2- 2- 0703 0059 0176 0042 002 1
IDUWUE-149 N 2- 2- N 2- 0059 0855 0022 0042 0022 2
IDUWUE-150 2 2 22- 22+ 0022 0825 0052 009 0011 2
IDUWUE-151 2- 2- 2- 4 0028 0489 0204 0261 0018 2
IDUWUE-153 2- 2- 2- 33+ 0009 044 0072 0461 0018 4
IDUWUE-154 33+ 3+ 3 2- 3+ 006 0458 026 0033 0188 2
IDUWUE-155 2- N 2+ 3 3 2 3+ 0055 0295 0099 0514 0037 4
IDUWUE-156 2- 3- 2- 2 4 0035 0016 0013 0829 0108 4
IDUWUE-157 2- 4 3 4 0022 0055 0018 0872 0033 4
IDUWUE-158 2- 2- 2- 2- 0009 0016 001 0951 0014 4
IDUWUE-159 2 3+ 3+ 4 0234 0152 0038 0566 001 4
IDUWUE-160 2- 3+ 3 4 0956 0009 0006 0018 0012 1
IDUWUE-161 2- 2 2- 2- 0034 0301 0036 062 0008 4
IDUWUE-163 2- 2- 2- 2- 0008 0532 0009 0391 0059 2
IDUWUE-164 2- 2- 2 22- 0033 0352 0015 0589 0011 4
IDUWUE-166 2-N 3+ 2+3- 4 0421 0117 0029 0415 0017 1
IDUWUE-167 2- 4 33+ 4 0679 0132 0025 0093 0072 1
174
Appendix 3 Continuedhelliphellip
Stem rust response Memberships Coefficients
Accession
code TRTTF TTKSK TTTTF JRCQC
Subgroup1
(ICARDA
germplasm for dry
areas
Subgroup 2
(ICARDA
germplasm for
temperate areas
Subgroup 3
(Italian and early
70s CIMMYT
germplasm
Subgroup 4
(CIMMYT
germplasm of
late 70s-early
80s)
Subgroup 5
(CIMMYT
late 80s-
early 90s)
Main
subgroup
175
IDUWUE-168 2- 2- 2- 2- 0011 0102 0016 0746 0124 4
IDUWUE-169 4 3+ 3+ 4 0606 0204 0016 0159 0016 1
IDUWUE-170 2- 2- 2- 2- 0044 0281 033 0061 0284 3
IDUWUE-171 2 3- 3+ 2- 2 0045 0302 0016 0624 0013 4
IDUWUE-172 2- 2+ 3+ 3+ 0259 0159 0054 0469 0059 4
IDUWUE-173 2- 3 2 2- 1 4 0015 0444 0158 0292 009 2
IDUWUE-175 2- 2- 2- 2 0065 0128 0213 0579 0015 4
IDUWUE-176 3+3 X- 3 4 0023 0698 0197 0076 0007 2
IDUWUE-177 22+ 2- 2- 4 002 0233 0013 0635 01 4
IDUWUE-178 2- 3+ 2- 2- 3 3+ 0013 0824 006 0076 0027 2
IDUWUE-179 2- 2- 2- 2- 0022 0158 0365 0259 0196 3
IDUWUE-181 3+3 3 3 3+ 0016 092 0038 0014 0012 2
IDUWUE-182 2- 22+ 2- 3 2- 0514 0435 0022 0015 0013 1
IDUWUE-183 2- 2- 2- 3+ 0042 0078 0054 0817 0009 4
IDUWUE-184 2- 2- 2- 3- 2- 0023 0013 0013 094 0011 4
IDUWUE-185 2- 4 2- 2- 3+ 003 0131 0013 0757 0069 4
IDUWUE-186 2- 2- 2- 2- 001 037 0245 0207 0169 2
IDUWUE-187 2- 33+ 3+ 4 0789 0014 0014 0173 001 1
IDUWUE-188 2- 3+ 3+ 4 0006 0346 0018 061 0019 4
IDUWUE-189 2- 2- 2- 2- 0026 0339 0614 0013 0008 3
CIMMYT-251 N 33+ 3 3+ 0053 0015 0025 0286 0621 5
CIMMYT-252 2- 4 3 3+ 0019 0056 0025 0015 0885 5
CIMMYT-253 2- 2- 2- 2 0004 0016 0007 0014 0959 5
CIMMYT-254 2 4 3+ 4 0008 0015 001 0505 0462 4
176
Appendix 3 Continuedhellip
Stem rust response Memberships Coefficients
Accession
code
TRTTF
TTKSK
TTTTF
JRCQC
Subgroup1
(ICARDA
germplasm
for dry areas
Subgroup 2
(ICARDA
germplasm for
temperate areas
Subgroup 3
(Italian and early
70s CIMMYT
germplasm
Subgroup 4
(CIMMYT
germplasm of
late 70s-early
80s)
Subgroup 5
(CIMMYT
late 80s-
early 90s)
Main
subgroup
CIMMYT-255 2- 2 2 2+ 0008 0017 0008 0024 0944 5
CIMMYT-256 2- 2- 2- 22+ 0018 0034 0024 0175 0749 5
CIMMYT-257 2- 2= 3 2- 0008 0009 0005 0021 0956 5
CIMMYT-258 2- 2- 2- 2- 0004 0006 0004 0007 098 5
CIMMYT-259 2- 2- 2- 4 0026 0048 0013 0032 088 5
CIMMYT-260 2- 2- 2 2 0011 0013 0011 049 0475 4
CIMMYT-261 2- 3 3+ 4 0011 0029 0018 0565 0377 4
CIMMYT-262 2- 2- 2- 3 0006 0028 0015 0045 0906 5
CIMMYT-263 2- 2 2- 2 0111 0079 0085 0113 0613 5
CIMMYT-264 2- 3 3+ 4 0058 0084 0018 0153 0686 5
CIMMYT-265 2- 2- 2- 4 0016 0061 0014 0054 0855 5
CIMMYT-266 2- 2- 2- 3+ 0004 0006 0004 0747 0238 4
CIMMYT-267 2- 2 2- 3 2 0099 0018 0012 0021 0851 5
CIMMYT-268 2- 2 2+ 2+ 0036 0229 0108 0043 0584 5
CIMMYT-269 2- 3 3+ 4 0099 0036 0028 0073 0764 5
Average
membership
coefficient
009 029 014 029 019
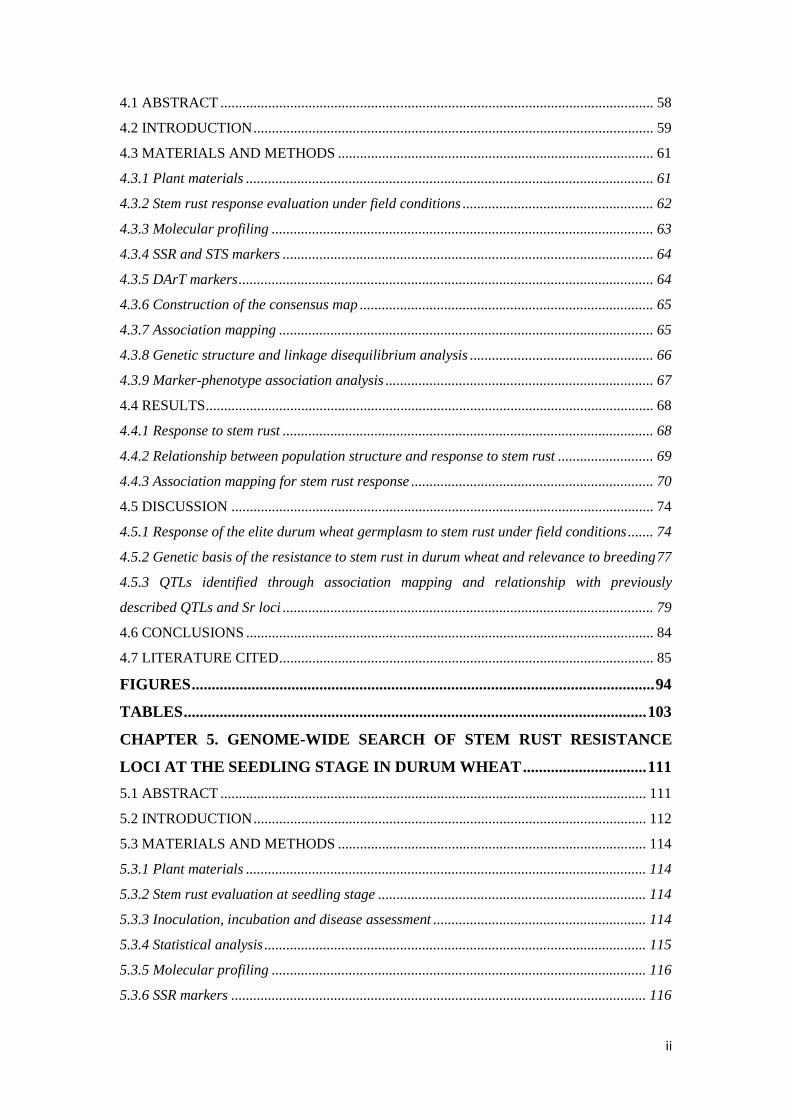

1
ACRONYMS
AFLP Amplified Fragment Length Polymorphism
AM Association Mapping
APR Adult Plant Resistance
CI Coefficient of Infection
CIMMYT International Maize and Wheat Improvement Center
cM centiMorgan
DArT Diversity Array Technology
DSS Disease Severity Score
DZARC Debre Zeit Agricultural Research Center
DZm Debre Zeit main season
DZo Debre Zeit off season
FDR False Discovery Rate
GWA Genome Wide Association
GLM General Linear Model
HR Hypersensitivity Reaction
ICARDA International Center for Agricultural Research in the Dry Areas
IT Infection Type
MAS Marker Assisted Selection
LD Linkage Disequilibrium
MLM Multiple Linear Model
NTSYS Numerical Taxonomy and Multivariate Analysis System
Pgt Puccinia graminis f sp tritici
QTL Quantitative Trait Loci
RIL Recombinant Inbred Line
SNP Single Nucleotide Polymorphism
SSR Simple Sequence Repeat
Sr Stem rust resistance
STS Sequence Tagged Site
TASSEL Trait Analysis by aSSociation Evolution and Linkage
UPGMA Unweighted pair group method with arithmetic average
2
ACKNOWLEDGMENTS
I would like to express my sincerest gratitude appreciation and special thanks to
various institutes and individuals who were involved during the course of my PhD
studies and research at the University of Bologna
First of all I would like to thank my supervisor Prof Roberto Tuberosa for accepting
me as his student for his keen interest most valuable and inspiring guidance constant
criticism throughout the research work and preparation of manuscripts and this
dissertation In general without his help the thesis would not have been possible to
present by now I have learned not only science but also the attitude of doing science
from him I always say thank you very much Prof Tuberosa for your unreserved and
unflagging help
I owe my profound thanks to my assistant supervisor Prof Maria Corinna Sanguneti
and Dr Marco Maccaferri for their availability to discuss result their valuable
suggestiions and their unfailing help during the course of the research In particular I
would like to thank Prof Maria Corinna Sanguneti for her personal kindness and the
immediate solutions to my administrative-related requests I am thankful to Dr Silvio
Salvi for helping me to be my official tutor at the Department of Agricultural Sciences
(DipSA) and being willing to discuss any of my questions or ideas It is also my
pleasure to thank Kay Stuart for her kindness encouragement and support during my
study period I express my cordial thanks to all my labmates in the laboratory of Prof
Tuberosa for helping me in many ways during my studies
I would like to thank Dr Ayele Badebo for all his technical help during the fieldwork
and scientific inputs encouragement and support throughout the duration of my study
I would also like to thank Dr Karim Ammar Dr Yue Jin and Dr Pablo Olivera for
all their suggestions and valuable inputs to improve the manuscripts generated from
this study In all without their active support guidance and encouragement this
dissertation would not have been possible
The financial support provided through Monsantorsquos Beachell-Borlaug International
scholarship by Monsanto to cover all my expenses for three years and Oromia
3
Agricultural Research Institute who covered my salary for completing my research
during the last six months and also giving me leave of absence and helping me in
some logistics for my study is gratefully acknowledged My sincerest thanks also
extend to Prof Ed Runge coordinator of the Monsantorsquos Beachell-Borlaug
International Scholarship for smooth communication and excellent guidance to my
scholarship related cases
It is my pleasure also to convey my appreciation for Dr Bedada Girma Dr Bekele
Abeyou Dr Firdisa Eticha Tafa Jobie Tadele Tadesse and Genene Gezu for their
contributions in my study in various ways and friendship During my PhD research
many experiments have been carried out both in the laboratory and in the field I am
grateful for the technical help and support provided to me by Tilahun Bayisa Ayalneh
Tilahun Mohammed Abinasa Tamiru Tadesse Wubshet Alemu Tesfaye Tadesse
Habtamu Tadesse Debele Tsegaye Habtamu Goro Siraj Defo Gezahegn Tadesse
and Gosaye Gizawu at Sinana and Gebre Behailu Ketema Betelhem Haregua at
Debre Zeit
Thanks to Dr Zeleke Eresso his friendly heart is always happy to help new students
when they have problems in Bologna I am full of gratitude to him and his family for
the assistance and help they gave to me His friendship to me contributed to make my
stay in Bologna memorable
I cannot eschew to express my wholehearted sense of reverence to my beloved wife
and family members who were instrumental in providing this opportunity for building
up my educational carrier encouragement and inspiration throughout the study I
would like to thank my family particularly my wife Etifwork Tadesse for her
constant love and support to help me walk through a lot of frustrations in the past few
years I would like to thank you truly for taking care of our kids in place of me I
could not have made it to the end without her Furthermore I would like to be in awe
of my son and daughter Abel and Ruth for refreshing me from my tiresome research
work with their sweet smile and affectionate cuddle
At last but not least I would be remiss if I did not thank my God There were many
times that I called on his name for help comfort and guidance he was always right at
my side
4
SUMMARY
Diseases are the main factors that cause yield loss in wheat and are best controlled
through the development of resistant cultivars Puccinia graminis f sp tritici the
causative agent of stem rust in wheat is known to rapidly evolve new virulence to
resistance genes While more than 50 stem rust resistance (Sr) loci have been
identified in wheat only a few remain effective particularly against the highly
virulent Ug99 (TTKSK) race and a mixture of durum-specific races An association
mapping (AM) approach based on 183 diverse durum wheat accessions was utilized
to identify resistance loci for stem rust response in Ethiopia over four evaluation
seasons by artificial inoculating with Ug99 and a mixture of durum-specific races
under field conditions as well as in the greenhouse test at the seedling growth stage
under controlled conditions for resistance to four highly virulent stem rust races
TRTTF TTTTF TTKSK (Ug99) and JRCQC The panel was profiled with simple
sequence repeat diversity array technology and sequence tagged site markers (1253
markers) Five subpopulations mostly comprised of lines of individual breeding
programs were identified LD decayed across a range between 5 to 10 cM as
determined by the pairwise r2 (squared value of the correlation coefficient between
two loci) method AM using the MLM method was then conducted to reveal the
genetic architecture of stem rust resistance in durum wheat breeding germplasm The
results under field conditions showed the oligogenic basis of resistance with 12 QTL-
tagging markers that were significant (P lt 005) across three to four seasons and with
R2 values from 11 to 113 Twenty-four additional single markerQTL regions were
found to be significant over two seasons The AM results confirmed the role of Sr13
previously described in bi-parental mapping studies and the role of chromosome
regions putatively harboring Sr9 Sr14 Sr17 and Sr28 Additionally 13 single
markerQTL regions were located in chromosome regions where no Sr genesQTLs
have been previously reported
The results under controlled conditions showed that 15 20 19 and 19 chromosome
regions harbored markers that showed significant effects for races TRTTF TTTTF
TTKSK and JRCQC respectively These genomic regions showed marker R2 values
ranging from 113 to 834 192 to 1764 175 to 2312 and 151 to 1533 for races
TRTTF TTTTF TTKSK and JRCQC respectively The study demonstrates that stem
5
rust resistance in durum wheat is governed in part by shared loci and in part by race-
specific ones The QTLs identified in this study through AM will be useful in the
marker-assisted development of durum wheat cultivars with durable stem rust
resistance
6
CHAPTER 1 INTRODUCTION
11 DURUM WHEAT IMPORTANCE AND FUTURE PERSPECTIVES
Durum wheat (Triticum turgidum L var durum 2n = 4x = 28 AABB genomes) is an
important crop mainly used for human consumption Recently this cereal has been
the object of renewed interest because of its valuable production and adaptation to
low rainfall and semi-arid environments More than half of the durum acreage lies in
the Mediterranean Basin mainly Italy Spain France Greece and the West Asian and
North African (WANA) countries where through history this cereal has received
special attention as an important commodity (Royo et al 2000) In Ethiopia about
60 of the wheat area is currently covered by bread wheat and 40 by durum wheat
(Badebo et al 2009) However the estimate for 1967 indicated that about 15 of the
wheat area was covered by bread wheat and 85 by durum wheat (Hailu 1991) In
Ethiopia durum wheat is traditionally grown by smallholder farmers on heavy black
clay soils (vertisol) of the highlands at altitude ranging from 1800-2800 m above sea
level exclusively under rain-fed agriculture (Tesfaye and Getachew 1991) Owing to
its long history of cultivation by farmers in varied agrosystems of the country
Ethiopia has an amazing wealth of genetic variability for different desirable economic
traits including disease resistance that can be utilized for improving the quality and
productivity of durum wheat Importantly Ethiopia is also recognized as one of the
Vavilovian centres of genetic diversity for this crop (Vavilov 1951)
In Ethiopia durum wheat is mainly utilized for the preparation of local traditional
recipes such as dabo (Ethiopian bread) injera (thin flattened bread) kolo (roasted
grain) nifro (boiled whole grain sometimes mixed with pulses) and kinche (crushed
kernels cooked with milk or water and mixed with spiced butter) and to some extent
for manufacturing of different pasta products (Solomon et al 2006) However in
view of the current rapidly growing rate of urbanization coupled with the increased
expansion of existing as well as newly emerging food processing industries durum
wheat products such as macaroni and spaghetti are highly demanded in the local
markets and have become an important part of the daily diet in the urban and peri-
urban areas of Ethiopia Importantly almost all local pasta manufacturers depend on
imported durum wheat At present the demand for imported durum is showing a
7
rising trend and annually the local pasta factories import thousands of tons of durum
wheat from abroad thus requiring tens of millions of dollars in foreign exchange The
rapidly increasing demand for more durum wheat both in global and domestic
markets combined with the availability of proven technologies and practices in the
country offer an excellent opportunity for commercialization of the crop so that the
Ethiopian smallholder farmers can significantly participate in the production of high
quality durum wheat to improve their income and livelihood (Newai 2006)
12 WHEAT STEM RUST HISTORICAL AND CONTEMPORARY
SIGNIFICANCE
Wheat stem rust caused by Puccinia graminis f sp tritici is the most destructive of
all the wheat rust pathogens due to its ability to decimate a healthy wheat crop late in
the season and is capable of causing up to 100 yield loss from lodging and by
damaging the stem of the plant as shown in Figure 1 and disrupting water and
photosynthate movement (Roelfs et al 1992) For as long as agrarian societies have
cultivated wheat stem rust has been a threat to food security The Bible refers to rust
epidemics as punishments on the Israelites from God for their sins (Chester 1946)
Around 700 AD the Roman festival of Robigalia was celebrated annually to pacify
the rust god Rubigus to ensure a healthy crop (Chester 1946 Peterson 2001)
During the last century stem rust has caused major epidemics in all wheat-producing
countries In the 1940rsquos and 1950rsquos China experienced major stem rust epidemics due
to higher than average temperatures and rainfall leading to ideal conditions for the
pathogen that flourishes under high temperature and moisture (Roelfs and Martens
1987) Severe epidemics took place in North America in the first half of the 20th
century (Roelfs and Bushnell 1985 Hodson 2011) In North America the spring
wheat-growing regions are most affected by stem rust epidemics causing yield losses
up to 50 (Leonard 2001)
Stem rust is potentially the most destructive of the three wheat rusts which include
stem (black) stripe (yellow) and leaf (brown) rusts Stripe rust epidemics have been
more frequent and widespread in recent years and under severe epidemics yield
losses are generally higher than usually recorded in large-scale production statistics
8
because the cool and wet conditions favorable for disease development are also
favorable for wheat productivity Stem rust in contrast is a biological firestorm with
the potential to completely devastate an otherwise healthy crop just three weeks
before harvest (Singh et al 2006 Herrera-Foessel et al 2011) at warmer temperatures
less conducive for wheat productivity It is arguably the most feared disease of wheat
on all continents where wheat is grown
In Ethiopia where over 30 fungal diseases of wheat have been identified stem rust is
a major production constraint in most wheat-growing areas of the country and causes
up to 100 yield loss in epidemic outbreaks (Figure 1 Admassu et al 2004) The
country also considered as one of the hot spot areas for the development of the present
wheat stem rust complex (Leppik 1970) The disease has become a major threat of
wheat production after the epidemics of 1974 and 1993 that drove out of production
the two bread wheat (Triticum aestivum L) varieties lsquoLacketchrsquo and lsquoEnkoyrsquo
(Badebo 2002 Beteselassie et al 2007) The discovery of the Ug99 race with
virulence to Sr31 in Uganda in 1999 (Pretorius et al 2000) represented a real threat to
wheat production in the world including Ethiopia where stem rust epidemics had not
occurred since the resistant cultivar Enkoy lost its resistance in 1993 (Badebo 2002)
Since the first report in Uganda race Ug99 has been detected in other parts of East
Africa (Singh et al 2006) and beyond in Yemen (Global Rust Initiative 2007) and
Iran (SeedQuest 2008) In Ethiopia Ug99 was first detected in 2003 at six dispersed
sites (Singh et al 2006) It was more dominant in the Southeast and Central parts of
the country than in Northwest Ethiopia Therefore Ug99 is a real threat to wheat
growers of Ethiopia requiring very close attention
13 MOLECULAR MARKERS AND THEIR USE IN BREEDING FOR DISEASE
RESISTANCE IN WHEAT
DNA-based molecular markers have several advantages over the traditional
phenotypic selection and their potential benefits as marker-assisted selection (MAS)
have been widely discussed (Melchinger 1990 Paterson et al 1991 Young 1996
Mohan et al 1997 Anderson 2003 Varshney and Tuberosa 2007) especially to
provide solutions to overcome some of the problems faced by classical phenotypic
screening approaches in plant breeding programs Molecular markers can be used to
9
tag rust resistance genes and further their use can serve for the improvement of the
efficiency of selection in plant breeding by MAS Marker-assisted selection can be
used at an early stage of plant development when multiple DNA markers are used to
screen a segregating population for one or more genes simultaneously
Even though single-gene resistance may be overcome by rapidly evolving races the
use of resistant cultivars is still the most effective and economical method of reducing
yield losses due to stem rust (McIntosh 1988) One way to increase the durability of
stem rust resistance genes is to pyramid several Sr genes to increase broad-spectrum
resistance to several races (Pederson and Leath 1988 Admasu et al 2011) With
conventional methods in wheat breeding programs the continuous pyramiding of
genes in a single genotype will become difficult or even impossible when one or more
genes in the background are effective against many races of the pathogen and also
when different resistance genes produce similar infection types In this case
identification of molecular markers linked to disease resistance genes facilitates MAS
for pyramiding resistant alleles (Sharp et al 2001 Babu et al 2004 Haile et al 2012
Miedaner and Korzun 2012)
To date more than 50 stem rust resistance (Sr) genes have been identified against
different races of stem rust fungus (McIntosh et al 2003 2008) and molecular
markers are available for some of them such as Sr2 (Mago et al 2011) Sr13
(Admassu et al 2011 Simons et al 2011) Sr22 (Olson et al 2010 Periyannan et al
2011) Sr25 (Liu et al 2010) Sr26 (Liu et al 2010) Sr32 (Bariana et al 2001) Sr33
(Sambasivam et al 2008) Sr35 (Zhang et al 2010) Sr39 (Mago et al 2009 Niu et al
2011) Sr40 (Wu et al 2009) Sr44 (Liu et al 2012) Sr45 (Sambasivam et al 2008)
Sr47 (Faris et al 2008) Sr50 (Anugrahwati et al 2008) Sr51 (Liu et al 2011a) Sr52
(Qi et al 2011) Sr53 (Liu et al 2011b) SrCad (Hiebert et al 2011) Sr57(synonym
Lr34Yr18) (Pumphrey et al 2012) and SrWeb (Hiebert et al 2010) Although some
of the markers have been used in MAS some of them are not diagnostic and require
improvement
10
14 OVERVIEW OF ASSOCIATION MAPPING IN PLANTS
Elucidating the genetic basis of beneficial traits is the fundamental aim of many
studies involving crop plants Surprisingly relatively little is known about the genetic
architecture of several key traits (Mackay et al 2009) particularly those
quantitatively inherited This notwithstanding the introduction of genomics
approaches now allows for an accurate dissection of the genetic basis of quantitative
traits (Tuberosa et al 2002 Semagn et al 2010 Liu et al 2012) There are two
quantitative genetic approaches that are mainly used to identify associations between
a genotype and phenotype One of those is linkage mapping or linkage analysis This
method is based on the co-segregation of marker alleles with phenotypic observations
on families of a segregating population to identify quantitative trait loci (QTLs) that
contain causal variants In a linkage or bi-parental mapping population the studied
progeny are usually just a few generations away from the two common ancestors
which results in high linkage disequilibrium (LD) ie the non-random association of
alleles between two loci (Rafalski 2002) Thus even rather distant markers are found
to co-segregate with the causal variant Although linkage mapping has proven
successful in identifying QTL for hundreds of traits in many plant species (Mauricio
2001 Doerge 2002 Maccaferri et al 2008 2011 Mackay et al 2009 Pasam et al
2012) the identified QTL region can extend over several centiMorgans (cM) or more
and contains hundreds of genes making the identification of suitable candidates a
very difficult task Therefore beneficial QTL alleles introgressed via marker-assisted
selection are likely to suffer from linkage drag ie the hitchhiking of deleterious loci
with selected target loci In addition the construction of mapping populations of
recombinant inbred lines (RILs) through controlled crosses followed by several
generations of selfing is rather time-consuming which further limits the use of
linkage mapping
An alternative method for identifying loci (genes and QTLs) is association mapping
(AM) or LD mapping (Risch and Merikangas 1996) which seeks to identify specific
causal variants linked to phenotypic polymorphisms in populations of unrelated
genotypes much more diverse than those derived from biparental crosses
Consequently AM populations are usually many generations away from a common
ancestor Recombination events occurring throughout the evolutionary history of the
11
AM population contribute to the breakage of LD blocks within the genome
(Nachman 2002 Rafalski 2002) Thus LD decays much faster in AM populations
than linkage mapping populations AM can therefore achieve a higher resolution of
causal trait polymorphism than linkage mapping In addition to achieving higher
resolution mapping this method can also accommodate germplasm with broader
genetic variation (ie from breeding lines to landraces and even wild progenitors) and
allow for the mapping of many traits simultaneously Thus there is no need to
develop expensive and time-consuming biparental populations for each target trait
However because of the much reduced LD extent in AM populations compared to
linkage mapping populations a significantly greater number of genetic markers are
needed to cover the whole genome and perform a genome-wide association scan
(Nordborg and Weigel 2008 Neuman et al 2010) With the number of available
robust genetic markers such as SSRs and Single Nucleotide Polymorphisms (SNPs)
increasing and the cost of genotyping decreasing AM has become a more attractive
approach for revealing the genetic architecture of various traits in crop species
(Rafalski 2002 Oraguzie et al 2007 Zhu et al 2008 Ingvarsson and Street 2010
Maccaferri et al 2011) including also disease resistance in wheat (Maccaferri et al
2011 Liu et al 2012)
Generally association mapping includes six steps as outlined in Figure 2 (1) a
collection of diverse genotypes are selected that may include landraces elite
cultivars wild relatives and exotic accessions (2) a comprehensive and precise
phenotyping is performed over the traits such as yield stress tolerance or quality-
related traits of the selected genotypes in multiple replicates and yearsenvironments
(3) the genotypes are then scanned with suitable molecular markers (AFLP SSRs
SNPs) (4) population structure and kinships are determined to avoid false positives
followed by (5) quantification of LD extent using different statistics like D D or r2
Finally (6) genotypic and phenotyping data are correlated using appropriate statistical
software allowing tagging of molecular marker positioned in close proximity of
gene(s) underlying a specific trait Consequently the tagged gene can be mobilized
between different genotypes andor cloned and annotated for a precise biological
function
12
141 Linkage disequilibrium
In AM studies the hypothesis of interest is to test whether a marker is associated with
the phenotype of interest Despite a declared significant marker may or may not be
within the functional gene it is likely to be associated with the particular phenotype
because it is in LD with the functional gene (Rafalski 2002) LD is defined as the
non-random association of alleles at different loci (Weir 1979) In other words
alleles are co-inherited either more or less often than expected by chance Three of the
most common measures for describing LD are D Drsquo and r2 (Weir 1979 Jorde
2000) Pairwise LD measured by the value of D according to Lewontin (1964) is as
follows Assume two diallelic loci are linked and let Pij be the proportion of
chromosomes that have allele i at the first locus and allele j at the second locus For
example p12 is the frequency of the haplotype with allele 1 at the first locus and allele
2 at the second locus The disequilibrium coefficient D is the difference between the
observed haplotype frequency p12 and the haplotype frequency expected under linkage
equilibrium the latter being the product of the two allele frequencies ie p1 and p2 It
may be written as follows
D = p12 ndash (p1x p2)
A more commonly quoted measure of LD is Drsquo (Lewontin 1964) This is a
normalized form with a numerator equal to D and the denominator equal to the
absolute maximum D that could be achieved given the allele frequencies at the two
loci Drsquo can take values from -1 to +1 but in general its absolute value is presented
and discussed A value of 1 indicates the absence of recombination event whereas
values less than 1 indicate that two loci have been separated through recombination
Intermediate values of Drsquo may be difficult to interpret as the measure tends to be
inflated when sample size is small or allele frequencies are low The squared
correlation coefficient r2 is sometimes preferred to quantify and compare the amount
of LD between pairs of loci In particular r2 is determined by dividing Drsquo by the
product of the four allele frequencies When r2 = 1 two markers provide identical
information not only having Drsquo = 1 but also having equal allele frequencies The
main advantage of r2 is its inverse relationship with the sample size required to detect
genetic association between markers that are in complete LD (Pritchard and
Przeworski 2001) For instance if cases and controls have only been genotyped for
13
markers in the vicinity of a functional variant the sample size should be increased by
a factor 1r2 in order to achieve the same power as would have been achieved by
generating data at the susceptible locus itself However r2 is more sensitive to allele
frequencies that Drsquo and can be difficult to interpret when the two loci in question
differ in allele frequencies
LD can be influenced by many factors Mutation and recombination are the two main
ones impacting LD Mutation provides the raw material for generating LD between
two loci Recombination however is the main mechanism by which these ancestral
haplotypes are broken down and LD is reduced Because the recombination rate can
vary across a chromosome the extent of LD is also expected to vary in inverse
relation to the local recombination rate (Nachman 2002) Other factors that can
influence the LD extent include inbreeding small population size genetic isolation
between lineages population subdivision founder effects population admixture and
selection (Flint-Garcia and Thornsberry 2003 Oraguzie et al 2007)
The average extent of LD in a species determines the density of molecular markers
needed in AM If LD extends over a longer distance as for example in many self-
pollinated species such as barley (Malysheva-Otto et al 2006) and Arabidopsis
(Nordborg et al 2002) then fewer markers are needed to cover the entire genome On
the other hand if LD extends over a very short distance as in the out-crossing species
of maize (Remington et al 2001) many more markers are needed to cover the entire
genome In addition because of the uneven distribution of recombination hotspots in
both animal and plant systems (Lichten and Goldman 1995 Mezard 2006) LD will
not only vary in different species but also across different chromosomes in the same
species and even in different regions on the same chromosome (Nachman 2002
Rafalski and Morgante 2004) If the marker density is not sufficiently high the extent
of LD across the entire genome cannot be rigorously assessed and thus portions of
the genome will remain poorly described (Rafalski 2002) Thus understanding the
extent of LD both globally and locally in the studied population is necessary for the
interpretation of AM results
14
142 Population structure
Because of non-random mating isolation or artificial selection patterns exist more or
less in any plant population When population structure is present an association may
be found between a phenotype and one or more markers that have no physical linkage
to the causal variants (Ewens and Spielman 1995) Population structure results from
selection and high levels of admixture (individual accession membership proportion
found in multiple subpopulations) in a population and results in increased LD between
unlinked markers (Farnir et al 2000 Nordborg and Tavare 2002 Cardon and Palmer
2003 Rostoks et al 2006 Zhu et al 2008) The occurrence of such spurious
associations is due to different phenotype frequencies across subpopulations
Population structure is often used in genetic studies to summarize relationships
between individuals within and among populations and can provide insights into
evolutionary relationships The probability of a Type I error increases in AM studies
if the population structure is not appropriately accounted for (Flint-Garcia and
Thornsberry 2003 Gupta et al 2005 Maccaferri et al 2011 Letta et al 2013)
Several methods have been proposed for estimating population structure and
modelling population structure in AM studies including distance and model-based
methods (Pritchard et al 2000a Ahmad 2002 Lu et al 2005 Maccaferri et al 2005
Yu et al 2006 Camus-Kulandaivelu et al 2007 Peleg et al 2008) Distance-based
estimates of population structure are generally based on clustering of individuals
based on pair-wise genetic distance estimates between individuals (Nei 1972 Rogers
1972 Nei 1978 Maccaferri et al 2005) Although visually appealing distance-based
methods are not suitable for statistical inference (Pritchard et al 2000a) In contrast
model-based methods assign individuals probabilistically to one or more
subpopulations (Pritchard et al 2000a) The most common model-based approach is
Bayesian modelling where allele frequencies are used to estimate the likelihood of an
individual belonging to a particular subpopulation This approach allows assignment
of individuals to respective populations that can be integrated into statistical models to
account for population structure in AM studies (Pritchard et al 2000a) With Bayesian
modelling the number of subpopulations is usually estimated a priori Often known
relationships (pedigree origin of the individual) andor genetic distance methods are
used to estimate a realistic number of subpopulations for calculation of model-based
15
assignments (Liu et al 2003 2005 Agrama et al 2007 Chao et al 2007 Hai et al
2007) Hai et al (2007) found that when assigning population structure among 69
bread wheat accessions both methods led to similar assignments of individuals to
subpopulations Maccaferri et al (2005) reported similar findings in 183 durum
accessions In contrast distance- and model-based methods were conflicting in a
collection of US wheat cultivars and breeding lines with model-based assignments
detecting population structure missed by distance-based analysis (Chao et al 2007)
The software STRUCTURE (Pritchard et al 2000a) has been developed to account
for population structure (Pritchard et al 2000a) and has been implemented in AM
studies in a number of crop species including barley (Rostoks et al 2006) wheat
(Breseghello and Sorrells 2006 Crossa et al 2007 Tommasini et al 2007) durum
wheat (Maccaferri et al 2010) and rice (Agrama et al 2007) Structure utilizes a
Bayesian modelling approach to assign individuals to a subpopulation to minimize the
LD among unlinked markers among subpopulations Yu et al (2006) proposed a
unified mixed-model method to determine relatedness of samples in populations
resulting in a reduction in both Type I and Type II errors by combining population
structure (Q) with relative kinship (K) accounting for multiple levels of relatedness
In an association study by Zhao et al (2007) when used alone or when combined
with estimates of population structure inclusion of the kinship matrix resulted in a
reduced false-positive rate Pedigree information has been proposed as a means to
estimate K but factors such as missingincorrect pedigree information selection and
genetic drift can make interpretation of pedigree information difficult (Liu et al
2003)
Rare alleles (commonly defined as occurring at frequencies lower than 5-10)
(Tenaillon et al 2001 Barnaud et al 2006 Caldwell et al 2006 Ravel et al 2006a
Chao et al 2007 Rhoneacute et al 2007) inflate estimates of LD reducing statistical
power in AM studies (Wilson et al 2004 Maccaferri et al 2005 Crossa et al 2007
Somers et al 2007) The presence of rare alleles can also increase LD between
unlinked markers and increase the Type I error rate in AM studies Removal of rare
alleles or subsequently pooling rare alleles into their own class (Pritchard et al
2000a Pritchard et al 2000b Maccaferri et al 2005 Somers et al 2007) is a common
practice prior to conducting AM studies Tightly linked markers may result in
16
increased LD among unlinked markers and are best avoided when assessing structure
(Falush et al 2003)
Closely related individuals are more easily assigned to related populations which may
result in overestimating the number of subpopulations as a result of background LD
(Pritchard et al 2000a Falush et al 2003) which reduces the statistical power of AM
studies (Yu et al 2006) In addition Camus-Kulandaivelu et al (2007) noted that
assignment of individuals to subpopulations was variable when closely related
individuals were present in the AM population However removal of highly related
individuals to estimate the number of subpopulations has been suggested as an
approach to minimize overestimation of the number of subpopulations (Liu et al
2003 Breseghello and Sorrells 2006 Camus-Kulandaivelu et al 2007)
143 Approaches for association mapping
Recently several AM studies have been published on a variety of crops including
common wheat (Breseghello and Sorrells 2006 Ravel et al 2006b Roy et al 2006
Crossa et al 2007 Jing et al 2007 Tommasini et al 2007 Peng et al 2008 Liu et al
2012) barley (Kraakman et al 2004 Kraakman et al 2006 Rostoks et al 2006
Cockram et al 2008) potato (Solanum tuberosum L) (Malosetti et al 2007) maize
(Remington et al 2001 Wilson et al 2004 Weber et al 2007) rice (Agrama et al
2007) and durum wheat (Sanguineti et al 2007 Maccaferri et al 2010 2011)
Several studies provided support for the potential of AM with a number of the
associations identified in their study in QTL regions previously identified through
linkage analysis in barley (Kraakman et al 2006) and wheat (Crossa et al 2007 Jing
et al 2007 Tommasini et al 2007 Yu et al 2012) Two approaches are used for AM
studies whole-genome scans and candidate gene analysis (Thornsberry et al 2001
Rafalski 2002 Kraakman et al 2004 Rostoks et al 2006 Pasam et al 2012)
1431 Genome-wide association mapping
Genome-wide association (GWA) mapping also known as whole genome scanning
approach is a comprehensive approach in which genotyping is done for all possible
genetic markers across the genome to systematically search the genome for causal
17
genetic variation affecting the target trait(s) (Hirschhorn and Daly 2005) GWA
identifies genomic regions throughout the genome associated with the trait of interest
A large number of markers are tested for association with various complex traits and
prior information regarding candidate genes is not required For many traits such
prior knowledge may not exist or may be very vague thus for these cases genome-
wide AM is often used in association studies The first association study to attempt a
genome scan in plants was conducted in wild beet (Beta vulgaris ssp maritima) for
the requirement of vernalization prior to bolting a feature determined by a single gene
(Hansen et al 2001)
The basis of genome-wide AM is to genotype a sufficient number of markers across
the genome so the causal variants (ie the underlying gene(s) that control the trait)
will likely be in LD with at least one marker This approach is favoured in situations
where LD extends for large distances allowing for potential candidate regions
associated with a trait of interest to be identified for further study (Remington et al
2001) The extent of LD therefore is a critical factor in determining the number of
markers needed to cover the genome and the mapping resolution that can be achieved
Association studies with high-density marker coverage large sample size and
minimum population structure offer great promise in complex trait dissection To
date candidate-gene association studies have searched only a tiny fraction of the
genome The debate of candidate genes versus genome scans traces back to the
original milestone paper of Risch and Merikangas (1996) As genomic technologies
continue to evolve more genome-wide association analyses conducted in different
plant species are expected
1432 Candidate gene association mapping
A candidate gene is a coding sequence located in a chromosome region suspected of
being involved in the expression of a trait whose protein product suggests that it could
be the gene in question Although the candidate gene approach has in some cases led
to the identification of a few causal genes (Werner et al 2005 Harjes et al 2008
Zheng et al 2008 Ramsay et al 2011) It relies on some prior knowledge about the
gene location and function Candidate genes are selected based on prior knowledge of
mutational analysis biochemical pathway or linkage and genome-wide association
18
analysis of the trait of interest However this low-cost hypothesis-driven and trait-
specific approach will inevitably miss the role of other unknown non-coding loci that
may actually be the primary cause of the observed phenotypic variability (Zhu et al
2008) A remarkable example for this is provided by the work of Salvi et al (2007)
with Vgt1 a major QTL in maize that controls the transition from the vegetative to the
reproductive stage ie flowering time The candidate gene approach directly tests the
effects of genetic variants of a gene that may affect a particular trait However the
candidate gene approach is limited by existing knowledge about the biology of the
trait of interest and the genes underlying the QTL interval This notwithstanding the
candidate gene approach is useful for quickly determining the association of a genetic
variant with a trait and also for identifying genes of modest effect Additionally the
increased availability of well-annotated genomes and the drastic reduction in
sequencing costs are expected to facilitate the adoption of the candidate gene
approach in future studies aimed to identify the loci governing the variability in traits
of breeding interest
Association analysis has the potential to identify the single polymorphism within a
gene that is responsible for the differences in the phenotype In addition many plant
species have a high level of diversity for which association approaches are well suited
to evaluate the numerous alleles available (Flint-Garcia and Thornsberry 2003)
Several studies showed the use of this approach to identify causal molecular
polymorphism responsible for several traits As an example SNPs in dwarf8 were
evaluated for association with flowering time and plant height in 92 maize inbred
lines (Thornsberry et al 2001) nine polymorphisms including a miniature
transposable element (MITE) insertion in the promoter were associated with
flowering time (Thornsberry et al 2001) and this gene has since been validated as a
causal factor influencing flowering time in maize (Andersen et al 2005) In maize
molecular differences at Y1 were associated with phenotypic variation in grain
carotenoid concentration (Palaisa et al 2003) and this gene has since been identified
as the causal factor for elevated carotenoids in maize However the association of
SNPs with a trait still requires validation as the SNP could be in disequilibrium with
the causal factor particularly if LD is high in the genomic region surrounding the
gene Thus candidate gene approaches are generally utilized to eliminate putative
candidates from more detailed functional studies
19
15 LITERATURE CITED
Admassu B Emebet F Zerihun K (2004) Physiological races and virulence diversity
of Puccinia graminis f sp tritici on wheat in Ethiopia In 12th
regional wheat
workshop for Eastern Central and Southern Africa Nakuru Kenya 22-26
November 2004 pp 145-150
Admassu B Perovic D Friedt W Ordon F (2011) Genetic mapping of the stem rust
(Puccinia graminis f sp tritici Eriks amp E Henn) resistance gene Sr13 in
wheat (Triticum aestivum L) Theor Appl Genet 122 643-648
Ahmad M (2002) Assessment of genomic diversity among wheat genotypes as
determined by simple sequence repeats Genome 45 646-651
Agrama HA Eizenga GC Yan W (2007) Association mapping of yield and its
components in rice cultivars Mol Breed 19 341-356
Al-Maskri AY Sajjad M Khan SH (2012) Association mapping a step forward to
discovering new alleles for crop improvement Int J Agric Biol 14 153-160
Andersen JR Schrag T Melchinger AE Zein I Luumlbberstedt T (2005) Validation of
Dwarf8 polymorphisms associated with flowering time in elite European
inbred lines of maize (Zea mays L) Theor Appl Genet 111 206-217
Anderson JA (2003) Plant genomics and its impact on wheat breeding In Plant
molecular breeding (HJNewbury Ed) Blackwell Pub Boca Raton 184-215
Anugrahwati DR Shepherd KW Verlin DC Zhang P Mirzaghaderi G Walker E
Francki MG Dundas IS (2008) Isolation of wheat-rye 1RS recombinants that
break the linkage between the stem rust resistance gene SrR and secalin
Genome 51 341-349
Babu RC Shanmugasundaram P Chezhian P Jeyaprakash P Balasubramanian P
Chararerk V Pathan MS Babu V Nguyen HT (2004) Mapping quantitative
trait loci for drought tolerance in rice comparison across environments
genetic backgrounds and validation In Poland D Sawkins JM Ribaut M
Hoisington D (Eds) Proceedings of a Workshop Held at Cuernavaca on
Resilient Crops for Water Limited Environments Mexico May 24-28
International Maize and Wheat Improvement Center Mexico pp 204-205
Badebo Ayele (2002) Breeding Bread Wheat with Multiple Disease Resistance and
High Yield for the Ethiopian Highlands Broadening the Genetic Basis of
Yellow Rust and Tan Spot Resistance Goettingen Germany Goettingen
20
University PhD thesis
Badebo A Gelalcha S Ammar K Nachit M Abdalla O (2009) Durum wheat research
in Ethiopia In Proceedings of the 2009 BGRI Technical Workshop
CIMMYT Cd Obregon Sonora Mexico March 17-20 2009 pp 28
Bariana HS Hayden MJ Ahmed NU Bell JA Sharp PJ McIntosh RA (2001)
Mapping of durable adult plant and seedling resistances to stripe rust and stem
rust diseases in wheat Aust J Agric Res 52 1247-1255
Barnaud A Lacombe T Doligez A (2006) Linkage disequilibrium in cultivated
grapevine Vitis vinifera L Theor Appl Genet 112 708-716
Beteselassie N Fininsa C Badebo A (2007) Sources of resistance to stem rust
(Puccinia graminis f sp tritici) in Ethiopian tetraploid wheat accessions
Genet Resour Crop Evol 54337-343
Breseghello F and Sorrells ME (2006) Association mapping of kernel size and milling
quality in wheat (Triticum aestivum L) cultivars Genetics 172 1165-1177
Caldwell KS Russell J Langridge P Powell W (2006) Extreme population-dependent
linkage disequilibrium detected in an inbreeding plant species Hordeum
vulgare Genetics 172 557-567
Camus-Kulandaivelu L Veyrieras JB Gouesnard B Charcosset A Manicacci D
(2007) Evaluating the Reliability of Structure Outputs in Case of Relatedness
between Individuals Crop Science 47 887-892
Cardon LR Palmer LJ (2003) Population stratification and spurious allelic
association The Lancet 361 598-604
Chao S Zhang W Dubcovsky J Sorrells M (2007) Evaluation of Genetic Diversity
and Genome-wide linkage disequilibrium among US wheat (Triticum aestivum
L) germplasm representing different market classes Crop Science 47 1018-
1030
Chester K (1946) The nature and prevention of the cereal rusts as exemplified in the
leaf rust of wheat Chronica Botanica Co Waltham MA
Cockram J White J Leigh FJ Lea VJ Chiapparino E Laurie DA Mackay IJ Powell
W OSullivan DM (2008) Association mapping of partitioning loci in barley
BMC Genetics 9 16
Crossa J Burguentildeo J Dreisigacker S Vargas M Herrera-Foessel SA Lillemo M
Singh RP Trethowan R Warburton M Franco J Reynolds M Crouch JH and
Ortiz R (2007) Association analysis of historical bread wheat germplasm
21
additive genetic covariance of relatives and population structure Genetics 177
1889-1913
Doerge RW (2002) Mapping and analysis of quantitative trait loci in experimental
populations Nat Rev Genet 3 43-52
Ewens WJ Spielman RS (1995) The transmissiondisequilibrium test history
subdivision and admixture Am J Hum Genet 57 455-464
Falush D Stephens M Pritchard JK (2003) Inference of population structure using
multilocus genotype data Linked loci and correlated allele frequencies
Genetics 1641567-1587
Faris JD Xu SS Cai X Friesen TL Jin Y (2008) Molecular and cytogenetic
characterization of a durum wheat-Aegilops speltoides chromosome
translocation conferring resistance to stem rust Chromosome Res 16 1097-
1105
Farnir F Coppieters W Arranz JJ Berzi P Cambisano N Grisart B Karim L Marcq
F Moreau L Mni M Nezer C Simon P Vanmanshoven P Wagenaar D
Georges M (2000) Extensive Genome-wide Linkage Disequilibrium in Cattle
Genome Research 10 220-227
Flint-Garcia SA Thornsberry JM Buckler ES (2003) Structure of linkage
disequilibrium in plants Annu Rev Plant Biol 54 357-374
Global Rust Initiative (2007) Dangerous Wheat Disease Jumps Red Sea http www
eurekalert org pub_releases2007-01imaw-dwd011607php
Gupta PK Rustgi S Kulwal PL (2005) Linkage disequilibrium and association
studies in higher plants present status and future prospects Plant Mol Biol
57 461-485
Hai L Wagner C Friedt W (2007) Quantitative structure analysis of genetic diversity
among spring bread wheats (Triticum aestivum L) from different geographical
regions Genetica 130 213-225
Haile JK (2012) Genetic mapping of resistance to race Ug99 of Puccinia graminis f
sp tritici diversity analysis and identification of stem rust resistance genes in
Ethiopian tetraploid wheats PhD thesis Kassel University Germany
Hailu Gebre-Mariam (1991) Wheat production and research in Ethiopia In Hailu
GebreMariam DG Tanner and Mengistu Hulluka (eds) lsquoWheat Research in
Ethiopia A historical perspectiversquo IARCIMMYT Addis Ababa Ethiopia
Harjes CE Rocheford TR Bai L Brutnell TP Kandianis CB Sowinski SG Stapleton
22
AE Vallabhaneni R Williams M Wurtzel ET Yan J Buckler ES (2008)
Natural genetic variation in lycopene epsilon cyclase tapped for maize
biofortification Science 319330-333
Herrera-Foessel SA Lagudah ES Huerta-Espino J Hayden MJ Bariana HS et al
(2011) New slow rusting leaf rust and stripe rust resistance genes Lr67 and
Yr46 in wheat are pleiotropic or closely linked Theor Appl Genet 122 239-
49
Hiebert CW Fetch TG Zegeye T (2010) Genetics and mapping of stem rust resistance
to Ug99 in the wheat cultivar Webster Theor Appl Genet 12165-69
Hiebert CW Fetch TG Zegeye T Thomas JB Somers DJ Humphreys DG
McCallum BD Cloutier S Singh D Knott DR (2011) Genetics and mapping
of seedling resistance to Ug99 stem rust in Canadian wheat cultivars `Peacersquo
and `AC Cadillac Theor Appl Genet 122 143-149
Hirschhorn JN Daly MJ (2005) Genome wide association studies for common
diseases and complex traits Nat Rev Genet 6 95-108
Hodson D (2011) Shifting boundaries challenges for rust monitoring Euphytica 179
93-104
Ingvarsson PK Street NR (2011) Association genetics of complex traits in
plants New Phytol 189 909 PK Street NR 922
Jing HC Kornyukhin D Kanyuka K Orford S Zlatska A Mitrofanova OP Koebner
R and Hammond-Kosack K (2007) Identification of variation in adaptively
important traits and genome-wide analysis of trait-marker associations in
Triticum monococcum J Exp Bot 58 3749-3764
Jorde LB Watkins WS Kere J Nyman D Eriksson AW (2000) Gene mapping in
isolated populations New roles for old friends Hum Hered 50 57-65
Kraakman ATW Niks RE Van den Berg PMM Stam P Van Eeuwijk FA (2004)
Linkage Disequilibrium Mapping of Yield and Yield Stability in Modern
Spring Barley Cultivars Genetics 168 435-446
Kraakman ATW Martinez F Mussiraliev B Eeuwijk FA Niks RE (2006) Linkage
disequilibrium mapping of morphological resistance and other agronomically
relevant traits in modern spring barley cultivars Mol Breed 1741-58
Leonard K (2001) Stem Rust- Future Enemy In Peterson P (ed) Stem Rust of
Wheat Ancient Enemy to Modern FoeThe American Phytopathological
Society St Paul MN pp 1-11
23
Leppik EE (1970) Gene centers of plants as sources of resistance Annu Rev
Phytopathol 8 323-344
Letta T Maccaferri M Badebo A Ammar K Ricci A Crossa J Tuberosa R (2013)
Searching for novel sources of field resistance to Ug99 and Ethiopian stem
rust races in durum wheat via association mapping Theor Appl Genet DOI
101007s00122-013-2050-8
Lewontin RC (1964) The interaction of selection and linkage I General
considerations heterotic models Genetics 49 49-67
Lichten M Goldman AS (1955) Meiotic recombination hotspots Annu Rev Genet
29 423-444
Liu K Goodman M Muse S Smith JS Buckler E Doebley J (2003) Genetic
Structure and Diversity Among Maize Inbred Lines as Inferred from DNA
Microsatellites Genetics 165 2117-2128
Liu S Yu L-X Singh RP Jin Y Sorrells ME Anderson JA (2010) Diagnostic and co-
dominant PCR markers for wheat stem rust resistance genes Sr25 and Sr26
Theor Appl Genet 120 691-697
Liu W Jin Y Rouse M Friebe B Gill B Pumphrey MO (2011a) Development and
characterization of wheat-Ae searsii Robertsonian translocations and a
recombinant chromosome conferring resistance to stem rust Theor Appl
Genet 122 537-45
Liu W Rouse M Friebe B Jin Y Gill B and Pumphrey MO (2011b) Discovery and
molecular mapping of a new gene conferring resistance to stem rust Sr53
derived from Aegilops geniculata and characterization of spontaneous
translocation stocks with reduced alien chromatin Chromosome Research 19
669-682
Liu WX Danivola TV Rouse MN Bowden RL Friebe B Gill BS Pumphrey MO
(2013) Development and characterization of a compensating wheat-
Thinopyrum intermedium Robertsonian translocation with Sr44 resistance to
stem rust (Ug99) Theor Appl Genet (In press)
Lu H Redus MA Coburn JR Rutger JN McCouch SR and Tai TH (2005) Population
Structure and Breeding Patterns of 145 US Rice Cultivars Based on SSR
Marker Analysis Crop Science 45 66-76
Maccaferri M Sanguineti MC Noli E Tuberosa R (2005) Population structure and
long-range linkage disequilibrium in a durum wheat elite collection Mol
24
Breed 15 271-289
Maccaferri M Sanguineti MC Corneti S Ortega JLA Ben Salem M Bort J
DeAmbrogio E del Moral LFG Demontis A El-Ahmed A Maalouf F
Machlab H Martos V Moragues M Motawaj J Nachit M Nserallah N
Ouabbou H Royo C Slama A Tuberosa R (2008) Quantitative trait loci for
grain yield and adaptation of durum wheat (Triticum durum Desf) across a
wide range of water availability Genetics 178 489-511
Maccaferri M Sanguineti MC Mantovani P Demontis A Massi A Ammar K
Kolmer J Czembor J Ezrati S Tuberosa R (2010) Association mapping of
leaf rust response in durum wheat Mol Breed 26 189-228
Maccaferri M Sanguineti MC del Moral LFG Demontis A El-Ahmed A Maalouf F
Machlab H Martos V Moragues M Motawaj J Nachit M Nserallah N
Ouabbou H Royo C Slama A Tuberosa R (2011) Association mapping in
durum wheat grown across a broad range of water regimes and yield potential
J Exp Bot 62 409-438
Mackay TFC Stone EA Ayroles JF (2009) The genetics of quantitative traits
challenges and prospects Nature Reviews Genetics 10 565-677
Mago R Zhang P Bariana HS Verlin DC Bansal UK Ellis JG Dundas IS (2009)
Development of wheat lines carrying stem rust resistance gene Sr39 with
reduced Aegilops speltoides chromatin and simple PCR markers for marker-
assisted selection Theor Appl Genet 119 1441-1450
Mago R Lawrence GJ Ellis JG (2011) The application of DNA marker and doubled-
haploid technology for stacking multiple stem rust resistance genes in wheat
Mol Breed 27 329-335
Malosetti M van der Linden CG Vosman B van Eeuwijk FA (2007) A mixed-model
approach to association mapping using pedigree information with an
illustration of resistance to phytophthor infestans in potato Genetics 175
879-889
Malysheva-Otto LV Ganal MW Roumlder MS (2006) Analysis of molecular diversity
population structure and linkage disequilibrium in a worldwide survey of
cultivated barley germplasm (Hordeum vulgare L) BMC Genet 7 1-14
Mauricio R (2001) Mapping quantitative trait loci in plants Uses and caveats for
evolutionary biology Nature Reviews Genetics 2 370-381
McIntosh RA (1988) Catalogue of gene symbols for wheat Proc Int Wheat Genet
25
Symp 7th
pp 225-1323
McIntosh RA Yamazaki Y Devos KM Dubcovsky J Rogers WJ Appels R (2003)
Catalogue of gene symbols for wheat In Pogna NE Romano M Pogna A
Galterio G (eds) Proceedings of the 10th international wheat genetics
symposium Paestum Italy
McIntosh RA Yamazaki Y Dubcovsky J Rogers WJ Morris CF Somers D Appels
R Devos KM (2008) Catalogue of gene symbols for wheat Gene Symbols In
McIntosh RA (ed) httpwheatpwusdagovGG2TriticumwgcGene Symbolpdf
Melchinger AE (1990) Use of molecular markers in breeding for oligogenic disease
resistance Plant Breed 104 1-19
Meacutezard C (2006) Meiotic recombination hotspots in plants Biochem Soc Trans 34
531-534
Miedaner T Korzun V (2012) Marker-assisted selection for disease resistance in wheat and
barely breeding Phytopathology 102 560-566
Mohan M Nair S Bhagwat A Krishna TG Yano M Bhatia CR Sasaki T (1997)
Genome mapping molecular markers and marker assisted selection in crop
plants Mol Breed 3 87-93
Nachman MW (2002) Variation in recombination rate across the genome evidence
and implications Curr Op Genet Devel 12 657-663
Nei M (1972) Genetic Distance between Populations The American Naturalist 106
283-292
Nei M (1978) Estimation of Average Heterozygosity and Genetic Distance from a
Small Number of Individuals Genetics 89 583-590
Neumann K Kobiljski B Dencic S Varshney RK Borner A (2010) Genome wide
association mapping A case study in bread wheat (Triticum aestivum L) Mol
breed DOI 101007s11032-010-9411-7
Newai Gebre-ab (2006) Commercialization of smallholder agriculture in Ethiopia
Ethiopian Development Research Institute Addis Ababa 22pp
Niu Z Klindworth DL Friesen TL Chao S Jin Y Cai X Xu SS (2011) Targeted
introgression of a wheat stem rust resistance gene by DNA marker-assisted
chromosome engineering Genetics 187 1011-21
Nordborg M Tavare S (2002) Linkage disequilibrium What history has to tell us
Trends Genet 18 83-90
26
Nordborg M Borevitz JO Bergelson J Berry CC Chory J Hagenblad J Kreitman
M Maloof JN Noyes T Oefner PJ Stahl EA Weigel D (2002) The extent of
linkage disequilibrium in Arabidopsis thaliana Nature Genetics 30 190-193
Nordborg M Weigel D (2008) Next-generation genetics in plants Nature 456 720-
723
Olson EL Brown-Guedira G Marshall DS Jin Y Mergoum M Lowe I Dubcovsky J
(2010) Genotyping of US wheat germplasm for presence of stem rust
resistance genes Sr24 Sr36 and Sr1RSAmigo Crop Sci 50 668-675
Oraguzie NC Wilcox PL Rikkerink EHA Silva HN (2007) Linkage disequilibriumrdquo
In Oraguzie NC EHA Rikkerink SE Gardiner and HN De Silva (eds)
Association Mapping in Plants pp 11-39 Springer New York USA
Palaisa KA Morgante M Williams M Rafalski A (2003) Contrasting Effects of
Selection on Sequence Diversity and Linkage Disequilibrium at Two Phytoene
Synthase Loci The Plant Cell 15 1795-1806
Pasam RK Sharma R Malosetti M Eeuwijk F Haseneyer G Kilian B Garner A
(2012) Genome wide association studies for agronomical traits in a world wide
spring barely collection BMC Plant Biol 12 1-16
Paterson AH Tanksley SD Sorrells ME (1991) DNA markers in plant improvement
Adv Agron 46 39-90
Pederson WL Leath S (1988) Pyramiding major genes for resistance to maintain
residual effects Ann Rev Phytopathol 26 368-378
Peleg Z Fahima T Abbo S Krugman T Saranga Y (2008) Genetic structure of wild
emmer wheat populations as reflected by transcribed versus anonymous SSR
markers Genome 51 187-195
Peng JH Bai Y Haley SD Lapitan NLV (2008) Microsatellite-based molecular
diversity of bread wheat germplasm and association mapping of wheat
resistance to the Russian wheat aphid Genetica 135 95-122
Periyannan SK Bansal UK Bariana HS Pumphrey M Lagudah ES (2011) A robust
molecular marker for the detection of shortened introgressed segment carrying
the stem rust resistance gene Sr22 in common wheat Theor Appl Genet 122
1-7
Peterson P (2001) Stem rust of wheat From ancient enemy to modern foe APS Press
St Paul MN
Pretorius ZA Singh RP Wagoire WW Payne TS (2000) Detection of virulence to
27
wheat stem rust resistance gene Sr31 in Puccinia graminis f sp tritici in
Uganda Plant Dis 84 203
Pritchard JK Stephens M Donnelly P (2000a) Inference of population structure using
multilocus genotype data Genetics 155 945-959
Pritchard JK Stephens M Rosenberg NA Donnelly P (2000b) Association mapping
in structured populations Am J Hum Genet 67 170-181
Pritchard JK Przewprski M (2001) Linkage disequilibrium in humans models and
data Am J Hum Genet 69 1-14
Pumphrey MO (2012) Stocking the Breedersrsquos toolbox an update on the status of
resistance to stem rust in wheat In Proceedings of BGRI 2012 Technical
Workshop ed R McIntosh Beijing China September 1-4 pp 23-29
Qi LL Pumphrey MO Friebe B Zhang P Qian C Bowden RL Rouse MN Jin Y
Gill BS (2011) A novel Robertsonian translocation event leads to transfer of a
stem rust resistance gene (Sr52) effective against race Ug99 from Dasypyrum
villosum into bread wheat Theor Appl Genet 123 159-67
Rafalski A (2002) Applications of single nucleotide polymorphisms in crop genetics
Curr Opin Plant Biol 5 94
Rafalski A Morgante M (2004) Corn and humans recombination and linkage
disequilibrium in two genomes of similar size Trends Genet 2 103-111
Ramsay L Comadran J Druka A Marshall DF Thomas WTB et al (2011)
INTERMEDIUM-C a modifier of lateral spikelet fertility in barely is an
ortholog of the maize domestication gene TEOSINTE BRANCHED 1 Nat
Genet 43 169-173
Ravel C Praud S Murigneux A Canaguier A Sapet F Samson D Balfourier F
Dufour P Chalhoub B Brunel D Beckert M Charmet G (2006a) Single-
nucleotide polymorphism frequency in a set of selected lines of bread wheat
(Triticum aestivum L) Genome 49 1131-1139
Ravel C Praud S Murigneux A Linossier L Dardevet M Balfourier F Dufour P
Brunel D Charmet G (2006b) Identification of Glu-B1-1 as a candidate gene
for the quantity of high-molecular-weight glutenin in bread wheat (Triticum
aestivum L) by means of an association study Theor Appl Genet 112 738-
743
Remington DL Thornsberry JM Matsuoka Y Wilson LM Whitt SR Doebley J
Kresovich Goodman MM Buckler ES (2001) Structure of linkage
28
disequilibrium and phenotypic associations in the maize genome PNAS 98
11479 -11484
Rhoneacute B Raquin AL Goldringer I (2007) Strong linkage disequilibrium near the
selected Yr17 resistance gene in a wheat experimental population Theor Appl
Genet 114 787-802
Risch N Merikangas K (1996) The future of genetic studies of complex human
diseases Science 273 1516-1517
Roelfs A Bushnell W (Eds) (1985) Epidemiology in North America In The Cereal
Rusts Vol II Diseases Distribution Epidemiology and Control Academic
Press Orlando FL
Roelfs AP Martens JW (1987) An International System of Nomenclature for Puccinia
graminis fsp tritici Phytopathol 78 526-533
Roelfs AP Singh RP Saari EE (1992) Rust diseases of wheat concepts and methods
of disease management CIMMYT Mexico DF
Rogers JS (1972) Measures of genetic similarity and genetic distance Studies in
genetics VII Univ Texas Publ 7213 145-153
Rostoks N Ramsay L MacKenzie K Cardle L Bhat PR Roose ML Svensson JT
Stein N Varshney R K Marshall DF Graner A Close TJ Waugh R (2006)
Recent history of artificial outcrossing facilitates whole-genome association
mapping in elite inbred crop varieties PNAS 103 18656-18661
Royo C Di Fonzo N Nachit MM Araus JL (eds) (2000) Durum wheat improvement
in the Mediterranean region new challenges Proceedings of a Seminar
Zaragoza Spain 12-14 April 2000 Options-Mediterraneennes
Roy JK Bandopadhyay R Rustgi S Balyan HS Gupta PK (2006) Association
analysis of agronomically important traits using SSR SAMPL and AFLP
markers in bread wheat Current Sci 90 683-689
Salvi S Sponza G Morgante M Tomes D Niu X Fengler KA Meeley R Ananiev
EV Svitashev S Bruggemann E Li B Hainey CF Radovic S Zaina G
Rafalski JA Tingey SV Miao GH Phillips RL Tuberosa R (2007) Conserved
noncoding genomic sequences associated with a flowering-time quantitative
trait locus in maize PNAS 104 11376-11381
Sambasivam PK Bansal UK Hayden MJ Dvorak J Lagudah ES Bariana HS (2008)
Identification of markers linked with stem rust resistance genes Sr33 and Sr45
In Appels R Eastwood R Lagudah E Langridge P Mackay M McIntyre L
29
Sharp P (eds) Proceedings of 11th international wheat genetics symposium
Sydney University Press Sydney Australia pp 351-353
Sanguineti MC Li S Maccaferri M Corneti S Rotondo F Chiari T Tuberosa R
(2007) Genetic dissection of seminal root architecture in elite durum wheat
germplasm Annals of Applied Biology 151 291-305
SeedQuest (2008) Ug99 wheat killer detected in Iran ndashdangerous fungus on the move
from East Africa to the Middle East SeedQuest News [http wwwseedquest
comNews] releases 2008 march21996htm
Semagn K Bjornstad A Xu Y (2010) The genetic dissection of quantitative traits in
crops Electronic J Biotechnol 1-45
Sharp PJ Johnston S Brown G McIntosh RA Pellota M Carter M Bariana HS
Khatkar S Lagudah ES Singh RP Kairallah M Potter R Jones MGK (2001)
Validation of molecular markers for wheat breeding Aust J Agric Res 52
1357-1366
Simons K Abate Z Chao S Zhang W Rouse M Jin Y Elias E Dubcovsky J (2011)
Genetic mapping of stem rust resistance gene Sr13 in tetraploid wheat
(Triticum turgidum ssp durum L) Theor Appl Genet 122 649-658
Singh RP Hodson DP Jin Y Huerta-Espino J Kinyua MG Wanyera R Njau P Ward
RW (2006) Current status likely migration and strategies to mitigate the threat
to wheat production from race Ug99 (TTKS) of stem rust pathogen In CAB
reviews perspectives in agriculture veterinary science nutrition and natural
resources 1 No 054
Solomon A Bemnet G Sherif A Amha Y Jemanesh H Alemayehu Z and Bekele M
(2006) Commercialization of durum wheat Approaches in Technology
generation scaling up and marketing through partnership In Tsedeke A (ed)
rsquoSuccesses with value chainrsquo Proceedings of scaling up and scaling out
agricultural technologies in Ethiopia An international conference 9-11 May
2006 Addis Ababa Ethiopia pp 66-75
Somers DJ Banks T DePauw R Fox S Clarke J Pozniak C McCartney C (2007)
Genome-wide linkage disequilibrium analysis in bread wheat and durum
wheat Genome 50 557-567
Tenaillon MI Sawkins MC Long AD Gaut RL Doebley JF Gaut BS (2001) Patterns
of DNA sequence polymorphism along chromosome 1 of maize (Zea mays
ssp mays L) PNAS 98 9161-9166
30
Tesfaye T Getachew B (1991) Aspects of Ethiopian tetraploid wheats with emphasis
on durum wheat genetics and breeding In Hailu GebreMariam DG Tanner
and Mengistu Hulluka (eds) lsquoWheat Research in Ethiopia A historical
perspectiversquo IARCIMMYT Addis Ababa Ethiopia pp 41-71
Thornsberry JM Goodman MM Doebley J Kresovich S Nielsen D Buckler ES
(2001) Dwarf8 polymorphisms associate with variation in fl owering time
Nat Genet 28 286-289
Tommasini L Schnurbusch T Fossati D Mascher F Keller B (2007) Association
mapping of Stagonospora nodorum blotch resistance in modern European
winter wheat varieties Theor Appl Genet 115 697-708
Tuberosa R Gill BS Quarrie SA (2002) Cereal genomics Ushering in a brave new
world Plant Mol Biol 48 744-755
Varshney RK Tuberosa R (2007) Application of linkage disequilibrium and
association mapping in crop plants Genomics Approaches and Platforms 1
97-119
Vavilov NI (1951) The origin variation immunity and breeding of cultivated plants
Chron Bot 13 1-36
Weber A Clark RM Vaughn L Saacutenchez-Gonzalez JdJ Yu J Yandell BS Bradbury
P Doebley J (2007) Major Regulatory Genes in Maize Contribute to Standing
Variation in Teosinte (Zea mays ssp parviglumis) Genetics 177 2349-2359
Weir BS (1979) Inferences about linkage disequilibrium Biometrics 35 235-254
Werner JD Borevitz JO Uhlenhaut NH Ecker JR Chory J and Weigel D (2005)
FRIGIDA-independent variation in flowering time of natural Arabidopsis
thaliana accessions Genetics 170 1197-1207
Wilson LM Whitt SR Rocheford TR Goodman MM Buckler ES (2004) Dissection
of maize kernel composition and starch production by candidate gene
association The Plant Cell 16 2719-2733
Wu S Pumphrey M Bai G (2009) Molecular mapping of stem-rustresistance gene
Sr40 in wheat Crop Sci 49 1681-1686
Young ND (1996) QTL mapping and quantitative disease resistance in plants Annu
Rev Phytopathol 34 479-501
Yu J Pressoir G Briggs WH Bi IV Yamasaki M Doebley JF McMullen MD Gaut
BS Nielsen DM Holland JB Kresovich S Buckler ES (2006) A unified
31
mixed-model method for association mapping that accounts for multiple levels
of relatedness Nature Genetics 38 203-208
Yu L-X Morgounov A Wanyera R Keser M Singh SK Sorrells M (2012)
Identification of Ug99 stem rust resistance loci in winter wheat germplasm
using genome-wide association analysis Theor Appl Genet DOI 101007
s00122-012-1867-x
Zhang W Olson E Saintenac C Rouse M Abate Z Jin Y Akhunov E Pumphrey M
Dubcovsky J (2010) Genetic maps of stem rust resistance gene Sr35 in diploid
and hexaploid wheat Crop Sci 50 2464-2474
Zhao K Aranzana MJ Kim S Lister C Shindo C Tang C Toomajian C Zheng H
Dean C Marjoram P Nordborg M (2007) An Arabidopsis example of
association mapping in structured samples PloS Genet 3e4
Zheng P Allen WBlt Roesler K Williams ME Zhang S Li J Glassman K Ranch J
Nubel D Solawetz W Bhattramakki D Llaca V Deschamps S Zhong GY
Tarczynski MC Shen B (2008) A phenylalanine in DGAT is a key
determinant of oil content and composition in maize Nat Genet 40 367-372
Zhu C Gore M Buckler SE Yu J (2008) Status and Prospects of Association
Mapping in Plants The Plant Genome 1 5-20
32
FIGURES
33
Figure 1 High disease epidemic caused by stem rust on wheat (Source http
wwwarsusdagov Maindocshtm docid-9910)
34
Figure 2 A simplified flow chart showing different stages of association mapping for
tagging a gene of interest using germplasm accessions (Adapted from Al-Maskri et al
2012)
35
CHAPTER 2 IMPROVING STEM RUST RESISTANCE IN WHEAT
21 INTRODUCTION
Resistance to stem rust was a top priority in the ldquoGreen Revolutionrdquo wheat varieties
bred by the late Norman Borlaug and co-workers beginning in the 1950s and the
combinations of resistance genes they created remained effective until the appearance
of a new strain of stem rust identified from Africa that overcomes the major resistance
genes used to combat stem rust (http 2bladesorgwheat-stem-rustphp) Improving
stem rust resistance in wheat requires knowledge of the pathogen including its life
cycle physiologic races and variation
22 LIFE CYCLE OF WHEAT STEM RUST
The wheat stem rust fungus Puccinia graminis Pers f sp tritici Eriks E Henn (Pgt)
has a complex life cycle consisting of both sexual and asexual reproductive cycles
different sexual and asexual hosts multiple spore stages and nuclear conditions
(Figure 1) Pgt is a heteroecious fungus requiring two hosts to complete the entire life
cycle Wheat stem rust is a biotrophic fungus and does not exist in nature apart from
the primary host wheat or the secondary host common barberry (Berberis vulgaris
L) (Leonard and Szabo 2005)
Teliospores from wheat stem infected with Pgt are produced late in the growing
season These abiotic stress-tolerant spores are capable of overwintering on infected
straw Upon formation of the two cells of teliospores two haploid nuclei (n+n) are
present in each cell These nuclei undergo karyogamy and form a single nucleus (2n)
Meiosis takes place after karyogamy but is arrested until germination the following
spring season (Boehm et al 1992) Germination of teliospores is synchronized with
new growth of the alternate host barberry (Berberis vulgaris) Each teliospore
produces a basidium from which four basidiospores are produced Each basidiospore
is haploid (n) and contains one of the four products of meiosis from the fusion of the
haploid nuclei The meiotic products are of different mating types two basidiospores
will be + and two will be - A mitotic division in the basidiospores produces two
haploid nuclei in each basidiospore The basidiospores are products of recombination
36
and it is through meiosis in teliospores that novel variation in Pgt can be produced
The basidiospores ejected from the basidia infect the adaxial surface of barberry
leaves (Roelfs 1985)
The hyphae of basidiospores grow within the leaf mesophyll as haploid hyphae and
produce a pycnium on the adaxial leaf surface Haploid pycniospores (n) of + and ndash
mating types are exuded from the top of the pycnium Serving as male gametes
pycniospores are brought into contact with haploid female (n) flexuous hyphae of the
opposite mating type that extrude from the top of the pycnium (Anikster et al 1999)
A dikaryon (n+n) consisting of two haploid nuclei is formed and the resulting hype
grows throughout the leaf mesophyll to produce an aecium on the abaxial leaf surface
From the aecium single celled dikaryotic (n+n) aeciospores are produced which can
then infect the wheat host
The primary infection of wheat is by aeciospores that infect and produce hyphae
within the host These hyphae then produce uredinia that yield dikaryotic
urediniospores (n+n) that represent the asexual stage of the life cycle Urediniospores
re-infect the host during the growing season and cause the principle damage to wheat
plants resulting in yield losses Upon maturity of the host teliospores (n+n) are
produced which will overwinter and begin the cycle the following growing season
23 PHYSIOLOGIC RACES AND VARIATION OF STEM RUST
Puccinia graminis f sp tritici is divided into physiologic races based on virulence
and avirulence specificities of isolates as related to a differential set of stem rust
resistance genes (Roelfs and Martens 1987) The differentials consist of five sets of
genes each comprised of four genes per set To discriminate races a letter code for
each set is assigned The specific pattern of high and the low infection type of genes
within each set determines the letter code with a higher letter indicating virulence to
more genes within the set
Host genotype and spatial scale can dramatically affect the population structure of
Pgt The cultivation of a wheat variety carrying a single major gene for resistance to
stem rust places an intense directional selection of existing avirulent Pgt genotypes
37
(Van der Plank 1968) In the case of major genes encoding for NB-LRR type
receptors that function in the detection of specific Pgt effector activity the selective
pressure on Pgt populations is for the loss of detection of effector activity which can
simply be achieved through allelic changes by mutation or recombination during the
sexual stage (McDonald and Linde 2002) As only Pgt genotypes carrying the loss of
avirulence are virulent on the host carrying the major resistance gene these genotypes
increases in frequency The result of this virulence shift is a widespread disease on the
newly-susceptible and widely cultivated variety As the frequency of virulence
increases in Pgt populations and epidemics worsen the susceptible variety is planted
on fewer acres usually replaced by a new variety with a different source of major
gene resistance thereby perpetuating the boom-and-bust cycle (Sun and Yang 1999)
Virulence shifts in Pgt populations take place during both sexual and asexual cycles
Sexual recombination allows the opportunity to bring virulence to multiple resistance
genes together in a single genotype The absence of the sexual cycle removes the
possibility of sexual recombination and most common genotypes of Pgt have lost the
ability to produce teliospores (Zambino et al 2000) The barberry eradication
program undertaken in the United States in the 20th
century served to limit the
diversity of Pgt populations by removing the impact of sexual reproduction and
limiting evolutionary potential The greatest diversity in aeciospore and urediniospore
collections from Minnesota is from prior the large-scale barberry eradication efforts
(Peterson et al 2005)
24 MECHANISMS OF STEM RUST RESISTANCE
Stem rust resistance genes generally operate under two mechanisms Of the
designated Sr genes 53 of them are single-locus major genes (McIntosh et al 1995)
conferring resistance at all stages of plant development sometimes with varying
effectiveness at the adult plant stage (Singh et al 2011a) Resistance can also be
quantitative conferred by multiple minor genes that individually contribute small
effects but together contribute significantly to the resistance phenotype (Poland et al
2008) In particular Sr2 and Sr55 confer quantitative adult plant resistance to stem
rust and are pleiotropic (McIntosh et al 1995 Krattinger et al 2009) conferring
resistance to other diseases such as leaf rust stripe rust and powdery mildew
38
The breeding methodology for developing wheat rust-resistant varieties varies greatly
but usually includes mass screening of (i) seedlings for their reaction to specific rust
pathotypes early in the breeding cycle and (ii) adult plants at a later date under field
conditions
241 Breeding for Hypersensitivity Response (HR)
Most of the resistance genes discovered and deployed in defence against the wheat
rusts are classified as major resistance genes also known as seedling resistance
vertical resistance all-stage resistance or race-specific resistance genes Major genes
confer effective levels of resistance against specific physiologic races of the pathogen
generally throughout the life cycle of the host In terms of disease phenotype major
resistance genes are often associated with a rapid programmed death of infected cells
a so-called lsquolsquohypersensitive responsersquorsquo (HR) thought to play a role in limiting the
expansion of biotrophic pathogens in the host tissue
The race-specific resistance genes are also known as lsquolsquoRrsquorsquo genes and follow the gene-
for-gene model (Flor 1956) Host resistance requires the simultaneous presence of the
resistance allele in the host and the corresponding avirulence allele in the pathogen A
race-specific ldquomajorrdquo gene can be easily deployed due to their large phenotypic
effects and hence are useful especially for short-term control options Routine
deployment of HR genes in combinations or pyramids has been less practical in the
past due to the small number of broadly effective genes available at any given time
and the lack of diagnostic markers needed to pyramid genes A first step in achieving
wheat lines with multiple sources of resistance is to have more genes at hand to work
with Stem rust resistance genes that are effective against Ug99 based on seedling
andor field testing (Singh et al 2011b) and have been tagged by molecular markers
include Sr2 (Mago et al 2011) Sr13 (Admassu et al 2011 Simons et al 2011) Sr22
(Olson et al 2010 Periyannan et al 2011) Sr25 (Liu et al 2010) Sr26 (Liu et al
2010) Sr32 (Bariana et al 2001) Sr33 (Sambasivam et al 2008) Sr35 (Zhang et al
2010) Sr39 (Mago et al 2009 Niu et al 2011) Sr40 (Wu et al 2009) Sr44 (Liu et
al 2012) Sr45 (Sambasivam et al 2008) Sr47 (Faris et al 2008) Sr50 (Anugrahwati
et al 2008) Sr51 (Liu et al 2011a) Sr52 (Qi et al 2011) Sr53 (Liu et al 2011b)
39
SrCad (Hiebert et al 2011) Sr57 (synonym Lr34Yr18) (Pumphrey et al 2012) and
SrWeb (Hiebert et al 2010)
Seedling reactions are assessed under controlled conditions on a 0 to 4 scale (Stakman
and Levine 1922 as reported by McIntosh et al 1995 Figure 2) Plants are
considered to be immune to the race used if the seedling leaf showed no reaction to
the rust (designated lsquo0rsquo) or there is only a slight clearing of the chlorophyll to produce
a fleck (designated as lsquorsquo) The seedling is classified as resistant when the reaction is a
small lesion surrounded by a necrotic area or by a halo of chlorosis These are
classified as lsquo1rsquo and lsquo2rsquo type reactions respectively The plant is predicted to be
susceptible if it produces a lsquo3rsquo (large healthy lesion surrounded by an area of
chlorosis) or lsquo4rsquo where the lesion is large and surrounded by little or no chlorosis A
mixed or mesothetic reaction may also be produced and designated as lsquoXrsquo This
methodology has been chosen as the heritability of rust resistance is quite high and it
is much more cost effective for screening the very large populations associated with
the early stages of the breeding cycle Also seedling screening for rust resistance can
readily and effectively be undertaken in the off season
The traditional emphasis on major gene resistance is understandable for many
reasons
1 Major genes are effective such genes have without question provided significant
economic benefits to wheat growers as illustrated by the decades-long protection
provided by the now defeated stem rust resistance gene Sr31
2 They are relatively easy to identify and deploy breeding for single-gene resistance is
much simpler than breeding for oligopolygenic resistance
3 They are historically easier to combine in the absence of clear additivity of the
resistance conferred by different genes and in the absence of good molecular markers
race-specific disease phenotypes facilitate the efficient introgression and stacking of
major genes using panels of different rust races
4 They provide clear levels of protection lsquolsquoresistancersquorsquo rather than lsquolsquotolerancersquorsquo has
long been held as an agronomic goal
Despite these clear historic advantages however major resistance genes frequently
lacked lsquolsquodurabilityrsquorsquo that is the ability of a widely deployed resistance gene to provide
40
an economic level of protection over an extended period of time (Johnson 1984)
Hence recent epidemics have reinvigorated interest within the wheat breeding and
research communities in partial resistance genes as sources of potentially more
durable resistance
242 Breeding for Adult Plant Resistance (APR)
Sources of resistance based on multiple genes often termed quantitative resistance
which delay infection and also growth and reproduction of the pathogen in adult
plants but not in seedlings have been described as lsquolsquoadult plant resistancersquorsquo (APR)
(Gustafson and Shaner 1982) The APR is usually more durable than resistance based
on single R genes and can be identified in cultivars with defeated or no race-specific
resistance genes In most countries especially developing countries that lack a
competitive seed sector variety turnover is slow which makes APR and durable
resistance particularly valuable for breeding purposes These are compelling reasons
for adopting an APR strategy in which wheat lines are by necessity bred for genetic
complexity of resistance The danger posed by inadequate monitoring of rapidly
mutating and migrating stem rust races further supports the APR approach Lastly the
use of resistance based on minor genes provides opportunities to other breeding
programs to utilize race-specific resistance and further enhance the diversity for
resistance in farmersrsquo fields
Sr2 is one of the best characterized APR genes that confer resistance to stem rust It is
arguably the most important stem rust resistance gene and is closely associated with
pseudo black chaff which offers a morphological marker for breeders working with
Sr2 Sr2 was introduced from Triticum turgidum into hexaploid wheat in the 1920s
and has remained durable since now (McIntosh et al 1995) Less is known about
other genes that contribute to adult plant resistance but widely used APR genes
Lr34Yr18 (recently designated Sr57) and Lr46Yr29 also contribute to stem rust APR
(Bhavani et al 2011) in bread wheat in combination with QTLs at other genomic
locations identified through biparental and association mapping (Bhavani et al 2011
Yu et al 2011) However early work by Knott and revisited by Singh indicates how
the accumulation of four or five minor effect genes can provide an almost perfect
immunity (Singh et al 2000 Figure 3)
41
APR is assessed under field conditions based upon severity (percentage of rust
infection on the plants Figure 4) and field response (type of disease reaction Figure
5) as described by Loegering (1966) Severity is recorded as a percentage according
to modified Cobb scale (Peterson et al 1948) This recording process relies upon
visual observations and it is common to use the following intervals Trace 5 10 20
40 60 100 infection Field response is recorded using the following letters
R = resistant visible chlorosis or necrosis no uredia are present
MR = moderately resistant small uredia are present and surrounded by either
chlorotic or necrotic areas
MS = moderately susceptible medium size uredia are present and possibly
surrounded by chlorotic areas
S = susceptible large uredia are present generally with little or no chlorosis and no
necrosis Severity and field response readings are usually combined
25 STEM RUST UG99 AND ITS IMPACT ON WHEAT PRODUCTION
Ug99 (Ug stands for Uganda and 99 for the year in which the race was named) more
formally known in the scientific literature as TTKSK (Jin et al 2007 2008) was
remarkable in that at the time of its discovery it was the only known race of P
graminis to overcome the race-specific stem rust resistant gene Sr31 after more than
30 years of widespread deployment leading to a wrong sense of ldquodurabilityrdquo
associated with this resistance gene Ug99 was uniquely virulent on Sr31 as well as
most of the resistance genes of wheat origin and other important genes found in
CIMMYT European North American and Australian wheat germplasm (Reynolds
and Borlaug 2006 Jin et al 2007) (Table 1) Today the area under immediate threat
along the projected migration pathway in North Africa the Middle East and Asia
(excluding China) amounts to 50 million hectares of wheat ie approximately 25 of
the worldrsquos wheat area responsible for 19 of global wheat production (Reynolds and
Borlaug 2006) An epidemic in this region would have a serious impact on the 1
billion people living within this zone Subsequent estimates warned that over 90 of
the worldrsquos wheat varieties are at risk imposed by Ug99 (Singh et al 2006)
42
251 Distribution of Ug99 lineages
There is some evidence that Ug99 may have been present in Kenya as early as 1993
prior to its identification in Uganda (Davidson et al 2012) By 2001 its presence was
confirmed in Kenya where it is now epidemic In 2003 it was widely reported in
Ethiopia and was poised to move across the Red Sea to the Arabian Peninsula and
beyond to the worldrsquos breadbasket in South Asia That jump happened in 2006 when
virulence to Sr31 was identified in Yemen By 2007 it was carried into Iran
apparently by a tropical storm To date there are no reports that the pathogen has
moved further into South Asia However the Ug99 family has also moved south
from Kenya and is now present as far as South Africa Other countries where Ug99 is
present are Eritrea Sudan Tanzania Mozambique and Zimbabwe totalling 11
countries The pathogen is not only moving but it is evolving overcoming additional
stem rust resistance genes across the eastern areas of Africa In total the Ug99 family
now has eight members (Hodson and Nazari 2012) Surveillance data indicate that
Ug99 variants with combined virulence to Sr31 and Sr24 are spreading rapidly An
update of the occurrence of the Ug99 family was compiled by Hodson and Nazari
(2012) and is reproduced in Figure 6
43
26 LITERATURE CITED
Admassu B Perovic D Friedt W Ordon F (2011) Genetic mapping of the stem rust
(Puccinia graminis f sp tritici Eriks amp E Henn) resistance gene Sr13 in
wheat (Triticum aestivum L) Theor Appl Genet 122 643-6
Anikster Y Eilam T Mittelman L Szabo LJ and Bushnell WR (1999) Pycnial nectar
of rust fungi induces cap formation on pycniospores of opposite mating type
Mycologia 91 858-870
Anugrahwati DR Shepherd KW Verlin DC Zhang P Mirzaghaderi G Walker E
Francki MG Dundas IS (2008) Isolation of wheat-rye 1RS recombinants that
break the linkage between the stem rust resistance gene SrR and secalin
Genome 51 341-349
Bariana HS Hayden MJ Ahmed NU Bell JA Sharp PJ McIntosh RA (2001)
Mapping of durable adult plant and seedling resistances to stripe rust and stem
rust diseases in wheat Aust J Agric Res 521247-1255
Bhavani S Singh RP Argillier O Huerta-Espino J Singh S Njau P Brun S Lacam S
Desmouceaux N (2011) Mapping durable adult plant stem rust resistance to
the race Ug99 group in six CIMMYT wheats In McIntosh RA (ed) BGRI
2011 Technical Workshop Borlaug Global Rust Initiative St Paul MN USA
pp 43-53
Boehm EWA Wenstrom JC McLaughlin DJ Szabo LJ Roelfs AP Bushnell WR
(1992) An ultrastructural pachytene karyotype for Puccinia graminis f sp
tritici Canadian Journal of Botany-Revue Canadienne de Botanique 70 401-
413
Davdson SE Singh RP Coffman R and Pumphrey M (2012) The Borlaug Global Rust
Initiative Reducing the genetic vulnerability of wheat to rust Gen Res Crop
Evol (In press)
Faris JD Xu SS Cai XW Friesen TL Jin Y (2008) Molecular and cytogenetic
characterization of a durum wheat-Aegilops speltoides chromosome
translocation conferring resistance to stem rust Chromosome Res 16 1097-
1105
Flor HH (1956) The complementary genic systems in flax and flax rust Adv Genet
8 29-54
Gustafson GD Shaner G (1982) Influence of plant age on the expression of slow
44
mildewing resistance in wheat Phytopathol 72 746-749
Harjes CE Rocheford TR Bai L Brutnell TP Kandianis CB Sowinski SG Stapleton
AE Vallabhaneni R Williams M Wurtzel ET Yan J Buckler ES (2008)
Natural genetic variation in lycopene epsilon cyclase tapped for maize
biofortification Science 319 330-333
Hiebert CW Fetch TG Zegeye T (2010) Genetics and mapping of stem rust resistance
to Ug99 in the wheat cultivar Webster Theor Appl Genet 121 65-69
Hiebert CW Fetch TG Zegeye T Thomas JB Somers DJ Humphreys DG
McCallum BD Cloutier S Singh D Knott DR (2011) Genetics and mapping
of seedling resistance to Ug99 stem rust in Canadian wheat cultivars Peace
and AC Cadillac Theor Appl Genet 122 143-149
Hodson D and Nazari K (2012) Rust bowl or breadbasket Keeping track of wheat
rust pathogens in Africa International Conference on lsquoWheat for food security
in Africarsquo Science and policy dialogue about the future of wheat in Africa
October 8-12 2012 Addis Ababa Ethiopia
Jin Y Pretorius ZA Singh RP (2007) New virulence within race TTKS (Ug99) of the
stem rust pathogen and effective resistance genes Phytopathol97 S137-S137
Jin Y Szabo LJ Pretorius ZA Singh RP Ward R Fetch T (2008) Detection of
virulence to resistance gene Sr24 within race TTKS of Puccinia graminis f sp
tritici Plant Disease 92 923-926
Johnson R (1984) A critical analysis of durable resistance Annu Rev Phytopathol
22 309-330
Krattinger SG Lagudah ES Spielmeyer W Singh RP Huerta-Espino J McFadden H
Bossolini E Selter LL and Keller B (2009) A putative ABC transporter confers
durable resistance to multiple fungal pathogens in wheat Science 323 1360-
1363
Leonard KJ and Szabo LJ (2005) Stem rust of small grains and grasses caused by
Puccinia graminis Molecular Plant Pathol 6 99-111
Liu SX Yu LX Singh RP Jin Y Sorrells ME Anderson JA (2010) Diagnostic and co-
dominant PCR markers for wheat stem rust resistance genes Sr25 and Sr26
Theor Appl Genet 120 691-697
Liu WX Jin Y Rouse M Friebe B Gill B Pumphrey MO (2011a) Development and
characterization of wheat-Aesearsii Robertsonian translocations and a
recombinant chromosome conferring resistance to stem rust Theor Appl
45
Genet 122 1537-1545
Liu WX Rouse M Friebe B Jin Y Gill B Pumphrey MO (2011b) Discovery and
molecular mapping of a new gene conferring resistance to stem rust Sr53
derived from Aegilops geniculata and characterization of spontaneous
translocation stocks with reduced alien chromatin Chromosome Res 19 669-
682
Liu WX Danivola TV Rouse MN Bowden RL Friebe B Gill BS Pumphrey MO
(2013) Development and characterization of a compensating wheat-
Thinopyrum intermedium Robertsonian translocation with Sr44 resistance to
stem rust (Ug99) Theor Appl Gen (In press)
Loegering WQ (1966) The relationship between host and pathogen in stem rust of
wheat Proc 2nd
Int Wheat Genetics Symp Lund 1963 Hereditas supp 2
167-177
Mago R Zhang P Bariana HS Verlin DC Bansal UK Ellis JG Dundas IS (2009)
Development of wheat lines carrying stem rust resistance gene Sr39 with
reduced Aegilops speltoides chromatin and simple PCR markers for marker-
assisted selection Theor Appl Genet 119 1441-1450
Mago R Brown-Guedira G Dreisigacker S Breen J Jin Y Singh R Appels R
Lagudah ES Ellis J Spielmeyer W (2011) An accurate DNA marker assay for
stem rust resistance gene Sr2 in wheat Theor Appl Genet 122 735-744
McDonald BA and Linde C (2002) Pathogen population genetics evolutionary
potential and durable resistance Annu Revof Phytopathol 40 349-379
McIntosh RA Wellings CR Park RF (1995) Wheat Rusts an Atlas of Resistance
Genes CSIRO Publications Victoria Australia
Niu ZX Klindworth DL Friesen TL Chao SM Jin Y Cai XW Xu SS (2011)
Targeted Introgression of a Wheat Stem Rust Resistance Gene by DNA
Marker-Assisted Chromosome Engineering Genetics 187 1011-1068
Olson EL Brown-Guedira G Marshall D Stack E Bowden RL Jin Y Rouse M
Pumphrey MO (2010) Development of Wheat Lines Having a Small
Introgressed Segment Carrying Stem Rust Resistance Gene Sr22 Crop Sci
50 1823-1830
Periyannan SK Bansal UK Bariana HS Pumphrey M Lagudah ES (2011) A robust
molecular marker for the detection of shortened introgressed segment carrying
the stem rust resistance gene Sr22 in common wheat Theor Appl Genet 122
46
1-7
Peterson RF Campbell AB Hannah AE (1948) A diagrammatic scale for estimating
rust intensity of leaves and stem of cereals Can J Res Sect C 26 496-500
Peterson PD Leonard KJ Pathology P Paul S Roelfs AP and De US (2005) Effect of
Barberry Eradication on Changes in Populations of Puccinia graminis in
Minnesota Plant Dis 89 935-940
Poland JA Balint-kurti PJ Wisser RJ Pratt RC and Nelson RJ (2008) Shades of gray
The world of quantitative disease resistance Trends in Plant Sci 14 21-29
Pumphrey MO (2012) Stocking the Breedersrsquos toolbox an update on the status of
resistance to stem rust in wheat In Proceedings of BGRI 2012 Technical
Workshop ed R McIntosh Beijing China September 1-4 pp 23-29
Qi LL Pumphrey MO Friebe B Zhang P Qian C Bowden RL Rouse MN Jin Y
Gill BS (2011) A novel Robertsonian translocation event leads to transfer of a
stem rust resistance gene (Sr52) effective against race Ug99 from Dasypyrum
villosum into bread wheat Theor Appl Genet 123 159-167
Reynolds MP Borlaug NE (2006) Applying innovations and new technologies for
international collaborative wheat improvement J Agric Sci 144 95-110
Roelfs A (1985) Wheat and rye stem rust In Roelfs A Bushnell W (eds) The
Cereal Rusts Vol 2 Academic Press Orlando FL pp 3-37
Roelfs AP Martens JW (1987) An International System of Nomenclature for Puccinia
graminis fsp tritici Phytopathol 78 526-533
Roelfs AP Singh RP Saari EE (1992) Rust diseases of wheat concepts and methods
of disease management CIMMYT Mexico DF
Sambasivam PK Bansal UK Hayden MJ Dvorak J Lagudah ES Bariana HS (2008)
Identification of markers linked with stem rust resistance genes Sr33 and Sr45
Proceedings of the 11th
International Wheat Genetics Symposium Brisbane
Australia
Simons K Abate Z Chao SM Zhang WJ Rouse M Jin Y Elias E Dubcovsky J
(2011) Genetic mapping of stem rust resistance gene Sr13 in tetraploid wheat
(Triticum turgidum ssp durum L) Theor Appl Genet 122 649-658
Singh RP Huerta-Espino J Rajaram S (2000) Achieving near-immunity to leaf and
stripe rusts in wheat by combining slow rusting resistance genes Acta
Phytopathologica et Entomologica Hungarica 35133-139
Singh RP Hodson DP Jin Y Huerta-Espino J Kinyua M Wanyera R Njau P Ward R
47
(2006) Current Status likely migration and strategies to mitigate the threat to
wheat production from race Ug99 (TTKS) of stem rust pathogen CAB
Reviews Perspectives in Agriculture Veterinary Science Nutrition and
Natural Resources 1 1-13
Singh RP Hodson DP Huerta-Espino J Jin Y Bhavani S Njau P Herrera-Foessel S
Singh PK Singh S Govindan V (2011a) The Emergence of Ug99 Races of the
Stem Rust Fungus is a Threat to World Wheat Production In VanAlfen NK
Bruening G Leach JE (eds) Annu Rev Phytopathol 49 465-81
Singh RP Huerta-Espino J Bhavani S Herrera-Foessel S Jin Y Njau P Velu G
Singh S Pentildea RJ Crossa J (2011b) High yielding CIMMYT spring wheats
with resistance to Ug99 and other rusts developed through targeted breeding
In McIntosh RA (ed) BGRI 2011 Technical Workshop Borlaug Global Rust
Initiative St Paul MN USA pp 98-104
Stakman EC Levine MN (1922) The determination of biologic forms of Puccinia
gamninis on Triticum spp Minn Agric Exp Stn Tech BUll pp 8
Sun P and Yang X (1999) Two properties of a gene-for-gene co-evolution system
under human perturbations Phytopathol 89 811-816
Van der Plank J (1968) Disease resistance in plants Academic Press New York NY
Wu SY Pumphrey M Bai GH (2009) Molecular Mapping of Stem-Rust-Resistance
Gene Sr40 in Wheat Crop Sci 49 1681-1686
Yu LX Lorenz A Rutkoski J Singh RP Bhavani S Huerta-Espino J Sorrells ME
(2011) Association mapping and gene-gene interaction for stem rust resistance
in CIMMYT spring wheat germplasm Theor Appl Genet 123 1257-1268
Zambino P Kubelik A Szabo L (2000) Gene action and linkage of avirulence genes
to DNA markers in the rust fungus Puccinia graminis Phytopathol 90 819-
826
Zhang WJ Olson E Saintenac C Rouse M Abate Z Jin Y Akhunov E Pumphrey M
Dubcovsky J (2010) Genetic Maps of Stem Rust Resistance Gene Sr35 in
Diploid and Hexaploid Wheat Crop Sci 50 2464-2474
48
FIGURES
49
Figure 1 Life and disease cycles for Puccinia graminis fsp tritici (wheat stem rust)
(Roelfs et al1992)
50
--------------------------Resistant--------------------------------Susceptible =
Figure 2 Seedling scoring of infection types on wheat differential using 0-4
evaluation scale Photo credit R F Park
51
Figure 3 Effect of accumulating a different number of minor genes in wheat cultivar
in reducing the level of disease infection (Adapted from Singh et al 2010)
52
Figure 4 Stem rust severity scores (From Rust scoring guide booklet)
53
Figure 5 Adult plant field responses to stem rust disease (From Rust scoring guide
booklet)
54
Figure 6 Distribution of Ug99 and its lineages (Hodson and Nazari 2012)
55
TABLE
56
Table 1 Origin and Sr genes in conferring seedling andor adult plant resistance to
Puccinia graminis f sp tritici races belonging to the Ug99 lineage
Origin of Sr genes
Stem rust resistance (Sr) genes
Ineffective Effective
Triticum aestivum 5 6 7a 7b 8a 8b 9a 9b
9f 10 15 16 18 19 20
23 30 41 42 49 McN
Wid-1
28a 29
bc 48 Tmp
a
AC-Cadillac Sha7b
Huw234b ND643
b
Triticum turgidum 9d 9e 9g 11 12 17 2b 13
ab 14
a
Triticum monococcum 21 22 35
Triticum timopheevi 36 37c
Aegilops speltoides - 32c 39
c 47
d
Aegilops tauschii - 33b 45
ab 46
ad
Triticum comosum 34 -
Triticum ventricosum 38 -
Triticum urarticum - 40c
Thinopyrum elongatum 24 25a 26 43
c
Thinopyrum intermedium - 44c
Secale cereale 31 27a 50 1A1R
ab
a Virulence for the gene is known to occur in other races
b Level of resistance conferred in the field usually inadequate under high disease
pressure
c Unsuitable for utilization due to linkage with undesirable traits in the translocation
(adapted from Singh et al 2011a)
57
CHAPTER 3 RESEARCH AIMS
Stem rust continues to cause huge losses worldwide in wheat production due to
reliance on cultivars with narrow genetic basis for resistance and the high level of
virulence variation in stem rust pathogens Therefore successful breeding relies on
the identification of new resistance sources via gene mapping and incorporation of
these resistance sources into breeding lines to release new resistant varieties
Furthermore it is useful to identify stem rust resistance genes against highly virulent
races of stem rust in durum wheat germplasm in order to increase the possibilities of
broadening the genetic base of resistance by crossing elite varieties of durum wheat
Hence the objectives of this study were
1 To survey virulence of stem rust races TRTTF TTTTF TTKSK (Ug99) and
JRCQC in a set of durum wheat accessions suitable for an association mapping
approach in order to identify genomic regions associated to seedling-based
resistance to these virulent races of stem rust
2 To evaluate the same set of durum wheat accessions under field conditions at an
adult plant growth stage in order to identify genomic regions associated to field-
based resistance to the combination of Ug99 with Ethiopian races of stem rust
58
CHAPTER 4 SEARCHING FOR NOVEL SOURCES OF FIELD
RESISTANCE TO UG99 AND ETHIOPIAN STEM RUST RACES IN DURUM
WHEAT VIA ASSOCIATION MAPPING
Tesfaye Letta14
Marco Maccaferri1 Ayele Badebo
2 Karim Ammar
3 Andrea Ricci
1
Jose Crossa3 Roberto Tuberosa
1
Pulished on Theoretical and Applied Genetics (2013) DOI 101007s00122-013-
2050-8
1 DiSTA University of Bologna Viale Fanin 44 40127 Bologna Italy
2 Debre Zeit Agricultural Research Center Debre Zeit Ethiopia
3 CIMMYT Int Apdo Postal 6-641 Mexico DF Mexico 06600
4 Sinana Agricultural Research Center Bale-Robe Ethiopia
41 ABSTRACT
Puccinia graminis f sp tritici the causative agent of stem rust in wheat is a
devastating disease of durum wheat While more than 50 stem rust resistance (Sr) loci
have been identified in wheat only a few of them remained effective against Ug99
and other durum-specific Ethiopian races An association mapping (AM) approach
based on 183 diverse durum wheat accessions was utilized to identify resistance loci
for stem rust response in Ethiopia over four field-evaluation seasons and artificial
inoculation with Ug99 (TTKSK race) and a mixture of durum-specific races The
panel was profiled with simple sequence repeat diversity array technology and
sequence tagged site markers (1253 markers) The resistance turned out to be
oligogenic with twelve QTL-tagging markers that were significant (P lt 005) across
three to four seasons R2 values ranged from 11 to 113 Twenty-four additional
single markerQTL regions were found to be significant over two seasons The AM
results confirmed the role of Sr13 previously described in bi-parental mapping
studies and the role of chromosome regions putatively harboring Sr9 Sr14 Sr17 and
Sr28 Three minor QTLs were coincident with those reported in hexaploid wheat and
five overlapped with those recently reported in the Sebatel times Kristal durum mapping
population Thirteen single markerQTL regions were located in chromosome regions
where no Sr genesQTLs have been previously reported The allelic variation
identified in this study is readily available and can be exploited for marker-assisted
selection thus providing additional opportunities for a more durable stem rust
resistance under field conditions
59
42 INTRODUCTION
Durum wheat (Triticum durum Desf) is an important crop in the Mediterranean
Basin a region accounting for approximately 75 of global worldwide production
(Belaid 2000 Habash et al 2009) In Sub-Saharan Africa Ethiopia is the largest
wheat-growing country and is considered one of the centers of diversity for tetraploid
wheat (Vavilov 1929 1951) Durum wheat is grown on approximately 40 of the
total wheat area in Ethiopia with a tendency to increase due to the growing internal
demand for pasta products (Badebo et al 2009) Among the factors that negatively
affect durum production and kernel quality rust diseases play an important role
(Singh et al 2005) Historically stem rust infections due to Puccinia graminis Pers f
sp tritici have caused severe losses to wheat production (Zwer et al 1992 McIntosh
and Brown 1997 Eversmeyer and Kramer 2000 Singh et al 2011) Until the
appearance of Ug99 stem rust control through the use of genetic resistance was
considered a remarkable success story worldwide Although more than 50 stem rust
resistance (Sr) loci have been identified in wheat (Singh et al 2006) including those
introgressed from its wild relatives only a few remain effective against Ug99 or its
variants and even fewer are useful against the durum-specific Ethiopian races
(Admassu et al 2009) Susceptibility in some CIMMYT-derived germplasm was first
noted in Uganda (Pretorius et al 2000) and soon after was observed in all germplasm
groups This new race designated as Ug99 or TTKS (Wanyera et al 2006) spread to
Kenya in 2001 and to Ethiopia in 2003 (Singh et al 2006) By 2006 TTKS was
identified in Sudan and Yemen (httpwwwfaoorg) and in 2008 its presence was
confirmed in Iran (Nazari et al 2009) Ug99 is projected to spread further into the
major wheat growing regions of Asia (Singh et al 2008) In Ethiopia Ug99 and its
variants were added to previously existing races the latter specifically virulent on
durum wheat Two such races have been characterized as TRTTF and JRCQC with a
combined virulence to Sr9e and Sr13 two genes present at high frequency in the
durum wheat germplasm (Olivera et al 2012) These races are predominant in durum-
growing areas of Ethiopia and effective resistance to them (52 of the lines tested)
was found in a collection of 996 tetraploid genotypes evaluated for field resistance at
the Debre-Zeit Research Station in Ethiopia in 2009 (Olivera et al 2010) Therefore
the combination of Ug99 + Sr13-virulent Ethiopian races currently poses a major
threat to durum wheat production in Ethiopia and represents a tangible potential
60
danger elsewhere should these virulent races reach distant durum-growing areas such
as central India where conditions are known to be conducive to the epidemic
development of this pathogen Three different races from the TTKS or Ug99 lineage
were identified in Kenya which led to the re-designation of the original race as
TTKSK and the other two races as TTKST (with additional virulence on Sr24) (Jin et
al 2008) and TTTSK (with additional virulence on Sr36) (Jin et al 2009) The
effectiveness and durability of the genetic resistance approach to control the disease
require the availability of many sources of resistance preferably involving genes that
act on adult plant field resistance to counter the continuing evolution of new
virulence in pathogen populations
Selecting for the resistant phenotypes conferred by major race-specific loci are
relatively straightforward and initially rewarding though eventually becomes
ineffective due to the fast evolution and selection of virulent strains of the pathogen
as seen with Ug99 Although a number of resistance genes have been introgressed
into cultivated wheat from wild relatives (Ceoloni et al 2005 Feuillet et al 2008) the
successful utilization of such materials has often been hampered by the inherent
difficulties of operating with alien genomes
Marker-based approaches allow us to identify genesquantitative trait loci (QTL)
governing plant response to diseases The effective deployment of stem rust resistance
alleles from different sources requires a thorough genetic characterization of the
available germplasm The standard approach is to use bi-parental mapping
populations to relate phenotypic information to genotypic data obtained from
molecular markers in order to determine the number and the chromosomal location of
resistance loci (Gupta et al 1999 Maccaferri et al 2008 Simons et al 2011) An
alternative to the use of bi-parental mapping is association mapping (AM) or linkage
disequilibrium (LD -based mapping in which genotype-phenotype relationships are
explored in germplasm collections or natural populations (Rafalski 2002 2011 Flint-
Garcia et al 2003) The underlying principle of this approach is that LD tends to be
maintained over many generations between loci that are genetically linked With AM
statistical assessments are made for associations between genotypes based on
molecular markers and phenotypes for various traits in reference germplasm sets
(Buntjer et al 2005) Since its first use in plants a decade ago (Thornsberry et al
61
2001) AM has been used in many important crops thanks to advances in high-
throughput genotyping technologies increased interest in identifying useful andor
novel alleles and improvements in statistical methods (Gupta et al 2005 Yu et al
2006 Zhu et al 2008) In both tetraploid and hexaploid wheat AM has already
proven to be an effective strategy to identify marker-trait associations for
agronomically valuable traits (Breseghello and Sorrells 2006 Crossa et al 2007
Maccaferri et al 2010 2011) including resistance to stem rust (Yu et al 2011)
Stagonospora nodorum Blotch (Tommasini et al 2007) Fusarium head blight
(Miedaner et al 2011) in bread wheat and leaf rust (Maccaferri et al 2010) and
SBMCV (Maccaferri et al 2011) in durum wheat
The objective of this study was to evaluate a panel of durum wheat accessions well-
suited for AM studies (Maccaferri et al 2006 2010 2011) in order to identify
genomic regions associated to field-based resistance to the combination of Ug99 with
Ethiopian races of stem rust
43 MATERIALS AND METHODS
431 Plant materials
A collection of 183 elite durum genotypes including cultivars released or breeding
lines developed in Italy Morocco Spain Syria Tunisia Southwestern USA and
Mexico was assembled to represent different spring durum germplasm groups
(Appendix 1) The genotypes included in the AM panel were chosen from a larger
pool of 330 accessions obtained from various sources and evaluated in a field trial in
2003 in Cadriano near Bologna Italy (Maccaferri et al 2006) The accessions of this
panel were chosen based on their pedigrees and morpho-physiological traits critical to
adaptation such as plant height and heading date Highly related accessions (eg sibs
from the same cross backcross lines etc) andor with excessively large differences in
heading date a feature that could have biased the phenotypic evaluation of traits
influenced by flowering time were excluded Most of the accessions were semi-
dwarf short- to medium-cycle elite cultivars and breeding lines released from the
early lsquo70s up to the late lsquo90s The collection comprises also lsquofounder genotypesrsquo
widely used as parents in breeding programs throughout the Mediterranean Basin and
62
at International CGIAR Centers (CIMMYT and ICARDA) The accessions were
assembled for conducting AM studies and are hitherto collectively referred to as the
lsquoAM durum panelrsquo A detailed phenotypic and molecular characterization of the panel
was previously reported in Maccaferri et al (2006 and 2010) Briefly the panel
included accessions belonging to one of five main population subgroups accessions
from ICARDA bred for the dryland areas (subgroup 1) from ICARDA bred for
temperate areas (subgroup 2) from the Italian and early rsquo70 CIMMYT breeding
programs (subgroup 3) from CIMMYT in the late rsquo70s-early rsquo80s (subgroup 4) and
from CIMMYT in the late rsquo80s-early rsquo90s (subgroup 5) As compared to the panel of
accessions described in Maccaferri et al (2010) 25 accessions were dropped due to
their relatively high relatedness while 19 additional accessions from the CIMMYT
breeding programs mainly classified as belonging to subgroup 5 were added to the
panel Based on their molecular profiles the accessions clustered into the five
subgroups with balanced frequencies
432 Stem rust response evaluation under field conditions
Field experiments were conducted in Ethiopia at the Debre-Zeit Agricultural Research
Center (DZARC) located at an altitude of approximately 1900 m above sea level
with latitude of 80 44rsquo N and longitude of 38
0 85rsquo E DZARC is a hot spot for wheat
stem rust during the main cropping season (July to November) as well as during the
off-season (mid-January to May) if irrigation is provided to ensure proper plant
development DZARC has been identified as an international durum wheat screening
site as part of the Borlaug Global Rust Initiative
The AM durum panel was evaluated during four consecutive growing seasons in 2009
and 2010 In both years the evaluation was carried out both in the off-season under
supplementary irrigation and in the main season under rain-fed conditions The off-
season is warmer than the main season and as a result stem rust disease pressure is
often higher than in the main season depending on the moisture availability for
disease development The accessions were evaluated in non-replicated field trials
using an augmented design with plots consisting of 1-m-long twin rows flanked by
spreader rows that were sown with a seed mixture of PBW343 Morocco (bread wheat
susceptible to Ug99) and Local Red or Arendeto (susceptible durum) accessions in
63
211 proportion respectively Spreader rows were artificially inoculated with Ug99
(TTKSK race) and a mixture of durum-specific races prevalent in Ethiopia The Ug99
(TTKSK) stem rust race was isolated and maintained on the variety PBW343 under
greenhouse conditions Race purity was regularly checked on the North American
stem rust differential lines Additionally bulk spores were collected directly from the
durum wheat nurseries in the field and temporarily stored at 4 oC after drying Field
inoculation was carried out following the methodology described in Roelfs et al
(1992) Inoculation was carried out on spreader rows starting at stem elongation
growth stage and was repeated two-three times at weekly intervals The cultural
practices including fertilizer weeds and insect control were applied according to the
local site recommendations
Stem rust disease severity was recorded two to three times during the epidemics
development using a modified Cobbrsquos scale (Peterson et al 1948) Disease severity
score (DSS) was calculated as the percentage of the infected stem area covered with
pustules (visually estimated over the whole canopy) at the same time the major
infection type was also recorded (Roelfs et al 1992) Infection types were categorized
into four discrete classes resistant (R) moderately resistant (MR) moderately
susceptible (MS) and susceptible (S) The DSS and the corresponding infection types
were used to compute the values of the Coefficients of Infection (Stubbs et al 1986)
For each evaluation season the terminal disease severity at the soft-dough stage
(Zadoks scale 85 Zadoks et al 1974) in coincidence with the peak of disease
severity was considered as the most informative disease score and was therefore used
to carry out the molecular-phenotype association tests
433 Molecular profiling
A bulk of 25 seeds from the original pure stock of each accession was germinated and
grown in a growth chamber at 20 oC After 2 weeks seedling leaves were collected
freeze-dried ground and used for genomic DNA extraction as previously described in
Maccaferri et al (2010) The accessions were profiled with 350 simple sequence
repeat loci (SSR) 900 Diversity Array Technology (DArT) markers and three
additional sequence tagged site (STS) markers including those previously reported as
markers associated to major stem rust resistance genes (Yu et al 2010)
64
434 SSR and STS markers
The SSR primers were chosen among the publicly available sets catalogued in the
GrainGenes database (httpwheatpwusdagov) as BARC (barc marker loci) CFA
CFD and GPW from INRA (cfa cfd and gpw respectively) KSUM (ksum) WMC
(wmc) and WMS (gwm) an additional subset of private genomic WMS primers from
TraitGenetics (supplied by M Ganal TraitGenetics Gatersleben Germany) were also
considered The SSR loci used to genotype the accessions were preselected for (i)
clarity and repeatability of the amplicons profile (ii) polymorphism level and (iii)
even distribution on all the A- and B-genome chromosomes (chrs) The choice was
carried out based on the results of a survey of SSR primer pairs conducted on a small
subset of eight founder accessions and lines used as parents of mapping populations
As described in Maccaferri et al (2008) a unique thermo-cycling protocol was used
for all primer sets and SSR profiles of the accessions were obtained using the
automated LI-COR 4200 IR2 System (LiCor Lincoln NE USA) Genotyping was
performed for most SSR markers using the M13-labeled primers and amplification
protocol (Schuelke 2000) Alleles were scored using founder genotypes as an allele
reference set Most markers produced only one band assigned to a unique wheat
chromosome in previous mapping studies For SSR primer pairs amplifying two or
more loci each locus was independently scored and assigned to the respective linkage
group based on either the score of the parental lines or the LD with adjacent markers
435 DArT markers
In addition to SSR and STS markers the panel was profiled with DArT markers
DArT markers were generated by Triticarte Pty Ltd (Canberra Australia http
wwwtriticartecomau) a whole-genome profiling service company as described by
Akbari et al (2006) The Durum wheat PstI TaqI array v 20 containing 7600 single
DArT clones obtained as described in Mantovani et al (2008) was used for
genotyping the panel The locus designation used by Triticarte Pty Ltd was adopted
(lsquowPtrsquo lsquorPtrsquo and lsquotPtrsquo loci corresponding to wheat rye and triticale clones
65
respectively) and alleles at polymorphic loci were scored as hybridization positive (1)
or negative (0)
436 Construction of the consensus map
The majority of the SSR markers considered herein were previously mapped in five
intra-specific durum recombinant inbred line (RIL)-based linkage maps whose
genotypic data were used to obtain a consensus durum wheat specific-linkage map
Four mapping populations ie Kofa times Svevo (KS RIL population Maccaferri et al
2008) Colosseo times Lloyd (CL RIL Mantovani et al 2008) Meridiano times Claudio (MC
RIL Maccaferri et al 2011) and Simeto times Levante (SL RIL Maccaferri et al
unpublished) were developed by DiSTA in collaboration with Produttori Sementi
Bologna SpA (Argelato BO Italy) a fifth linkage map obtained from the cross Kofa
times UC1113 (KU RIL population Zhang et al 2008) was considered for consensus
mapping and the genotypic data were downloaded from the GrainGenes web
database
The consensus linkage map was obtained from the five datasets using the Carthagene
v40 software (de Givry et al 2005) Merging was performed with the dsmergen
command after checking for marker order consistency across maps so that for each
marker pair a single recombination rate was estimated based on all available meioses
A framework-mapping method was applied Non-framework markers were
incorporated in the framework map by building a complete map using the framework
map as a fixed order The marker order and inter-marker genetic distances from the
consensus map were used to report the LD and association results The consensus map
included a total of 2031 markers (mostly SSR and DArT markers) Of those 861 had
genotypic scores available in the durum accessions (320 SSRs 3 STSs and 538 DArT
markers)
437 Association mapping
For association mapping analysis only markers with non-rare alleles (allelic
frequencies greater than 010) were considered for the LD and marker-trait association
analyses thus reducing the false-positive rate and the LD inflation effects that have
66
frequently been associated with the consideration of rare alleles (Myles et al 2009)
Similarly to rare alleles data-points showing residual allelic heterogeneity within
accession were considered as missing data In total 1211 markers were used for
marker-phenotype association tests Among these 320 SSRs 3 STSs and 538 DArT
markers were projected onto the consensus linkage map The remaining 332
polymorphic and informative DArT markers and 18 SSRs that could not be integrated
into the final map were not considered further
438 Genetic structure and linkage disequilibrium analysis
Prior knowledge suggested the presence of significant population structure in the
panel To decrease the false-positive rate this structure was accounted for in the
association test models The genetic structure of the panel has been investigated with
a combination of model- and distance-based analyses Model-based population
structure using a selection of 96 loosely linked highly informative and evenly spread
SSRs was assessed using the program STRUCTURE v 2 (Pritchard et al 2000)
Structure parameter settings were linkage model allele frequencies correlated burn-
in length 10000 and 10000 MCMC repetitions An optimum number of five
hypothetical subgroups were chosen to obtain the Q matrix of membership
coefficients of each accession to all subgroups (for details see Maccaferri et al 2011)
In the distance-based analysis pairwise genetic similarity values (GSij) were
calculated for all possible pairs of accessions using the simple matching coefficient
for multi-state markers a co-ancestry K (kinship) matrix was thus obtained for SSRs
(for details see Maccaferri et al 2010) Similarly the kinship matrix was also
calculated for DArT markers separately
Estimating LD between markers measures whether markers segregate independently
or not The program TASSEL ver 21 (www maizegeneticsnet Yu et al 2006) was
used to estimate the LD parameters Drsquo and r2 values as a function of the
corresponding inter-marker distances and the comparison-wise significance was
computed with 10000 permutations The r2 parameter was estimated for loci on the
same chromosome and compared based on genetic distances measured in cM If
within a chr region all pairs of adjacent loci were in LD this region was referred to
as an LD block (Stich et al 2005)
67
439 Marker-phenotype association analysis
Genome-wide scans for AM of loci governing stem rust resistance were conducted
using the coefficient of infection (CI) as reference phenotypic data AM analysis was
conducted using the TASSEL program ver 21 The 320 SSRs 3 STSs and the 538
DArT markers were tested for significance of marker-trait associations under (1) the
fixed general linear model (GLM) including the Q population structure results as
covariates (Q GLM) (2) the mixed linear model (MLM) including the Q population
structure results plus the K kinship matrix (Q + K MLM) For GLM analysis besides
the marker-wise association probability values the experiment-wise association
significance probability was obtained based on a permutation test implemented in
TASSEL (10000 permutations in total) The experiment-wise test provides a much
more severe threshold for significance as compared to the marker-wise test (Bradbury
et al 2007 2011) In the MLM analysis experiment-wise significance was inspected
using the false discovery rate (FDR) approach according to Storey and Tibshirani
(2003) and implemented in Qvalue program Multiple adjacent co-segregating
significant markers were assigned to a unique QTL region upon satisfaction of the
following conditions less than 20 cM of inter-marker genetic distance the presence
of significant and strong LD among markers (possibly with r2 values ge 06)
consistency of the marker allelic effects in sign (Massman et al 2011)
Prior to analyzing the phenotype data the homogeneity of experimental variance
across experiments was verified through the Bartlettrsquos test Chr regions with markers
that were repeatedly associated to stem rust response over two or more seasons as
well as using the mean data averaged across seasons were considered as putative
QTLs even though the experiment-wise significance threshold was not reached For
each putative QTL the most significant marker associated to stem rust response was
considered as the main QTL-tagging marker further results on the allelic distribution
and effects have been reported for the QTL-tagging markers only Linear regression
was used to investigate the fit of the accessionsrsquo haplotypes at the main QTLs
(significant over three to four seasons) to the corresponding phenotypic responses
(CIs averaged across seasons) Based on the results of the GLM and MLM tests the
non-rare alleles at the QTL-tagging markers significant over three to four seasons
68
were qualitatively classified as beneficial intermediate or deleterious and the
cumulative number of beneficial and deleterious alleles was counted for each
accession The accessionsrsquo disease response averaged across the four seasons was
regressed on the cumulative numbers of both beneficial and deleterious alleles The
significance of the regression was estimated with an F test
44 RESULTS
441 Response to stem rust
Stem rust infection was high in all four testing seasons allowing for clear and
unambiguous scoring of field reaction The mean CI values of the panel accessions
ranged from 336 for DZm-2010 to 493 for DZo-2010 In both years the off-season
experiment showed a disease pressure significantly (P le 001) higher than that
recorded in the main-season (Table 1) In all seasons a broad and continuous
variation within the panel was noted from close-to-immune highly resistant reactions
to highly susceptible ones as indicated by the observed disease response ranges
reported in Table 1 and by the CI frequency distribution in each season and across
seasons (reported in Figures 1-5)
The analysis of variance for stem rust reaction showed highly significant differences
(P le 00001) among accessions and seasons (results not reported) the accession times
season interaction was also significant (P le 001) The heritability coefficient of stem
rust response calculated across seasons using the data from the non-replicated
experiments was equal to 080 while the coefficient of variation reached 261 The
Pearson correlation coefficients between the stem rust responses recorded in the four
seasons (data not reported) were always highly significant (P le 0001) with values
ranging from 040 (DZo-2010 vs DZm-2010) to 058 (DZm-2009 vs DZo-2010)
Based on the distribution of the stem rust responses averaged over the four seasons
(Table 2) about 5 of the accessions (nine in total) were highly resistant (mean DSS
lt 10) and 19 (36 accessions) were categorized as moderately resistant (mean DSS
comprised between 10 and 30) Additionally 11 accessions (ie 6) were classified
as susceptible or highly susceptible (DSS equal to or higher than 70) their number
69
increased to 51 (ie 30 of accessions) when considering the single DZo-2010 season
that was characterized by an infection level significantly (higher than that reached in
the other three seasons
442 Relationship between population structure and response to stem rust
The genetic relationships among the accessions were investigated using both a
genetic-similarity and a model-based Bayesian clustering method and the results have
been reported in Figure 6 Both methods pointed out that the minimum and optimum
number of hypothetical well-distinct subgroups present in the panel were equal to
five It was shown that the five subgroups corresponded to clearly distinct breeding
lineages 1) the ICARDA germplasm bred for the dryland areas (subgroup S1) 2) the
ICARDA germplasm bred for the temperate areas (subgroup S2) 3) the Italian and
early rsquo70s CIMMYT germplasm (subgroup S3) 4) the late rsquo70s CIMMYT
germplasm widely adapted to Mediterranean conditions (subgroup S4) 5) the late
rsquo80s to early rsquo90s CIMMYT germplasm with increased yield potential (subgroup
S5) Based on the molecular assignment of each accession to the subgroup with the
highest Bayesian probability the five subgroups included 11 55 26 56 and 35
accessions respectively The membership coefficient for each of the five subgroups
averaged over all the accessions was equal to 009 029 014 029 and 019 from S1
to S5 respectively The differences for stem rust response among the five subgroups
were highly significant (P le 00001 results not reported) with the differences among
subgroups explaining 155 of the total variance Although differences among
subgroups were found significant the within-group component of variance prevailed
accounting for 532 of the total variation The effect of population structure on the
stem rust response was also investigated by means of regression analysis Using data
of each season separately a modest population structure effect was detected for the
DZo-2009 and DZm-2010 seasons with R2 values of 89 and 77 respectively
while a greater influence was detected for DZm-2009 and DZo-2010 with R2
values
of 147 and 208 respectively The mean and range of stem rust response values
(CIs) of each of the five subgroups are reported in Table 3 These values clearly show
that all five subgroups included accessions with a wide range of responses from
highly resistant to highly susceptible thus indicating that all subgroups are equally
informative and well-suited for AM purposes Considering the mean subgroup values
70
across seasons and based on the least significant difference among subgroups S4 and
S5 which mainly included CIMMYT elite germplasm showed significantly higher
stem rust susceptibility than S1 S2 and S3 The complete data set of phenotypic
response and population structure membership coefficients for each of the 183
accessions included in the association panel is reported as Appendix 2
443 Association mapping for stem rust response
In view of the strong genotype by season interaction marker-phenotype association
tests were conducted separately for each season as well as for the responses averaged
over the four seasons The association mapping (AM) analysis was conducted by
performing single-marker F tests using both the General Linear Model with Q
covariate matrix (population structure correction Q GLM) and the mixed linear
model with Q + K matrices (population structure and familial relatedness correction
Q + K MLM) The genome-wide scan revealed chromosome regions harboring
putative QTLs for stem rust response on all chromosomes except for 3B Overall 45
chr regions harbored markers that were significant (P le 005) in at least two seasons
under the Q GLM model as well as across the averaged data of the four seasons 36 of
these 45 chr regions showed significant effects also using the Q + K MLM model
Introducing the experiment-wise correction eight chr regions showed significant (P le
005) effects in the Q GLM model while in the Q + K MLM model the significance
was limited to one region on chr 6A which showed the strongest association with
stem rust response Based on these findings we decided to present detailed results of
the 36 chr regions which were detected in the marker-wise analysis and considered as
putative QTLs
Figure 7 summarizes the results of the Q + K MLM genome scan for the disease
response averaged across the four seasons In several cases the presence of a QTL
was evidenced by multiple significant associations at linked SSR and DArT markers
with inter-marker distances always comprised within 10 cM as estimated from the
durum consensus map and in most cases LD r2
values higher than 06 For each of
the QTLs that were identified as linkage-blocks of adjacent markers all the markers
significantly associated to the phenotype were checked for consistency of their effects
71
and the marker with the most significant association to the trait was considered as the
QTL-tagging marker
For 12 of the 36 chr regions considered as putatively harboring QTLs the
significance of the effects on stem rust response was confirmed across three to four
seasons (QTL features reported in Table 4 see also Figure 7) while the 24 additional
regions showed significant consistent effects in two seasons (Table 5 and Figure 7)
The QTLs with consistent effects across three to four seasons (Table 4) were also
those with the highest overall R2 values based on the season-mean data (in most cases
comprised between 40 and 70) as well as for single seasons (values ranging from
10 to 113) In particular regions on chromosomes 1BS (QTL-tagging marker
barc8) 2AS (gwm1045) 3AS (wPt-7972) 6AL (gwm427 and CD926040) and 7AS
(wPt-2799) showed the highest R2
values and all these QTLs were tagged by a series
of adjacent markers that supported the primary QTL effect Regions on chromosomes
2BL 3AL and 5AL had consistently high R2 values but were identified by single
markers
The QTL tagged by barc8 on chr 1BS at 320 cM showed strong LD (r2
range of
060-067) along a 90 cM interval that included nine DArT markers (following the
mapping order of the consensus map wPt-2999 wPt-4605 wPt-3582 tPt-8831 wPt-
9864 wPt-4133 wPt-1876 wPt-5899 and wPt-4729) and one SSR marker
(gwm1100) In the distal region of chr 6AL highly significant effects were detected
at three closely adjacent chr regionslinkage that overall spanned 158 cM on the
durum consensus linkage map but showed low LD as to each others Each of these
three chr regions were identified respectively by i) the marker pair gwm427-wmc580
(at chro position 1395 cM r2 LD value between the two markers = 098) ii) the
EST-derived marker CD926040 (chr position 1440 cM) associated to wPt-9474
wPt-4229 wPt-5654 wPt-3247 and wPt-4663 (spanning a 93 cM interval with
moderate LD among markers and r2 values ranging from 012 to 058) and iii)
barc104 (chr position 1553 cM)The marker pair gwm427-wmc580 showed low LD
values with all the other markers in the region (r2 values from 001 to 020) while LD
was detected between the linkage block of markers associated to CD926040 and
barc104 (r2 from 026 to 055)
72
As compared to the QTLs identified across three to four seasons those (24 in total)
with significant effects in only two seasons (Table 5) showed in general lower effects
and R2 values both on a mean- (values from 10 to 38) and single-season basis
Nonetheless some of these QTLs (eg those on chrs 1AS 1BL 2B 3AL 6A and
7B) showed relatively high R2 values in specific seasons (from 36 to 80)
The least square phenotypic means (based on CIs) of non-rare alleles at the QTL-
tagging markers with significant effects in three to four seasons are reported in Table
6 The SSR marker gwm427 (chr 6AL) showed two common alleles (molecular
weight equal to 212 and 188 bp) that differed significantly (P le 005) for the
associated stem rust response with the 188 bp allele being associated with lower CI
values The EST-derived marker CD926040 (chr 6AL) carried three common alleles
with phenotypic effects that were estimated to be beneficial for one allele (855 bp)
over all seasons and detrimental (ie associated to increased susceptibility) for the
other two alleles (851 and 845 bp) At barc104 (chr 6AL) the 202 and 206 bp alleles
were both considered as beneficial as compared to the 172 bp allele (detrimental)
Table 7 reports the frequencies in the five main germplasm subgroups of the non-rare
alleles at the QTL-tagging markers that were significant in three to four seasons
Inspection of allele frequencies as reported in Table 7 indicates that allele fixation
within subgroups was rare and further suggests that in most cases the frequency of
the resistant alleles and of the other common alleles can be considered as balanced (gt
020) hence informative In general common alleles were present with balanced
frequencies - the best condition to maximize the reliability of the association assay -
in two to three subgroups while barc104 (chr 6AL) wPt-2799 (chr 7AS) and wPt-
7785 (chr 7AS) showed balanced allele frequencies across four or five subgroups
For each QTL-tagging marker the frequency of the beneficial alleles across the five
germplasm subgroups was highly variable As an example in five cases beneficial
alleles were observed at relatively high frequencies (gt 050) in more than one
subgroup ie in all the five subgroups (wPt-7992 chr 3AS) in four subgroups
(barc8 and gwm1045 chr 1BS and 2AS respectively) in three subgroups (barc104
chr 6AL) and in two subgroups (wmc388 chr 3AL)
73
Overall subgroup 1 (ICARDA accessions bred for drylands) had higher frequencies
of resistance allele at the QTLs on chr 5A subgroup 5 (CIMMYT accessions
released in the late rsquo80s - early rsquo90s) though characterized by mean phenotypic
responses higher than those showed by the other groups had higher frequencies of
resistance allele at QTLs on chr 6A compared with the other subgroups
For each locus consistently associated to stem rust resistance over seasons in addition
to reporting the allelic effects estimated as phenotypic least squared means over the
whole association panel and the consistency of their significant differences (Table 6)
were further inspected within panel subgroups Markers associated to the main stem
rust resistance on chrs 1B (barc8) 6A (CD926040 and barc104) and 7A (wPt-2799)
were considered for the comparison of the allelic phenotypic values in the entire panel
and its subpopulations as these markers accounted for the largest proportion of
phenotypic variation Accessions carrying the 255 bp allele at barc8 the 855 bp allele
at CD926040 the 202 or 206 bp allele at barc104 as well as the presence of the band
at wPt-2799 had significantly (P le 005) lower stem rust infection than the other
accessions across three or more of the five subgroups that composed the panel
The relevance of the QTL-tagging markers significant over three or four seasons in
predicting the accessionsrsquo stem rust response was further investigated by regressing
CI values on the cumulated number of beneficial alleles of the accessions The scatter
plot thus obtained is reported in Figure 8 Although the significance of the linear
regression was high (P le 0001) the R2 value of the regression was very low (56)
As expected the regression coefficient was negative (b = -175) The increase in
resistance associated to the cumulative effects of the beneficial alleles is also revealed
by the comparison between the response values predicted for zero beneficial alleles
(CI = 483) and the maximum number (9) of cumulated beneficial alleles (CI = 325)
The significance of the regression was also tested for the pool of QTL-tagging
markers when considering only the accessions with the susceptible allele at
CD926040 the maker most associated to the Sr13 region also in this case the
regression on the number of beneficial alleles was highly significant (P le 0001) with
the b coefficient and the R2 value equal to -352 and 161 respectively
74
45 DISCUSSION
A better understanding of the genetic basis underlying the durum wheat response to
Ug99 and durum-specific Ethiopian races of stem rust will help enhance disease
resistance of this crop globally while shedding light on the evolution of durum wheat-
stem rust relationships in East Africa To this end association mapping (AM) is a
useful approach as indicated by the growing interest in its application to identify
disease-resistance genesQTLs in a wide range of crops (Ersoz et al 2009 Hall et al
2010 Maccaferri et al 2010 Haile et al 2012)
The AM durum panel evaluated in the present study encompasses a large portion of
the genetic variation present in the elite germplasm pools commonly used by durum
breeders Only very few landracespre-Green Revolution genotypes were kept because
of their ldquofoundersrdquo role and significant contribution to the development of some of the
modern germplasm groups The predominance of elite germplasm in this panel was
justified for several reasons First the presence in the elite germplasm of LD which
extends over rather long distances as shown in Maccaferri et al (2005 2006 and
2011) enabled us to conduct a genome-wide scan with an average marker density
matching the genotyping capacity allowed by the marker systems currently available
for durum wheat mainly SSR and DArT markers (Maccaferri et al 2003 Mantovani
et al 2008) Second very little information about useful loci for quantitative stem rust
field resistance is available in durum wheat and thus the modern germplasm pool was
considered as the primary target for such investigation Finally the high homogeneity
in phenology of the elite materials herein considered (Maccaferri et al 2006) as
compared to the higher heterogeneity in phenology observed in other AM collections
particularly those including landraces (Wang et al 2012) allowed for a more
meaningful assessments of the disease responses
451 Response of the elite durum wheat germplasm to stem rust under field
conditions
Highly significant genotype times season interactions were detected within the AM panel
used in this study These interactions were due not only to magnitude effects since
the stem rust response of some accessions varied from resistant in one season to
75
clearly susceptible in another season This finding was confirmed by the values of
correlation coefficients between accession responses in different seasons that even if
highly significant were quite low (r lt 058) These interactions could be explained in
part by the different growing conditions prevailing in different seasons which are
known to affect disease incidence and intensity Such inter-season effect on disease
intensity is clearly seen in the increase in average intensity in the warmer off-seasons
compared to the more temperate conditions during the main-seasons Most
importantly perhaps genotype times season interactions may have been due to the use of
a mixture of races with different virulence spectra rather than a single race The
different races especially the least characterized durum-specific ones may have
impacted differently on final reaction in different seasons due to different starting
relative quantities fitness or interactions with season-specific environmental andor
inoculation conditions However the use of such mixture rather than single race
inoculum while predictably complicating the interpretation of the results was
essential for this study to address comprehensively stem rust threats that are relevant
to durum wheat breeding under field conditions
The use of Ug99 or its more recent variants alone all avirulent on Sr13 would have
had limited relevance to global durum wheat breeding as resistance to them is present
in the most germplasm groups worldwide On the other hand the exclusive use of the
Ethiopian races as single isolates or mixtures because of their unclear virulence
spectrum would have likely provided incomplete information as to the global
usefulness of sources of resistance or genomic regions involved in controlling such
resistance Also the presence of Ug99 in the mixture was important since this is the
only race that so far has migrated out of Africa into Asia and could therefore become
the first threat to the South Asian durum-growing areas Whatever the reason for the
highly significant genotype times season interaction its effects were mitigated and the
robustness of our conclusions was supported by the analysis of single season data in
addition to the results averaged over the seasons Genotypes were considered resistant
or susceptible only when they performed as such consistently across seasons and
phenotype-marker associations as discussed below were considered relevant only
when they were significant in at least three of the four seasons Nevertheless clear
trends in the distribution of genetic resistance present in this AM panel were observed
and reliable conclusions could be drawn First is the very low frequency (5 of all
76
accessions) of high-level resistance expressed as reactions that are consistently close-
to-immune or always below 10 DSS supporting the conclusions from previous
studies that elite durum wheat germplasm is relatively poor in genes with major
effects providing complete field resistance to stem rust (Singh et al 1992 Bonman et
al 2007) This is also in agreement with results from evaluations conducted in
Ethiopia at the onset of the Borlaug Global Rust Initiative in 2007-08 which showed
only 3 of resistant lines within the CIMMYT elite germplasm tested in that year
(Ammar and Badebo unpublished) This trend seems to extend to wider germplasm
groups as shown by Olivera et al (2010) who reported 52 of field resistance in a
worldwide collection of 996 durum wheat accessions and other tetraploid relatives
under conditions and with races similar to those used in the present study
Another interesting reaction group includes genotypes showing DSS between 10 and
20 mostly with R-MR to MS type pustules with a reaction type very similar to that
of local Ethiopian cultivars such as Boohai or Ude considered adequately resistant to
be competitive in most areas of Ethiopia In the present study 9 of the genotypes
were consistently classified in this group and therefore could be considered as
resistance sources for breeding programs possibly providing usable resistance genes
In contrast to the low frequency of accessions with high levels of resistance a
sizeable portion (at least 28) showed a DSS consistently between 30 and 40 Such
intermediate albeit susceptible values can indicate when accompanied by seedling
susceptibility to the races investigated in this study the presence in the durum
germplasm in relatively high frequency of minor genes conferring quantitative and
partial field resistance to both Ug99 and the Ethiopian durum races of stem rust The
accumulation of such genes in a single genotype provided their effects are additive
and seedling susceptibility confirmed should result in an improved resistance
comparable to that conferred by major gene-based resistance but otherwise race non-
specific and thus more likely to be durable (Skovmand et al 1978 Lagudah 2011
Singh et al 2011) Alternatively the low rust response observed in some accessions
included in the present study may be due to the presence and possible accumulation of
race-specific seedling genes which exhibit moderate resistance to moderate
susceptibility at the adult plant growth stage Genotypes useful as sources of minor
gene-based resistance to leaf rust have been identified in durum wheat (Herrera-
77
Foessel et al 2007) and the improvement of resistance through the accumulation of
such genes has been demonstrated (Herrera-Foessel et al 2009)
452 Genetic basis of the resistance to stem rust in durum wheat and relevance to
breeding
Based on the observation that complete immunity to the Ethiopian races was seldom
observed in the field under heavy infection conditions it has been suggested that
resistance in durum wheat was likely to be based on additivity ie resulting from the
cumulative effect of additive beneficial alleles from multiple loci (major and minor)
of variable effect (Osman Abdallah personal communication Ayele Badebo
personal communication) This finding is clearly supported in the present study by the
fact that resistance was always associated with several genomic regions each
contributing a small fraction of the variability associated with field reaction while
none of them was individually capable of providing a high level of resistance When
estimated in single seasons each QTL identified in this study explained not more than
13 of the phenotypic variation for stem rust resistance unlike previous QTL studies
based on wide crosses where QTL with R2
values as high as 37 have been reported
(Bansal et al 2008) Even though QTL effects estimated via AM are usually lower
than those estimated through biparental mapping the fact that even the most resistant
close-to-immune genotypes did not owe their resistance to a single major QTL
indicates the marginal role of classical major genes as often seen in bread wheat
Furthermore it is also known that most of the seedling major genes described for
stem rust resistance in wheat including Sr13 native of tetraploid wheat at the adult
plant stage confer medium-resistance to medium-susceptiblity rather than complete
resistanceimmunity The oligogenic nature of the resistance is also supported by the
negative albeit low relationship between the number of accumulated favorable
alleles and field reaction whether or not the genomic region corresponding to Sr13 a
major gene known to provide complete resistance to Ug99 was included in the
analysis Recently this hypothesis has been strengthened by the results obtained from
the genetic mapping of the factors responsible for the resistant response of the
ICARDA elite cultivar lsquoSebatelrsquo (Haile et al 2012) also included in this study The
genetic basis of Sebatelrsquo resistance turned out to be oligogenic with nine major and
minor QTLs identified in the RIL population and R2
values ranging from 50 to
78
340 Another aspect that can contribute to explain the different results found
between durum and bread wheat is that the elite breeding germplasm of durum wheat
has not been improved in the past decades by means of an extensive use of wide-
crosses to introgress alleles with strong phenotypic effects (Maccaferri et al 2005) as
has been the case with hexaploid wheat
In the absence of single-race analysis at the seedling and adult stages with a wide
collection of races conclusive evidence cannot be drawn as to the nature of the
resistance observed in the present study Nevertheless this report on the oligogenic
nature and likely minor-gene basis of stem rust resistance in durum wheat has
important implications for breeding activities It suggests that deploying the sources
identified in this study in a resistance-breeding program would result in an increase in
resistance that would likely be more durable as compared to a monogenic major-gene
resistance However unlike the large-effect QTLs that are easily identified and
maintained in breeding populations through phenotypic selection and can be easily
managed via marker-assisted selection (MAS) the simultaneous handling of small-
effect QTLs is much more complex In fact an effective phenotypic selection for
small-effect loci requires well-planned populations and intense uniform epidemics at
every cycle of visual selection in order to readily detect and accurately score
transgressive segregants Under these conditions the availability of useful markers
reliably tagging the minor QTLs and the ready access to MAS facility becomes
critical In the near future the availability of high-density single nucleotide
polymorphism (SNP) platforms including thousands of highly multiplexed assays will
allow for a nearly complete genome coverage and the possibility to switch from
single-marker to haplotype-based analyses thus enabling a full exploitation of the
potential of AM (Akhunov et al 2009 Kaur et al 2011 Trebbi et al 2011 You et al
2011 van Poecke et al 2013) The use of the same SNP assays in applied breeding
programs will also facilitate the simultaneous selection of multiple beneficial alleles
for partial resistance Thus MAS strategies that can effectively deal with a relatively
high number of markers and haplotypes are required to accumulate and maintain the
beneficial alleles at these small-effect QTLs in order to achieve an acceptable and
durable level of resistance for stem rust within durum breeding populations (Kuchel et
al 2007) With this aim recent advances in the implementation of genomic selection
in crop species in particular to improve stem rust resistance in hexaploid wheat
79
(Rutkoski et al 2010) indicate that this could be the most efficient approach to
exploit the potential of high-density molecular marker screening tools
453 QTLs identified through association mapping and relationship with previously
described QTLs and Sr loci
The joint Q GLM and Q + K MLM association analyses highlighted several chr
regions putatively harboring QTLs with main effects of varying magnitudes on field
stem rust response As expected multiple-test correction drastically reduced the
number of significant regions a condition not well-suited for an exploratory analysis
like the present one In addition our goal was to keep a reasonable power to identify
loci conferring partial resistance with alleles characterized by relatively small effects
Therefore also the most significant chr regions based on the less stringent marker-
wise significance test has been considered provided that the associations were
significant on the season average data and in at least two of the four seasons
Several QTLs identified in this study co-located with previously reported major Sr
loci as well as with a number of QTLs recently identified through AM in hexaploid
wheat (Yu et al 2011) and in tetraploid wheat (Haile et al 2012) Others namely
those discovered on chrs 1A 1B 3A 4A 4B 5A5B 7A and 7B were not reported
elsewhere These results highlight the effectiveness of AM to dissect the genetic basis
of moderately complex traits while showing its potential to unveil the presence of
previously unknown QTLs provided that an appropriately balanced and
phenologically suitable set of accessions are evaluated
In chr 1A significant effects were identified in the distal end and near the centromere
of chr 1AS In both cases significant effects were reported in hexaploid and
tetraploid wheat respectively within 10 cM distance from the significant markers
with associated R2 values of ca 50 Highly significant effects were detected near
the centromere of chr 1B This region is known to harbor Sr14 as well as the 1B1R
translocation-based Sr31 (Zeller 1973) However due to the absence of the 1B1R
translocation in the present panel the effect herein detected is likely due to Sr14 A
recent AM study in hexaploid wheat (Yu et al 2011) showed the presence of a QTL
associated to stem rust response in this same region precisely on the chr arm 1BS
80
Moreover three DArT markers significantly associated to stem rust response were
reported in the same region by Crossa et al (2007) Significant markers on the
proximal region of chr arm 1BL such as cfd65 wPt-8168 and gwm947 are located in
the same region as Sr14 which is effective against Ug99 races (Singh et al 2006)
The presence of the Sr14 resistance allele in the durum wheat germplasm can be
traced back to Triticum dicoccum Schrank accessions such as Khapli emmer which is
known to carry Sr14 and is also considered as one of the few founders of the modern
durum wheat germplasm (Autrique et al 1996) Sr14 has been considered as one of
the causes of stem rust resistance in some synthetic wheat-derived lines (Njau et al
2010)
Overlap of the QTL location in our study and a minor QTL described by Haile et al
(2012) in the durum wheat RIL population was found on chr 2AS On chr arm 2BL
gwm1300 and wmc356 (509 cM apart) were significantly associated with stem rust
resistance for two and three seasons respectively These markers mapped to regions
corresponding to the putative locations of Sr9SrWeb and Sr28Sr16 respectively At
the Sr9 region two alleles are known Sr9e which was reported to be ineffective
against Ug99 at the seedling stage while showing MR to MS infection types in the
field nurseries (Jin et al 2007) and Sr9g which provides field resistance to Ug99 and
to the Ethiopian races Sr9e is present in many durum wheat genotypes including the
CIMMYT landmark Yavaros C79 and its sister line Karim 80 which were classified
as moderately resistant to moderately susceptible under the present studyrsquos conditions
Sr9g is one of the resistance alleles reported to be present in the durum cultivar
Iumillo (McIntosh et al 1995)
Several regions with significant associations to field reaction to stem rust were
detected on chr 3A where Sr27 and Sr35 both effective against Ug99 have been
reported (McIntosh et al 1995 Singh et al 2006) However as Sr27 originated from
a wheat-rye translocation engineered exclusively in bread wheat and Sr35 from
Triticum monococcum transferred to some tetraploids of Canadian origin none of
which was present in this study or in the pedigree of the accessions of the AM panel
the chr 3A related associations detected herein are likely to involve novel loci or
alleles The distal region of chr 3BS is known to harbor Sr2 a gene that confers
partial resistance to Ug99 at the adult plant stage In hexaploid wheat the beneficial
81
Sr2 allele selected by MAS originates from the tetraploid wheat germplasm (Yaroslav
emmer) Although the Sr2 locus has been reported as the major component of
resistance in the durum wheat RIL population Sebatel times Kristal (R2 value equal to
340 Haile et al 2012) in the durum elite germplasm considered in this study it
was irrelevant The SSR markers used to provide information on the Sr2-associated
haplotype (gwm533 and barc133) showed that this haplotype was very rare in the
sample of elite durum wheat accessions herein considered under the allele frequency
cutoff threshold used for the AM test (100)
On chr 6A the AM analysis highlighted six QTLs with significant effects on field
stem rust reaction One of these regions (approximately 8 cM wide) tagged by wPt-
7330 in the distal portion of chr arm 6AS co-locates with the region known to harbor
Sr8 a gene known to be ineffective against Ug99 (Singh et al 2006) Interestingly
this region completely overlapped with a QTL for stem rust resistance recently
reported in an AM study in hexaploid wheat (Yu et al 2011) A wide region on chr
arm 6AL about 40 cM wide plays a major role in controlling stem rust response in
the durum wheat germplasm tested herein This region includes two distinct sub-
regions harboring effective but most probably distinct genes
The first proximal sub-region tagged by tPt-4209 gwm1150 and gwm169 and
associated with stem rust resistance in this study co-locates with Sr26 a gene
effective against Ug99 (Singh et al 2006) and the Ethiopian races (Ayele and Ammar
unpublished results) However the presence of the known Sr26 allele in the AM panel
or in the durum wheat germplasm at large is unlikely the Sr26-resistant allele having
been introgressed from the wild relative Thinopirum ponticum exclusively into bread
wheat A novel geneallelic variant other than Sr26 should be located in this sub-
region Remarkably this QTL region has been independently confirmed in the Sebatel
times Kristal durum population and reported as QSrIPK-6A (Haile et al 2012) a QTL
with R2 value equal to 93 and tagged by the SSR markers gwm494-gwm1150 The
second distal sub-region of chr 6AL includes three further sub-regions (tagged by
gwm427 CD926040 and barc104) strongly associated to stem rust response These
sub-regions co-locate with Sr13 mapped in tetraploid wheat to chr 6AL within a 12
to 28 cM interval flanked by the EST-derived markers CD926040 and BE471213
(Simons et al 2011) In our study CD926040 showed the maximum R2 value and was
82
consistently significant across all four seasons Sr13 is effective against the TTKS
complex of Puccinia graminis ssp tritici namely TTKSK (Ug99) TTKST and
TTTSK However virulence for Sr13 within Ethiopian stem rust populations has been
suspected for some time and recently confirmed by the characterization of the
TRTTF and JRCQC isolates collected from the Ethiopian site in Debre-Zeit (Olivera
et al 2010 and 2012) Therefore while very effective against the TTKSK or Ug99
lineage (the only ones so far to have migrated out of Africa) its presence alone is not
sufficient for adequate protection in Ethiopia This is clearly seen when comparing the
field reaction and the long-range haplotype in the extended Sr13 chr region of two
US desert-durum cultivars namely Kronos and Kofa which were considered in the
present study While both cultivars exhibited the haplotype of Khapli Emmer known
to carry Sr13 (Knott 1962) Kronos had one of the most consistently resistant
reactions over seasons while Kofa was regularly susceptible Taking into account all
of the above information the presence of the resistant allele(s) in the Sr13 region is
valuable for breeding activities and should be pursued for pyramiding multiple useful
alleles Specifically for the Sr13 locus Simons et al (2011) found different linked
marker alleles among the Sr13 donors suggesting that breeding programs used
different sources of Sr13 or that independent recombination event occurred between
loci In our study the durum wheat accessions Khapli Kofa and Kronos were the
donors of resistant Sr13 alleles (Simons et al 2011) The LD decay among the three
main linkage blocks (tagged by gwm427-wmc580 CD926040 and barc104) near Sr13
and the variation in band sizes of the marker alleles indicate that the current markers
are not fully diagnostic in a wide range of backgrounds and therefore cannot be used
to predict with high confidence the presence of Sr13 in unknown sets of germplasm
This notwithstanding these markers can be used to follow the Sr13 resistant alleles in
segregating populations involving parental lines (eg Khapli Kofa and Kronos)
related to any of the known Sr13 sources The future availability of high-density SNP
platforms (Trebbi et al 2011 van Poecke et al 2012) will likely provide much better
haplotype resolution
The significant effects identified in chrs 6BS 7AS and 7BS are specific of the durum
germplasm herein considered Accordingly these regions have not been reported as
QTL locations neither in t bread wheat germplams nor in the Sebatel times Kristal
population On the distal portion of chr 7AL DArT markers with significant effects
83
on stem rust resistance in our study overlapped with the locations of Sr22 and
QSripk-7AL (Haile et al 2012) This is additional independent evidence for the
relevance of this QTL region for stem rust response Finally AM detected QTLs at
the distal end of chr arm 7BL (QTL-tagging marker wPt-8615) with several DArT
markers associated with stem rust resistance This region co-locates with that known
to harbor Sr17 a gene linked to Lr14a and Pm5 in bread wheat (Crossa et al 2007) It
also is consistent with a region reported to include a stem rust QTL in the Arina x
Forno RIL population (Bansal et al 2008) Sr17-related resistance to stem rust has
been reported in tetraploid wheat as well as synthetic bread wheat (Bariana et al
2009) In the present study there was no relationship either in coupling or repulsion
between stem rust resistance and the presence of Lr14a (known from previous studies
on the same panel) present in the same region This may indicate that both genes are
widely spaced so no linkage could be detected Further research is underway to
confirm the presence of known resistancesusceptibility alleles for the aforementioned
designated stem rust genes at the seedling stage
Based on the results herein presented it is clear that quantitative additive variation is
present in the elite germplasm at chromosome regions known to carry well-
characterized resistance genes (Sr14 Sr28-Sr16 Sr8 and particularly Sr13) whose
alleles are tagged by known molecular markers and are known to be frequently
defeated by specific races or non-effective at the seedling stage Nevertheless our
results show that the same genes may have residual appreciable effects (though of
quantitative and additive nature) at the adult open field stage particularly when
present in multiple combinations
It is also known that most of the seedling stem rust resistance genes produce medium-
susceptible to medium-resistant responses thus more quantitative in nature as
compared to classical resistant responses and more subjected to genotype times
environment interaction at the adult plant stage (including Sr13 and with the
exception of Sr6 Sr9e Sr17 Sr19 Sr21 and Sr31) The low rust response phenotypes
observed in the present study can therefore be ascribed to the presence of
combinations of resistance genes including major designated genes and additional
novel genesQTLs
84
46 CONCLUSIONS
Association mapping in elite germplasm has the potential to accelerate the translation
of basic genetic information towards applications in crop improvement and cultivar
release Our study shows that AM effectively complement bi-parental mapping
studies by providing independent validation of previously detected QTLs and
discovering new QTLs Additionally our study highlighted the presence of valuable
genetic variation that could be exploited to sustainably enhance stem rust resistance in
durum wheat The oligogenic nature or minor-gene basis of resistance to Ug99 and
the Ethiopian races of stem rust in durum wheat have been clearly documented
Several chr regions harboring putative QTLs involved in the stem rust response in the
field under high infection were consistently detected across seasons the allelic
variation at these QTLs can be exploited for further validation studies and utilization
in MAS programs The AM results reported herein confirm the important role of the
Sr13 region but also its limitation in individually addressing the presence of the
Ethiopian races Our analysis also highlighted the role of chr regions putatively
harboring Sr14 and Sr9 Sr17 to be further dissected as providing alleles with
beneficial effects on final resistance but again not sufficiently strong individually
Additionally the AM analysis strengthen the role of five QTLs recently described in
the Sebatel times Kristal durum mapping population and located in chromosome regions
where no designated resistance genes were mapped New regions so far not reported
to be associated with stem rust resistance either in durum or bread wheat have been
detected These regions contribute minor genes that can be accumulated through MAS
towards a more durable resistance to stem rust in durum wheat
85
47 LITERATURE CITED
Admassu B Lind V Friedt W Ordon F (2009) Virulence analysis of Puccinia
graminis f sp tritici populations in Ethiopia with special consideration of
Ug99 Plant Pathol 58 362-369
Akbari M Wenzl P Caig V Carling J Xia L et al (2006) Diversity arrays
technology (DArT) for high-throughput profiling of the hexaploid wheat
genome Theor Appl Genet 113 1409-1420
Akhunov E Nicolet C Dvorak J (2009) Single nucleotide polymorphism genotyping
in polyploid wheat with the Illumina GoldenGate assay Theor Appl Genet
119 507-517
Autrique E Nachit MM Monneveux P Tanksley SD Sorrells ME (1996) Genetic
diversity in durum wheat based on RFLPs morphophysiological traits and
coefficient of parentage Crop Sci 36 735-742
Badebo A Gelalcha S Ammar K Nachit M M Abdalla O (2009) Durum wheat
research in Ethiopia In Proceedings of the 2009 BGRI Technical Workshop
CIMMYT Cd Obregon Sonora Mexico March 17-20 2009 pp 28
Bansal UK Bossolini E Miah H Keller B Park RF Bariana HS (2008) Genetic
mapping of seedling and adult plant stem rust resistance in two European
winter wheat cultivars Euphytica 164 821-828
Beavis WD (1998) ETL analysis power precision and accuracy In Paterson AH
(ed) Molecular analysis of complex traits CRC Boca Raton pp 145-161
Belaid A (2000) Durum wheat in WANA (West Asia and North Africa) production
trade and gains from technological change In Royo C Nachit MM Di Fonzo
N Araus JL (eds) Durum wheat improvement in the Mediterranean region
new challenges vol 40 Options Mediterraneennes CIHEAM-IAMZ
Zaragoza pp 35-39
Bonman JM Bockelman HE Jin Y Hijmans RJ Gironella AIN (2007) Geographic
distribution of stem rust resistance in wheat landraces Crop Sci 47 1955-
1963
Bradbury PJ Zhang Z Kroon DE Casstevens TM Ramdoss Y Buckler ES (2007)
TASSEL software for association mapping of complex traits in diverse
samples Bioinformatics 23 2633-2635
86
Bradbury P Parker T Hamblin MT Jannink JL (2011) Assessment of Power and
False Discovery Rate in Genome-Wide Association Studies using the Barley
CAP Germplasm Crop Sci 51 52-59
Breseghello F Sorrells ME (2006) Association mapping of kernel size and milling
quality in wheat (Triticum aestivum L) cultivars Genetics 172 1165-1177
Buntjer JB Sorensen AP Peleman JD (2005) Haplotype diversity the link between
statistical and biological association Trends Plant Sci 10 466-471
Ceoloni C Forte P Gennaro A Micali S Carozza R Bitti A (2005) Recent
developments in durum wheat chromosome engineering Cytogenet Genome
Res 109 328-334
Crossa J Burgueno J Dreisigacker S Vargas M Herrera-Foessel SA Lillemo M et al
(2007) Association analysis of historical bread wheat germplasm using
additive genetic covariance of relatives and population structure Genetics 177
1889-1913
de Givry S Bouchez M Chabrier P Milan D Schiex T (2005) CAR (H) (T) A Gene
multipopulation integrated genetic and radiation hybrid mapping
Bioinformatics 21 1703-1704
Ersoz ES Yu J Buckler ES (2009) Application of linkage disequilibrium and
association mapping in maize In Kriz A Larkins B (eds) Molecular genetic
approaches to maize improvement Springer Berlin pp 173-195
Eversmeyer MG Kramer CL (2000) Epidemiology of wheat leaf and stem rust in the
central Great Plains of the USA Annu Rev Phytopathol 38 491-513
Feuillet C Langridge P Waugh R (2008) Cereal breeding takes a walk on the wild
side Trends Genet 24 24-32
Flint-Garcia SA Thornsberry JM Buckler ES (2003) Structure of linkage
disequilibrium in plants Annu Rev Plant Biol 54 357-374
Gupta PK Varshney RK Sharma PC Ramesh B (1999) Molecular markers and their
applications in wheat breeding Plant Breed 118 369-390
Gupta PK Rustgi S Kulwal PL (2005) Linkage disequilibrium and association
studies in higher plants present status and future prospects Plant Mol Biol
57 461-485
Habash DZ Kehel Z Nachit M (2009) Genomic approaches for designing durum
wheat ready for climate change with a focus on drought J Exp Bot 60 2805-
2815
87
Haile JK Nachit MM Hammer K Badebo A Roumlder MS (2012) QTL mapping of
resistance to race Ug99 of Puccinia graminis f sp tritici in durum wheat
(Triticum durum Desf) Mol Breed DOI 101007s1032-012-9734-7
Hall D Tegstrom C Ingvarsson PK (2010) Using association mapping to dissect the
genetic basis of complex traits in plants Brief Funct Genom 9 157-165
Heffner EL Sorrells ME Jannink J (2009) Genomic selection for crop improvement
Crop Sci 49 1-12
Herrera-Foessel SA Singh RP Huerta-Espino J Crossa J Djurle A Yue J (2007)
Evaluation of slow rusting resistance components to leaf rust in CIMMYT
durum wheats Euphytica 155 361-369
Herrera-Foessel SA Singh RP Huerta-Espino J Ammar K (2009) Pyramiding Slow
Rusting Genes for Durable Resistance to Leaf Rust in Durum Wheat Borlaug
Global Rust Initiative Technical Workshop 2009 Ciudad Obregon Sonora
Mexico March 17-20 2009
Jin Y Singh RP Ward RW Wanyera R Kinyua M Njau P Pretorius ZA (2007)
Characterization of seedling infection types and adult plant infection responses
of monogenic Sr gene lines to race TTKS of Puccinia graminis f sp tritici
Plant Dis 91 1096-1099
Jin Y Szabo LJ Pretorius ZA Singh RP Ward R Fetch T Jr (2008) Detection of
virulence to resistance gene Sr24 within race TTKS of Puccinia graminis f sp
tritici Plant Dis 92 923-926
Jin Y Szabo L Rouse M Fetch T Jr Pretorius ZA Wanyera R Njau P (2009)
Detection of virulence to resistance gene Sr36 within race TTKS lineage of
Puccinia graminis f sp tritici Plant Dis 93 367-370
Kaur S Franki MG Forster JW (2011) Identification characterization and
interpretation of single-nucleotide sequence variation in allopolyploid crop
species Plant Biotechnol J 2011 Aug 10 doi 101111 j 1467-76522011
00644 x
Klindworth DL Miller JD Jin Y Xu SS (2007) Chromosomal locations of genes for
stem rust resistance in monogenic lines derived from tetraploid wheat
accession ST464 Crop Sci47 1441-1450
Knott DR (1962) The inheritance of resistance to races 15B and 56 of stem rust in the
wheat variety Khapstein Can J Agric Sci 42 415-419
88
Kuchel H Ye GY Fox R Jefferies S (2005) Genetic and economic analysis of a
targeted marker-assisted wheat breeding strategy Mol Breed 16 67-78
Kuchel H Langridge P Eagles HA Jefferies SP (2007) Genetic dissection of grain
yield in bread wheat I QTL analysis Theor Appl Genet 115 1029-1041
Lagudah ES (2011) Molecular genetics of race non-specific rust resistance in wheat
Euphytica 179 81-91
Maccaferri M Sanguineti MC Donini P Tuberosa R (2003) Microsatellite analysis
reveals a progressive widening of the genetic basis in the elite durum wheat
germplasm Theor Appl Genet 107 783-797
Maccaferri M Sanguineti MC Noli E Tuberosa R (2005) Population structure and
long-range linkage disequilibrium in a durum wheat elite collection Mol
Breed 15 271-289
Maccaferri M Sanguineti MC Natoli V Ortega JLA Ben Salem M Bort J
Chenenaoui C De Ambrogio E del Moral LG De Montis A El-Ahmed A
Maalouf F Machlab H Moragues M Motawaj J Nachit M Nserallah N
Ouabbou H Royo C Tuberosa R (2006) A panel of elite accessions of durum
wheat (Triticum durum Desf) suitable for association mapping studies Plant
Gen Res 4 79-85
Maccaferri M Sanguineti MC Corneti S Ortega JLA Ben Salem M Bort J
DeAmbrogio E del Moral LFG Demontis A El-Ahmed A Maalouf F
Machlab H Martos V Moragues M Motawaj J Nachit M Nserallah N
Ouabbou H Royo C Slama A Tuberosa R (2008) Quantitative trait loci for
grain yield and adaptation of durum wheat (Triticum durum Desf) across a
wide range of water availability Genetics 178 489-511
Maccaferri M Sanguineti MC Mantovani P Demontis A Massi A Ammar K
Kolmer J Czembor J Ezrati S Tuberosa R (2010) Association mapping of
leaf rust response in durum wheat Mol Breed 26 189-228
Maccaferri M Sanguineti MC del Moral LFG Demontis A El-Ahmed A Maalouf F
Machlab H Martos V Moragues M Motawaj J Nachit M Nserallah N
Ouabbou H Royo C Slama A Tuberosa R (2011) Association mapping in
durum wheat grown across a broad range of water regimes and yield potential
J Exp Bot 62 409-438
Maccaferri M Ratti C Rubies-Autonell C Vallega V Demontis A Stefanelli S
Tuberosa R Sanguineti MC (2011) Resistance to Soil-borne cereal mosaic
89
virus in durum wheat is controlled by a major QTL on chromosome arm 2BS
and minor loci Theor Appl Genet 123 527-544
Mago R Lawrence GJ Ellis JG (2011) The application of DNA marker and doubled-
haploid technology for stacking multiple stem rust resistance genes in wheat
Mol Breed 27 329-335
Mantovani P Maccaferri M Sanguineti MC Tuberosa R Catizone I Wenzl P
Thomson B Carling J Eric H De-Ambrogio E Kilian A (2008) An integrated
DArT-SSR linkage map of durum wheat Mol Breed 22 629-648
Massman J Cooper B Horsley R Neate S Dill-Macky R Chao S Dong Y Schwarz
P Muehlbauer GJ Smith KP (2011) Genome wide association mapping of
fusarium head blight resistance in contemporary barely breeding germplasm
Mol Breed 27 439-454
McIntosh RA Wellings CR Park RF (1995) Wheat rusts an atlas of resistance genes
CSIRO Canberra
McIntosh RA Brown GN (1997) Anticipatory breeding for resistance to rust diseases
in wheat Annu Rev Phytol 35 311-326
Melchinger AE Utz HF Schon CC (1998) Quantitative trait locus (QTL) mapping
using different testers and independent population samples in maize reveals
low power of QTL detection and large bias in estimates of QTL effects
Genetics 149 383-403
Miedaner T Wurschum T Maurer HP Korzun V Ebmeyer E Reif JC (2011)
Association mapping for Fusarium head blight resistance in European soft
winter wheat Mol Breed 28 647-655
Myles S Peiffer J Brown PJ Ersoz ES Zhang ZW Costich DE Buckler ES (2009)
Association mapping critical considerations shift from genotyping to
experimental design The Plant Cell 21 2194-2202
Nazari K Mafi M Yahyaoui A Singh RP Park RF (2009) Detection of wheat stem
rust (Puccinia graminis f sp tritici) race TTKSK (Ug99) in Iran Plant Dis
93 317
Njau PN Jin Y Huerta-Espino J Keller B Singh RP 2010 Identification and
evaluation of sources of resistance to stem rust race Ug99 in wheat Plant Dis
94 413-419
Olivera PD Jin Y Badebo A Singh D (2010) Races of Puccinia graminis fsp tritici
with virulence on Sr13 and Sr9e in durum screening nursery in Ethiopia In
90
Proceedings of BGRI 2010 Technical Workshop ed R McIntosh Z
Pretorious St Petersburg Russia May 30-31 pp 7-8
Peterson RF Campbell AB Hannah AE (1948) A diagrammatic scale for estimating
rust intensity of leaves and stem of cereals Can J Res Sect C 26 496-500
Pretorius ZA Singh RP Wagoire WW Payne TS (2000) Detection of virulence to
wheat stem rust resistance gene Sr31 in Puccinia graminis f sp tritici in
Uganda Plant Dis 84 203
Pritchard JK Stephens M Donnelly P (2000) Inference of population structure using
multilocus genotype data Genetics 155 945-959
Rafalski JA (2002) Novel genetic mapping tools in plants SNPs and LD-based
approaches Plant Sci 162 329-333
Rafalski JA (2011) Genomic tools for the analysis of genetic diversity Plant Gen
Res Characterization and Utilization 9 159-162
Robertson A (1967) The nature of quantitative genetic variation In Brink (ed)
Heritage from Mendel University of Wisconsin Madison pp 265-280
Roelfs AP Singh RP Saari EE (1992) Rust diseases of wheat concepts and methods
of disease management CIMMYT Mexico DF
Rutkoski JE Heffner EL Sorrells ME (2010) Genomic selection for durable stem rust
resistance in wheat Euphytica 179161-173
Schuelke M (2000) An economic method for the fluorescent labelling of PCR
fragments Nat Biotechnol 18 233-234
Simons K Abate Z Chao S Zhang W Rouse M Jin Y Elias E Dubcovsky J (2011)
Genetic mapping of stem rust resistance gene Sr13 in tetraploid wheat
(Triticum turgidum ssp durum L) Theor Appl Genet 122 649-658
Singh RP Bechere E Abdalla O (1992) Genetic analysis of resistance to stem rust in
10 durum wheats Phytopathol 82 919-922
Singh RP Huerta-Espino J Fuentes G Duveiller E Gilchrist L Henry M Nicol MJ
(2005) Resistance to diseases In Royo C Nachit MM Di Fonzo N Araus JL
Pfeiffer WH Slafer GA (eds) Durum wheat breeding current approaches and
future strategies Food Product Press Binghamton pp 291-315
Singh RP Hodson DP Jin Y Huerta-Espino J Kinyua MG Wanyera R Njau P
Ward RW (2006) Current status likely migration and strategies to mitigate the
threat to wheat production from race Ug99 (TTKS) of stem rust pathogen In
91
CAB reviews perspectives in agriculture veterinary science nutrition and
natural resources 1 No 054
Singh D Girma B Njau P Wanyera R Badebo A Bhavani S Singh RP Huerta-
Espino J Woldeab G Ward R (2008) Screening for stem rust resistance in
East Africa In Proceedings of the 2009 BGRI Technical Workshop
CIMMYT Cd Obregon Sonora Mexico March 17-20 2009 pp 33-38
Singh RP Hodson DP Huerta-Espino J Jin Y Bhavani S Njau P Herrera-Foessel S
Singh PK Singh S and Govindan V (2011) The Emergence of Ug99 Races of
the Stem Rust Fungus is a Threat to World Wheat Production Annu Rev
Phytopathol 49 465-81
Skovmand B Wilcoxson RD Shearer BL Stucker RE (1978) Inheritance of slow
rusting to stem rust in wheat Euphytica 27 95-107
Stich B Melchinger AE Frisch M Maurer HP Heckenberger M Reif JC (2005)
Linkage disequilibrium in European elite maize germplasm investigated with
SSRs Theor Appl Genet 111 723-730
Stich B Melchinger AE (2010) An introduction to association mapping in plants
CAB Rev 5 039Storey JD Tibshirani R (2003) Statistical significance for genome
wide studies Proc Natl Acad Sci USA 100 9440-9445
Stubbs RW Prescott JM Saari EE Dubin HJ (1986) Cereal Dis Methodol Manual
pp 45-46
Thornsberry JM Goodman MM Doebley J Kresovich S Nielsen D Buckler ES IV
(2001) Dwarf8 polymorphisms associate with variation in flowering time Nat
Genet 28 286-289
Tommasini L Schnurbusch T Fossati D Mascher F Keller B (2007) Association
mapping of Stagonospora nodorum blotch resistance in modern European
winter wheat varieties Theor Appl Genet 115 697-708
Trebbi D Maccaferri M de Heer P Sorensen A Giuliani S Salvi S Sanguineti MC
Massi A van der Vossen EAG Tuberosa R (2011) High-throughput SNP
discovery and genotyping in durum wheat (Triticum durum Desf) Theor
Appl Genet 123 555-569
van Poecke RMP Maccaferri
M Tang
J Truong HT Janssen A van Orsouw NJ
Salvi S Maria C Sanguineti
MC Tuberosa R van der Vossen EAG
(2013)
Sequence-based SNP genotyping in durum wheat Pl Biotech J (in press)
92
Vavilov NI 1951 The origin variation immunity and breeding of cultivated plants
Chron Bot 131-36
Vavilov NI 1929 Wheat of Ethiopia Bulletin of Applied Botany Genetics and
Plant Breed 20 224-356
Wang M Jiang N Jia T Leach L Cockram J Comadran J Shaw P Waugh R Luo Z
(2012) Genome-wide association mapping of agronomic and morphologic
traits in highly structured populations of barley cultivars Theor Appl Genet
124 233-246
Wanyera R Kinyua MG Jin Y Singh R (2006) The spread of stem rust caused by
Puccinia graminis f sp tritici with virulence on Sr31 in wheat in Eastern
Africa Plant Dis 90 113
You FM Huo NX Deal KR Gu YQ Luo MC McGuire PE Dvorak J Anderson OD
(2011) Annotation-based genome-wide SNP discovery in the large and
complex Aegilops tauschii genome using next-generation sequencing without
a reference genome sequence BMC Genomics 12 DOI 1011861471-2164-
12-59
Yu JM Pressoir G Briggs WH Bi IV Yamasaki M Doebley JF McMullen MD
Gaut BS Nielsen DM Holland JB Kresovich S Buckler ES (2006) A unified
mixed-model method for association mapping that accounts for multiple levels
of relatedness Nat Genet 38 203-208
Yu L-X Liu S Anderson JA Singh RP Jin Y Dubcovsky J BrownGuidera G
Bhavani S Morgounov A He Z Huerta-Espino J Sorrells ME (2010)
Haplotype diversity of stem rust resistance loci in uncharacterized wheat lines
Mol Breed 26 667-680
Yu L-X Lorenz A Rutkoski J Singh RP Bhavani S Huerta-Espino J Sorrells ME
(2011) Association mapping and gene-gene interaction for stem rust resistance
in CIMMYT spring wheat germplasm Theor Appl Genet 123 1257-1268
Zadoks JC Chang TT Konzak CF (1974) A decimal code for the growth stages of
cereals Weed Research 14 415-421
Zeller F J (1973) 1B1R wheat-rye chromosome substitutions and translocations In
Sears E R and Sears L M S (eds) Proc 4th
Int Wheat Genetics Symposium
Columbia Missouri pp 209-221
93
Zhang W Chao S Manthey F Chicaiza O Brevis JC Echenique V Dubcovsky J
(2008) QTL analysis of pasta quality using a composite microsatellite and
SNP map of durum wheat Theor Appl Genet117 1361-1377
Zhu C Gore M Buckler ES Yu J (2008) Status and prospects of association mapping
in plants Plant Genome 1 5-20
Zwer PK Park RF McIntosh RA (1992) Wheat-Stem rust in Australia- 1969-1985
Aust J Agric Res 43 399-432
94
FIGURES
95
Figure 1 Frequency distribution of the Coefficient of Infection of the elite accessions
tested at Debrezeit 2009 off cropping season
Nu
mb
er
of
accessio
ns
(n
o)
0-10 11-20 31-40 41-50 51-60 61-70 71-8021-30
0
10
20
40
30
50
60
DZo_2009
81-90 91-100
Disease rating scale (Coefficient of Infection)
Frequency distribution of the Coefficient of Infection
of the elite accessions tested in the four seasons
96
Figure 2 Frequency distribution of the Coefficient of Infection of the elite accessions
tested at Debrezeit 2009 main cropping season
0-10 11-20 31-40 41-50 51-60 61-70 71-8021-30
0
10
20
40
30
50
60
81-90 91-100
Nu
mb
er
of
ac
ce
ss
ion
s(n
o)
DZm_2009
Disease rating scale (Coefficient of Infection)
97
Figure 3 Frequency distribution of the Coefficient of Infection of the elite accessions
tested at Debrezeit 2010 off-cropping season
0-10 11-20 31-40 41-50 51-60 61-70 71-8021-30
0
10
20
40
30
50
60
81-90 91-100
Nu
mb
er
of
accessio
ns
(n
o)
DZo_2010
Disease rating scale (Coefficient of Infection)
98
Figure 4 Frequency distribution of Coefficient of Infection of the elite accessions
tested at Debrezeit 2010 main cropping season
0-10 11-20 31-40 41-50 51-60 61-70 71-8021-30
0
10
20
40
30
50
60
81-90 91-100
Nu
mb
er
of
accessio
ns
(n
o)
DZm_2010
Disease rating scale (Coefficient of Infection)
99
Figure 5 Frequency distribution of Coefficient of Infection of the elite accessions
tested at Debrezeit mean over four seasons cropping season
0-10 11-20 31-40 41-50 51-60 61-70 71-8021-30
0
10
20
40
30
50
60
Mean over four seasons
81-90 91-100
Nu
mb
er
of
accessio
ns
(n
o)
Disease rating scale (Coefficient of Infection)
100
Figure 6 Population structure investigated by both distance and model-based
Bayesian analysis
Model-based Bayesian clustering (STRUCTURE)
Subpopulation number (K) = 5
Similarity-based dendrogram
(UPGMA)
Italian germplasm
(Cappelli Valnova)
CIMMYT germplasm lsquo70
(JoAaFg Yavaros79)
CIMMYT germplasm lsquo80
(Altar84)
ICARDA germplasm lsquo80
(Cham1 temperate high yield potential)
ICARDA germplasm lsquo80
(Omrabi dryland)
101
Figure 7 Association mapping probabilities reported as -log (p) of the mapped
markers tested for association to stem rust response of 183 elite accessions of durum
wheat Results are shown for the stem rust response averaged over four evaluation
seasons reported on a chromosome-by-chromosome basis The -log 005 significance
threshold value is equal to 135 Centromeres have been indicated as solid filled
triangles Vertical dashed lines indicate the 12 markers with significant effects (P lt
005) in three or four seasons vertical dotted lines indicate the 24 markers tagging
QTL regions with significant effects (P lt 005) in two seasons only Chromosome
intervals corresponding to the locations of stem rust (Sr) resistance loci reported by
previous studies in hexaploid and tetraploid wheat have been reported as black bars
above the graph of each chromosome Chromosome linkage blocks associated to stem
rust response in hexaploid wheat (Crossa et al 2007 Yu et al 2011) and in tetraploid
wheat (Haile et al 2012) have been reported as gray and crossed-bars respectively
102
Figure 8 Scatter plot of the coefficient of infection values of the elite accessions of
durum wheat on the cumulated number of beneficial alleles at the QTL-tagging
markers significant (P lt 005) in three or four seasons Results are shown for the stem
rust response averaged over four evaluation seasons of the 183 accessions (a) and of
the 67 accessions (b) with the susceptible allele at CD926040 the marker most
associated to the Sr13 region
103
TABLES
104
Table 1 Descriptive statistics for field stem rust response (reported as Coefficient of Infection) of the 183 elite durum wheat accessions
evaluated in four growing seasons in Ethiopia
Season a
CI
Mean Min Max
DZo-2009 422 02 800
DZm-2009 369 00 800
DZo-2010 493 00 900
DZm-2010 336 79 682
Mean 405 35 720
a stem rust response evaluation carried out in Debre Zeit (DZ) Agricultural Research Center DZo-2009 off season field trial evaluation
carried out in 2009 (January to May) DZm-2009 main season evaluation in 2009 (July to November) DZo-2010 off season evaluation
in 2010 DZm-2010 main season evaluation in 2010
105
Table 2 Frequency distribution of stem rust responses averaged over four growing seasons in Ethiopia for the 183 elite durum wheat
accessions included in the association mapping durum panel
Season Stem rust response a
(DSS lt 10) (DSS 10-20) (DSS 30) (DSS 40) (DSS 50-60) (DSS 70-100)
DZo-2009 006 (10) b 006 (10) 012 (20) 026 (43) 045 (75) 005 (8)
DZm-2009 011 (16) 012 (17) 019 (27) 018 (26) 028 (40) 013 (19)
DZo-2010 005 (9) 006 (10) 010 (17) 016 (27) 034 (58) 030 (51)
DZm-2010 015 (22) 010 (14) 017 (25) 022 (31) 030 (43) 006 (8)
Mean 005 (9) 009 (17) 010 (19) 018 (33) 051 (94) 006 (11) a classification of response based on the Disease Severity Score (DSS) as reported in Singh et al (2009)
b frequencies values values within brackets report the actual accession numbers
Table 3 Mean and range of stem rust response (reported as Coefficient of Infection) in the five main germplasm subgroups of the association
mapping durum wheat panel
Environment
Subgroup 1 (S1)
ICARDA drylands
(11)a
Subgroup 2 (S2) ICARDA
temperate (55)
Subgroup 3 (S3) Italian and
early rsquo70s CIMMYT (26)
Subgroup 4 (S4) late rsquo70s
CIMMYT (56)
Subgroup 5 (S5) late rsquo80s
CIMMYT (35)
Mean Min Ma
x
Mean Min Max Mean Min Max Mean Min Max Mean Min Max
DZo-2009 406 9 70 416 02 70 323 02 60 449 6 80 454 4 70
DZm-2009 274 6 54 345 2 80 227 0 63 427 3 80 44 3 80
DZo-2010 457 27 70 445 3 80 383 0 80 49 9 90 662 12 80
DZm-2010 435 94 60
5
322 79 605 274 79 605 337 11 527 362 79 682
Mean 396 146 58 386 35 675 294 38 587 427 75 662 475 95 72
Least significant difference (LSD) among subgroups = 499 (P 005)
a number of accessions belonging to each subgroup
106
Table 4 Quantitative trait loci (QTLs) for stem rust response identified through association mapping in a panel of 183 elite durum wheat
accessions evaluated in Ethiopia with significant effects observed over three to four evaluation seasons For each QTL the chromosome
position the associated markers and the QTL features are reported
Chr
Most associated
marker
Position
(cM)a
Seasons with significant marker-
trait associations R2 range ()
b
R2
()c Associated markers in the QTL region
Interval
width
(cM)a
1BS barc8 32 DZm-2009 DZo-2010 DZm-
2010
32 - 56 46 gwm1100 wPt-2999 wPt-4605 tPt-8831
wPt-9864 wPt -3582 wPt-4133 wPt-1876
wPt-5899 wPt-4729
9
2AS gwm1045 877 DZm-2009 DZo-2010 DZm-
2010
33 - 58 39 gwm425 cfa2263 125
2BL wmc356 220 DZo-2009 DZm-2009 DZo-
2010
32 - 66 41 - 0
3AS wPt-7992 8 DZo-2009 DZm-2009 DZo-
2010 DZm-2010
17 - 47 33 wPt-6854 barc12 wPt-1111 35
3AL wmc388 856 DZo-2009 DZo-2010 DZm-
2010
19 -41 4 - 0
5AL gwm126 933 DZo-2009 DZo-2010 DZm-
2010
18 -48 41 - 0
5AL gwm291 1117 DZo-2009 DZm-2009 DZo-
2010
27 -57 44 - 0
6AL gwm427 1395 DZo-2009 DZm-2009 DZm-
2010
17 -68 35 wmc580 01
6AL CD926040 144 DZo-2009 DZm-2009 DZo-
2010 DZm-2010
35 - 113 71 wPt-9474 wPt-4229 wPt-5654 wPt-3247
wPt-4663
93
6AL barc104 1553 DZo-2009 DZm-2009 DZm-
2010
61 - 97 45 - 0
7AS wPt-2799 382 DZo-2009 DZm-2009 DZo-
2010 DZm-2010
17 - 49 52 barc70 gwm1187 wmc479 63
7AS wPt-7785 948 DZo-2009 DZo-2010 DZm-
2010
11 - 23 15 - 0
a position of the QTL most associated marker as from the durum consensus map used as reference
b range of R
2 value across the three to four evaluation seasons with significant marker-trait association
c R
2 value for the marker most associated to the QTL (averaged over the four evaluation seasons)
107
Table 5 Quantitative trait loci (QTLs) for stem rust response identified through association mapping in a panel of 183 elite durum wheat
accessions evaluated during four seasons in Ethiopia with significant effects observed in two out of four evaluation seasons For each
QTL the chromosome position the associated markers and QTL features are reported
Chr
Most associated
marker Position (cM)a
Seasons with significant marker-trait
associations
R2 range
()b R
2 ()
c
Associated markers
in the QTL region
Interval
width
(cM)a
1AS gpw2246 0 DZo-2009 DZm-2009 23 - 47 31 - 0
1AS wPt-5411 696 DZm-2009 DZo-2010 14 - 16 13 gwm164 1
1BL cfd65 408 DZm-2009 DZm-2010 35 - 38 24 wPt-8168 gwm947 11
1BL wPt-0202 857 DZo-2009 DZm-2009 14 - 20 1 wPt-0506 wPt-3227 06
2AS wPt-7049 269 DZo-2010 DZm-2010 17 - 32 16 barc212 4
2BS wPt-8404 757 DZm-2009 DZm-2010 22 - 61 16 wmc257 wmc243
wmc25
2
2BL wmc361 29 DZm-2009 DZo-2010 25 - 43 2 - 0
2BL gwm1300 1691 DZo-2009 DZm-2010 16 - 80 17 wPt-5242 1
3AL wPt-1923 464 DZm-2009 DZm-2010 22 - 45 22 wPt-3348 wPt-1652 0
3AL wmc428 1105 DZo-2009 DZm-2009 44 - 68 38 - 0
3AL wPt-8203 2003 DZo-2009 DZm-2009 19 - 25 18 barc1177 59
4AL wPt-9196 1024 DZo-2010 DZm-2010 10 - 15 1 wPt-2985 wPt-8886
wPt-8271 wPt-8167
wPt-3108 wPt-3796
wPt-6502 wPt-7821
69
a position of the QTL most associated marker as from the durum consensus map used as reference
b range of R
2 value across the evaluation seasons with significant marker-trait association
c R
2 value for the marker most associated to the QTL (average over the four evaluation seasons)
108
Table 5 Continuedhellip
Chr
Most associated
marker Position (cM)a
Seasons with significant marker-trait
associations
R2 range
()b R
2 ()
c
Associated markers
in the QTL region
Interval
width
(cM)a
4AL wPt-0798 1110 DZo-2009 DZm-2010 28 - 29 19 wPt-5055 00
4BL wPt-8543 1019 DZo-2009 DZo-2010 12 - 29 14 - 00
5BL wPt-9300 1189 DZm-2009 DZo-2010 12 - 19 11 wPt-2453 wPt-1733 00
6AS wPt-7330 186 DZm-2009 DZo-2010 12 - 36 16 wPt-1742 wPt-
5395 wPt-5633 tPt-
6710 wPt-1377
wPt-9075 wPt-6520
wPt-7754 wPt-
4016wPt-4017 wPt-
3468
75
6AL tpt-4209 1096 DZm-2009 DZo-2010 23 - 26 15 gwm1150 84
6AL gwm169 1266 DZo-2009 DZm-2010 20 - 30 15 00
6BS wPt-1437 419 DZo-2009 DZo-2010 22 - 23 13 wPt-2095 wPt-7935 24
7AS wPt-5489 00 DZo-2009 DZo-2010 15 - 18 20 00
7AL wPt-0745 2484 DZo-2009 DZm-2010 17 - 22 13 wPt-7763 00
7BS gwm573 666 DZo-2009 DZm-2009 29 - 57 34 gwm1184wmc182 62
7BL wmc517 1556 DZm-2009 DZm-2010 35 - 36 23 - 00
7BL wPt-8615 1759 DZo-2010 DZm-2010 23 - 27 21 wPt-5343 wPt-
1715 wPt-4298
wPt-4869 wPt-
7362 wPt-4010
wPt-7191 wPt-
7351 Pt-8417 wPt-
4045 gwm611
21
0
a position of the QTL most associated marker as from the durum consensus map used as reference
b range of R
2 value across the evaluation seasons with significant marker-trait association
c R
2 value for the marker most associated to the QTL (average over the four evaluation seasons)
109
Table 6 Allele frequencies and phenotypic coefficients of infection (CI) least square means for the markers most associated to the QTLs
consistently observed over three to four evaluation seasons Data are reported for the common allelic variants only (frequency ge 010)
CI least square means
Chromosome Marker Allele a b Allele frequency DZo-2009 DZm-2009 DZo-2010 DZm-2010 Mean over four seasons
1BS barc8 257 023 527 70 872 483 636 b
255 077 469 464 679 363 494 a
2AS gwm1045 Null 012 523 609 848 519 621 b
180 076 505 475 744 391 529 a
172 012 565 641 952 481 659 c
2BL wmc356 180 012 224 20 611 233 324 a
178 069 402 342 743 337 455 b
176 019 476 379 899 275 499 c
3AS wPt-7992 1 021 599 641 809 478 623 b
0 079 502 499 733 404 533 a
3AL wmc388 250 029 614 533 757 434 574 b
258 038 602 559 816 446 608 c
275 033 479 459 707 355 496 a
5AL gwm126 nu11 046 51 488 748 413 537 b
214 042 418 41 672 329 448 a
208 012 498 449 772 423 525 b
5AL gwm291 166 045 499 483 718 391 519 b
160 04 546 592 819 432 596 c
139 015 429 449 607 397 473 a
6AL gwm427 212 072 551 536 764 451 575 b
188 028 458 436 699 334 485 a
6AL CD926040 855 032 501 498 731 398 534 a
851 04 689 613 838 557 669 b
845 028 618 678 896 486 673 b
6AL barc104 206 021 506 686 766 329 562 b
202 03 50 489 737 379 524 a
172 049 629 684 819 491 638 c
7AS wPt-2799 1 042 482 447 705 366 499 a
0 058 556 593 782 453 596 b
7AS wPt-7785 1 078 486 46 718 387 509 b
0 012 409 419 649 313 451 a a molecular weight (bp) of the alleles at SSR markers presence (1) or absence (0) of the band at DArT markers (wPt-) b ldquordquo indicates the most resistant allele
Least square means reported with bold font refer to the marker-environment pairs showing significant associations For each locus the least significant
difference between the allele means over four seasons was calculated means followed by different letters are significantly different (P le 005)
110
Table 7 Allele frequency within each of the five germplasm subgroups (S1 to S5) for the markers most associated to the QTLs
consistently observed over three to four evaluation seasons
Frequency with in
subgroups
Chromosome Marker Allele a b Subgroup 1 (S1) ICARDA
drylands ((11) a)
Subgroup 2 (S2) ICARDA
temperate (55)
Subgroup 3 (S3) Italian and
earlyrsquo70s CIMMYT (26)
Subgroup 4 (S4) Late
70s CIMMYT (56)
Subgroup 5 (S5) late
rsquo80s CIMMYT (35)
1BS barc8 257 0 02 073 012 015
255 1 08 027 089 085
2AS gwm1045 Null 02 018 013 01 007
180 08 079 025 088 093
172 0 003 069 002 0
2BL wmc356 180 0 03 0 005 0
178 1 062 017 084 1
176 0 008 083 011 0
3AS wPt-7992 1 009 033 029 017 006
0 091 067 071 083 094
3AL wmc388 250 0 037 065 028 006
258 0 043 025 052 025
275 1 02 01 02 069
5AL gwm126 nu11 018 043 02 043 085
214 082 041 048 048 015
208 01 016 032 009 0
5AL gwm291 166 01 047 013 042 077
160 0 039 063 054 02
139 09 014 024 004 002
6AL gwm427 212 0 063 087 08 058
188 1 037 013 02 042
6AL CD926040 855 018 024 008 022 079
851 072 044 065 036 012
845 01 032 027 042 009
6AL barc104 206 033 028 024 02 006
202 033 024 005 012 084
172 033 048 071 067 01
7AS wPt-2799 1 03 037 045 025 073
0 07 063 055 075 027
7AS wPt-7785 1 05 078 073 08 1
0 05 022 027 02 0 a molecular weight (bp) of the alleles at SSR markers presence (1) or absence (0) of the band at DArT markers (wPt-) b ldquordquo indicates the most resistant allele
Least square means reported with bold font refer to the marker-environment pairs showing significant associations
111
CHAPTER 5 GENOME-WIDE SEARCH OF STEM RUST RESISTANCE LOCI AT
THE SEEDLING STAGE IN DURUM WHEAT
Tesfaye Letta15
Pablo Olivera2 Marco Maccaferri
1 Yue Jin
2 Karim Ammar
3 Ayele
Badebo4 Enrico Noli
1 Jose Crossa
3 Roberto Tuberosa
1
1DiSTA University of Bologna Viale Fanin 44 40127 Bologna Italy
2United States Department of Agriculture-Agricultural Research Service (USDA-ARS)
Cereal Disease Laboratory 1551 Lindig Street St Paul MN 55108 USA
3CIMMYT CIMMYT Carretera Mexico-Veracruz KM 45 56130 Texcoco Mexico
4Debre Zeit Agricultural Research Center Debre Zeit Ethiopia
5Sinana Agricultural Research Center Bale-Robe Ethiopia
51 ABSTRACT
Stem rust caused by Puccinia graminis f sp tritici (Pgt) is one of the most destructive
diseases of both durum and bread wheat Recently emerged races in East African such as
TTKSK (or Ug99) possess broad virulence to durum cultivars and only a limited number of
known genes were effective Association mapping (AM) was used to identify quantitative
trait loci (QTLs) for resistance to stem rust races in a panel of 183 elite durum wheat
accessions tested under controlled conditions at seedling stage The panel was genotyped
with 1250 SSR and DArTreg markers Overall 15 20 19 and 19 chromosome regions were
significantly associated to the response to TRTTF TTTTF TTKSK (Ug99) and JRCQC
races respectively QTL R2 values ranged from 113 to 2312 One QTL on chromosome
5A and two on chromosome 6A provided resistance to all tested races whilst the majority
showed significant effects to one or two races Some QTLs were co-located with known Sr
genes (eg Sr9 Sr13 and Sr14) while others mapped in chromosome regions where no Sr
genes have previously been reported Two major QTLs on chromosome arm 6AL mapped in
the region known to harbour Sr13 and showed major effects on TTTTF TTKSK and JRCQC
(R2 up to 2312) and a minor effect on TRTTF The combined analysis of the results of this
study with those on adult plant resistance in Ethiopia where such races are present provide
valuable indications to identify suitable parental lines for further improving stem rust
resistance of durum wheat
112
52 INTRODUCTION
Durum wheat (Triticum turgidum ssp durum Desf) is an important crop for tens of millions
in the Mediterranean Basin particularly in West Asia and North Africa (WANA) where
durum wheat is grown annually over more than 13 million hectares Mediterranean countries
account for approximately 75 of global worldwide durum wheat production (Belaid 2000
Habash et al 2009) In Sub-Saharan Africa Ethiopia is the largest wheat-growing country
and is one of the centers of diversity for tetraploid wheat Durum wheat represents
approximately 40 of the total wheat area in Ethiopia with a tendency to increase in
response to the growing internal demand for pasta (Badebo et al 2009)
Durum production and kernel quality can be negatively affected by rust diseases (Singh et al
2005) Historically stem rust infections of Puccinia graminis Pers f sp tritici (Pgt) have
caused severe losses to wheat production (McIntosh and Brown 1997 Eversmeyer and
Kramer 2000 Singh et al 2011) While more than 50 stem rust resistance (Sr) loci have been
identified in cultivated wheat and wild relatives only a few of them remained effective
against the new emerging races in East Africa including TTKSK = Ug99 (Pretorious et al
2000) and its variants and even fewer are effective against the durum-specific Ethiopian
races (Admassu et al 2009 Rouse et al 2012) In Ethiopia Ug99 was in fact added to
previously existing races several of them specifically virulent on durum wheat (Admassu and
Fekedu 2005 Haile et al 2012) Two such races have been characterised as TRTTF and
JRCQC with a combined virulence on stem rust resistance genes Sr9e and Sr13 (Olivera et al
2012) and virulence on Sr13 appears to be widespread in Ethiopia (Admassu et al 2009)
Very limited effective resistance (52) to races TRTTF and JRCQC was found in a highly
diverse collection of 996 tetraploid genotypes evaluated for field reaction at the Debre Zeit
Research Station in Ethiopia (Olivera et al 2012) Therefore the combination of Ug99 and
Sr13- and Sr9e-virulent Ethiopian races represents a major threat to the viability of the
Ethiopian durum wheat production Achieving higher and more durable stem rust resistance
requires the characterisation of the genetic basis underlying the resistance present in
improved germplasm or in exotic sources used for introgression in breeding Only then can
breeding programmes develop strategies to pre-emptively counter the emerging new
virulence types in the pathogen populations Whereas field resistance is the ultimate goal
113
sought in breeding programmes seedling tests are a good complement for resistance
characterisation as they allow large number of lines to be screened for reaction to multiple
races one race at a time in a short period and with modest space requirements (Sun and
Steffenson 2005) Seedling screening provides information allowing postulating the presence
of certain genes based on the series of races available without confounding effects of having
several races acting at the same time as it is often the case in field experiments
Marker-based approaches can be used to identify genesquantitative trait loci (QTLs)
governing plant response to diseases The standard approach is to use biparental mapping
populations to relate phenotypic information to genotypic data obtained from molecular
markers in order to determine the number and chromosomal location of resistance loci
(Maccaferri et al 2008 Simons et al 2011 Singh et al 2013) An alternative to the use of
biparental mapping is association mapping (AM) or linkage disequilibrium (LD)-based
mapping in which genotype-phenotype relationships are explored in germplasm collections or
natural populations (Rafalski 2002 Flint-Garcia et al 2003) Since its first use in plants a
decade ago (Thornsberry et al 2001) AM has been used in many crops due to advances in
high-throughput genotyping technologies increased interest in identifying useful andor
novel alleles and improvements in statistical methods (Gupta et al 2005 Yu et al 2006 Zhu
et al 2008) In both tetraploid and hexaploid wheat AM has already proven to be an effective
strategy to identify marker-trait associations for agronomically valuable traits (Breseghello
and Sorrells 2006 Crossa et al 2007 Maccaferri et al 2010 2011) including resistance to
stem rust (Yu et al 2011) and leaf rust (Maccaferri et al 2010) in durum wheat Linkage
disequilibrium (LD) in the cultivated durum wheat germplasm ranges from 5 to 10 cM
(Maccaferri et al 2005) thus enabling a whole-genome scan analysis for marker-trait
associations with a relatively modest number of markers as compared to species with lower
LD
The objectives of this study were a genome-wide search in durum wheat for resistance loci to
races TRTTF TTTTF TTKSK and JRCQC of P graminis f sp tritici at the seedling stage
and the identification of genomic regions suitable for marker-assisted selection and further
genetic dissection
114
53 MATERIALS AND METHODS
531 Plant materials
One hundred eighty-three accessions from different durum wheat-growing regions of
Mediterranean countries (Italy Morocco Spain Syria and Tunisia) Southwestern USA and
Mexico already used in previous AM analysis for stem rust resistance under field conditions
(Letta et al 2013) were analysed in this study (Appendix 1) A detailed description of the
accessions at the molecular and phenotypic level is reported in Maccaferri et al (2006 and
2010)
532 Stem rust evaluation at seedling stage
Pathogen races
The AM panel was evaluated for reaction to four Pgt races TRTTF TTTTF TTKSK and
JRCQC The race designation is based on the letter code nomenclature system (Roelfs and
Martens 1988 Roelfs et al 1993) modified to further delineate races in the TTKS lineage
(Jin et al 2008) These races were selected based on their differential virulence pattern andor
importance for durum wheat Race TTKSK (Ug99) has a wide virulence spectrum and is
rapidly evolving in East Africa Race TTTTF is the most widely virulent race known in the
United States producing high infection types on the majority of stem rust differential lines
(Jin et al 2007) Races TRTTF and JRCQC both present in Ethiopia possess a virulence
combination that overcomes both the resistance genes Sr13 and Sr9e two genes present at
high frequency in durum wheat (Klindworth et al 2007) Information about the stem rust
isolates used in the disease phenotyping tests is summarised in Table 1
533 Inoculation incubation and disease assessment
The AM panel was evaluated under controlled conditions using a completely randomised
design with two replications (over time) for each of the four races Five to six seedlings per
line were inoculated on the fully expanded primary leaves 8 to 9 days after planting This
work was conducted at the Cereal Disease Laboratory St Paul MN USA and the
115
experimental procedures in inoculation and disease assessment were done as described by Jin
et al (2007) Wheat cultivar McNair 701 (CItr 15288) was used as susceptible control Plants
were evaluated for their infection types (ITs) 14 days post-inoculation using the 0-4 scale
according to Stakman et al (1962) where ITs of 0 - - 1 - 2 or X are considered as low IT
and ITs of 3 or 4 are considered as high ITs Lines giving variable reactions between
experiments were repeated again to confirm the most likely reactions
534 Statistical analysis
Stakmanrsquos ITs were converted to a linear scale using a conversion algorithm proposed by
Zhang et al (2011) Briefly infection types are converted as follows 0 1- 1 1+ 2- 2 2+ 3-
3 and 3+ are coded as 0 1 2 3 4 5 6 7 8 and 9 respectively The symbol for
hypersensitive flecks () is converted to 0 and IT 4 is converted to 9 Special annotation codes
C and N are ignored Double minus and double plus annotations are converted to single
minus and single plus respectively Complex ranges such as 12+ are first collapsed to 2+
Then the first and last ITs of the ranges are converted and averaged with the first IT double-
weighted because the most prevalent IT is listed first Infection types X- X and X+ are
converted to linearised scores of 4 5 and 6 respectively These linearised 0-9 scale values
were used for subsequent statistical analysis
The heritability of linearised infection type responses was calculated for each of the four
races on a mean basis across two replications according to the following h2 =
2G (
2G +
2
Er) where r = number of replicates 2
G = genotypic component of the MS among
accessions and 2
E = MSerror with MS indicating the mean square values as from the ANOVA
results
The dendrogram analysis was carried out using NTSYS-pc software version 20 (Rohlf
1997) and was based on the virulence phenotypes (Infection Types estimated with a 0-4
scale) of the races the distances among races have been computed using the standardised
Manhattan distances (lsquocity-blockrsquo method)
116
535 Molecular profiling
Genomic DNA extraction and other molecular procedures were carried out as described in
Maccaferri et al (2010) The accessions were profiled with 350 simple sequence repeat loci
(SSR) 900 Diversity Array Technology (DArT) markers and three additional sequence
tagged site (STS) markers including those previously reported to be associated to major stem
rust resistance genes (Yu et al 2010)
536 SSR markers
The SSR primers were chosen among the publicly available sets catalogued in the
GrainGenes database (httpwheatpwusdagov) as BARC (barc marker loci) CFA-CFD-
GPW from INRA (cfa cfd and gpw respectively) KSUM (ksum) WMC (wmc) and WMS
(gwm) an additional subset of private genomic WMS primers from Trait Genetics (supplied
by M Ganal TraitGenetics Gatersleben Germany) were also used The SSR loci used to
genotype the accessions were preselected for (i) clarity and repeatability of the amplicons (ii)
polymorphism level and (iii) even distribution on the A- and B-genome linkage groups The
choice was carried out based on the results of a survey of SSR primer pairs conducted on a
small subset of eight germplasm founder accessions and lines used as parents of mapping
populations A unique thermo-cycling protocol (Maccaferri et al 2008) was implemented for
all primer sets and SSR profiles using an automated LI-COR 4200 IR2 System (LiCor
Lincoln NE USA) Genotyping was performed for most SSR markers using the M13-labeled
primers and amplification protocol (Schuelke 2000) Alleles were scored using founder
genotypes as an allele reference set
537 DArT markers
DArT markers were generated by Triticarte Pty Ltd (Canberra Australia http
wwwtriticarte com au) as described by Akbari et al (2006) The Durum wheat PstI TaqI
array v 20 containing 7600 single DArT clones (Mantovani et al 2008) was used for
genotyping the panel The locus designation used by Triticarte Pty Ltd was adopted (lsquowPtrsquo
117
lsquorPtrsquo and lsquotPtrsquo loci corresponding to the respective clones of the genomic representation) and
alleles at polymorphic loci were scored as hybridisation positive (1) or negative (0)
538 Association mapping
For AM analysis only markers with non-rare alleles (frequency gt 010) in the AM Durum
Panel were considered for the LD and marker-trait association analysis thus reducing the
false positives and the LD inflation effects which have frequently been attributed to the use of
rare alleles (Myles et al 2009) Rare alleles were considered as missing data Data-points
showing residual allelic heterogeneity within accession were also considered as missing data
In total 1211 markers were used for marker-phenotype association tests Among these 323
SSRs and STSs and 538 DArT markers were projected onto a consensus linkage map
obtained from the genotypic data of five recombinant inbred line (RIL) mapping populations
using the Carthagene v 40 software (de Givry et al 2005) The RIL mapping populations
included four populations from the crosses Kofa times Svevo (KS RIL Maccaferri et al 2008)
Colosseo times Lloyd (CL RIL Mantovani et al 2008) Meridiano times Claudio (MC RIL
Maccaferri et al 2011) and Simeto times Levante (SL RIL Maccaferri et al unpublished)
developed by a joint effort of Produttori Sementi Bologna SpA (Argelato BO Italy) and
DipSA Bologna Italy and one population obtained from the cross Kofa times UC1113 (KU RIL
population Zhang et al 2008) whose genotypic data were downloaded from the GrainGenes
web database The consensus linkage map was obtained from the five data-sets using the
Carthagene v40 software (de Givry et al 2005) Merging was performed with the dsmergen
command after checking for marker order consistency across maps so that for each marker
pair a single recombination rate was estimated based on all available meioses A framework-
mapping method was applied Non-framework markers were incorporated in the framework
map by building a complete map using the framework map as a fixed order The marker order
and inter-marker genetic distances from the consensus map were used to report the LD and
association results The remaining 332 polymorphic and informative DArT markers and 17
SSRs that could not be integrated into the final map were not further considered Details on
the consensus map are reported in Letta et al (2013)
118
539 Genetic structure and linkage disequilibrium analysis
The genetic structure of the panel has been investigated with a combination of model- and
distance-based analyses Model-based population structure was assessed deploying a
selection of 96 loosely linked highly informative and evenly spaced SSRs and using the
program STRUCTURE v 2 (Pritchard et al 2000) Details for structure and kinship analysis
were reported in Maccaferri et al (2010 2011) The program TASSEL
(httpwwwmaizegenetics net) was used to estimate the LD parameters Drsquo and r2 values as
a function of the corresponding inter-marker distances and the comparison-wise significance
was computed with 10000 permutations The r2 parameter was estimated for all loci on the
same chromosome and compared based on the genetic distances measured in cM If all pairs
of adjacent loci within a given chromosomal region were in LD this region was referred to as
an LD block (Stich et al 2005)
5310 Marker-phenotype association analysis
Genome-wide scan for loci governing stem rust resistance at the seedling stage was
conducted using phenotypic data converted to a linear scale AM analysis was carried out
with TASSEL ver 21 (www maizegeneticsnet Yu et al 2006) The 323 SSRs and STSs
and 538 DArT markers were tested for significance of marker-trait associations under (i) the
fixed general linear model (GLM) including the Q population structure results as covariates
(Q GLM) (ii) the mixed linear model (MLM) including the Q population structure results
plus the K kinship matrix (Q + K MLM)
For GLM analysis besides the marker-wise association probability values the experiment-
wise association significance probability was obtained based on a permutation test
implemented in TASSEL (10000 permutations were used) The experiment-wise P-value
provides a much more severe test of significance (adjusted P-value) that corresponds to the
experiment-wise error and was used to make decisions about the significance of marker
effects (Bradbury et al 2007) In the MLM analysis experiment-wise significance was
119
inspected using the False Discovery Rate (FDR) approach according to Storey and Tibshirani
(2003) and implemented in Qvalue program
Multiple adjacent co-segregating significant markers were assigned to a unique QTL region
upon meeting the following conditions less than 20 cM of inter-marker genetic distance
presence of significant and strong LD among the markers (with r2 values ge 04) within the
QTL region and consistency of allelic effects across significant markers (Massman et al
2011)
54 RESULTS
541 Seedling evaluations
Seedling ITs for each of the 183 durum accessions are presented in the Appendix 3 The ITs
frequency distribution presented in Figure 1 depicts a continuous variation for all four races
with that for JRCQC being skewed toward susceptibility scores (3 and 4) The analysis of
variance for stem rust seedling response showed highly significant differences (P le 00001)
among races and accessions with highly significant effects of subgroups of accessions and
subgroup times race interaction (results not reported) The highly variable classification and
ranking of the accessions (Appendix 3) based on their responses to the different races
supports the significance of the race times accession interaction Heritability of the linearised IT
values was high for all four races ranging from h2 = 930 for race TTTTF to h
2 = 989 for
TTKSK
The frequencies of accessions categorised as resistant susceptible and heterogeneous in their
reaction to the four races varied markedly depending on the race (Table 2) Seedling
resistance to TRTTF TTTTF TTKSK and JRCQC was observed in 149 (814) 117
(639) 106 (579) and 87 (475) accessions respectively (Table 2) with the race
TRTTF from Yemen showing the lowest degree of virulence and the Ethiopian race JRCQC
showing the highest degree of virulence among the four races Sixty-six (361) accessions
were resistant (IT = 0 to 23) to all four races Figure 2 reports the pattern of diversity among
the four stem rust races based on the UPGMA-cluster analysis of the avirulencevirulence
patterns on the 183 durum accessions The dendrogram clearly shows that the races grouped
120
into three well-distinct groups with TTTTF and TTKSK that clearly clustered together while
TRTTF and JRCQC showed independent virulence patterns Highly significant correlations
of ITs among genotypes were observed for all the four races In particular relatively high r-
values were observed for the pair-correlations of TTKSK vs TTTTF (072) TTTTF vs
JRCQC (057) TRTTF vs TTTTF (051) TTKSK vs TRTTF (046) The correlation of ITs
between JRCQC and TTKSK or JRCQC and TRTTF was rather weak (036 and 015
respectively)
542 Relationship between population structure and seedling response to stem rust
The genetic relationships among the accessions were investigated using both a genetic-
similarity and a model-based Bayesian clustering method and the results have been reported
elsewhere (Maccaferri et al 2006 2011 Letta et al 2013) Both methods pointed out that the
minimum and optimum number of hypothetical well-distinct subgroups present in the panel
was equal to five corresponding to clearly distinct breeding lineages (from S1 to S5) Each
subgroup contains 11 55 26 56 and 35 accessions respectively The differences for seedling
stem rust response among the five subgroups were highly significant (P le 0001 data not
shown) The coefficients of membership to the five main subgroups as estimated with
STRUCTURE were used to assess the effect of population structure to single race responses
by means of multiple regressions The percentage of phenotypic variation accounted for by
population structure ranged from a minimum of 909 for race TTKSK to a maximum of
1215 for race JRCQC
The percentages of resistant and susceptible accessions for each of the five main subgroups
are reported in Table 3 This clearly shows that all five subgroups included accessions with
different responses thus indicating that all subgroups are equally informative for AM
purposes The complete dataset of seedling phenotypic response and population structure
membership coefficients for each of the 183 accessions included in the association panel is
reported as Appendix 3
The ranking values of the four races based on their frequencies of avirulence virulence
interactions considering the germplasm collection as a whole (with TRTTF showing the
121
highest degree of avirulent interactions followed by TTTTF TTKSK and finally JRCQC
which showed the highest frequency of virulent interactions) was roughly confirmed when
considering each of the five different subgroups of germplasm accessions separately (Table
3) One exception was observed for the race virulence spectrum to accessions of subgroup 3
(including the Italian and early lsquo70s CIMMYT germplasm) where race TTTTF showed the
highest frequency of avirulence and race TTKSK resulted the most virulent Differences
among subgroups for frequency of resistance were observed in the proportion of accessions
resistant to a given race For all four races subgroup 5 (CIMMYT germplasm of late 80s
early 90s) had the highest frequency of seedling resistant accessions mostly scored as IT = 2
(Table 3) On the other hand subgroup 1 (ICARDA accessions for rainfed environments)
which is also the least represented within the panel had the highest frequency of susceptible
accessions except when considering TRTTF for which only subgroup 3 showed a higher
frequency of susceptible accessions Overall more accessions in subgroups 4 and 5 showed
resistance to all the four races than in the other subgroups
543 Association mapping for seedling response to stem rust
The results of AM are reported in Table 4 AM revealed several putative QTLs for stem rust
resistance at the seedling stage using the four races In total 41 distinct QTLs represented by
either single markers or sets of closely linked markers were found to be significantly
associated to the seedling response to the four tested races under the Q + K MLM models
with 15 20 19 and 19 QTLs for the response to TRTTF (marker R2 from 113 to 834)
TTTTF (R2 from 192 to 1764) TTKSK (R
2 from 175 to 2312) and JRCQC (R
2 from
151 to 1533) respectively (Table 4) All these regions identified with the Q + K MLM
showed significant effects also with the Q GLM model In some cases the presence of a QTL
was evidenced by multiple significant associations at linked SSR and DArT markers within
10 cM as estimated from the durum consensus map and LD r2 values higher than 04 in most
cases (result not reported) Using a more stringent model including the False Discovery Rate
(FDR) multiple testing correction and Q + K MLM model the number of chromosomal
regions (QTLs) that showed significant (P le 005) associations were 4 3 4 and 4 for races
TRTTF TTTTF TTKSK and JRCQC respectively (Table 4) while the Q GLM model
detected a higher number of significant markers
122
The most important region in terms of significance and R2
effects was observed on
chromosome arm 6AL a 287 cM interval harboring four distinct QTLs with R2 values
ranging from 151 to 2312 Within this large interval noticeable associations across the
four races were found at the two sites tagged by CD926040 (1439 cM on the consensus
linkage group) and barc104 (1553 cM) These two sites (CD926040 and barc104) showed
consistently high R2 values (from 1047 to 2312) for races TTTTF TTKSK and JRCQC
Conversely CD926040 and barc104 showed only a limited effect though still significant for
race TRTTF (R2 values equal to 352 and 284 respectively)
In terms of significance across all four races apart from the two sites on chromosome arm
6AL only one QTL on chromosome 5A (gwm410) showed significant effects in response to
all the four races considered in this study Two genomic regions were identified on
chromosomes 1B (barc61) and 2A (wPt-5839) that were putatively effective across three
races (TRTTF TTTTF and TTKSK but not for race JRCQC at both regions) The R2 values of
marker on chromosome 1B ranged from 227 to 245 while marker on chromosome 2A
explained from 160 to 244 of the phenotypic variation On chromosome 3A marker wPt-
1923 tagged a region significant for TTTTF TTKSK and JRCQC with R2 values from 209 to
398 Race-specific effects (P lt 0001) were observed for each race as following for race
TRTTF putative genomic regions significantly affecting the response were found on
chromosomes 2A 2B and two regions on chromosome 7A The region with the largest effect
(R2 = 834) was tagged by gwm47 on chromosome 2BL The second and third regions with
a sizeable effect to the response to race TRTTF were tagged by markers wPt-6668 and
gwm344 on chromosome 7A with R2
values of 270 and 579 respectively Marker wPt-
2293 on chromosome 2A tagged an additional region with a sizeable effect (R2 = 420) on
this race For race TTTTF marker wmc517 on chromosome 7B showed a significant effect
(R2 = 800) that was shared with race TTKSK (R
2 = 496) A QTL (R
2 = 487 and
275) specific for TTKSK and TTTTF respectively was observed on chromosome 3B
(wmc43) Remarkably up to ten QTLs showed specificity for race JRCQC These ten QTLs
were tagged by wPt-1876 wPt-9049 barc78 gwm1570 barc165 gwm234 wPt-2991
gwm816 gwm573 and gwm333 Among those QTLs the most important in terms of
significance and R2
value was located on chromosome 4A tagged by barc78 (R2 = 936)
123
55 DISCUSSION
There is a growing interest in applying association mapping (AM) to a wide range of crops to
identify genesQTLs responsible for quantitatively inherited variation (Ersoz et al 2009 Hall
et al 2010 Stich and Melchinger 2010 Kollers et al 2013 Li et al 2013) Accordingly a
better understanding of the genetic basis underlying the naturally occurring genetic diversity
for stem rust response in durum wheat could help to accelerate the progress for enhancing
stem rust resistance of this crop while shedding light on the evolution of the host-pathogen
relationships Along this line the panel of accessions herein evaluated surveys the genetic
variation present in elite germplasm pool commonly used by durum breeders a feature that
makes our results more readily transferable to and more valuable for pre-breeding activities
551 Relationship between QTLs for resistance at seedling and field evaluations
A previous study has examined the present collection for resistance to stem rust under field
conditions (Letta et al 2013) in Ethiopia using an inoculum which included three of the four
races (TTKSK TRTTF and JRCQC) tested herein Such study highlighted the presence of 24
QTLs with significant effects in two out of four seasons and 12 QTLs in three out of four
seasons (Letta et al 2013) QTLs detected at seedling stage associated with resistance to the
four races namely those tagged by CD926040 and barc104 were significantly and
consistently (over seasons) associated with resistance under field conditions as well
CD926040 and barc104 located on the long arm of chromosome 6A are linked to Sr13
(Simons et al 2011) Marker gwm410 on chromosome 5AL also showed a significant effect
for three seasons under field conditions and for all four races at the seedling stage QTLs
tagged by gwm1300 gwm169 and wmc517 showed significant effect to race TTKSK as well
as under field conditions for two seasons Among the markers associated with resistance to
this race gwm1300 and gwm169 were in the same regions harbouring SrWeb and Sr26
respectively which are known to be effective against race TTKSK (Ug99) (Yu et al 2011)
The seedling QTL on chromosome 2B tagged by wmc356 which showed a significant effect
with races TTTTF and JRCQC also showed significant effects in the field condition for two
seasons Seedling QTL specific to race JRCQC tagged by marker gwm573 showed significant
124
effect under field conditions for two seasons Other specific QTLs detected for the same race
at loci gwm1620 and barc78 on chromosomes 3A and 4A respectively were located in
regions very close to markers which showed significant effects under field conditions for four
and two seasons respectively
552 significant markers linked to previously identified Sr genes
The analysis of the results obtained with both the Q GLM and Q + K MLM models
highlighted several chromosome regions putatively harboring QTLs with main effects for
stem rust response at the seedling stage To determine whether any known resistance gene
coincides with the putative genomic regions identified in this study the current results were
compared with previous findings for stem rust resistance in wheat Several QTLs identified in
this study co-located at previously reported major Sr loci as well as to a number of QTLs
recently identified through linkage mapping in tetraploid wheat (Haile et al 2012) and AM in
hexaploid wheat (Yu et al 2011 2012) One QTL tagged by wPt-1876 (chromosome 1B) for
response to race JRCQC corresponds to a region previously shown to influence stem rust
resistance in two independent studies (Crossa et al 2007 Yu et al 2011) This region
harbours Sr14 which appears effective against several stem rust races (Singh et al 2006)
However this region did not show significant effects for race TTKSK in accordance to the
Sr14 seedling IT reported by Jin et al (2007) The genomic region on the distal part of
chromosome 1B tagged by wmc44 and associated with seedling resistance to TTTTF and
JRCQC has been shown to harbour genes for multiple diseases Lr46Yr29Pm39 and a yet to
be named gene for APR to stem rust (Bhavani et al 2011 Ravi Singh personal
communication) On chromosome 2A cfa2201 and wPt-5839 co-located with the region
known to host Sr38 and Sr34 respectively However both genes are ineffective against races
of the Ug99 lineage (Jin et al 2007 Singh et al 2011) and originate from Triticum comosum
and Triticum ventricosum which makes their presence in durum wheat highly unlikely
Consequently cfa2201 and wPt-5839 could be linked to putatively new loci Several Sr genes
are located on chromosome arm 2BL including Sr9 Sr16 Sr28 (McIntosh et al 1995) and
SrWeb (Hiebert et al 2010) SrWeb confers resistance to Ug99 while none of the several
alleles of Sr9 confers resistance to the same race (Jin et al 2007) Hence the significant
effects detected by gwm1300 for race TTKSK might be tagging the presence of SrWeb
125
(Hiebert et al 2010) while gwm47 detected for race TRTTF might tag potential new alleles
near or at the Sr9 locus Additionally at the end of chromosome 2B significant effects of
wmc356 to races TTTTF and JRCQC were detected but it is unlikely that Sr16 or Sr28 plays
any role since both genes are ineffective to these races At chromosome arm 3BS several Sr
genes including Sr2 Sr51 Sr12 and SrB (Yu et al 2009) are known Among more than 50
stem rust resistance loci identified so far Sr2 is one of the most widely deployed (McIntosh
et al 1995) and has provided durable adult plant rust resistance for more than 50 years A
previous study suggested that the Sr2 APR allele is rare in the AM panel (Letta et al 2013)
Similarly in the present study none of the markers on chromosome arm 3BS showed
significant effects near the position of Sr2 (Mago et al 2010) The chances of detecting Sr2 at
the seedling stage based on the IT responses were minimal being this gene an APR locus
Nevertheless Sr2 has been reported to be tightly linked to a specific leaf chlorosis (mosaic)
phenotype (Brown 1997) which was not observed in the entire panel (Olivera personal
communication) However the genomic region at wmc43 on chromosome arm 3BS
conferring resistance to races TTKSK and TTTTF is in the same region of a previously
reported QTL region for field stem rust resistance (Yu et al 2011)
Four markers mapped in a 2870 cM-wide region on chromosome arm 6AL with low LD as
to each other (gwm169 gwm427 CD926040 and barc104) showed significant effects in the
same region previously reported to harbour genes for stem rust resistance For instance
gwm427 CD926040 and barc104 correspond to the region reported by Simons et al (2011)
and Letta et al (2013) while gwm169 co-locates with Sr26 a gene effective against Ug99
(Singh et al 2006) and the Ethiopian races (Badebo and Ammar unpublished results)
However Sr26 has been reported to be present exclusively in bread wheat following an
introgression from the wild relative Thynopirum elongatum thus its presence within the elite
durum wheat germplasm included in this study is mostly unlikely
A wide chromosome region including three subregions (marked by gwm427 CD926040 and
barc104) at the end of chromosome arm 6AL was strongly associated with resistance to all
stem rust races This region co-locates with Sr13 mapped in tetraploid wheat to the long arm
of chromosome 6A within a 12 to 28 cM interval flanked by the EST-derived markers
CD926040 and BE471213 (Simons et al 2011 Admassu et al 2011 Dubcovsky et al 2011)
126
In our study CD926040 showed the largest R2 value and significance effects for resistance to
all four races Sr13 is effective against the TTKS complex of Pgt namely TTKSK (Ug99)
TTKST and TTTSK However virulence for Sr13 within Ethiopian stem rust populations has
been reported (Admassu et al 2009) and recently confirmed by the characterisation of two
races (TRTTF and JRCQC) collected at the site near Debre-Zeit (Olivera et al 2012) The
strong association between markers at this location and resistance to stem rust both in
seedlings inoculated with the four races and in field-grown adult plants inoculated with a
mixture including Sr13-virulent inoculum suggests the presence on chromosome arm 6AL of
an additional gene linked to Sr13 Fine mapping and more precise characterisation of allelic
variation present in the germplasm on adequate genetic stocks are needed to sort-out the
precise genetic basis underlying the chromosome 6AL-related resistance to stem rust in
durum wheat Other Sr genes were mapped to chromosome 6A such as Sr5 and Sr8a which
showed to be a highly effective gene for races TRTTF and JRCQC (Yue Jin personal
communication) However their mapping locations did not coincide with the 6AL-distal
region
Two significant QTLs for resistance to stem rust were found on chromosome arm 7AL
where Sr22 and Sr15 are located Sr15 is distally located on chromosome arm 7AL near
gwm344 while wPt-7299 appears to be linked to Sr22 Finally AM detected a QTL at the
distal end of chromosome arm 7BL near wmc517 a region known to harbour Sr17 a gene
linked to Lr14a and Pm5 in bread wheat (Crossa et al 2007) It is also consistent with a
region reported to include a stem rust QTL in the Arina x Forno RIL population (Bansal et al
2008)
553 Significant markers for putatively novel stem rust resistance at seedling stage
Several significant markers tagged regions where no stem rust genes had previously been
reported These regions with significant associations (one for TTKSK one for TRTTF two
for TTTTF and three for race JRCQC) were detected on chromosome 3A where Sr27 and
Sr35 both effective against Ug99 have been reported (McIntosh et al 1995 Singh et al
2006 Jin et al 2007) However as Sr27 originated from a wheat-rye translocation present
mostly in triticales and Sr35 from Triticum monococcum and then transferred to some
127
tetraploids of Canadian origin none of which were present in this study or in the pedigree of
the accessions of the AM panel the chromosome 3A-related associations detected herein are
likely to involve alternative and unknown loci Additionally no Sr gene was reported on
chromosome arm 3BL and thus the significant effects associated with wmc418 and wPt-9049
could be due to putatively novel loci Similarly the QTL on chromosome arm 4AL with a
major effect for race JRCQC and the QTL on chromosome 4BL for race TTTTF could
represent new race-specific loci for stem rust resistance Although the significant markers
identified on chromosomes 5A and 5B did not overlap with any reported major Sr gene
resistance QTLs for response to Ug99 have been mapped in similar locations on chromosome
arm 5BS (Yu et al 2011) The markers on chromosome 5A were located where no Sr gene or
QTL has been previously reported and may represent one or more new QTL for stem rust
resistance All significant markers identified on chromosome arm 6BS did not coincide with
any of the reported major Sr genes and may thus represent new loci Similarly two genomic
regions were detected on chromosome 7AS (wPt-6668 and wPt-7188) and were not
significantly associated with stem rust resistance in previous reports Although no Sr genes
have been reported for chromosome arm 7BS two distinct QTLs were detected for race
JRCQC near gwm573 and gwm333 which could also be considered as novel Sr loci
Following further characterisation and validation diagnostic markers for these resistance loci
would be useful for enhancing APR to stem rust provided they are also associated with broad
range adult plant resistance
554 Reaction of race-specific resistance genes
Although more than 50 different stem rust resistance loci have been cataloged and multiple
alleles are known for three genes (Singh et al 2011) additional resistance loci that are likely
different from designated genes have recently been identified All designated genes except
Sr2 and the recently characterised Sr55 and Sr57 are race specific The majority of stem rust
resistance genes confer varying levels of intermediate resistance both at seedling and adult
stages and some genes did not confer adequate protection in the field if present alone (Singh
et al 2006 2011) In our study several race-specific QTLs associated to resistance to three or
four of the races were detected that upon pyramiding may reduce susceptibility and enhance
durability Most studies in which several races were used to detect QTLs for resistance have
128
reported either race-specific QTLs (Niks et al 2000 Zhu et al 2003) or a combination of
broad-spectrum QTLs and race-specific QTLs with various effects on resistance (Qi et al
1999 Arru et al 2003 Chen et al 2003) Our results are more complex since (i) some of the
race-specific QTLs had strong effects on resistance (for instance the QTL on chromosome 2B
tagged by gwm47 for race TRTTF and the QTL on chromosome 4A tagged by barc78 for race
JRCQC) (ii) some QTLs had strong albeit quantitative effect (QTL on chromosome 7B
tagged by wmc517 for races TTKSK and TTTTF) (iii) some minor QTLs were effective
across all races (QTL on chromosome 5A tagged by gwm410) and (iv) the QTL cluster on
chromosome 6A tagged by CD926040 and barc104 showed broad spectrum resistance with
major effect for races TTKSK TTTTF and JRCQC and relatively minor effects for race
TRTTF The greater complexity observed in our study could partly derive from the evaluation
of a large number of accessions with different genetic background and races with distinct
virulence
555 QTLs with minor effects
Except for the QTLs tagged by CD926040 and barc104 each significant association
identified in this study explained less than 10 of the phenotypic variation for stem rust
resistance at the seedling stage Previous AM studies have also identified QTLs with minor
phenotypic effects (Roy et al 2010 Maccaferri et al 2011 Massman et al 2011) QTL
effects estimated via AM are usually lower in R2 and effect values than those estimated in
biparental populations because of the greater complexity at the effector loci explored in the
AM panels as compared to biparental mapping populations including the presence of more
complex epistatic interactions among loci More importantly the elite breeding germplasm of
durum wheat in the past decades has not been improved by means of an extensive use of
wide-crosses to introgress alleles with strong phenotypic effects (Maccaferri et al 2005)
Lastly the effect of the marker is a function of the QTL effect and of the LD between the
marker and the QTL and insufficient marker density could lead to markers that are in low LD
with the QTL (Massman et al 2011)
129
556 Breeding perspectives
This study shows that the level of seedling resistance to stem rust in elite durum is largely
governed by minor QTLs and one major QTL on chromosome 6A Selection for markers
closely linked to these loci have thus the potential to improve stem rust resistance in
populations generated from this set of accessions Other promising sources of seedling
resistance have been identified and demonstrated their effectiveness under highly conducive
environments for stem rust epidemics Markers are already available for Sr9 (Tsilo et al
2007) Sr13 (Simons et al 2011) Sr26 (Mago et al 2005 Liu et al 2010) and Sr25 (Yu et al
2010) If further confirmed the QTLs reported here for seedling resistance and the
corresponding closely linked molecular markers will contribute to broadening the genetic
basis of seedling and potentially also field resistance to stem rust an important goal of durum
wheat breeding We have identified several loci for resistance to highly virulent stem rust
races that can be used in breeding programmes Notably some of the durum wheat lines that
were tested herein carry resistance to all four races of Pgt
Our results indicate the suitability of AM to provide valuable information to accelerate durum
wheat improvement and cultivar release In particular the results confirm the role of of Sr9
Sr13 and Sr14 previously described in biparental mapping studies while unveiling the
presence of putatively novel loci that could be exploited to enhance stem rust resistance in
durum wheat via marker-assisted selection With proper planning and an accurate deployment
of Sr genes long-term broad-spectrum APR can thus be attained more effectively Attaining
APR is essential for the release of novel cultivars of durum wheat because stem rust
susceptibility is low until heading Therefore stem rust resistance at the seedling stage while
easy and fast to assay may not be indicative of the reaction at the adult plant stage
Combining the results of this study with those on APR in the field where races such as
TTKSK TRTTF and JRCQC prevail (Letta et al 2013) will facilitate the selection of suitable
parental lines for further improving stem rust resistance of durum wheat In summary this
study provides novel information that can be exploited for pre-emptive breeding efforts to
reduce the vulnerability of durum wheat to stem rust The first step would be to identify a
small subset of accessions that carry resistance alleles at different QTLs These accessions
would then be used as donor parents in a marker-assisted backcrossing scheme aimed to
select lines with resistance alleles at different loci in an elite genetic background Further
130
characterisation of these sets of near-isogenic lines would confirm the QTL effects while
providing more accurate estimates of allelic effects and their epistatic interactions In the near
future the availability of high-density SNP platforms including thousands of markers will
allow for studies with almost complete genome coverage and a much more refined resolution
at the haplotype level (Akhunov et al 2009 Kaur et al 2011 Trebbi et al 2011 You et al
2011 van Poeke et al 2013) The use of the same SNP assays in applied breeding
programmes will also facilitate the simultaneous selection of multiple beneficial alleles for
partial resistance Finally the relatively large number and small effects of the QTLs herein
described suggest that a more comprehensive selection strategy such as genomic selection
(Heffner et al 2009 Rutkoski et al 2011) may prove more cost-effective than traditional
MAS strategies at accumulating beneficial alleles in breeding populations
56 CONCLUSIONS
Association mapping has the promising potential to dissect quantitative traits including
disease resistance to generated information that facilitate crop improvement and variety
development As shown in this and other studies AM complements bi-parental mapping for
an independent QTL validation identification of novel QTLs and potentially more precise
QTL location The present study highlighted the presence of novel genetic variation that
could be exploited to enhance stem rust resistance in durum wheat via marker-assisted
selection Our results confirm the role of of Sr9 Sr13 and Sr14 previously described in
biparental mapping studies while unveiling the presence of putatively novel loci thus
supporting the validity of AM
Identifying new sources of resistance to stem rust including Ug99 and other virulent races
provides wheat breeders with an increased diversity of Sr genes to be combined in new
cultivars With proper planning and an accurate selection of Sr genes long-term broad-
spectrum resistance can thus be attained Attaining adult plant resistance is essential for the
release of novel cultivars of durum wheat because stem rust susceptibility is not high until
heading Nonetheless stem rust resistance at the seedling stage while easy and fast to assay
may not be indicative of the reaction at the adult plant stage because some genes are effective
only at specific growth stages Combining the results of this study with those in adult plant
131
resistance in the field at Debrezeit where races such as TTKSK TRTTF and JRCQC are
prevalent will provide valuable indications to select suitable parental lines for further
improving stem rust resistance of durum wheat Additionally accessions carrying putative
novel alleles should be tested against a collection of different stem rust isolates in the
greenhouse to determine whether they possess a broad-based resistance
Acknowledgments
The financial contribution of the Beachell-Borlaug International Scholar Initiative to support
Tesfaye L Dugo is gratefully acknowledged
132
57 LITERATURE CITED
Admassu B Fekadu E (2005) Physiologic races and virulence diversity of Puccinia graminis
f sp tritici on wheat in Ethiopia Phytopathol Mediterr 44 313-318
Admassu B Lind V Friedt W Ordon F (2009) Virulence analysis of Puccinia graminis f sp
tritici populations in Ethiopia with special consideration of Ug99 Plant Pathol 58
362-369
Admassu B Perovic D Friedt W Ordon F (2011) Genetic mapping of the stem rust (Puccinia
graminis f sp tritici Eriks amp E Henn) resistance gene Sr13 in wheat (Triticum
aestivum L) Theor Appl Genet 122 643-648
Akbari M Wenzl P Caig V Carling J Xia L Yang S Uszynski G Mohler V Lehmensiek A
Kuchel H Hayden MJ Howes N Sharp P Vaughan P Rathmell B Huttner E Kilian
A et al (2006) Diversity arrays technology (DArT) for high-throughput profiling of the
hexaploid wheat genome Theor Appl Genet 113 1409-1420
Akhunov E Nicolet C Dvorak J (2009) Single nucleotide polymorphism genotyping in
polyploid wheat with the Illumina GoldenGate assay Theor Appl Genet 119 507-
517
Arru L Francia E Pecchioni N (2003) Isolate-specific QTLs of resistance to leaf stripe
(Pyrenophora graminea) in the lsquoSteptoersquo times lsquoMorexrsquo spring barley cross Theor Appl
Genet 106 668-675
Badebo A Gelalcha S Ammar K Nachit M M Abdalla O et al (2009) Durum wheat research
in Ethiopia In Proceedings of the 2009 BGRI Technical Workshop CIMMYT Cd
Obregon Sonora Mexico March 17-20 2009 pp 28
Bansal UK Bossolini E Miah H Keller B Park RF Bariana HS et al (2008) Genetic
mapping of seedling and adult plant stem rust resistance in two European winter
wheat cultivars Euphytica 164 821-828
Belaid A (2000) Durum wheat in WANA (West Asia and North Africa) production trade and
gains from technological change In Royo C Nachit MM Di Fonzo N Araus JL
(eds) Durum wheat improvement in the Mediterranean region new challenges vol 40
Options Mediterraneennes CIHEAM-IAMZ Zaragoza pp 35-39
Bhavani S Singh RP Argillier O Huerta-Espino J Singh S Njau P Brun S Lacam S
Desmouceaux N et al (2011) Mapping durable adult plant stem rust resistance to the
133
race Ug99 group in six CIMMYT wheats In McIntosh RA (ed) BGRI 2011 Technical
Workshop Borlaug Global Rust Initiative St Paul MN USA pp 43-53
Bradbury PJ Zhang Z Kroon DE Casstevens TM Ramdoss Y Buckler ES et al (2007)
TASSEL software for association mapping of complex traits in diverse samples
Bioinformatics 23 2633-2635
Breseghello F Sorrells ME (2006) Association mapping of kernel size and milling quality in
wheat (Triticum aestivum L) cultivars Genetics 172 1165-1177
Brown GN (1997) The inheritance and expression of leaf chlorosis associated with gene Sr2
for adult plant resistance to wheat stem rust Euphytica 95 67-71
Chen H Wang S Xing Y Xu C Hayes PM Zhang Q et al (2003) Comparative analyses of
genomic locations and race specificities of loci for quantitative resistance to
Pyricularia grisea in rice and barley Proc Natl Acad Sci USA 100 2544-2549
Crossa J Burgueno J Dreisigacker S Vargas M Herrera-Foessel SA Lillemo M et al (2007)
Association analysis of historical bread wheat germplasm using additive genetic
covariance of relatives and population structure Genetics 177 1889-1913
de Givry S Bouchez M Chabrier P Milan D Schiex T et al (2005) CAR(H) (T) A Gene
multipopulation integrated genetic and radiation hybrid mappingBioinformatics 21
1703-1704
Dilbirligi M Erayman M Sanghu D Sidhu D Gill KS et al (2004) Identification of wheat
chromosomal regions containing expressed resistance genes Genetics 166 461-481
Dubcovsky J Ordon F Perovic D Admassu B Friedt W Abate Z Zhang W Chao S (2011)
Conflicting mapping results for stem rust resistance gene Sr13 Theor Appl Genet
122 659-659
Ersoz ES Yu J Buckler ES (2009) Application of linkage disequilibrium and association
mapping in maize In Kriz A Larkins B (eds) Molecular genetic approaches to maize
improvement Springer Berlin pp 173-195
Eversmeyer MG Kramer CL (2000) Epidemiology of wheat leaf and stem rust in the central
Great Plains of the USA Annu Rev Phytopathol 38 491-513
Flint-Garcia SA Thornsberry JM Buckler ES (2003) Structure of linkage disequilibrium in
plants Annu Rev Plant Biol 54357-374
Gupta PK Rustgi S Kulwal PL (2005) Linkage disequilibrium and association studies in
higher plants present status and future prospects Plant Mol Biol 57 461-485
134
Habash DZ Kehel Z Nachit M (2009) Genomic approaches for designing durum wheat
ready for climate change with a focus on drought J Exp Bot 60 2805-2815
Haile JK Nachit MM Hammer K Badebo A Roder MS et al (2012) QTL mapping of
resistance to race Ug99 of Puccinia graminis f sp tritici in durum wheat (Triticum
durum Desf) Mol Breed 30 1479-1493
Hall D Tegstrom C Ingvarsson PK (2010) Using association mapping to dissect the genetic
basis of complex traits in plants Brief Funct Genom 9 157-165
Heffner EL Sorrells ME Jannink J (2009) Genomic selection for crop improvement Crop
Sci 49 1-12
Hiebert CW Fetch TG Zegeye T (2010) Genetics and mapping of stem rust resistance to
Ug99 in the wheat cultivar Webster Theor Appl Genet 121 65-69
Jin Y Singh RP Ward RW Wanyera R Kinyua M Njau P Pretorius ZA et al (2007)
Characterization of seedling infection types and adult plant infection responses of
monogenic Sr gene lines to race TTKS of Puccinia graminis f sp tritici Plant Dis
91 1096-1099
Jin Y Szabo LJ Pretorius ZA Singh RP Ward R Fetch T Jr et al (2008) Detection of
virulence to resistance gene Sr24 within race TTKS of Puccinia graminis f sp tritici
Plant Dis 92 923-926
Kaur S Franki MG Forster JW (2011) Identification characterization and interpretation of
single-nucleotide sequence variation in allopolyploid crop species Plant Biotechnol
J 10 125-138 doi 101111 j1467-7652 2011 00644 x
Klindworth DL Miller JD Jin Y Xu SS (2007) Chromosomal locations of genes for stem
rust resistance in monogenic lines derived from tetraploid wheat accession ST464
Crop Sci 47 1441-1450
Kollers S Rodemann B Ling J Korzun V Ebmeyer E Argillier O Hinze M Plieske J
Kulosa D Ganal MW Roumlder MS (2013) Whole Genome Association Mapping of
Fusarium Head Blight Resistance in European Winter Wheat (Triticum aestivum L)
PLoS One 8 e57500
Li H Peng Z Yang X Wang W Fu J Wang J Han Y Chai Y Guo T Yang N Liu J
Warburton ML Cheng Y Hao X Zhang P Zhao J Liu Y Wang G Li J Yan J (2013)
Genome-wide association study dissects the genetic architecture of oil biosynthesis in
maize kernels Nat Genet 45 43-50
135
Letta T Maccaferri M Ammar K Badebo A Ricci A Crossa J Tuberosa R et al (2013)
Searching for novel sources of field resistance to Ug99 and Ethiopian stem rust races
in durum wheat via association mapping Theor Appl Genet doi 101007 s00122-
013-2050-8
Li H Peng Z Yang X Wang W Fu J Wang J Han Y Chai Y Guo T Yang N Liu J
Warburton ML Cheng Y Hao X Zhang P Zhao J Liu Y Wang G Li J Yan J (2013)
Genome-wide association study dissects the genetic architecture of oil biosynthesis in
maize kernels Nat Genet 45 43-50
Liu S Yu LX Singh RP Jin Y Sorrells ME Anderson JA et al (2010) Diagnostic and co-
dominant PCR markers for wheat stem rust resistance genes Sr25 and Sr26 Theor
Appl Genet 120 691-697
Maccaferri M Sanguineti MC Noli E Tuberosa R (2005) Population structure and long-
range linkage disequilibrium in a durum wheat elite collection Mol Breed15 271-
289
Maccaferri M Sanguineti MC Natoli V Ortega JLA Ben Salem M Bort J Chenenaoui C
De Ambrogio E del Moral LG De Montis A El-Ahmed A Maalouf F Machlab H
Moragues M Motawaj J Nachit M Nserallah N Ouabbou H Royo C Tuberosa R et
al (2006) A panel of elite accessions of durum wheat (Triticum durum Desf) suitable
for association mapping studies Plant Gen Res 4 79-85
Maccaferri M Sanguineti MC Corneti Ortega JLA Ben Salem M Bort J DeAmbrogio E
del Moral LFG Demontis A El-Ahmed A Maalouf F Machlab H Martos V
Moragues M Motawaj J Nachit M Nserallah N Ouabbou H Royo C Slama A
Tuberosa R et al (2008) Quantitative trait loci for grain yield and adaptation of durum
wheat (Triticum durum Desf) across a wide range of water availability Genetics 178
489-511
Maccaferri M Sanguineti MC Mantovani P Demontis A Massi A Ammar K Kolmer J
Czembor J Ezrati S Tuberosa R et al (2010) Association mapping of leaf rust
response in durum wheat Mol Breed26 189-228
Maccaferri M Sanguineti MC del Moral LFG Demontis A El-Ahmed A Maalouf F
Machlab H Martos V Moragues M Motawaj J Nachit M Nserallah N Ouabbou H
Royo C Slama A Tuberosa R et al (2011) Association mapping in durum wheat
136
grown across a broad range of water regimes and yield potential J Exp Bot 62 409-
438
Mago R Bariana HS Dundas IS Spielmeyer W Lawrence GJ Pryor AJ Ellis JG et al (2005)
Development of PCR markers for the selection of wheat stem rust resistance genes
Sr24 and Sr26 in diverse wheat germplasm Theor Appl Genet 111 496-504
Mago R Brown-Guedira G Dreisigacker S Breen J Jin Y Singh R Appels R Lagudah ES
Ellis J Spielmeyer W et al (2010) An accurate DNA marker assay for stem rust
resistance gene Sr2 in wheat Theor Appl Genet 122 735-744 doi101007 s00122-
010- 1482 -7
Mantovani P Maccaferri M Sanguineti MC Tuberosa R Catizone I Wenzl P Thomson B
Carling J Eric H De-Ambrogio E Kilian A et al (2008) An integrated DArT-SSR
linkage map of durum wheat Mol Breed22 629-648
Massman J Cooper B Horsley R Neate S Dill-Macky R Chao S Dong Y Schwarz P
Muehlbauer GJ Smith KP et al (2011) Genome wide association mapping of fusarium
head blight resistance in contemporary barely breeding germplasm Mol Breed27
439-454
McIntosh RA Wellings CR Park RF (1995) Wheat rusts An Atlas of resistance genes
CSIRO Canberra
McIntosh RA Brown GN (1997) Anticipatory breeding for resistance to rust diseases in
wheat Annu Rev Phytol 35 311-326
Myles S Peiffer J Brown Ersoz ES Zhang ZW Costich DE Buckler ESPJ et al (2009)
Association mapping critical considerations shift from genotyping to experimental
designThe Plant Cell 21 2194-2202
Niks RE Fernaacutendez E Van Haperen Bekele Aleye B Martiacutenez FB et al (2000) Specificity of
QTLs for partial and non-host resistance of barley to leaf rust fungi Acta Phytopathol
Hun 35 13-21
Olivera PD Jin Y Rouse Badebo A Fetch T Jr Singh RP and Yahyaoui AM et al (2012)
Races of Puccinia graminis f sp tritici with combined virulence to Sr13 and Sr9e in a
field stem rust screening nursery in Ethiopia Plant Dis 96 623-628
Pretorius ZA Singh RP Wagoire WW Payne TS (2000) Detection of virulence to wheat stem
rust resistance gene Sr31 in Puccinia graminis f sp tritici in Uganda Plant Dis 84
203
137
Pritchard JK Stephens M Donnelly P (2000) Inference of population structure using
multilocus genotype data Genetics 155 945-959
Qi X Jiang G Chen W Niks RE Stam P Lindhout P et al (1999) Isolate-specific QTLs for
partial resistance to Puccinia hordei in barley Theor Appl Genet 99 877-884
Rafalski JA (2002) Novel genetic mapping tools in plants SNPs and LD-based approaches
Plant Sci 162 329-333
Roelfs AP Martens JW (1988) An international system of nomenclature for Puccinia
graminis f sp tritici Phytopathol 78 526-533
Roelf AP Long DL Robert JJ (1993) Races of Puccinia graminis in the United States during
1990 Plant Dis 77 125-128
Rohlf FJ (1997) NTSYS-pc version 20 Exeter Press East Setauket NY USA
Roy JK Smith KP Muehlbauer GJ Chao S Close TJ Steffenson BJ et al (2010) Association
mapping of spot blotch resistance in wild barley Mol Breed 26 243-256
Rouse MN Nava IC Chao S Anderson JA Jin Y (2012) Identification of markers linked to
the race Ug99 effective stem rust resistance gene Sr28 in wheat (Triticum aestivum
L) Theor Appl Genet 125 877-885
Rutkoski JE Heffner EL Sorrells ME (2011) Genomic selection for durable stem rust
resistance in wheat Euphytica 179 161-173
Schuelke M (2000) An economic method for the fluorescent labelling of PCR fragments Nat
Biotechnol 18 233-234
Simons K Abate Z Chao S Zhang W Rouse M Jin Y Elias E Dubcovsky J et al (2011)
Genetic mapping of stem rust resistance gene Sr13 in tetraploid wheat (Triticum
turgidum ssp durum L) Theor Appl Genet 122 649-658
Singh RP Huerta-Espino J Fuentes G Duveiller E Gilchrist L Henry M Nicol MJ et al
(2005) Resistance to diseases In Royo C Nachit MM Di Fonzo N Araus JL
Pfeiffer WH Slafer GA (eds) Durum wheat breeding current approaches and future
strategies Food Product Press Binghamton pp 291-315
Singh RP Hodson DP Jin Y Huerta-Espino J Kinyua MG Wanyera R Njau P Ward RW et
al (2006) Current status likely migration and strategies to mitigate the threat to wheat
production from race Ug99 (TTKS) of stem rust pathogen In CAB reviews
perspectives in agriculture veterinary science nutrition and natural resources 1 No
054
138
Singh RP Hadson DP Huerta-Espino J Jin Y Bhavani S Njau P Herrera-Foessel S Singh
PK Singh S Govindan V et al (2011) The emergence of Ug99 races of the stem rust
fungus is a threat to world wheat production Ann Rev Phytopathol 49 465-481
Singh A Pandey MP Singh AK Knox RE Ammar K Clarke JM Clarke FR Singh RP
Pozniak CJ Depauw RM McCallum BD Cuthbert RD Randhawa HS Fetch TG
(2013) Identification and mapping of leaf stem and stripe rust resistance quantitative
trait loci and their interactions in durum wheat Mol Breed31 405-418
Stakman EC Steward DM Loegering WQ (1962) Identification of physiologic races of
Puccinia graminis var tritici U S Dep Agric Agric Res Serv E-617
Stich B Melchinger AE Frisch M Maurer HP Heckenberger M Reif JC et al (2005)
Linkage disequilibrium in European elite maize germplasm investigated with SSRs
Theor Appl Genet 111 723-730
Stich B Melchinger AE (2010) An introduction to association mapping in plants CAB Rev
5 039
Storey JD Tibshirani R (2003) Statistical significance for genome wide studies Proc Natl
Acad Sci USA 100 9440-9445
Sun Y Steffenson BJ (2005) Reaction of barely seedlings with different stem rust resistance
genes to Puccinia graminis f sp tritici and Puccinia graminis f sp secalis Canad J
Plant Pathol 27 80-89
Thornsberry JM Goodman MM Doebley J Kresovich S Nielsen D Buckler ES IV et al
(2001) Dwarf8 polymorphisms associate with variation in flowering time Nat Genet
28 286-289
Trebbi D Maccaferri M de Heer P Sorensen A Giuliani S Salvi S Sanguineti MC Massi
A van der Vossen EAG Tuberosa R et al (2011) High-throughput SNP discovery and
genotyping in durum wheat (Triticum durum Desf) Theor Appl Genet 123 555-
569
Tsilo TJ Jin Y Anderson JA (2007) Microsatellite markers linked to stem rust resistance
allele Sr9a in wheat Crop Sci 47 2013-2020
van Poecke Remco Maccaferri MarcoTang JifengTruongHoa Janssen Antoine van
Orsouw Nathalie Salvi Silvio Sanguineti Maria Tuberosa Roberto van der Vossen
Edwin (2013) Sequence-based SNP genotyping in durum wheat Plant Biotechnol J
Accepted
139
You FM Huo NX Deal KR Gu YQ Luo MC McGuire PE Dvorak J Anderson OD et al
(2011) Annotation-based genome-wide SNP discovery in the large and complex
Aegilops tauschii genome using next-generation sequencing without a reference
genome sequence BMC Genomics doi 1011861471-2164-12-59
Yu JM Pressoir G Briggs WH Bi IV Yamasaki M Doebley JF McMullen MD Gaut BS
Nielsen DM Holland JB Kresovich S Buckler ES et al (2006) A unified mixed-
model method for association mapping that accounts for multiple levels of
relatedness Nat Genet 38 203-208
Yu L-X Abate Z Anderson JA Bansal UK Bariana HS Bhavani S Dubcovsky J Lagudah
ES Liu SX Sambasivam PK Singh RP Sorrells ME et al (2009) Developing and
optimizing markers for stem rust resistance in wheat Proceedings of 2009 Technical
Workshop Borlaug Global Rust Initiative Cd Obregoacuten Sonora Mexico pp 117-130
Yu L-X Liu S Anderson JA Singh RP Jin Y Dubcovsky J BrownGuidera G Bhavani S
Morgounov A He Z Huerta-Espino J Sorrells ME et al (2010) Haplotype diversity of
stem rust resistance loci in uncharacterized wheat lines Mol Breed 26 667-680
Yu L-X Lorenz A Rutkoski J Singh RP Bhavani S Huerta-Espino J Sorrells ME et al
(2011) Association mapping and gene-gene interaction for stem rust resistance in
CIMMYT spring whear germplasm Theor Appl Genet 123 1257-1268
Yu L-X Morgounov A Wanyera R Keser M Singh S K Sorrells M (2012) Identification of
Ug99 stem rust resistance loci in winter wheat germplasm using genome-wide
association analysis Theor Appl Genet 125 749-758
140
FIGURES
141
Figure 1 Frequency distribution of Infection Types (ITs) within an AM panel of 183 durum
genotypes challenged at seedling stage with 4 stem rust races
142
Figure 2 UPGMA-dendrogram of the 4 stem rust (Puccinia graminis Pers F sp tritici)
races used to characterize the durum germplasm collection
The dendrogram is based on the racesrsquo virulence phenotypes (Infection types estimated with a
0-4 scale) Distances were computed using the standardized Manhattan distances (lsquocity-
blockrsquo method)
TTKSK
TTTTF
JRCQC
TRTTF
Manhattanrsquo distance104 794 1483 2172
143
TABLES
144
Table 1 Isolate designation origin virulence phenotype and infection type (IT) on Sr13 of Puccinia graminis f sp tritici races used to
evaluate the durum panel
Race Isolate Origin Avirulence Virulence
IT on Sr13
1
TRTTF 06YEM34-1 Yemen Sr8a 24 31 Sr5 6 7b 9a 9b 9d 9e 9g 10 11 17 Sr21
30 36 38 McN 3+
TTTTF 01MN84A-1-2 United States Sr24 31
Sr5 6 7b 8a 9a 9b 9d 9e 9g 10 11 Sr17
21 30 36 38 McN 2
TTKSK
(Ug99) 04KEN15604 Kenya Sr24 36 Tmp
Sr5 6 7b 8a 9a 9b 9d 9e 9g 10 11 Sr17
21 30 31 38 McN 22-
JRCQC 09ETH08-3 Ethiopia
Sr5 7b 8a 36 9b 30
Tmp 24 31 38 Sr21 9e 11 6 9g 17 9a 9d McN 3
1Infection types observed on seedlings at 14 days post-inoculation using a 0 to 4 scale according to Stakman et al (1962) where infection types of 1 2 or X are
considered as a low IT and ITs of 3 or higher are considered as a high IT
145
Table 2 Numbers and frequencies of infection types (IT) and resistant susceptible and heterogeneous reactions of the 183 durum
genotypes included in the AM panel to four races of Puccinia graminis f sp tritici and the combined reaction to all races
IT1 Reaction TRTTF TTTTF TTKSK (Ug99) JRCQC All races
Lines Lines Lines Lines Lines
ldquo0rdquo or ldquordquo 10 55 3 16 2 11 4 22 0 0
ldquo1rdquo 1 05 10 55 1 05 5 27 0 0
ldquo2rdquo or ldquo23rdquo or ldquoXrdquo 138 754 104 568 103 563 78 426 66 361
Resistant Reaction 149 814 117 639 106 579 87 475 66 361
ldquo3rdquo 22 120 47 257 53 290 39 213 10 55
ldquo4rdquo 4 22 2 11 13 71 50 273 2 11
Susceptible Reaction 26 142 49 268 66 361 89 486 12 66
Heterogeneous2 8 44 17 93 11 60 7 38 1 05
1Infection types observed on seedlings at 14 days post-inoculation using a 0 to 4 scale according to Stakman et al (1962) where infection types of 1 2 or X are
considered as a low IT and ITs of 3 or higher are considered as a high IT
2Accessions that contained both resistant and susceptible plants
146
Table 3 Numbers and frequencies of reactions of 183 durum genotypes included in the AM panel to 4 races of Puccinia graminis f sp
tritici classified by origin subgroup
Durum Panel
subgroup1
TRTTF TTTTF TTKSK JRCQC Across races
Res2 Sus
3 Res
4 Res Sus Res Res Sus Res Res Sus Res Res Sus Res
no no Rank no no rank no no rank no no rank no no rank
S1
(11 accessions) Lines 9 2 4 5 5 5 3 7 5 2 9 5 2 1 4
818 182 50 50 30 70 182 818 667 333
S2
(55 accessions) Lines 42 9 3 41 11 2 30 21 2 23 28 3 22 6 3
824 176 788 212 588 412 451 549 786 214
S2
(55 accessions) Lines 14 8 5 17 5 3 12 11 4 16 10 2 8 4 5
636 364 773 227 522 478 615 385 667 333
S2
(55 accessions) Lines 53 3 2 32 16 4 31 23 3 21 33 4 19 2 2
946 54 667 333 574 426 389 611 905 95
S2
(55 accessions) Lines 35 0 1 29 5 1 29 5 1 25 9 1 26 0 1
100 0 853 147 853 147 735 265 100 0
1 Durum Panel subgroups S1 ICARDA germplasm for dryland areas S2 ICARDA germplasm for temperate areas S3 Italian and early rsquo70 CIMMYT germplasm
S4 CIMMYT germplasm (late rsquo70-early rsquo80) S5 CIMMYT germplasm (late rsquo80-early rsquo90)
2 Resistant accessions infection types of 1 2 or X
3 Susceptible accessions ITs of 3 or higher
4 Subgroup rank values based on their of resistant accessions
147
Table 4 Most significant markers for each QTL associated with stem rust races TRTTF TTTTF TTKSK and JRCQC resistance in 183
durum association panel at seedling stage
1 P values of markers that showed significant (P le 005) associations at the genome-wise level are reported in bold (continued)
P value (Q+K model)1 R
2 ()
Number of significant
tests over four races
Marker Chr cM TRTTF TTTTF TTKSK JRCQC TRTTF TTTTF TTKSK JRCQC Marker-
wise tests
Genome-
wise tests
wPt-1876 1B 313 - - - 00033 - - - 313 1 0
barc61 1B 872 00306 00393 00328 - 245 227 241 - 3 0
barc81 1B 1199 - 00144 00131 - - 242 237 - 2 0
wmc44 1B 1581 - 00283 - 00093 - 388 - 486 2 0
wPt-5839 2A 0 00165 00098 00155 - 160 244 217 - 3 0
cfa2201 2A 478 00054 - 00137 - 425 - 350 - 2 0
wPt-2293 2A 637 126E-4
- - - 420 - - - 1 1
gwm410 2B 641 0009 - - - 370 - - - 1 0
gwm47 2B 1589 181E-5
- - - 834 - - - 1 1
gwm1300 2B 1691 - 00215 00041 - - 336 466 - 2 0
wmc356 2B 220 - 00421 - 0008 - 244 - 422 2 0
wPt-1923 3A 464 - 00029 0017 694E-4
- 317 209 398 3 1
gwm1620 3A 83 - 00375 - 00152 - 247 - 309 2 0
wmc264 3A 1196 00217 - - 00322 37 - - 349 2 0
wmc43 3B 579 - 00127 00017 - - 275 487 - 2 1
wmc418 3B 122 00116 00143 - - 366 356 - - 2 0
wPt-9049 3B 1825 - - - 00043 - - - 284 1 0
barc78 4A 1106 - - - 687E-7
- - - 936 1 1
gwm1084 4B 919 - 00081 - - - 367 - - 1 0
gwm617 5A 44 - - 00024 - - - 480 - 1 0
gwm1570 5A 326 - - - 0004 - - - 294 1 0
barc165 5A 571 - - - 00248 - - - 350 1 0
gwm410 5A 120 00155 00191 0009 00032 204 192 256 356 4 0
wPt-5514 5B 0 - 0011 00067 - - 248 289 - 2 0
gwm234 5B 272 - - - 0007 - - - 351 1 0
wPt-0566 5B 1891 00415 00021 - - 113 356 - - 2 0
148
Table 4 Continuedhellip
P value (Q+K model) 1 R
2 ()
Number of significant
tests
Marker Chr cM TRTTF TTTTF TTKSK JRCQC TRTTF TTTTF TTKSK JRCQC Marker-
wise tests
Genome-
wise tests
gwm169 6deg 1266 - 0002 00345 - - 368 175 - 2 0
gwm427 6deg 1395 - - 00153 00323 - - 249 151 2 0
CD926040 6deg 1439 00087 343E-12
417E-16
156E-10
352 1764 2312 1533 4 3
barc104 6deg 1553 0037 752E-7
335E-10
402E-6
284 1195 1782 1047 4 3
wPt-2991 6B 194 - - - 00095 - - - 24 1 0
wPt-0470 6B 516 - 00088 00086 - - 245 250 - 2 0
gwm518 6B 841 - - 00032 - - - 431 - 1 0
gwm816 6B 1021 - - - 00307 - - - 260 1 0
wPt-6668 7deg 327 835E-4
- - - 270 - - - 1 1
wPt-7188 7deg 804 00056 - 00341 - 211 - 177 - 2 0
wPt-7299 7deg 1507 - - 00037 - - - 314 - 1 0
gwm344 7deg 2419 525E-4
00088 - - 579 379 - - 2 1
gwm573 7B 666 - - - 00347 - - - 318 1 0
gwm333 7B 997 - - - 00182 - - - 390 1 0
wmc517 7B 1556 - 173E-5
00016 - - 80 496 - 2 2
Total significant regions
Marker-wise test 15 20 19 19
Total Regions after FDR
Genome-wise test 4 3 4 4
1 P values of markers that showed significant (P le 005) associations at the genome-wise level are reported in bold
149
GENERAL CONCLUSIONS AND PERSPECTIVES
Ethiopia is the second largest wheat producer in the sub-Saharan Africa The country is rich
in genetic resources of tetraploid wheat and has suitable environments for wheat production
However the country is a net importer of wheat particularly durum wheat (hard wheat) The
demand for durum wheat is continuously increasing because of the new emerging food
processing industries But the productivity of wheat in Ethiopia is low due to the contrains
caused by biotic and abiotic stresses Among the biotic factors stem rust plays a role of
paramount importance in yield reduction As a result of a recent emergence and spread of
Ug99 a new and highly virulent race of leaf rust and evolution of new durum-specific races
which overcame widely deployed stem rust resistance genes (eg Sr31) that had been
effective for many years stem rust is becoming a serious threat to wheat production in
Ethiopia as well as in other East African and wheat producing countries across the globe
Therefore it is important to identify new resistance sources conferring resistance to stem rust
races including Ug99 and its lineages and to develop codominant molecular markers suitable
for marker-assisted selection towards a more sustainable control of stem rust
To identify loci conferring resistance to stem rust races both at seedling and adult stages in
durum wheat 183 elite accessions representing the broad geographic origin were employed
The accessions were genotyped with 350 SSRs and 900 Diversity Array Technology (DArT)
markers Phenotypic data were collected on these accessions for stem rust resistance at the
adult plant stage in Ethiopia in four evaluation seasons Additionally seedling phenotypic
data on races TRTTF TTTTF TTKSK and JRCQC were collected at the Cereal Disease
Laboratory USDA and University of Minnesota St Paul on the same set of durum panel
Based on field data twelve QTL-tagging markers significant (P lt 005) across three to four
seasons were detected The role of Sr13 Sr9 Sr14 Sr17 and Sr28 was confirmed Thirteen
markers with significant effects on leaf rust resistance were located in regions with no Sr
genesQTLs and thus provide novel opportunities for marker-assisted selection At the
seedling stage and under controlled conditions the number of chr regions with significant
effects on resistance to the TRTTF TTTTF TTKSK and JRCQC races was 15 20 19 and
150
19 respectively Additionally the results of this study show that stem rust resistance in
durum is governed by shared loci and by race-specific ones The QTLs identified in this study
through AM will be useful in the marker-assisted development of durum wheat cultivars with
durable stem rust resistance and for selecting suitable parental lines for further improving
stem rust resistance of durum wheat Additionally accessions carrying putative novel alleles
should be tested against a collection of different stem rust isolates in the greenhouse to
determine whether they possess a broad-based resistance
In conclusion based on the results obtained in this study a short list of elite accessions of
durum wheat carrying beneficial alleles at different QTLs for stem rust resistance has been
identified and can be used as donors to initiate a MAS program to improve stem rust
resistance in the adapted Ethiopian durum wheat germplasm
151
APPENDICES
152
Appendix 1 Name and origin of accessons of durum wheat used in this study
Accession code Accession name ORIGIN
IDUWUE-002 CANNIZZO ITALY
IDUWUE-003 CLAUDIO ITALY
IDUWUE-004 LESINA ITALY
IDUWUE-005 MERIDIANO ITALY
IDUWUE-006 MONGIBELLO ITALY
IDUWUE-007 NORBA ITALY
IDUWUE-008 PIETRAFITTA ITALY
IDUWUE-010 TORREBIANCA ITALY
IDUWUE-011 BISU_1PATKA_3 CIMMYT
IDUWUE-012
CMH82A10623GGOVZ394SBA81PLC4AAZ_1C
REX5HUICIT71CII CIMMYT
IDUWUE-013 DUKEM3RUFFFGOYAV79 CIMMYT
IDUWUE-015 KULRENGI-BALIKCIL_8 CIMMYT
IDUWUE-016 PLATA_16 CIMMYT
IDUWUE-017 PORTO_5 CIMMYT
IDUWUE-018 ROKFGOSTIL3BISU_1 CIMMYT
IDUWUE-020 ACUATICOYAZI_1 CIMMYT
IDUWUE-021 FOCHA_15ALAS CIMMYT
IDUWUE-023 BUSHEN_4TARRO_2BUSHEN_4 CIMMYT
IDUWUE-024
GSCRASBA813HO4MEXI_15MEMO62ALT
AR 84 CIMMYT
IDUWUE-025 RASCON_372TARRO_2 CIMMYT
IDUWUE-027 SRN_3AJAIA_15DUKEM_13DION_2 CIMMYT
IDUWUE-028 ALDEANO IRTA-SPAIN
IDUWUE-029 ARIESOL IRTA-SPAIN
IDUWUE-030 ARTENA IRTA-SPAIN
IDUWUE-031 ASTIGI IRTA-SPAIN
IDUWUE-032 BOABDIL IRTA-SPAIN
IDUWUE-033 BOLENGA IRTA-SPAIN
IDUWUE-034 BOLIDO IRTA-SPAIN
IDUWUE-035 BOLO IRTA-SPAIN
IDUWUE-036 BOMBASI IRTA-SPAIN
IDUWUE-037 BORLI IRTA-SPAIN
IDUWUE-038 CANYON IRTA-SPAIN
IDUWUE-039 DURCAL IRTA-SPAIN
IDUWUE-040 DUROI IRTA-SPAIN
IDUWUE-041 GALLARETA IRTA-SPAIN
IDUWUE-042 ILLORA IRTA-SPAIN
IDUWUE-044 SENADUR IRTA-SPAIN
IDUWUE-045 SULA IRTA-SPAIN
IDUWUE-047 NASSIRA (MOROCCO_1805) INRA-MOROCCO
IDUWUE-048 CHAOUI (MOROCCO_1807) INRA-MOROCCO
IDUWUE-049 AMRIA (MOROCCO_1808) INRA-MOROCCO
IDUWUE-050 MAROUANE (MOROCCO_1809) INRA-MOROCCO
IDUWUE-053 JAWHAR INRA-MOROCCO
IDUWUE-054 MARJANA INRA-MOROCCO
IDUWUE-055 MARZAK INRA-MOROCCO
153
Appendix 1 Continuedhellip
Accession code Accession name ORIGIN
IDUWUE-056 OURGH INRA-MOROCCO
IDUWUE-057 TAREK INRA-MOROCCO
IDUWUE-060 AWALBIT ICARDA
IDUWUE-061 BCR3CHAM_1GTASTR ICARDA
IDUWUE-062 CHHB88DERAA ICARDA
IDUWUE-063 CHACAN ICARDA
IDUWUE-064 KARIM ICARDA
IDUWUE-065 HMLCHHB88 ICARDA
IDUWUE-066 KRSHCN ICARDA
IDUWUE-067 MURLAGOST-3 ICARDA
IDUWUE-068 MOULSABIL_2 ICARDA
IDUWUE-069 OMBAR ICARDA
IDUWUE-071 MRB589_5 ICARDA
IDUWUE-072
QUADALETEERPMAL3UNKNOWN(VSGIODES
SA) ICARDA
IDUWUE-073 SEBAH ICARDA
IDUWUE-074 STOJOCRI_3 ICARDA
IDUWUE-075 ZEINA_1 ICARDA
IDUWUE-076 ANTON ICARDA
IDUWUE-077 APPIO ITALY
IDUWUE-079 ARCANGELO ITALY
IDUWUE-080 ARCOBALENO ITALY
IDUWUE-081 BRAVADUR DESERT
IDUWUE-082 BRONTE ITALY
IDUWUE-083 CAPEITI 8 ITALY
IDUWUE-084 CAPPELLI ITALY
IDUWUE-085 CICCIO ITALY
IDUWUE-086 COLORADO-DW DESERT
IDUWUE-087 COLOSSEO ITALY
IDUWUE-088 CORTEZ DESERT
IDUWUE-089 CRESO ITALY
IDUWUE-090 DON PEDRO ITALY
IDUWUE-091 DUILIO ITALY
IDUWUE-093 FLAMINIO ITALY
IDUWUE-094 FORTORE ITALY
IDUWUE-095 GARGANO ITALY
IDUWUE-096 GRAZIA ITALY
IDUWUE-097 IRIDE ITALY
IDUWUE-098 ITALO ITALY
IDUWUE-099 IXOS ITALY
IDUWUE-100 KRONOS DESERT
IDUWUE-102 MESSAPIA ITALY
IDUWUE-103 MEXICALI 75 ITALY
IDUWUE-104 MOHAWK ITALY
IDUWUE-105 OFANTO ITALY
IDUWUE-106 PLATANI ITALY
IDUWUE-107 PLINIO ITALY
IDUWUE-108 PRODURA ITALY
IDUWUE-109 REVA ITALY
IDUWUE-110 ROQUENO ITALY
154
Appendix 1 Continuedhellip
Accession code Accession name ORIGIN
IDUWUE-111 SVEVO ITALY
IDUWUE-112 TRINAKRIA ITALY
IDUWUE-113 VALBELICE ITALY
IDUWUE-114 VALNOVA ITALY
IDUWUE-116 WESTBRED 881 DESERT
IDUWUE-117 WESTBRED TURBO DESERT
IDUWUE-118 AGHRASS_1 ICARDA
IDUWUE-119 AINZEN_1 ICARDA
IDUWUE-120 ANGRE ICARDA
IDUWUE-121 AMEDAKUL-1 ICARDA
IDUWUE-122 AMMAR-1 ICARDA
IDUWUE-123 ARISLAHN-5 ICARDA
IDUWUE-124 ATLAST-1 ICARDA
IDUWUE-125 AUS1 ICARDA
IDUWUE-126 AWALI_1 ICARDA
IDUWUE-127 RADIOSO ITALY
IDUWUE-128 AZEGHAR_2 ICARDA
IDUWUE-130 BICRE ICARDA
IDUWUE-131 BICREDERAA_1 ICARDA
IDUWUE-132 BIGOST-1 ICARDA
IDUWUE-133 BELIKH 2 ICARDA
IDUWUE-134 BRACHOUA ICARDA
IDUWUE-135 CHAHBA88 ICARDA
IDUWUE-136 CHAM_1 ICARDA
IDUWUE-137 DERAA ICARDA
IDUWUE-139 GEROMTEL-1 ICARDA
IDUWUE-140 GEZIRA-17 ICARDA
IDUWUE-141 GIDARA_2 ICARDA
IDUWUE-142 GUEROU_1 ICARDA
IDUWUE-144 HAURANI ICARDA
IDUWUE-145 HEIDER ICARDA
IDUWUE-146
OSL_14BUCCHRCPRL3PVN5HEL3YAVCORMS
HWA ICARDA
IDUWUE-147 SEBOU ICARDA
IDUWUE-148 BLK2134XS-69-186368-13MRB589_54ALBT_3 ICARDA
IDUWUE-149 ARIC31708703BO-DWCDECHBR-DW4CIT71GTA ICARDA
IDUWUE-150 JORDAN ICARDA
IDUWUE-151 KABIR 1 ICARDA
IDUWUE-153 KHABUR_1 ICARDA
IDUWUE-154 KORIFLA ICARDA
IDUWUE-155 LAGONIL-2 ICARDA
IDUWUE-156 LAHN ICARDA
IDUWUE-157 LOUKOS_1 ICARDA
IDUWUE-158 MAAMOURI-1 ICARDA
IDUWUE-159 MARSYR-1 ICARDA
IDUWUE-160 MASSARA_1 ICARDA
IDUWUE-161 MIKI-1 ICARDA
IDUWUE-163 MURLAGOST-1 ICARDA
IDUWUE-164 NILE ICARDA
IDUWUE-166 OMGENIL_3 ICARDA
IDUWUE-167 OMLAHN-3 ICARDA
IDUWUE-168 OMRUF-2 ICARDA
IDUWUE-169 OMSNIMA-1 ICARDA
155
Appendix 1 Continuedhellip
Accession code Accession name ORIGIN
IDUWUE-170 ORONTE 1 ICARDA
IDUWUE-171 OTB-6 ICARDA
IDUWUE-172 OUASERL_1 ICARDA
IDUWUE-173 OUASLAHN-1 ICARDA
IDUWUE-175 QUABRACH-1 ICARDA
IDUWUE-176 QUADALETE ICARDA
IDUWUE-177 RAZZAK INRAT
IDUWUE-178 SAADA3DDSMTL-1 ICARDA
IDUWUE-179 SAJUR ICARDA
IDUWUE-181 SHABHA ICARDA
IDUWUE-182 TELSET_5 ICARDA
IDUWUE-183 TENSIFT_1 ICARDA
IDUWUE-184 TERBOL 97_3 ICARDA
IDUWUE-185 TUNSYR-1 ICARDA
IDUWUE-186 WADALMEZ_1 ICARDA
IDUWUE-187 YOUNES-1 ICARDA
IDUWUE-188 YOUSEF_1 ICARDA
IDUWUE-189 KOFA ITALY
CIMMYT-251 1A1D 5+10-63MOJORCOL CIMMYT
CIMMYT-252 SOOTY_9RASCON_37 CIMMYT
CIMMYT-253 STOTALTAR 84ALD CIMMYT
CIMMYT-254 SOMAT_4INTER_8 CIMMYT
CIMMYT-255
CHEN_1TEZ3GUILCIT71CII4SORAPLATA_125ST
OTALTAR 84ALD CIMMYT
CIMMYT-256 MALMUK_1LOTUS_5F3LOCAL(SELETHIO13585) CIMMYT
CIMMYT-257
1A1D 5+10-62WB8811A1D 5+10-
63MOJO3BISU_1PATKA_3 CIMMYT
CIMMYT-258 HESSIAN-F_23STOTALTAR 84ALD CIMMYT
CIMMYT-259
AJAIA_12F3LOCAL(SELETHIO13585)PLATA_133S
OMAT_34SOOTY_9RASCON_37 CIMMYT
CIMMYT-260
USDA5953D673RABICRA4ALO5HUIYAV_16AR
DENTE7HUIYAV798POD_9 CIMMYT
CIMMYT-261 CNDOPRIMADURHAI-OU_173SNITAN CIMMYT
CIMMYT-262
GEDIZFGOGTA3SRN_14TOTUS5ENTEMEXI_2H
UI3YAV_1GEDIZ6SOMBRA_207STOTALTAR
84ALD CIMMYT
CIMMYT-263 VANRRIKSE_621A-1D 2+12-53WB881 CIMMYT
CIMMYT-264
RANCOCIT71CII3COMDK4TCHOSHWAMALD3
CREX5SNITAN CIMMYT
CIMMYT-265
PLATA_106MQUE4USDA573QFNAA_73ALBA-
D5AVOHUI7PLATA_138THKNEE_119CHENALTA
R 843HUIPOCBUBRUFO4FNFOOT CIMMYT
CIMMYT-266
EUDOCHEN_1TEZ3TANTLO_14PLATA_6GREEN_1
7 CIMMYT
CIMMYT-267
ROLA_53AJAIA_12F3LOCAL(SELETHIO13585)PLA
TA_134MALMUK_1SERRATOR_1 CIMMYT
CIMMYT-268 ARMENTSRN_3NIGRIS_43CANELO_91 CIMMYT
CIMMYT-269 SOMAT_3PHAX_1TILO_1LOTUS_4 CIMMYT
156
Appendix 2 Complete data set of field phenotypic response and population structure membership coefficients for each of the 183
accessions included in the association panel
Stem rust response Memberships Coefficients
Accession code
Dzo-
2009
DZm-
2009
Dzo-
2010
DZm-
2010 Mean
Subgroup1 (ICARDA
germplasm for dry
areas
Subgroup 2
(ICARDA
germplasm for
temperate areas
Subgroup 3
(Italian and early
70s CIMMYT
germplasm
Subgroup 4
(CIMMYT
germplasm of
late 70s-early
80s)
Subgroup 5
(CIMMYT late
80s-early 90s)
Main
subgroup
IDUWUE-002 20 45 373 329 009 003 08 006 002 3
IDUWUE-003 27 70 45 48 001 036 026 015 022 2
IDUWUE-004 40 50 80 45 537 014 025 057 004 001 3
IDUWUE-005 60 80 373 579 017 013 003 064 003 4
IDUWUE-006 6 6 16 373 163 001 009 072 004 014 3
IDUWUE-007 70 45 567 008 022 018 008 045 5
IDUWUE-008 40 18 20 373 288 001 002 06 037 001 3
IDUWUE-010 50 27 70 605 519 001 027 054 001 017 3
IDUWUE-011 40 40 70 45 487 001 019 004 003 073 5
IDUWUE-012 45 32 80 249 455 005 078 001 013 003 2
IDUWUE-013 70 527 606 003 045 006 033 013 2
IDUWUE-015 45 45 80 202 476 001 002 001 002 094 5
IDUWUE-016 40 36 80 295 464 001 003 001 028 067 5
IDUWUE-017 40 24 60 45 422 002 002 001 01 084 5
IDUWUE-018 36 45 54 272 406 001 018 002 025 054 5
IDUWUE-020 40 60 45 472 001 005 001 012 081 5
IDUWUE-021 30 16 40 373 308 001 001 001 021 078 5
IDUWUE-023 40 24 70 342 42 002 01 001 001 087 5
IDUWUE-024 50 40 70 249 462 001 001 001 003 095 5
IDUWUE-025 50 32 70 527 512 001 016 001 003 079 5
IDUWUE-027 36 27 60 218 362 002 032 003 027 036 5
IDUWUE-028 50 60 503 002 09 006 002 001 2
IDUWUE-029 50 40 458 001 083 005 008 004 2
IDUWUE-030 60 32 60 45 492 001 092 003 001 003 2
157
Appendix 2 Continuedhellip
Stem rust response Memberships Coefficients
Accession code
Dzo-
2009
DZm-
2009
Dzo-
2010
DZm-
2010 Mean
Subgroup1
(ICARDA
germplasm for dry
areas
Subgroup 2
(ICARDA
germplasm for
temperate areas
Subgroup 3
(Italian and early
70s CIMMYT
germplasm
Subgroup 4
(CIMMYT
germplasm of
late 70s-early
80s)
Subgroup 5
(CIMMYT
late 80s-
early 90s)
Main
subgroup
IDUWUE-031 60 54 80 45 597 002 02 001 02 057 5
IDUWUE-032 60 27 60 187 414 005 036 001 04 017 4
IDUWUE-033 6 12 11 122 003 065 026 006 001 2
IDUWUE-034 50 45 70 53 007 077 001 011 004 2
IDUWUE-035 40 60 453 001 069 001 004 025 2
IDUWUE-036 60 36 70 605 566 001 001 001 032 066 5
IDUWUE-037 9 18 36 45 27 001 004 001 072 021 4
IDUWUE-038 30 3 50 11 235 001 029 001 063 006 4
IDUWUE-039 70 70 605 675 003 051 002 041 003 2
IDUWUE-040 40 45 36 342 388 004 038 001 051 006 4
IDUWUE-041 45 72 60 11 47 0 001 0 001 098 5
IDUWUE-042 50 18 70 272 413 001 042 002 003 052 5
IDUWUE-044 60 63 70 342 568 001 04 043 002 014 3
IDUWUE-045 36 8 50 202 286 001 002 004 033 061 5
IDUWUE-047 60 18 60 373 438 01 056 001 031 003 2
IDUWUE-048 30 36 70 156 379 001 091 001 005 001 2
IDUWUE-049 02 6 79 35 002 094 002 002 001 2
IDUWUE-050 70 70 80 45 662 001 093 001 003 002 2
IDUWUE-053 70 70 70 45 637 002 003 005 06 03 4
IDUWUE-054 4 9 79 95 001 003 003 039 054 5
IDUWUE-055 30 60 50 447 028 068 002 001 001 2
IDUWUE-056 27 60 50 437 001 001 0 097 001 4
IDUWUE-057 50 54 36 45 462 002 035 001 059 003 4
IDUWUE-060 30 50 527 431 094 001 003 001 001 1
158
Appendix 2 Continuedhellip
Stem rust response Memberships Coefficients
Accession code
Dzo-
2009
DZm-
2009
Dzo-
2010
DZm-
2010 Mean
Subgroup1
(ICARDA
germplasm for dry
areas
Subgroup 2
(ICARDA
germplasm for
temperate areas
Subgroup 3
(Italian and early
70s CIMMYT
germplasm
Subgroup 4
(CIMMYT
germplasm of
late 70s-early
80s)
Subgroup 5
(CIMMYT
late 80s-
early 90s)
Main
subgroup
IDUWUE-061 400 700 500 450 512 021 004 001 072 002 4
IDUWUE-062 400 400 360 373 383 004 034 003 051 009 4
IDUWUE-063 320 630 300 373 406 002 031 008 048 012 4
IDUWUE-064 600 450 517 001 001 000 098 001 4
IDUWUE-065 400 500 800 547 001 043 002 050 004 4
IDUWUE-066 100 240 40 342 180 002 061 001 034 002 2
IDUWUE-067 500 700 600 373 543 002 023 007 042 027 2
IDUWUE-068 500 800 800 373 618 001 026 007 050 017 4
IDUWUE-069 600 450 505 035 005 002 049 010 4
IDUWUE-071 540 700 450 570 094 001 001 001 002 1
IDUWUE-072 60 90 110 75 027 003 001 067 003 4
IDUWUE-073 300 700 600 514 001 081 001 016 001 2
IDUWUE-074 500 700 500 527 557 012 062 002 023 001 2
IDUWUE-075 300 540 270 527 409 004 031 022 036 007 4
IDUWUE-076 02 30 270 187 122 005 001 091 001 003 3
IDUWUE-077 600 800 600 605 651 016 071 005 002 007 2
IDUWUE-079 270 360 272 307 020 055 017 008 001 2
IDUWUE-080 240 600 700 342 470 001 001 001 030 067 5
IDUWUE-081 200 200 270 204 002 009 083 005 001 3
IDUWUE-082 600 400 373 464 002 002 007 088 001 4
IDUWUE-083 90 180 94 146 060 008 031 001 001 1
IDUWUE-084 500 700 600 527 582 005 052 038 002 003 2
IDUWUE-085 700 202 443 034 001 064 001 001 3
IDUWUE-086 135 600 295 350 001 028 051 019 002 3
159
Appendix 2 Continuedhelliphellip
Stem rust response Memberships Coefficients
Accession code
Dzo-
2009
DZm-
2009
Dzo-
2010
DZm-
2010 Mean
Subgroup1
(ICARDA
germplasm for dry
areas
Subgroup 2
(ICARDA
germplasm for
temperate areas
Subgroup 3
(Italian and early
70s CIMMYT
germplasm
Subgroup 4
(CIMMYT
germplasm of
late 70s-early
80s)
Subgroup 5
(CIMMYT
late 80s-
early 90s)
Main
subgroup
IDUWUE-087 400 500 400 295 399 001 090 001 006 002 2
IDUWUE-088 300 700 373 446 007 042 008 038 005 2
IDUWUE-089 300 500 500 342 410 002 055 002 039 001 2
IDUWUE-090 300 700 700 547 008 035 003 051 004 4
IDUWUE-091 270 500 450 413 001 001 000 097 001 4
IDUWUE-093 500 360 272 366 001 001 043 054 001 4
IDUWUE-094 20 00 110 50 011 013 074 001 001 3
IDUWUE-095 400 80 360 79 230 009 002 087 001 001 3
IDUWUE-096 80 94 134 002 002 077 016 003 3
IDUWUE-097 120 30 110 112 001 019 004 030 046 5
IDUWUE-098 400 600 700 547 009 033 018 035 005 4
IDUWUE-099 160 30 125 94 002 012 079 006 001 3
IDUWUE-100 60 20 270 97 001 012 068 019 001 3
IDUWUE-102 90 360 110 212 001 094 002 002 001 2
IDUWUE-103 120 160 148 002 002 073 004 020 3
IDUWUE-104 600 600 527 564 002 046 029 022 002 2
IDUWUE-105 00 02 94 38 004 004 090 001 002 3
IDUWUE-106 450 300 527 414 039 002 056 001 002 3
IDUWUE-107 500 600 600 272 493 004 021 061 011 004 3
IDUWUE-108 500 600 272 446 001 089 002 008 001 2
IDUWUE-109 400 180 79 208 001 030 058 009 001 3
IDUWUE-110 600 360 300 527 447 003 090 001 004 002 2
IDUWUE-111 500 450 400 249 400 005 022 002 070 002 4
IDUWUE-112 20 40 79 53 022 044 030 003 001 2
160
Appendix 2 Continuedhellip
Stem rust response Memberships Coefficients
Accession code
Dzo-
2009
DZm-
2009
Dzo-
2010
DZm-
2010 Mean
Subgroup1
(ICARDA
germplasm for dry
areas
Subgroup 2
(ICARDA
germplasm for
temperate areas
Subgroup 3
(Italian and early
70s CIMMYT
germplasm
Subgroup 4
(CIMMYT
germplasm of
late 70s-early
80s)
Subgroup 5
(CIMMYT late
80s-early 90s)
Main
subgroup
IDUWUE-113 400 120 270 133 231 026 059 013 001 001 2
IDUWUE-114 300 80 450 265 001 001 097 001 001 3
IDUWUE-116 40 40 60 94 59 001 011 086 001 002 3
IDUWUE-117 400 360 333 014 006 002 075 002 4
IDUWUE-118 320 360 600 407 002 001 003 092 003 4
IDUWUE-119 360 240 400 156 289 001 003 001 094 001 4
IDUWUE-120 600 600 700 450 587 002 025 038 016 019 3
IDUWUE-121 600 600 500 547 002 012 001 084 001 4
IDUWUE-122 600 500 500 514 001 004 009 084 001 4
IDUWUE-123 450 600 180 125 339 007 011 027 053 002 4
IDUWUE-124 500 540 270 373 421 001 058 002 033 006 2
IDUWUE-125 400 225 373 321 003 023 019 050 004 4
IDUWUE-126 360 500 500 434 008 047 012 032 002 2
IDUWUE-127 500 270 160 187 279 003 079 014 003 001 2
IDUWUE-128 400 160 450 362 048 006 005 038 003 1
IDUWUE-130 500 360 320 450 407 002 004 001 093 001 4
IDUWUE-131 600 180 270 450 375 002 027 004 066 001 4
IDUWUE-132 500 360 600 373 458 004 037 001 055 003 4
IDUWUE-133 200 240 156 187 002 062 002 029 006 2
IDUWUE-134 400 400 600 447 003 045 004 036 012 2
IDUWUE-135 400 500 700 450 512 002 010 001 084 003 4
IDUWUE-136 60 120 270 110 140 003 078 003 015 001 2
IDUWUE-137 20 30 272 114 002 063 003 027 005 2
IDUWUE-139 500 120 360 295 319 002 052 003 039 004 2
161
Appendix 2 Continuedhellip
Stem rust response Memberships Coefficients
Accession code
Dzo-
2009
DZm-
2009
Dzo-
2010
DZm-
2010 Mean
Subgroup1 (ICARDA
germplasm for dry
areas
Subgroup 2
(ICARDA
germplasm for
temperate
areas
Subgroup 3
(Italian and early
70s CIMMYT
germplasm
Subgroup 4
(CIMMYT
germplasm of
late 70s-early
80s)
Subgroup 5
(CIMMYT
late 80s-
early 90s)
Main
subgroup
IDUWUE-140 400 381 002 043 049 006 001 2
IDUWUE-141 500 160 180 527 342 043 045 001 010 001 2
IDUWUE-142 400 700 503 001 029 002 064 004 4
IDUWUE-144 400 40 360 450 312 024 071 003 001 001 2
IDUWUE-145 500 270 700 79 387 002 080 001 016 001 2
IDUWUE-146 600 60 160 295 279 001 085 001 009 005 2
IDUWUE-147 500 80 90 249 230 002 088 002 005 003 2
IDUWUE-148 120 60 270 187 159 070 006 018 004 002 1
IDUWUE-149 300 90 270 79 185 006 086 002 004 002 2
IDUWUE-150 400 500 403 002 083 005 009 001 2
IDUWUE-151 300 700 453 003 049 020 026 002 2
IDUWUE-153 400 400 110 292 001 044 007 046 002 4
IDUWUE-154 600 600 527 564 006 046 026 003 019 2
IDUWUE-155 400 270 450 295 354 006 030 010 051 004 4
IDUWUE-156 400 600 453 004 002 001 083 011 4
IDUWUE-157 300 600 202 356 002 006 002 087 003 4
IDUWUE-158 600 400 600 249 462 001 002 001 095 001 4
IDUWUE-159 800 450 900 373 631 023 015 004 057 001 4
IDUWUE-160 700 400 700 580 096 001 001 002 001 1
IDUWUE-161 540 270 400 295 376 003 030 004 062 001 4
IDUWUE-163 500 360 373 399 001 053 001 039 006 2
IDUWUE-164 500 360 383 003 035 002 059 001 4
IDUWUE-166 600 270 500 373 436 042 012 003 042 002 1
IDUWUE-167 400 180 360 527 367 068 013 003 009 007 1
162
Appendix 2 Continuedhellip
Stem rust response Memberships Coefficients
Accession code
Dzo-
2009
DZm-
2009
Dzo-
2010
DZm-
2010 Mean
Subgroup1 (ICARDA
germplasm for dry
areas
Subgroup 2
(ICARDA
germplasm for
temperate areas
Subgroup 3
(Italian and early
70s CIMMYT
germplasm
Subgroup 4
(CIMMYT
germplasm of
late 70s-early
80s)
Subgroup 5
(CIMMYT
late 80s-
early 90s)
Main
subgroup
IDUWUE-168 500 160 400 373 358 001 010 002 075 012 4
IDUWUE-169 500 270 360 605 434 061 020 002 016 002 1
IDUWUE-170 400 700 187 417 004 028 033 006 028 3
IDUWUE-171 300 200 600 187 322 005 030 002 062 001 4
IDUWUE-172 500 500 500 373 468 026 016 005 047 006 4
IDUWUE-173 600 270 225 249 336 002 044 016 029 009 2
IDUWUE-175 360 240 150 230 007 013 021 058 002 4
IDUWUE-176 500 360 383 002 070 020 008 001 2
IDUWUE-177 500 500 453 002 023 001 064 010 4
IDUWUE-178 400 270 120 187 244 001 082 006 008 003 2
IDUWUE-179 400 300 450 364 002 016 037 026 020 3
IDUWUE-181 500 240 700 450 472 002 092 004 001 001 2
IDUWUE-182 450 320 320 605 424 051 044 002 002 001 1
IDUWUE-183 400 270 540 384 004 008 005 082 001 4
IDUWUE-184 400 300 500 380 002 001 001 094 001 4
IDUWUE-185 300 240 270 250 003 013 001 076 007 4
IDUWUE-186 270 320 160 249 250 001 037 025 021 017 2
IDUWUE-187 500 360 400 527 447 079 001 001 017 001 1
IDUWUE-188 500 360 700 450 502 001 035 002 061 002 4
IDUWUE-189 600 400 600 514 003 034 061 001 001 3
CIMMYT-251 600 360 600 500 005 002 003 029 062 5
CIMMYT-252 600 600 700 682 645 002 006 003 002 089 5
CIMMYT-253 700 600 800 342 610 000 002 001 001 096 5
CIMMYT-254 800 600 800 450 662 001 002 001 051 046 4
163
Appendix 2 Continuedhellip
Stem rust response Memberships Coefficients
Accession code
Dzo-
2009
DZm-
2009
Dzo-
2010
DZm-
2010 Mean
Subgroup1 (ICARDA
germplasm for dry
areas
Subgroup 2
(ICARDA
germplasm for
temperate areas
Subgroup 3
(Italian and early
70s CIMMYT
germplasm
Subgroup 4
(CIMMYT
germplasm of
late 70s-early
80s)
Subgroup 5
(CIMMYT
late 80s-
early 90s)
Main
subgroup
CIMMYT-255 600 700 800 450 637 001 002 001 002 094 5
CIMMYT-256 500 600 600 450 537 002 003 002 018 075 5
CIMMYT-257 600 500 800 614 001 001 001 002 096 5
CIMMYT-258 400 600 600 373 493 000 001 000 001 098 5
CIMMYT-259 500 360 700 342 475 003 005 001 003 088 5
CIMMYT-260 700 320 450 470 001 001 001 049 048 4
CIMMYT-261 500 500 360 373 433 001 003 002 057 038 4
CIMMYT-262 600 360 600 295 464 001 003 002 005 091 5
CIMMYT-263 120 120 79 95 011 008 009 011 061 5
CIMMYT-264 700 700 800 682 720 006 008 002 015 069 5
CIMMYT-265 600 700 700 373 593 002 006 001 005 086 5
CIMMYT-266 600 600 553 000 001 000 075 024 4
CIMMYT-267 500 600 700 527 582 010 002 001 002 085 5
CIMMYT-268 450 700 700 597 004 023 011 004 058 5
CIMMYT-269 600 800 800 527 682 010 004 003 007 076 5
Mean 009 029 014 029 019
164
Appendix 3 Complete data set of phenotypic response to four races (TRTTF TTKSK TTTTF and JRCQC) and population structure
membership coefficients for each of the 183 accessions included in the association panel
Stem rust response Memberships Coefficients
Accession
code TRTTF TTKSK TTTTF JRCQC
Subgroup1
(ICARDA
germplasm
for dry areas
Subgroup 2
(ICARDA
germplasm for
temperate areas
Subgroup 3
(Italian and early
70s CIMMYT
germplasm
Subgroup 4
(CIMMYT
germplasm of late
70s-early 80s)
Subgroup 5
(CIMMYT
late 80s-
early 90s)
Main
subgroup
IDUWUE-002 3- 2- 2 3 2- 1 0086 0027 0803 0064 002 3
IDUWUE-003 22- 2 3 2- 2 0009 036 026 0149 0222 2
IDUWUE-004 2 33+ 2- 33+ 1 3+ 0136 0248 0568 0038 0011 3
IDUWUE-005 2- 4 4 4 0173 0131 0031 064 0025 4
IDUWUE-006 3 2+2+3- 2+ 3- 2- 0013 0094 0715 0041 0136 3
IDUWUE-007 2- 2- 2- 3+ 2- 008 0218 0176 0079 0448 5
IDUWUE-008 33+ 3 2+ N 0009 0019 0598 0365 001 3
IDUWUE-010 33+ 33+ 3+ 4 0012 027 0538 0013 0168 3
IDUWUE-011 2- 2- 2- 2- 0008 0192 0042 0025 0733 5
IDUWUE-012 2- 2 2- 4 0047 0784 0014 0127 0029 2
IDUWUE-013 2 3+ 3+ 3+ 0027 0448 0064 0331 013 2
IDUWUE-015 2- 2 2- 2- 0012 0018 0006 002 0944 5
IDUWUE-016 2- 2 2- 2 0011 0029 001 0282 0667 5
IDUWUE-017 2- 2 2- 2 0021 0018 0014 0103 0844 5
IDUWUE-018 2- 2 2- 22+ 0012 0176 0023 0245 0544 5
IDUWUE-020 2- 2- 2- 4 0007 0053 0013 0122 0805 5
IDUWUE-021 2- 2 2- 2 0005 0008 0006 0206 0775 5
IDUWUE-023 2- 22- 2- 2 0015 0099 0007 0013 0865 5
IDUWUE-024 2- 2 2- 2- 0005 001 0007 0028 0951 5
IDUWUE-025 2- 2- 2- 2- 0013 0155 0007 0031 0793 5
IDUWUE-027 N 2- N 22+ 0019 0323 0034 0267 0358 5
IDUWUE-028 2- 2- 2- 0 3+ 0016 0898 006 0016 001 2
IDUWUE-029 2- 2- 2- 001 0827 005 0078 0035 2
IDUWUE-030 3+ 3 3+ 2 4 0014 092 0026 0014 0026 2
165
Appendix 3 Continuedhellip
Stem rust response Memberships Coefficients
Accession code TRTTF TTKSK TTTTF JRCQC
Subgroup1
(ICARDA
germplasm for
dry areas
Subgroup 2
(ICARDA
germplasm for
temperate areas
Subgroup 3
(Italian and early
70s CIMMYT
germplasm
Subgroup 4
(CIMMYT
germplasm of late
70s-early 80s)
Subgroup 5
(CIMMYT
late 80s-
early 90s)
Main
subgroup
166
IDUWUE-031 2- 3 33+ 4 0015 0202 0011 02 0573 5
IDUWUE-032 2- 4 3+ 0 0054 0362 0008 0403 0172 4
IDUWUE-033 N 1- 2+ 0026 0653 0255 006 0006 2
IDUWUE-034 2- 2- 2 2+ 0073 0769 0011 0109 0038 2
IDUWUE-035 2- 2 2- 2- 0013 069 001 0041 0246 2
IDUWUE-036 2- 2 2- 2- 001 0006 0006 0321 0657 5
IDUWUE-037 2- 2- 2- 2- 0009 0044 0012 0723 0212 4
IDUWUE-038 2- 2- 2- 3+1N 001 0286 001 0632 0061 4
IDUWUE-039 22- 3+ 3+ 3+ 0032 0507 0015 0412 0033 2
IDUWUE-040 2- 2- 22- 22+ 0042 0378 0009 051 0062 4
IDUWUE-041 2- 2- 2- 2- 0004 0005 0004 0006 098 5
IDUWUE-042 2- 2- 2- 2- 0013 0416 0019 0033 0518 5
IDUWUE-044 N 0 1 2+3- 0014 0397 043 002 0138 3
IDUWUE-045 2- 2 2+ 2- 2- 001 0018 0035 0327 0609 5
IDUWUE-047 2 3++ 3+ 4 0097 0559 001 0308 0026 2
IDUWUE-048 2 2- 22- 3 0011 0914 0014 0051 001 2
IDUWUE-049 2- 2- 2- 0015 0942 0015 0017 0011 2
IDUWUE-050 33+ 3 3+ 3+ 0012 0934 0011 0025 0018 2
IDUWUE-053 2- 22+ 2- 2- 2- 0022 0034 0047 0599 0298 4
IDUWUE-054 2- 2- 2- 2- 0011 0026 0033 0386 0544 5
IDUWUE-055 2+ 2- 2- 2 0276 0683 0016 0014 0011 2
IDUWUE-056 2 2+3- 3 3+ 3+ 0008 0007 0004 0969 0012 4
IDUWUE-057 2-N 33+ 22- 3+ 0019 035 0009 0591 0032 4
IDUWUE-060 2 3- 3 3+ 094 0013 0031 0009 0006 1
167
Appendix 3 Continuedhellip
Stem rust response Memberships Coefficients
Accession
code TRTTF TTKSK TTTTF JRCQC
Subgroup1
(ICARDA
germplasm for
dry areas
Subgroup 2
(ICARDA
germplasm for
temperate areas
Subgroup 3 (Italian
and early 70s
CIMMYT
germplasm
Subgroup 4
(CIMMYT
germplasm of
late 70s-early
80s)
Subgroup 5
(CIMMYT
late 80s-
early 90s)
Main
subgroup
IDUWUE-061 2- 3+ 2 3 3+ 0207 0043 001 072 0021 4
IDUWUE-062 2- 3 3 4 0038 0339 0028 0506 0089 4
IDUWUE-063 22- 3- 2- 3+ 002 0307 0075 0477 0121 4
IDUWUE-064 22- 3- 3+ 4 0006 0008 0004 0975 0007 4
IDUWUE-065 2 3+ 2- 3 2 3+ 2+ 4 0009 0428 0018 0501 0044 4
IDUWUE-066 2- 2- 1- 2- 0018 0608 0013 034 0021 2
IDUWUE-067 0 1
2+3-
22- 2+3- 3+ 0019 0225 0066 0422 0267 2
IDUWUE-068 4 3 33+ 3+ 0007 0258 0068 0499 0168 4
IDUWUE-069 2 2- 2- 3+ 2- 3 2 0352 0049 0015 0489 0096 4
IDUWUE-071 22+ 3+ 3 4 0944 0012 0011 0012 002 1
IDUWUE-072 2- 2- 2- 2- 0274 0027 0006 0668 0025 4
IDUWUE-073 22- 2- 2- 2+ 001 0809 0011 016 001 2
IDUWUE-074 22- 2- 2 22+ 0122 0617 0023 0228 001 2
IDUWUE-075 3 3 2- N 0039 0314 0216 0363 0069 4
IDUWUE-076 3 3 2- 11+ 0046 0013 0907 0009 0025 3
IDUWUE-077 X 2+ 2+ 4 0164 0706 0046 0015 0069 2
IDUWUE-079 3- 2+3- 3- 33+ 0196 0548 0168 0077 0011 2
IDUWUE-080 2- 22+ 2- 2- 0005 0012 0011 0299 0673 5
IDUWUE-081 2- 2- 2- 3+ 0021 0086 0829 0052 0012 3
IDUWUE-082 2 3 33+ 4 0023 002 0069 088 0008 4
IDUWUE-083 2+3 2+ 22+ 33+ 0598 0076 0314 0005 0007 1
IDUWUE-084 3- 4 2+3 2+ 4 0053 0517 0384 0016 003 2
IDUWUE-085 33+ 3 33+ 4 0338 0014 0639 0005 0005 3
IDUWUE-086 3+ 2 4 2+ 4 0011 0275 0511 0186 0017 3
168
Appendix 3 Continuedhellip
Stem rust response Memberships Coefficients
Accession
code TRTTF TTKSK TTTTF JRCQC
Subgroup1
(ICARDA
germplasm
for dry areas
Subgroup 2
(ICARDA
germplasm for
temperate areas
Subgroup 3 (Italian
and early 70s
CIMMYT
germplasm
Subgroup 4
(CIMMYT
germplasm of
late 70s-early
Subgroup 5
(CIMMYT
late 80s-
early 90s)
Main
subgroup
169
80s)
IDUWUE-087 3+ 3+ 3 4 0012 0902 0007 0063 0015 2
IDUWUE-088 33+ 3 33+ 4 0071 0419 0079 0383 0048 2
IDUWUE-089 23 3 2- 33+ 002 0554 0023 0393 0009 2
IDUWUE-090 2- 2- 2- 4 0078 0353 0025 0507 0036 4
IDUWUE-091 2 3 3 4 0007 0008 0004 0973 0008 4
IDUWUE-093 2 33- 3 4 001 001 0431 0538 0011 4
IDUWUE-094 3+ 2+3 3 33+ 4 0111 0134 0735 0006 0013 3
IDUWUE-095 3+ 3 33+ 3+3 0091 0022 087 0007 001 3
IDUWUE-096 2- 2- 2- 0018 0022 0765 0161 0034 3
IDUWUE-097 2- 2 2- 2 001 0193 0038 0302 0456 5
IDUWUE-098 N 2-N 2- 2 009 0329 0182 0352 0047 4
IDUWUE-099 33+ 3 2+ 2- 0018 0117 079 0063 0012 3
IDUWUE-100 2- 2- 2- 3+ 2- 0008 0115 0679 0193 0006 3
IDUWUE-102 2 2- 2- 2- 001 094 0024 0017 001 2
IDUWUE-103 2- 2- 2- 2 002 0015 0729 0041 0195 3
IDUWUE-104 2- 3 22+ 1 0018 0457 0291 0218 0015 2
IDUWUE-105 33+ 2+ 3+ 2- 2- 0038 004 0895 0008 0019 3
IDUWUE-106 2- 2+2 2 22+ 0389 0019 0561 0009 0021 3
IDUWUE-107 3+3 3 33+ 4 0035 021 0606 0109 0041 3
IDUWUE-108 22+ 22+ 22- 2+ 0007 089 0015 0082 0006 2
IDUWUE-109 2- 2- 3 2- 3+ 001 0304 0584 009 0011 3
IDUWUE-110 32+ 2 2+3 31+ 4 0027 0897 0013 0042 0021 2
IDUWUE-111 2- 2- 2- 4 0047 0216 0017 07 002 4
IDUWUE-112 2+3- 22+ 2+ 3 0224 044 0299 0025 0011 2
170
Appendix 3 Continuedhellip
Stem rust response Memberships Coefficients
171
Accession
code
TRTTF TTKSK TTTTF JRCQC Subgroup1
(ICARDA
germplasm for
dry areas
Subgroup 2
(ICARDA
germplasm for
temperate areas
Subgroup 3 (Italian
and early 70s
CIMMYT
germplasm
Subgroup 4
(CIMMYT
germplasm of
late 70s-early
80s)
Subgroup 5
(CIMMYT
late 80s-
early 90s)
Main
subgroup
IDUWUE-113 2+3- 22+ 2+ 3 0261 0591 0133 001 0006 2
IDUWUE-114 3 2+3- 2 1 0006 001 097 0006 0008 3
IDUWUE-116 2- 2- 22- 2+ 0011 0105 0857 0007 002 3
IDUWUE-117 22- 3 3 3+ 0143 0064 0024 0751 0018 4
IDUWUE-118 2- 2- 2- 3+ 22+ 0021 0008 0026 0919 0025 4
IDUWUE-119 2- 2- 2- 2- 0006 0028 0013 0939 0014 4
IDUWUE-120 2- 2- 2+ 33+ 0022 025 0383 0158 0187 3
IDUWUE-121 2- 2- 2- 4 0022 0115 0011 0842 0011 4
IDUWUE-122 2 2 22+ 22+ 001 0044 0093 084 0013 4
IDUWUE-123 2- 2- 2- 33+ 0071 0106 0274 0526 0023 4
IDUWUE-124 2- 4X 3 4 0014 0583 002 0328 0056 2
IDUWUE-125 3+ 3+ 3+ 4 0027 0234 0194 0501 0044 4
IDUWUE-126 2- 2- 2- 4 0081 0465 0115 0323 0017 2
IDUWUE-127 2 2+ 2- 2- 0029 0787 014 0032 0012 2
IDUWUE-128 2 4 3+ 4 0483 0056 005 0384 0026 1
IDUWUE-130 2 3 2+ 3 4 0018 0038 0009 0927 0009 4
IDUWUE-131 2- 3+ 2- 3+ 0022 027 0037 0661 001 4
IDUWUE-132 2- 2- 2- 2+3- 0041 0372 001 0551 0026 4
IDUWUE-133 2- 2- 2- 2- 0016 0615 002 0287 0062 2
IDUWUE-134 2- 2- 2- 33+ 0032 0448 0042 0359 0118 2
IDUWUE-135 2- 4 3+ 3+ 0024 0101 001 0839 0026 4
IDUWUE-136 22+ 2- 2- 3- 1 4 0028 0779 0033 0149 0011 2
IDUWUE-137 3- 4 2- 2 0017 063 0034 0272 0047 2
IDUWUE-139 2- 3 2- 2+ 0023 0521 0029 0386 0041 2
172
Appendix 3 Continuedhellip
Stem rust response Memberships Coefficients
173
Accession
code
TRTTF TTKSK TTTTF JRCQC Subgroup1
(ICARDA
germplasm for dry
areas
Subgroup 2
(ICARDA
germplasm for
temperate areas
Subgroup 3
(Italian and
early 70s
CIMMYT
germplasm
Subgroup 4
(CIMMYT
germplasm of
late 70s-early
80s)
Subgroup
5
(CIMMYT
late 80s-
early 90s)
Main
subgroup
IDUWUE-140 2-2 3 22+ 3 0022 0427 0487 0055 0009 2
IDUWUE-141 2- 3+ 3+ 4 0429 0449 0014 01 0007 2
IDUWUE-142 2- 2- 2- 3+ 2- 0008 0292 0023 064 0037 4
IDUWUE-144 4 4 4 4 0238 0712 0032 0009 0009 2
IDUWUE-145 2 2+ 2- 2 2+ 002 0804 0006 0155 0014 2
IDUWUE-146 2 3 2- 2- 0007 0847 0011 009 0045 2
IDUWUE-147 N 2 2- N1 2- 3 0022 0884 0016 0048 003 2
IDUWUE-148 2- 2- 2- 2- 0703 0059 0176 0042 002 1
IDUWUE-149 N 2- 2- N 2- 0059 0855 0022 0042 0022 2
IDUWUE-150 2 2 22- 22+ 0022 0825 0052 009 0011 2
IDUWUE-151 2- 2- 2- 4 0028 0489 0204 0261 0018 2
IDUWUE-153 2- 2- 2- 33+ 0009 044 0072 0461 0018 4
IDUWUE-154 33+ 3+ 3 2- 3+ 006 0458 026 0033 0188 2
IDUWUE-155 2- N 2+ 3 3 2 3+ 0055 0295 0099 0514 0037 4
IDUWUE-156 2- 3- 2- 2 4 0035 0016 0013 0829 0108 4
IDUWUE-157 2- 4 3 4 0022 0055 0018 0872 0033 4
IDUWUE-158 2- 2- 2- 2- 0009 0016 001 0951 0014 4
IDUWUE-159 2 3+ 3+ 4 0234 0152 0038 0566 001 4
IDUWUE-160 2- 3+ 3 4 0956 0009 0006 0018 0012 1
IDUWUE-161 2- 2 2- 2- 0034 0301 0036 062 0008 4
IDUWUE-163 2- 2- 2- 2- 0008 0532 0009 0391 0059 2
IDUWUE-164 2- 2- 2 22- 0033 0352 0015 0589 0011 4
IDUWUE-166 2-N 3+ 2+3- 4 0421 0117 0029 0415 0017 1
IDUWUE-167 2- 4 33+ 4 0679 0132 0025 0093 0072 1
174
Appendix 3 Continuedhelliphellip
Stem rust response Memberships Coefficients
Accession
code TRTTF TTKSK TTTTF JRCQC
Subgroup1
(ICARDA
germplasm for dry
areas
Subgroup 2
(ICARDA
germplasm for
temperate areas
Subgroup 3
(Italian and early
70s CIMMYT
germplasm
Subgroup 4
(CIMMYT
germplasm of
late 70s-early
80s)
Subgroup 5
(CIMMYT
late 80s-
early 90s)
Main
subgroup
175
IDUWUE-168 2- 2- 2- 2- 0011 0102 0016 0746 0124 4
IDUWUE-169 4 3+ 3+ 4 0606 0204 0016 0159 0016 1
IDUWUE-170 2- 2- 2- 2- 0044 0281 033 0061 0284 3
IDUWUE-171 2 3- 3+ 2- 2 0045 0302 0016 0624 0013 4
IDUWUE-172 2- 2+ 3+ 3+ 0259 0159 0054 0469 0059 4
IDUWUE-173 2- 3 2 2- 1 4 0015 0444 0158 0292 009 2
IDUWUE-175 2- 2- 2- 2 0065 0128 0213 0579 0015 4
IDUWUE-176 3+3 X- 3 4 0023 0698 0197 0076 0007 2
IDUWUE-177 22+ 2- 2- 4 002 0233 0013 0635 01 4
IDUWUE-178 2- 3+ 2- 2- 3 3+ 0013 0824 006 0076 0027 2
IDUWUE-179 2- 2- 2- 2- 0022 0158 0365 0259 0196 3
IDUWUE-181 3+3 3 3 3+ 0016 092 0038 0014 0012 2
IDUWUE-182 2- 22+ 2- 3 2- 0514 0435 0022 0015 0013 1
IDUWUE-183 2- 2- 2- 3+ 0042 0078 0054 0817 0009 4
IDUWUE-184 2- 2- 2- 3- 2- 0023 0013 0013 094 0011 4
IDUWUE-185 2- 4 2- 2- 3+ 003 0131 0013 0757 0069 4
IDUWUE-186 2- 2- 2- 2- 001 037 0245 0207 0169 2
IDUWUE-187 2- 33+ 3+ 4 0789 0014 0014 0173 001 1
IDUWUE-188 2- 3+ 3+ 4 0006 0346 0018 061 0019 4
IDUWUE-189 2- 2- 2- 2- 0026 0339 0614 0013 0008 3
CIMMYT-251 N 33+ 3 3+ 0053 0015 0025 0286 0621 5
CIMMYT-252 2- 4 3 3+ 0019 0056 0025 0015 0885 5
CIMMYT-253 2- 2- 2- 2 0004 0016 0007 0014 0959 5
CIMMYT-254 2 4 3+ 4 0008 0015 001 0505 0462 4
176
Appendix 3 Continuedhellip
Stem rust response Memberships Coefficients
Accession
code
TRTTF
TTKSK
TTTTF
JRCQC
Subgroup1
(ICARDA
germplasm
for dry areas
Subgroup 2
(ICARDA
germplasm for
temperate areas
Subgroup 3
(Italian and early
70s CIMMYT
germplasm
Subgroup 4
(CIMMYT
germplasm of
late 70s-early
80s)
Subgroup 5
(CIMMYT
late 80s-
early 90s)
Main
subgroup
CIMMYT-255 2- 2 2 2+ 0008 0017 0008 0024 0944 5
CIMMYT-256 2- 2- 2- 22+ 0018 0034 0024 0175 0749 5
CIMMYT-257 2- 2= 3 2- 0008 0009 0005 0021 0956 5
CIMMYT-258 2- 2- 2- 2- 0004 0006 0004 0007 098 5
CIMMYT-259 2- 2- 2- 4 0026 0048 0013 0032 088 5
CIMMYT-260 2- 2- 2 2 0011 0013 0011 049 0475 4
CIMMYT-261 2- 3 3+ 4 0011 0029 0018 0565 0377 4
CIMMYT-262 2- 2- 2- 3 0006 0028 0015 0045 0906 5
CIMMYT-263 2- 2 2- 2 0111 0079 0085 0113 0613 5
CIMMYT-264 2- 3 3+ 4 0058 0084 0018 0153 0686 5
CIMMYT-265 2- 2- 2- 4 0016 0061 0014 0054 0855 5
CIMMYT-266 2- 2- 2- 3+ 0004 0006 0004 0747 0238 4
CIMMYT-267 2- 2 2- 3 2 0099 0018 0012 0021 0851 5
CIMMYT-268 2- 2 2+ 2+ 0036 0229 0108 0043 0584 5
CIMMYT-269 2- 3 3+ 4 0099 0036 0028 0073 0764 5
Average
membership
coefficient
009 029 014 029 019


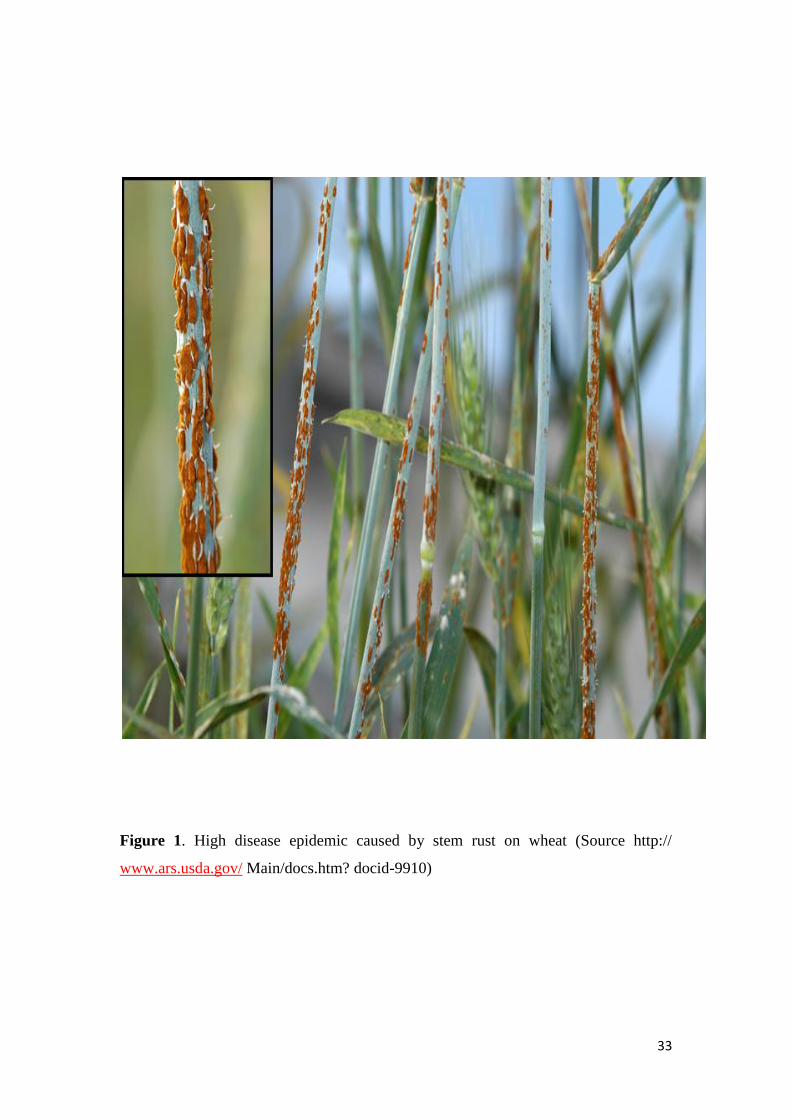
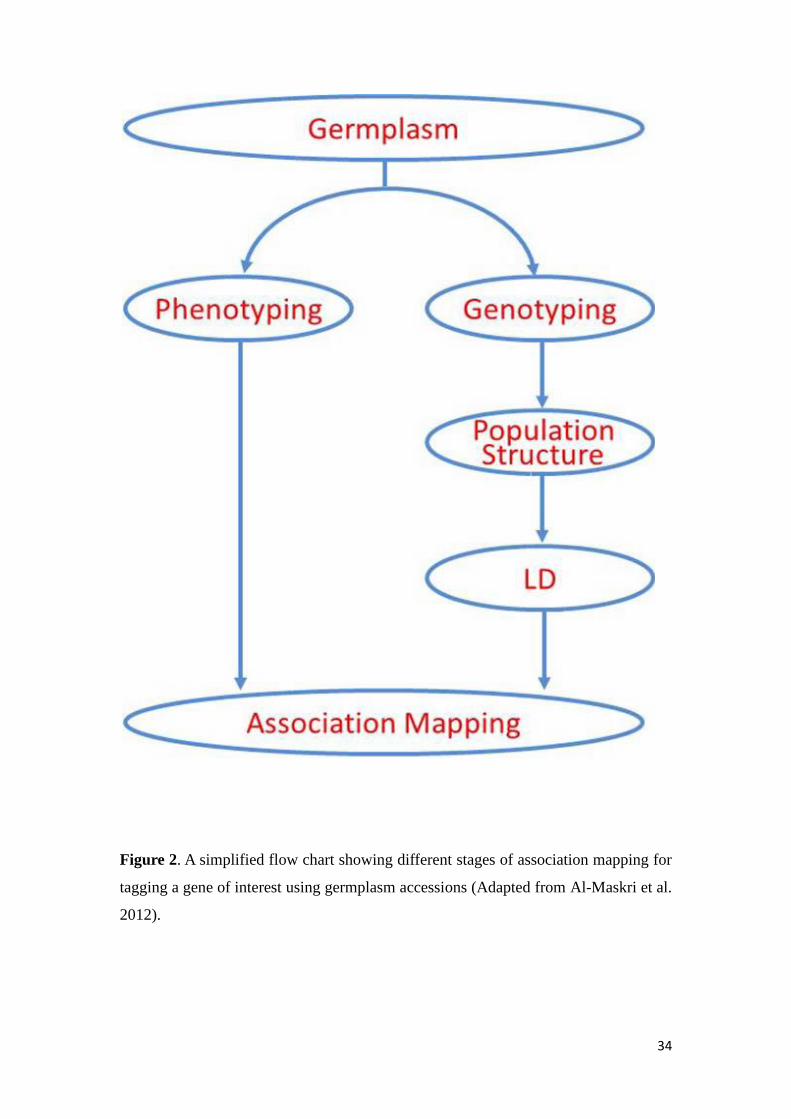


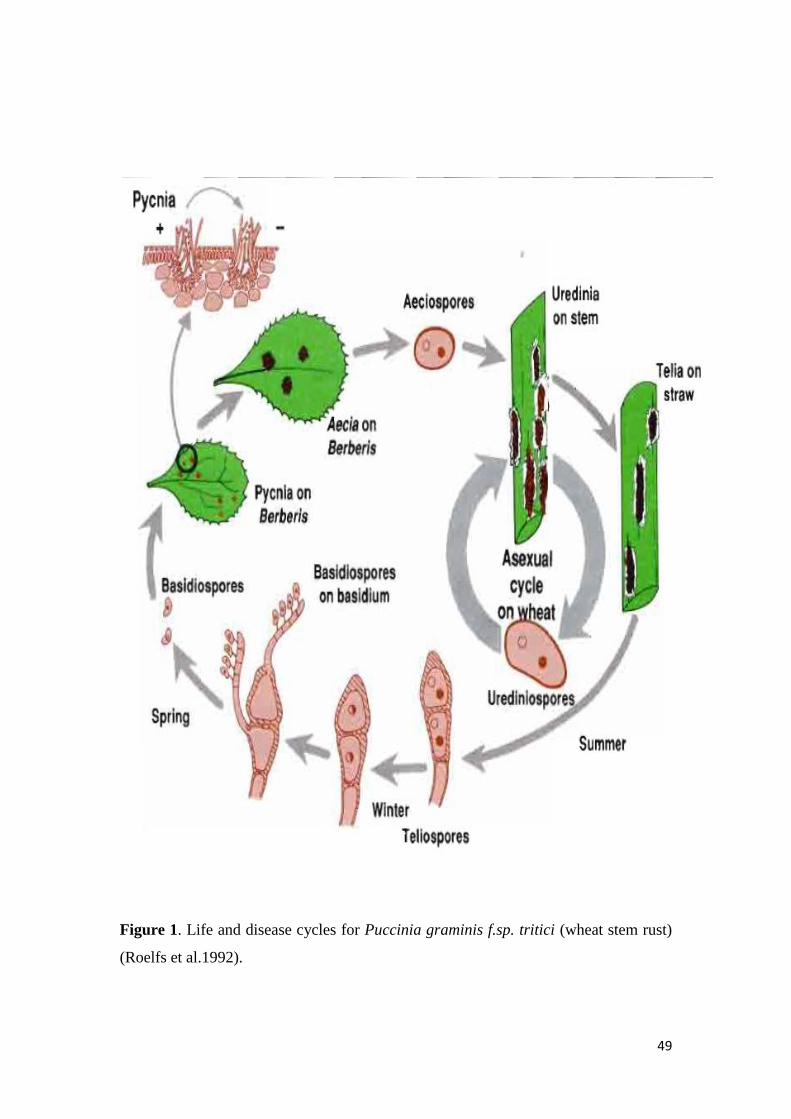
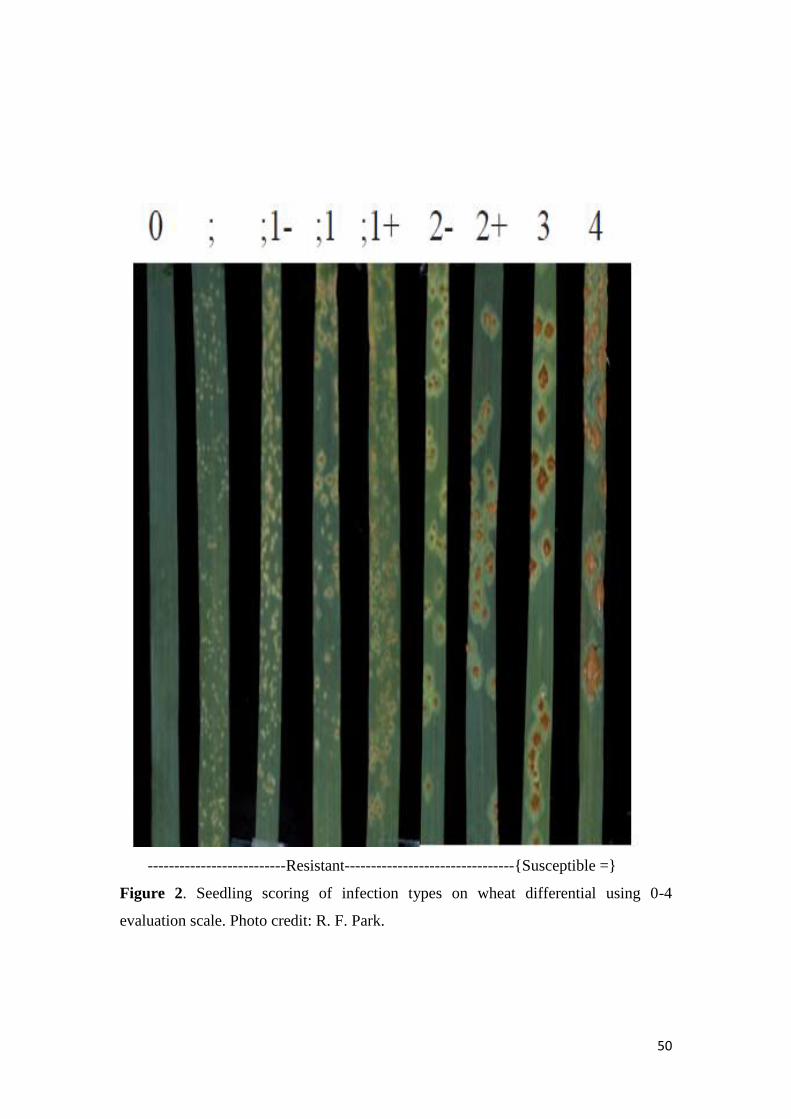
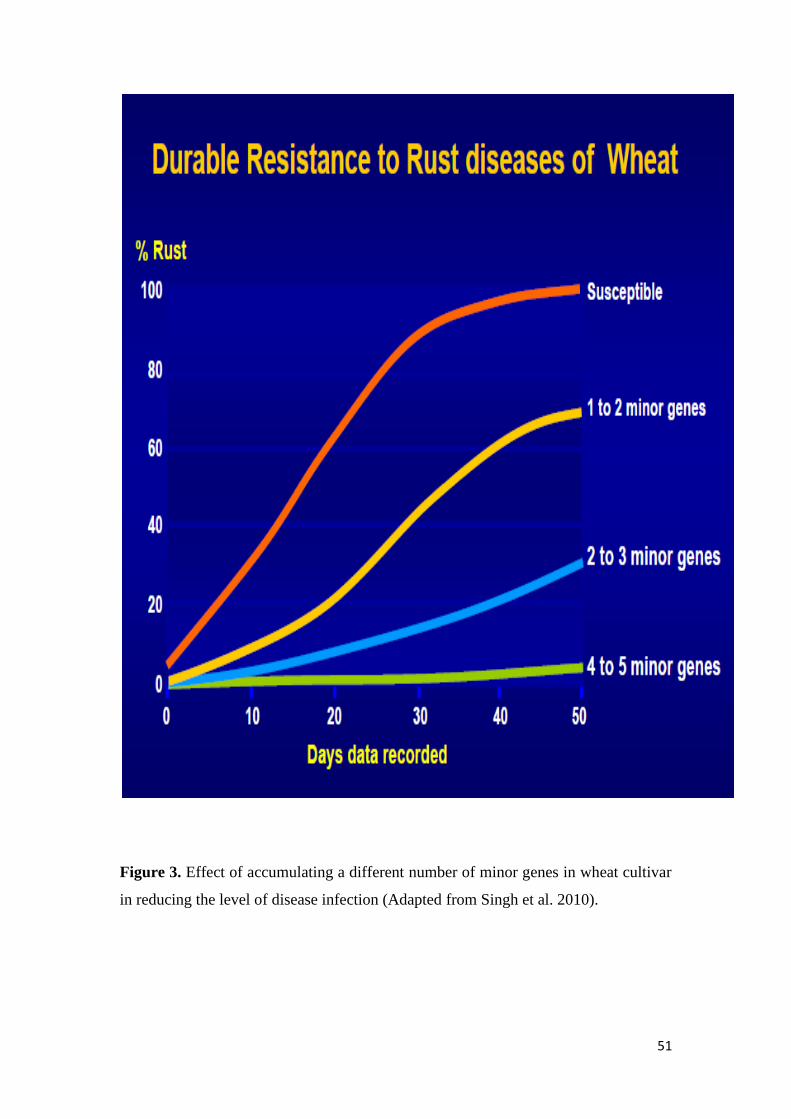
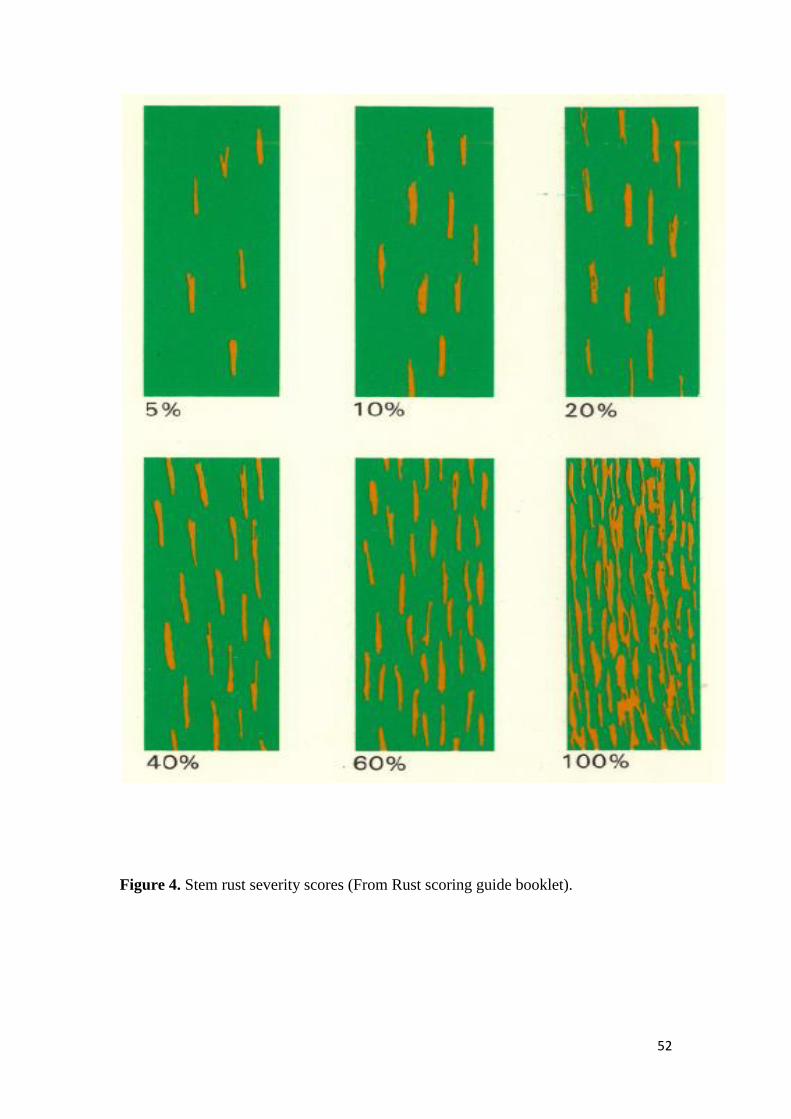
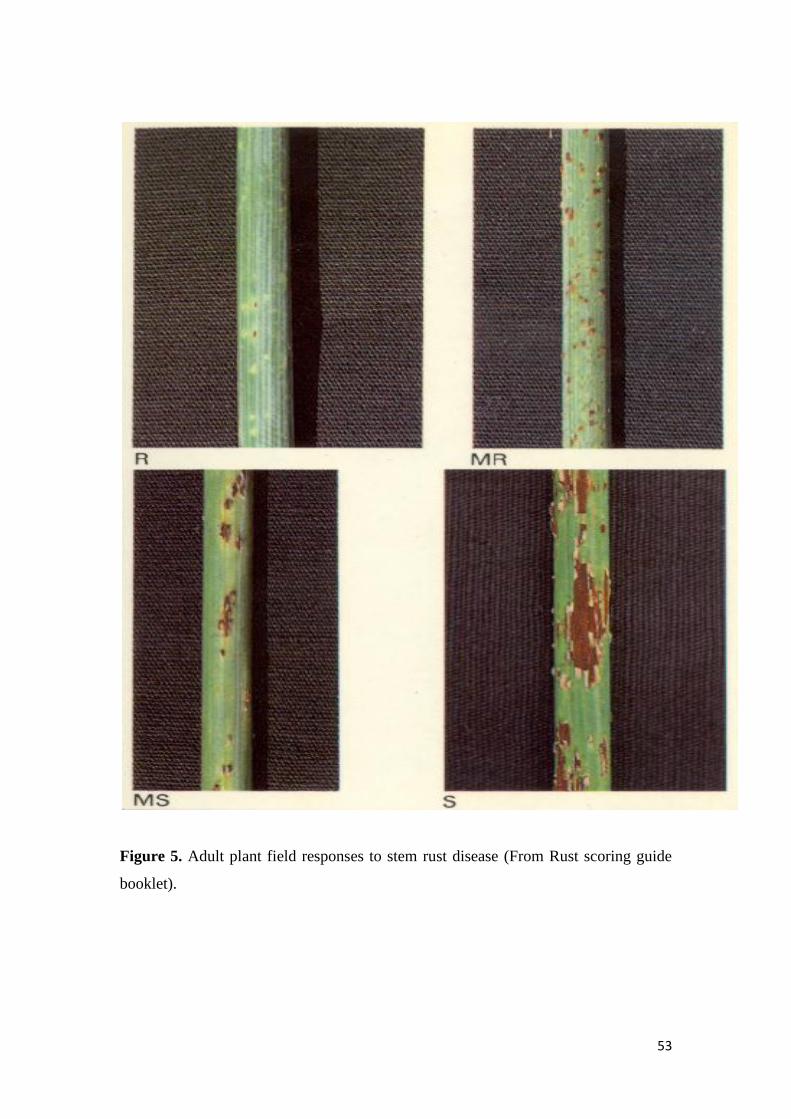


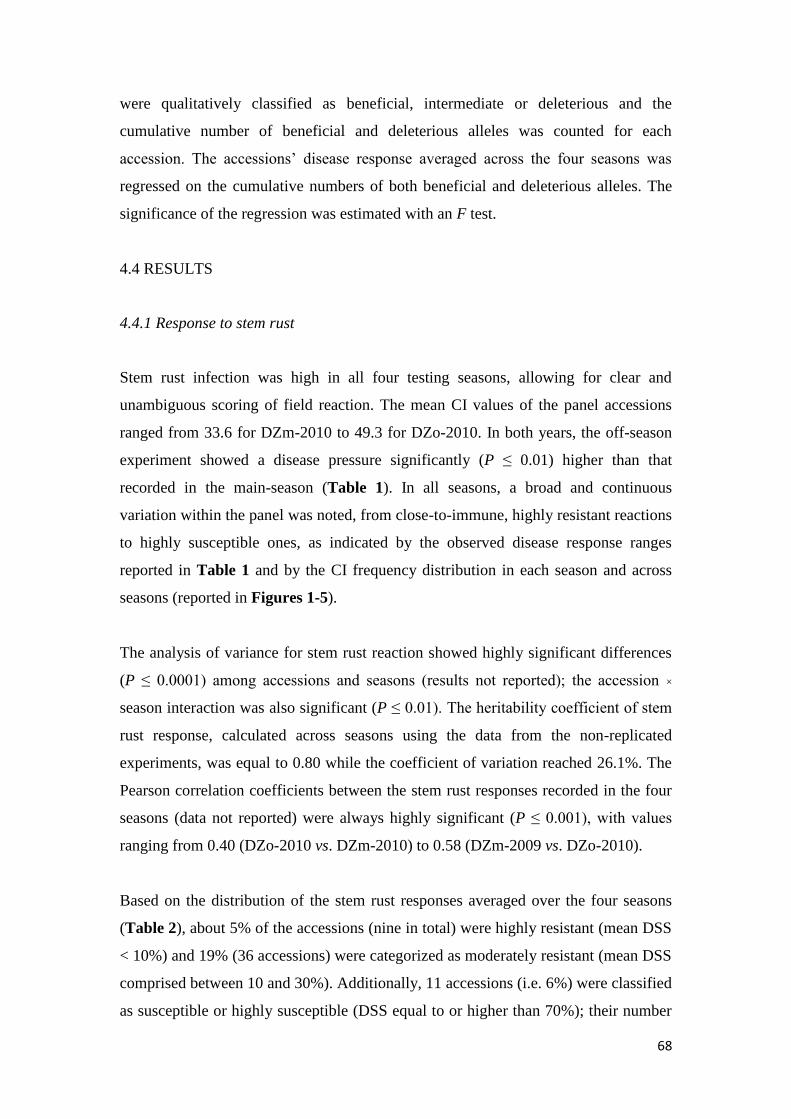
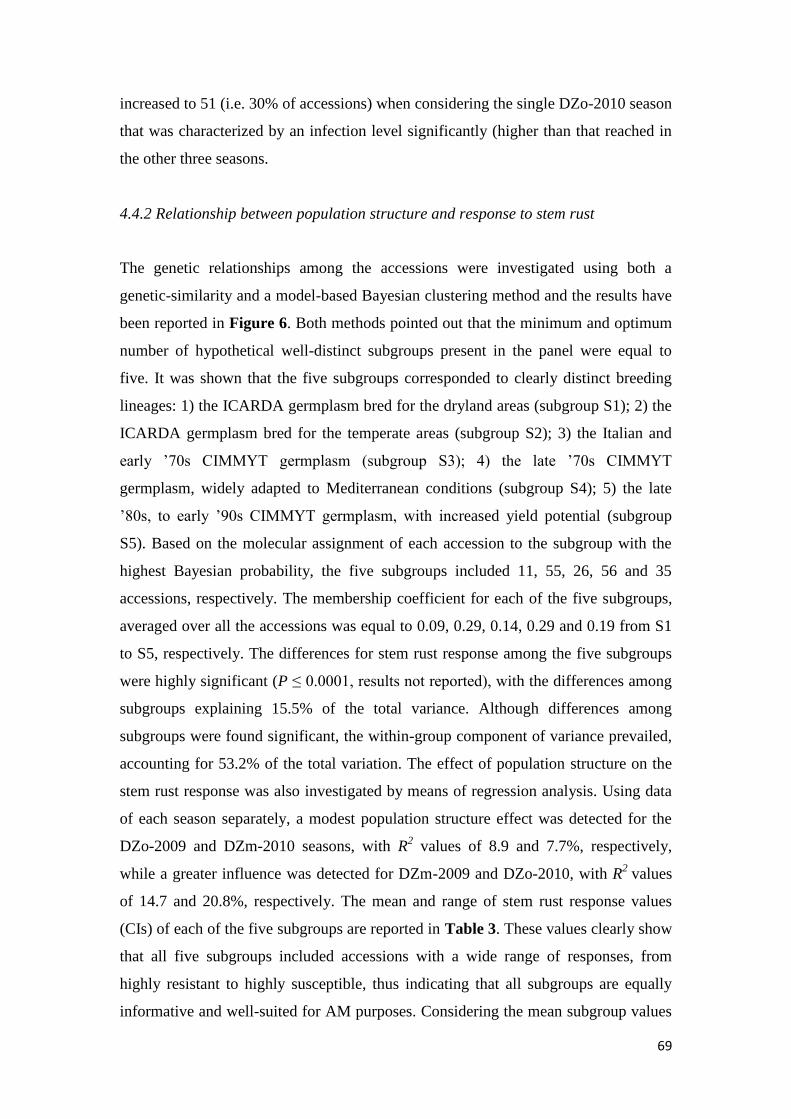
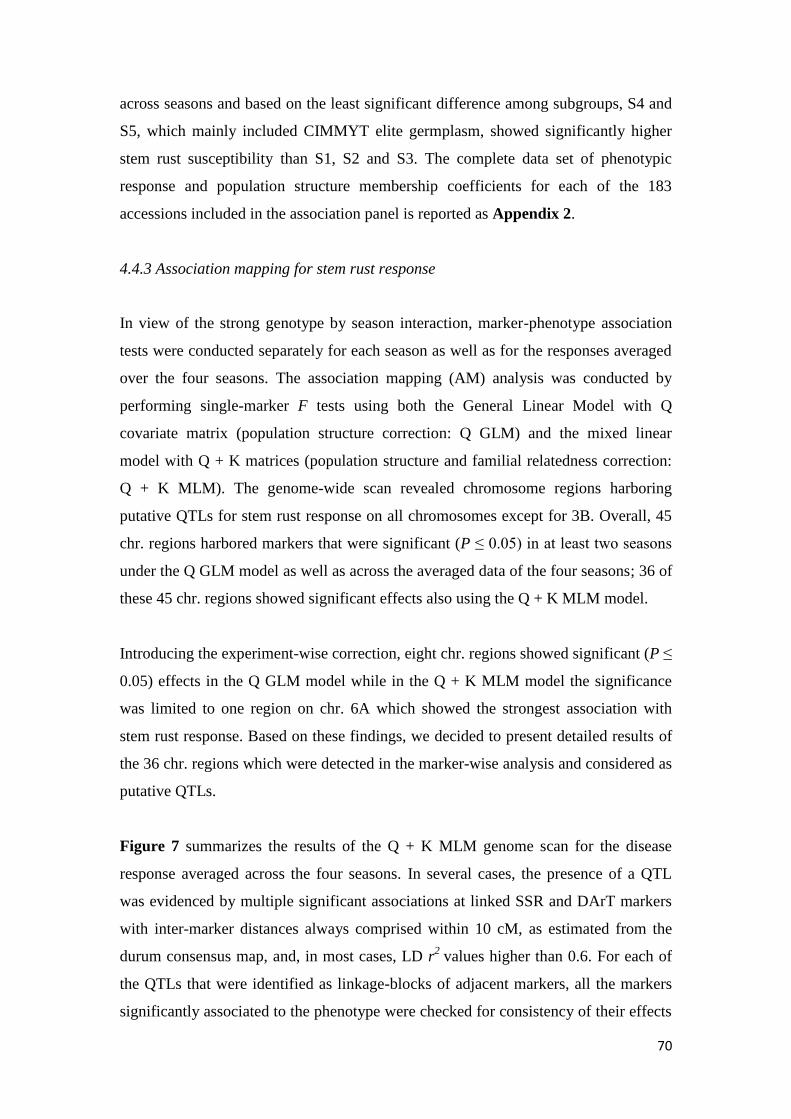


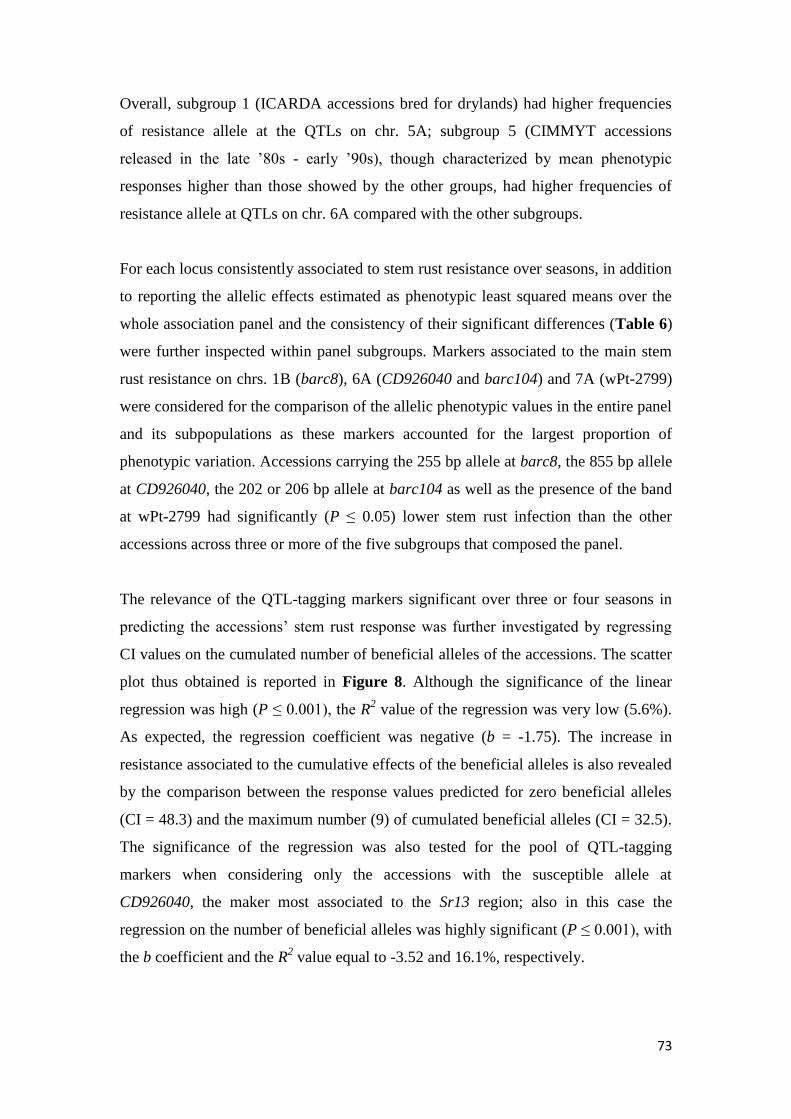


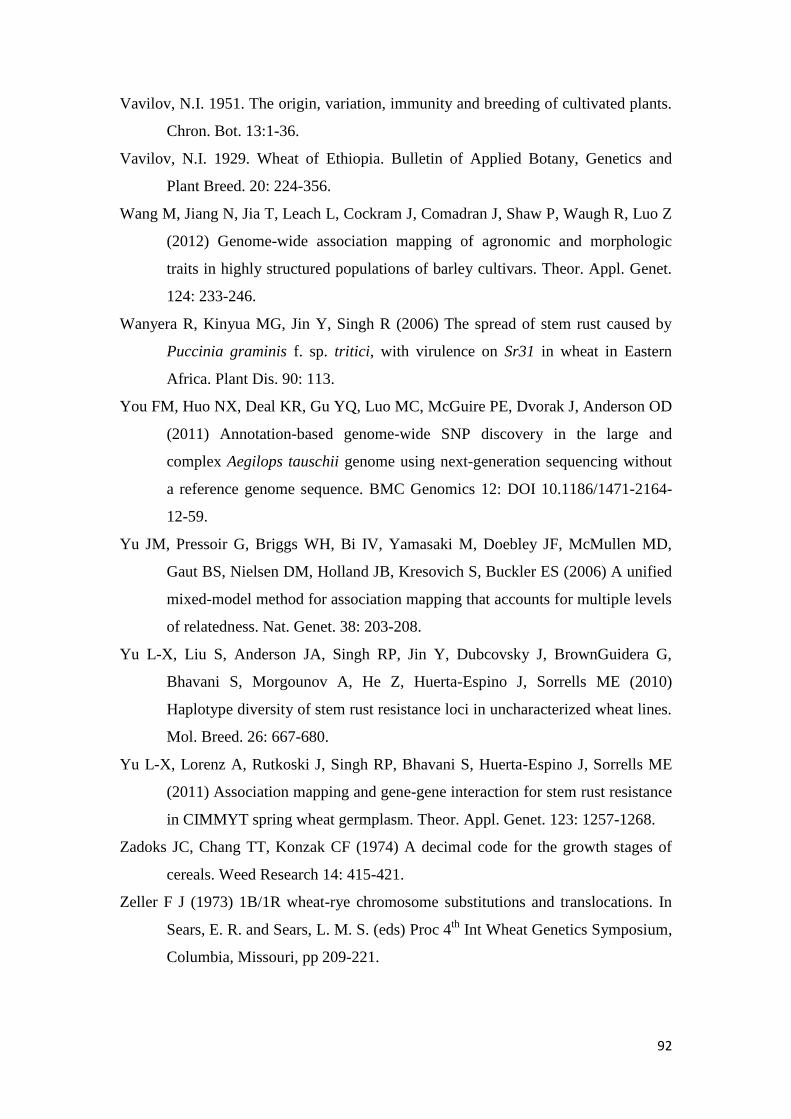
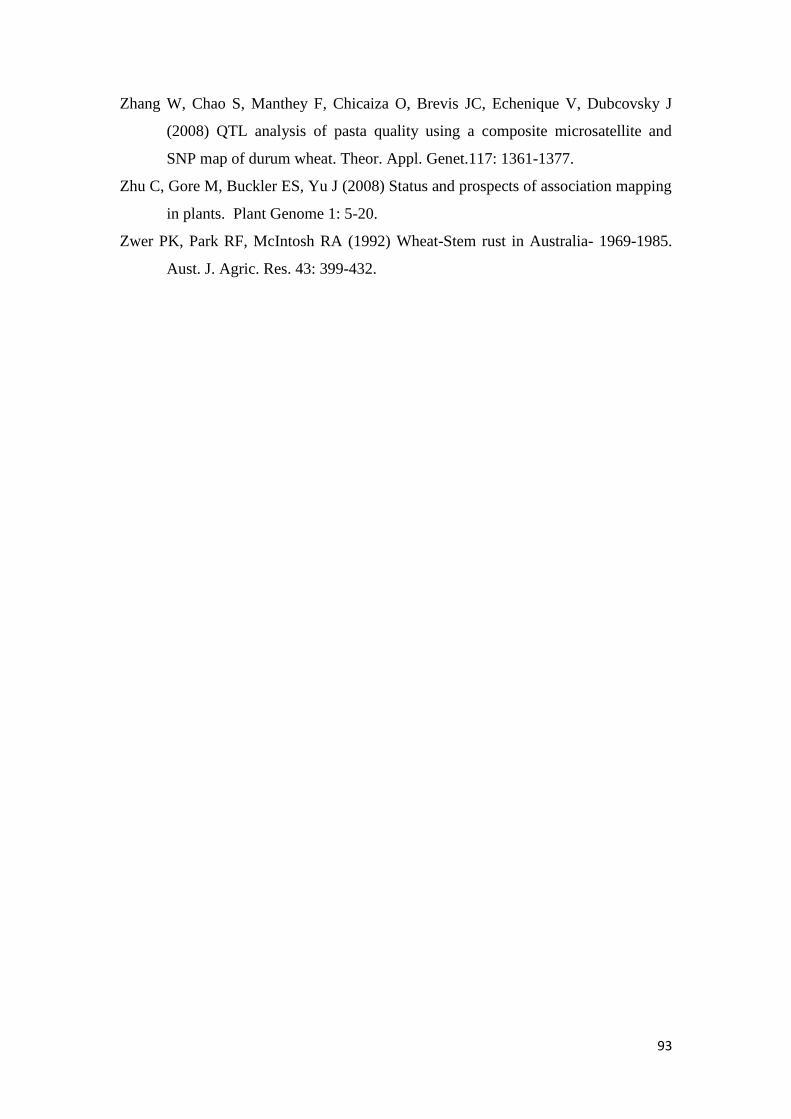

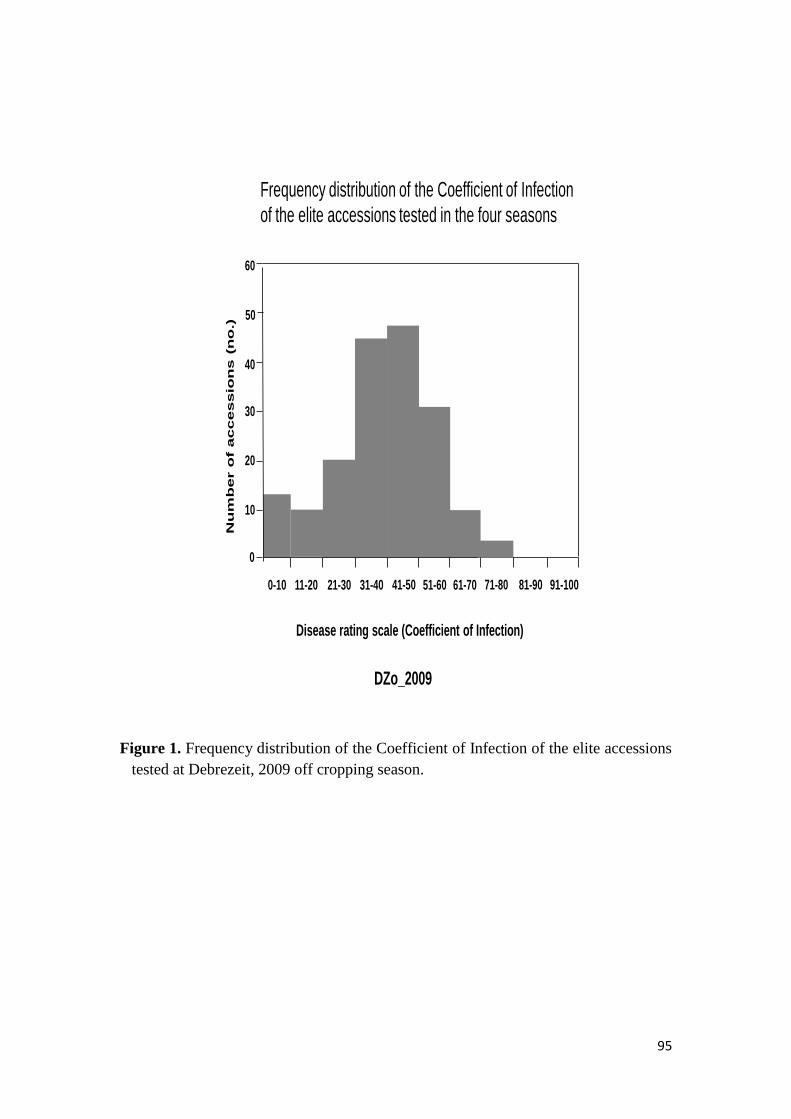
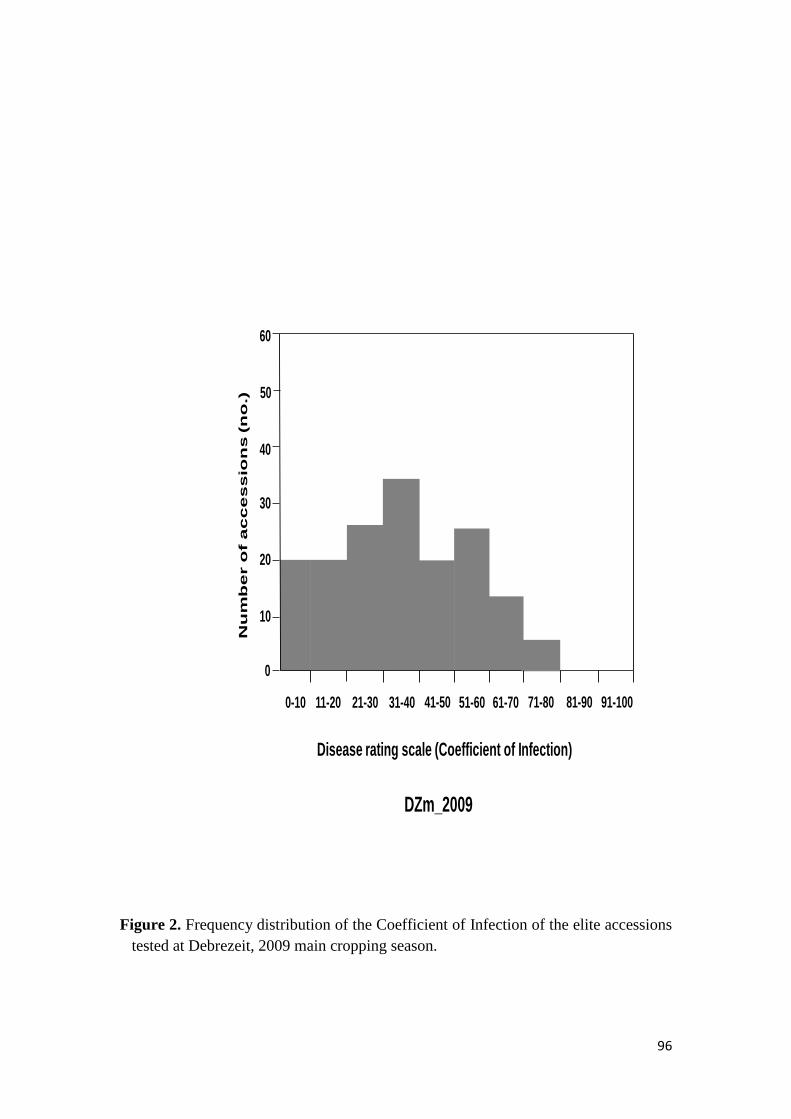
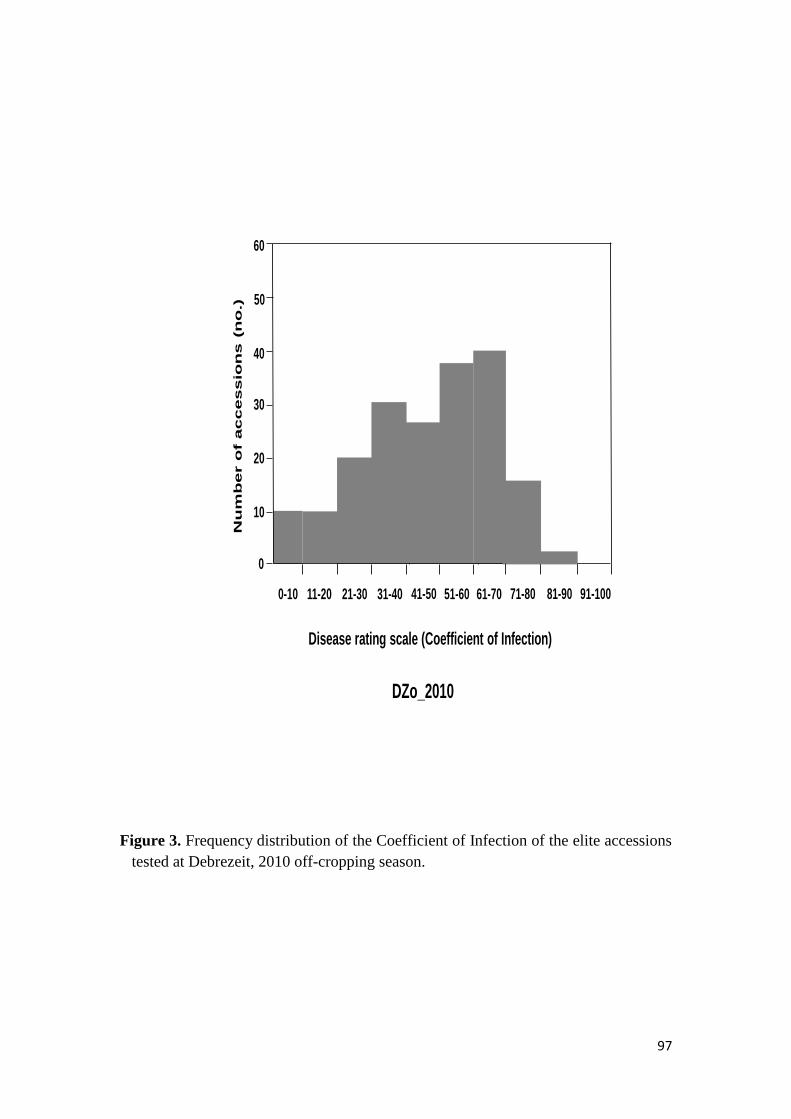
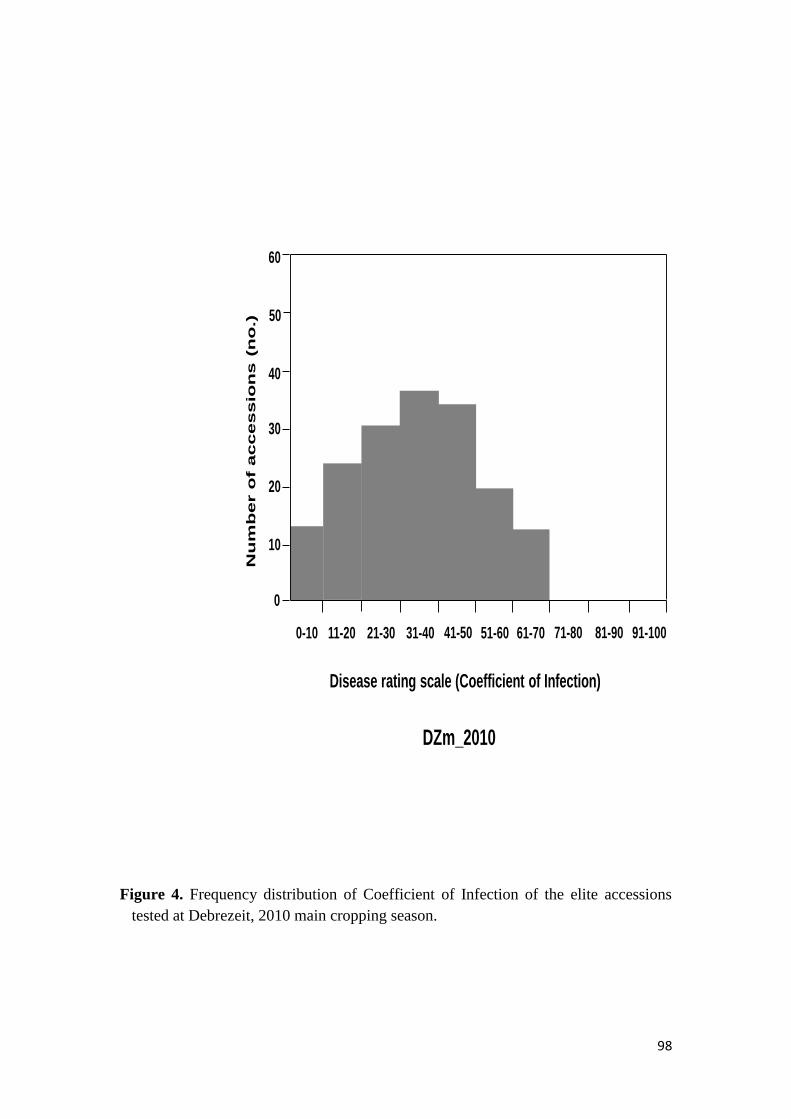
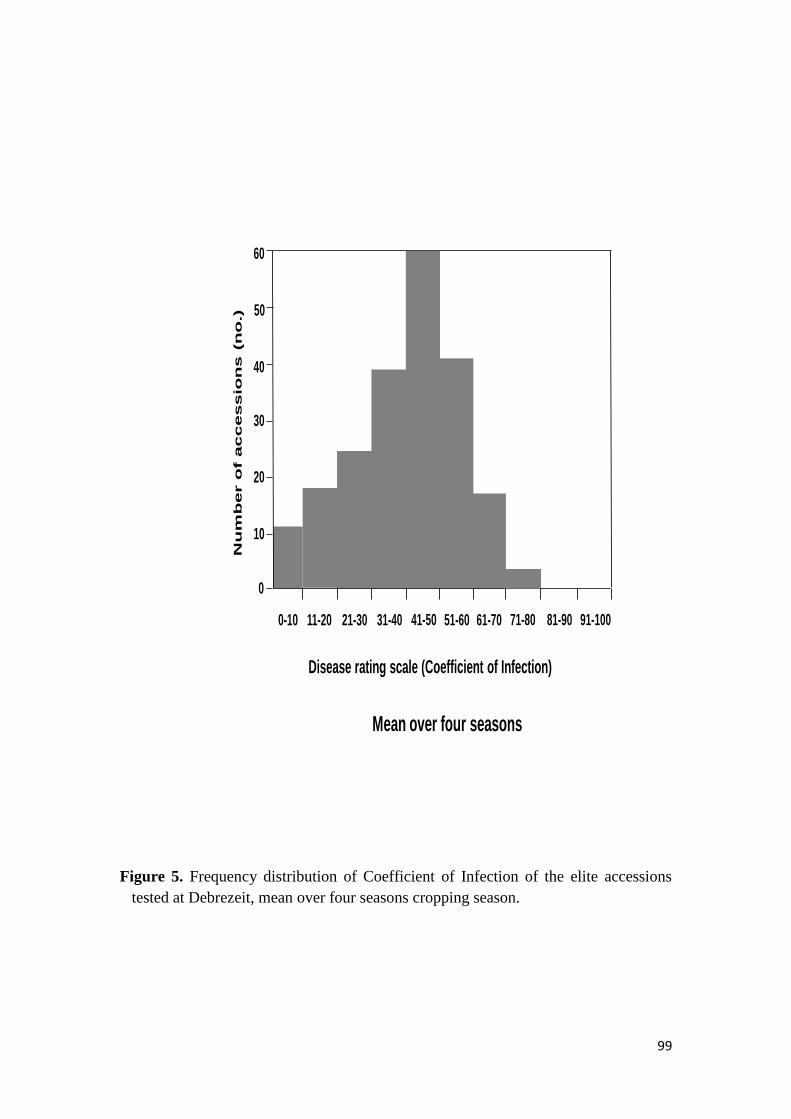

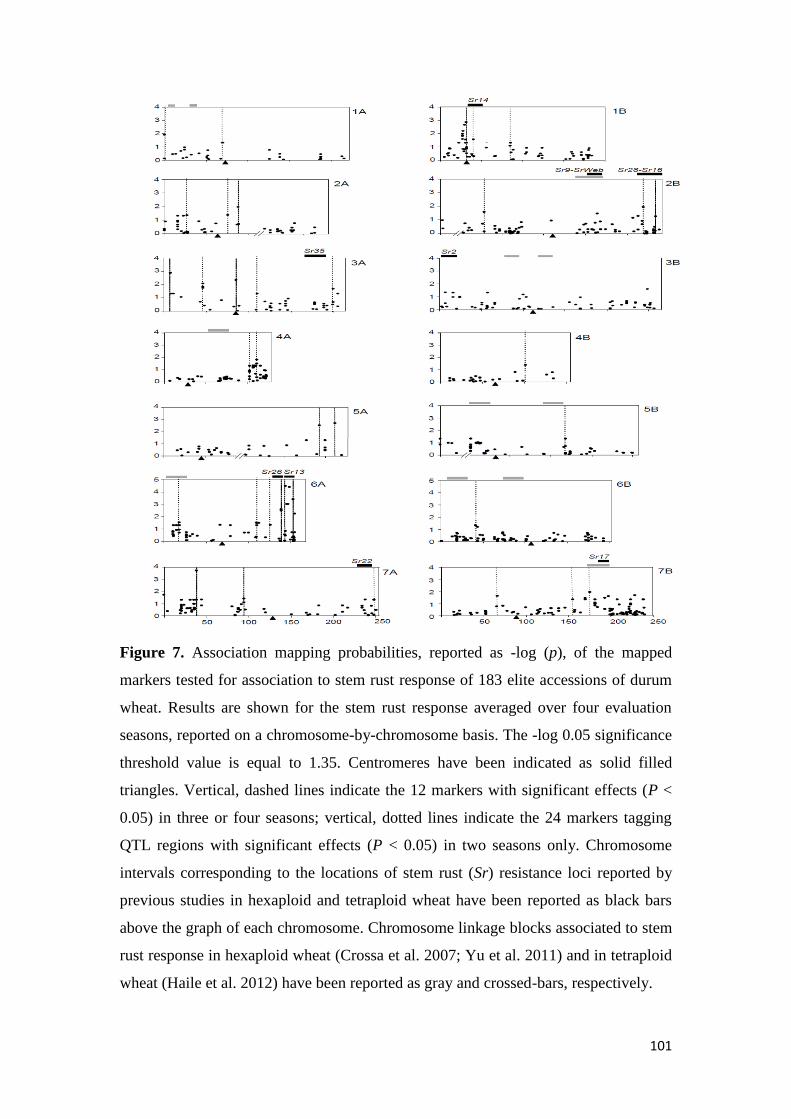
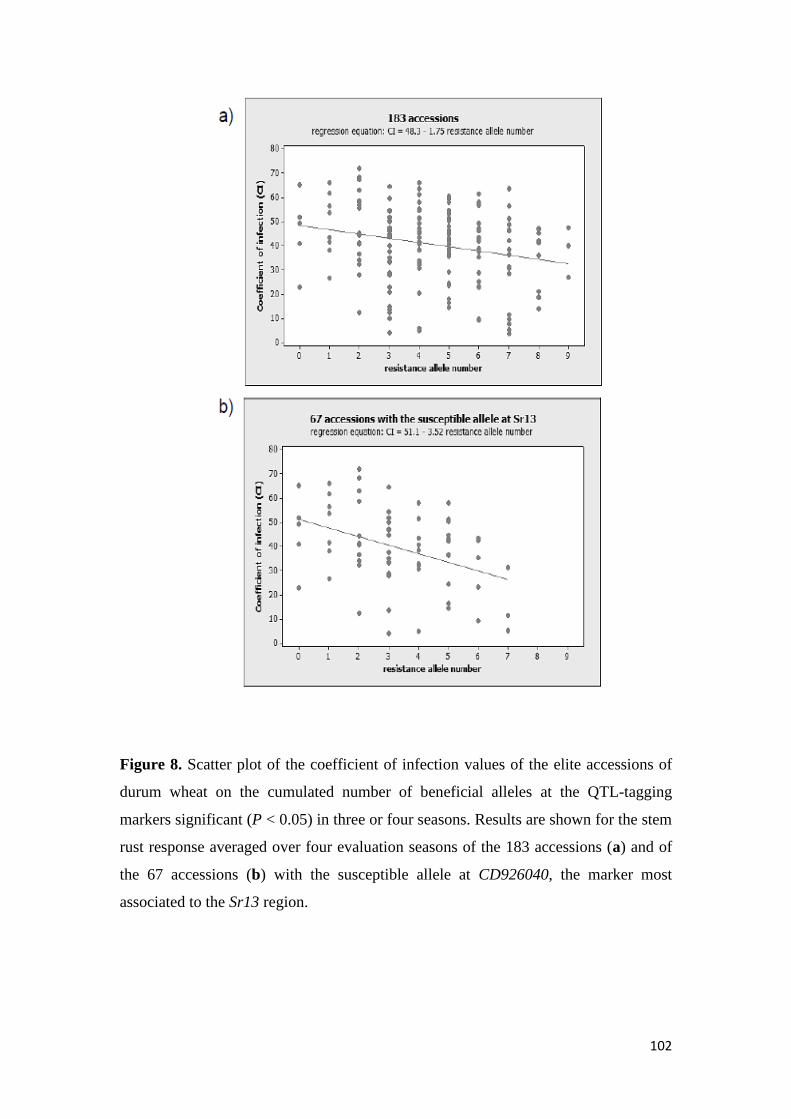

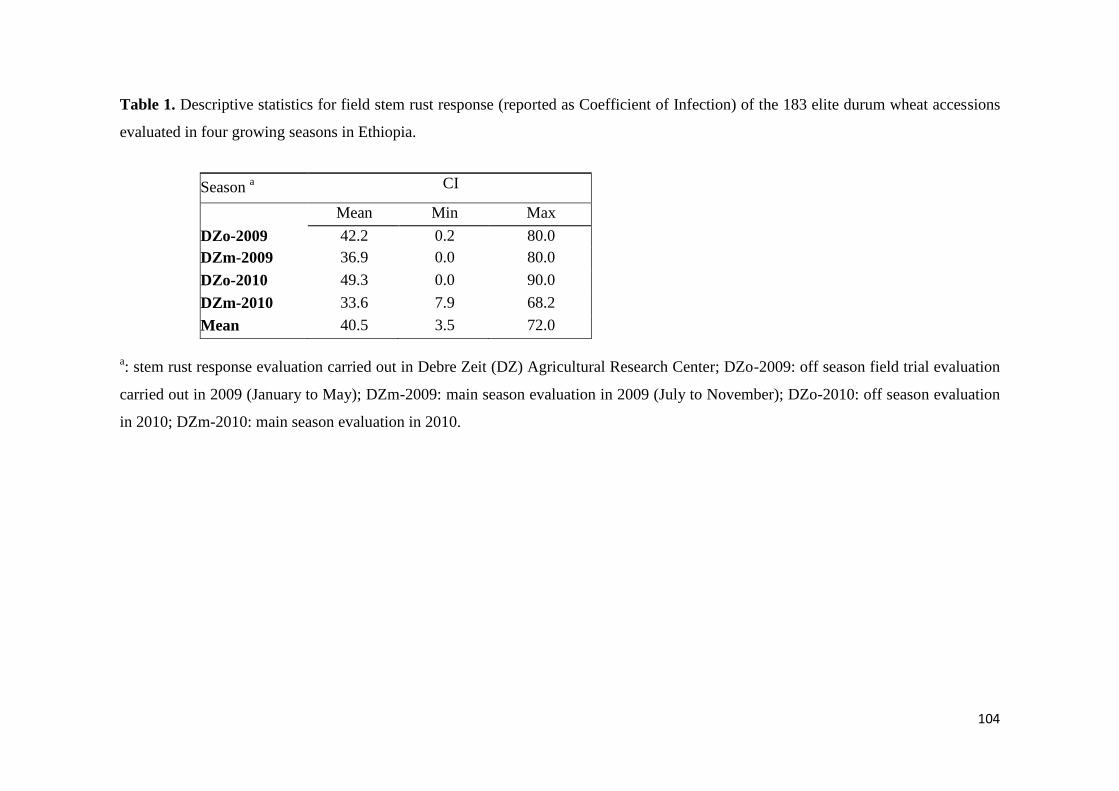
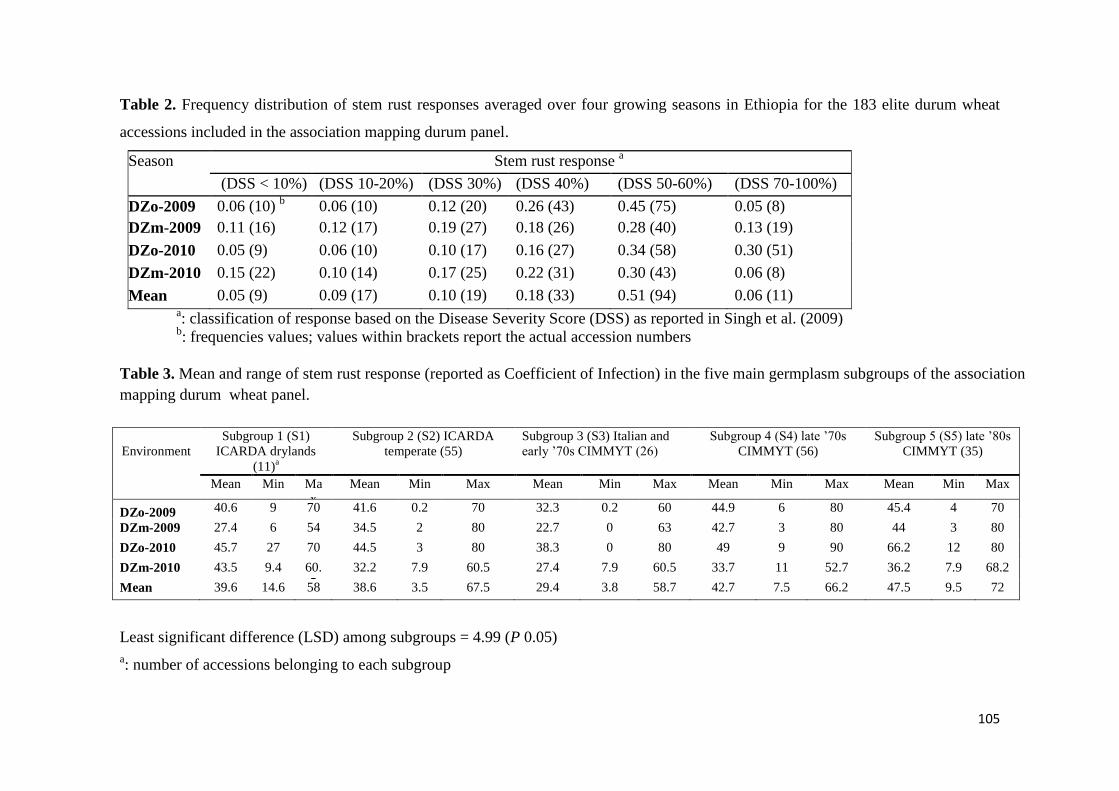
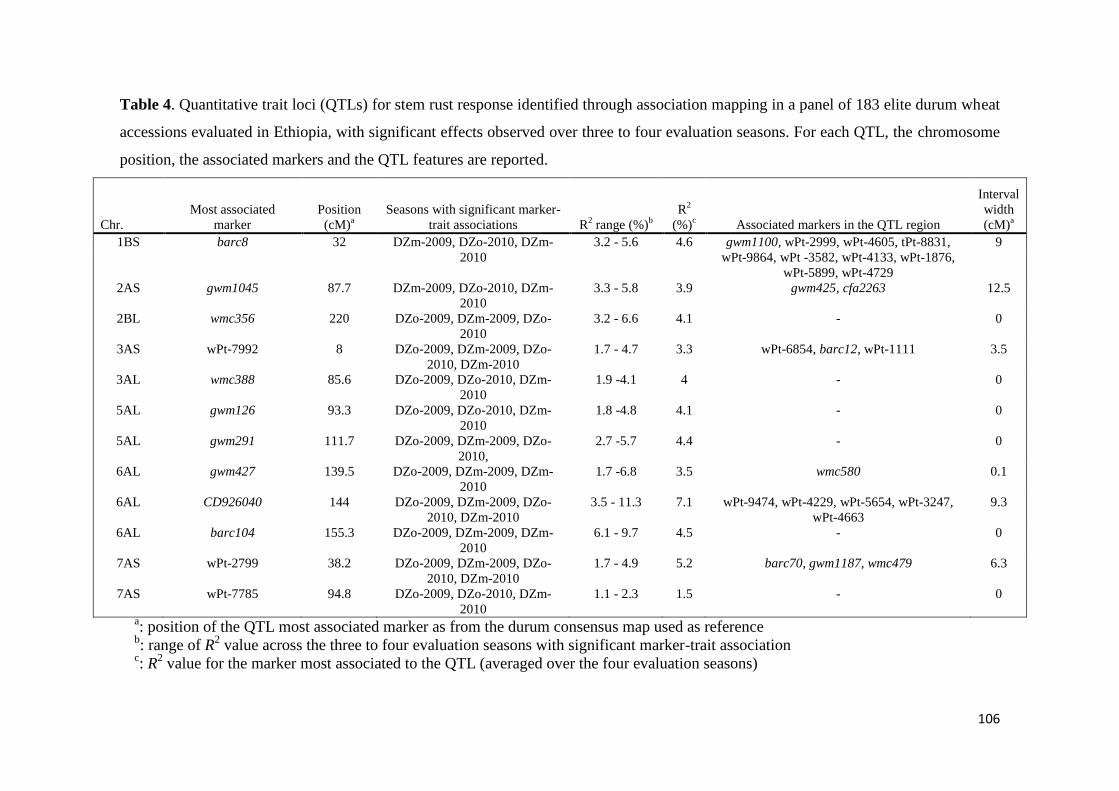

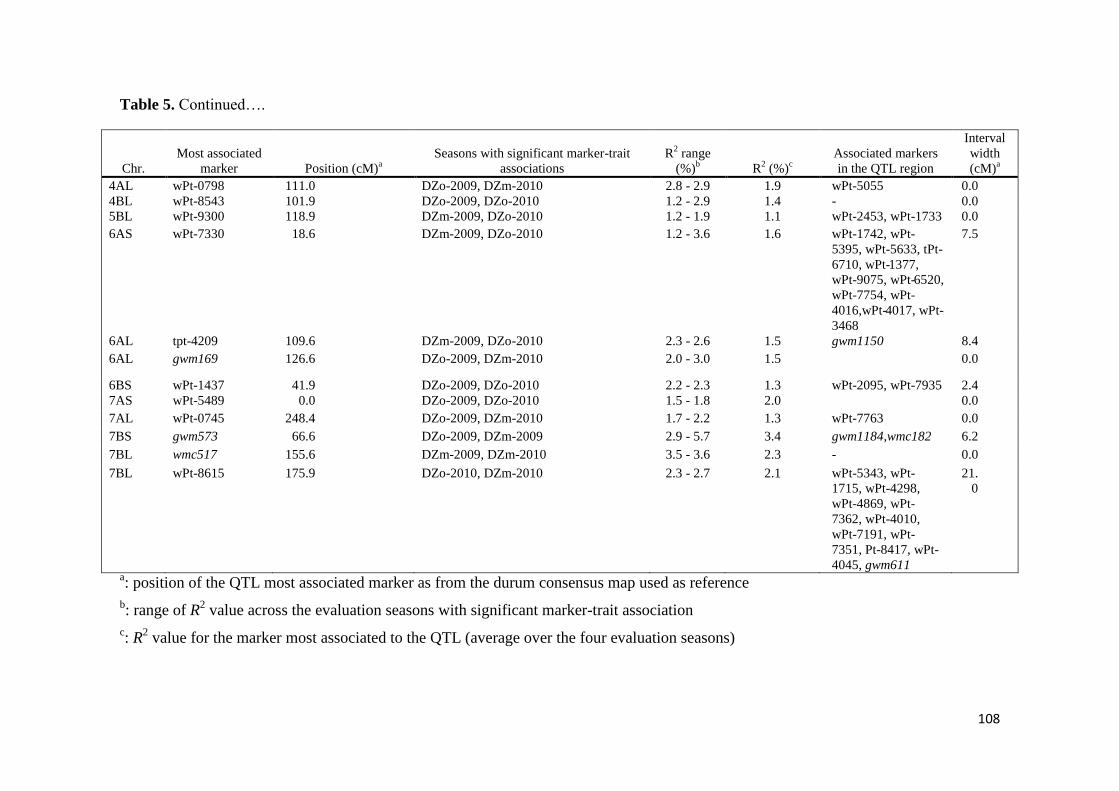
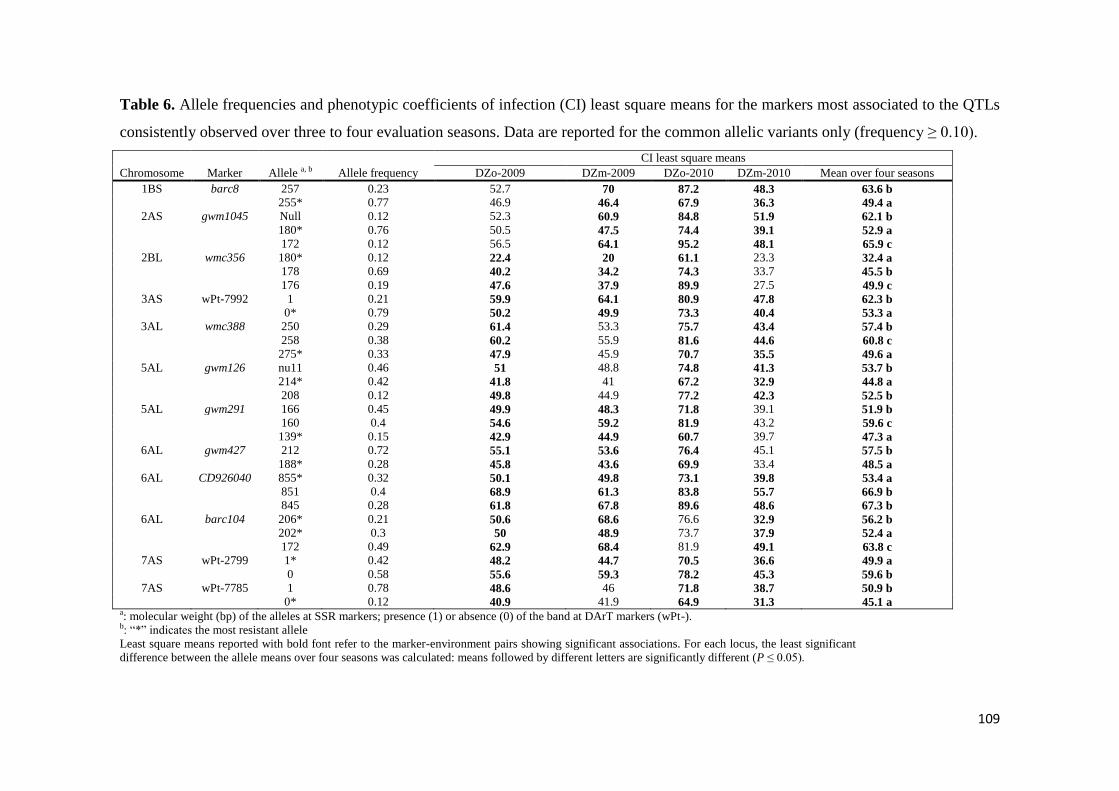
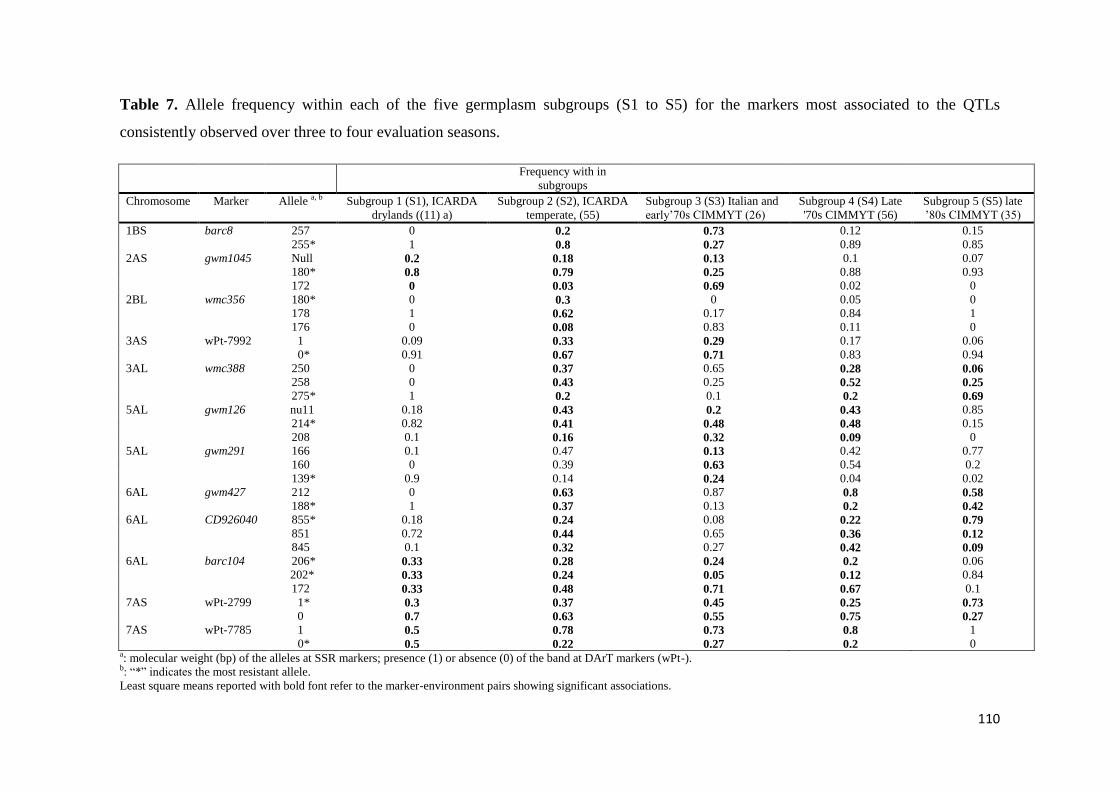
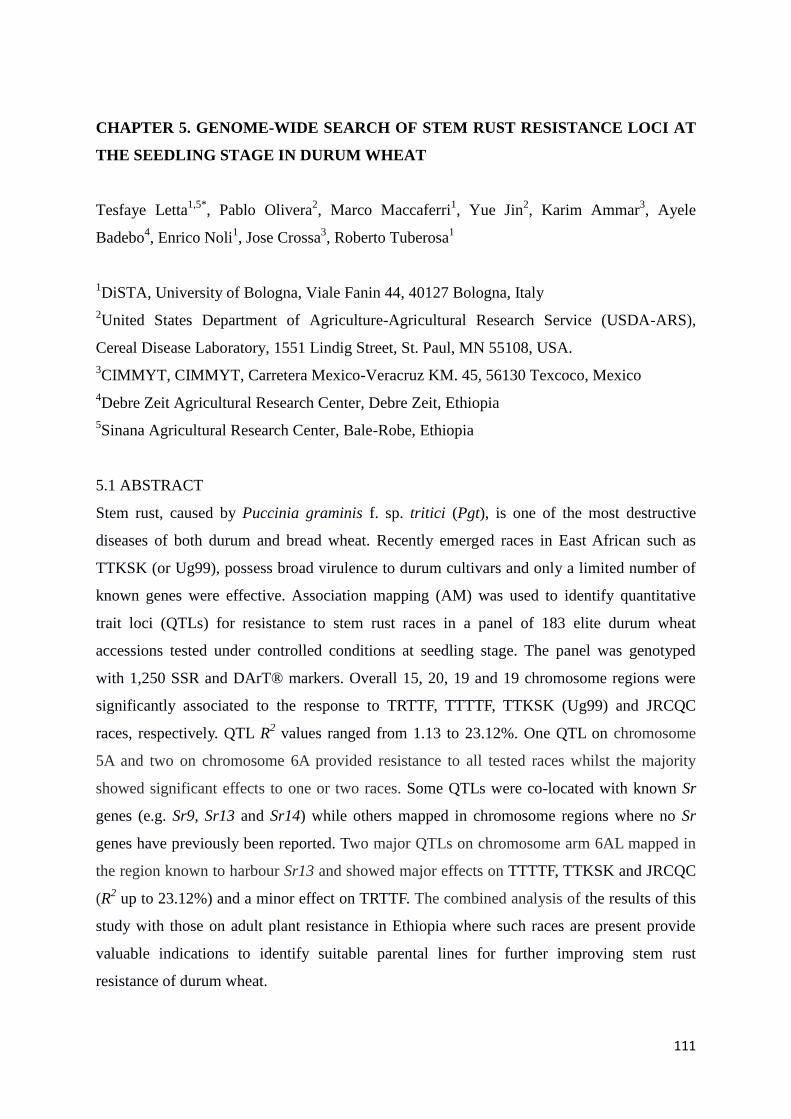


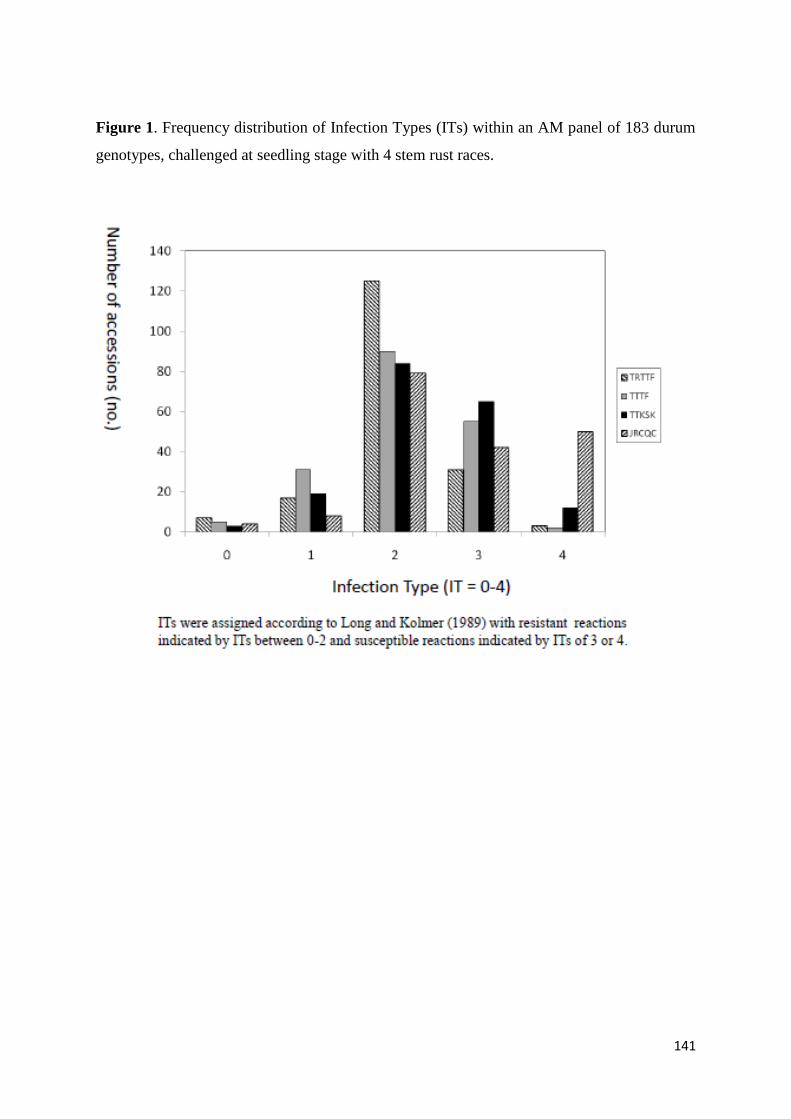
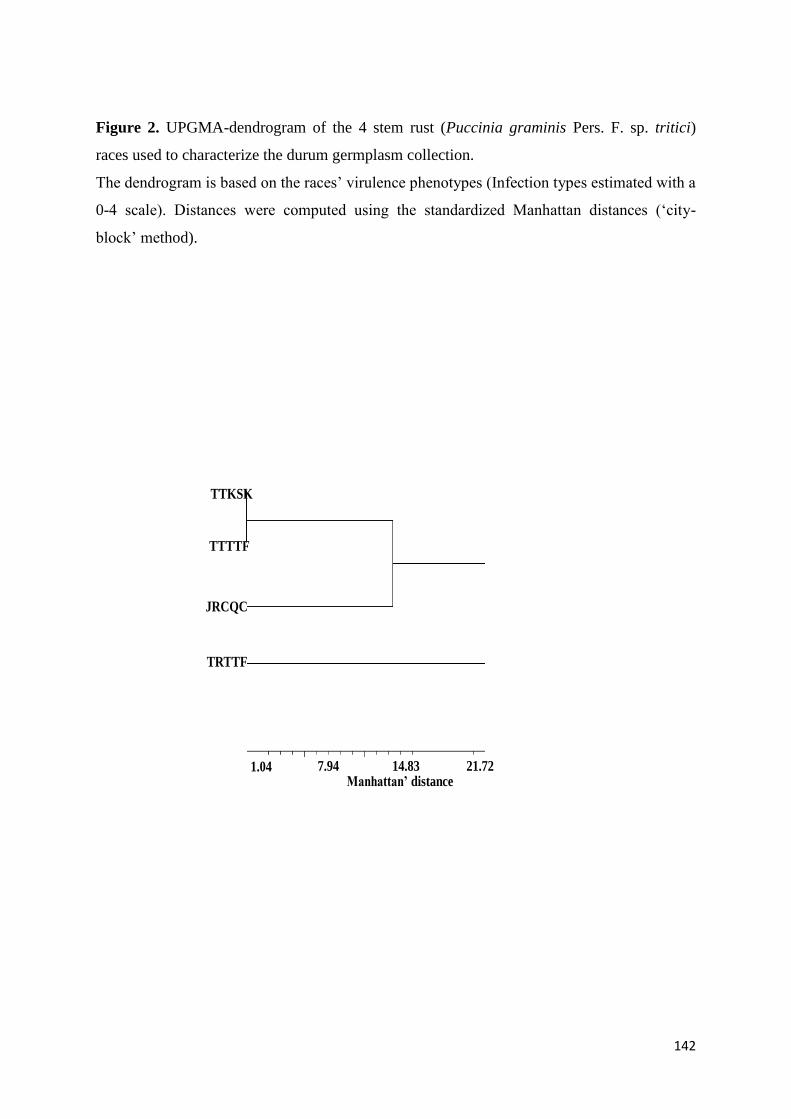

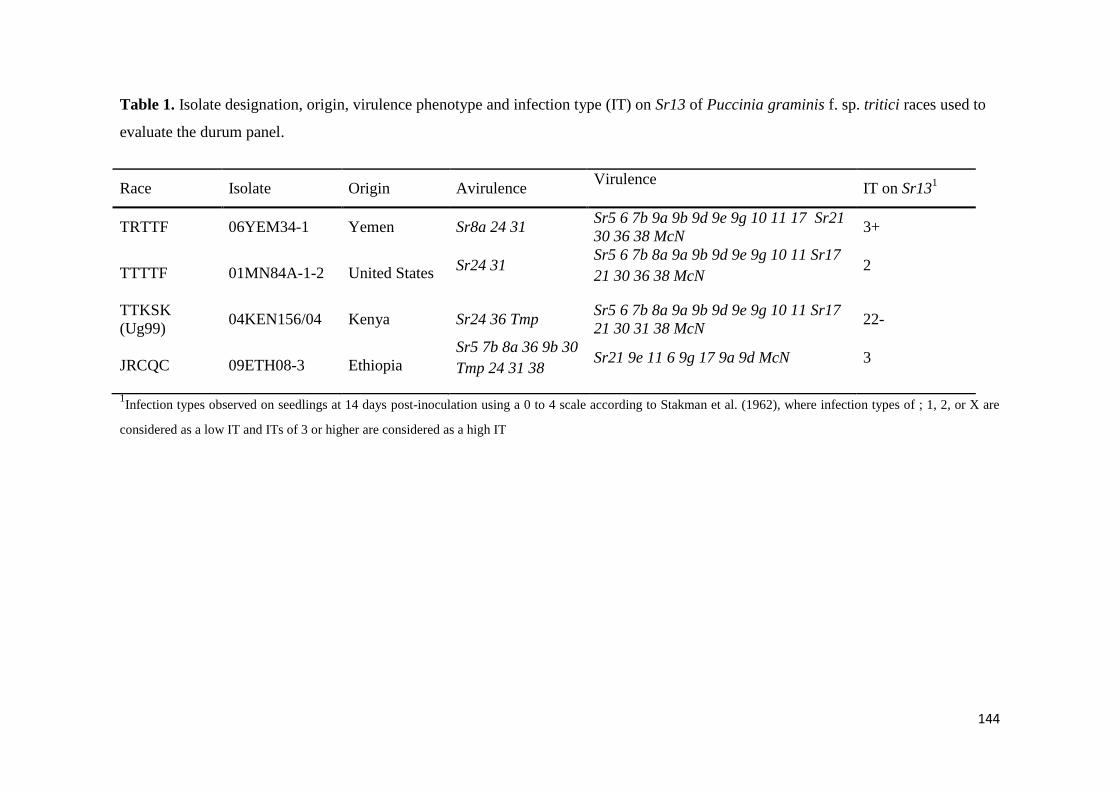
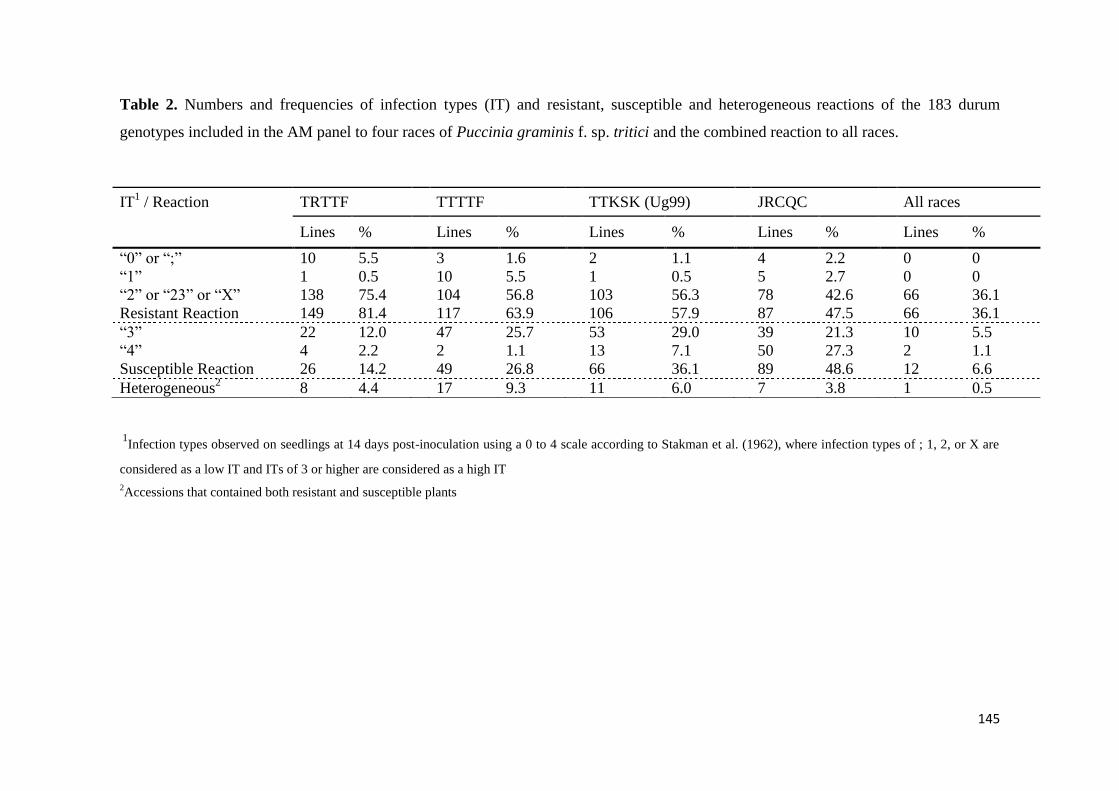

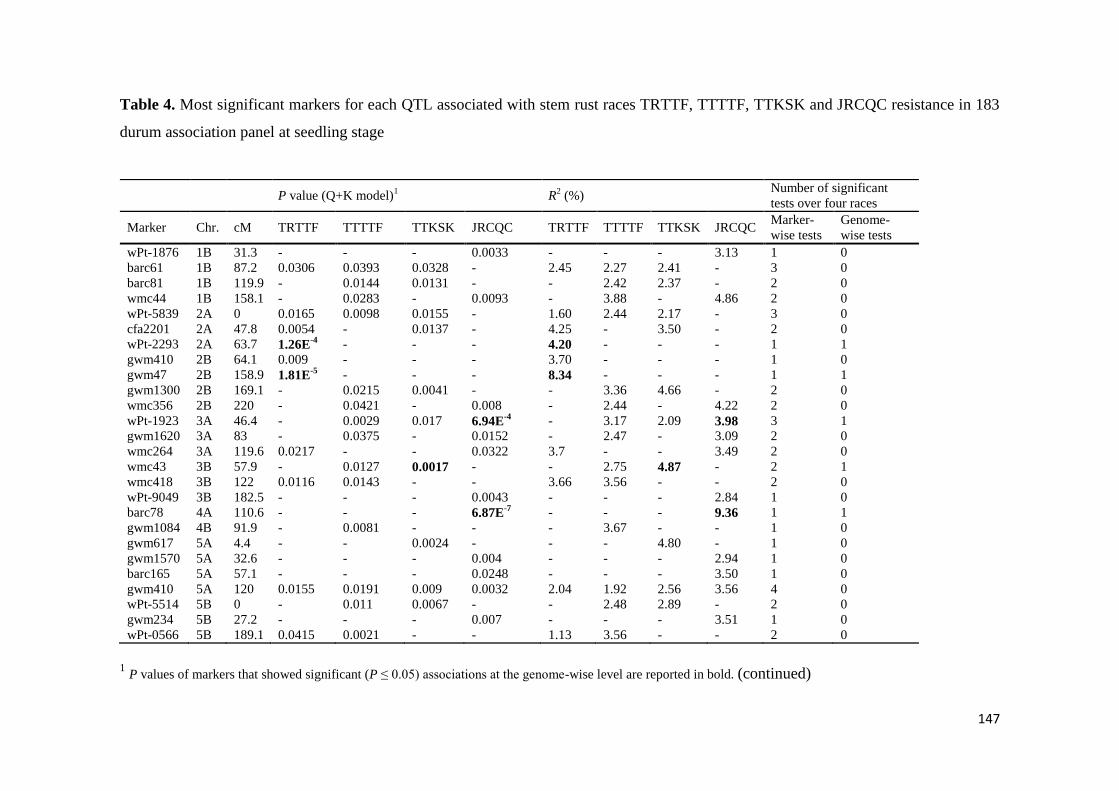
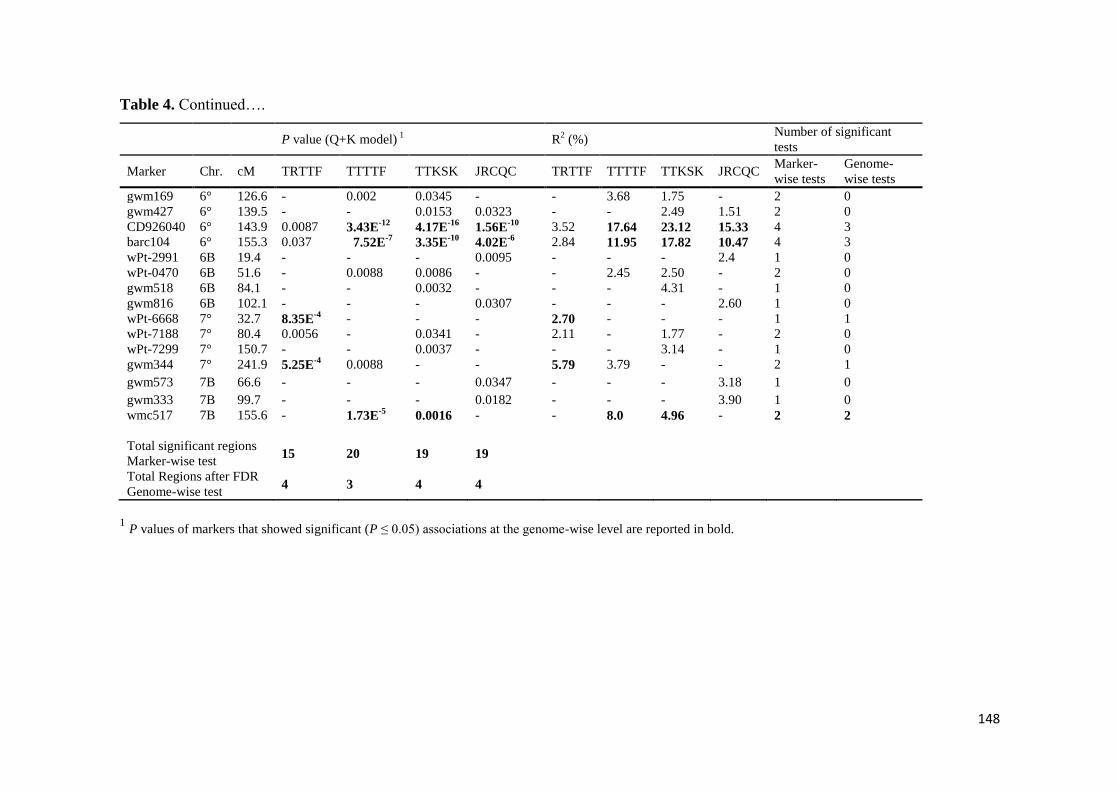
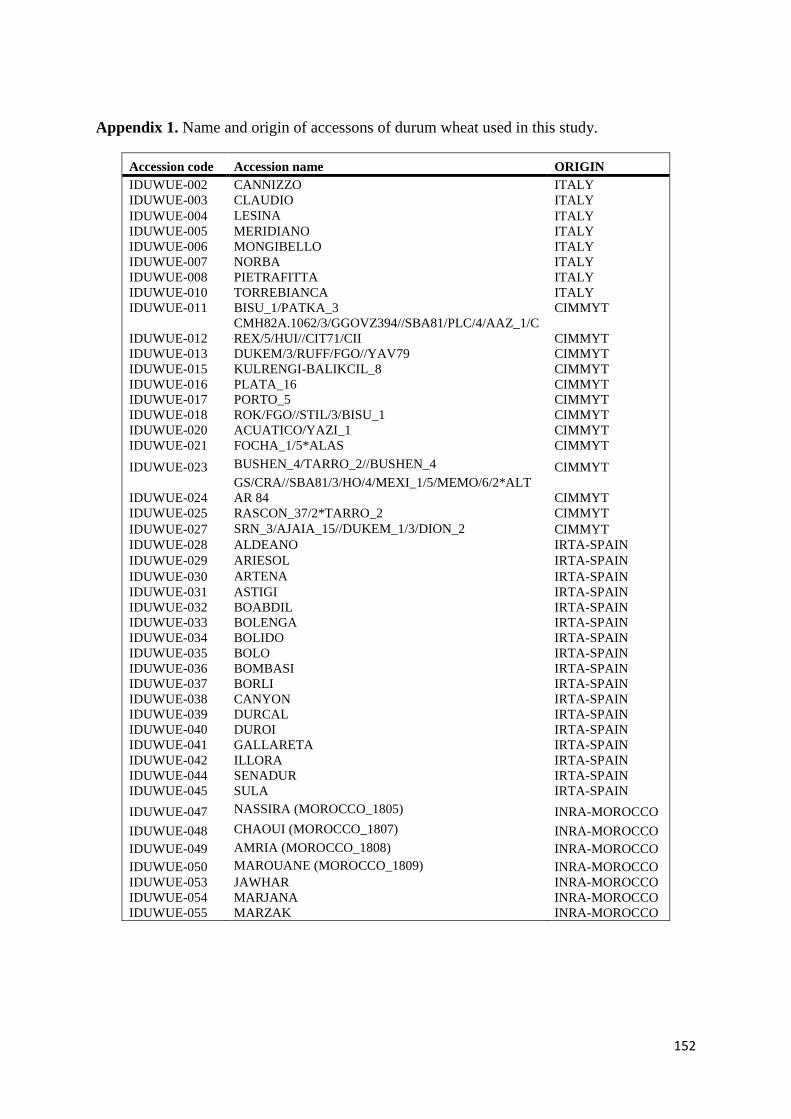
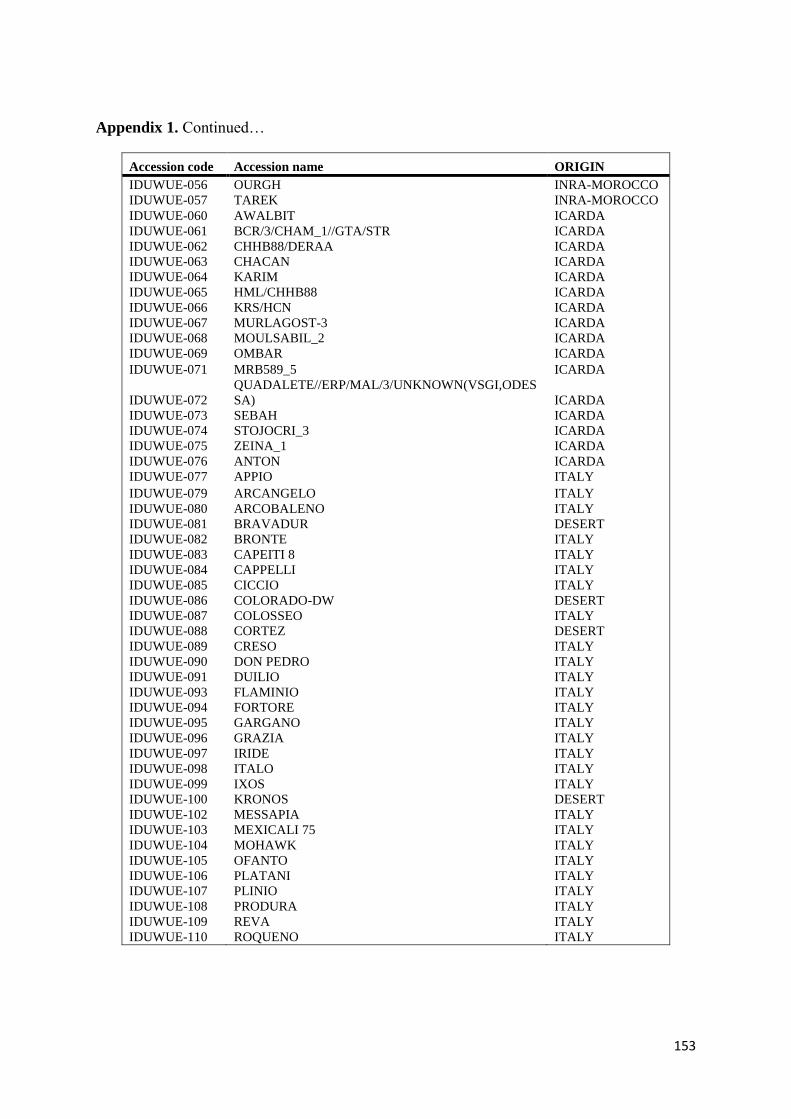


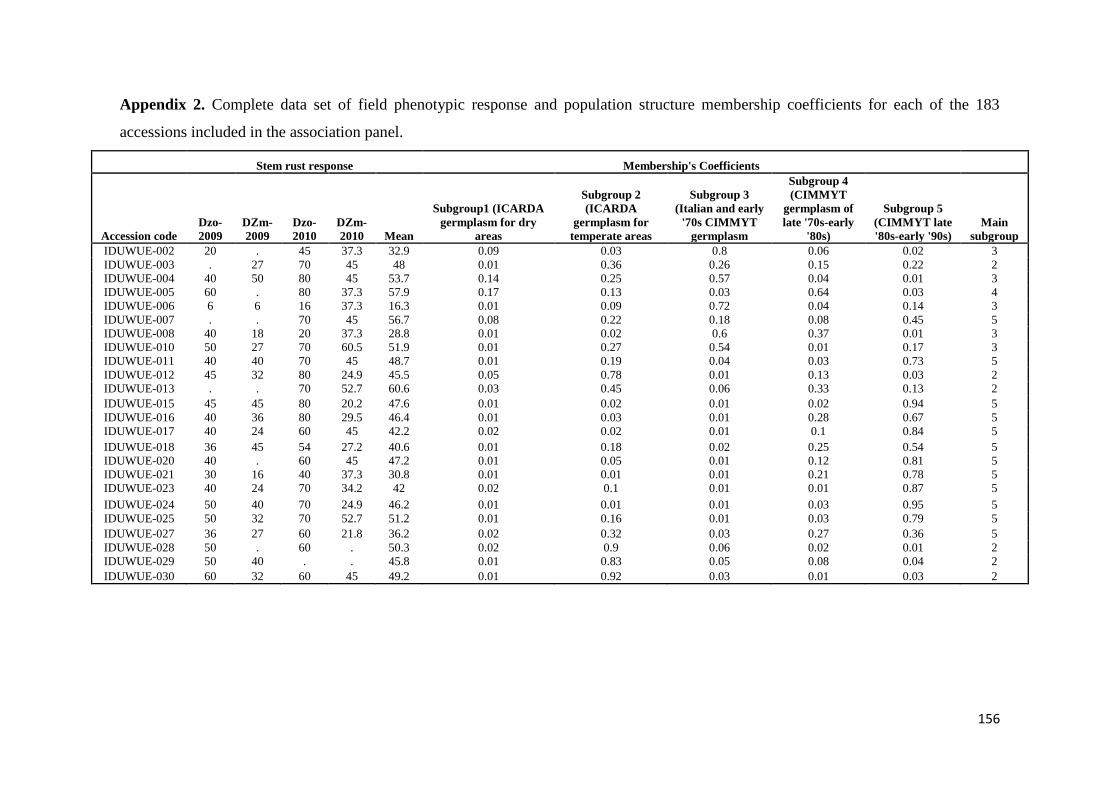

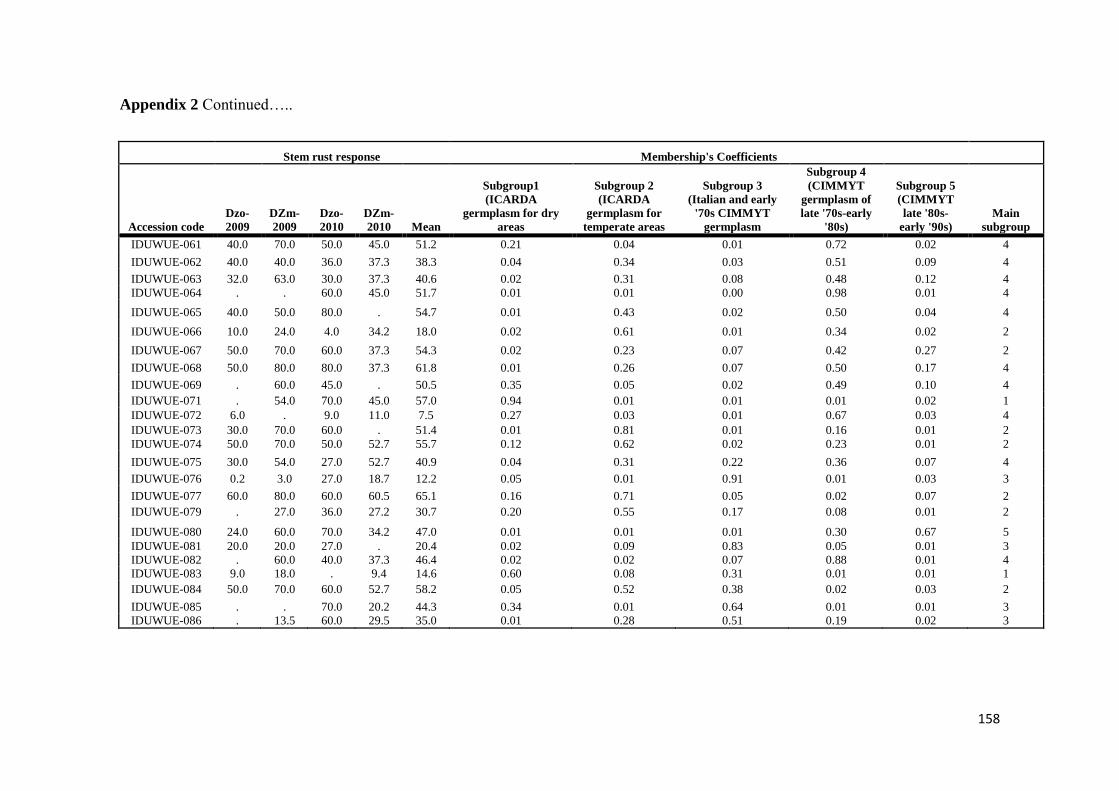

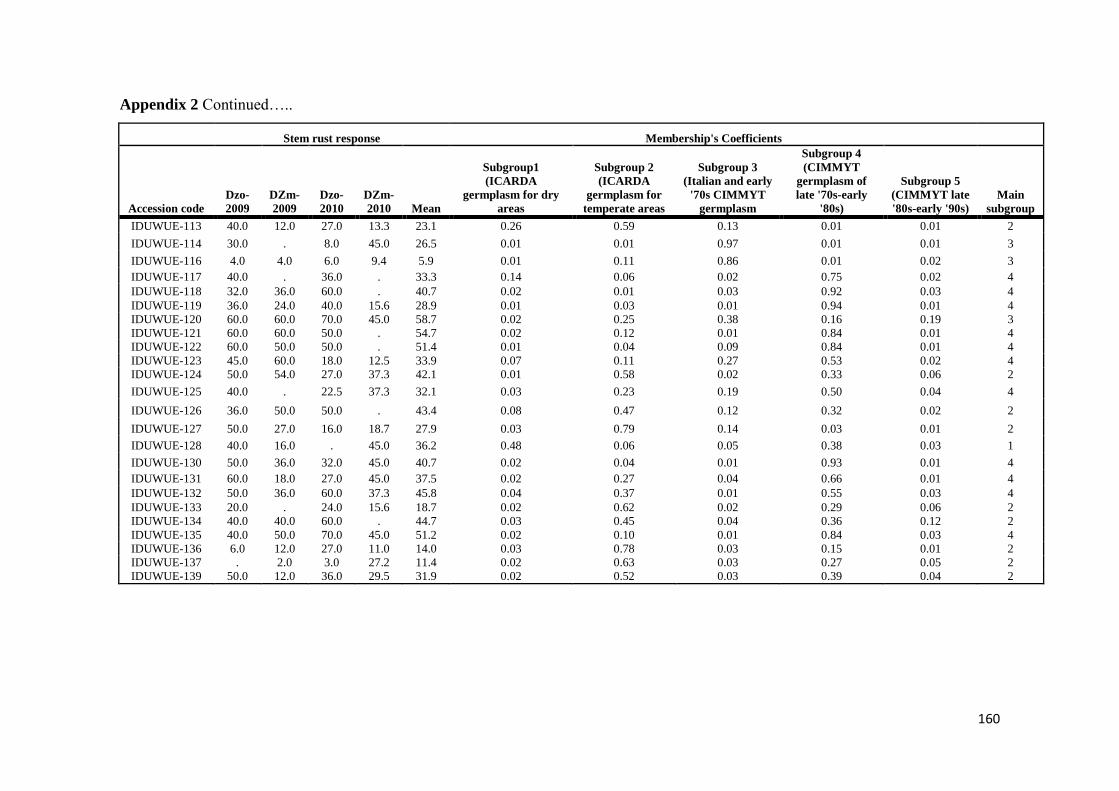

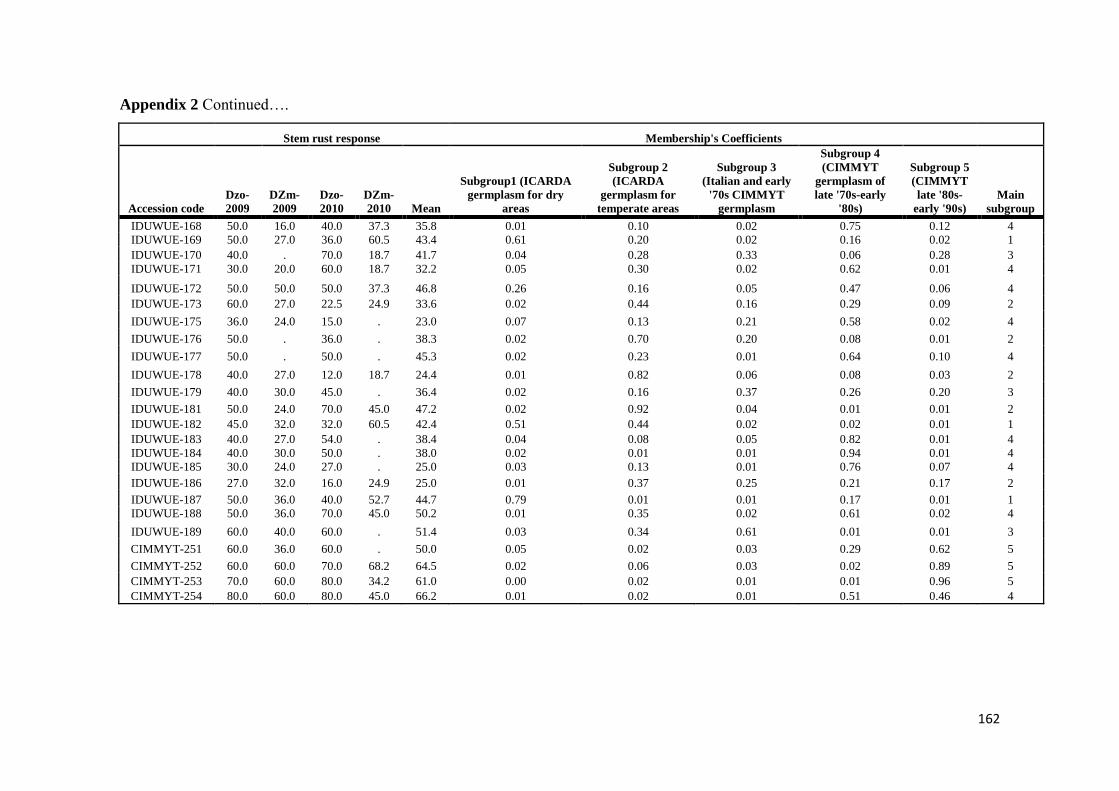

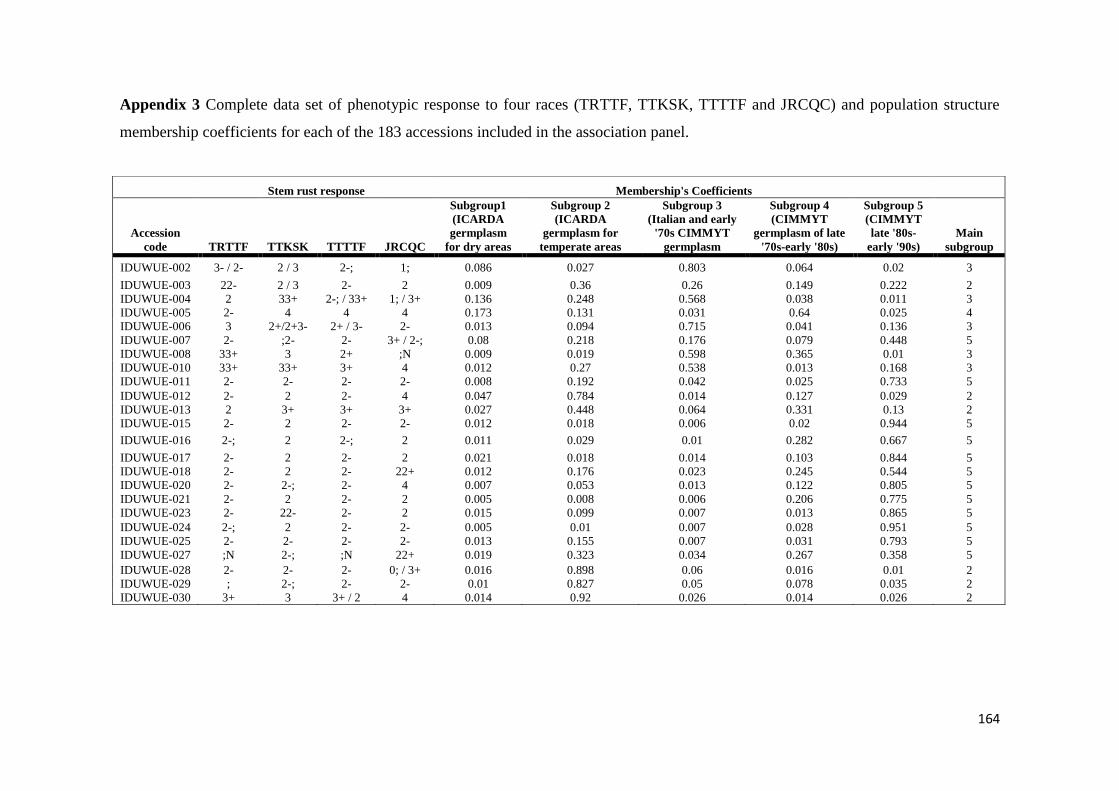
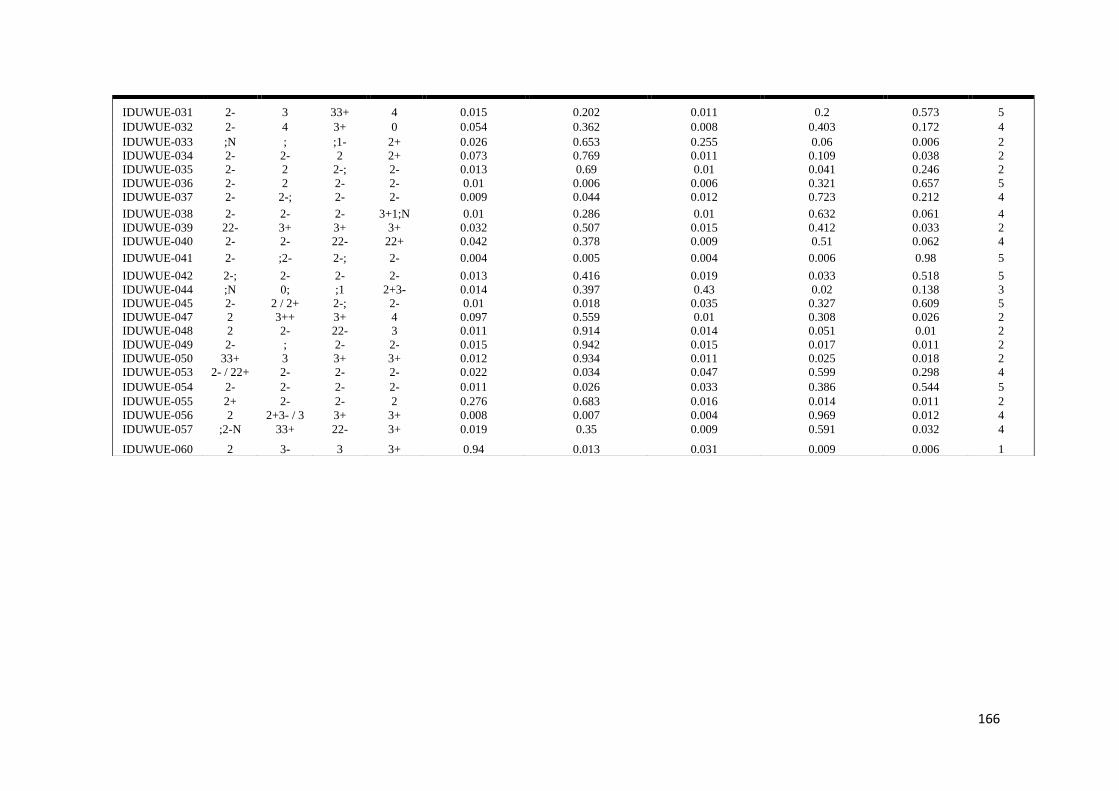


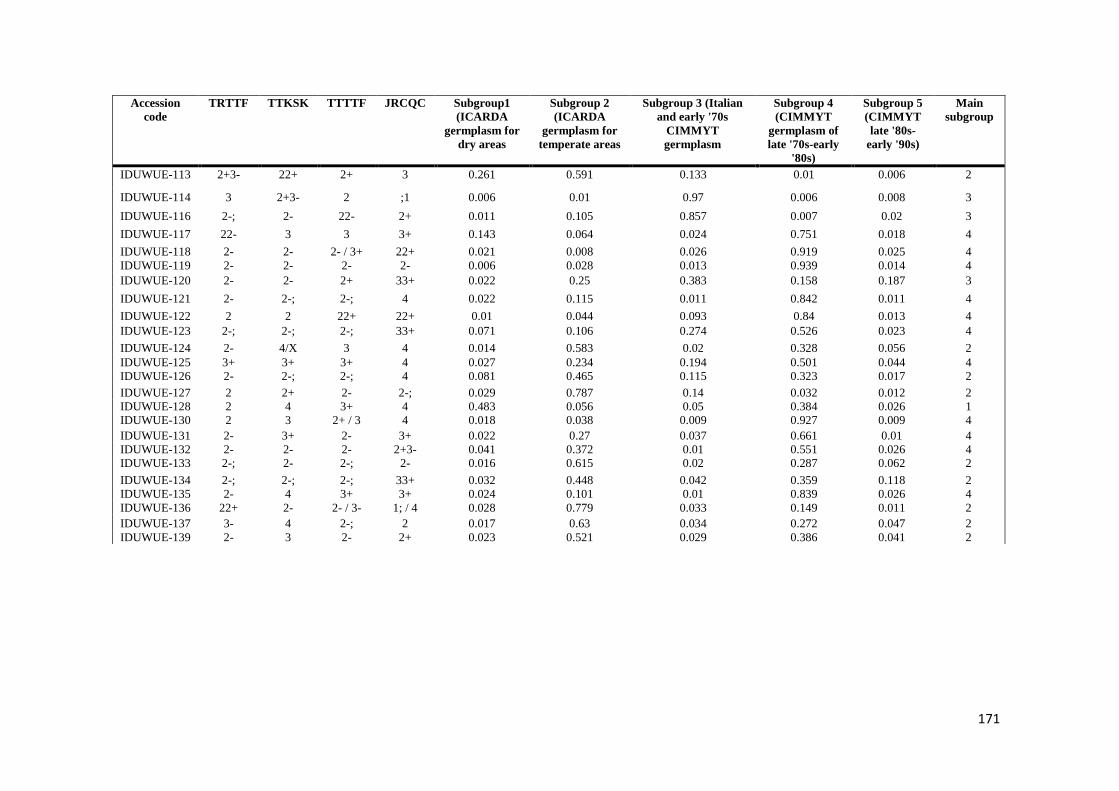
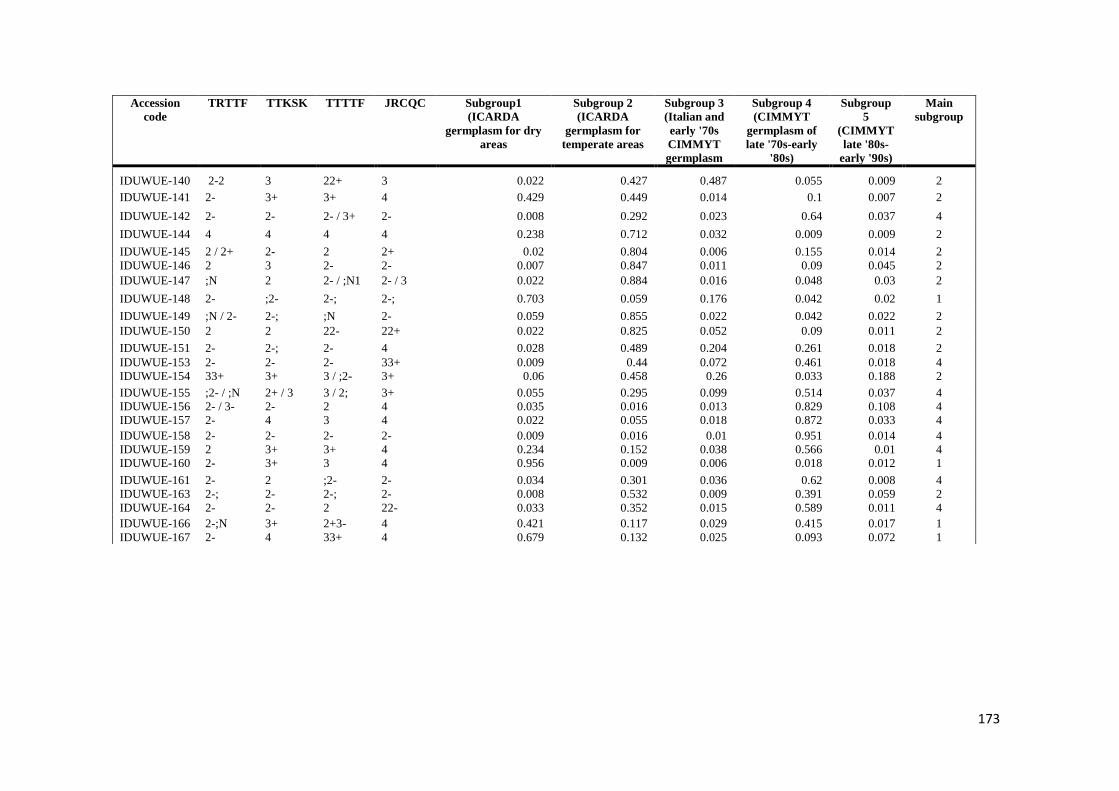
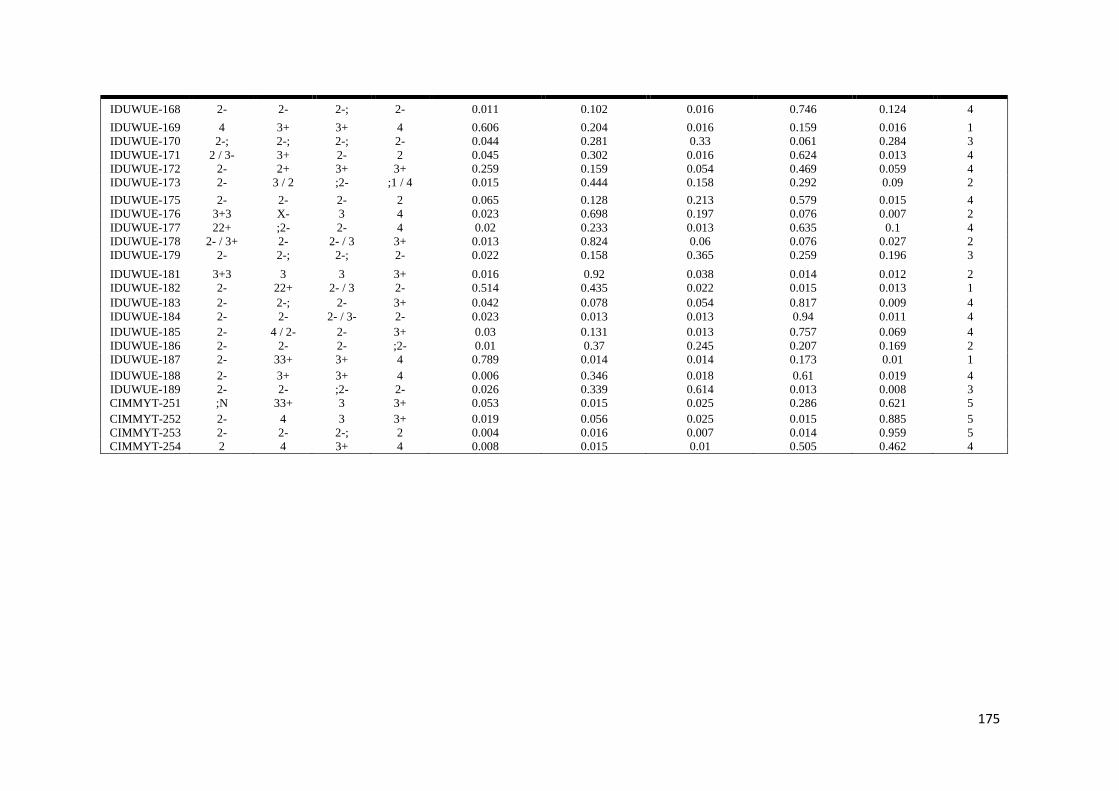
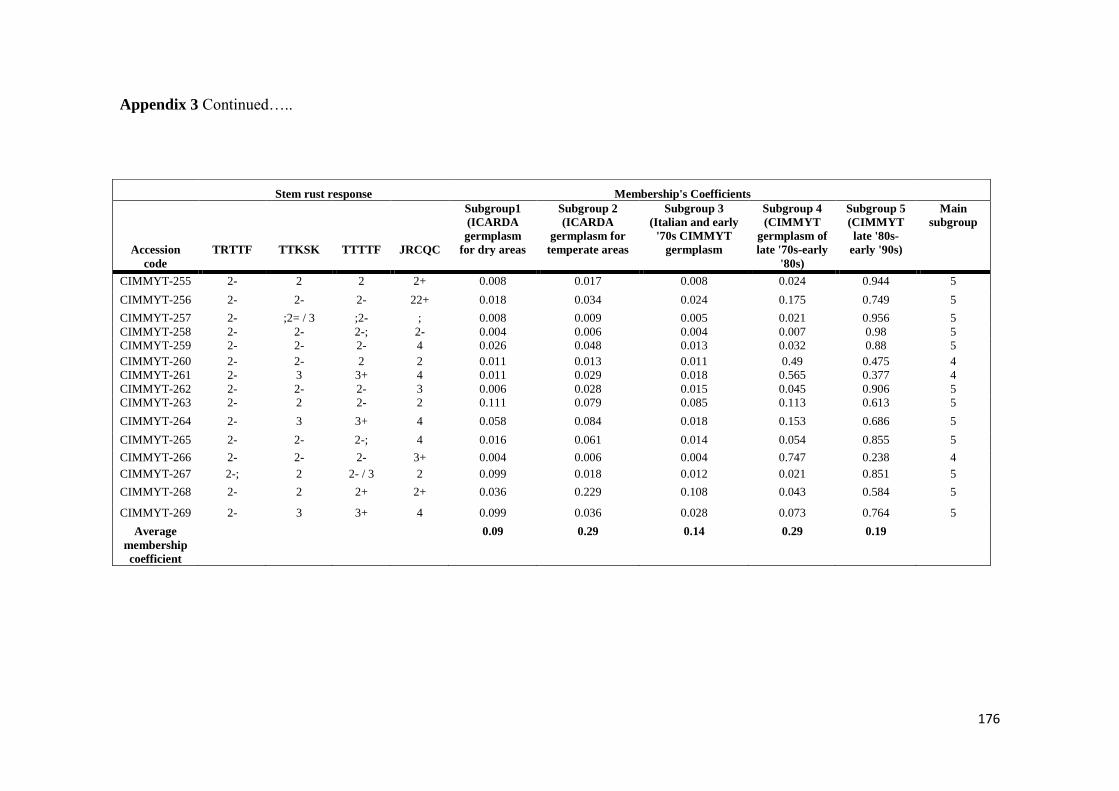
![Identification of Stripe Rust Resistance in Ethiopian Durum Wheat … · 2019-12-31 · KASP based assays are relatively easy-going, have better resolution power [42] and low cost](https://img.pdfslide.us/doc/110x75/5f1431d82aab826152599983/identification-of-stripe-rust-resistance-in-ethiopian-durum-wheat-2019-12-31-kasp.jpg)