Embed Size (px)
Citation preview
1 Marine Turtle Conservation Project Final Scientifc Report1 Marine Turtle Conservation Project Final Scientifc Report Marine Turtle Conservation Project Final Scientifc Report 1
Scientific Report | Water Research and Learning Programme | Wadi Wurayah National Park | Field Season 2015–2016 EWS-WWF
Scientific Report Water Research and Learning ProgrammeWadi Wurayah National ParkField Season 2015–2016
2 Marine Turtle Conservation Project Final Scientifc Report Marine Turtle Conservation Project Final Scientifc Report 32 Scientific Report | Water Research and Learning Programme | Wadi Wurayah National Park | Field Season 2015–2016
HSBC Bank Middle East Ltd.One of the largest international banks in the Middle East and a key financial partner and supporter of Wadi Wurayah National Park since 2006. HSBC Bank Middle East Ltd. established the Water Research and Learning Programme as part of its Global Water Programme.
Fujairah MunicipalityStrategic partner and driver of Wadi Wurayah National Park development. The mission of Fujairah Municipality is to provide advanced infrastructure, a sustainable environment, and excellence in services to the people of Fujairah.
Emirates Wildlife Society-WWFEmirates Wildlife Society-WWF is a UAE environmental nongovernmental organisation established under the patronage of H. H. Sheikh Hamdan bin Zayed Al Nahyan, ruler’s representative in the western region and chairman of Environmental Agency Abu Dhabi. Since its establishment, Emirates Wildlife Society has been working in association with WWF, one of the largest and most respected independent global conservation organisations, to initiate and implement environmental conservation and education projects in the region. EWS-WWF has been active in the UAE since 2001, and its mission is to work with people and institutions within the UAE and the region to conserve biodiversity and tackle climate change through education, awareness, policy, and science-based conservation initiatives.
Earthwatch InstituteEarthwatch Institute is a leading global nongovernmental organisation operating from offices in the United States, the United Kingdom, India, Hong Kong, Japan, Australia, and Brazil. The Earthwatch Institute engages communities in environmental projects in more than 40 countries worldwide. Scientists, educators, students, corporations, and the general public are engaged in initiatives to promote the understanding of and actions necessary for a sustainable environment.
PROJECT PARTNERS
Lead Author: Jacky Judas
Co Authors: Patricia CabreraAltaf HabibMaria Siem-Jørgensen
EWS-WWF Head OfficeP.O. Box 45553 Abu Dhabi United Arab Emirates T: +971 2 634 7117 F: +971 2 634 1220
EWS-WWF Dubai OfficeP.O. Box 454891 Dubai United Arab Emirates T: +971 4 354 9776 F: +971 4 354 9774
The Water Research & Learning Programme P.O BOX 9777 Wadi Wurayah National Park, Fujairah, UAE
For information about the programme, please contact: [email protected]
www.ewswwf.ae
@ews_wwf /ews.wwf wwfuae @ews_wwf
Front Cover:© Wouter Kingma / EWS-WWF
© Text 2016 EWS-WWFAny reproduction in full or in part must mention the title and credit the above mentioned publisher as the copyright owner. All rights reserved© EWS-WWF
4 Marine Turtle Conservation Project Final Scientifc Report Marine Turtle Conservation Project Final Scientifc Report 5
Table of Contents1 Introduction 62 General objectives 73 Monitoring of freshwater habitats 8 3.1 Water quality parameters 8
3.1.1 The monitoring programme 8
3.1.2 Measurements of water quality parameters 9
3.1.3 Amplitude and factors of variations 12
3.1.4 Interannual variations 15
3.1.5 Assessment of thresholds 16
3.2 Freshwater Watch 18
3.2.1 The Earthwatch global network 18
3.2.2 The standard method 18
3.2.3 Nitrate and phosphate concentrations 18
3.2.4 Comparisons between seasons 19
3.3 Measures of bacteriological parameters 20
3.3.1 Purpose 20
3.3.2 Methodology 21
3.3.3 Results 21
3.3.4 Conclusions 22
3.4 Zooplankton as bioindicators 22
3.4.1 Estimating richness and abundance 22
3.4.2 Samplingandidentification 23
3.4.3 Variation in zooplankton diversity and abundance 23
3.4.4 Discussion and perspectives 26
3.5 Freshwater invertebrates as bioindicators 27
3.5.1 Purpose 27
3.5.2 Samplingandidentification 27
3.5.3 Freshwater invertebrate community characterisation 27
3.5.4 The way forward 29
4 Odonate studies 31 4.1 Species occurrence 31
4.2 Point counts 34
4.2.1 Intraseasonal variations 34
4.2.2 Interannual variations 34
4.3 Dragonflytagging 37
4.3.1 Purpose 37
4.3.2 Method of tagging 37
4.3.3 Variations in capture success 37
4.3.4 Recapture 38
4.4 Collection of exuviae 39
5 Toad population study 41 5.1 Purpose 41
5.2 Sampling 41
5.3 Population abundance 42
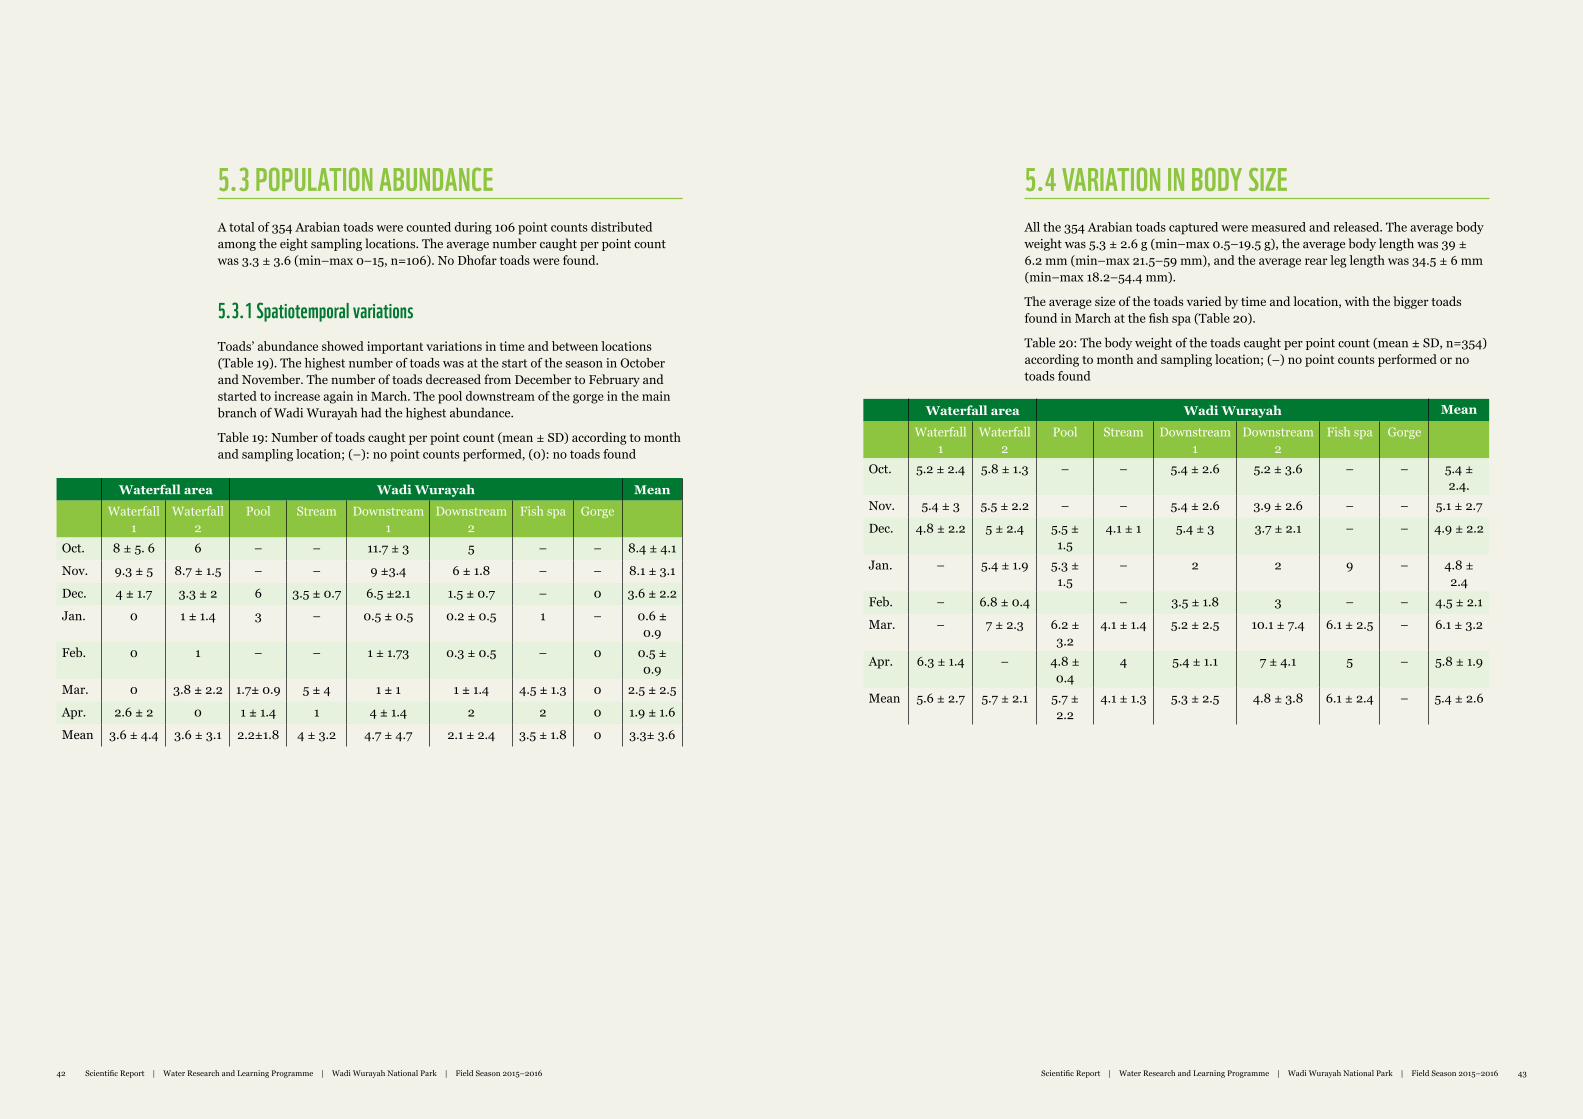
5.3.1 Spatiotemporal variations 42
5.4 Variation in body size 43
5.5 Toad tagging 44
5.5.1 Breeding records 46
5.5.2 Interannual variation 46
5.6 Perspectives 47
6 Monitoring of terrestrial habitats 48 6.1 Vegetation study 48
6.1.1 Purpose 48
6.1.2 Pilot study 48
6.1.3 Sampling 48
6.1.4 Species phenology 49
6.1.5 Biomass 49
6.1.6 Carbon sequestration 52
6.1.7 Conclusions and remarks 52
6.2 Rodents population study 52
6.2.1 Purpose 52
6.2.2 Method 52
6.2.3 Trapping success 53
6.2.4 Cumulative curves of captures 54
7 Discussion and perspectives 568 References 59
SCIENTIFIC REPORT WATER RESEARCH AND
LEARNING PROGRAMMEWadi Wurayah National Park
Field Season 2015–2016
6 Marine Turtle Conservation Project Final Scientifc Report Marine Turtle Conservation Project Final Scientifc Report 7Scientific Report | Water Research and Learning Programme | Wadi Wurayah National Park | Field Season 2015–2016 76 Scientific Report | Water Research and Learning Programme | Wadi Wurayah National Park | Field Season 2015–2016
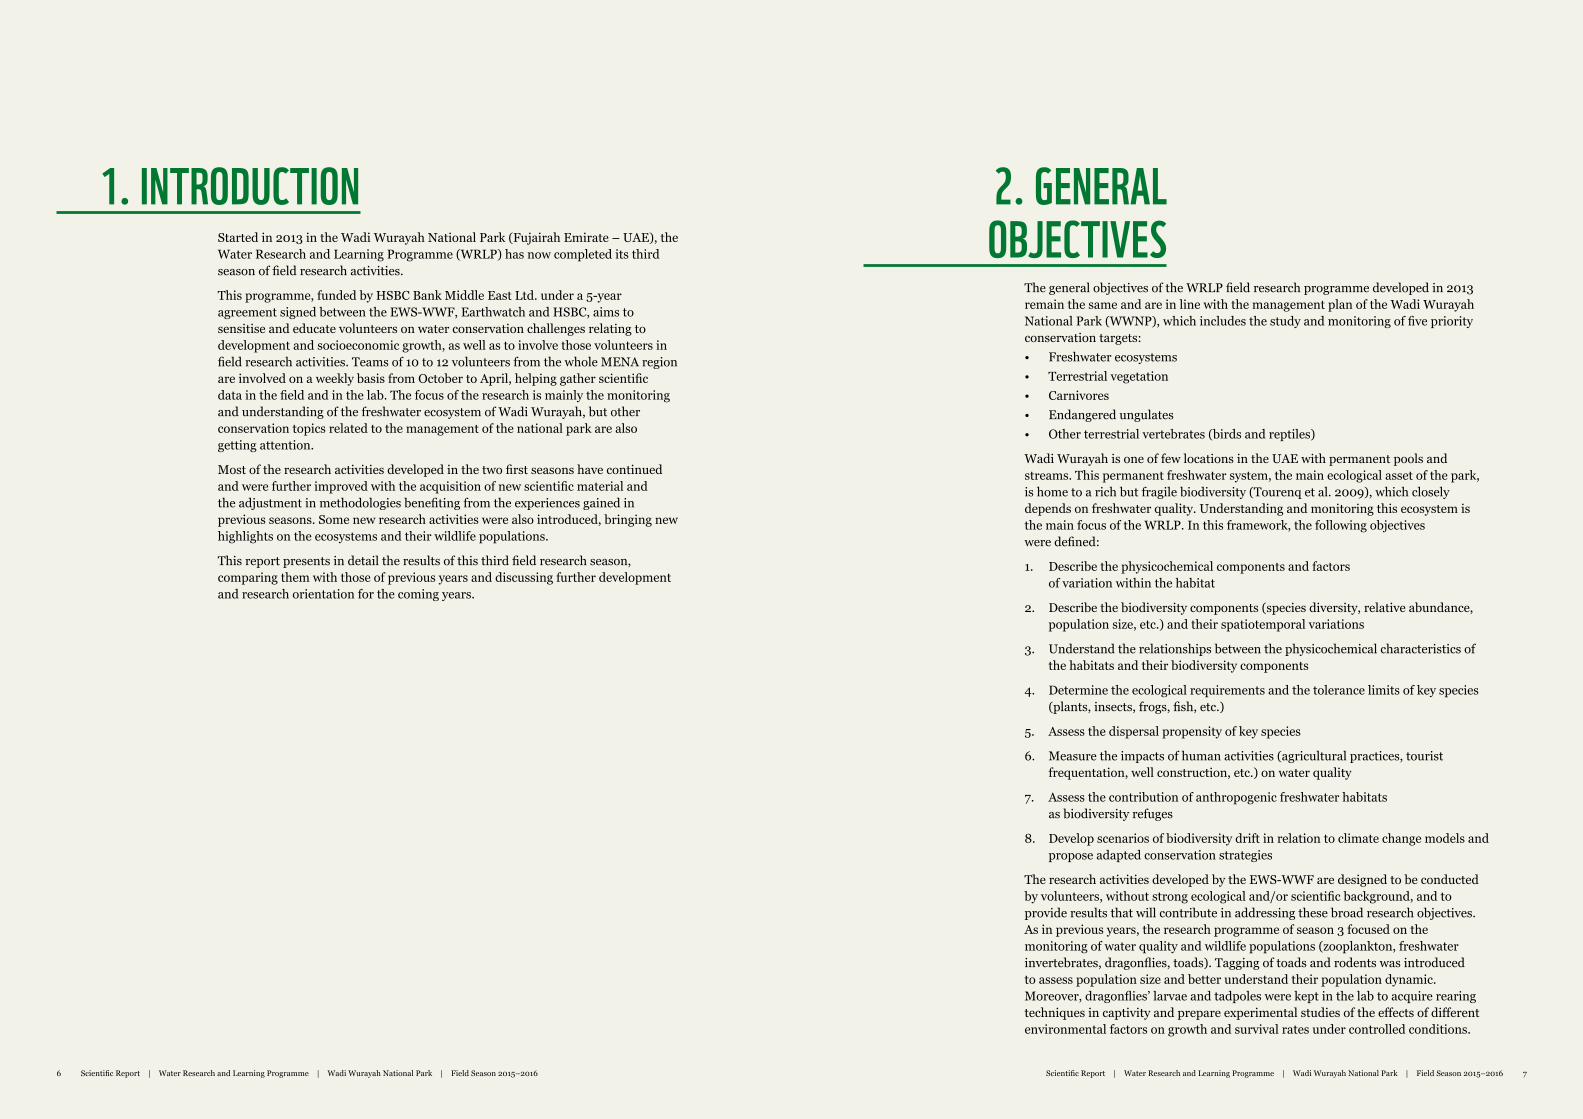
Started in 2013 in the Wadi Wurayah National Park (Fujairah Emirate – UAE), the Water Research and Learning Programme (WRLP) has now completed its third season of field research activities.
This programme, funded by HSBC Bank Middle East Ltd. under a 5-year agreement signed between the EWS-WWF, Earthwatch and HSBC, aims to sensitise and educate volunteers on water conservation challenges relating to development and socioeconomic growth, as well as to involve those volunteers in field research activities. Teams of 10 to 12 volunteers from the whole MENA region are involved on a weekly basis from October to April, helping gather scientific data in the field and in the lab. The focus of the research is mainly the monitoring and understanding of the freshwater ecosystem of Wadi Wurayah, but other conservation topics related to the management of the national park are also getting attention.
Most of the research activities developed in the two first seasons have continued and were further improved with the acquisition of new scientific material and the adjustment in methodologies benefiting from the experiences gained in previous seasons. Some new research activities were also introduced, bringing new highlights on the ecosystems and their wildlife populations.
This report presents in detail the results of this third field research season, comparing them with those of previous years and discussing further development and research orientation for the coming years.
The general objectives of the WRLP field research programme developed in 2013 remain the same and are in line with the management plan of the Wadi Wurayah National Park (WWNP), which includes the study and monitoring of five priority conservation targets: • Freshwater ecosystems• Terrestrial vegetation• Carnivores• Endangered ungulates• Other terrestrial vertebrates (birds and reptiles)
Wadi Wurayah is one of few locations in the UAE with permanent pools and streams. This permanent freshwater system, the main ecological asset of the park, is home to a rich but fragile biodiversity (Tourenq et al. 2009), which closely depends on freshwater quality. Understanding and monitoring this ecosystem is the main focus of the WRLP. In this framework, the following objectives were defined:
1. Describe the physicochemical components and factors of variation within the habitat
2. Describe the biodiversity components (species diversity, relative abundance, population size, etc.) and their spatiotemporal variations
3. Understand the relationships between the physicochemical characteristics of the habitats and their biodiversity components
4. Determine the ecological requirements and the tolerance limits of key species (plants, insects, frogs, fish, etc.)
5. Assess the dispersal propensity of key species
6. Measure the impacts of human activities (agricultural practices, tourist frequentation, well construction, etc.) on water quality
7. Assess the contribution of anthropogenic freshwater habitats as biodiversity refuges
8. Develop scenarios of biodiversity drift in relation to climate change models and propose adapted conservation strategies
The research activities developed by the EWS-WWF are designed to be conducted by volunteers, without strong ecological and/or scientific background, and to provide results that will contribute in addressing these broad research objectives. As in previous years, the research programme of season 3 focused on the monitoring of water quality and wildlife populations (zooplankton, freshwater invertebrates, dragonflies, toads). Tagging of toads and rodents was introduced to assess population size and better understand their population dynamic. Moreover, dragonflies’ larvae and tadpoles were kept in the lab to acquire rearing techniques in captivity and prepare experimental studies of the effects of different environmental factors on growth and survival rates under controlled conditions.
1. INTRODUCTION 2. GENERAL OBJECTIVES
8 Marine Turtle Conservation Project Final Scientifc Report Marine Turtle Conservation Project Final Scientifc Report 9Scientific Report | Water Research and Learning Programme | Wadi Wurayah National Park | Field Season 2015–2016 98 Scientific Report | Water Research and Learning Programme | Wadi Wurayah National Park | Field Season 2015–2016
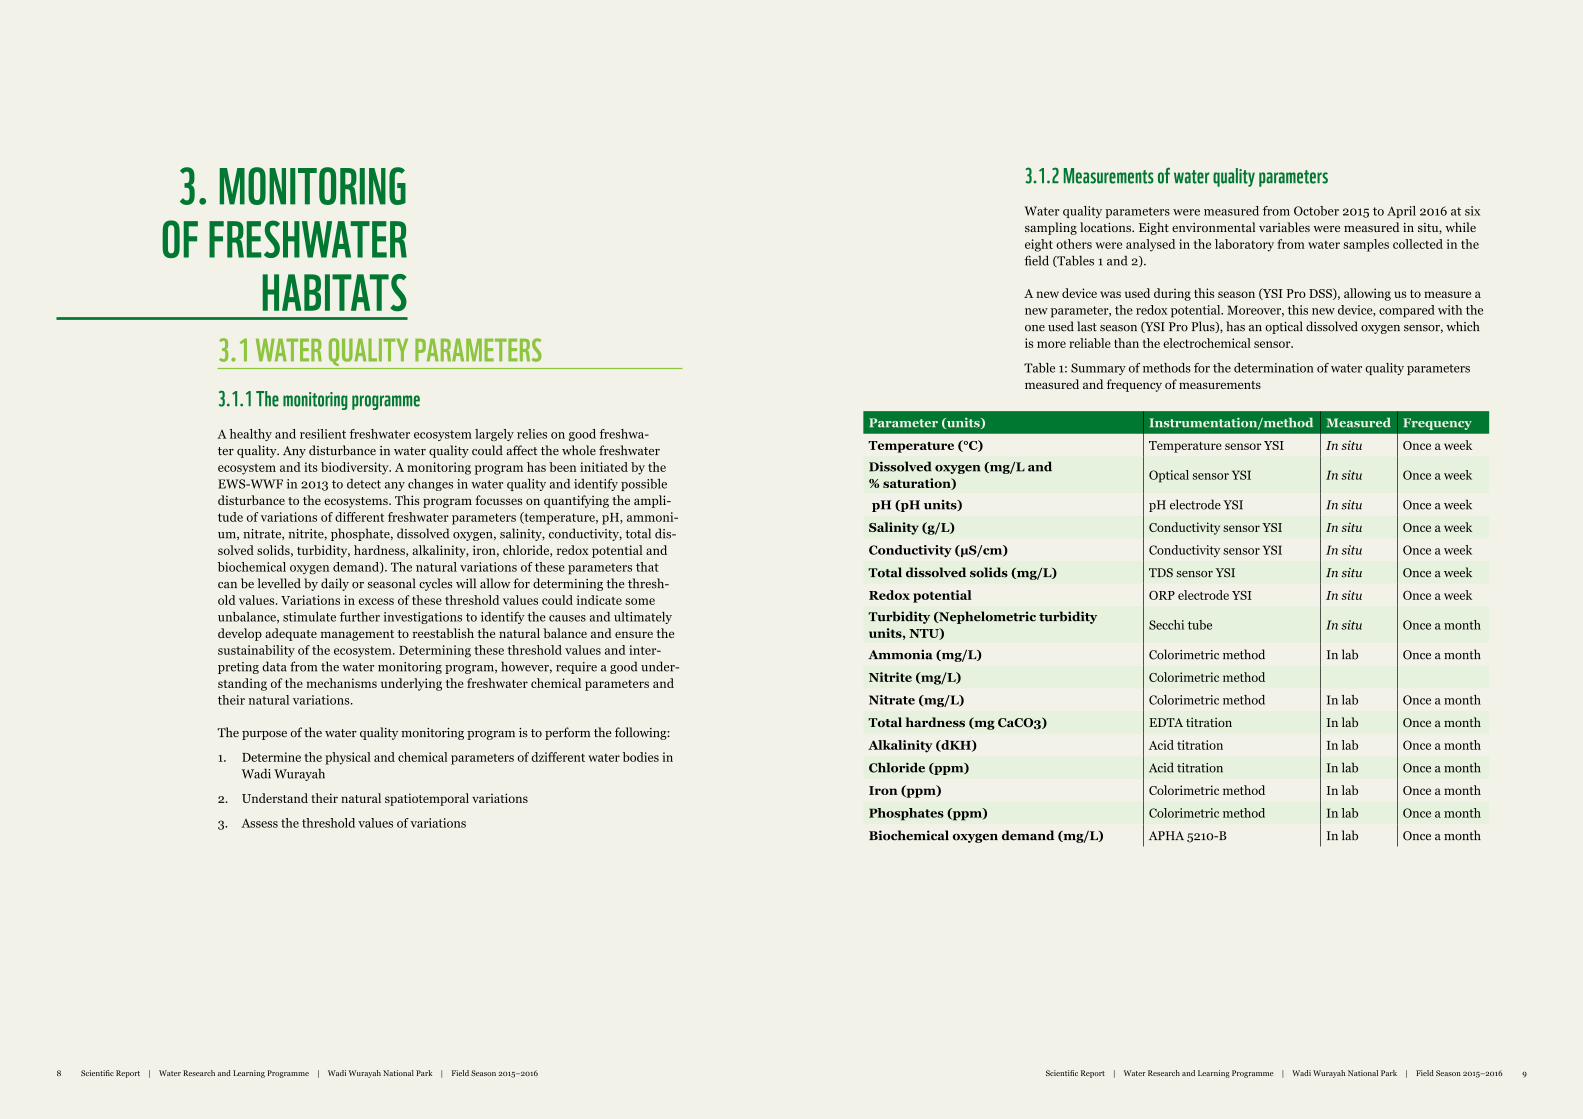
3.1 WATER QUALITY PARAMETERS3.1.1 The monitoring programme A healthy and resilient freshwater ecosystem largely relies on good freshwa-ter quality. Any disturbance in water quality could affect the whole freshwater ecosystem and its biodiversity. A monitoring program has been initiated by the EWS-WWF in 2013 to detect any changes in water quality and identify possible disturbance to the ecosystems. This program focusses on quantifying the ampli-tude of variations of different freshwater parameters (temperature, pH, ammoni-um, nitrate, nitrite, phosphate, dissolved oxygen, salinity, conductivity, total dis-solved solids, turbidity, hardness, alkalinity, iron, chloride, redox potential and biochemical oxygen demand). The natural variations of these parameters that can be levelled by daily or seasonal cycles will allow for determining the thresh-old values. Variations in excess of these threshold values could indicate some unbalance, stimulate further investigations to identify the causes and ultimately develop adequate management to reestablish the natural balance and ensure the sustainability of the ecosystem. Determining these threshold values and inter-preting data from the water monitoring program, however, require a good under-standing of the mechanisms underlying the freshwater chemical parameters and their natural variations.
The purpose of the water quality monitoring program is to perform the following:
1. Determine the physical and chemical parameters of dzifferent water bodies in Wadi Wurayah
2. Understand their natural spatiotemporal variations
3. Assess the threshold values of variations
3.1.2 Measurements of water quality parametersWater quality parameters were measured from October 2015 to April 2016 at six sampling locations. Eight environmental variables were measured in situ, while eight others were analysed in the laboratory from water samples collected in the field (Tables 1 and 2).
A new device was used during this season (YSI Pro DSS), allowing us to measure a new parameter, the redox potential. Moreover, this new device, compared with the one used last season (YSI Pro Plus), has an optical dissolved oxygen sensor, which is more reliable than the electrochemical sensor.
Table 1: Summary of methods for the determination of water quality parameters measured and frequency of measurements
3. MONITORING OF FRESHWATER
HABITATS
Parameter (units) Instrumentation/method Measured Frequency
Temperature (°C) Temperature sensor YSI In situ Once a weekDissolved oxygen (mg/L and % saturation) Optical sensor YSI In situ Once a week
pH (pH units) pH electrode YSI In situ Once a week
Salinity (g/L) Conductivity sensor YSI In situ Once a week
Conductivity (μS/cm) Conductivity sensor YSI In situ Once a week
Total dissolved solids (mg/L) TDS sensor YSI In situ Once a week
Redox potential ORP electrode YSI In situ Once a weekTurbidity (Nephelometric turbidity units, NTU) Secchi tube In situ Once a month
Ammonia (mg/L) Colorimetric method In lab Once a month
Nitrite (mg/L) Colorimetric method
Nitrate (mg/L) Colorimetric method In lab Once a month
Total hardness (mg CaCO3) EDTA titration In lab Once a month
Alkalinity (dKH) Acid titration In lab Once a month
Chloride (ppm) Acid titration In lab Once a month
Iron (ppm) Colorimetric method In lab Once a month
Phosphates (ppm) Colorimetric method In lab Once a month
Biochemical oxygen demand (mg/L) APHA 5210-B In lab Once a month
10 Marine Turtle Conservation Project Final Scientifc Report Marine Turtle Conservation Project Final Scientifc Report 11Scientific Report | Water Research and Learning Programme | Wadi Wurayah National Park | Field Season 2015–2016 1110 Scientific Report | Water Research and Learning Programme | Wadi Wurayah National Park | Field Season 2015–2016
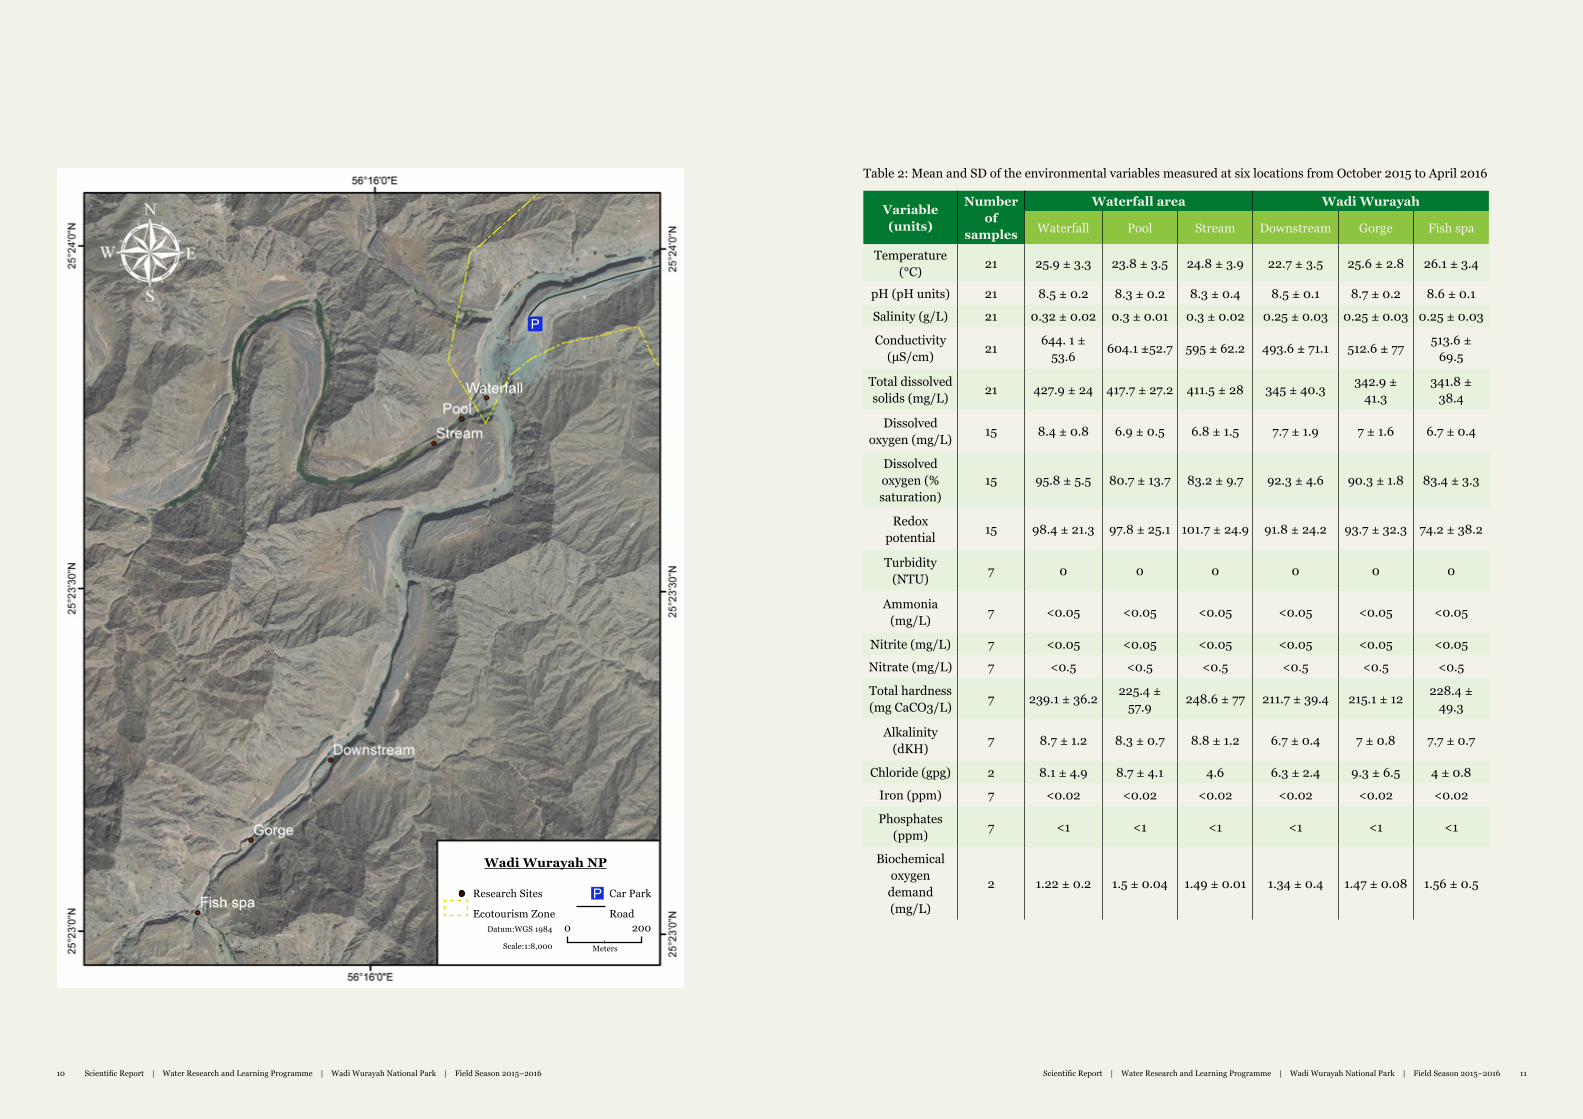
Table 2: Mean and SD of the environmental variables measured at six locations from October 2015 to April 2016
Variable (units)
Number of
samples
Waterfall area Wadi Wurayah
Waterfall Pool Stream Downstream Gorge Fish spa
Temperature (°C) 21 25.9 ± 3.3 23.8 ± 3.5 24.8 ± 3.9 22.7 ± 3.5 25.6 ± 2.8 26.1 ± 3.4
pH (pH units) 21 8.5 ± 0.2 8.3 ± 0.2 8.3 ± 0.4 8.5 ± 0.1 8.7 ± 0.2 8.6 ± 0.1
Salinity (g/L) 21 0.32 ± 0.02 0.3 ± 0.01 0.3 ± 0.02 0.25 ± 0.03 0.25 ± 0.03 0.25 ± 0.03
Conductivity (μS/cm) 21 644. 1 ±
53.6 604.1 ±52.7 595 ± 62.2 493.6 ± 71.1 512.6 ± 77 513.6 ± 69.5
Total dissolved solids (mg/L) 21 427.9 ± 24 417.7 ± 27.2 411.5 ± 28 345 ± 40.3 342.9 ±
41.3341.8 ±
38.4
Dissolved oxygen (mg/L) 15 8.4 ± 0.8 6.9 ± 0.5 6.8 ± 1.5 7.7 ± 1.9 7 ± 1.6 6.7 ± 0.4
Dissolved oxygen (% saturation)
15 95.8 ± 5.5 80.7 ± 13.7 83.2 ± 9.7 92.3 ± 4.6 90.3 ± 1.8 83.4 ± 3.3
Redox potential 15 98.4 ± 21.3 97.8 ± 25.1 101.7 ± 24.9 91.8 ± 24.2 93.7 ± 32.3 74.2 ± 38.2
Turbidity (NTU) 7 0 0 0 0 0 0
Ammonia (mg/L) 7 <0.05 <0.05 <0.05 <0.05 <0.05 <0.05
Nitrite (mg/L) 7 <0.05 <0.05 <0.05 <0.05 <0.05 <0.05
Nitrate (mg/L) 7 <0.5 <0.5 <0.5 <0.5 <0.5 <0.5
Total hardness (mg CaCO3/L) 7 239.1 ± 36.2 225.4 ±
57.9 248.6 ± 77 211.7 ± 39.4 215.1 ± 12 228.4 ± 49.3
Alkalinity (dKH) 7 8.7 ± 1.2 8.3 ± 0.7 8.8 ± 1.2 6.7 ± 0.4 7 ± 0.8 7.7 ± 0.7
Chloride (gpg) 2 8.1 ± 4.9 8.7 ± 4.1 4.6 6.3 ± 2.4 9.3 ± 6.5 4 ± 0.8
Iron (ppm) 7 <0.02 <0.02 <0.02 <0.02 <0.02 <0.02
Phosphates (ppm) 7 <1 <1 <1 <1 <1 <1
Biochemical oxygen
demand (mg/L)
2 1.22 ± 0.2 1.5 ± 0.04 1.49 ± 0.01 1.34 ± 0.4 1.47 ± 0.08 1.56 ± 0.5
P
Wadi Wurayah NP
Research Sites
Ecotourism Zone
Meters
Car Park
Road0 200
P
Datum:WGS 1984
Scale:1:8,000
12 Marine Turtle Conservation Project Final Scientifc Report Marine Turtle Conservation Project Final Scientifc Report 13Scientific Report | Water Research and Learning Programme | Wadi Wurayah National Park | Field Season 2015–2016 1312 Scientific Report | Water Research and Learning Programme | Wadi Wurayah National Park | Field Season 2015–2016
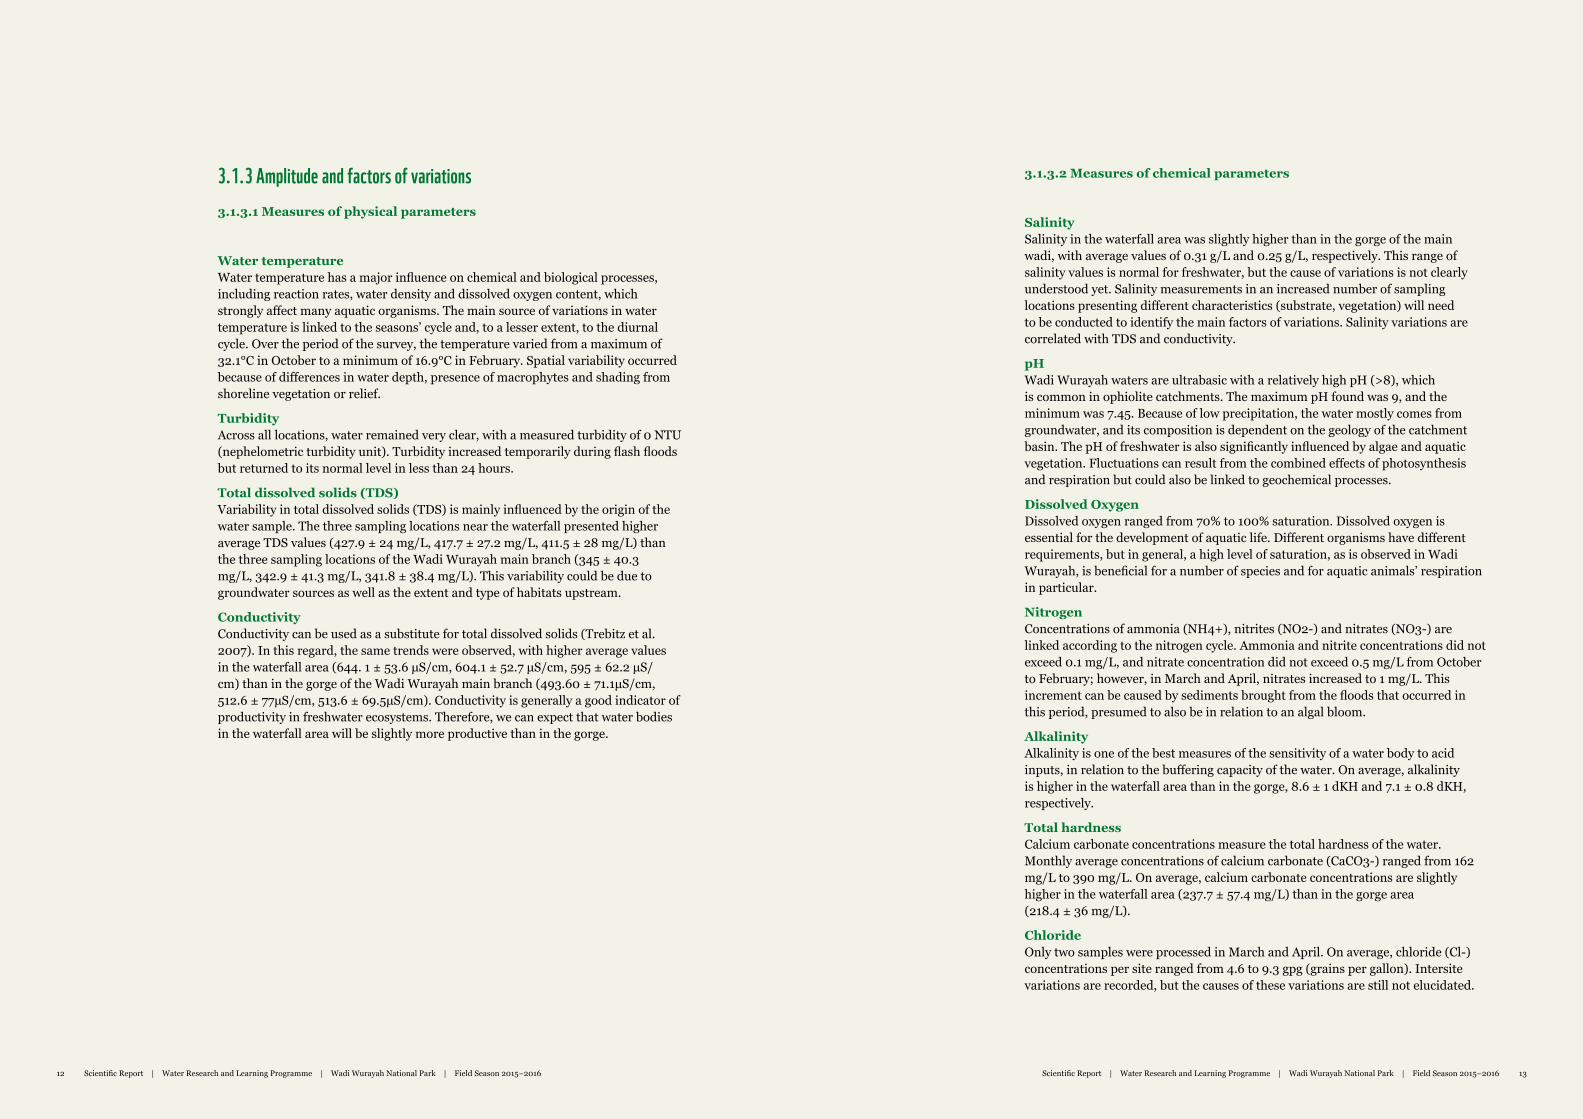
3.1.3 Amplitude and factors of variations3.1.3.1 Measures of physical parameters
Water temperature Water temperature has a major influence on chemical and biological processes, including reaction rates, water density and dissolved oxygen content, which strongly affect many aquatic organisms. The main source of variations in water temperature is linked to the seasons’ cycle and, to a lesser extent, to the diurnal cycle. Over the period of the survey, the temperature varied from a maximum of 32.1°C in October to a minimum of 16.9°C in February. Spatial variability occurred because of differences in water depth, presence of macrophytes and shading from shoreline vegetation or relief.
Turbidity Across all locations, water remained very clear, with a measured turbidity of 0 NTU (nephelometric turbidity unit). Turbidity increased temporarily during flash floods but returned to its normal level in less than 24 hours.
Total dissolved solids (TDS) Variability in total dissolved solids (TDS) is mainly influenced by the origin of the water sample. The three sampling locations near the waterfall presented higher average TDS values (427.9 ± 24 mg/L, 417.7 ± 27.2 mg/L, 411.5 ± 28 mg/L) than the three sampling locations of the Wadi Wurayah main branch (345 ± 40.3 mg/L, 342.9 ± 41.3 mg/L, 341.8 ± 38.4 mg/L). This variability could be due to groundwater sources as well as the extent and type of habitats upstream.
Conductivity Conductivity can be used as a substitute for total dissolved solids (Trebitz et al. 2007). In this regard, the same trends were observed, with higher average values in the waterfall area (644. 1 ± 53.6 μS/cm, 604.1 ± 52.7 μS/cm, 595 ± 62.2 μS/cm) than in the gorge of the Wadi Wurayah main branch (493.60 ± 71.1μS/cm, 512.6 ± 77μS/cm, 513.6 ± 69.5μS/cm). Conductivity is generally a good indicator of productivity in freshwater ecosystems. Therefore, we can expect that water bodies in the waterfall area will be slightly more productive than in the gorge.
3.1.3.2 Measures of chemical parameters
Salinity Salinity in the waterfall area was slightly higher than in the gorge of the main wadi, with average values of 0.31 g/L and 0.25 g/L, respectively. This range of salinity values is normal for freshwater, but the cause of variations is not clearly understood yet. Salinity measurements in an increased number of sampling locations presenting different characteristics (substrate, vegetation) will need to be conducted to identify the main factors of variations. Salinity variations are correlated with TDS and conductivity.
pH Wadi Wurayah waters are ultrabasic with a relatively high pH (>8), which is common in ophiolite catchments. The maximum pH found was 9, and the minimum was 7.45. Because of low precipitation, the water mostly comes from groundwater, and its composition is dependent on the geology of the catchment basin. The pH of freshwater is also significantly influenced by algae and aquatic vegetation. Fluctuations can result from the combined effects of photosynthesis and respiration but could also be linked to geochemical processes.
Dissolved Oxygen Dissolved oxygen ranged from 70% to 100% saturation. Dissolved oxygen is essential for the development of aquatic life. Different organisms have different requirements, but in general, a high level of saturation, as is observed in Wadi Wurayah, is beneficial for a number of species and for aquatic animals’ respiration in particular.
Nitrogen Concentrations of ammonia (NH4+), nitrites (NO2-) and nitrates (NO3-) are linked according to the nitrogen cycle. Ammonia and nitrite concentrations did not exceed 0.1 mg/L, and nitrate concentration did not exceed 0.5 mg/L from October to February; however, in March and April, nitrates increased to 1 mg/L. This increment can be caused by sediments brought from the floods that occurred in this period, presumed to also be in relation to an algal bloom.
Alkalinity Alkalinity is one of the best measures of the sensitivity of a water body to acid inputs, in relation to the buffering capacity of the water. On average, alkalinity is higher in the waterfall area than in the gorge, 8.6 ± 1 dKH and 7.1 ± 0.8 dKH, respectively.
Total hardness Calcium carbonate concentrations measure the total hardness of the water. Monthly average concentrations of calcium carbonate (CaCO3-) ranged from 162 mg/L to 390 mg/L. On average, calcium carbonate concentrations are slightly higher in the waterfall area (237.7 ± 57.4 mg/L) than in the gorge area (218.4 ± 36 mg/L).
Chloride Only two samples were processed in March and April. On average, chloride (Cl-) concentrations per site ranged from 4.6 to 9.3 gpg (grains per gallon). Intersite variations are recorded, but the causes of these variations are still not elucidated.
14 Marine Turtle Conservation Project Final Scientifc Report Marine Turtle Conservation Project Final Scientifc Report 15Scientific Report | Water Research and Learning Programme | Wadi Wurayah National Park | Field Season 2015–2016 1514 Scientific Report | Water Research and Learning Programme | Wadi Wurayah National Park | Field Season 2015–2016
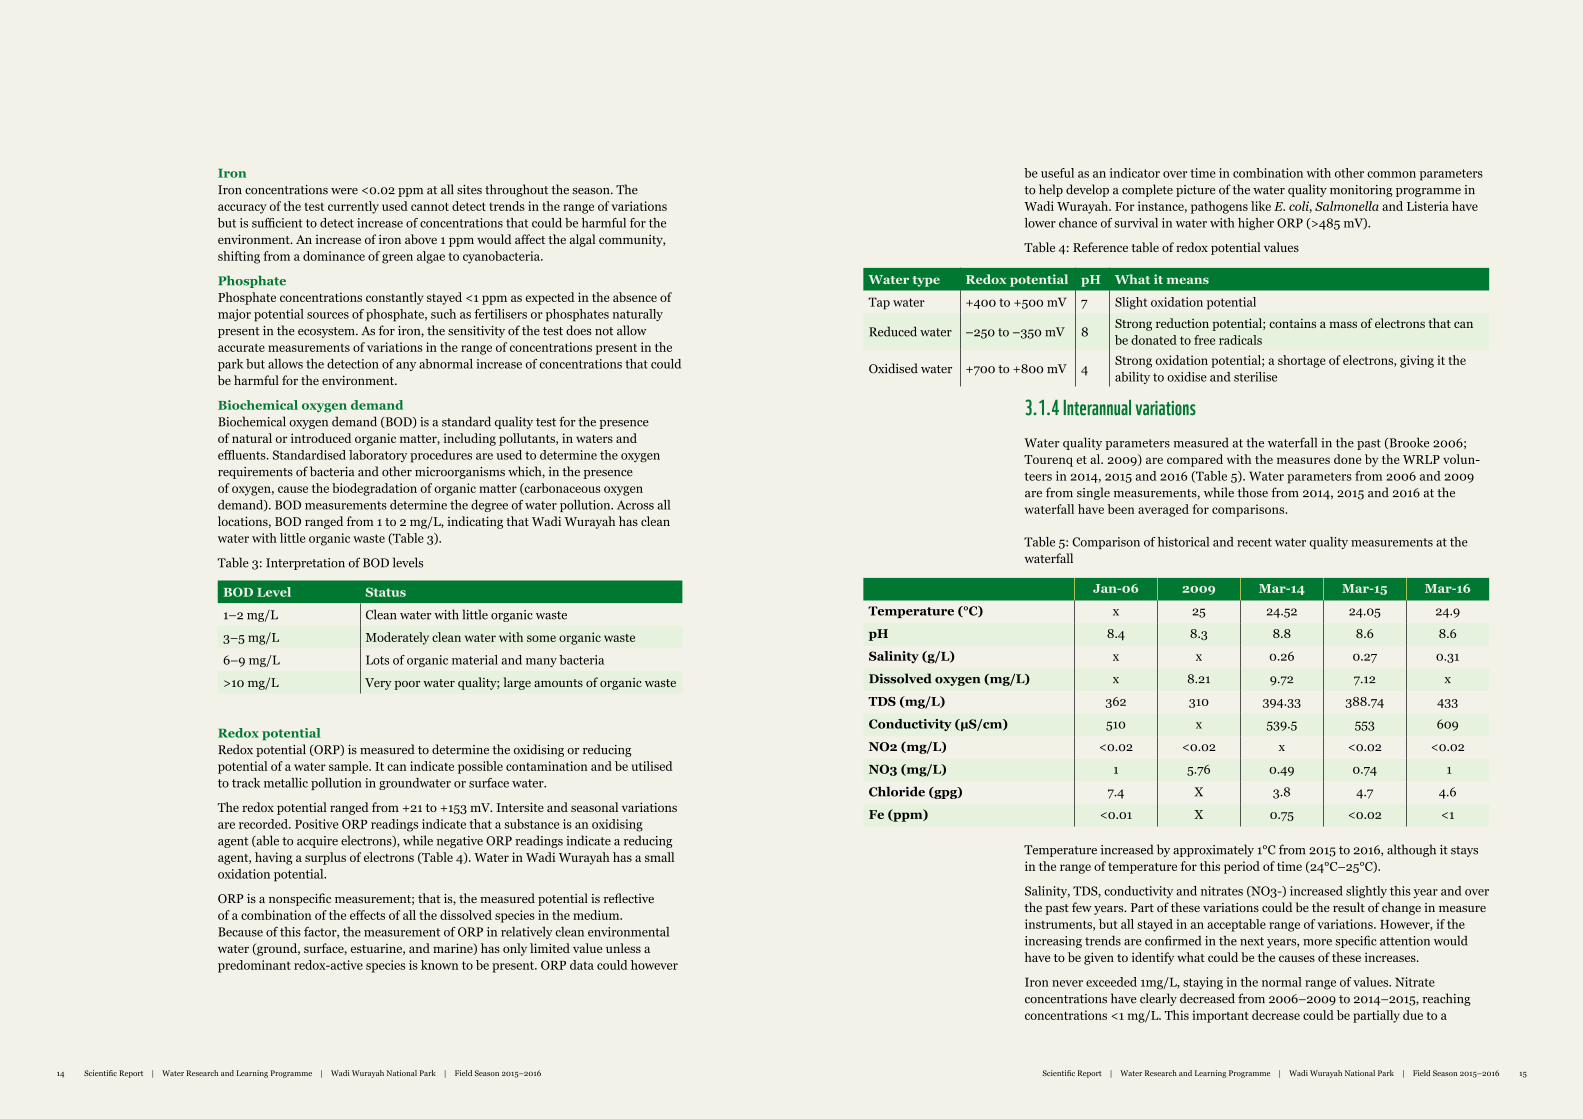
Iron Iron concentrations were <0.02 ppm at all sites throughout the season. The accuracy of the test currently used cannot detect trends in the range of variations but is sufficient to detect increase of concentrations that could be harmful for the environment. An increase of iron above 1 ppm would affect the algal community, shifting from a dominance of green algae to cyanobacteria.
Phosphate Phosphate concentrations constantly stayed <1 ppm as expected in the absence of major potential sources of phosphate, such as fertilisers or phosphates naturally present in the ecosystem. As for iron, the sensitivity of the test does not allow accurate measurements of variations in the range of concentrations present in the park but allows the detection of any abnormal increase of concentrations that could be harmful for the environment.
Biochemical oxygen demand Biochemical oxygen demand (BOD) is a standard quality test for the presence of natural or introduced organic matter, including pollutants, in waters and effluents. Standardised laboratory procedures are used to determine the oxygen requirements of bacteria and other microorganisms which, in the presence of oxygen, cause the biodegradation of organic matter (carbonaceous oxygen demand). BOD measurements determine the degree of water pollution. Across all locations, BOD ranged from 1 to 2 mg/L, indicating that Wadi Wurayah has clean water with little organic waste (Table 3).
Table 3: Interpretation of BOD levels
BOD Level Status
1–2 mg/L Clean water with little organic waste
3–5 mg/L Moderately clean water with some organic waste
6–9 mg/L Lots of organic material and many bacteria
>10 mg/L Very poor water quality; large amounts of organic waste
Redox potential Redox potential (ORP) is measured to determine the oxidising or reducing potential of a water sample. It can indicate possible contamination and be utilised to track metallic pollution in groundwater or surface water.
The redox potential ranged from +21 to +153 mV. Intersite and seasonal variations are recorded. Positive ORP readings indicate that a substance is an oxidising agent (able to acquire electrons), while negative ORP readings indicate a reducing agent, having a surplus of electrons (Table 4). Water in Wadi Wurayah has a small oxidation potential.
ORP is a nonspecific measurement; that is, the measured potential is reflective of a combination of the effects of all the dissolved species in the medium. Because of this factor, the measurement of ORP in relatively clean environmental water (ground, surface, estuarine, and marine) has only limited value unless a predominant redox-active species is known to be present. ORP data could however
be useful as an indicator over time in combination with other common parameters to help develop a complete picture of the water quality monitoring programme in Wadi Wurayah. For instance, pathogens like E. coli, Salmonella and Listeria have lower chance of survival in water with higher ORP (>485 mV).
Table 4: Reference table of redox potential values
Water type Redox potential pH What it means
Tap water +400 to +500 mV 7 Slight oxidation potential
Reduced water –250 to –350 mV 8 Strong reduction potential; contains a mass of electrons that can be donated to free radicals
Oxidised water +700 to +800 mV 4 Strong oxidation potential; a shortage of electrons, giving it the ability to oxidise and sterilise
3.1.4 Interannual variationsWater quality parameters measured at the waterfall in the past (Brooke 2006; Tourenq et al. 2009) are compared with the measures done by the WRLP volun-teers in 2014, 2015 and 2016 (Table 5). Water parameters from 2006 and 2009 are from single measurements, while those from 2014, 2015 and 2016 at the waterfall have been averaged for comparisons.
Table 5: Comparison of historical and recent water quality measurements at the waterfall
Jan-06 2009 Mar-14 Mar-15 Mar-16
Temperature (°C) x 25 24.52 24.05 24.9
pH 8.4 8.3 8.8 8.6 8.6
Salinity (g/L) x x 0.26 0.27 0.31
Dissolved oxygen (mg/L) x 8.21 9.72 7.12 x
TDS (mg/L) 362 310 394.33 388.74 433
Conductivity (μS/cm) 510 x 539.5 553 609
NO2 (mg/L) <0.02 <0.02 x <0.02 <0.02
NO3 (mg/L) 1 5.76 0.49 0.74 1
Chloride (gpg) 7.4 X 3.8 4.7 4.6
Fe (ppm) <0.01 X 0.75 <0.02 <1
Temperature increased by approximately 1°C from 2015 to 2016, although it stays in the range of temperature for this period of time (24°C–25°C).
Salinity, TDS, conductivity and nitrates (NO3-) increased slightly this year and over the past few years. Part of these variations could be the result of change in measure instruments, but all stayed in an acceptable range of variations. However, if the increasing trends are confirmed in the next years, more specific attention would have to be given to identify what could be the causes of these increases.
Iron never exceeded 1mg/L, staying in the normal range of values. Nitrate concentrations have clearly decreased from 2006–2009 to 2014–2015, reaching concentrations <1 mg/L. This important decrease could be partially due to a
16 Marine Turtle Conservation Project Final Scientifc Report Marine Turtle Conservation Project Final Scientifc Report 17Scientific Report | Water Research and Learning Programme | Wadi Wurayah National Park | Field Season 2015–2016 1716 Scientific Report | Water Research and Learning Programme | Wadi Wurayah National Park | Field Season 2015–2016
Parameters Pattern of variations
Range of variations of monthly averages
Thresholds Unit Point of concern
min max Min MaxWater temperature
Seasonal and site dependent
21.5 30 20 30 °C Increase of average monthly temperature
DO No patterns detected
50 97.7 60 % Decrease below 60%
pH Stable 7.7 8.9 7.5 9 pH unit Increase or decrease beyond threshold values
Salinity Rather stable, with possible slight seasonal variations
0.24 0.34 0.2 0.4 g/l Increase or decrease beyond threshold values
Conductivity Rather stable, with possible slight seasonal variations
434 711 400 750 μS/cm Increase or decrease beyond threshold values
TDS Rather stable, with possible slight seasonal variations and site dependency
300 470 300 470 mg/l Increase or decrease beyond threshold values
Water flow Variations without a clear pattern
0 0.8 m/s
Turbidity Increase of rainfall <5 N.A. 5 NTU Increase >5 NTU, out of rainfall period
decrease in human presence following the closure of the park to the public in December 2013. However, the higher values of this year at this period of time are linked to the floods that occurred in February and March.
As a general note, the closure of the park to the public had beneficial effects on the quality of water in Wadi Wurayah.
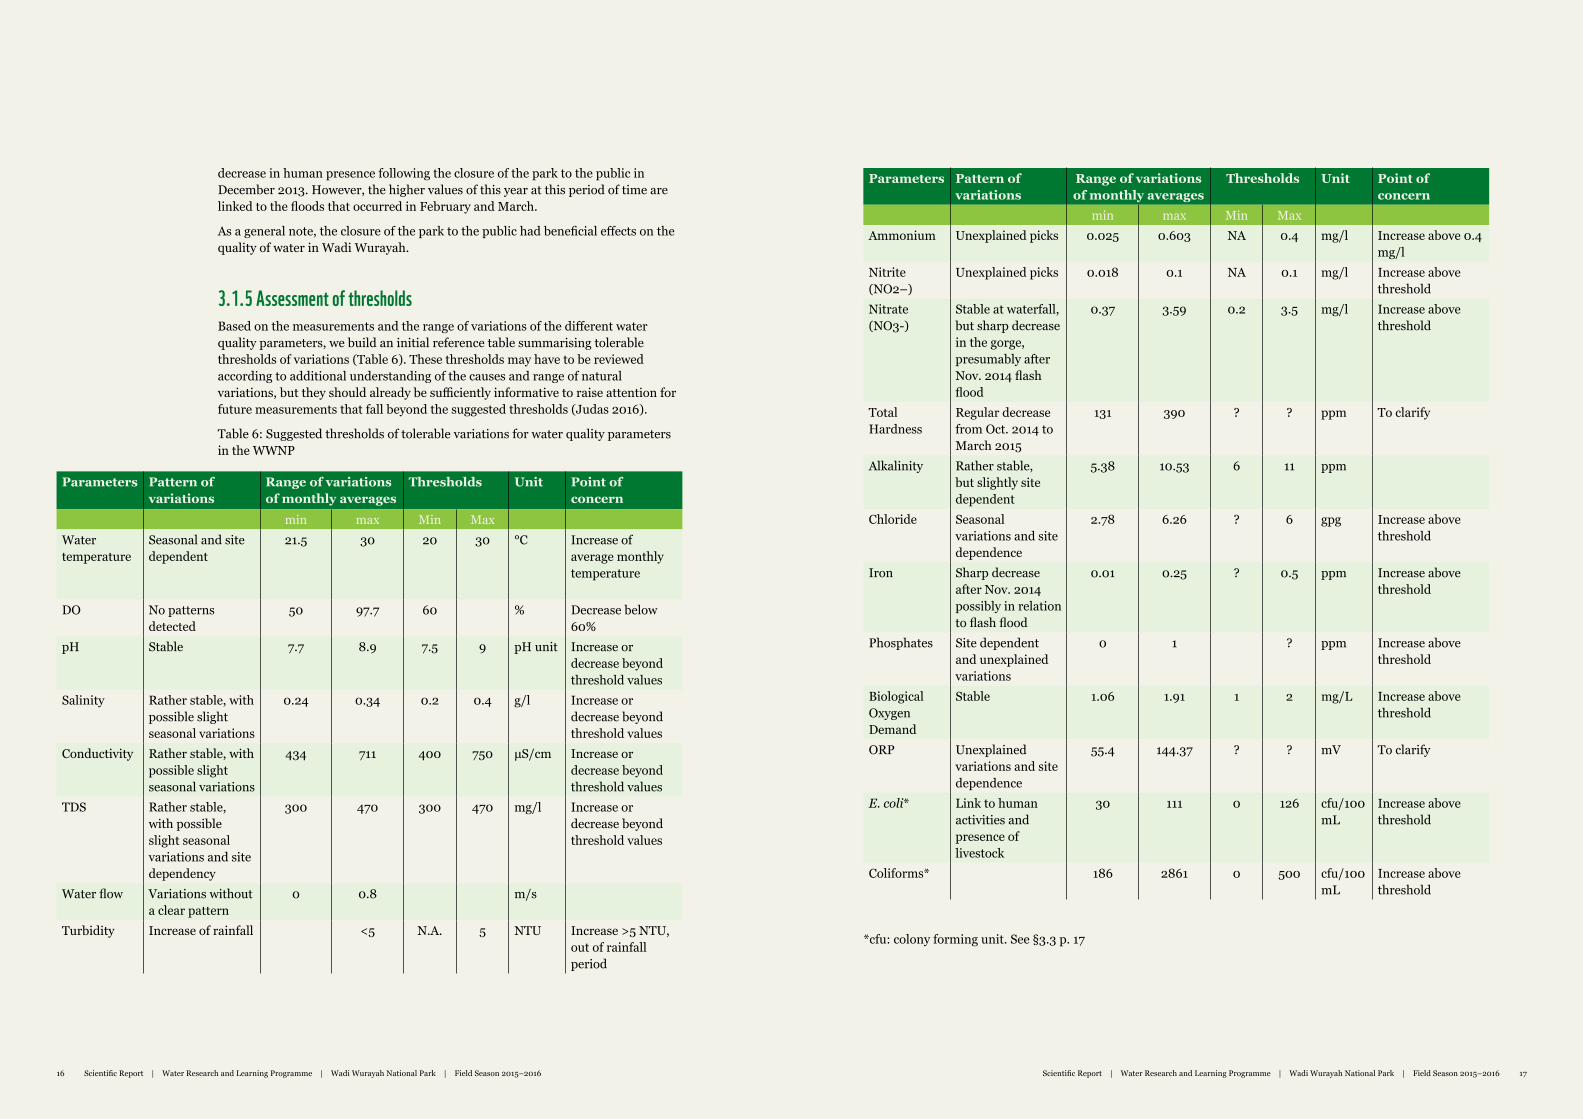
3.1.5 Assessment of thresholds Based on the measurements and the range of variations of the different water quality parameters, we build an initial reference table summarising tolerable thresholds of variations (Table 6). These thresholds may have to be reviewed according to additional understanding of the causes and range of natural variations, but they should already be sufficiently informative to raise attention for future measurements that fall beyond the suggested thresholds (Judas 2016).
Table 6: Suggested thresholds of tolerable variations for water quality parameters in the WWNP
Parameters Pattern of variations
Range of variations of monthly averages
Thresholds Unit Point of concern
min max Min MaxAmmonium Unexplained picks 0.025 0.603 NA 0.4 mg/l Increase above 0.4
mg/lNitrite (NO2–)
Unexplained picks 0.018 0.1 NA 0.1 mg/l Increase above threshold
Nitrate (NO3-)
Stable at waterfall, but sharp decrease in the gorge, presumably after Nov. 2014 flash flood
0.37 3.59 0.2 3.5 mg/l Increase above threshold
Total Hardness
Regular decrease from Oct. 2014 to March 2015
131 390 ? ? ppm To clarify
Alkalinity Rather stable, but slightly site dependent
5.38 10.53 6 11 ppm
Chloride Seasonal variations and site dependence
2.78 6.26 ? 6 gpg Increase above threshold
Iron Sharp decrease after Nov. 2014 possibly in relation to flash flood
0.01 0.25 ? 0.5 ppm Increase above threshold
Phosphates Site dependent and unexplained variations
0 1 ? ppm Increase above threshold
Biological Oxygen Demand
Stable 1.06 1.91 1 2 mg/L Increase above threshold
ORP Unexplained variations and site dependence
55.4 144.37 ? ? mV To clarify
E. coli* Link to human activities and presence of livestock
30 111 0 126 cfu/100 mL
Increase above threshold
Coliforms* 186 2861 0 500 cfu/100 mL
Increase above threshold
*cfu: colony forming unit. See §3.3 p. 17
18 Marine Turtle Conservation Project Final Scientifc Report Marine Turtle Conservation Project Final Scientifc Report 19Scientific Report | Water Research and Learning Programme | Wadi Wurayah National Park | Field Season 2015–2016 1918 Scientific Report | Water Research and Learning Programme | Wadi Wurayah National Park | Field Season 2015–2016
3.2 FRESHWATER WATCH3.2.1 The Earthwatch global network Freshwater Watch is a global initiative from Earthwatch operating in 32 cities to monitor and assess freshwater quality and availability. The WRLP of the WWNP is part of this network.
Two of the most important factors affecting water quality are nitrates and phosphate concentrations. Excessive nitrogen and phosphate, called eutrophication, leads to algal blooms, wherein algae float on the surface of the water and create a barrier that limits the exchange of gasses and light, produces many negative impacts on the freshwater ecosystem and generally results in worsened water quality.
In the WWNP, citizen scientists are trained to measure nitrate and phosphate concentrations, thereby monitoring water quality at the local level. At the global level, Freshwater Watch aims to establish a water quality monitoring network throughout the world to obtain information from water bodies that might not have previously been studied and to assist in mapping the spatial extent of eutrophication.
3.2.2 The standard method A global standard methodology is used for Freshwater Watch tests, with researchers filling a standardised data sheet describing the ecosystem conditions, recording the simple colorimetric tests for nitrate (NO3-) and phosphate (PO4+) and measuring turbidity levels with using a Secchi tube. All citizen scientists are trained and supervised by the staff of the WRLP and have received direct training from Earthwatch.
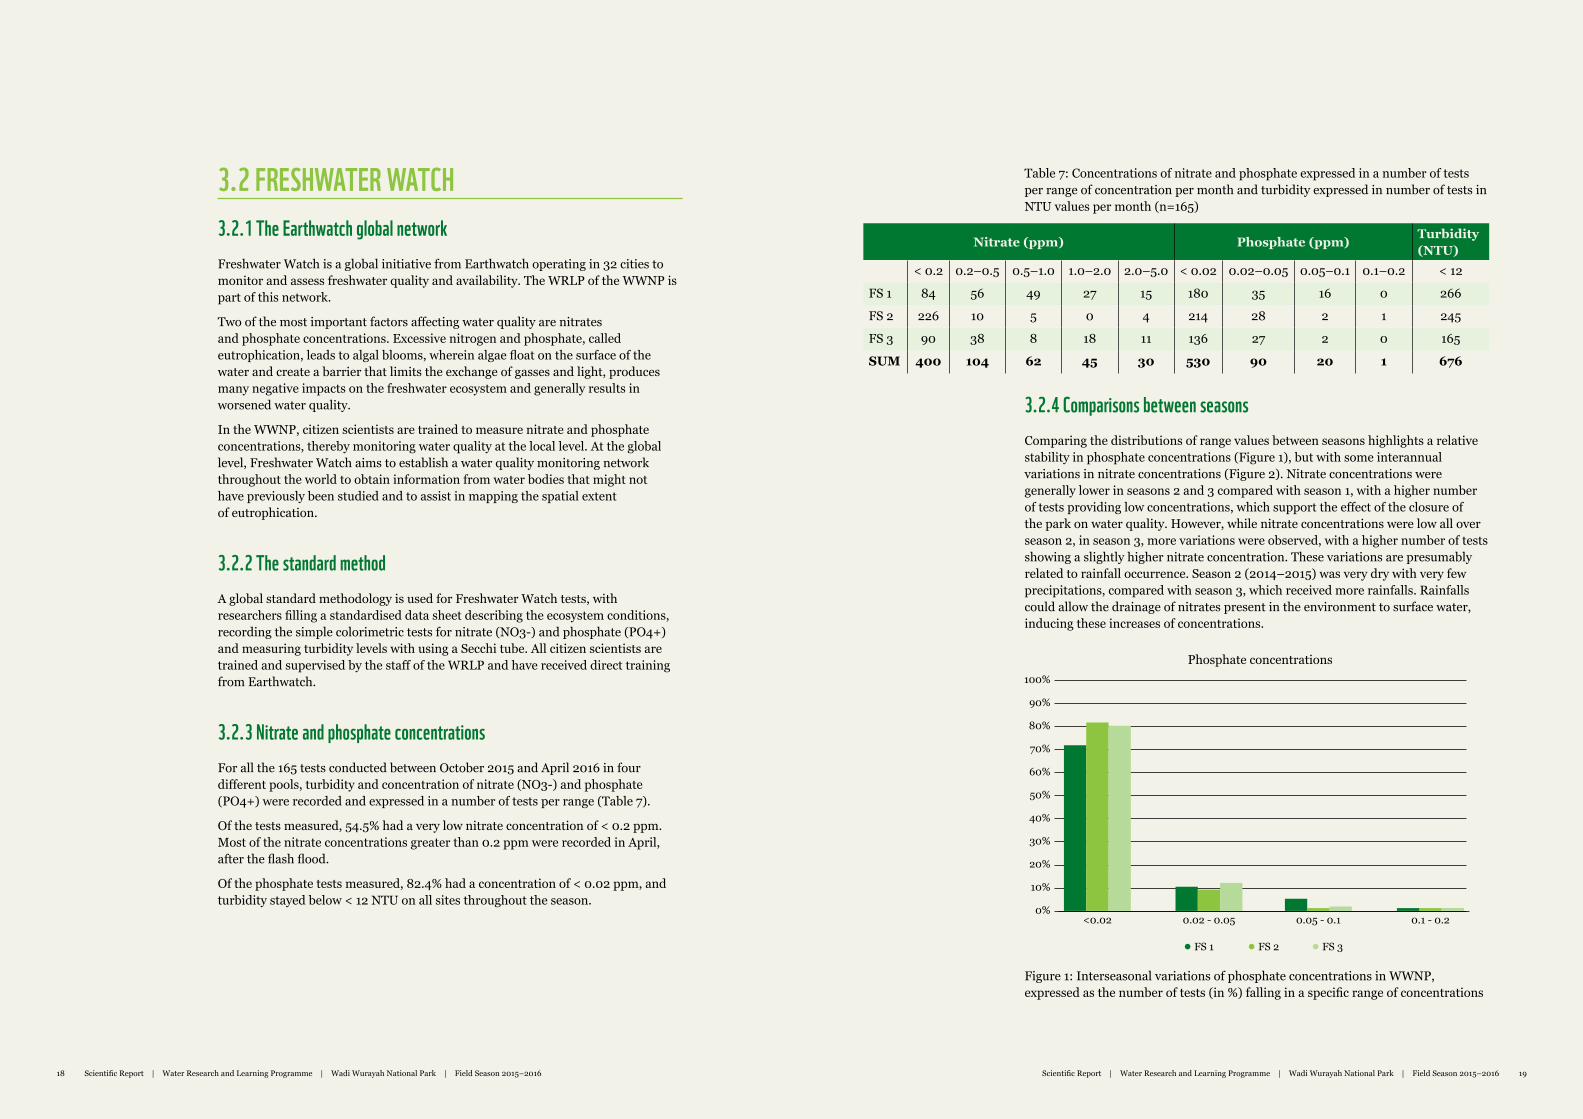
3.2.3 Nitrate and phosphate concentrations For all the 165 tests conducted between October 2015 and April 2016 in four different pools, turbidity and concentration of nitrate (NO3-) and phosphate (PO4+) were recorded and expressed in a number of tests per range (Table 7).
Of the tests measured, 54.5% had a very low nitrate concentration of < 0.2 ppm. Most of the nitrate concentrations greater than 0.2 ppm were recorded in April, after the flash flood.
Of the phosphate tests measured, 82.4% had a concentration of < 0.02 ppm, and turbidity stayed below < 12 NTU on all sites throughout the season.
Table 7: Concentrations of nitrate and phosphate expressed in a number of tests per range of concentration per month and turbidity expressed in number of tests in NTU values per month (n=165)
<0.02 0.02 - 0.05 0.05 - 0.1 0.1 - 0.20%
20%
40%
60%
80%
100%
10%
30%
50%
70%
90%
Phosphate concentrations
FS 1 FS 2 FS 3
Nitrate (ppm) Phosphate (ppm) Turbidity (NTU)
< 0.2 0.2–0.5 0.5–1.0 1.0–2.0 2.0–5.0 < 0.02 0.02–0.05 0.05–0.1 0.1–0.2 < 12
FS 1 84 56 49 27 15 180 35 16 0 266
FS 2 226 10 5 0 4 214 28 2 1 245
FS 3 90 38 8 18 11 136 27 2 0 165
SUM 400 104 62 45 30 530 90 20 1 676
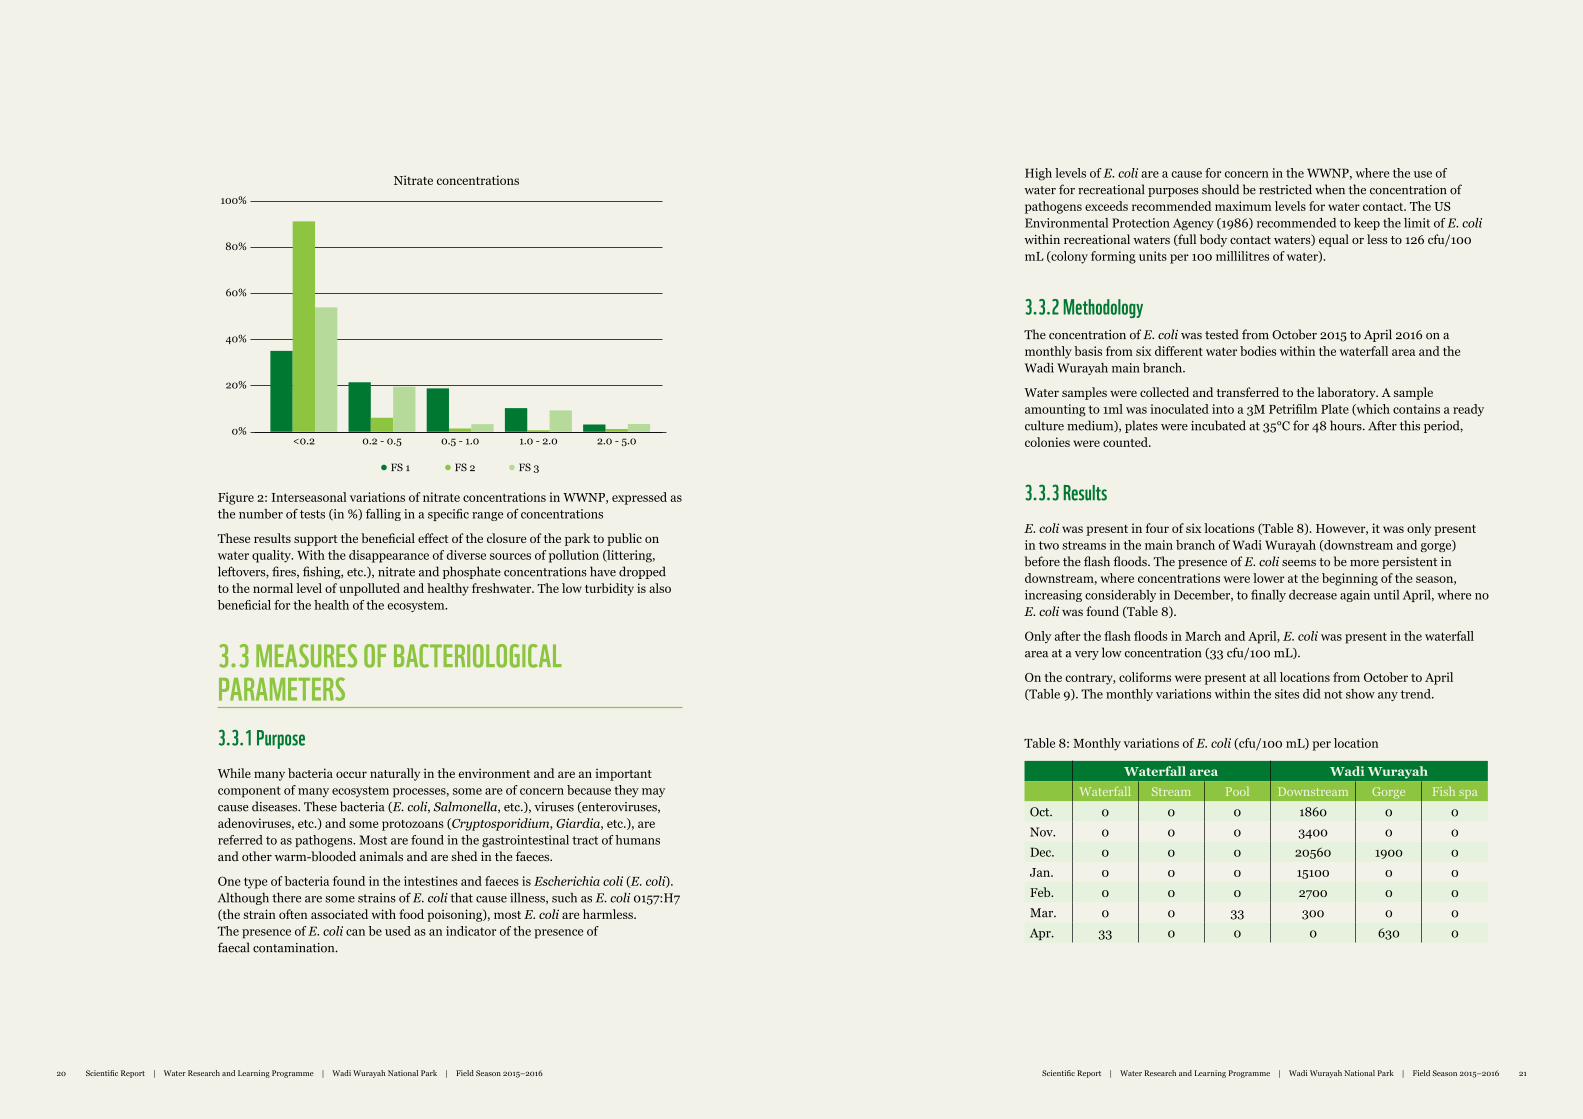
3.2.4 Comparisons between seasons Comparing the distributions of range values between seasons highlights a relative stability in phosphate concentrations (Figure 1), but with some interannual variations in nitrate concentrations (Figure 2). Nitrate concentrations were generally lower in seasons 2 and 3 compared with season 1, with a higher number of tests providing low concentrations, which support the effect of the closure of the park on water quality. However, while nitrate concentrations were low all over season 2, in season 3, more variations were observed, with a higher number of tests showing a slightly higher nitrate concentration. These variations are presumably related to rainfall occurrence. Season 2 (2014–2015) was very dry with very few precipitations, compared with season 3, which received more rainfalls. Rainfalls could allow the drainage of nitrates present in the environment to surface water, inducing these increases of concentrations.
Figure 1: Interseasonal variations of phosphate concentrations in WWNP, expressed as the number of tests (in %) falling in a specific range of concentrations
20 Marine Turtle Conservation Project Final Scientifc Report Marine Turtle Conservation Project Final Scientifc Report 21Scientific Report | Water Research and Learning Programme | Wadi Wurayah National Park | Field Season 2015–2016 2120 Scientific Report | Water Research and Learning Programme | Wadi Wurayah National Park | Field Season 2015–2016
Figure 2: Interseasonal variations of nitrate concentrations in WWNP, expressed as the number of tests (in %) falling in a specific range of concentrations
These results support the beneficial effect of the closure of the park to public on water quality. With the disappearance of diverse sources of pollution (littering, leftovers, fires, fishing, etc.), nitrate and phosphate concentrations have dropped to the normal level of unpolluted and healthy freshwater. The low turbidity is also beneficial for the health of the ecosystem.
3.3 MEASURES OF BACTERIOLOGICAL PARAMETERS3.3.1 PurposeWhile many bacteria occur naturally in the environment and are an important component of many ecosystem processes, some are of concern because they may cause diseases. These bacteria (E. coli, Salmonella, etc.), viruses (enteroviruses, adenoviruses, etc.) and some protozoans (Cryptosporidium, Giardia, etc.), are referred to as pathogens. Most are found in the gastrointestinal tract of humans and other warm-blooded animals and are shed in the faeces.
One type of bacteria found in the intestines and faeces is Escherichia coli (E. coli). Although there are some strains of E. coli that cause illness, such as E. coli 0157:H7 (the strain often associated with food poisoning), most E. coli are harmless. The presence of E. coli can be used as an indicator of the presence of faecal contamination.
High levels of E. coli are a cause for concern in the WWNP, where the use of water for recreational purposes should be restricted when the concentration of pathogens exceeds recommended maximum levels for water contact. The US Environmental Protection Agency (1986) recommended to keep the limit of E. coli within recreational waters (full body contact waters) equal or less to 126 cfu/100 mL (colony forming units per 100 millilitres of water).
3.3.2 MethodologyThe concentration of E. coli was tested from October 2015 to April 2016 on a monthly basis from six different water bodies within the waterfall area and the Wadi Wurayah main branch.
Water samples were collected and transferred to the laboratory. A sample amounting to 1ml was inoculated into a 3M Petrifilm Plate (which contains a ready culture medium), plates were incubated at 35°C for 48 hours. After this period, colonies were counted.
3.3.3 ResultsE. coli was present in four of six locations (Table 8). However, it was only present in two streams in the main branch of Wadi Wurayah (downstream and gorge) before the flash floods. The presence of E. coli seems to be more persistent in downstream, where concentrations were lower at the beginning of the season, increasing considerably in December, to finally decrease again until April, where no E. coli was found (Table 8).
Only after the flash floods in March and April, E. coli was present in the waterfall area at a very low concentration (33 cfu/100 mL).
On the contrary, coliforms were present at all locations from October to April (Table 9). The monthly variations within the sites did not show any trend.
Table 8: Monthly variations of E. coli (cfu/100 mL) per location
Waterfall area Wadi WurayahWaterfall Stream Pool Downstream Gorge Fish spa
Oct. 0 0 0 1860 0 0Nov. 0 0 0 3400 0 0Dec. 0 0 0 20560 1900 0Jan. 0 0 0 15100 0 0Feb. 0 0 0 2700 0 0Mar. 0 0 33 300 0 0Apr. 33 0 0 0 630 0
0%
20%
40%
60%
80%
100%
Nitrate concentrations
FS 1 FS 2 FS 3
<0.2 0.2 - 0.5 0.5 - 1.0 1.0 - 2.0 2.0 - 5.0
22 Marine Turtle Conservation Project Final Scientifc Report Marine Turtle Conservation Project Final Scientifc Report 23Scientific Report | Water Research and Learning Programme | Wadi Wurayah National Park | Field Season 2015–2016 2322 Scientific Report | Water Research and Learning Programme | Wadi Wurayah National Park | Field Season 2015–2016
Table 9: Monthly variations of coliforms (cfu/100 mL) per location
Waterfall area Wadi WurayahWaterfall Stream Pool Downstream Gorge Fish spa
Oct. 10033 433 2866 4133 100 1133Nov. 11500 1433 966 2800 166 2533Dec. 31633 14066 2733 44300 39666 4933Jan. 5666 1333 1133 3066 0 566Feb. 5400 8666 1500 2566 1966 966Mar. 19533 16566 11066 8800 15866 23300Apr. 20133 8233 12733 1800 3666 966
3.3.4 Conclusions The average number of E. coli measured at the waterfall from January to March 2014 was 128.36 cfu/100 mL, whereas E. coli was not found during the same period at the same location in 2016. This could be due to less human activity, as for the last two years the park was closed to the public. However, the high concentration of E. coli downstream of the Wadi Wurayah gorge and its variation through the season require further investigations to understand better what the sources of the pathogens are. The presence of breeding feral pigeons within that area, whose faeces are found around the pool, is suspected as a potential source (Saidenberg et al. 2012).
Water quality standards should be set within the WWNP to limit exposure to recreational waters when pathogens are present. Following US-EPA’s recommendations, we found that E. coli concentrations exceed the limit (126 cfu/100 mL) in two of six locations (downstream and gorge); therefore, actions should be taken to identify the source of contamination and decrease E. coli concentrations. Any use of water (for the purpose of recreational or scientific activities) should be considered with caution.
3.4 ZOOPLANKTON AS BIOINDICATORS3.4.1 Estimating richness and abundanceZooplankton includes small floating or weakly swimming heterotrophic organisms that drift with water currents for their movement. Freshwater ecosystems are productive areas with rich zooplankton population. Zooplankton is a vital component within freshwater food webs, as it forms a link between the phytoplankton community and larger species, such as fish and invertebrate predators. It is composed of primary consumers (which eat phytoplankton) and secondary consumers (which feed on other zooplankton species).
Zooplankton communities are present in almost all lakes and ponds; however, they are rarely important in rivers and streams because they cannot maintain positive net growth rates in the face of downstream losses. Planktonic populations have long been used as ecological indicators (Webber et al. 2005).
Following the research conducted during the previous field season in zooplankton communities, which investigated different methodologies, the objectives of this third season were to estimate zooplankton diversity (richness and abundance) and to compare spatiotemporal variations.
3.4.2 Sampling and identificationZooplankton samples were collected from October 2015 to April 2016 on a monthly basis from six different water bodies within the waterfall area and the Wadi Wurayah main branch.
Five litres of water were collected from the surface of water bodies and filtered through a long conical plankton net (mesh size: 100 μm; mouth diameter: 13 cm). The net was held vertically by hand. In the laboratory, samples were poured into a 7 × 27 × 43 cm white tray, where all living organisms were captured using a pipette and counted. Identification was performed, under 40 × magnification using a Swift binocular microscope, according to the “Practical Guide to Identifying Freshwater Crustacean Zooplankton” (Witty 2004).
3.4.3 Variation in zooplankton diversity and abundance3.4.3.1 Species diversity
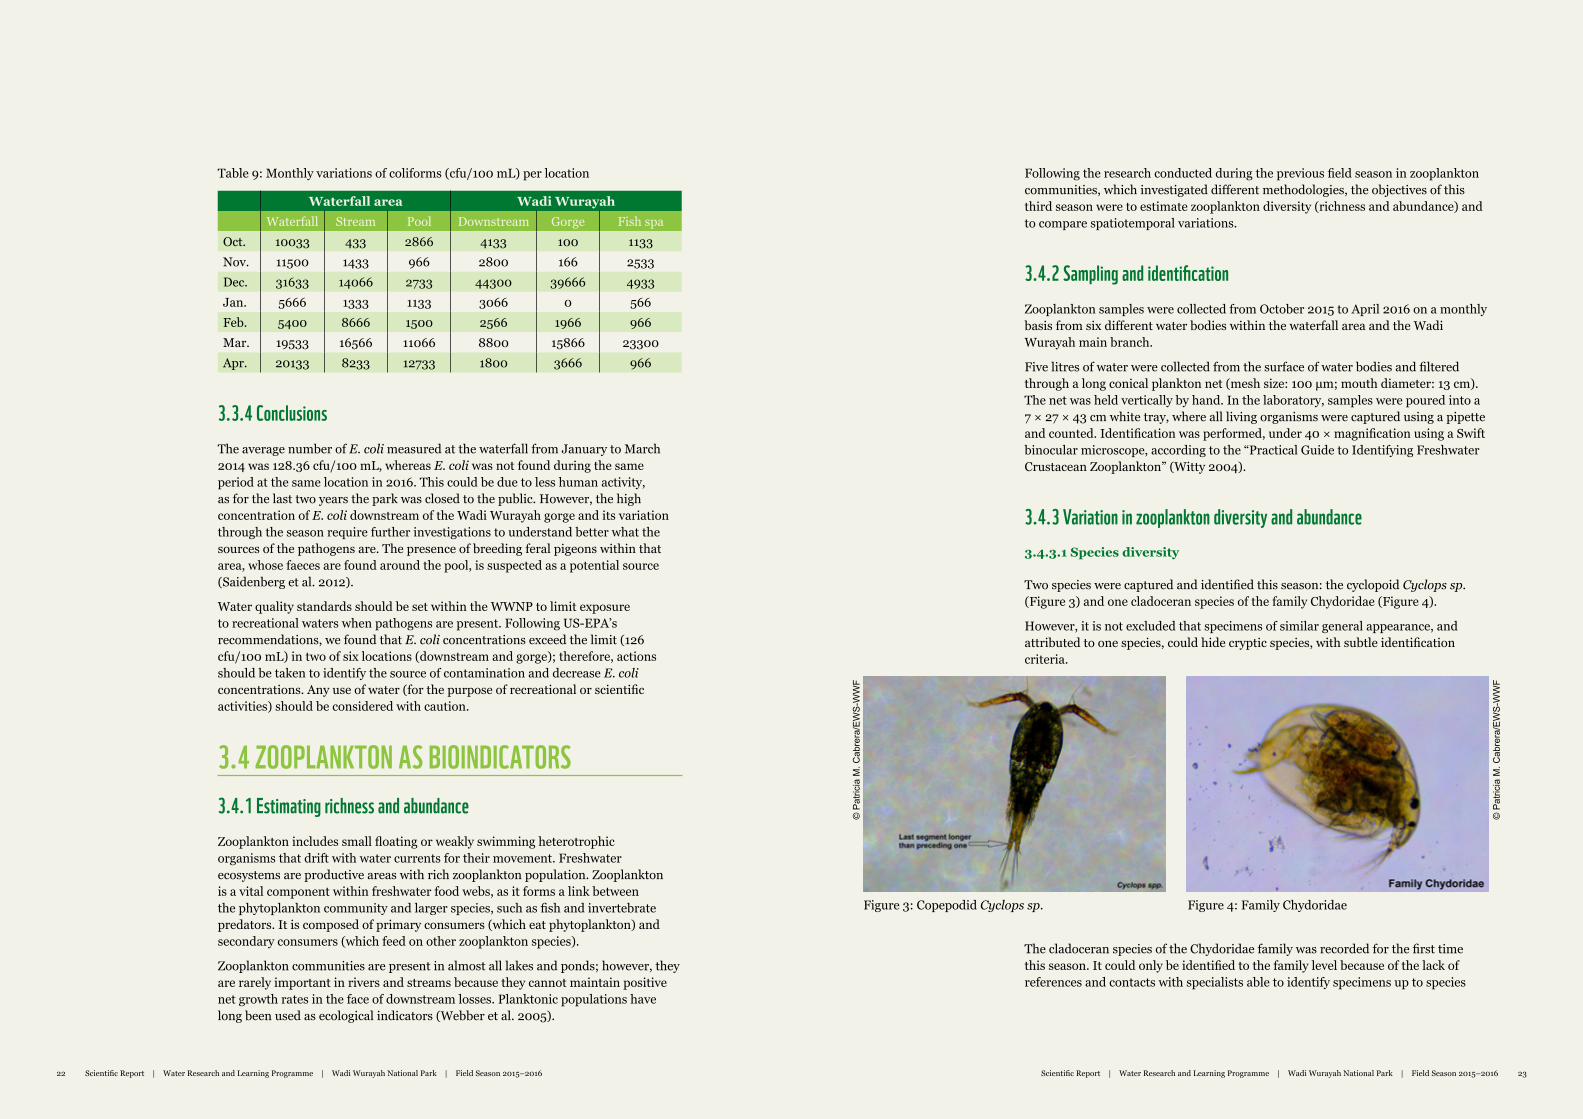
Two species were captured and identified this season: the cyclopoid Cyclops sp. (Figure 3) and one cladoceran species of the family Chydoridae (Figure 4).
However, it is not excluded that specimens of similar general appearance, and attributed to one species, could hide cryptic species, with subtle identification criteria.
Figure 3: Copepodid Cyclops sp. Figure 4: Family Chydoridae
The cladoceran species of the Chydoridae family was recorded for the first time this season. It could only be identified to the family level because of the lack of references and contacts with specialists able to identify specimens up to species
© P
atric
ia M
. Cab
rera
/EW
S-W
WF
© P
atric
ia M
. Cab
rera
/EW
S-W
WF
24 Marine Turtle Conservation Project Final Scientifc Report Marine Turtle Conservation Project Final Scientifc Report 25Scientific Report | Water Research and Learning Programme | Wadi Wurayah National Park | Field Season 2015–2016 2524 Scientific Report | Water Research and Learning Programme | Wadi Wurayah National Park | Field Season 2015–2016
level. Forró et al. (2007) state that the Afrotropical region, though poorly studied, seems to be especially deprived of known higher-level endemic cladoceran taxa, being represented by a single endemic genus and more than 24 endemic species.
Daphnia sp., captured twice in January and February 2015, was not recorded this season.
Other organisms present in the plankton samples included mayflies, stoneflies and mosquito larvae.
3.4.3.2 Abundance
From the 42 samples, 103 specimens of at least two different species were collected.
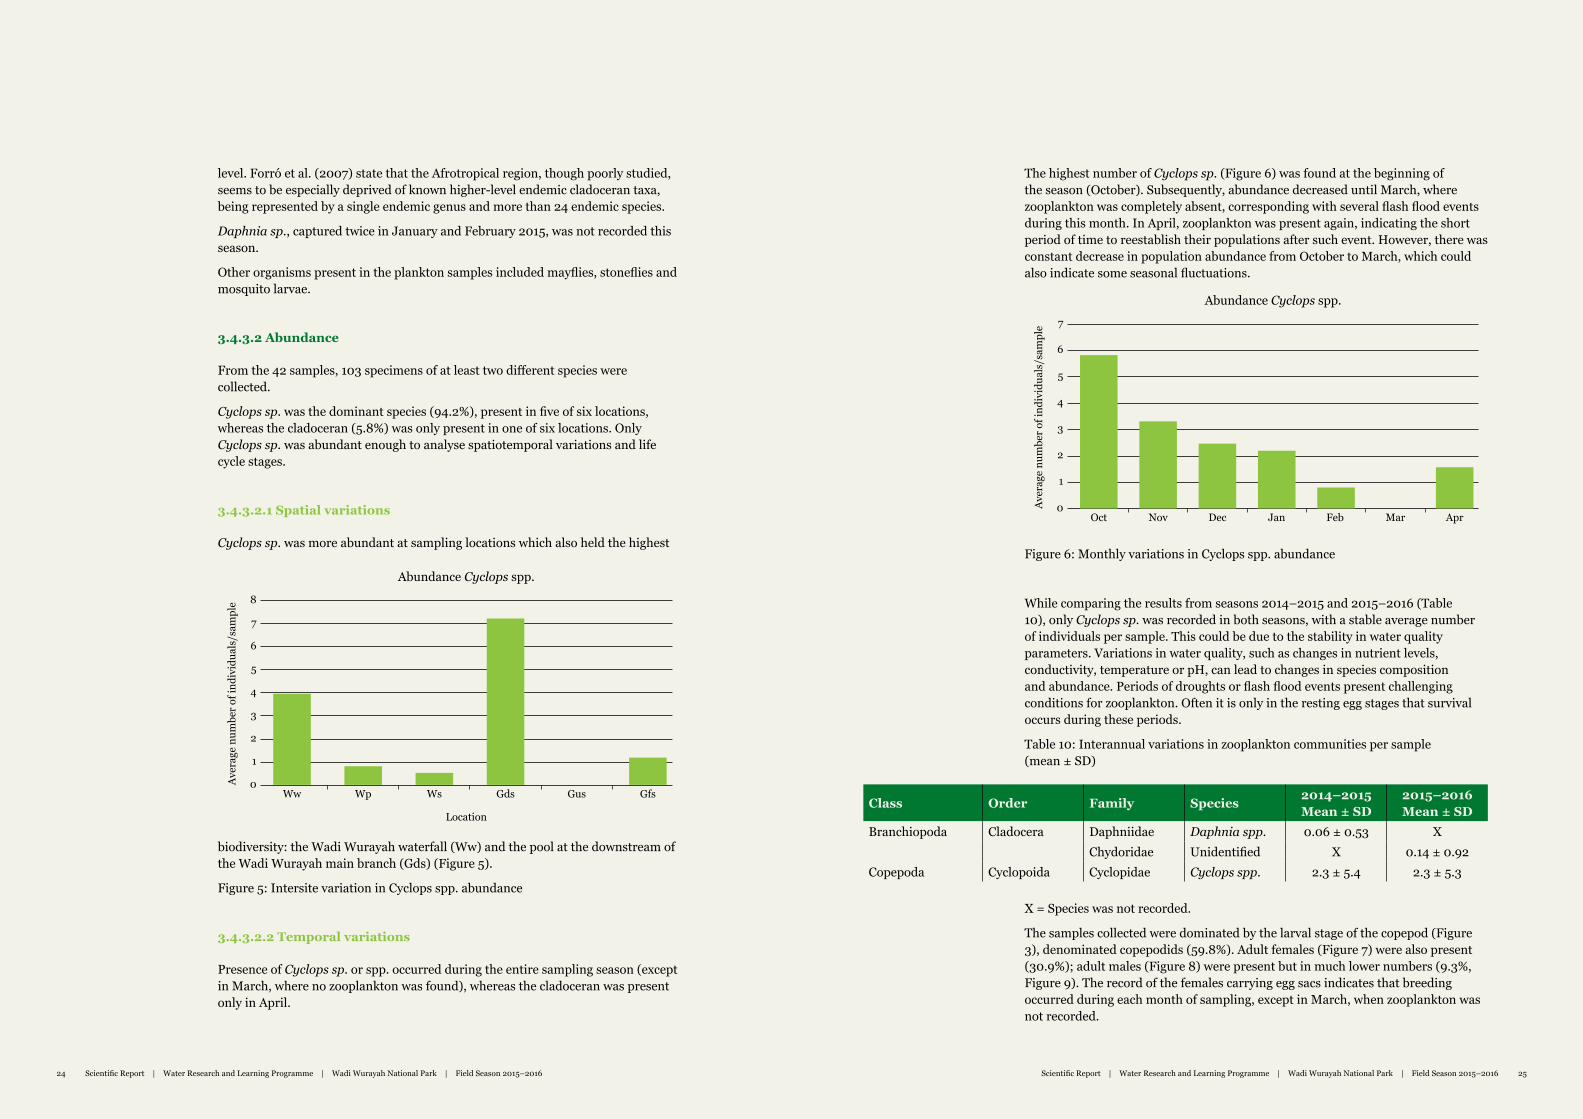
Cyclops sp. was the dominant species (94.2%), present in five of six locations, whereas the cladoceran (5.8%) was only present in one of six locations. Only Cyclops sp. was abundant enough to analyse spatiotemporal variations and life cycle stages.
3.4.3.2.1 Spatial variations
Cyclops sp. was more abundant at sampling locations which also held the highest
The highest number of Cyclops sp. (Figure 6) was found at the beginning of the season (October). Subsequently, abundance decreased until March, where zooplankton was completely absent, corresponding with several flash flood events during this month. In April, zooplankton was present again, indicating the short period of time to reestablish their populations after such event. However, there was constant decrease in population abundance from October to March, which could also indicate some seasonal fluctuations.
Ww Wp Ws Gds Gus Gfs0
2
4
6
8
1
3
5
7
Abundance Cyclops spp.
Location
Ave
rage
num
ber
of in
divi
dual
s/sa
mpl
e
Oct Nov Dec Jan Feb Mar Apr0
Abundance Cyclops spp.
Ave
rage
num
ber
of in
divi
dual
s/sa
mpl
e
1
2
3
4
5
6
7
biodiversity: the Wadi Wurayah waterfall (Ww) and the pool at the downstream of the Wadi Wurayah main branch (Gds) (Figure 5).
Figure 5: Intersite variation in Cyclops spp. abundance
3.4.3.2.2 Temporal variations
Presence of Cyclops sp. or spp. occurred during the entire sampling season (except in March, where no zooplankton was found), whereas the cladoceran was present only in April.
Figure 6: Monthly variations in Cyclops spp. abundance
While comparing the results from seasons 2014–2015 and 2015–2016 (Table 10), only Cyclops sp. was recorded in both seasons, with a stable average number of individuals per sample. This could be due to the stability in water quality parameters. Variations in water quality, such as changes in nutrient levels, conductivity, temperature or pH, can lead to changes in species composition and abundance. Periods of droughts or flash flood events present challenging conditions for zooplankton. Often it is only in the resting egg stages that survival occurs during these periods.
Table 10: Interannual variations in zooplankton communities per sample (mean ± SD)
X = Species was not recorded.
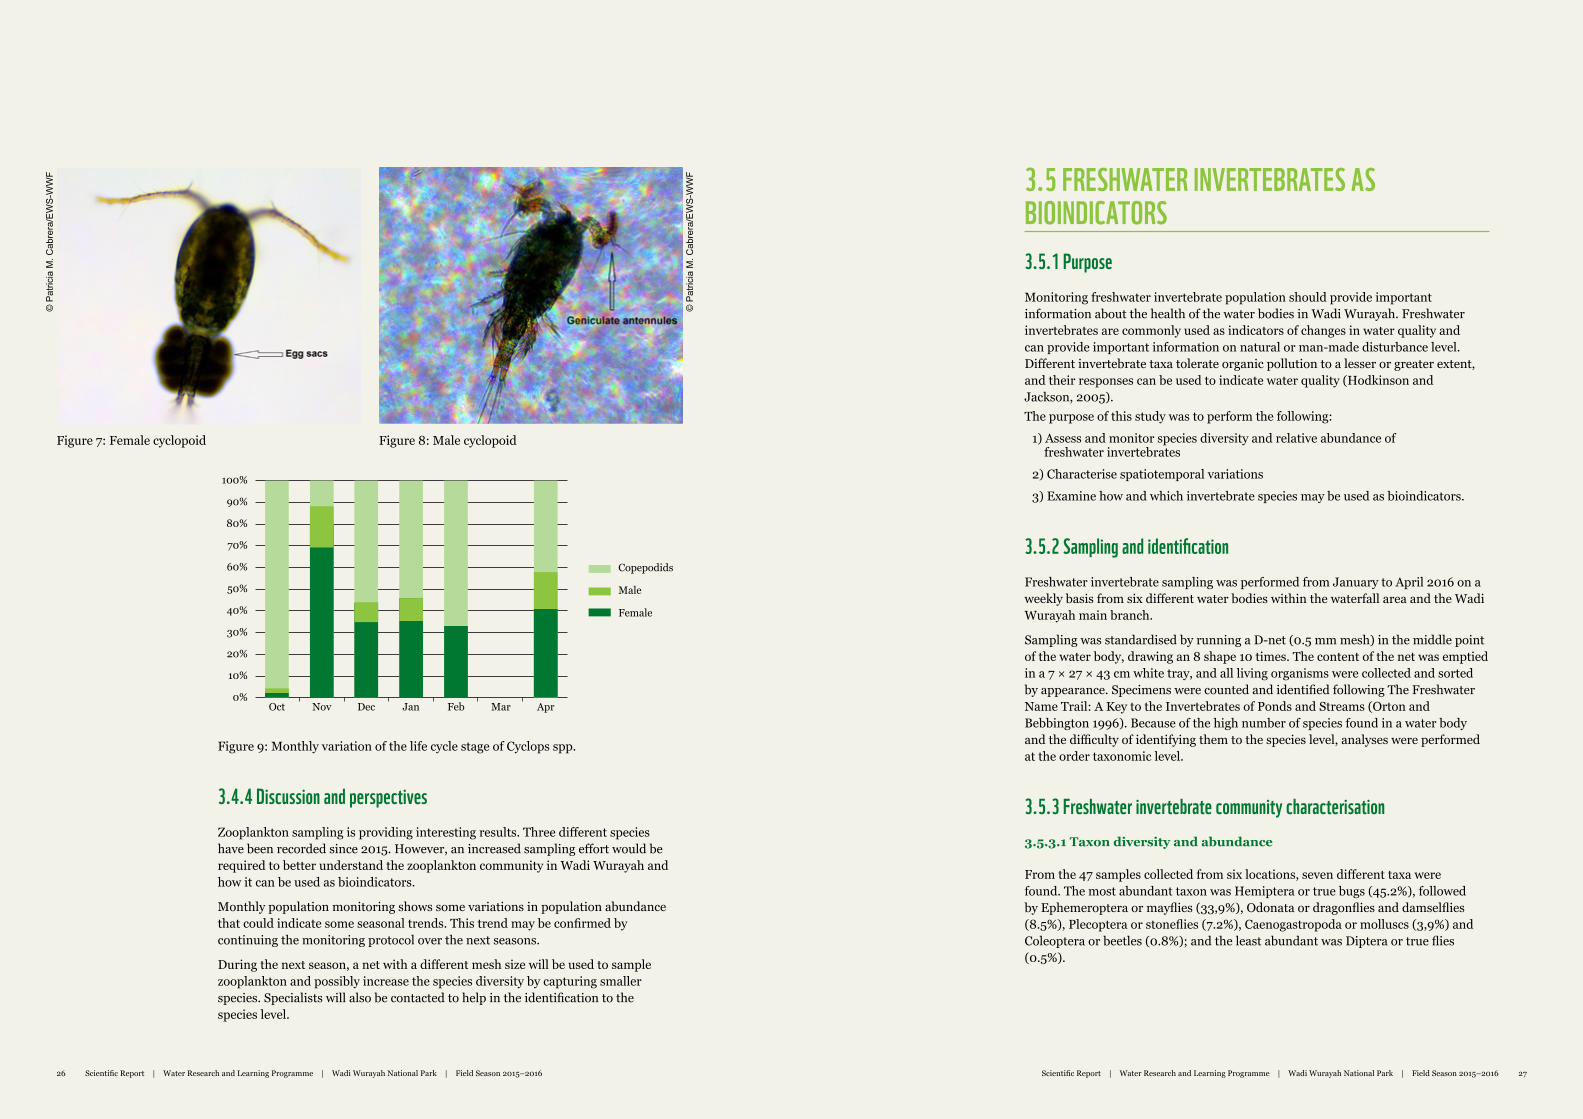
The samples collected were dominated by the larval stage of the copepod (Figure 3), denominated copepodids (59.8%). Adult females (Figure 7) were also present (30.9%); adult males (Figure 8) were present but in much lower numbers (9.3%, Figure 9). The record of the females carrying egg sacs indicates that breeding occurred during each month of sampling, except in March, when zooplankton was not recorded.
Class Order Family Species 2014–2015Mean ± SD
2015–2016Mean ± SD
Branchiopoda Cladocera Daphniidae Daphnia spp. 0.06 ± 0.53 XChydoridae Unidentified X 0.14 ± 0.92
Copepoda Cyclopoida Cyclopidae Cyclops spp. 2.3 ± 5.4 2.3 ± 5.3
26 Marine Turtle Conservation Project Final Scientifc Report Marine Turtle Conservation Project Final Scientifc Report 27Scientific Report | Water Research and Learning Programme | Wadi Wurayah National Park | Field Season 2015–2016 2726 Scientific Report | Water Research and Learning Programme | Wadi Wurayah National Park | Field Season 2015–2016
Figure 8: Male cyclopoidFigure 7: Female cyclopoid
3.5 FRESHWATER INVERTEBRATES AS BIOINDICATORS3.5.1 PurposeMonitoring freshwater invertebrate population should provide important information about the health of the water bodies in Wadi Wurayah. Freshwater invertebrates are commonly used as indicators of changes in water quality and can provide important information on natural or man-made disturbance level. Different invertebrate taxa tolerate organic pollution to a lesser or greater extent, and their responses can be used to indicate water quality (Hodkinson and Jackson, 2005).The purpose of this study was to perform the following:
1) Assess and monitor species diversity and relative abundance of freshwater invertebrates
2) Characterise spatiotemporal variations
3) Examine how and which invertebrate species may be used as bioindicators.
3.5.2 Sampling and identificationFreshwater invertebrate sampling was performed from January to April 2016 on a weekly basis from six different water bodies within the waterfall area and the Wadi Wurayah main branch.
Sampling was standardised by running a D-net (0.5 mm mesh) in the middle point of the water body, drawing an 8 shape 10 times. The content of the net was emptied in a 7 × 27 × 43 cm white tray, and all living organisms were collected and sorted by appearance. Specimens were counted and identified following The Freshwater Name Trail: A Key to the Invertebrates of Ponds and Streams (Orton and Bebbington 1996). Because of the high number of species found in a water body and the difficulty of identifying them to the species level, analyses were performed at the order taxonomic level.
3.5.3 Freshwater invertebrate community characterisation3.5.3.1 Taxon diversity and abundance
From the 47 samples collected from six locations, seven different taxa were found. The most abundant taxon was Hemiptera or true bugs (45.2%), followed by Ephemeroptera or mayflies (33,9%), Odonata or dragonflies and damselflies (8.5%), Plecoptera or stoneflies (7.2%), Caenogastropoda or molluscs (3,9%) and Coleoptera or beetles (0.8%); and the least abundant was Diptera or true flies (0.5%).
Figure 9: Monthly variation of the life cycle stage of Cyclops spp.
3.4.4 Discussion and perspectivesZooplankton sampling is providing interesting results. Three different species have been recorded since 2015. However, an increased sampling effort would be required to better understand the zooplankton community in Wadi Wurayah and how it can be used as bioindicators.
Monthly population monitoring shows some variations in population abundance that could indicate some seasonal trends. This trend may be confirmed by continuing the monitoring protocol over the next seasons.
During the next season, a net with a different mesh size will be used to sample zooplankton and possibly increase the species diversity by capturing smaller species. Specialists will also be contacted to help in the identification to the species level.
100%
90%
80%
70%
60%
50%
40%
30%
20%
10%
0%
Female
Male
Copepodids
Oct Nov Dec Jan MarFeb Apr
© P
atric
ia M
. Cab
rera
/EW
S-W
WF
© P
atric
ia M
. Cab
rera
/EW
S-W
WF
28 Marine Turtle Conservation Project Final Scientifc Report Marine Turtle Conservation Project Final Scientifc Report 29Scientific Report | Water Research and Learning Programme | Wadi Wurayah National Park | Field Season 2015–2016 2928 Scientific Report | Water Research and Learning Programme | Wadi Wurayah National Park | Field Season 2015–2016
3.5.4 The way forwardDuring this season, we have explored one technique to sample freshwater invertebrates. A visual guide on the most common freshwater invertebrate species has been created, and the most abundant taxa have been identified. Wadi Wurayah, as a stronghold for the invertebrate fauna of the UAE because of its habitat diversity and the presence of permanent surface water (Tourenq et al. 2009), can be used to develop a model of environmental monitoring using freshwater invertebrate as bioindicators. One of the most abundant taxa found, Ephemeroptera, represents a group that can be reliably identified, is ecologically important and contains pollution-sensitive species.
Therefore, one of our goals for the next field season will be to assess freshwater invertebrates’ diversity at the species level by increasing our focus on mayflies.
Odonata is an order of carnivorous insects, encompassing the dragonflies (Anisoptera) and the damselflies (Zygoptera). Dragonflies are generally larger and perch with their wings held out to the side. Damselflies have slender bodies and hold their wings over the body at rest. Species diversity and abundance in Odonate communities are generally considered a good indicator of water quality as odonates depend on water all throughout their life cycle (Corbet 2004). Adult damselflies and dragonflies lay their eggs in freshwater; the eggs hatch into aquatic predatory larvae. Each species has a different level of tolerance to its surroundings, such as water temperature, dissolved oxygen, pH, and so on. As predators, either when adults or during their larval stage, odonates’ existence is linked to prey availability, making their numbers and diversity reflect the conditions of the whole aquatic ecosystem. Out of the 29 odonate species known in the UAE, 25 have been recorded within Wadi Wurayah, which is a positive indicator of the health of the freshwater ecosystem and water quality. However, to maintain this ecological equilibrium and diversity, we need to understand what the species requirements are, how their life cycle is linked to environmental conditions and what the amplitude and cycle of variations in population abundance are. The research and monitoring programme developed with the help of the volunteers aims to address these questions.
3.5.3.2 Spatiotemporal variations
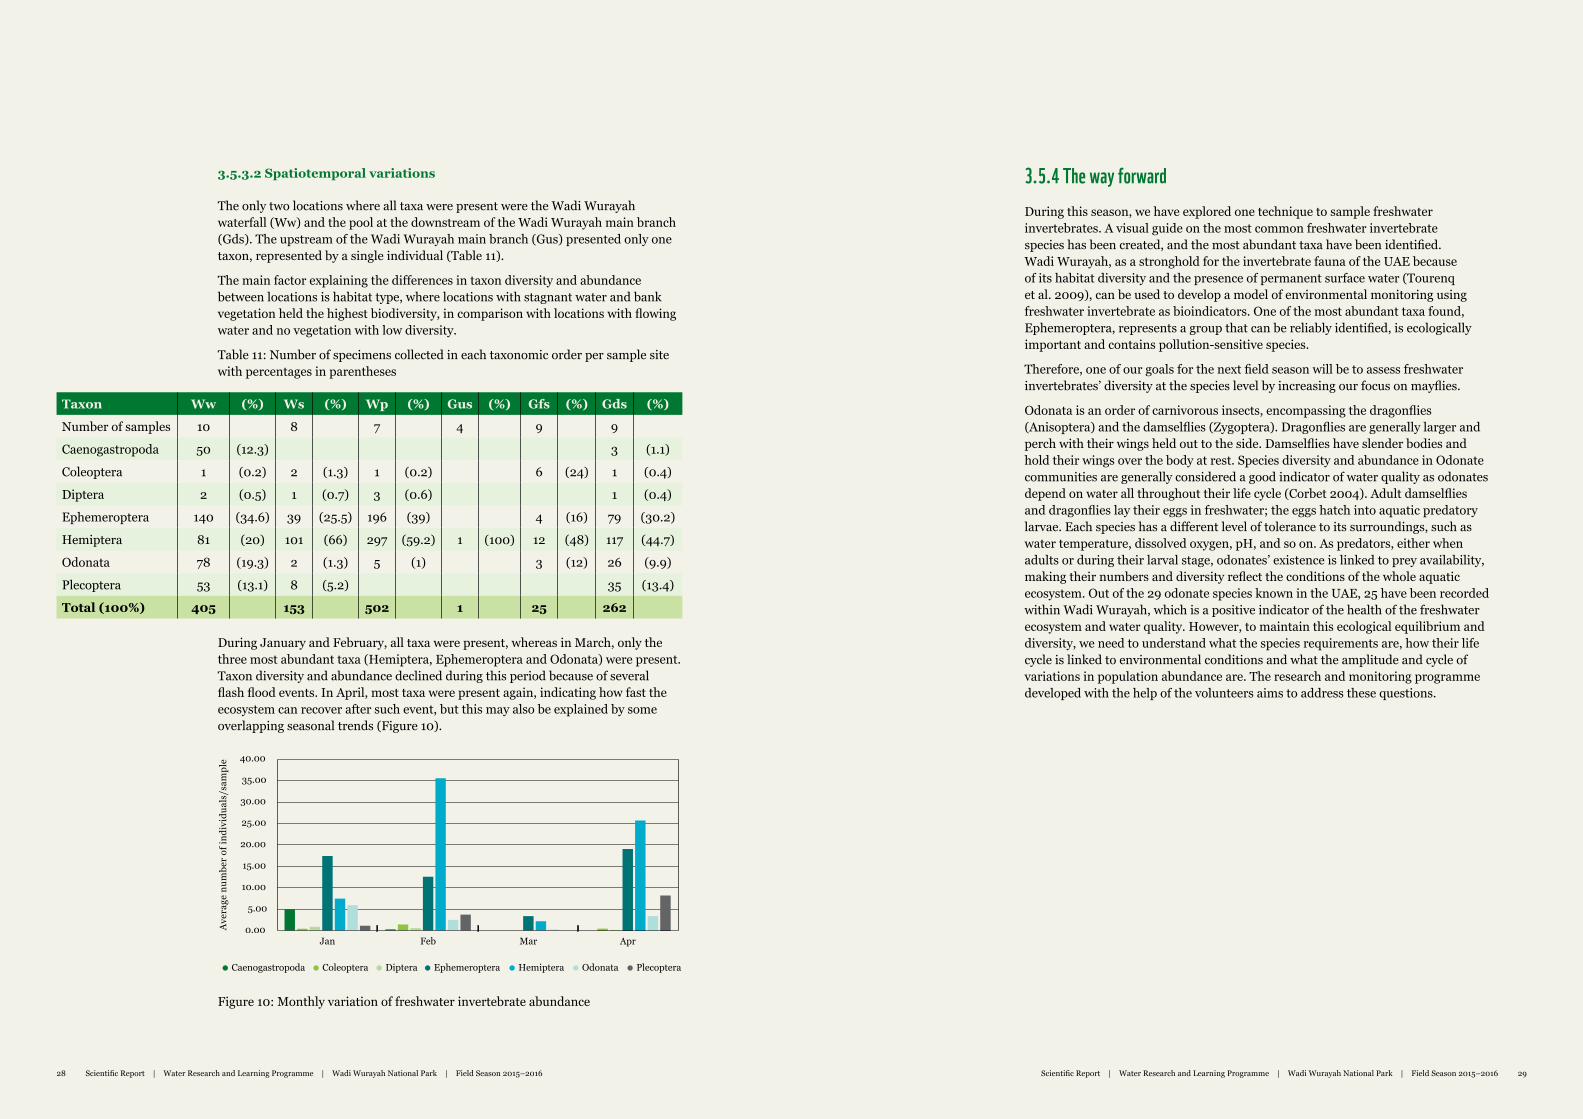
The only two locations where all taxa were present were the Wadi Wurayah waterfall (Ww) and the pool at the downstream of the Wadi Wurayah main branch (Gds). The upstream of the Wadi Wurayah main branch (Gus) presented only one taxon, represented by a single individual (Table 11).
The main factor explaining the differences in taxon diversity and abundance between locations is habitat type, where locations with stagnant water and bank vegetation held the highest biodiversity, in comparison with locations with flowing water and no vegetation with low diversity.
Table 11: Number of specimens collected in each taxonomic order per sample site with percentages in parentheses
During January and February, all taxa were present, whereas in March, only the three most abundant taxa (Hemiptera, Ephemeroptera and Odonata) were present. Taxon diversity and abundance declined during this period because of several flash flood events. In April, most taxa were present again, indicating how fast the ecosystem can recover after such event, but this may also be explained by some overlapping seasonal trends (Figure 10).
Ave
rage
num
ber o
f ind
ivid
uals
/sam
ple
5.00
10.00
15.00
20.00
25.00
30.00
35.00
40.00
0.00Jan Feb Mar Apr
Caenogastropoda Coleoptera Ephemeroptera Hemiptera Odonata PlecopteraDiptera
Taxon Ww (%) Ws (%) Wp (%) Gus (%) Gfs (%) Gds (%)
Number of samples 10 8 7 4 9 9
Caenogastropoda 50 (12.3) 3 (1.1)
Coleoptera 1 (0.2) 2 (1.3) 1 (0.2) 6 (24) 1 (0.4)
Diptera 2 (0.5) 1 (0.7) 3 (0.6) 1 (0.4)
Ephemeroptera 140 (34.6) 39 (25.5) 196 (39) 4 (16) 79 (30.2)
Hemiptera 81 (20) 101 (66) 297 (59.2) 1 (100) 12 (48) 117 (44.7)
Odonata 78 (19.3) 2 (1.3) 5 (1) 3 (12) 26 (9.9)
Plecoptera 53 (13.1) 8 (5.2) 35 (13.4)
Total (100%) 405 153 502 1 25 262
Figure 10: Monthly variation of freshwater invertebrate abundance
30 Marine Turtle Conservation Project Final Scientifc Report Marine Turtle Conservation Project Final Scientifc Report 31Scientific Report | Water Research and Learning Programme | Wadi Wurayah National Park | Field Season 2015–2016 3130 Scientific Report | Water Research and Learning Programme | Wadi Wurayah National Park | Field Season 2015–2016
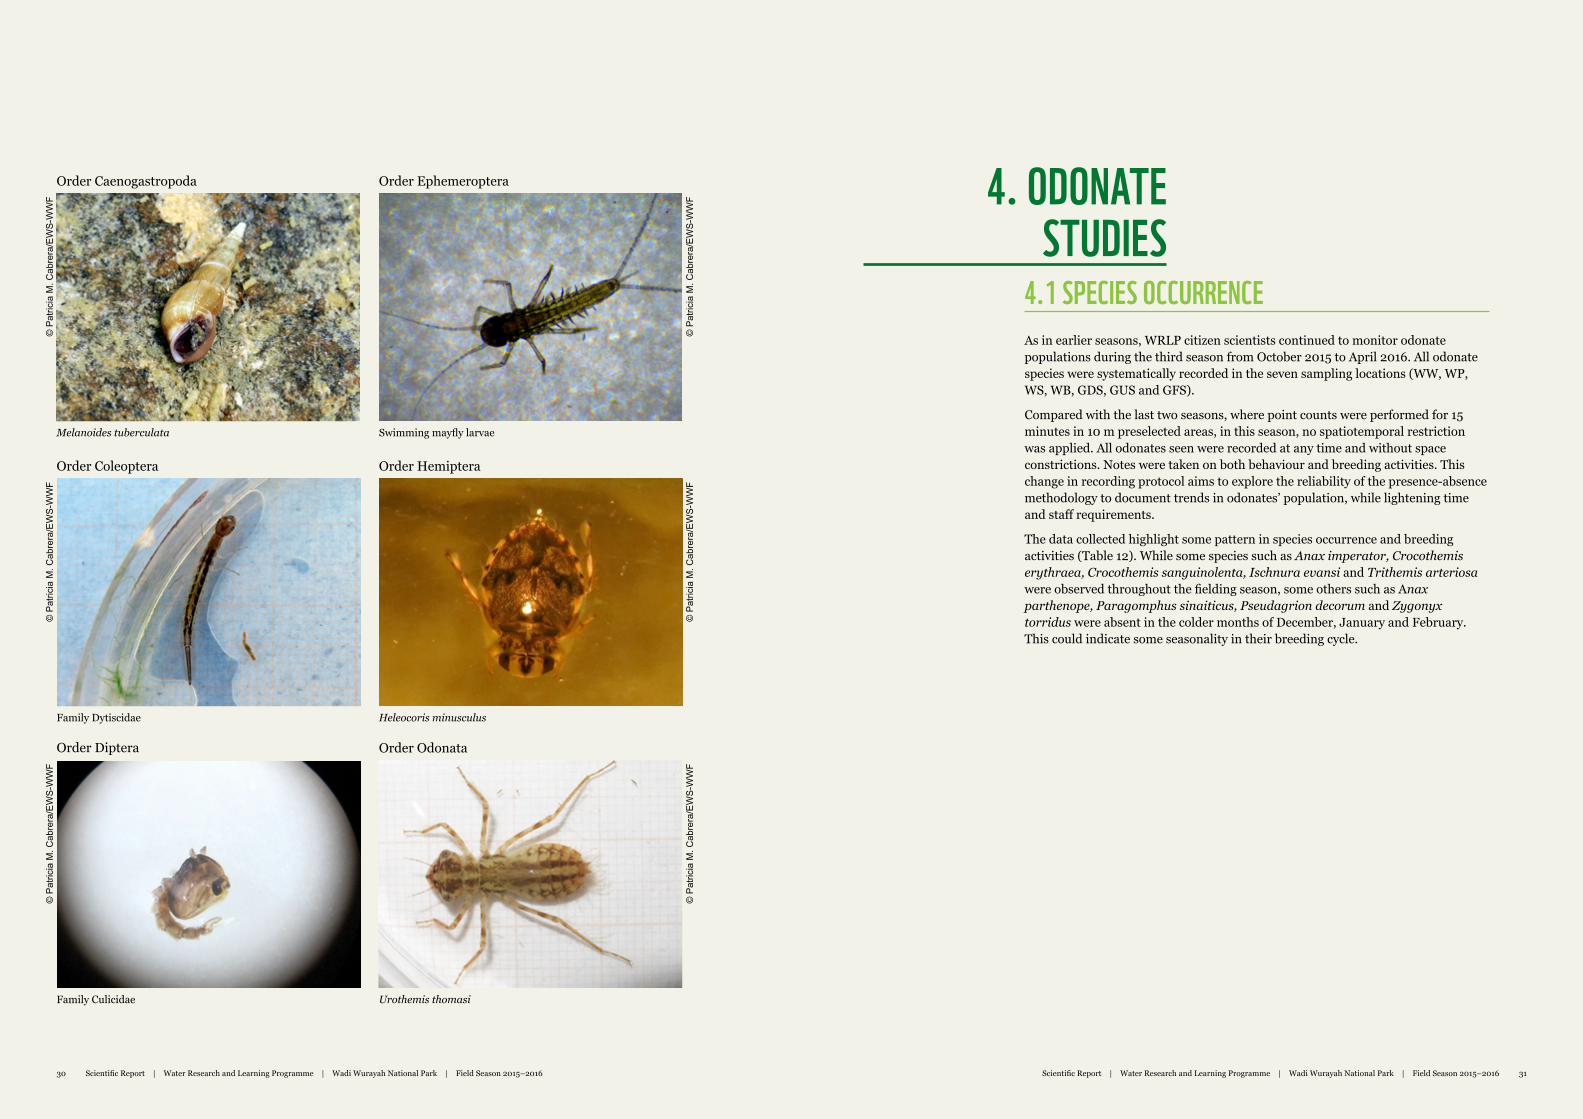
4.1 SPECIES OCCURRENCE As in earlier seasons, WRLP citizen scientists continued to monitor odonate populations during the third season from October 2015 to April 2016. All odonate species were systematically recorded in the seven sampling locations (WW, WP, WS, WB, GDS, GUS and GFS).
Compared with the last two seasons, where point counts were performed for 15 minutes in 10 m preselected areas, in this season, no spatiotemporal restriction was applied. All odonates seen were recorded at any time and without space constrictions. Notes were taken on both behaviour and breeding activities. This change in recording protocol aims to explore the reliability of the presence-absence methodology to document trends in odonates’ population, while lightening time and staff requirements.
The data collected highlight some pattern in species occurrence and breeding activities (Table 12). While some species such as Anax imperator, Crocothemis erythraea, Crocothemis sanguinolenta, Ischnura evansi and Trithemis arteriosa were observed throughout the fielding season, some others such as Anax parthenope, Paragomphus sinaiticus, Pseudagrion decorum and Zygonyx torridus were absent in the colder months of December, January and February. This could indicate some seasonality in their breeding cycle.
4. ODONATE STUDIES
Melanoides tuberculata
Family Culicidae
Family Dytiscidae
Swimming mayfly larvae
Urothemis thomasi
Heleocoris minusculus
Order Caenogastropoda
Order Coleoptera
Order Diptera
Order Ephemeroptera
Order Odonata
Order Hemiptera
© P
atric
ia M
. Cab
rera
/EW
S-W
WF
© P
atric
ia M
. Cab
rera
/EW
S-W
WF
© P
atric
ia M
. Cab
rera
/EW
S-W
WF
© P
atric
ia M
. Cab
rera
/EW
S-W
WF
© P
atric
ia M
. Cab
rera
/EW
S-W
WF
© P
atric
ia M
. Cab
rera
/EW
S-W
WF
32 Marine Turtle Conservation Project Final Scientifc Report Marine Turtle Conservation Project Final Scientifc Report 33Scientific Report | Water Research and Learning Programme | Wadi Wurayah National Park | Field Season 2015–2016 3332 Scientific Report | Water Research and Learning Programme | Wadi Wurayah National Park | Field Season 2015–2016
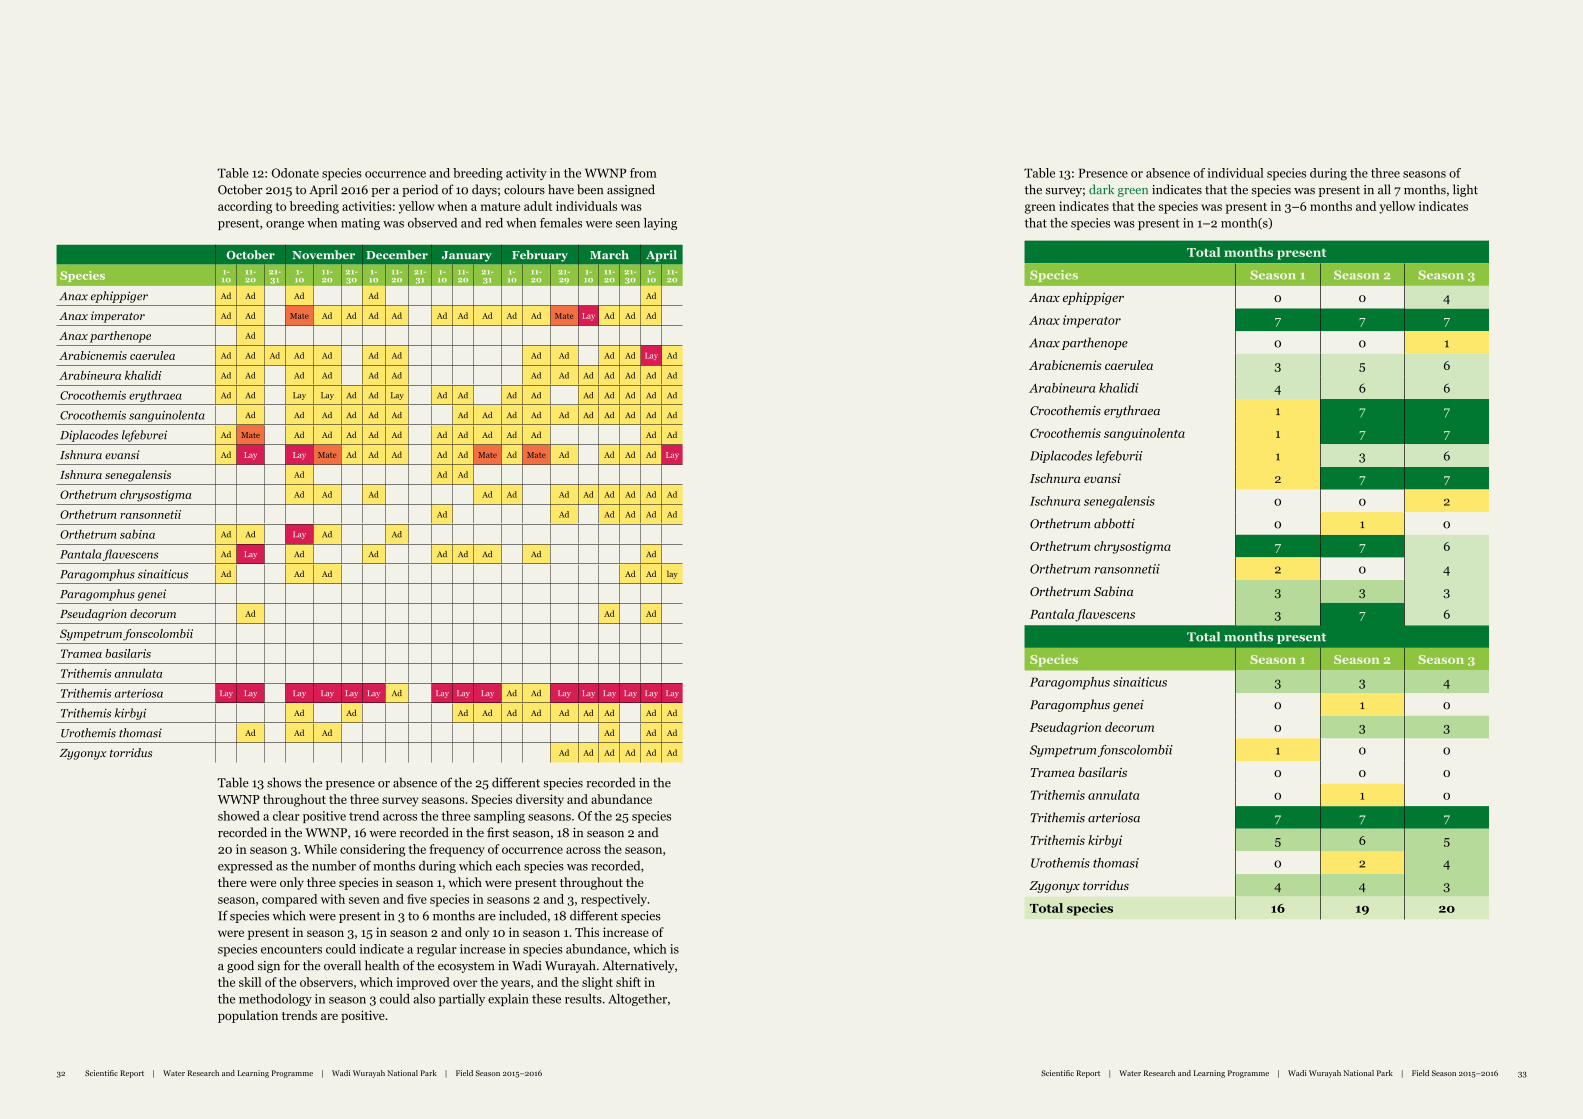
Table 12: Odonate species occurrence and breeding activity in the WWNP from October 2015 to April 2016 per a period of 10 days; colours have been assigned according to breeding activities: yellow when a mature adult individuals was present, orange when mating was observed and red when females were seen laying
Table 13: Presence or absence of individual species during the three seasons of the survey; dark green indicates that the species was present in all 7 months, light green indicates that the species was present in 3–6 months and yellow indicates that the species was present in 1–2 month(s)
Total months present
Species Season 1 Season 2 Season 3
Anax ephippiger 0 0 4
Anax imperator 7 7 7
Anax parthenope 0 0 1
Arabicnemis caerulea 3 5 6
Arabineura khalidi 4 6 6
Crocothemis erythraea 1 7 7
Crocothemis sanguinolenta 1 7 7
Diplacodes lefebvrii 1 3 6
Ischnura evansi 2 7 7
Ischnura senegalensis 0 0 2
Orthetrum abbotti 0 1 0
Orthetrum chrysostigma 7 7 6
Orthetrum ransonnetii 2 0 4
Orthetrum Sabina 3 3 3
Pantala flavescens 3 7 6
Total months present
Species Season 1 Season 2 Season 3
Paragomphus sinaiticus 3 3 4
Paragomphus genei 0 1 0
Pseudagrion decorum 0 3 3
Sympetrum fonscolombii 1 0 0
Tramea basilaris 0 0 0
Trithemis annulata 0 1 0
Trithemis arteriosa 7 7 7
Trithemis kirbyi 5 6 5
Urothemis thomasi 0 2 4
Zygonyx torridus 4 4 3
Total species 16 19 20
Table 13 shows the presence or absence of the 25 different species recorded in the WWNP throughout the three survey seasons. Species diversity and abundance showed a clear positive trend across the three sampling seasons. Of the 25 species recorded in the WWNP, 16 were recorded in the first season, 18 in season 2 and 20 in season 3. While considering the frequency of occurrence across the season, expressed as the number of months during which each species was recorded, there were only three species in season 1, which were present throughout the season, compared with seven and five species in seasons 2 and 3, respectively. If species which were present in 3 to 6 months are included, 18 different species were present in season 3, 15 in season 2 and only 10 in season 1. This increase of species encounters could indicate a regular increase in species abundance, which is a good sign for the overall health of the ecosystem in Wadi Wurayah. Alternatively, the skill of the observers, which improved over the years, and the slight shift in the methodology in season 3 could also partially explain these results. Altogether, population trends are positive.
October November December January February March April
Species 1- 10
11-20
21-31
1- 10
11-20
21-30
1- 10
11-20
21-31
1- 10
11-20
21-31
1- 10
11-20
21-29
1- 10
11-20
21-30
1- 10
11-20
Anax ephippiger Ad Ad Ad Ad Ad
Anax imperator Ad Ad Mate Ad Ad Ad Ad Ad Ad Ad Ad Ad Mate Lay Ad Ad Ad
Anax parthenope Ad
Arabicnemis caerulea Ad Ad Ad Ad Ad Ad Ad Ad Ad Ad Ad Lay Ad
Arabineura khalidi Ad Ad Ad Ad Ad Ad Ad Ad Ad Ad Ad Ad Ad
Crocothemis erythraea Ad Ad Lay Lay Ad Ad Lay Ad Ad Ad Ad Ad Ad Ad Ad Ad
Crocothemis sanguinolenta Ad Ad Ad Ad Ad Ad Ad Ad Ad Ad Ad Ad Ad Ad Ad Ad
Diplacodes lefebvrei Ad Mate Ad Ad Ad Ad Ad Ad Ad Ad Ad Ad Ad Ad
Ishnura evansi Ad Lay Lay Mate Ad Ad Ad Ad Ad Mate Ad Mate Ad Ad Ad Ad Lay
Ishnura senegalensis Ad Ad Ad
Orthetrum chrysostigma Ad Ad Ad Ad Ad Ad Ad Ad Ad Ad Ad
Orthetrum ransonnetii Ad Ad Ad Ad Ad Ad
Orthetrum sabina Ad Ad Lay Ad Ad
Pantala flavescens Ad Lay Ad Ad Ad Ad Ad Ad Ad
Paragomphus sinaiticus Ad Ad Ad Ad Ad lay
Paragomphus genei
Pseudagrion decorum Ad Ad Ad
Sympetrum fonscolombii
Tramea basilaris
Trithemis annulata
Trithemis arteriosa Lay Lay Lay Lay Lay Lay Ad Lay Lay Lay Ad Ad Lay Lay Lay Lay Lay Lay
Trithemis kirbyi Ad Ad Ad Ad Ad Ad Ad Ad Ad Ad Ad
Urothemis thomasi Ad Ad Ad Ad Ad Ad
Zygonyx torridus Ad Ad Ad Ad Ad Ad
34 Marine Turtle Conservation Project Final Scientifc Report Marine Turtle Conservation Project Final Scientifc Report 35Scientific Report | Water Research and Learning Programme | Wadi Wurayah National Park | Field Season 2015–2016 3534 Scientific Report | Water Research and Learning Programme | Wadi Wurayah National Park | Field Season 2015–2016
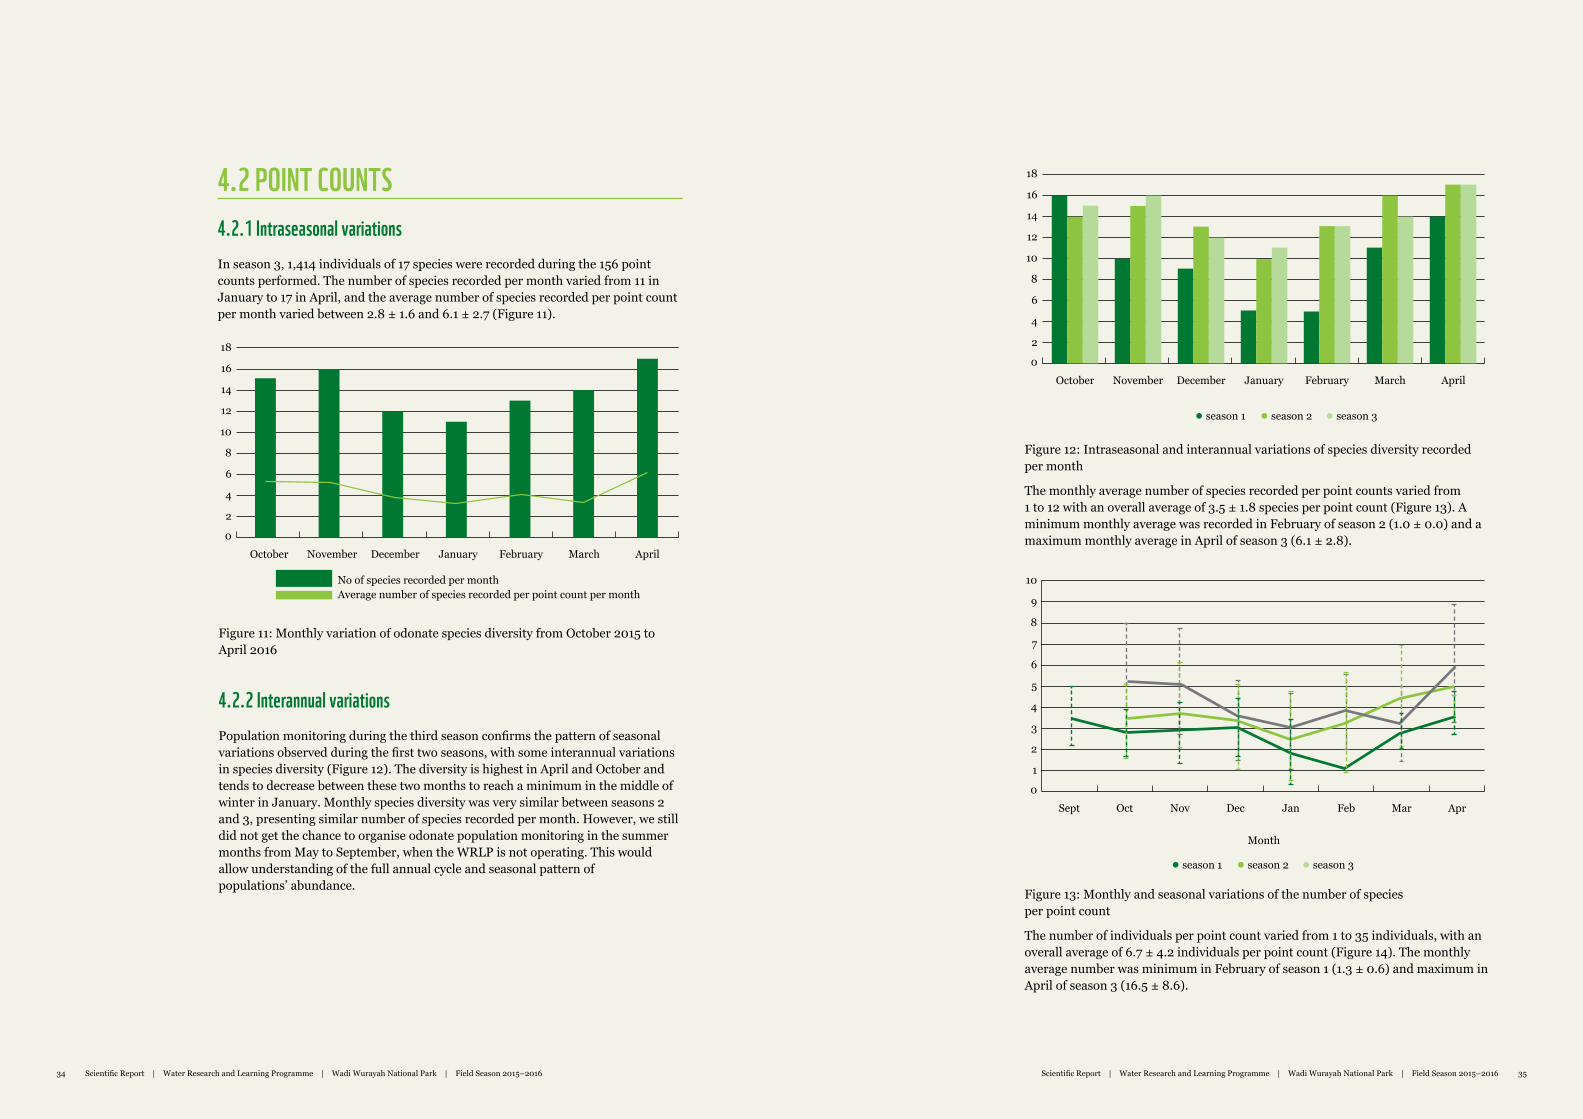
4.2 POINT COUNTS4.2.1 Intraseasonal variationsIn season 3, 1,414 individuals of 17 species were recorded during the 156 point counts performed. The number of species recorded per month varied from 11 in January to 17 in April, and the average number of species recorded per point count per month varied between 2.8 ± 1.6 and 6.1 ± 2.7 (Figure 11).
Figure 12: Intraseasonal and interannual variations of species diversity recorded per month
The monthly average number of species recorded per point counts varied from 1 to 12 with an overall average of 3.5 ± 1.8 species per point count (Figure 13). A minimum monthly average was recorded in February of season 2 (1.0 ± 0.0) and a maximum monthly average in April of season 3 (6.1 ± 2.8).
season 1 season 2 season 3
2
4
6
8
10
12
14
16
18
October November December January February March April
0
2
4
6
8
10
12
14
16
18
October November
No of species recorded per monthAverage number of species recorded per point count per month
December January February March April
0
Figure 11: Monthly variation of odonate species diversity from October 2015 to April 2016
4.2.2 Interannual variationsPopulation monitoring during the third season confirms the pattern of seasonal variations observed during the first two seasons, with some interannual variations in species diversity (Figure 12). The diversity is highest in April and October and tends to decrease between these two months to reach a minimum in the middle of winter in January. Monthly species diversity was very similar between seasons 2 and 3, presenting similar number of species recorded per month. However, we still did not get the chance to organise odonate population monitoring in the summer months from May to September, when the WRLP is not operating. This would allow understanding of the full annual cycle and seasonal pattern of populations’ abundance.
season 1 season 2
Month
season 3
1
2
3
4
5
6
7
8
9
10
Oct Nov Dec Jan Feb Mar Apr
0
Sept
Figure 13: Monthly and seasonal variations of the number of species per point count
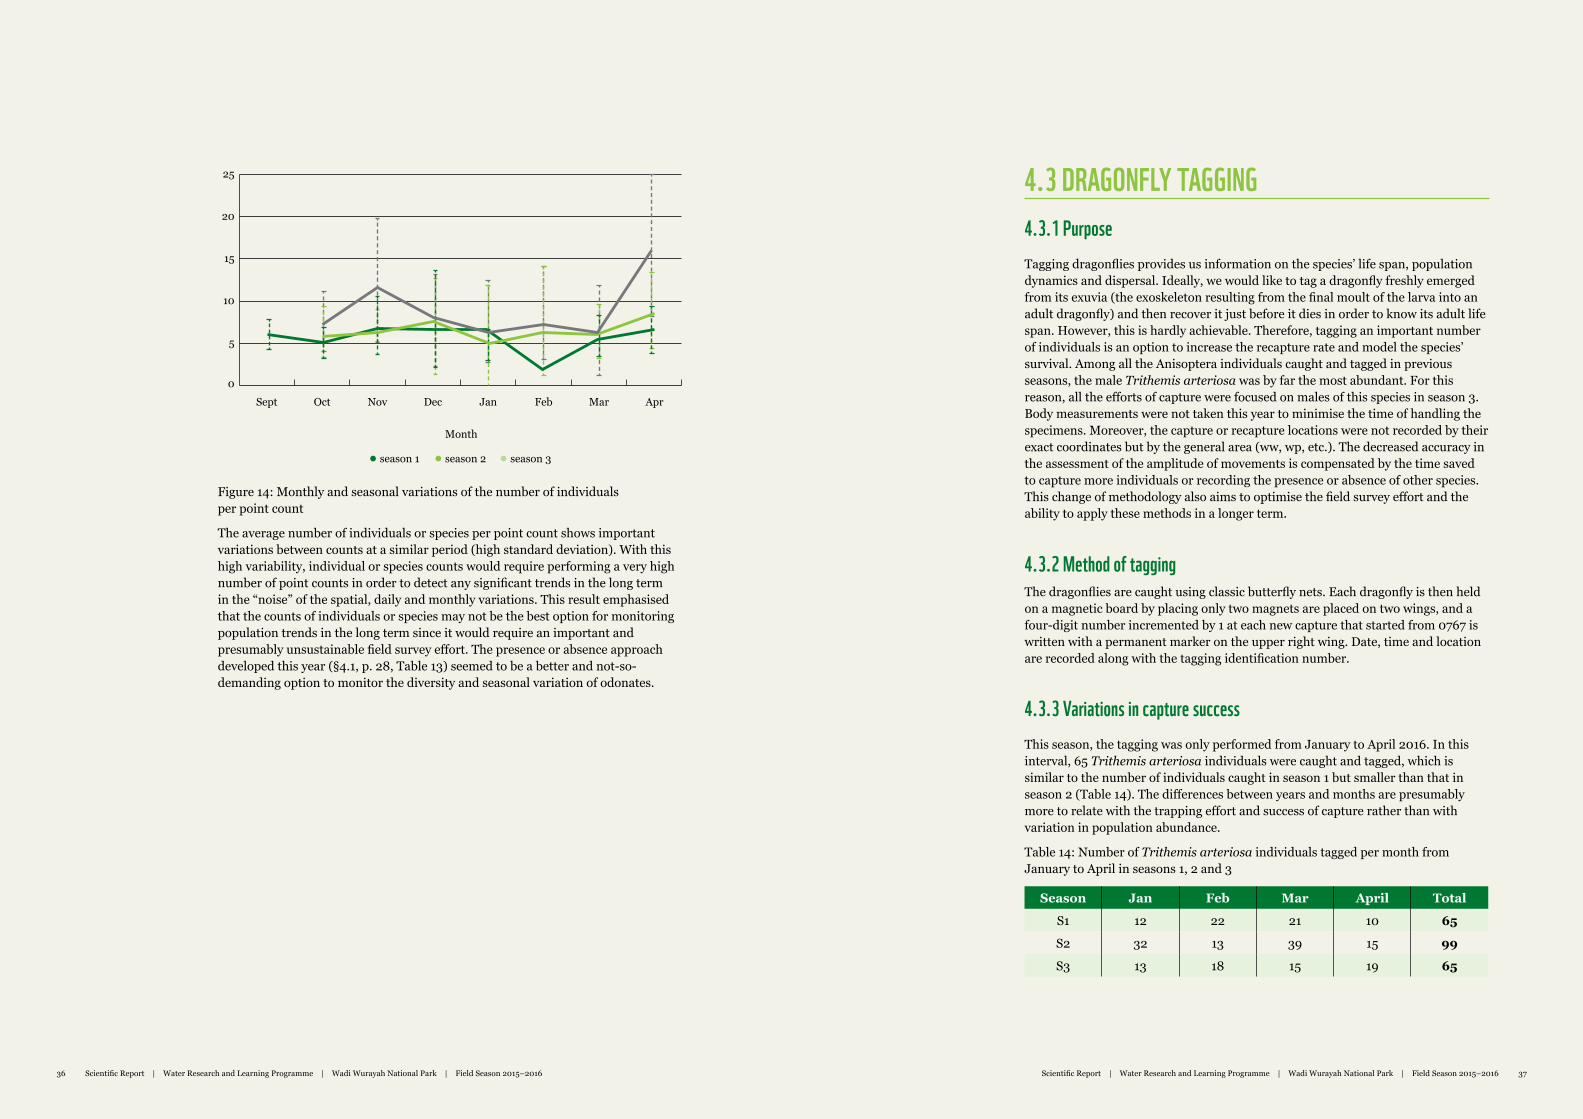
The number of individuals per point count varied from 1 to 35 individuals, with an overall average of 6.7 ± 4.2 individuals per point count (Figure 14). The monthly average number was minimum in February of season 1 (1.3 ± 0.6) and maximum in April of season 3 (16.5 ± 8.6).
36 Marine Turtle Conservation Project Final Scientifc Report Marine Turtle Conservation Project Final Scientifc Report 37Scientific Report | Water Research and Learning Programme | Wadi Wurayah National Park | Field Season 2015–2016 3736 Scientific Report | Water Research and Learning Programme | Wadi Wurayah National Park | Field Season 2015–2016
Figure 14: Monthly and seasonal variations of the number of individuals per point count
The average number of individuals or species per point count shows important variations between counts at a similar period (high standard deviation). With this high variability, individual or species counts would require performing a very high number of point counts in order to detect any significant trends in the long term in the “noise” of the spatial, daily and monthly variations. This result emphasised that the counts of individuals or species may not be the best option for monitoring population trends in the long term since it would require an important and presumably unsustainable field survey effort. The presence or absence approach developed this year (§4.1, p. 28, Table 13) seemed to be a better and not-so-demanding option to monitor the diversity and seasonal variation of odonates.
4.3 DRAGONFLY TAGGING4.3.1 PurposeTagging dragonflies provides us information on the species’ life span, population dynamics and dispersal. Ideally, we would like to tag a dragonfly freshly emerged from its exuvia (the exoskeleton resulting from the final moult of the larva into an adult dragonfly) and then recover it just before it dies in order to know its adult life span. However, this is hardly achievable. Therefore, tagging an important number of individuals is an option to increase the recapture rate and model the species’ survival. Among all the Anisoptera individuals caught and tagged in previous seasons, the male Trithemis arteriosa was by far the most abundant. For this reason, all the efforts of capture were focused on males of this species in season 3. Body measurements were not taken this year to minimise the time of handling the specimens. Moreover, the capture or recapture locations were not recorded by their exact coordinates but by the general area (ww, wp, etc.). The decreased accuracy in the assessment of the amplitude of movements is compensated by the time saved to capture more individuals or recording the presence or absence of other species. This change of methodology also aims to optimise the field survey effort and the ability to apply these methods in a longer term.
4.3.2 Method of taggingThe dragonflies are caught using classic butterfly nets. Each dragonfly is then held on a magnetic board by placing only two magnets are placed on two wings, and a four-digit number incremented by 1 at each new capture that started from 0767 is written with a permanent marker on the upper right wing. Date, time and location are recorded along with the tagging identification number.
4.3.3 Variations in capture successThis season, the tagging was only performed from January to April 2016. In this interval, 65 Trithemis arteriosa individuals were caught and tagged, which is similar to the number of individuals caught in season 1 but smaller than that in season 2 (Table 14). The differences between years and months are presumably more to relate with the trapping effort and success of capture rather than with variation in population abundance.
Table 14: Number of Trithemis arteriosa individuals tagged per month from January to April in seasons 1, 2 and 3
Season Jan Feb Mar April Total
S1 12 22 21 10 65
S2 32 13 39 15 99
S3 13 18 15 19 65
season 1 season 2
Month
season 3
5
10
15
20
25
Oct Nov Dec Jan Feb Mar Apr
0
Sept
38 Marine Turtle Conservation Project Final Scientifc Report Marine Turtle Conservation Project Final Scientifc Report 39Scientific Report | Water Research and Learning Programme | Wadi Wurayah National Park | Field Season 2015–2016 3938 Scientific Report | Water Research and Learning Programme | Wadi Wurayah National Park | Field Season 2015–2016
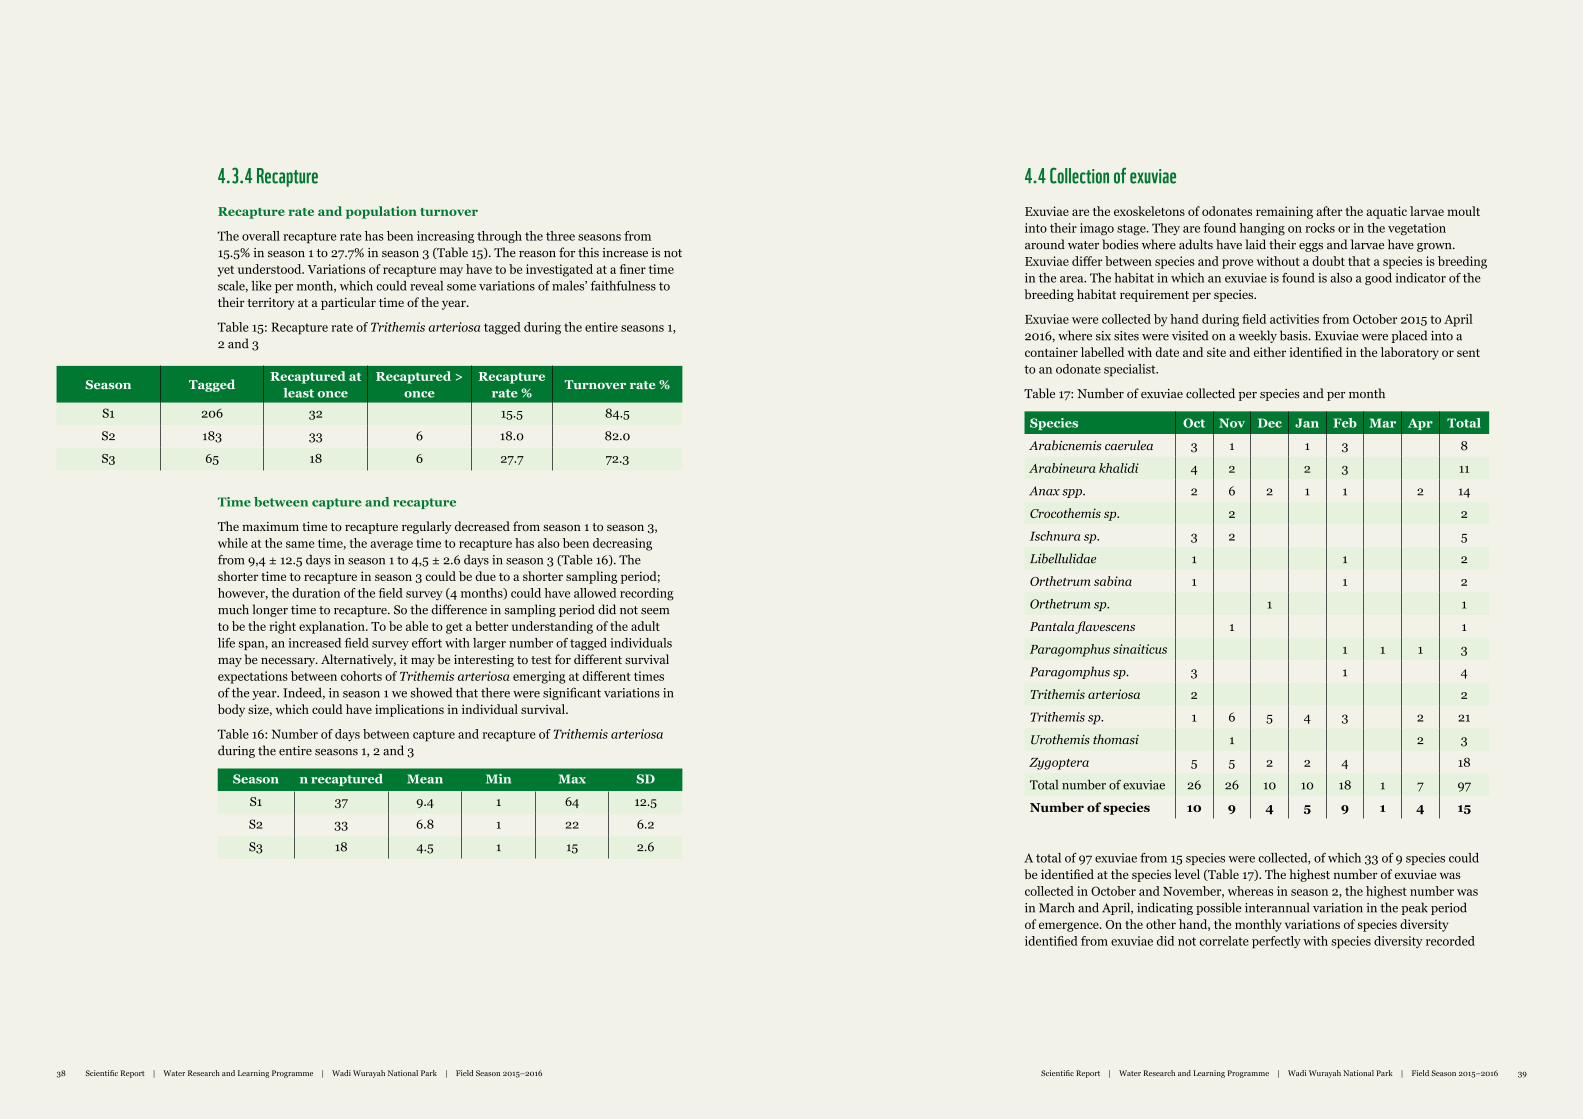
4.3.4 RecaptureRecapture rate and population turnover
The overall recapture rate has been increasing through the three seasons from 15.5% in season 1 to 27.7% in season 3 (Table 15). The reason for this increase is not yet understood. Variations of recapture may have to be investigated at a finer time scale, like per month, which could reveal some variations of males’ faithfulness to their territory at a particular time of the year.
Table 15: Recapture rate of Trithemis arteriosa tagged during the entire seasons 1, 2 and 3
4.4 Collection of exuviaeExuviae are the exoskeletons of odonates remaining after the aquatic larvae moult into their imago stage. They are found hanging on rocks or in the vegetation around water bodies where adults have laid their eggs and larvae have grown. Exuviae differ between species and prove without a doubt that a species is breeding in the area. The habitat in which an exuviae is found is also a good indicator of the breeding habitat requirement per species.
Exuviae were collected by hand during field activities from October 2015 to April 2016, where six sites were visited on a weekly basis. Exuviae were placed into a container labelled with date and site and either identified in the laboratory or sent to an odonate specialist.
Table 17: Number of exuviae collected per species and per month
Species Oct Nov Dec Jan Feb Mar Apr Total
Arabicnemis caerulea 3 1 1 3 8
Arabineura khalidi 4 2 2 3 11
Anax spp. 2 6 2 1 1 2 14
Crocothemis sp. 2 2
Ischnura sp. 3 2 5
Libellulidae 1 1 2
Orthetrum sabina 1 1 2
Orthetrum sp. 1 1
Pantala flavescens 1 1
Paragomphus sinaiticus 1 1 1 3
Paragomphus sp. 3 1 4
Trithemis arteriosa 2 2
Trithemis sp. 1 6 5 4 3 2 21
Urothemis thomasi 1 2 3
Zygoptera 5 5 2 2 4 18
Total number of exuviae 26 26 10 10 18 1 7 97
Number of species 10 9 4 5 9 1 4 15
A total of 97 exuviae from 15 species were collected, of which 33 of 9 species could be identified at the species level (Table 17). The highest number of exuviae was collected in October and November, whereas in season 2, the highest number was in March and April, indicating possible interannual variation in the peak period of emergence. On the other hand, the monthly variations of species diversity identified from exuviae did not correlate perfectly with species diversity recorded
Season Tagged Recaptured at least once
Recaptured > once
Recapture rate % Turnover rate %
S1 206 32 15.5 84.5
S2 183 33 6 18.0 82.0
S3 65 18 6 27.7 72.3
Time between capture and recapture
The maximum time to recapture regularly decreased from season 1 to season 3, while at the same time, the average time to recapture has also been decreasing from 9,4 ± 12.5 days in season 1 to 4,5 ± 2.6 days in season 3 (Table 16). The shorter time to recapture in season 3 could be due to a shorter sampling period; however, the duration of the field survey (4 months) could have allowed recording much longer time to recapture. So the difference in sampling period did not seem to be the right explanation. To be able to get a better understanding of the adult life span, an increased field survey effort with larger number of tagged individuals may be necessary. Alternatively, it may be interesting to test for different survival expectations between cohorts of Trithemis arteriosa emerging at different times of the year. Indeed, in season 1 we showed that there were significant variations in body size, which could have implications in individual survival.
Table 16: Number of days between capture and recapture of Trithemis arteriosa during the entire seasons 1, 2 and 3
Season n recaptured Mean Min Max SD
S1 37 9.4 1 64 12.5
S2 33 6.8 1 22 6.2
S3 18 4.5 1 15 2.6
40 Marine Turtle Conservation Project Final Scientifc Report Marine Turtle Conservation Project Final Scientifc Report 41Scientific Report | Water Research and Learning Programme | Wadi Wurayah National Park | Field Season 2015–2016 4140 Scientific Report | Water Research and Learning Programme | Wadi Wurayah National Park | Field Season 2015–2016
by presence or absence records on point counts (Table 18). In March and April, one and four species were found by exuviae collection and identification, while the species diversity assessed on point counts was 14 and 17 species, respectively. The peak of emergence from exuviae was recorded in February. The causes of this important differences will have to be explored, whether this is resulting from data artefact or translating a real biological phenomenon. A plausible explanation is that exuviae may have been washed away during the rainfall events that occurred in the beginning of March, which could result in less exuviae being found. However, no rainfalls were recorded in April, and the exuviae diversity stayed low, while the diversity of adults was at its maximum.
Table 18: Comparison of species diversity per month determined from exuviae collection and from presence or absence records of flying adults
Species diversity Oct Nov Dec Jan Feb Mar Apr TotalExuviae species diversity 10 9 4 5 9 1 4 15Flying adults diversity 15 16 12 11 13 14 17 20
The sampling of exuviae is an excellent and important method to get an overall insight into the presence and breeding of odonates in Wadi Wurayah. A greater effort on collecting exuviae may be necessary to see a clearer pattern.
5.1 PURPOSEBecause of the nature of their life cycles, amphibians have long been considered good indicators of ecosystem health and good water quality. They are highly sensitive to aquatic pollution during all phases of their life (Boyer and Grue 1995). The two species of amphibians present in the UAE, the Arabian toad (Sclerophrys arabica) and the Dhofar toad (Duttaphrynus dhufarensis), are both living in Wadi Wurayah. They are both primary consumers at the larval stage and secondary consumers as adults, are linked to freshwater habitats to survive, but have different ecologies (Soorae et al. 2013). The Arabian toad, more dependent on permanent water than the Dhofar toad, is much more abundant, or at least more visible, in the park. The Dhofar toad, which is a more opportunistic breeder, stays nearly invisible all year long but appears in numbers just after rainfalls to lay eggs in temporary pools. These differences in ecology and dependence on water make these two species an excellent model to study the effects of climate change in the Hajar Mountains ecosystems and to determine how different breeding strategies can favour or not a species.
The purpose of this study was to perform the following:
1. Assess and monitor toads’ abundance and their spatiotemporal variations
2. Estimate their population size
3. Assess their population dynamic
5.2 SAMPLINGToads were captured from October 2015 to April 2016 at eight different sampling locations. Toads were actively searched visually and captured using hand nets within a 20 m diameter area for 37 minutes on average and placed into a bucket partially filled with water. All individuals were then measured, and some of them were tagged.
Following the criteria adopted by Pyke (2005), toads whose snout-vent length (SVL) exceeded 40 mm, were fitted with passive integrated transponder (PIT) tags, allowing detection using a portable handheld reader. PIT tags (biocompatible glass-encapsulated tags, 134.2 kHz radio frequency 8.4 mm, Biomark) were loaded into a disposable needle and injected subcutaneously in the postdorsal position.
Toads’ measurements included SVL, which is defined as the distance between the tip of the head and the end of the cloaca (to the nearest 0.1 mm); rear leg length (RLL), which is the distance between the foot and the end of the cloaca (to the nearest 0. 1 mm); and body weight (to the nearest 0.1g). At all locations, water quality parameters and meteorological conditions were recorded.
5. TOAD POPULATION STUDY
42 Marine Turtle Conservation Project Final Scientifc Report Marine Turtle Conservation Project Final Scientifc Report 43Scientific Report | Water Research and Learning Programme | Wadi Wurayah National Park | Field Season 2015–2016 4342 Scientific Report | Water Research and Learning Programme | Wadi Wurayah National Park | Field Season 2015–2016
5.3 POPULATION ABUNDANCEA total of 354 Arabian toads were counted during 106 point counts distributed among the eight sampling locations. The average number caught per point count was 3.3 ± 3.6 (min–max 0–15, n=106). No Dhofar toads were found.
5.3.1 Spatiotemporal variationsToads’ abundance showed important variations in time and between locations (Table 19). The highest number of toads was at the start of the season in October and November. The number of toads decreased from December to February and started to increase again in March. The pool downstream of the gorge in the main branch of Wadi Wurayah had the highest abundance.
Table 19: Number of toads caught per point count (mean ± SD) according to month and sampling location; (–): no point counts performed, (0): no toads found
5.4 VARIATION IN BODY SIZEAll the 354 Arabian toads captured were measured and released. The average body weight was 5.3 ± 2.6 g (min–max 0.5–19.5 g), the average body length was 39 ± 6.2 mm (min–max 21.5–59 mm), and the average rear leg length was 34.5 ± 6 mm (min–max 18.2–54.4 mm).
The average size of the toads varied by time and location, with the bigger toads found in March at the fish spa (Table 20).
Table 20: The body weight of the toads caught per point count (mean ± SD, n=354) according to month and sampling location; (–) no point counts performed or no toads found
Waterfall area Wadi Wurayah Mean Waterfall
1Waterfall
2Pool Stream Downstream
1Downstream
2Fish spa Gorge
Oct. 8 ± 5. 6 6 – – 11.7 ± 3 5 – – 8.4 ± 4.1
Nov. 9.3 ± 5 8.7 ± 1.5 – – 9 ±3.4 6 ± 1.8 – – 8.1 ± 3.1
Dec. 4 ± 1.7 3.3 ± 2 6 3.5 ± 0.7 6.5 ±2.1 1.5 ± 0.7 – 0 3.6 ± 2.2
Jan. 0 1 ± 1.4 3 – 0.5 ± 0.5 0.2 ± 0.5 1 – 0.6 ± 0.9
Feb. 0 1 – – 1 ± 1.73 0.3 ± 0.5 – 0 0.5 ± 0.9
Mar. 0 3.8 ± 2.2 1.7± 0.9 5 ± 4 1 ± 1 1 ± 1.4 4.5 ± 1.3 0 2.5 ± 2.5
Apr. 2.6 ± 2 0 1 ± 1.4 1 4 ± 1.4 2 2 0 1.9 ± 1.6
Mean 3.6 ± 4.4 3.6 ± 3.1 2.2±1.8 4 ± 3.2 4.7 ± 4.7 2.1 ± 2.4 3.5 ± 1.8 0 3.3± 3.6
Waterfall area Wadi Wurayah Mean
Waterfall 1
Waterfall 2
Pool Stream Downstream 1
Downstream 2
Fish spa Gorge
Oct. 5.2 ± 2.4 5.8 ± 1.3 – – 5.4 ± 2.6 5.2 ± 3.6 – – 5.4 ± 2.4.
Nov. 5.4 ± 3 5.5 ± 2.2 – – 5.4 ± 2.6 3.9 ± 2.6 – – 5.1 ± 2.7
Dec. 4.8 ± 2.2 5 ± 2.4 5.5 ± 1.5
4.1 ± 1 5.4 ± 3 3.7 ± 2.1 – – 4.9 ± 2.2
Jan. – 5.4 ± 1.9 5.3 ± 1.5
– 2 2 9 – 4.8 ± 2.4
Feb. – 6.8 ± 0.4 – 3.5 ± 1.8 3 – – 4.5 ± 2.1
Mar. – 7 ± 2.3 6.2 ± 3.2
4.1 ± 1.4 5.2 ± 2.5 10.1 ± 7.4 6.1 ± 2.5 – 6.1 ± 3.2
Apr. 6.3 ± 1.4 – 4.8 ± 0.4
4 5.4 ± 1.1 7 ± 4.1 5 – 5.8 ± 1.9
Mean 5.6 ± 2.7 5.7 ± 2.1 5.7 ± 2.2
4.1 ± 1.3 5.3 ± 2.5 4.8 ± 3.8 6.1 ± 2.4 – 5.4 ± 2.6
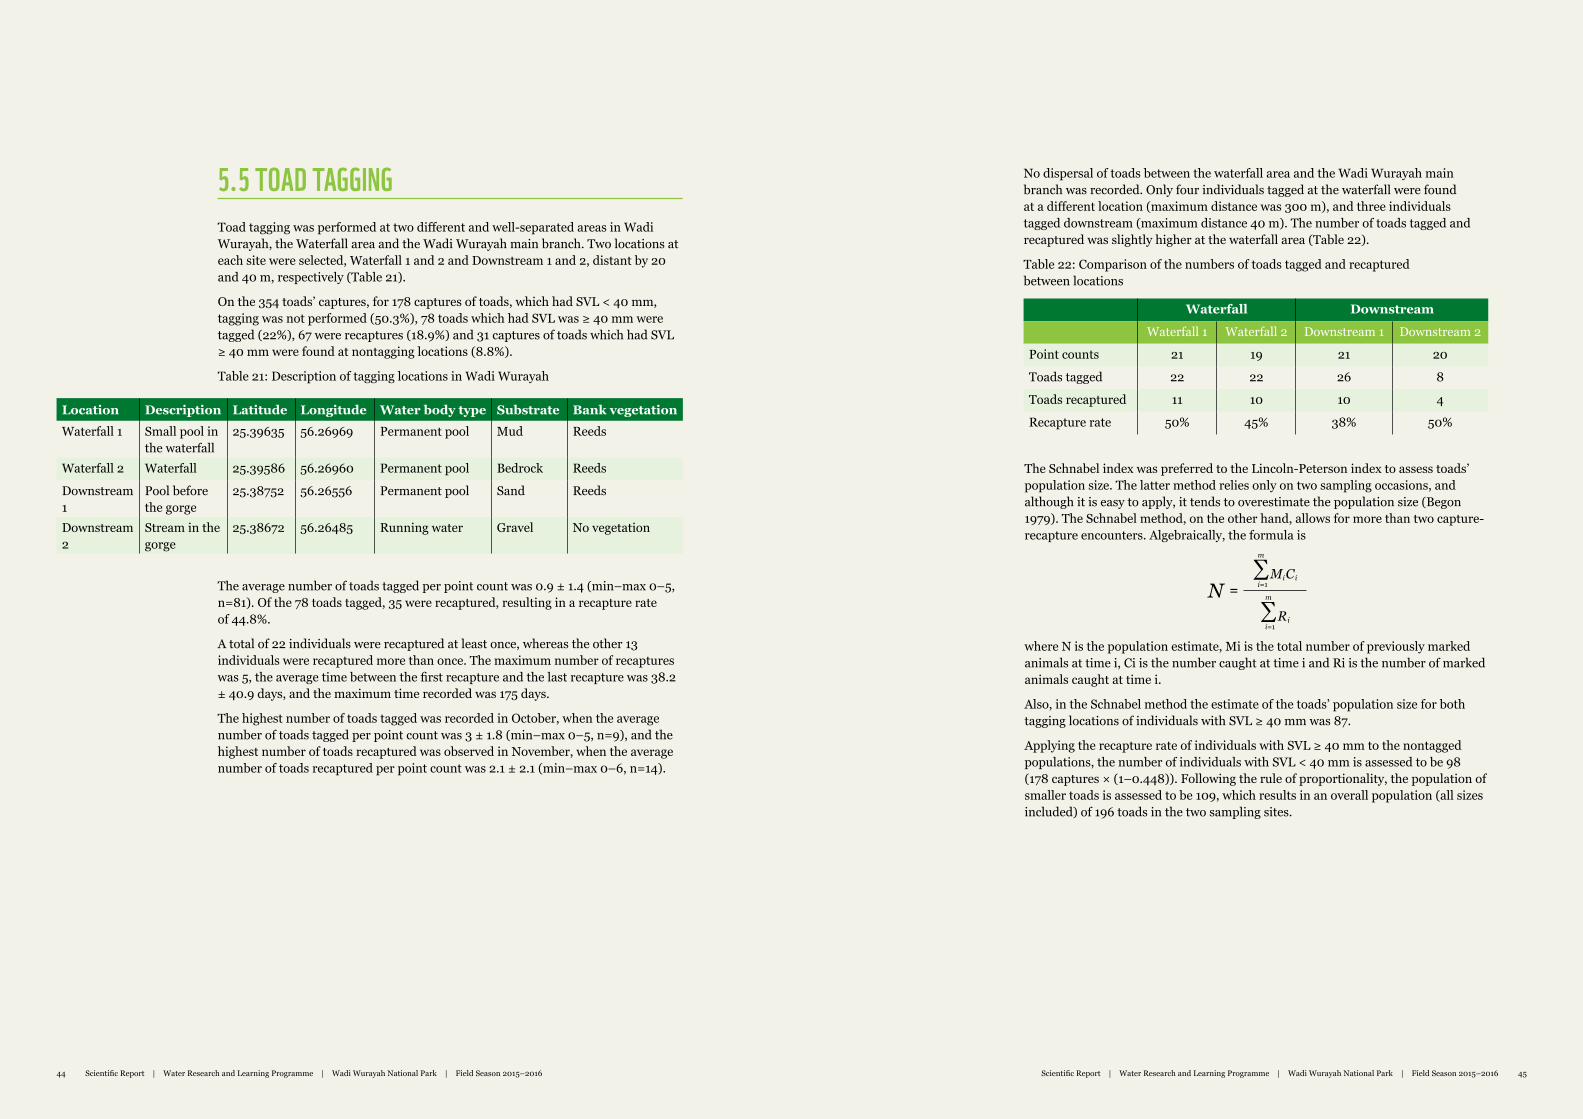
44 Marine Turtle Conservation Project Final Scientifc Report Marine Turtle Conservation Project Final Scientifc Report 45Scientific Report | Water Research and Learning Programme | Wadi Wurayah National Park | Field Season 2015–2016 4544 Scientific Report | Water Research and Learning Programme | Wadi Wurayah National Park | Field Season 2015–2016
5.5 TOAD TAGGINGToad tagging was performed at two different and well-separated areas in Wadi Wurayah, the Waterfall area and the Wadi Wurayah main branch. Two locations at each site were selected, Waterfall 1 and 2 and Downstream 1 and 2, distant by 20 and 40 m, respectively (Table 21).
On the 354 toads’ captures, for 178 captures of toads, which had SVL < 40 mm, tagging was not performed (50.3%), 78 toads which had SVL was ≥ 40 mm were tagged (22%), 67 were recaptures (18.9%) and 31 captures of toads which had SVL ≥ 40 mm were found at nontagging locations (8.8%).
Table 21: Description of tagging locations in Wadi Wurayah
No dispersal of toads between the waterfall area and the Wadi Wurayah main branch was recorded. Only four individuals tagged at the waterfall were found at a different location (maximum distance was 300 m), and three individuals tagged downstream (maximum distance 40 m). The number of toads tagged and recaptured was slightly higher at the waterfall area (Table 22).
Table 22: Comparison of the numbers of toads tagged and recaptured between locations
Waterfall Downstream
Waterfall 1 Waterfall 2 Downstream 1 Downstream 2
Point counts 21 19 21 20
Toads tagged 22 22 26 8
Toads recaptured 11 10 10 4
Recapture rate 50% 45% 38% 50%Location Description Latitude Longitude Water body type Substrate Bank vegetationWaterfall 1 Small pool in
the waterfall 25.39635 56.26969 Permanent pool Mud Reeds
Waterfall 2 Waterfall 25.39586 56.26960 Permanent pool Bedrock Reeds
Downstream 1
Pool before the gorge
25.38752 56.26556 Permanent pool Sand Reeds
Downstream 2
Stream in the gorge
25.38672 56.26485 Running water Gravel No vegetation
The average number of toads tagged per point count was 0.9 ± 1.4 (min–max 0–5, n=81). Of the 78 toads tagged, 35 were recaptured, resulting in a recapture rate of 44.8%.
A total of 22 individuals were recaptured at least once, whereas the other 13 individuals were recaptured more than once. The maximum number of recaptures was 5, the average time between the first recapture and the last recapture was 38.2 ± 40.9 days, and the maximum time recorded was 175 days.
The highest number of toads tagged was recorded in October, when the average number of toads tagged per point count was 3 ± 1.8 (min–max 0–5, n=9), and the highest number of toads recaptured was observed in November, when the average number of toads recaptured per point count was 2.1 ± 2.1 (min–max 0–6, n=14).
The Schnabel index was preferred to the Lincoln-Peterson index to assess toads’ population size. The latter method relies only on two sampling occasions, and although it is easy to apply, it tends to overestimate the population size (Begon 1979). The Schnabel method, on the other hand, allows for more than two capture-recapture encounters. Algebraically, the formula is
where N is the population estimate, Mi is the total number of previously marked animals at time i, Ci is the number caught at time i and Ri is the number of marked animals caught at time i.
Also, in the Schnabel method the estimate of the toads’ population size for both tagging locations of individuals with SVL ≥ 40 mm was 87.
Applying the recapture rate of individuals with SVL ≥ 40 mm to the nontagged populations, the number of individuals with SVL < 40 mm is assessed to be 98 (178 captures × (1–0.448)). Following the rule of proportionality, the population of smaller toads is assessed to be 109, which results in an overall population (all sizes included) of 196 toads in the two sampling sites.
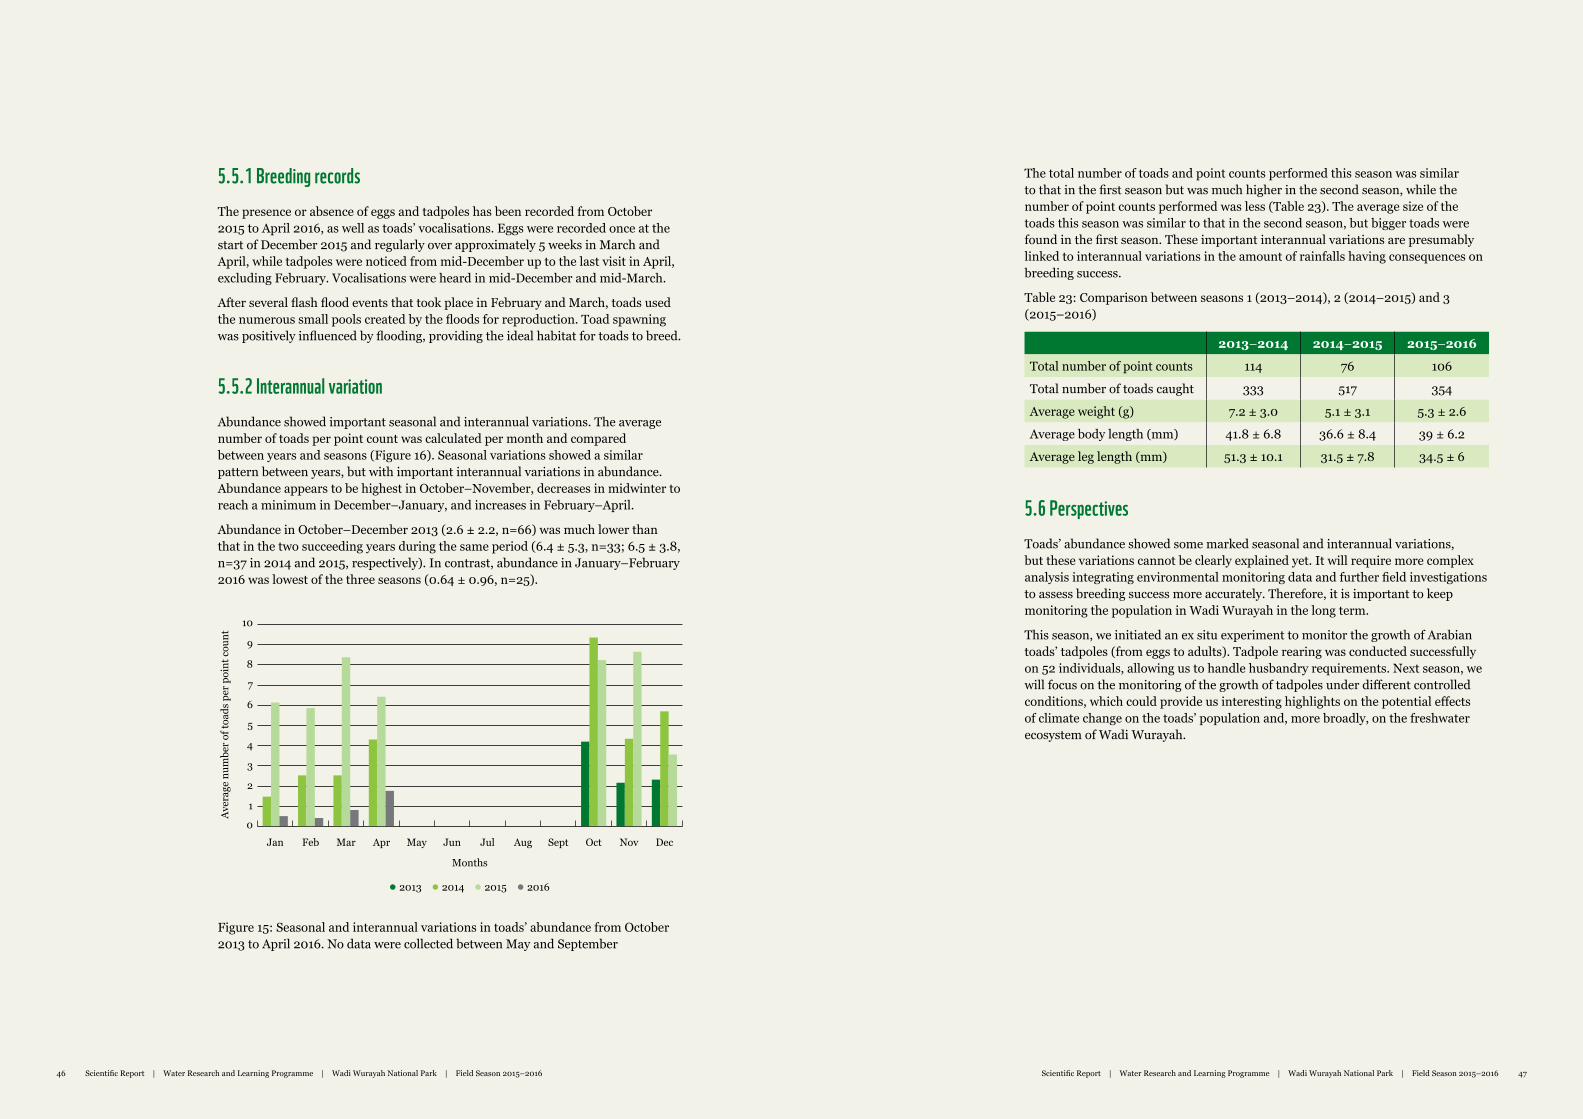
46 Marine Turtle Conservation Project Final Scientifc Report Marine Turtle Conservation Project Final Scientifc Report 47Scientific Report | Water Research and Learning Programme | Wadi Wurayah National Park | Field Season 2015–2016 4746 Scientific Report | Water Research and Learning Programme | Wadi Wurayah National Park | Field Season 2015–2016
5.5.1 Breeding recordsThe presence or absence of eggs and tadpoles has been recorded from October 2015 to April 2016, as well as toads’ vocalisations. Eggs were recorded once at the start of December 2015 and regularly over approximately 5 weeks in March and April, while tadpoles were noticed from mid-December up to the last visit in April, excluding February. Vocalisations were heard in mid-December and mid-March.
After several flash flood events that took place in February and March, toads used the numerous small pools created by the floods for reproduction. Toad spawning was positively influenced by flooding, providing the ideal habitat for toads to breed.
5.5.2 Interannual variationAbundance showed important seasonal and interannual variations. The average number of toads per point count was calculated per month and compared between years and seasons (Figure 16). Seasonal variations showed a similar pattern between years, but with important interannual variations in abundance. Abundance appears to be highest in October–November, decreases in midwinter to reach a minimum in December–January, and increases in February–April.
Abundance in October–December 2013 (2.6 ± 2.2, n=66) was much lower than that in the two succeeding years during the same period (6.4 ± 5.3, n=33; 6.5 ± 3.8, n=37 in 2014 and 2015, respectively). In contrast, abundance in January–February 2016 was lowest of the three seasons (0.64 ± 0.96, n=25).
The total number of toads and point counts performed this season was similar to that in the first season but was much higher in the second season, while the number of point counts performed was less (Table 23). The average size of the toads this season was similar to that in the second season, but bigger toads were found in the first season. These important interannual variations are presumably linked to interannual variations in the amount of rainfalls having consequences on breeding success.
Table 23: Comparison between seasons 1 (2013–2014), 2 (2014–2015) and 3 (2015–2016)
2013–2014 2014–2015 2015–2016
Total number of point counts 114 76 106
Total number of toads caught 333 517 354
Average weight (g) 7.2 ± 3.0 5.1 ± 3.1 5.3 ± 2.6
Average body length (mm) 41.8 ± 6.8 36.6 ± 8.4 39 ± 6.2
Average leg length (mm) 51.3 ± 10.1 31.5 ± 7.8 34.5 ± 6
5.6 PerspectivesToads’ abundance showed some marked seasonal and interannual variations, but these variations cannot be clearly explained yet. It will require more complex analysis integrating environmental monitoring data and further field investigations to assess breeding success more accurately. Therefore, it is important to keep monitoring the population in Wadi Wurayah in the long term.
This season, we initiated an ex situ experiment to monitor the growth of Arabian toads’ tadpoles (from eggs to adults). Tadpole rearing was conducted successfully on 52 individuals, allowing us to handle husbandry requirements. Next season, we will focus on the monitoring of the growth of tadpoles under different controlled conditions, which could provide us interesting highlights on the potential effects of climate change on the toads’ population and, more broadly, on the freshwater ecosystem of Wadi Wurayah.
Figure 15: Seasonal and interannual variations in toads’ abundance from October 2013 to April 2016. No data were collected between May and September
2013 2014 2015 2016
1
2
3
4
5
6
7
8
9
10
Jan Feb Mar Apr May Jun Jul Aug Sept Oct Nov Dec
Months
0
Aver
age
num
ber o
f toa
ds p
er p
oint
cou
nt
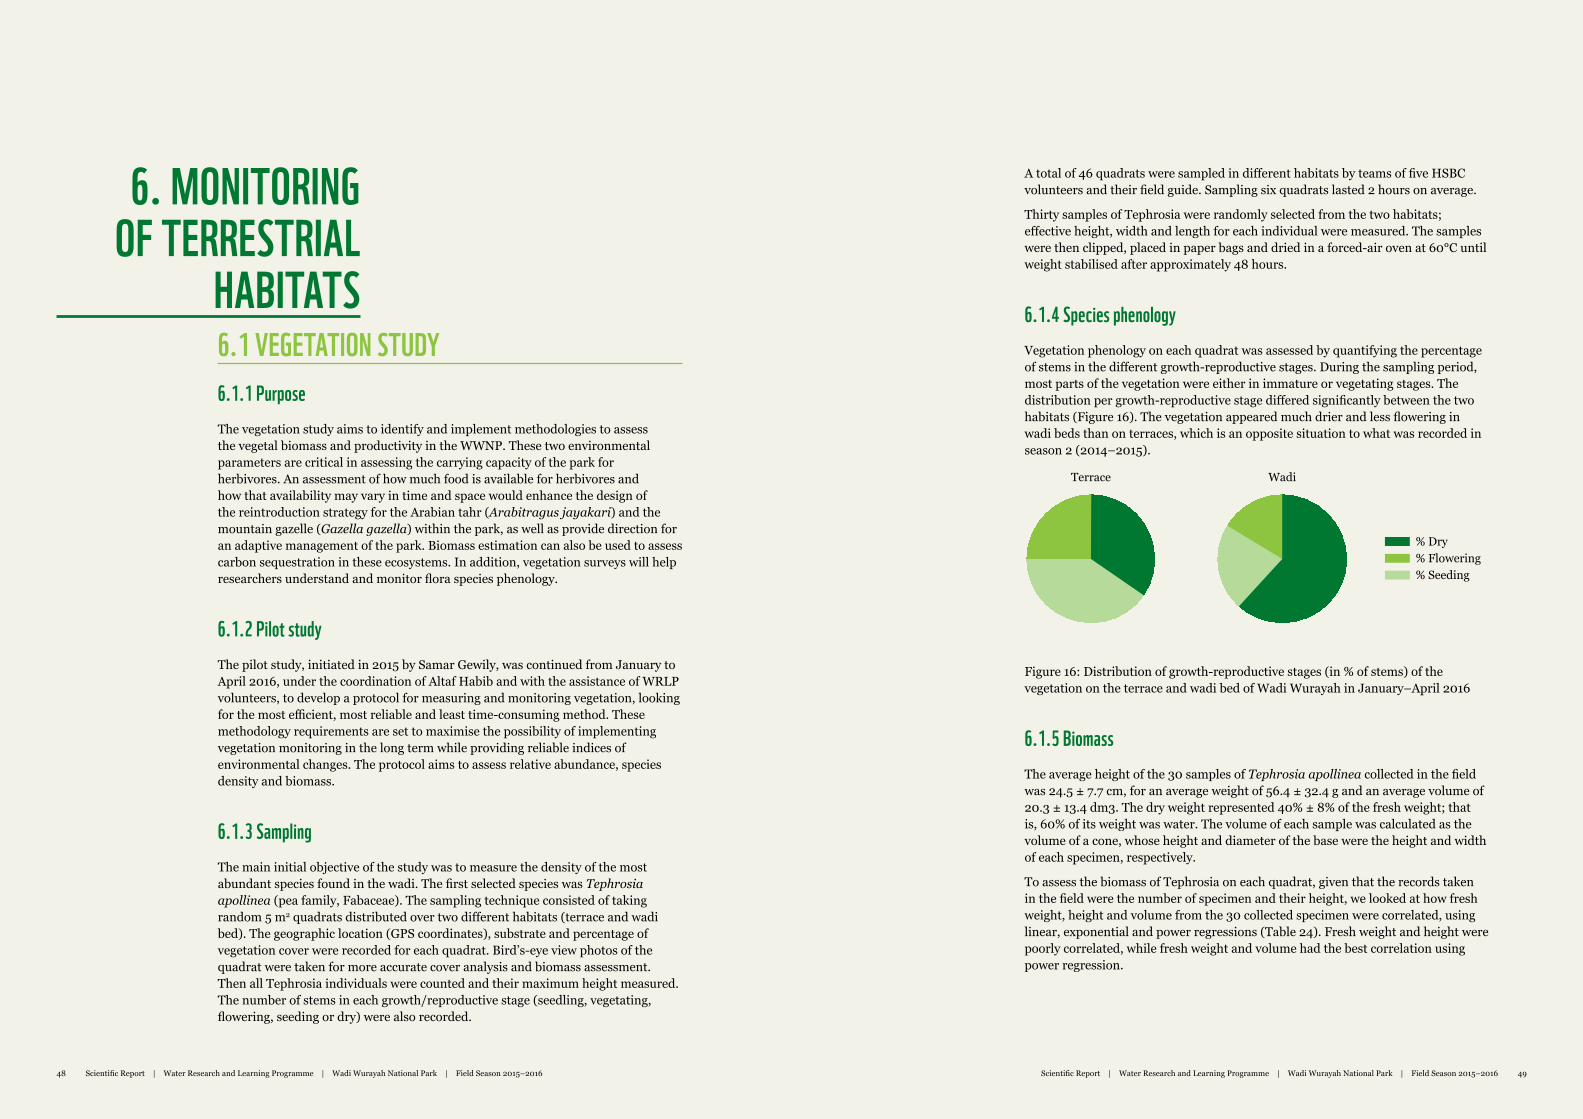
48 Marine Turtle Conservation Project Final Scientifc Report Marine Turtle Conservation Project Final Scientifc Report 49Scientific Report | Water Research and Learning Programme | Wadi Wurayah National Park | Field Season 2015–2016 4948 Scientific Report | Water Research and Learning Programme | Wadi Wurayah National Park | Field Season 2015–2016
6.1 VEGETATION STUDY6.1.1 Purpose The vegetation study aims to identify and implement methodologies to assess the vegetal biomass and productivity in the WWNP. These two environmental parameters are critical in assessing the carrying capacity of the park for herbivores. An assessment of how much food is available for herbivores and how that availability may vary in time and space would enhance the design of the reintroduction strategy for the Arabian tahr (Arabitragus jayakari) and the mountain gazelle (Gazella gazella) within the park, as well as provide direction for an adaptive management of the park. Biomass estimation can also be used to assess carbon sequestration in these ecosystems. In addition, vegetation surveys will help researchers understand and monitor flora species phenology.
6.1.2 Pilot study The pilot study, initiated in 2015 by Samar Gewily, was continued from January to April 2016, under the coordination of Altaf Habib and with the assistance of WRLP volunteers, to develop a protocol for measuring and monitoring vegetation, looking for the most efficient, most reliable and least time-consuming method. These methodology requirements are set to maximise the possibility of implementing vegetation monitoring in the long term while providing reliable indices of environmental changes. The protocol aims to assess relative abundance, species density and biomass.
6.1.3 Sampling The main initial objective of the study was to measure the density of the most abundant species found in the wadi. The first selected species was Tephrosia apollinea (pea family, Fabaceae). The sampling technique consisted of taking random 5 m2 quadrats distributed over two different habitats (terrace and wadi bed). The geographic location (GPS coordinates), substrate and percentage of vegetation cover were recorded for each quadrat. Bird’s-eye view photos of the quadrat were taken for more accurate cover analysis and biomass assessment. Then all Tephrosia individuals were counted and their maximum height measured. The number of stems in each growth/reproductive stage (seedling, vegetating, flowering, seeding or dry) were also recorded.
A total of 46 quadrats were sampled in different habitats by teams of five HSBC volunteers and their field guide. Sampling six quadrats lasted 2 hours on average.
Thirty samples of Tephrosia were randomly selected from the two habitats; effective height, width and length for each individual were measured. The samples were then clipped, placed in paper bags and dried in a forced-air oven at 60°C until weight stabilised after approximately 48 hours.
6.1.4 Species phenology Vegetation phenology on each quadrat was assessed by quantifying the percentage of stems in the different growth-reproductive stages. During the sampling period, most parts of the vegetation were either in immature or vegetating stages. The distribution per growth-reproductive stage differed significantly between the two habitats (Figure 16). The vegetation appeared much drier and less flowering in wadi beds than on terraces, which is an opposite situation to what was recorded in season 2 (2014–2015).
Figure 16: Distribution of growth-reproductive stages (in % of stems) of the vegetation on the terrace and wadi bed of Wadi Wurayah in January–April 2016
6.1.5 Biomass The average height of the 30 samples of Tephrosia apollinea collected in the field was 24.5 ± 7.7 cm, for an average weight of 56.4 ± 32.4 g and an average volume of 20.3 ± 13.4 dm3. The dry weight represented 40% ± 8% of the fresh weight; that is, 60% of its weight was water. The volume of each sample was calculated as the volume of a cone, whose height and diameter of the base were the height and width of each specimen, respectively.
To assess the biomass of Tephrosia on each quadrat, given that the records taken in the field were the number of specimen and their height, we looked at how fresh weight, height and volume from the 30 collected specimen were correlated, using linear, exponential and power regressions (Table 24). Fresh weight and height were poorly correlated, while fresh weight and volume had the best correlation using power regression.
6. MONITORING OF TERRESTRIAL
HABITATS
WadiTerrace
% Dry% Flowering% Seeding
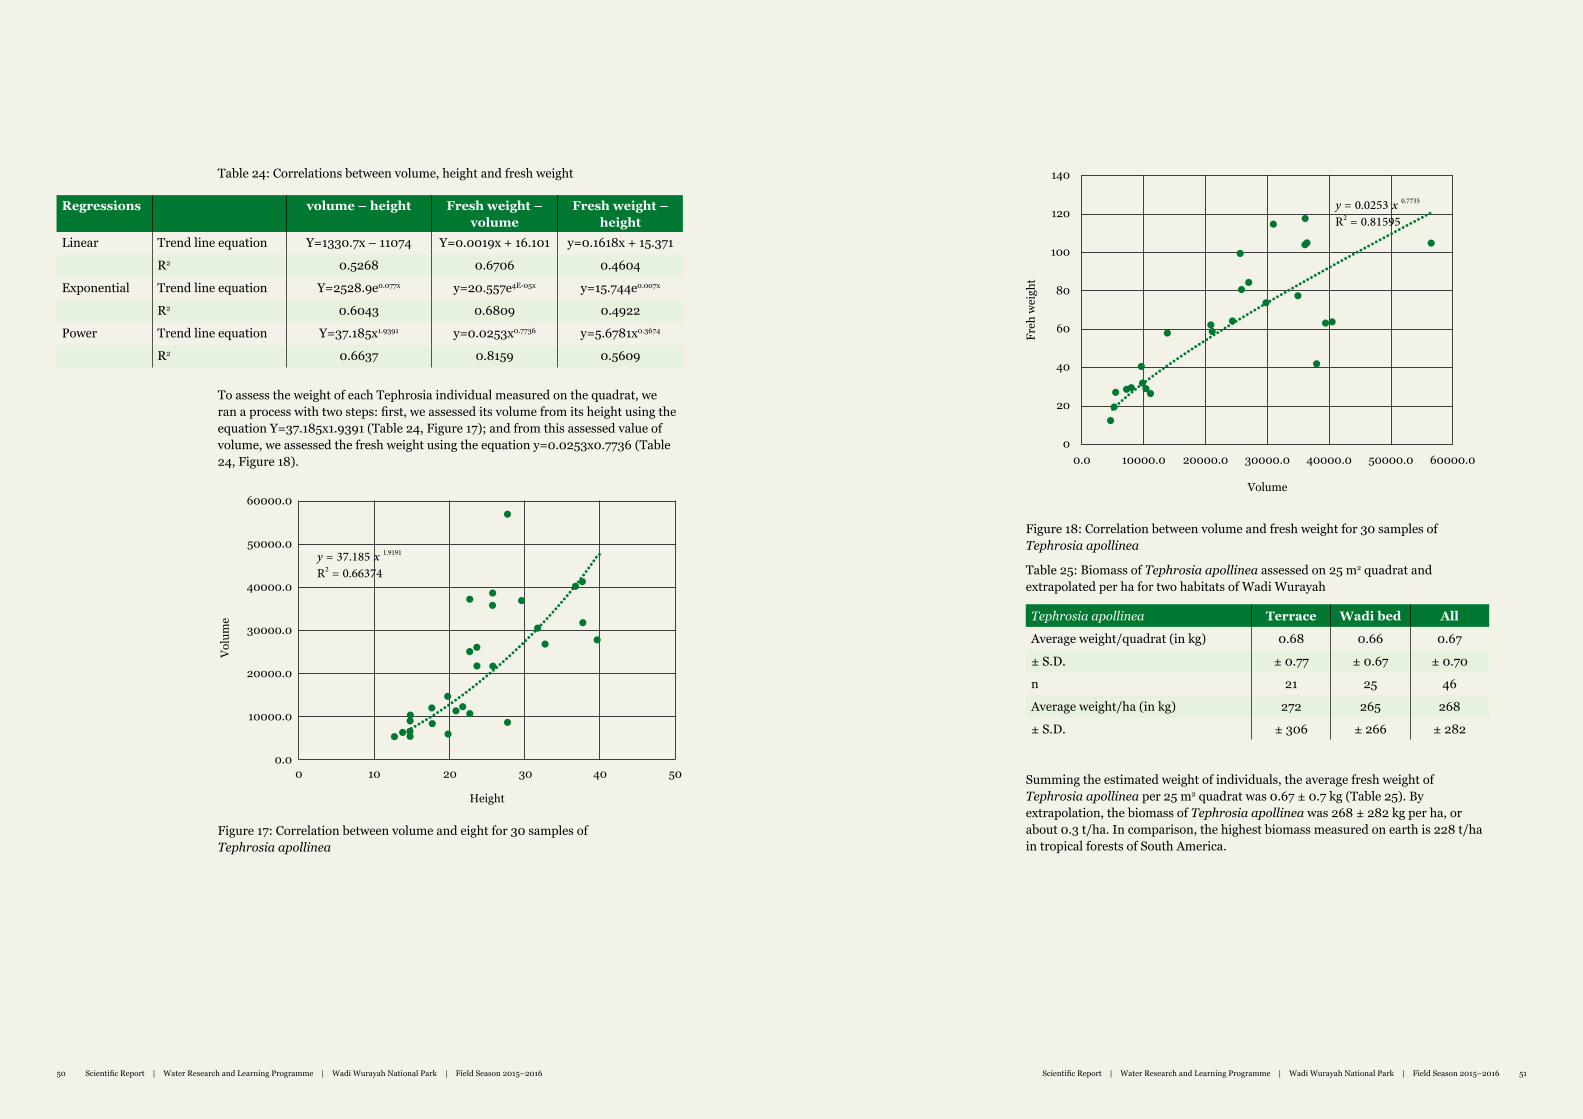
50 Marine Turtle Conservation Project Final Scientifc Report Marine Turtle Conservation Project Final Scientifc Report 51Scientific Report | Water Research and Learning Programme | Wadi Wurayah National Park | Field Season 2015–2016 5150 Scientific Report | Water Research and Learning Programme | Wadi Wurayah National Park | Field Season 2015–2016
Table 24: Correlations between volume, height and fresh weight
Figure 18: Correlation between volume and fresh weight for 30 samples of Tephrosia apollinea
Table 25: Biomass of Tephrosia apollinea assessed on 25 m2 quadrat and extrapolated per ha for two habitats of Wadi Wurayah
Tephrosia apollinea Terrace Wadi bed All
Average weight/quadrat (in kg) 0.68 0.66 0.67
± S.D. ± 0.77 ± 0.67 ± 0.70
n 21 25 46
Average weight/ha (in kg) 272 265 268
± S.D. ± 306 ± 266 ± 282
Summing the estimated weight of individuals, the average fresh weight of Tephrosia apollinea per 25 m2 quadrat was 0.67 ± 0.7 kg (Table 25). By extrapolation, the biomass of Tephrosia apollinea was 268 ± 282 kg per ha, or about 0.3 t/ha. In comparison, the highest biomass measured on earth is 228 t/ha in tropical forests of South America.
Regressions volume – height Fresh weight – volume
Fresh weight – height
Linear Trend line equation Y=1330.7x – 11074 Y=0.0019x + 16.101 y=0.1618x + 15.371
R2 0.5268 0.6706 0.4604
Exponential Trend line equation Y=2528.9e0.077x y=20.557e4E-05x y=15.744e0.007x
R2 0.6043 0.6809 0.4922
Power Trend line equation Y=37.185x1.9391 y=0.0253x0.7736 y=5.6781x0.3674
R2 0.6637 0.8159 0.5609
To assess the weight of each Tephrosia individual measured on the quadrat, we ran a process with two steps: first, we assessed its volume from its height using the equation Y=37.185x1.9391 (Table 24, Figure 17); and from this assessed value of volume, we assessed the fresh weight using the equation y=0.0253x0.7736 (Table 24, Figure 18).
Figure 17: Correlation between volume and eight for 30 samples of Tephrosia apollinea
60000.0
50000.0
40000.0
30000.0
20000.0
10000.0
0.00 10 20 30 40 50
y = 37.185 x 1.9191
R2 = 0.66374
Height
Vol
ume
140
60000.0
Freh
wei
ght
Volume
0.00
20
40
60
80
100
120
10000.0 20000.0 30000.0 40000.0 50000.0
y = 0.0253 x 0.7735
R2 = 0.81595
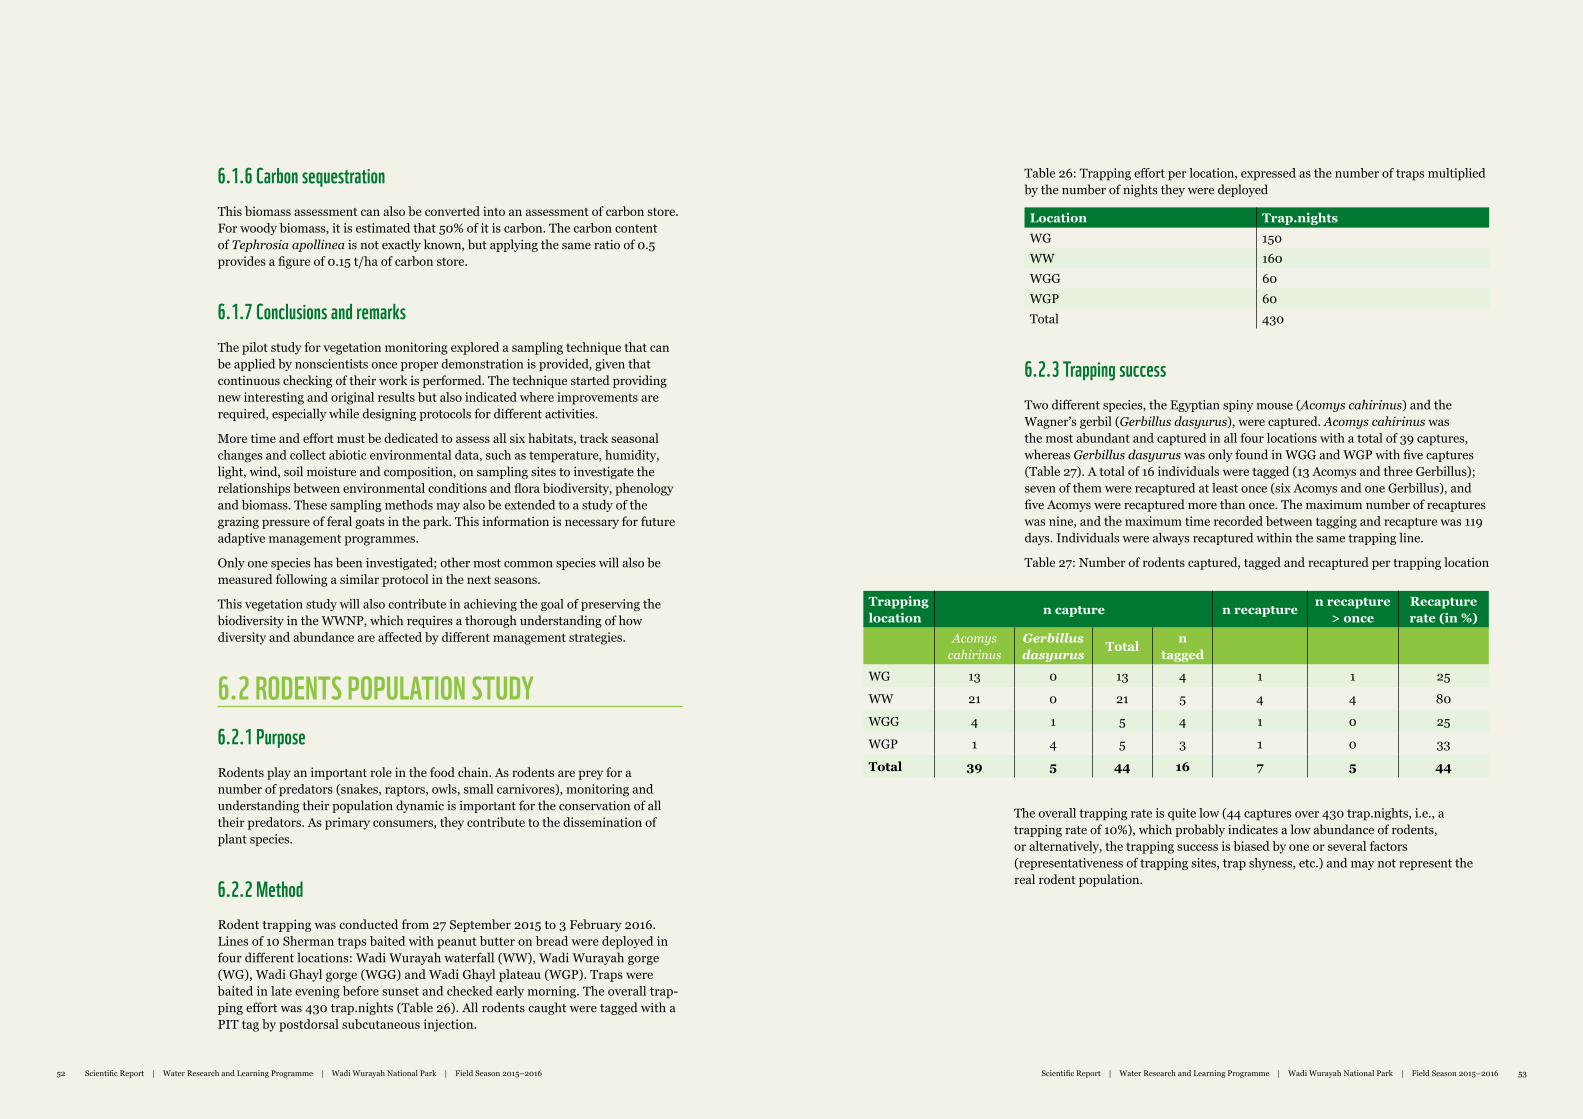
52 Marine Turtle Conservation Project Final Scientifc Report Marine Turtle Conservation Project Final Scientifc Report 53Scientific Report | Water Research and Learning Programme | Wadi Wurayah National Park | Field Season 2015–2016 5352 Scientific Report | Water Research and Learning Programme | Wadi Wurayah National Park | Field Season 2015–2016
6.1.6 Carbon sequestrationThis biomass assessment can also be converted into an assessment of carbon store. For woody biomass, it is estimated that 50% of it is carbon. The carbon content of Tephrosia apollinea is not exactly known, but applying the same ratio of 0.5 provides a figure of 0.15 t/ha of carbon store.
6.1.7 Conclusions and remarks The pilot study for vegetation monitoring explored a sampling technique that can be applied by nonscientists once proper demonstration is provided, given that continuous checking of their work is performed. The technique started providing new interesting and original results but also indicated where improvements are required, especially while designing protocols for different activities.
More time and effort must be dedicated to assess all six habitats, track seasonal changes and collect abiotic environmental data, such as temperature, humidity, light, wind, soil moisture and composition, on sampling sites to investigate the relationships between environmental conditions and flora biodiversity, phenology and biomass. These sampling methods may also be extended to a study of the grazing pressure of feral goats in the park. This information is necessary for future adaptive management programmes.
Only one species has been investigated; other most common species will also be measured following a similar protocol in the next seasons.
This vegetation study will also contribute in achieving the goal of preserving the biodiversity in the WWNP, which requires a thorough understanding of how diversity and abundance are affected by different management strategies.
6.2 RODENTS POPULATION STUDY6.2.1 PurposeRodents play an important role in the food chain. As rodents are prey for a number of predators (snakes, raptors, owls, small carnivores), monitoring and understanding their population dynamic is important for the conservation of all their predators. As primary consumers, they contribute to the dissemination of plant species.
6.2.2 MethodRodent trapping was conducted from 27 September 2015 to 3 February 2016. Lines of 10 Sherman traps baited with peanut butter on bread were deployed in four different locations: Wadi Wurayah waterfall (WW), Wadi Wurayah gorge (WG), Wadi Ghayl gorge (WGG) and Wadi Ghayl plateau (WGP). Traps were baited in late evening before sunset and checked early morning. The overall trap-ping effort was 430 trap.nights (Table 26). All rodents caught were tagged with a PIT tag by postdorsal subcutaneous injection.
Table 26: Trapping effort per location, expressed as the number of traps multiplied by the number of nights they were deployed
Location Trap.nightsWG 150WW 160WGG 60WGP 60Total 430
6.2.3 Trapping successTwo different species, the Egyptian spiny mouse (Acomys cahirinus) and the Wagner’s gerbil (Gerbillus dasyurus), were captured. Acomys cahirinus was the most abundant and captured in all four locations with a total of 39 captures, whereas Gerbillus dasyurus was only found in WGG and WGP with five captures (Table 27). A total of 16 individuals were tagged (13 Acomys and three Gerbillus); seven of them were recaptured at least once (six Acomys and one Gerbillus), and five Acomys were recaptured more than once. The maximum number of recaptures was nine, and the maximum time recorded between tagging and recapture was 119 days. Individuals were always recaptured within the same trapping line.
Table 27: Number of rodents captured, tagged and recaptured per trapping location
Trapping location n capture n recapture n recapture
> onceRecapture rate (in %)
Acomys cahirinus
Gerbillus dasyurus
Total n tagged
WG 13 0 13 4 1 1 25
WW 21 0 21 5 4 4 80
WGG 4 1 5 4 1 0 25
WGP 1 4 5 3 1 0 33
Total 39 5 44 16 7 5 44
The overall trapping rate is quite low (44 captures over 430 trap.nights, i.e., a trapping rate of 10%), which probably indicates a low abundance of rodents, or alternatively, the trapping success is biased by one or several factors (representativeness of trapping sites, trap shyness, etc.) and may not represent the real rodent population.
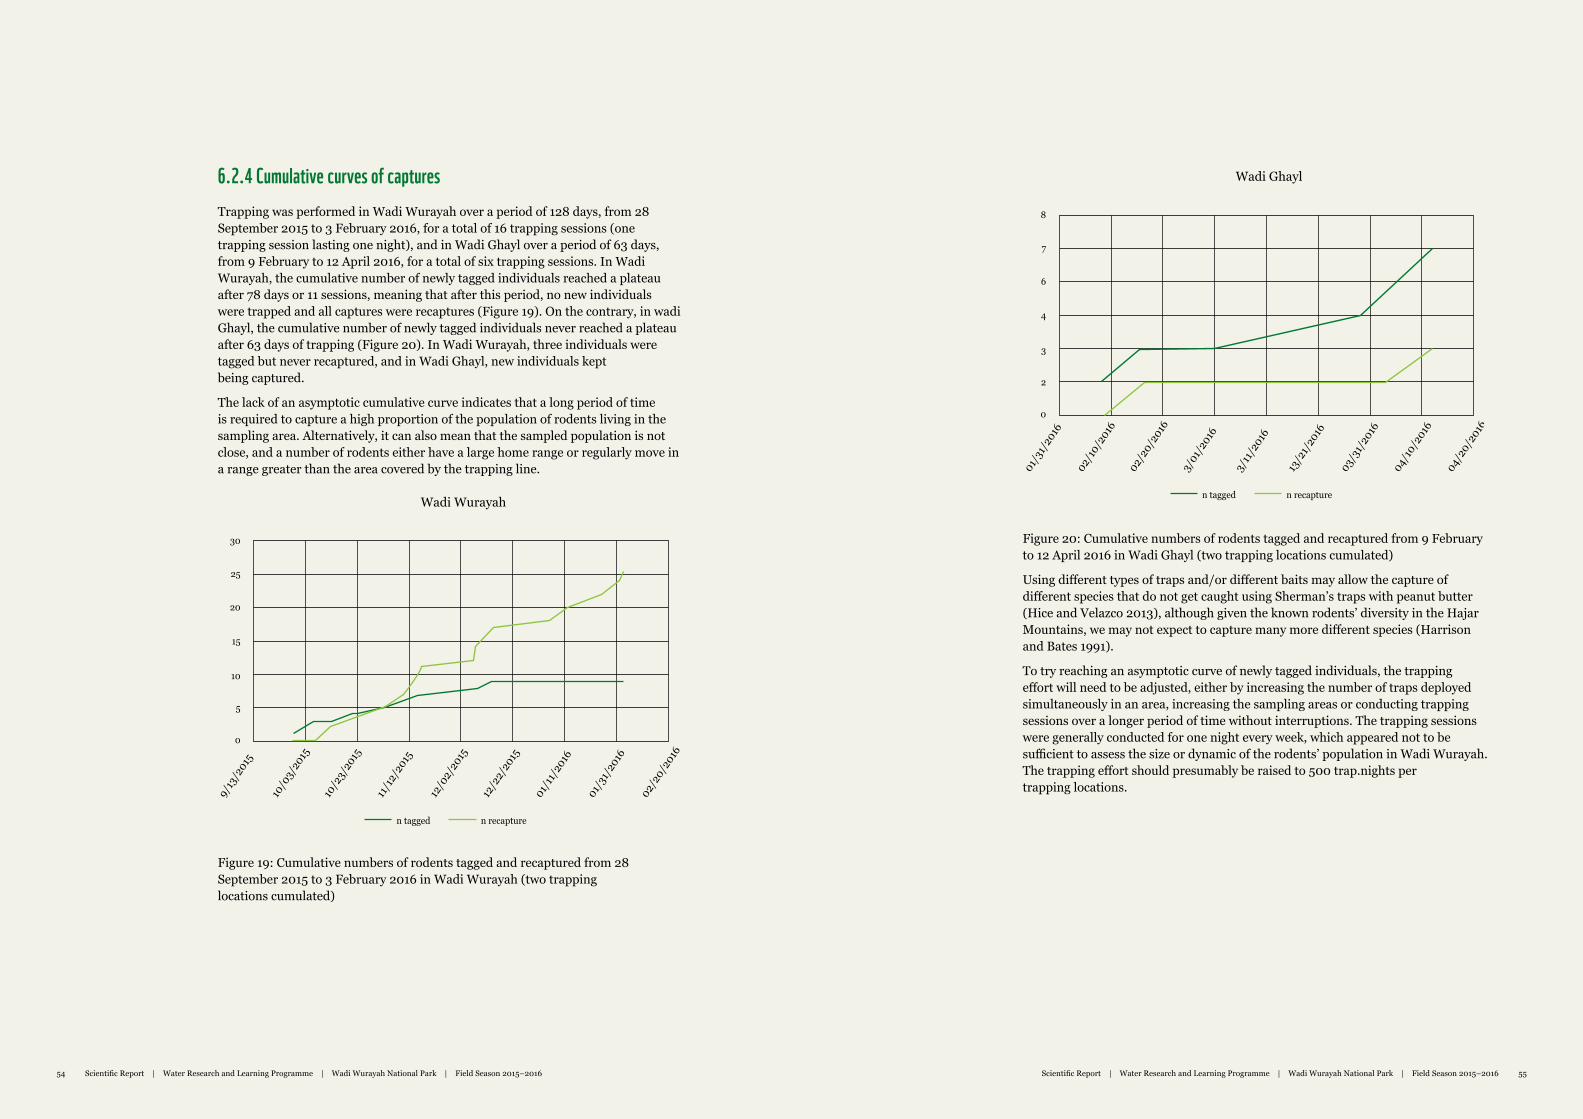
54 Marine Turtle Conservation Project Final Scientifc Report Marine Turtle Conservation Project Final Scientifc Report 55Scientific Report | Water Research and Learning Programme | Wadi Wurayah National Park | Field Season 2015–2016 5554 Scientific Report | Water Research and Learning Programme | Wadi Wurayah National Park | Field Season 2015–2016
6.2.4 Cumulative curves of capturesTrapping was performed in Wadi Wurayah over a period of 128 days, from 28 September 2015 to 3 February 2016, for a total of 16 trapping sessions (one trapping session lasting one night), and in Wadi Ghayl over a period of 63 days, from 9 February to 12 April 2016, for a total of six trapping sessions. In Wadi Wurayah, the cumulative number of newly tagged individuals reached a plateau after 78 days or 11 sessions, meaning that after this period, no new individuals were trapped and all captures were recaptures (Figure 19). On the contrary, in wadi Ghayl, the cumulative number of newly tagged individuals never reached a plateau after 63 days of trapping (Figure 20). In Wadi Wurayah, three individuals were tagged but never recaptured, and in Wadi Ghayl, new individuals kept being captured.
The lack of an asymptotic cumulative curve indicates that a long period of time is required to capture a high proportion of the population of rodents living in the sampling area. Alternatively, it can also mean that the sampled population is not close, and a number of rodents either have a large home range or regularly move in a range greater than the area covered by the trapping line.
Figure 19: Cumulative numbers of rodents tagged and recaptured from 28 September 2015 to 3 February 2016 in Wadi Wurayah (two trapping locations cumulated)
Figure 20: Cumulative numbers of rodents tagged and recaptured from 9 February to 12 April 2016 in Wadi Ghayl (two trapping locations cumulated)
Using different types of traps and/or different baits may allow the capture of different species that do not get caught using Sherman’s traps with peanut butter (Hice and Velazco 2013), although given the known rodents’ diversity in the Hajar Mountains, we may not expect to capture many more different species (Harrison and Bates 1991).
To try reaching an asymptotic curve of newly tagged individuals, the trapping effort will need to be adjusted, either by increasing the number of traps deployed simultaneously in an area, increasing the sampling areas or conducting trapping sessions over a longer period of time without interruptions. The trapping sessions were generally conducted for one night every week, which appeared not to be sufficient to assess the size or dynamic of the rodents’ population in Wadi Wurayah. The trapping effort should presumably be raised to 500 trap.nights per trapping locations.
0
5
10
15
20
25
30
01/3
1/20
16
01/1
1/20
16
02/2
0/20
16
12/2
2/20
15
12/0
2/20
15
11/1
2/20
15
10/2
3/20
15
10/0
3/20
15
9/13
/201
5
n tagged n recapture
Wadi Wurayah
0
2
3
4
6
7
8
04/1
0/20
16
03/3
1/20
16
04/2
0/20
16
13/2
1/20
16
3/11
/201
6
3/01
/201
6
02/2
0/20
16
02/1
0/20
16
01/3
1/20
16
n tagged n recapture
Wadi Ghayl
56 Marine Turtle Conservation Project Final Scientifc Report Marine Turtle Conservation Project Final Scientifc Report 57Scientific Report | Water Research and Learning Programme | Wadi Wurayah National Park | Field Season 2015–2016 5756 Scientific Report | Water Research and Learning Programme | Wadi Wurayah National Park | Field Season 2015–2016
The third season of field research activities has now been completed, bringing an important amount of new data to the WRLP started in the WWNP in September 2013.
The monitoring of water parameters shows a good and stable water quality, with minor interannual variations. Salinity, TDS, conductivity and nitrates (NO3–) slightly but regularly increased over the past 3 years. The sources of these variations are still not fully understood and would require more effort to understand them, although currently there is no major concern since they are not compromising the water quality. The new measures introduced this year (potential redox and biochemical oxygen demand) or the improved measures of dissolved oxygen will need some more years to characterise seasonal variations and detect interannual variations.
After 3 years of regular monitoring, thresholds of water quality can now be confidently proposed. These thresholds are limits of natural variations within which water quality is not affected. Measures outside these threshold values should raise concern to investigate the causes of extralimital variations. When causes have been elucidated and confirmed, management procedures to solve the problem could be searched, experimented and implemented. These thresholds are presumably not definitive and may have to be adjusted in accordance with new results of monitoring. The WWNP’s governance body is encouraged to define action plans of measures to be implemented when thresholds are exceeded.
The Freshwater Watch tests provided complementary interesting results about nitrate and phosphate variations in the wadi. Despite some lack of accuracy in measuring concentrations, the variations in the distribution of range values showed an improvement of water quality following the closure of the park to the public, however, with some interannual variations in the presence of nitrates at low concentrations. Better accuracy in measuring nitrate concentrations would be required to characterise and determine the origin of these nitrates.
Some high concentration levels of E. coli were found in two locations in the park, but their sources remain unknown. Feral pigeons breeding in rocky cliffs in the main gorge of Wadi Wurayah are suspected. This may be investigated further in season 4.
Zooplankton surveys showed some variations between locations and throughout the season. Monitoring following the same protocol will be continued to confirm these observations and to improve our understanding of the causes of these variations. Identifying zooplankton to the species level is a very specialised and technical work. Specialists will be approached to go farther in the species diversity characterisation.
Identification of freshwater invertebrates this season substantially improved the characterisation of species diversity and provided highlights on local distribution and abundance of some species. The approach has been at the community level, and some refinements of the field protocol will be considered to study seasonal variations in the abundance of some species or families. Mayflies (Ephemeroptera) are well represented in the WWNP and are generally recognised as a good indicator of freshwater quality. More effort may be dedicated to characterising mayflies’ populations.
Odonates have received an important part of our attention since the beginning of the WRLP programme, and our understanding of their population has greatly increased. The new protocol of population monitoring by presence or absence, which was introduced this season, already provided valuable data and seems promising in calculating indices for measuring population trends. After three seasons, we can now confirm the seasonal pattern of populations’ variations in species diversity and abundance. However, the tagging experiment still raises more questions: the recapture rate of Trithemis arteriosa has been increasing, while the average time to recapture has been decreasing without straightforward explanations. We will continue our tagging effort, still focusing on the most abundant species, Trithemis arteriosa, to understand its population dynamic.
The third season of studying toads confirmed the seasonal trends in abundance but also showed important interannual variations, not only in abundance, but also in the size of the individuals captured. The newly introduced programme of toad tagging provided some first estimate of population size, but environmental factors controlling populations’ variations still need more investigations. Trials were conducted this year to keep and raise tadpoles indoors. The approach was successful and prepared us to initiate an experimental study of the effects of different factors (temperature, food availability, light) on their development in controlled artificial conditions. This experiment will contribute in forecasting the potential effects of climate change on their populations and assess their vulnerability. Such experiments will require time to reach conclusions but should provide much-needed information to more accurately model the effects of climate change on terrestrial ecosystems. Most models of habitats’ or species’ vulnerability to climate change are correlative but rarely integrate species’ ecological traits and tolerance, resulting in a low reliability and predictability of changes in habitats, species distribution or community structure.
The vegetation study provided the first results of biomass assessment for the park. Only one species (Tephrosia apollinea) has been measured; however, the methodology provided encouraging results. Biomass assessment will be extended to a larger number of most abundant species. Moreover, we will continue testing the accuracy of the method by comparing the assessed biomass of one quadrat with a true measure of this biomass. In addition to providing estimation of food availability for herbivores in the park (ungulates in particular), this method also opens interesting perspectives to assess carbon sequestration and eventually assess a value of carbon sequestration according to the carbon credit market.
7. DISCUSSION AND PERSPECTIVES
58 Marine Turtle Conservation Project Final Scientifc Report Marine Turtle Conservation Project Final Scientifc Report 59Scientific Report | Water Research and Learning Programme | Wadi Wurayah National Park | Field Season 2015–2016 5958 Scientific Report | Water Research and Learning Programme | Wadi Wurayah National Park | Field Season 2015–2016
The study of rodents’ population by PIT tagging was first introduced as a research topic this season. The overall low capture rate indicated low population density. Moreover, the low recapture rates may indicate either low survival or important movements in the population. To go farther in the data analysis and the understanding of population dynamic, changes in the trapping protocols and increase in trapping effort will be required.
Results from previous seasons have already demonstrated the valuable contribution of citizen scientists in successfully implementing scientific protocols and collecting data in the field. Ecological studies often require very time-consuming and labour-intensive field and lab activities in order to patiently collect an important amount of data pooled and analysed together, which will help in understanding how the ecosystem functions or what are the statuses and trends of wildlife populations. The monitoring of water quality parameters and wildlife populations (dragonflies, toads, freshwater invertebrates, etc.), repeated year after year, is intended to run in the long term. Results of these time- and staff-demanding monitoring activities often end up, after spending hours in the field and inputting and analysing data in offices, summarised on one point on a trend curve.
The three seasons of continuous monitoring start to reveal some patterns of seasonal and interannual variations and some possible trends. It is only in the long term, after untangling multiple environmental factors that continuously act to shape the evolution of species and ecosystems, that we can start understanding the ecosystems in their whole complexity of interrelationships. However, field observations are often not sufficient to separate the relative effects of different environmental factors on an ecological variable, and the experimental approach under controlled conditions is unavoidable in testing the effects of a single factor. This is the direction given to the development of the lab.
The next season promises to still be busy with a lot of different field research activities that will continue to provide valuable results for our understanding of the Wadi Wurayah ecosystem. New activities may still be introduced. The EWS-WWF is initiating a survey of the bat fauna of the Hajar Mountains, which requires the characterisation of the echolocation calls of different species. In October 2015, a Sind serotine bat was caught at the Water Research and Learning Centre; its echolocation calls are still poorly known. Some new research activities with volunteers may focus on using bat detectors to record echolocation calls. The new research programme for season 4 will be finalised in September 2016.
Begon, M., 1979. Investigating animal abundance: Capture-recapture for biologists. London: Edward Arnold (Publishers) Limited, 1979 pp.
Boyer, R., and Grue, C. E., 1995. The need for water quality criteria for frogs. Environmental Health Perspectives 103 (4):352–357.
Brooke, 2006. Water resources of Wadi Al Wurayyah Fujairah, U.A.E.: A preliminary study for WWF, Dubai. February 2006. EAD – EWS-WWF internal report, 40 pp.
Corbet, P. S., 2004. Dragonflies: Behaviour and ecology of odonata (revised edition). England: Harley Books, 829 pp.
Forró, L., Korovchinsky, N. M., Kotov, A. A., and Petrusek, A., 2008. Global diversity of cladocerans (Cladocera; Crustacea) in freshwater. Hydrobiologia 595:177–184.
Harrison, D. L., & Bates, P. J. J., 1991: The mammals of Arabia (second edition). Sevenoaks: Harrison Zoological Museum, 354 pp.
Hice, C. L., and Velazco, P. M., 2013. Relative effectiveness of several bait and trap types for assessing terrestrial small mammal communities in neotropical rainforest. Occasional Papers. Museum of Texas Tech Univ. (316):1–15.
Hodkinson, I. D., and Jackson, J. K., 2005. Terrestrial and aquatic invertebrates as bioindicators for environmental monitoring, with particular reference to mountain ecosystems. Environmental Management 35 (5):649–666.
Judas, J., 2016. Wadi Wurayah National Park: Scientific research report 2013–2015. EWS-WWF report, 115 pp.
Orton, R., and Bebbington, J., 1996. The freshwater name trail: A key to the invertebrates of ponds and streams. The Field Studies Council, UK.
Pyke, G., 2005. The Use of PIT tags in capture-recapture studies of Frogs: A field evaluation. Herpetol Rev 36:281–285.
Saidenberg, A. B., Robaldo Guedes, N. M., Fernandes Seixas, G. H., da Costa Allgayer, M., Pacifico de Assis, E., Siveira, L. F., Melville, P. A., and Roberti Benites, N., 2012. A survey for Escherichia coli virulence factors in asymptomatic free-ranging parrots. ISRN Veterinary Science. Vol 2012, Article ID 984813, 6 pp.
8. REFERENCES
60 Marine Turtle Conservation Project Final Scientifc Report Marine Turtle Conservation Project Final Scientifc Report 61Scientific Report | Water Research and Learning Programme | Wadi Wurayah National Park | Field Season 2015–2016 6160 Scientific Report | Water Research and Learning Programme | Wadi Wurayah National Park | Field Season 2015–2016
Soorae, P., Els, J., Gardner, D., and El Alqamy, H., 2013. Distribution and ecology of the Arabian and Dhofar toads (D. arabicus and D. dhufarensis) in the United Arab Emirates and adjacent areas of Northern Oman. Zool. Midd. East 59(3):229–234.
Tourenq, C., Khassim, A., Sawaf, M., Shuriqi, M. K., Smart, E., Ziolkowski, M., Brook, M., Selwan, R., and Perry, L., 2009. Characterization of the Wadi Wurayah catchment basin, the first mountain protected area in the United Arab Emirates. International Journal of Ecology and Environmental Sciences 35 (4):289–311.
Trebitz, A. S., Brazner, J. C., Cotter, A. M., Knuth, M. L., Morrice, J. A., Peterson, G. S., Sierszen, M. A., Thompson, J. A., and Kelly, J. R., 2007. Water quality in Great Lakes coastal wetlands: Basin-wide patterns and responses to an anthropogenic disturbance gradient. J. Great Lakes Res. 33 (Special Issue 3):67–85.
US Environmental Protection Agency, 1986. Ambient water quality criteria for bacteria, 18 pp. Available online at: https://www.regulations.gov/#!documentDetail;D=EPA-HQ-OW-2007-0808-0001
Webber, M., Edwards-Myers, E., Campbell, C., Webber, D., 2005. Phytoplankton and zooplankton as indicators of water quality in Discovery Bay, Jamaica. Hydrobiologia 545 (1):177–193.
Witty, L. M., 2004. Practical guide to identifying freshwater crustacean zooplankton. Cooperative Freshwater Ecology Unit, Laurentian University, Ontario – Canada, 2nd edition. Available online at: http://www3.laurentian.ca/livingwithlakes/wp-content/uploads/2012/06/Zooplankton-Guide-to- Taxonomy.pdf

1 Marine Turtle Conservation Project Final Scientifc Report1 Marine Turtle Conservation Project Final Scientifc Report
Scientific Report | Water Research and Learning Programme | Wadi Wurayah National Park | Field Season 2015–2016 EWS-WWF
Established in 2001 under the patronage of HH Sheikh Hamdan bin Zayed Al Nahyan, Ruler’s Representative in the Western Region, EWS-WWF’s mission is to conserve nature and reduce the most pressing threats to the environment by working with people and institutions in the UAE and region to implement conservation solutions through science, research, policy, education and awareness.
For more information about EWS-WWF please visit: uae.panda.org
Scientific Report | Water Research and Learning Programme | Wadi Wurayah National Park | Field Season 2015–2016 EWS-WWF