Embed Size (px)
Citation preview

Global Warming
IB syllabus: 6.1.1-6.1.7AP Syllabus
Ch 18Video -

http://wakeupfreakout.org/film/tipping.html
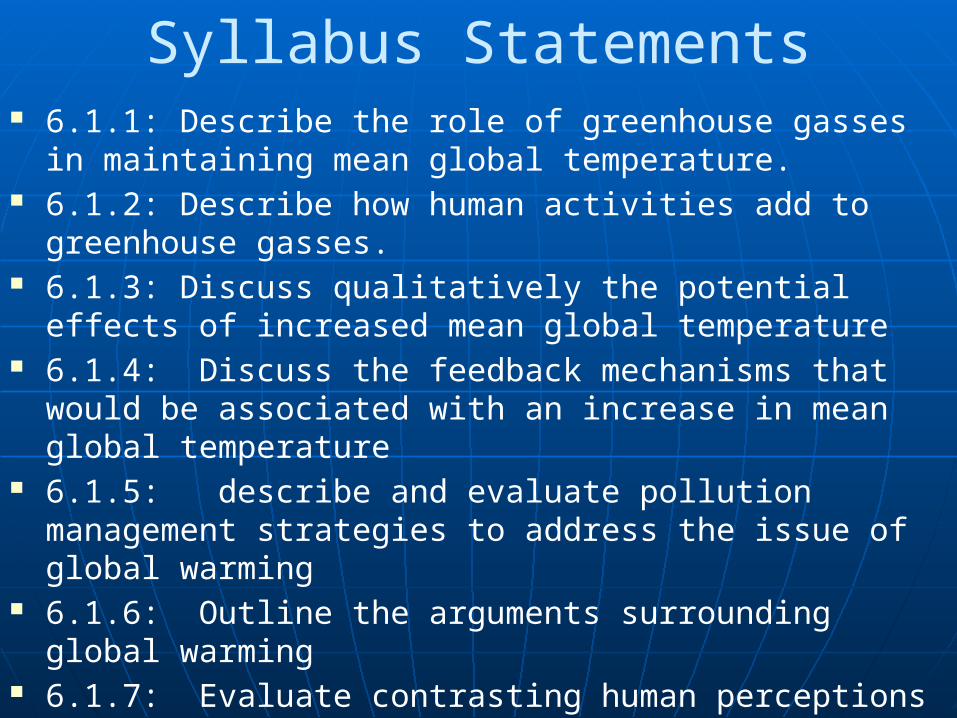
Syllabus Statements 6.1.1: Describe the role of greenhouse gasses in
maintaining mean global temperature. 6.1.2: Describe how human activities add to
greenhouse gasses. 6.1.3: Discuss qualitatively the potential effects of
increased mean global temperature 6.1.4: Discuss the feedback mechanisms that would be
associated with an increase in mean global temperature
6.1.5: describe and evaluate pollution management strategies to address the issue of global warming
6.1.6: Outline the arguments surrounding global warming
6.1.7: Evaluate contrasting human perceptions of the issue of global warming
vocabulary
Correlation Global warming Greenhouse gases Negative feedback Positive feedback
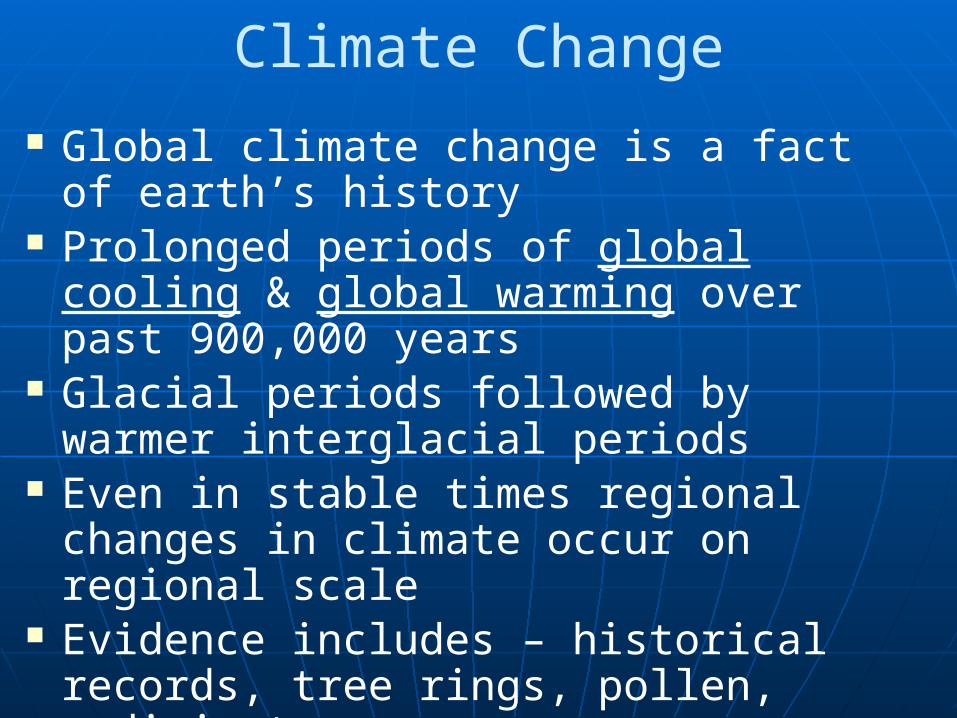
Climate Change
Global climate change is a fact of earth’s history
Prolonged periods of global cooling & global warming over past 900,000 years
Glacial periods followed by warmer interglacial periods
Even in stable times regional changes in climate occur on regional scale
Evidence includes – historical records, tree rings, pollen, radioisotopes
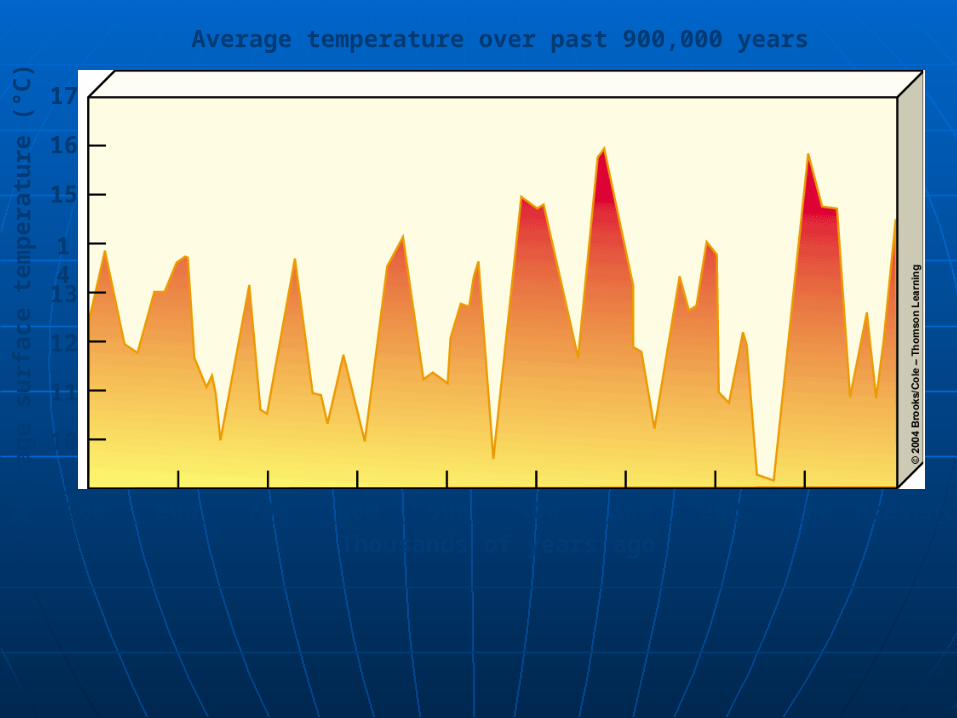
Average temperature over past 900,000 years
Thousands of years ago
Ave
rag
e su
rfac
e te
mp
erat
ure
(°C
)
900 800 700 600 500 400 300 200 100 Present9
10
11
12
13
14
15
16
17
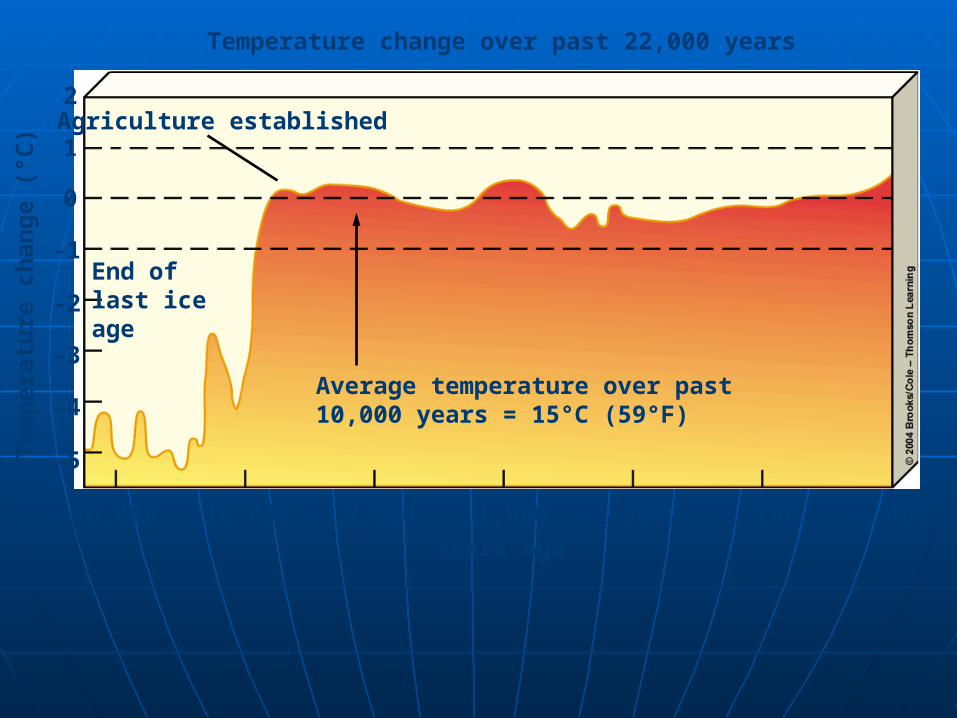
Temperature change over past 22,000 years
Years ago
Tem
per
atu
re c
han
ge
(°C
)
20,000 10,000 2,000 1,000 200 100 Now
-5
-4
-3
-2
-1
0
1
2
End oflast iceage
Agriculture established
Average temperature over past10,000 years = 15°C (59°F)
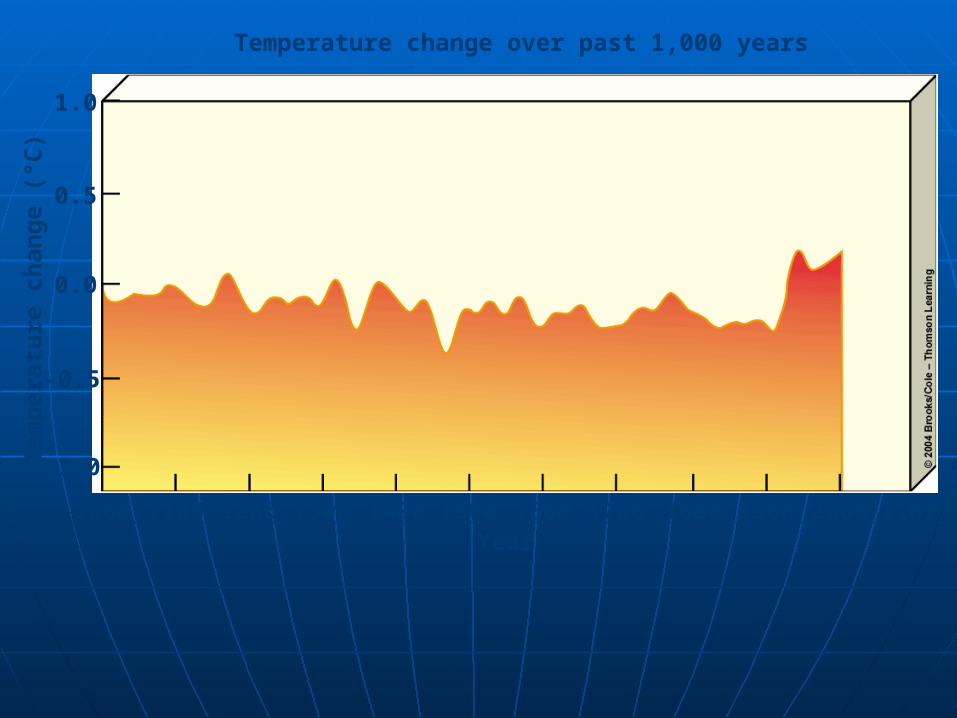
Temperature change over past 1,000 years
Year
Tem
per
atu
re c
han
ge
(°C
)
1000 1100 1200 1300 1400 1500 1600 1700 1800 1900 2000 2101
-1.0
-0.5
0.0
0.5
1.0
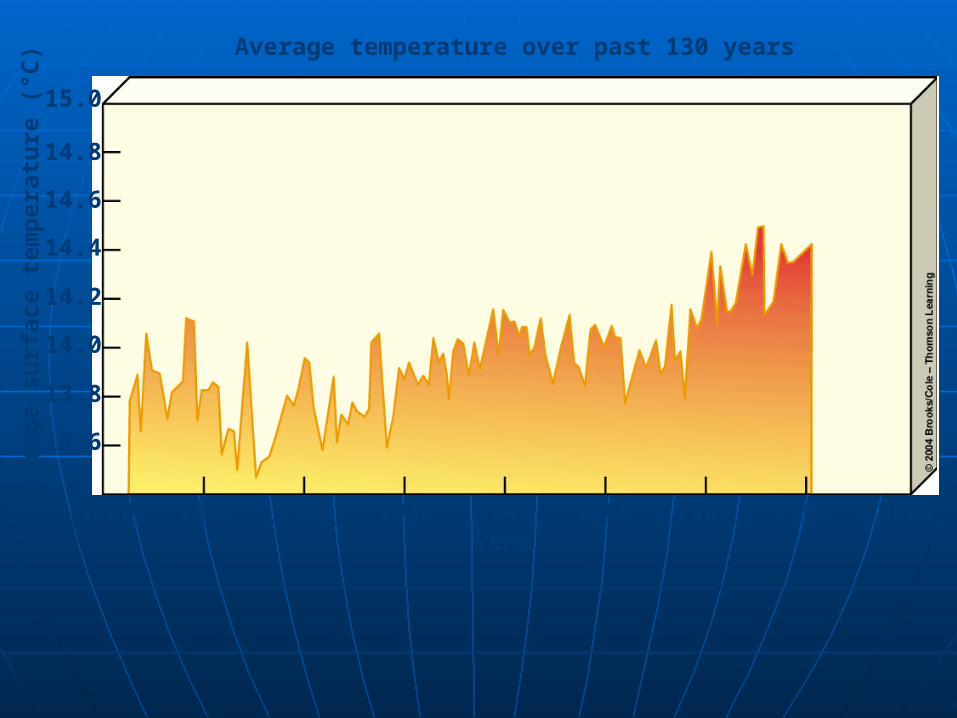
Average temperature over past 130 years
Year
Ave
rag
e su
rfac
e te
mp
erat
ure
(°C
)
1860 1880 1900 1920 1940 1960 1980 2000 2020
13.6
13.8
14.0
14.2
14.4
14.6
14.8
15.0
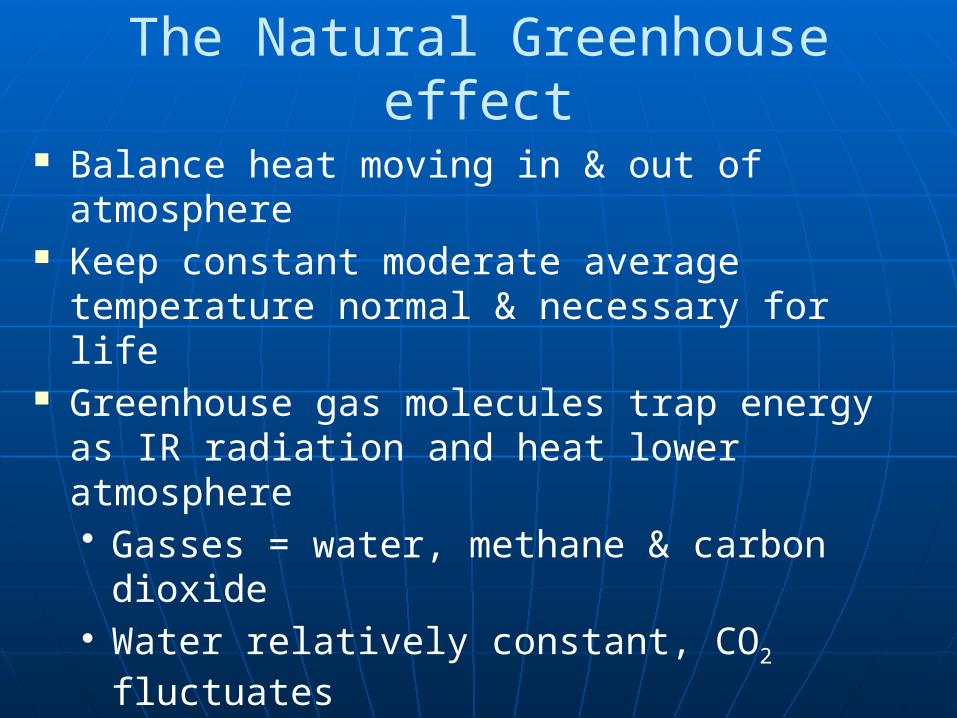
The Natural Greenhouse effect
Balance heat moving in & out of atmosphere Keep constant moderate average
temperature normal & necessary for life Greenhouse gas molecules trap energy as IR
radiation and heat lower atmosphere• Gasses = water, methane & carbon dioxide• Water relatively constant, CO2 fluctuates
Really a tropospheric heating effect With natural cooling average global temp =
59 ˚F
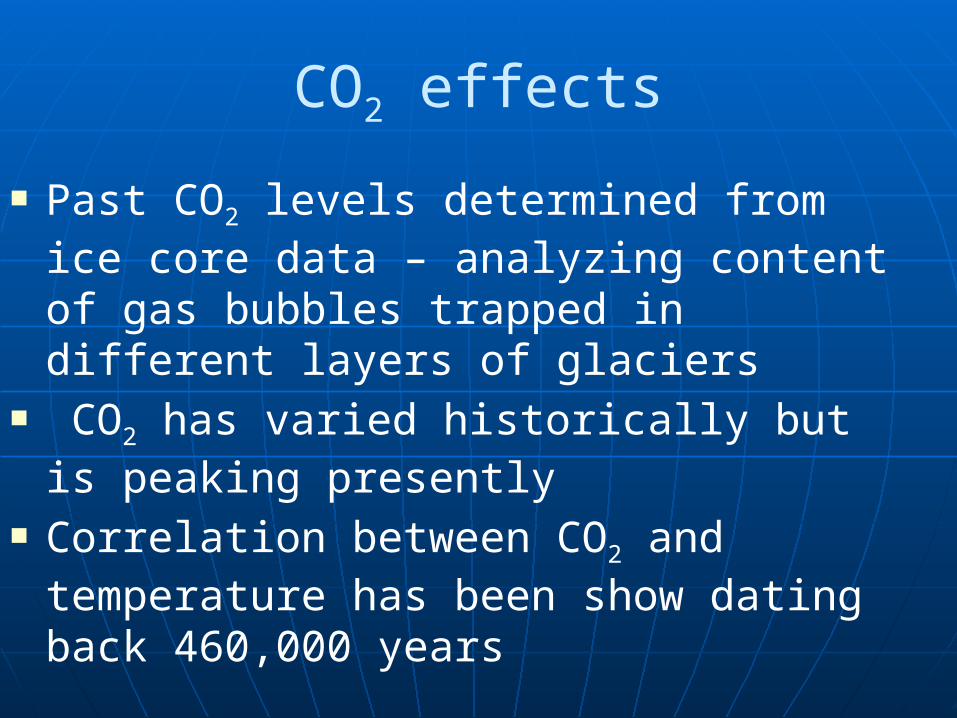
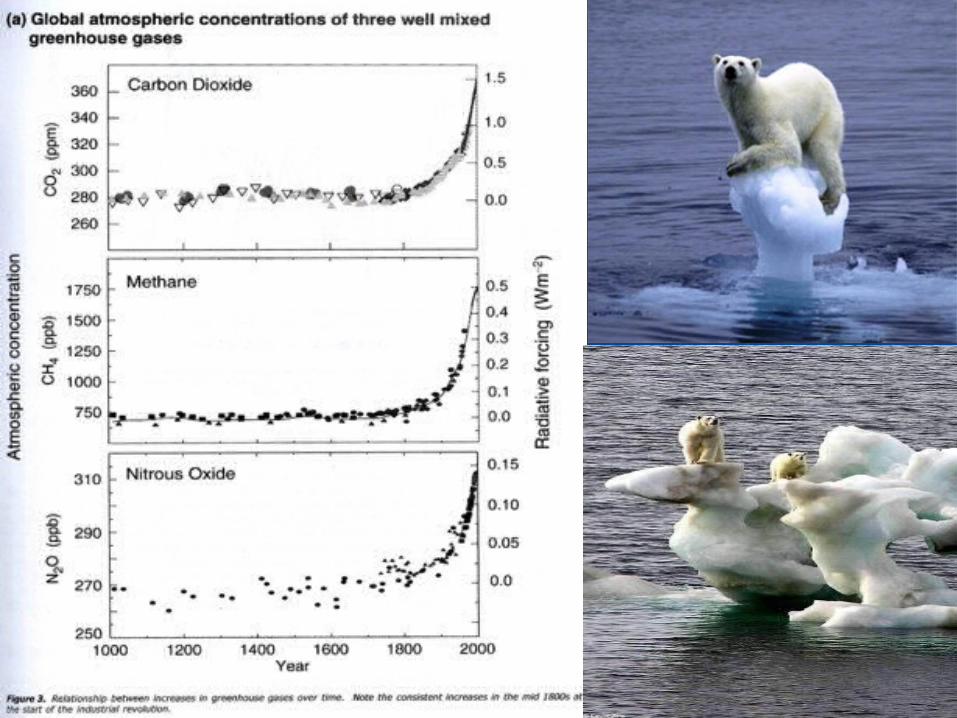
CO2 effects
Past CO2 levels determined from ice core data – analyzing content of gas bubbles trapped in different layers of glaciers
CO2 has varied historically but is peaking presently
Correlation between CO2 and temperature has been show dating back 460,000 years
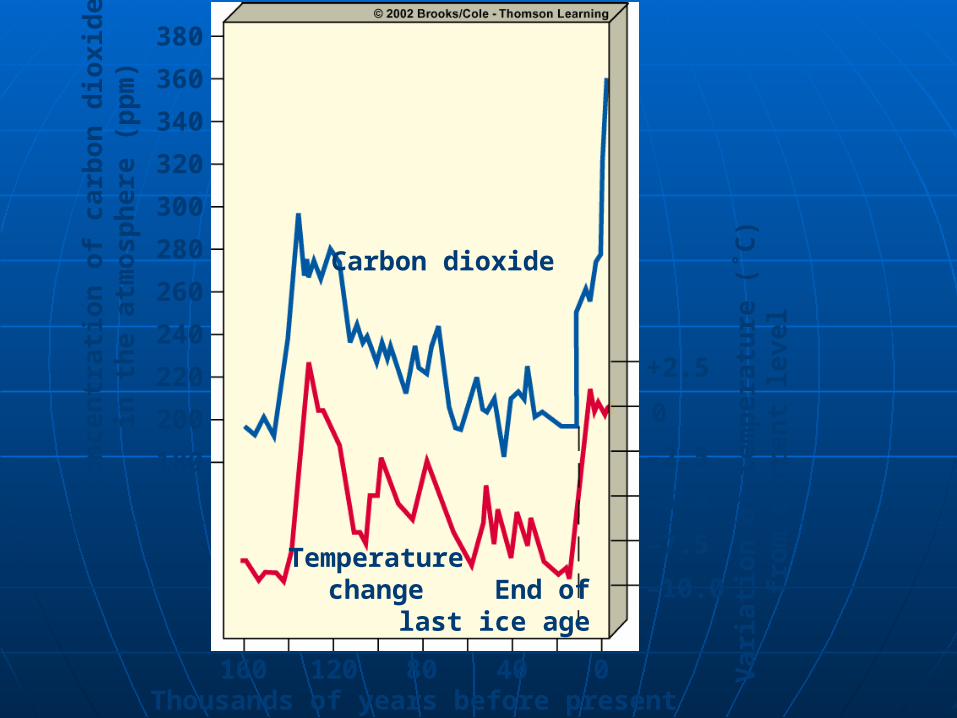
Carbon dioxide
Temperaturechange End of
last ice age
160 120 80 40 0Thousands of years before present
Co
nc
entr
ati
on
of
carb
on
dio
xid
ein
th
e a
tmo
sph
ere
(p
pm
)
180
200
220
240
260
280
300
320
340
360
380
–10.0
–7.5
–5.0
–2.5
0
+2.5
Va
ria
tio
n o
f te
mp
era
ture
(˚C
)fr
om
cu
rre
nt
lev
el
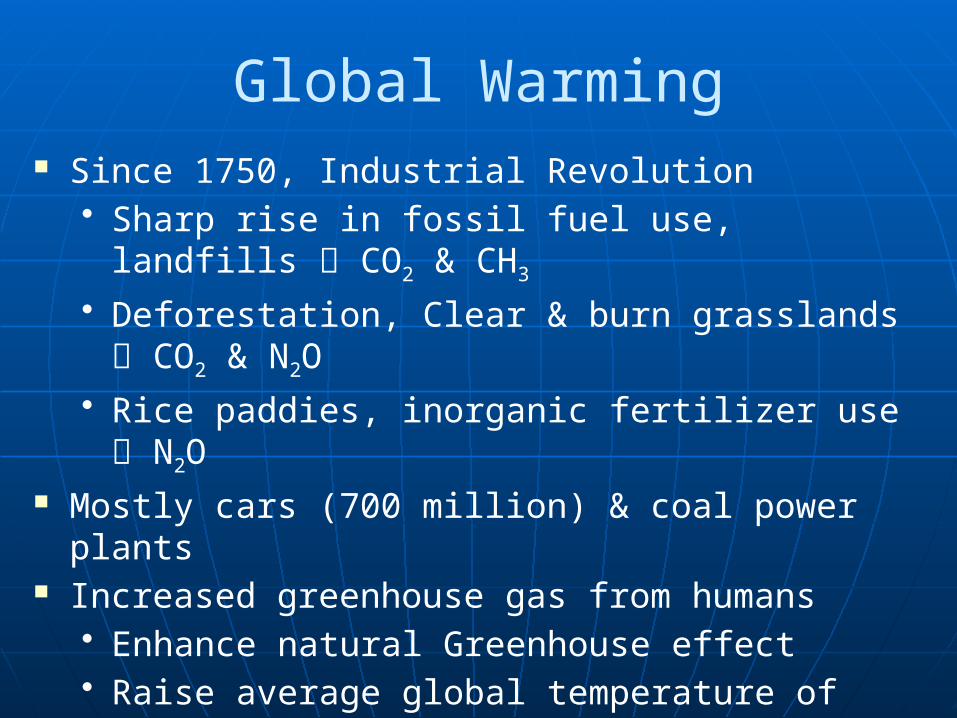
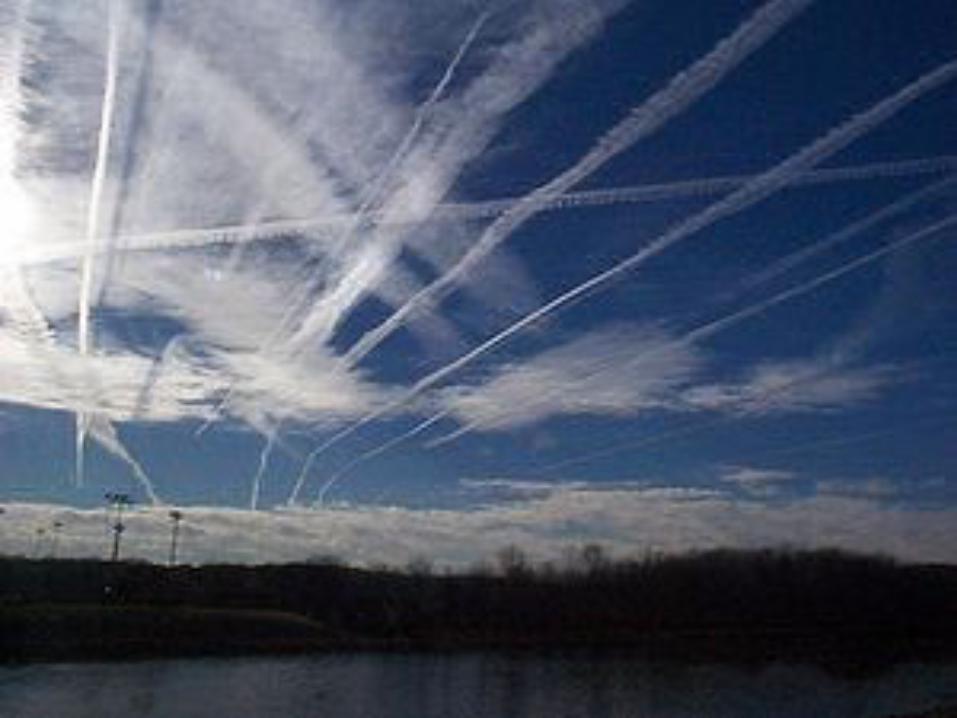
Global Warming Since 1750, Industrial Revolution
• Sharp rise in fossil fuel use, landfills CO2 & CH3
• Deforestation, Clear & burn grasslands CO2 & N2O
• Rice paddies, inorganic fertilizer use N2O Mostly cars (700 million) & coal power plants Increased greenhouse gas from humans
• Enhance natural Greenhouse effect• Raise average global temperature of
atmosphere near earth’s surface Global warming
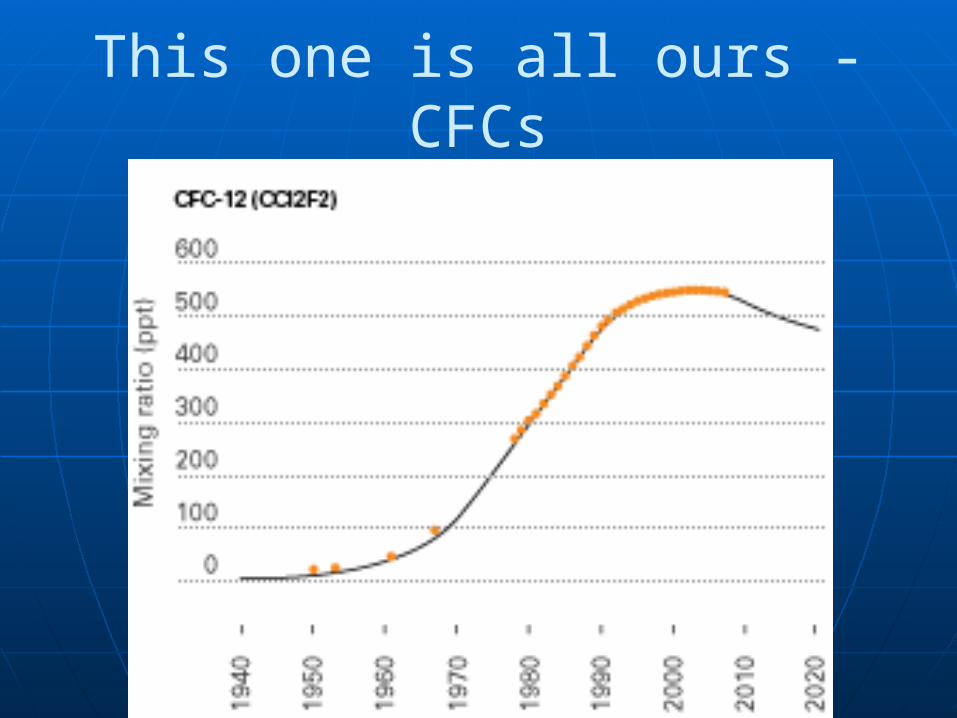
This one is all ours - CFCs
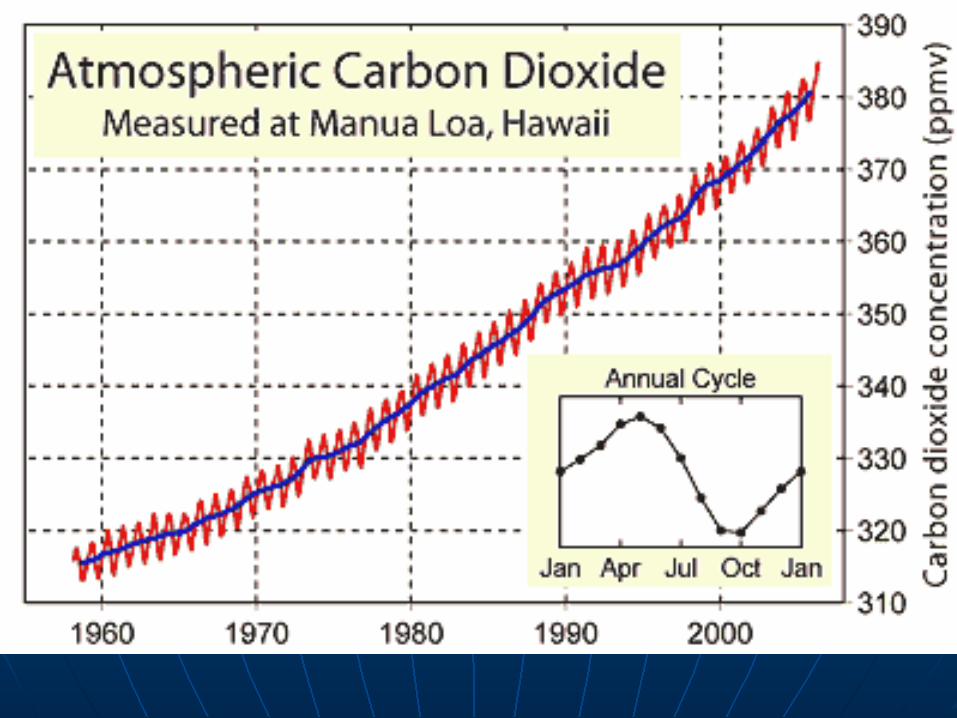
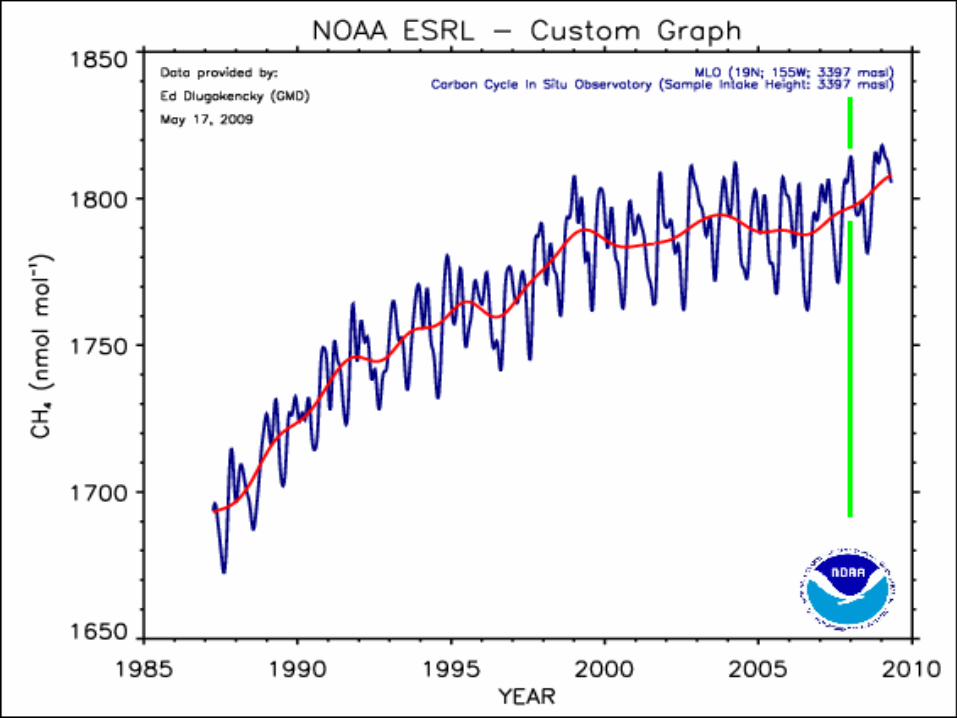
Are we experiencing Global Warming? There is no longer a question
CO2 in troposphere highest in last 20 million years
20th century hottest in last 1000 years Since 1861 average global temp has risen
0.74 +/- 0.18 ˚C Shrinking of glaciers, melting of ice caps 10 – 20 cm rise in global sea level Change of range of species, moving to
poles Timing of seasons has changed
14.7
14.6
14.5
14.4
14.3
14.2
14.1
14.0
13.9
13.8
Temp
erature (C
º)
Year
1970 1980 1990 2000 2005
380
375
365
355
345
335
325
CO
2 co
nce
ntr
atio
n (
pp
m)
8.4
8.0
7.6
7.2
6.8
6.4
6.0
4.8
5.6
5.2
Fo
ssil
fuel
s b
urn
(bill
ion
s o
f m
etri
c to
ns
of
oil
equ
ival
ent)
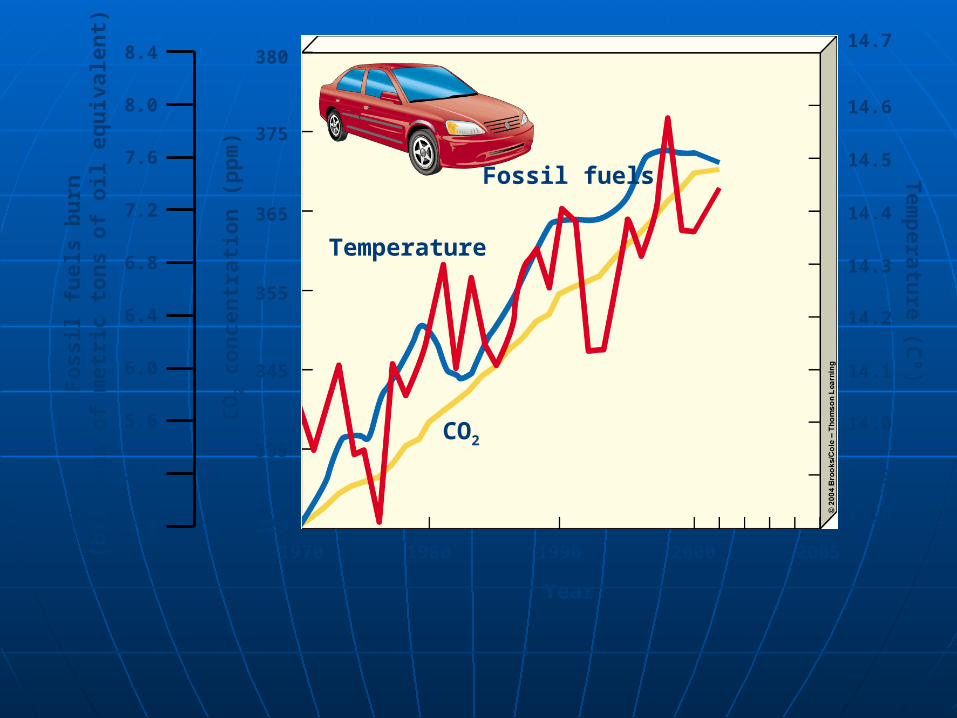
CO2
Fossil fuels
Temperature
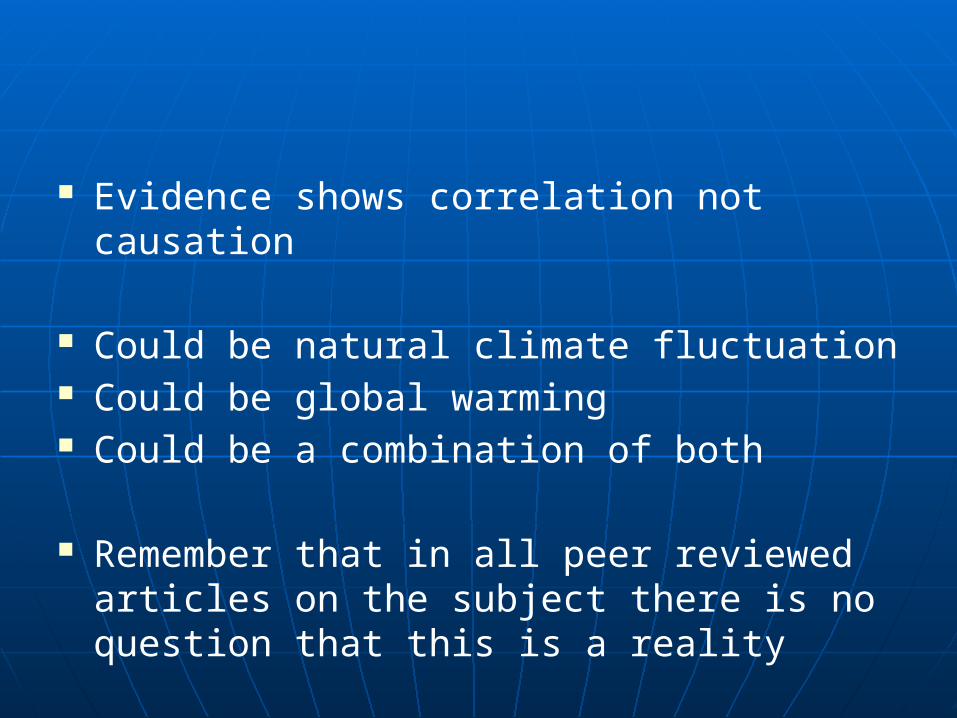
Evidence shows correlation not causation
Could be natural climate fluctuation Could be global warming Could be a combination of both
Remember that in all peer reviewed articles on the subject there is no question that this is a reality
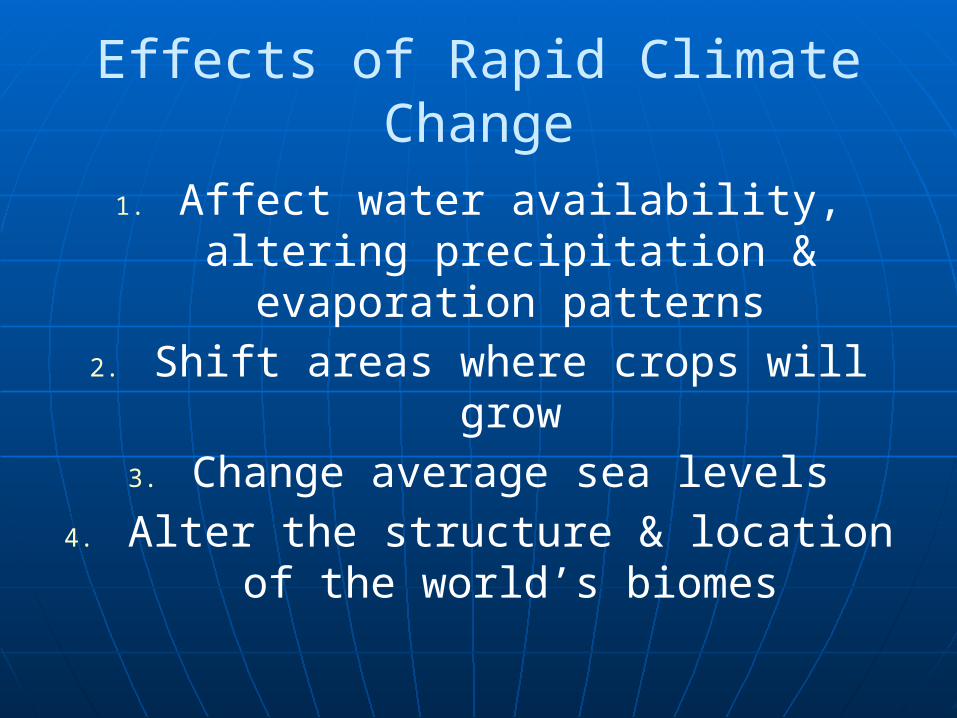
Effects of Rapid Climate Change
1. Affect water availability, altering precipitation & evaporation patterns
2. Shift areas where crops will grow3. Change average sea levels
4. Alter the structure & location of the world’s biomes
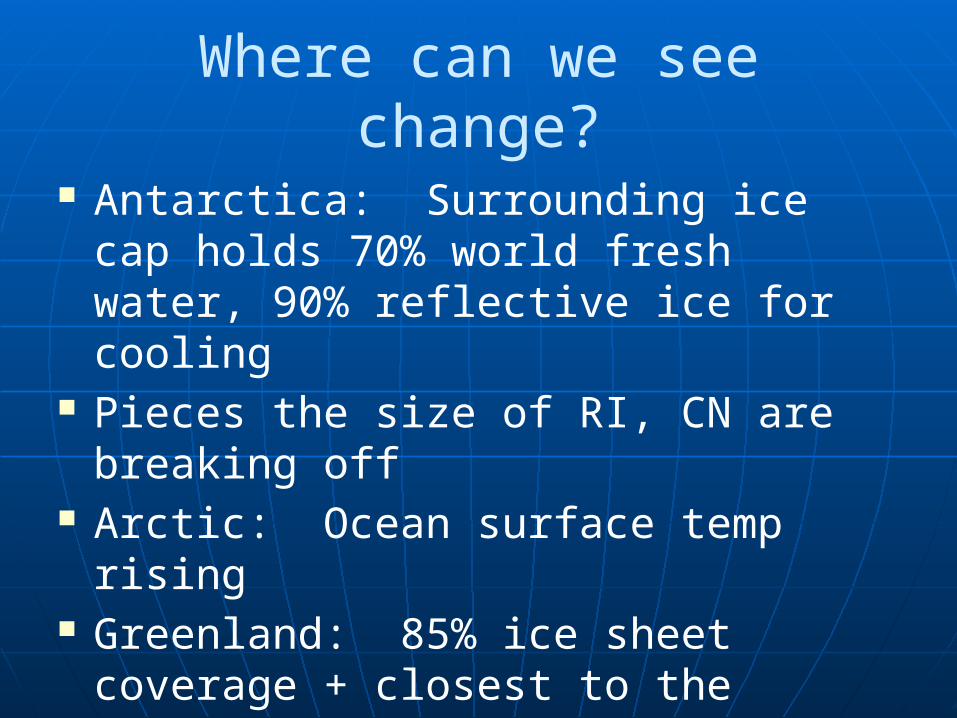
Where can we see change?
Antarctica: Surrounding ice cap holds 70% world fresh water, 90% reflective ice for cooling
Pieces the size of RI, CN are breaking off
Arctic: Ocean surface temp rising Greenland: 85% ice sheet coverage
+ closest to the equator
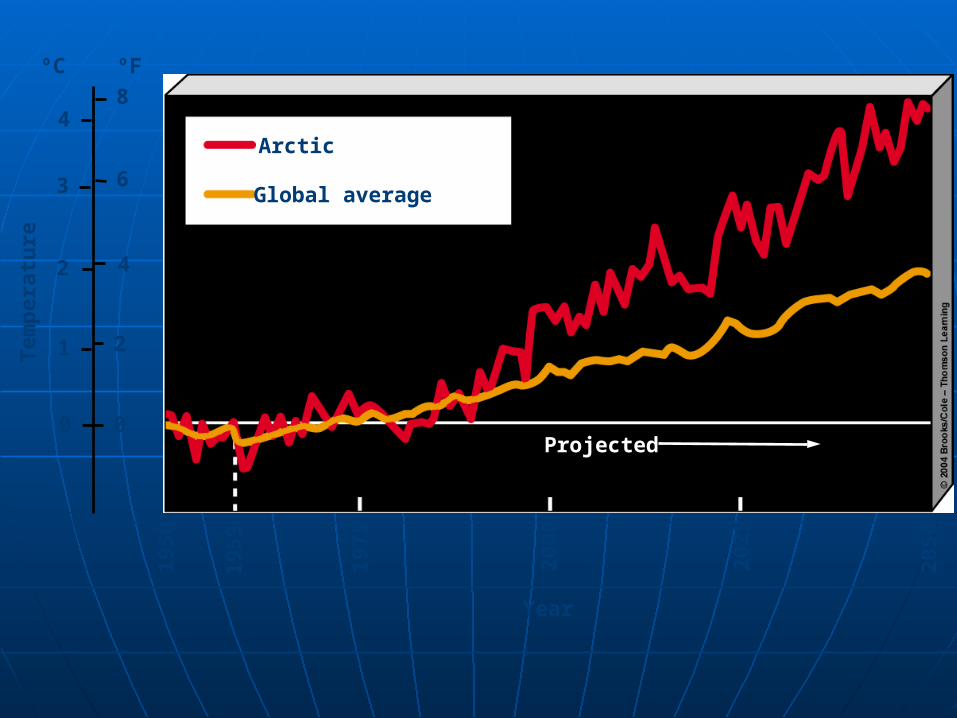
Arctic
Global average
8
6
4
2
00
1
2
3
4
ºC ºF
Tem
per
atu
re
1950
1959
1975
2000
2025
2050
Projected
Year
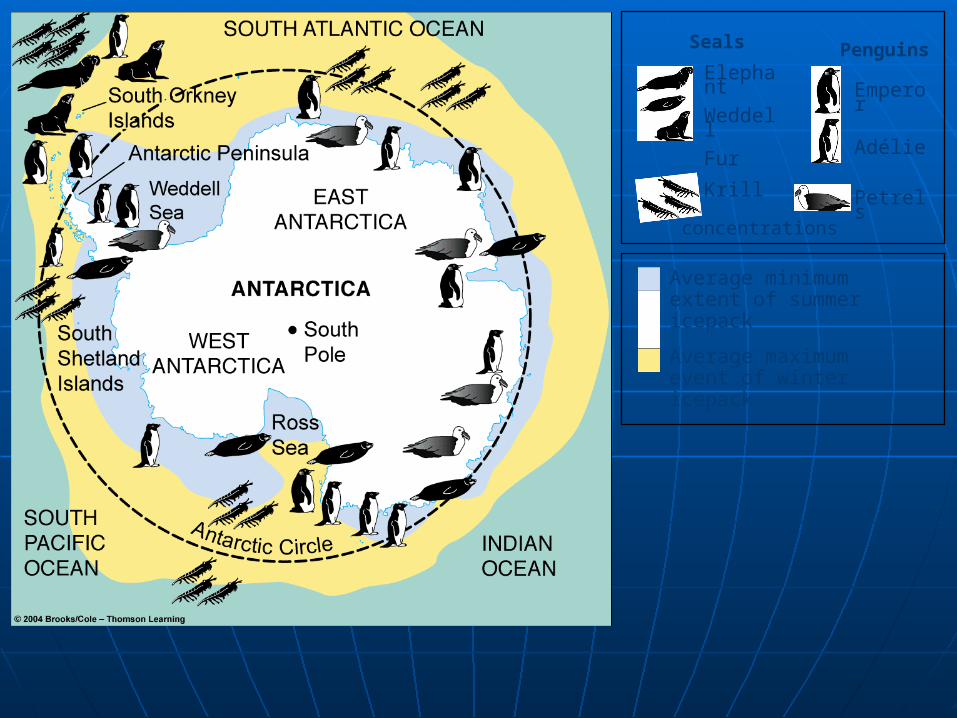
PenguinsSeals
Elephant
Weddell
Fur
Emperor
Adélie
PetrelsKrill
concentrations
Average minimumextent of summer icepack
Average maximumevent of wintericepack
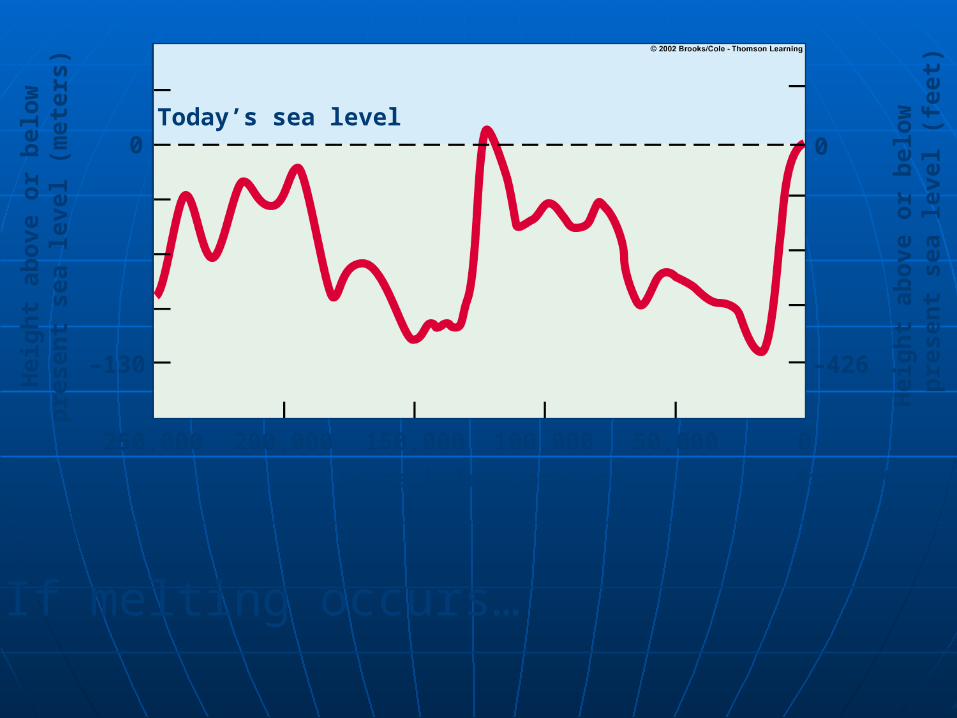
Today’s sea level
Years before present Present
250,000 200,000 150,000 100,000 50,000 0
–130
0
–426
0
Hei
gh
t ab
ove
or
bel
ow
pre
sen
t se
a le
vel
(met
ers)
Hei
gh
t ab
ove
or
bel
ow
p
rese
nt
sea
leve
l (f
eet)
If melting occurs…
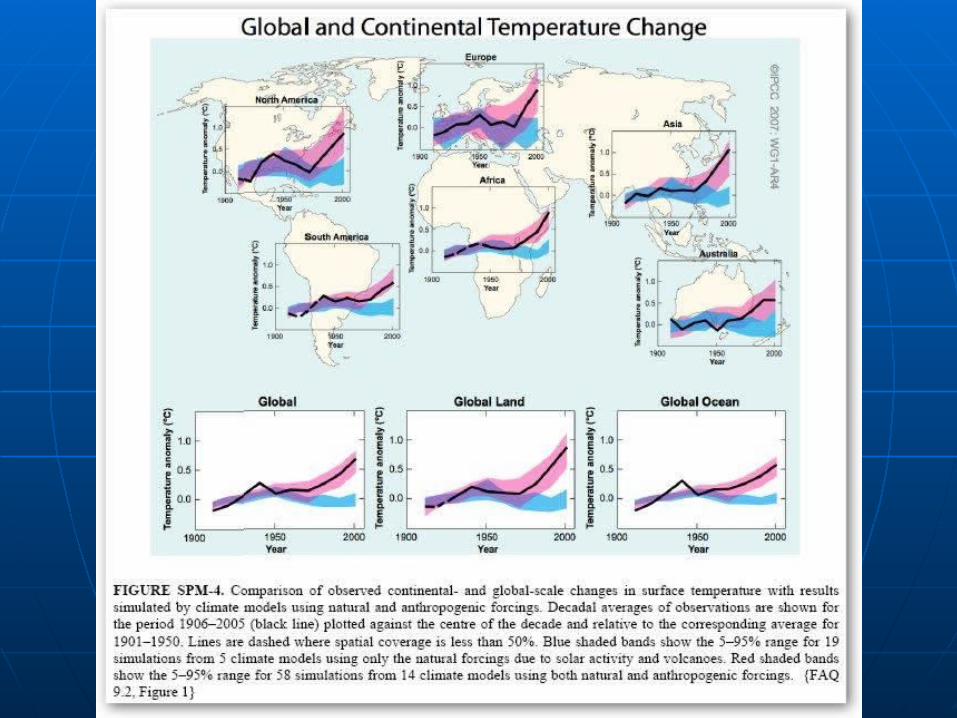
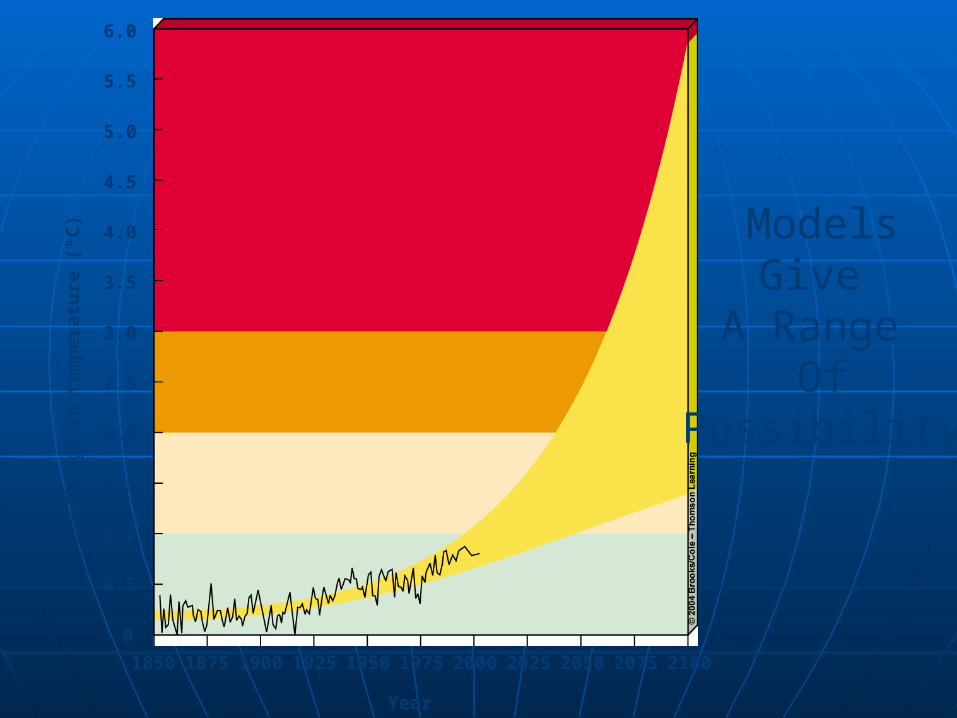
Can we project future changes?
Scientists create climate models GCM – general circulation model – represents
air circulation on earths surface Also include: (1) ocean circulation, (2) air /
ocean circulation, (3) solar input, (4) aerosols IPCC – International Panel on Climate Change
(p 455 for results)• Still debate on severity of the issue• Agree that more research necessary to
improve models
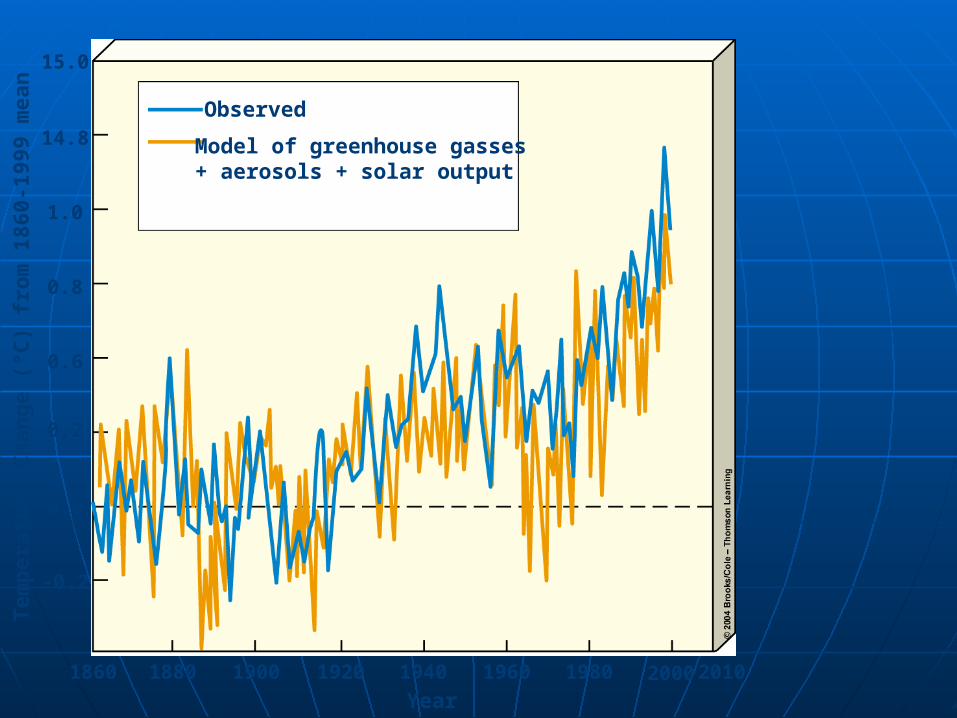
Year
Tem
per
atu
re C
han
ge
(°C
) fr
om
186
0-19
99 m
ean
1860 1880 1900 1920 1940 1960 1980 2010
-0.2
0.0
0.2
0.6
0.8
1.0
14.8
15.0
2000
Observed
Model of greenhouse gasses+ aerosols + solar output
Year
0
1850 1875 1900 1925 1950 1975 2000 2025 2050 2075 2100
0.5
1.0
1.5
2.0
2.5
3.0
3.5
4.0
4.5
5.0
5.5
6.0
Ch
ang
e i
n t
em
pe
ratu
re (
ºC) Models
Give A Range
OfPossibility

What will effect continued climate change?
Natural & Human influenced factors will effect the future of global climate
Factors may amplify current trends positive feedback
Factors may dampen current trends negative feedback
These factors could influence how fast and how much temperatures change
Also effect regional differences
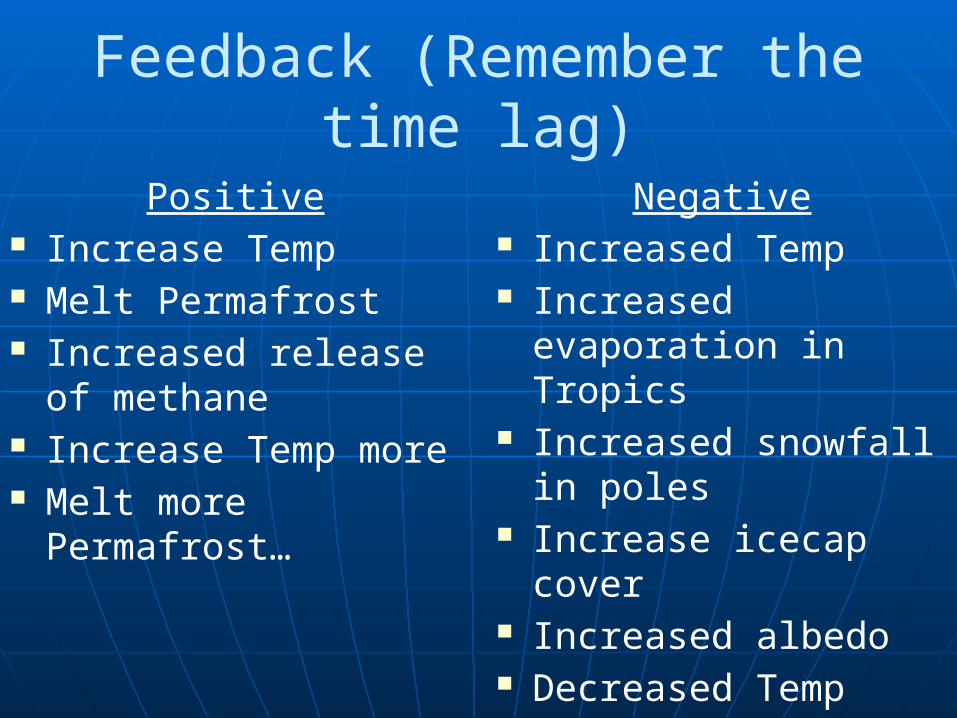
Feedback (Remember the time lag)
Positive Increase Temp Melt Permafrost Increased release of
methane Increase Temp more Melt more
Permafrost…
Negative Increased Temp Increased
evaporation in Tropics Increased snowfall in
poles Increase icecap cover Increased albedo Decreased Temp
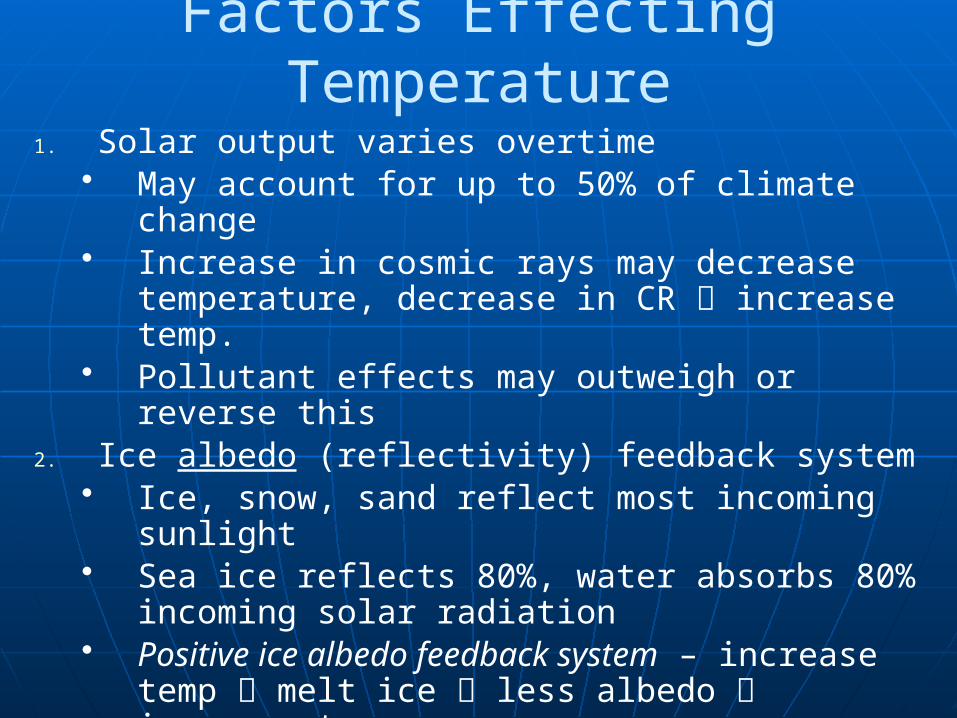
Factors Effecting Temperature
1. Solar output varies overtime• May account for up to 50% of climate change• Increase in cosmic rays may decrease
temperature, decrease in CR increase temp.• Pollutant effects may outweigh or reverse this
2. Ice albedo (reflectivity) feedback system• Ice, snow, sand reflect most incoming sunlight• Sea ice reflects 80%, water absorbs 80%
incoming solar radiation• Positive ice albedo feedback system – increase
temp melt ice less albedo increase temp …
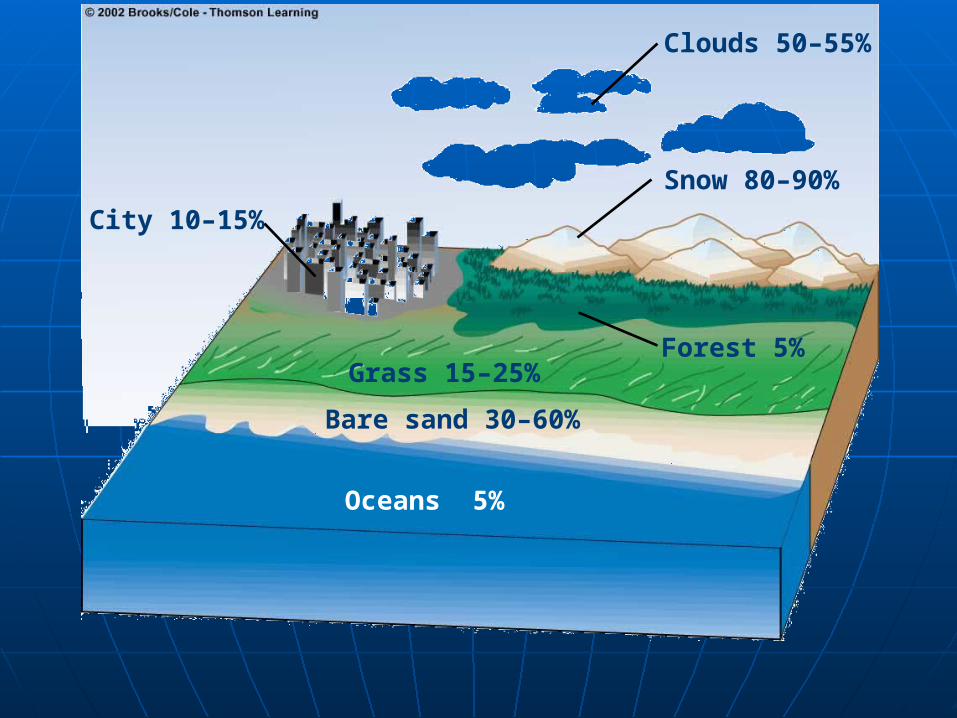
Oceans 5%
Bare sand 30–60%
Grass 15–25%
Clouds 50–55%
Snow 80–90%
City 10–15%
Forest 5%
Factors Effecting Temperature II
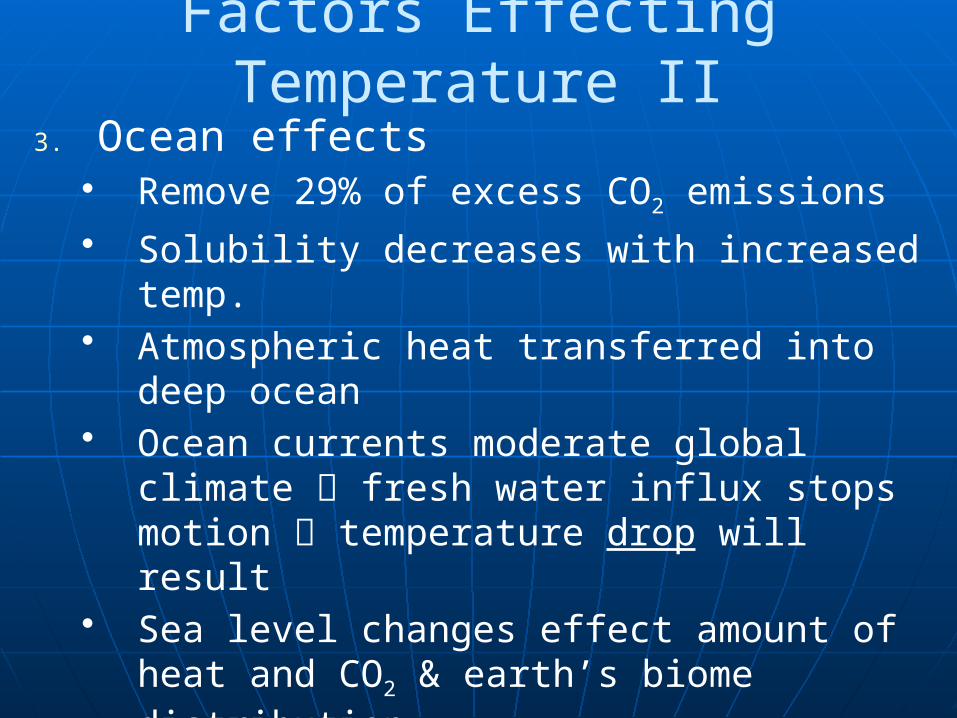
3. Ocean effects• Remove 29% of excess CO2 emissions• Solubility decreases with increased temp.• Atmospheric heat transferred into deep
ocean• Ocean currents moderate global climate
fresh water influx stops motion temperature drop will result
• Sea level changes effect amount of heat and CO2 & earth’s biome distribution
• Thermal expansion of oceans possible too
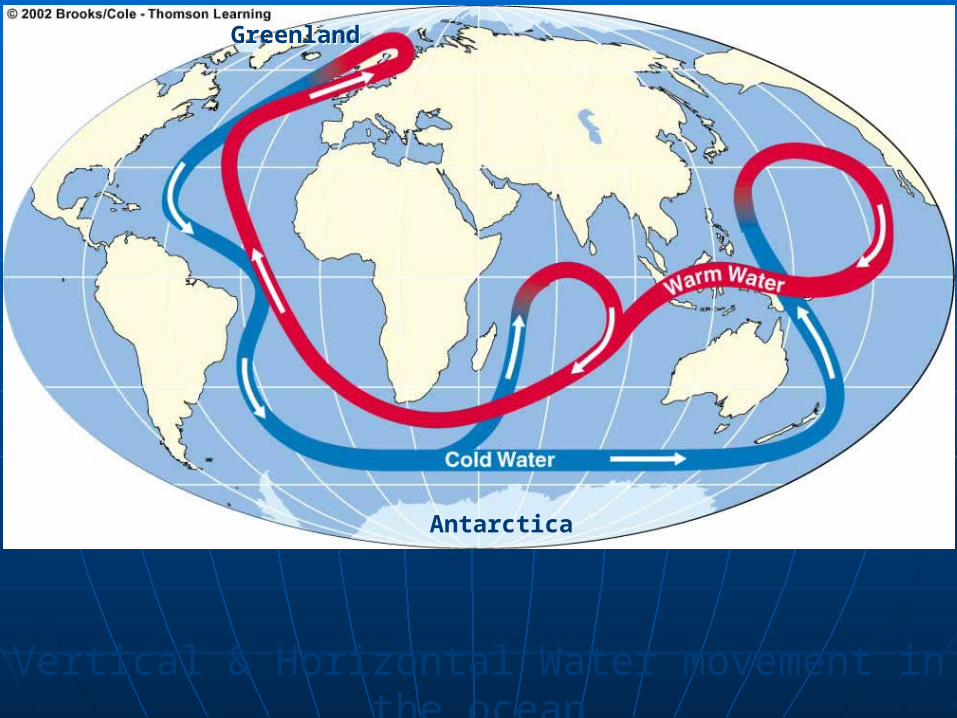
Antarctica
GreenlandGreenland
Vertical & Horizontal Water movement in the ocean
Factors Effecting Temperature III
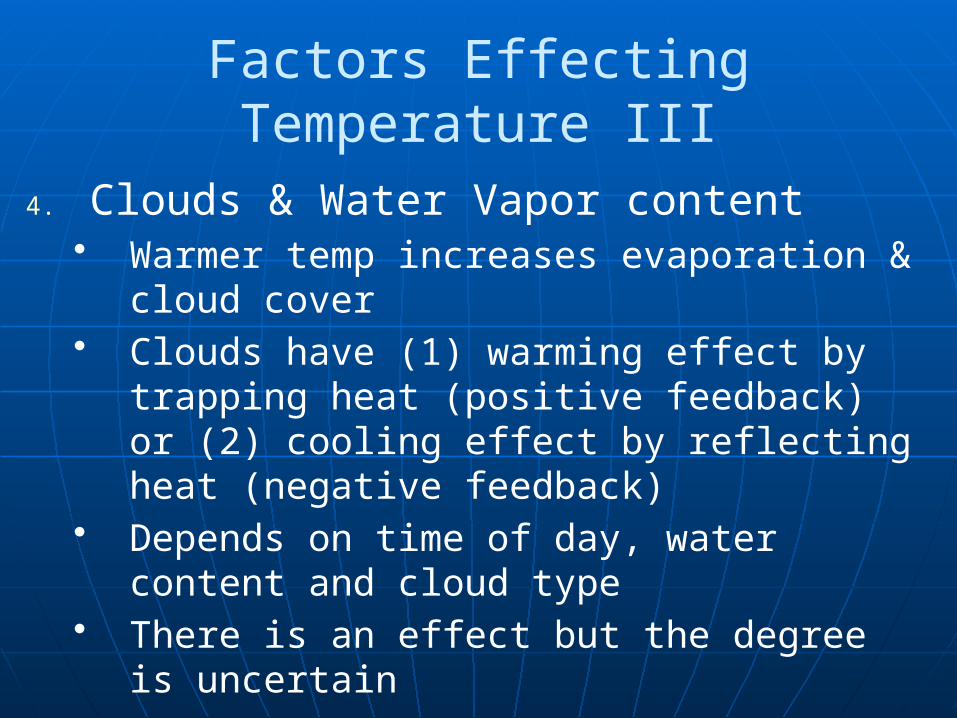
4. Clouds & Water Vapor content• Warmer temp increases evaporation &
cloud cover• Clouds have (1) warming effect by
trapping heat (positive feedback) or (2) cooling effect by reflecting heat (negative feedback)
• Depends on time of day, water content and cloud type
• There is an effect but the degree is uncertain
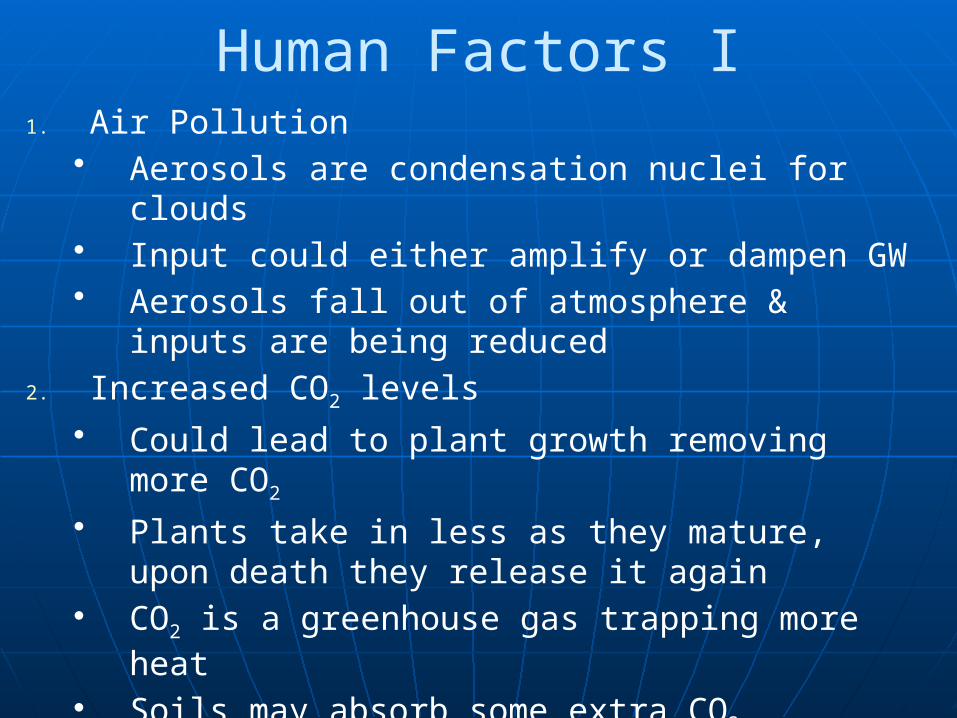
Human Factors I1. Air Pollution
• Aerosols are condensation nuclei for clouds• Input could either amplify or dampen GW• Aerosols fall out of atmosphere & inputs are
being reduced2. Increased CO2 levels
• Could lead to plant growth removing more CO2
• Plants take in less as they mature, upon death they release it again
• CO2 is a greenhouse gas trapping more heat
• Soils may absorb some extra CO2
Human Factors II
3. Greenhouse gas production• Power production, Land clearing
practices, Transportation• Regional input global distribution• Lifestyle dependency on this process
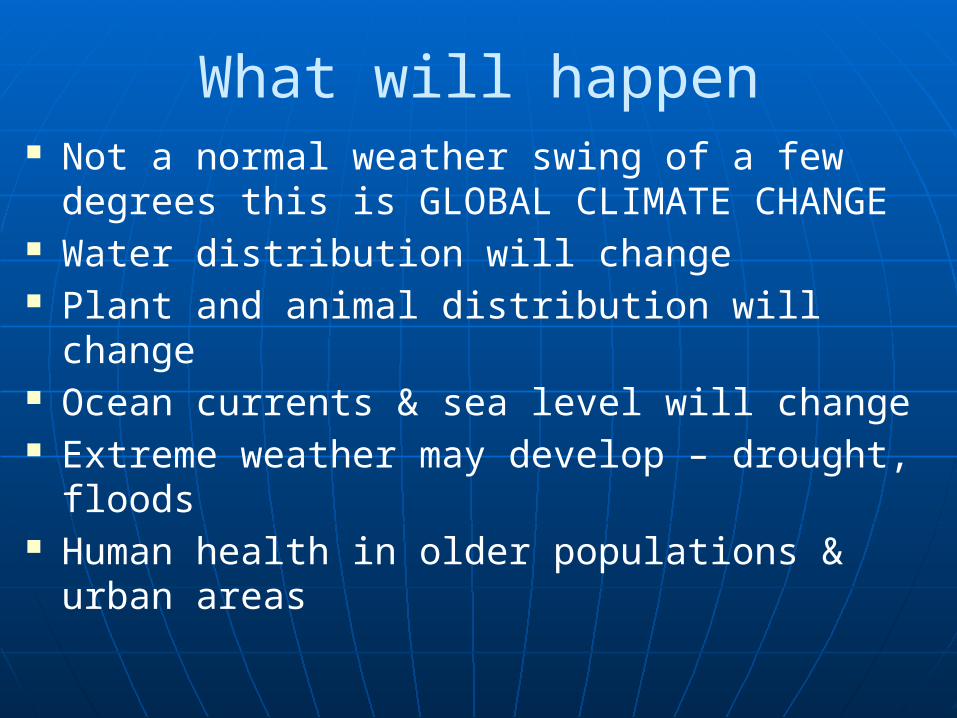
What will happen Not a normal weather swing of a few degrees
this is GLOBAL CLIMATE CHANGE Water distribution will change Plant and animal distribution will change Ocean currents & sea level will change Extreme weather may develop – drought,
floods Human health in older populations & urban
areas
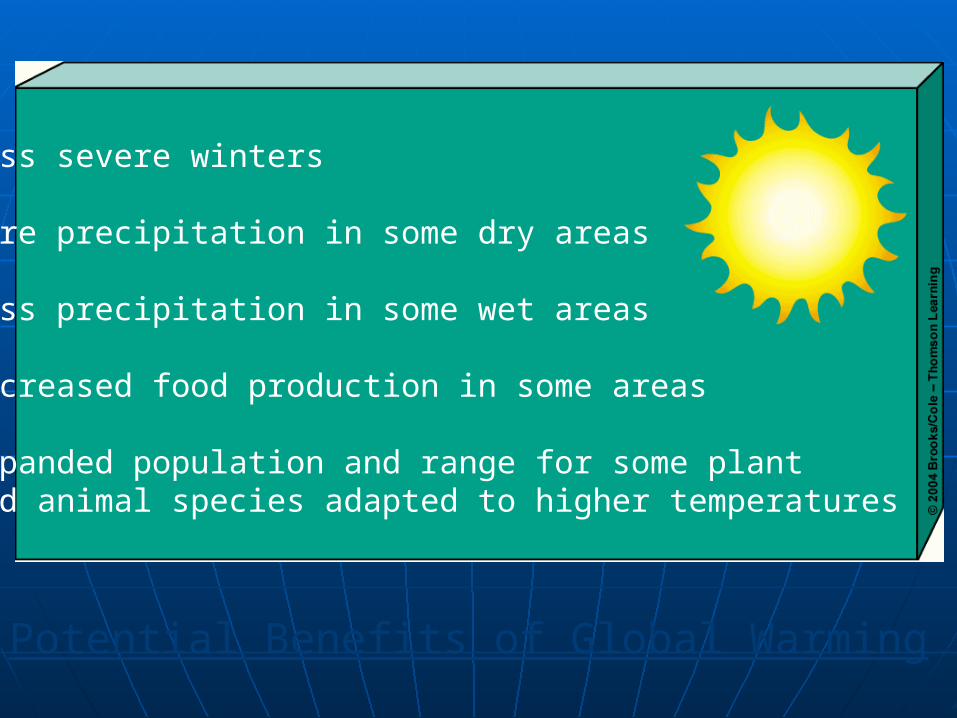
• Less severe winters
• More precipitation in some dry areas
• Less precipitation in some wet areas • Increased food production in some areas
• Expanded population and range for some plant and animal species adapted to higher temperatures
Potential Benefits of Global Warming
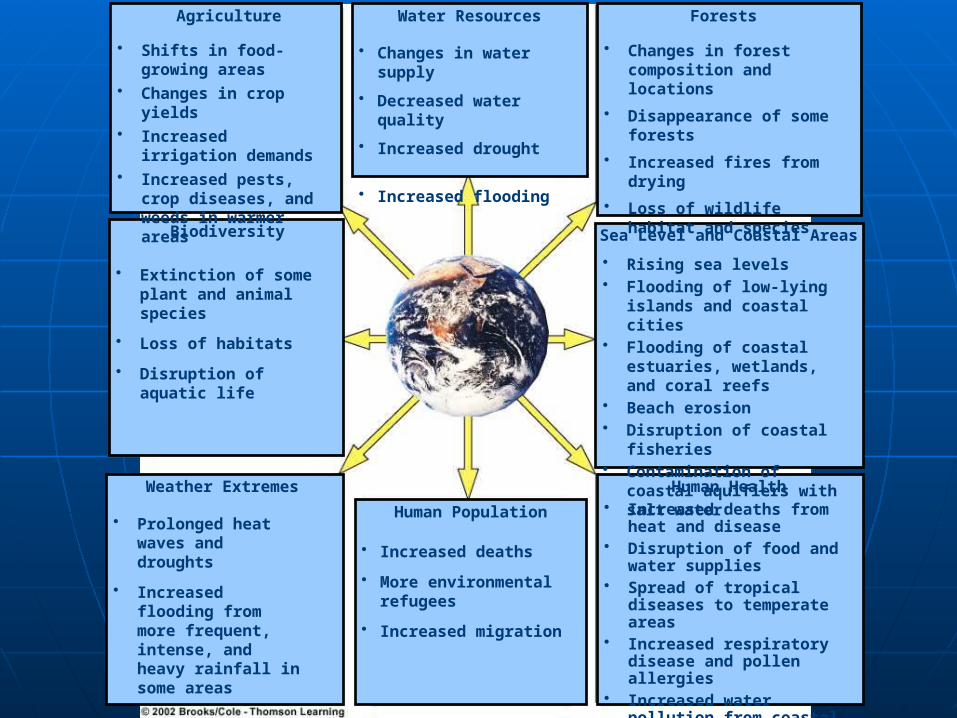
• Increased deaths from heat and disease
• Disruption of food and water supplies
• Spread of tropical diseases to temperate areas
• Increased respiratory disease and pollen allergies
• Increased water pollution from coastal flooding
Human Health
• Rising sea levels• Flooding of low-lying islands
and coastal cities• Flooding of coastal estuaries,
wetlands, and coral reefs• Beach erosion• Disruption of coastal
fisheries• Contamination of coastal
aquifiers with salt water
Sea Level and Coastal Areas
• Changes in forest composition and locations
• Disappearance of some forests
• Increased fires from drying
• Loss of wildlife habitat and species
Forests
• Changes in water supply
• Decreased water quality
• Increased drought
• Increased flooding
Water Resources
• Shifts in food-growing areas
• Changes in crop yields• Increased irrigation
demands• Increased pests, crop
diseases, and weeds in warmer areas
Agriculture
• Extinction of some plant and animal species
• Loss of habitats
• Disruption of aquatic life
Biodiversity
• Prolonged heat waves and droughts
• Increased flooding from more frequent, intense, and heavy rainfall in some areas
Weather Extremes
• Increased deaths
• More environmental refugees
• Increased migration
Human Population
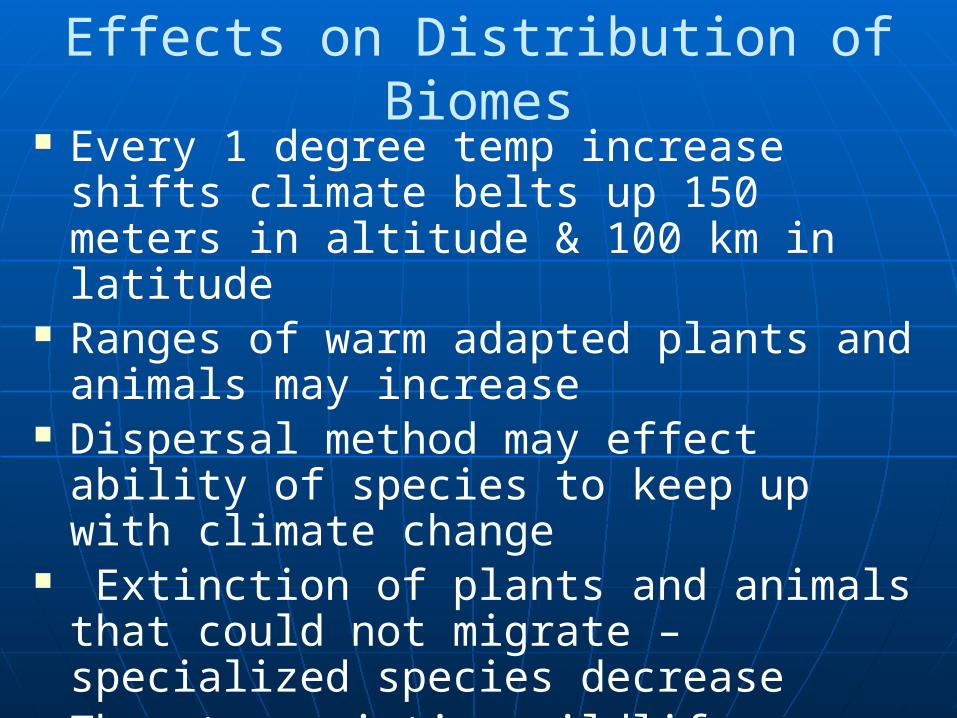
Effects on Distribution of Biomes Every 1 degree temp increase shifts
climate belts up 150 meters in altitude & 100 km in latitude
Ranges of warm adapted plants and animals may increase
Dispersal method may effect ability of species to keep up with climate change
Extinction of plants and animals that could not migrate – specialized species decrease
Threaten existing wildlife reserves, parks, wetlands & coral reefs
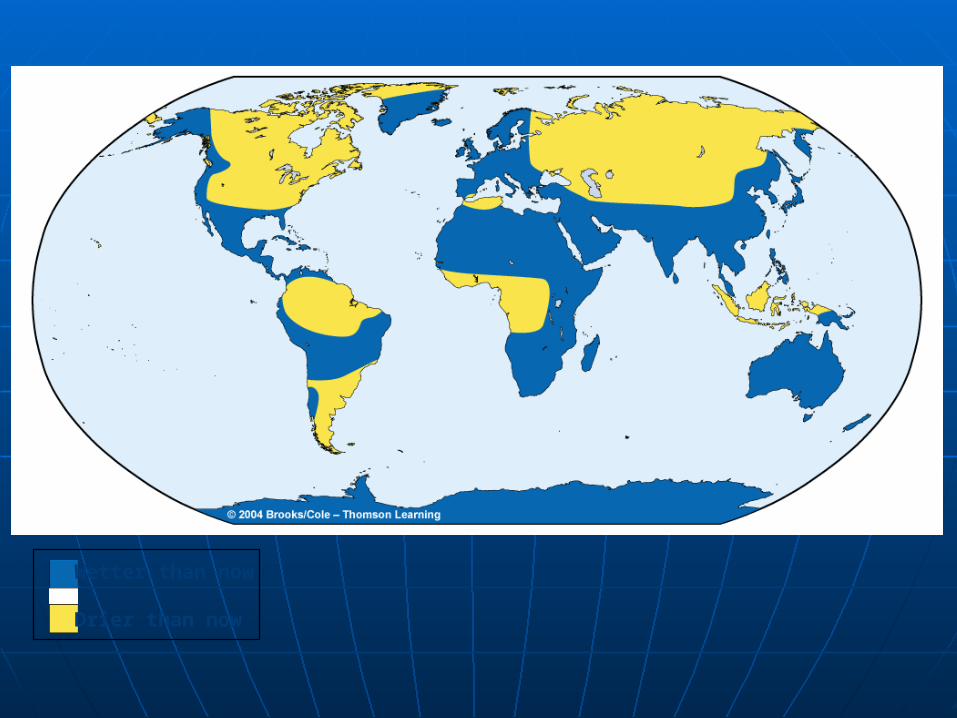
Wetter than now
Drier than now
Global agricultural regions will change characteristics
Decreased production in some areas
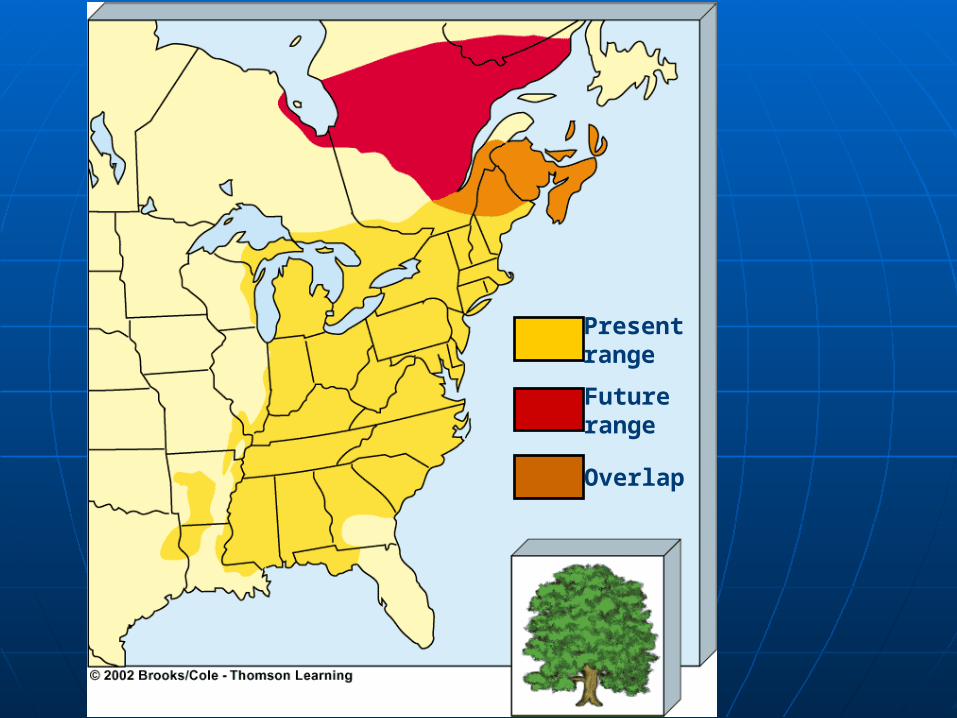
Presentrange
Futurerange
Overlap
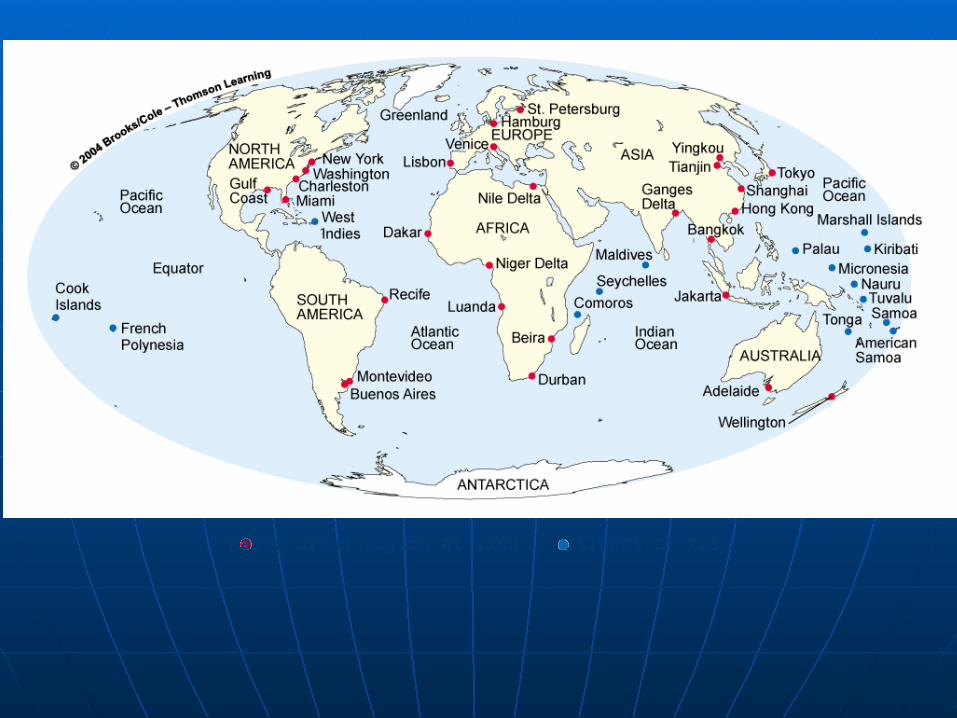
Major urban region at risk Islands at risk

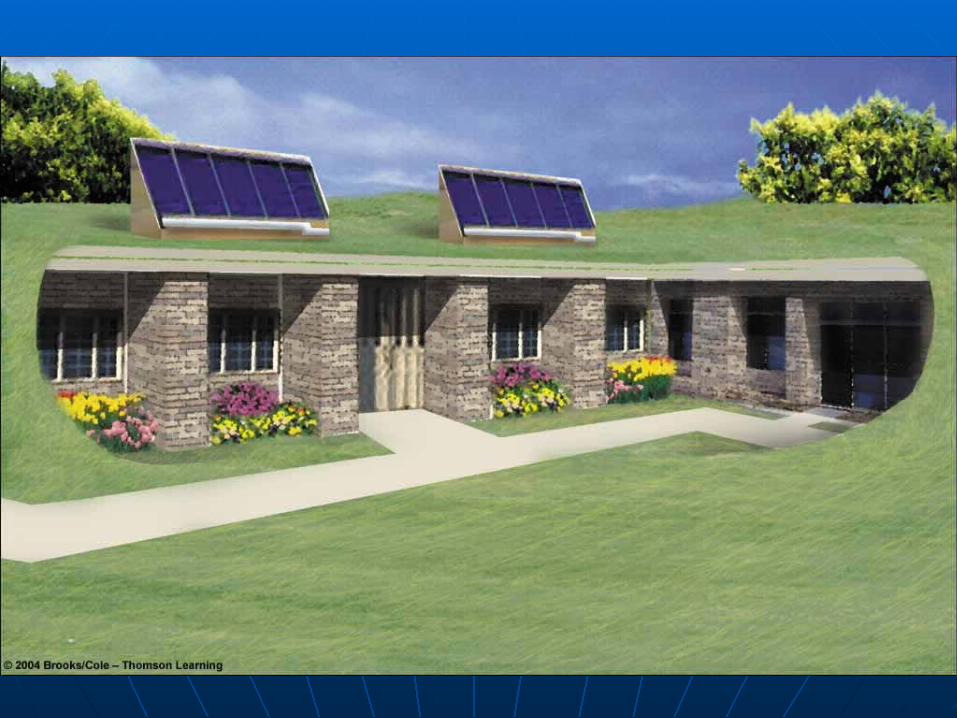
What can you do in your own life to effect local green
house emissions?
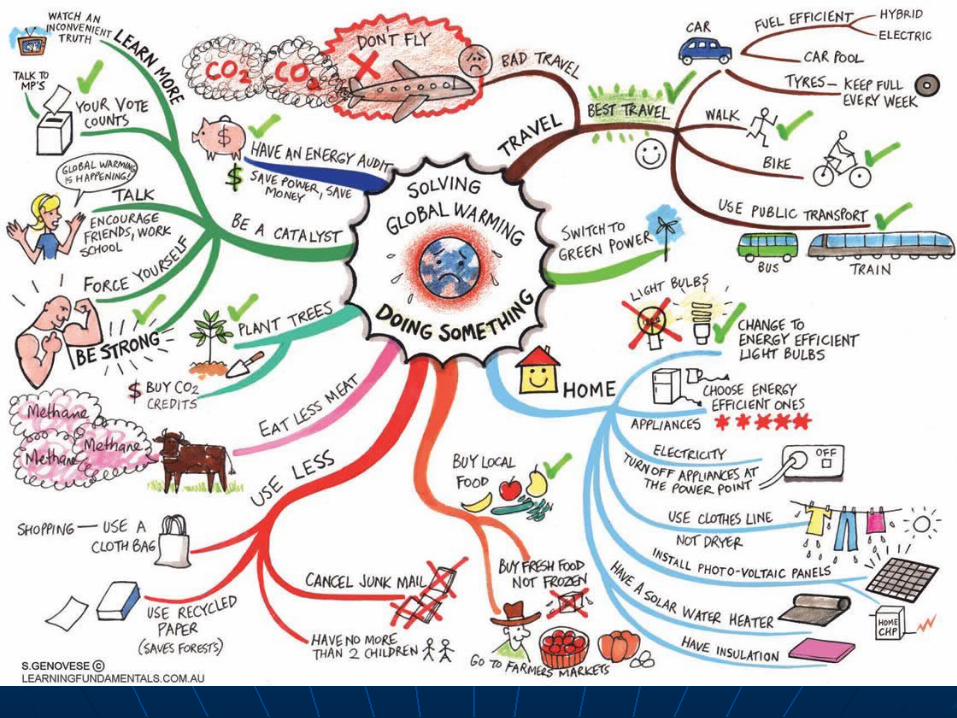
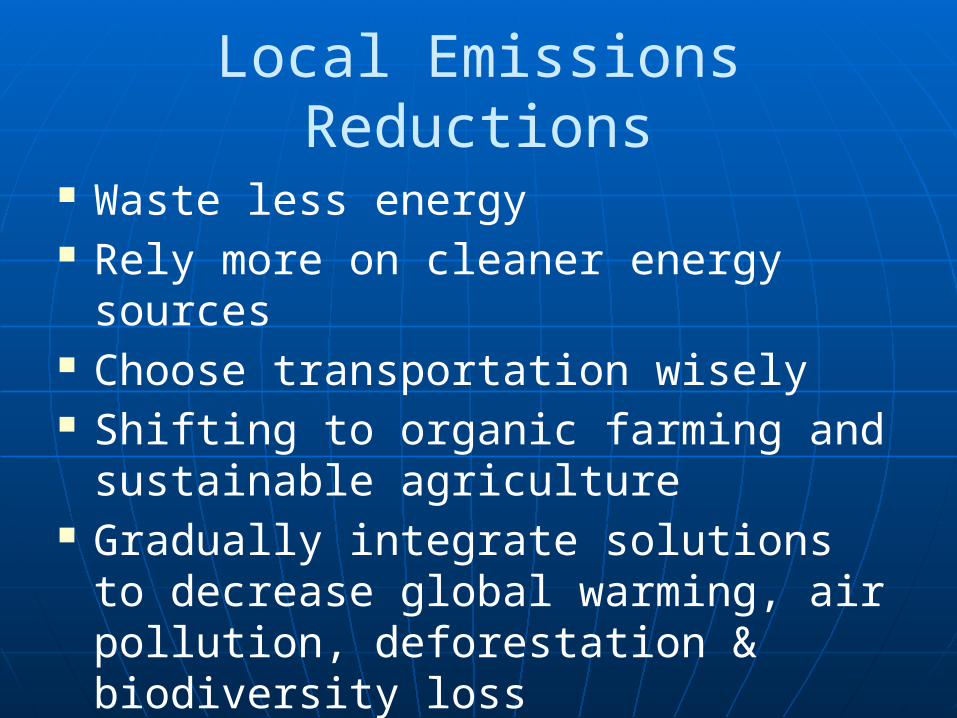
Local Emissions Reductions
Waste less energy Rely more on cleaner energy sources Choose transportation wisely Shifting to organic farming and
sustainable agriculture Gradually integrate solutions to
decrease global warming, air pollution, deforestation & biodiversity loss
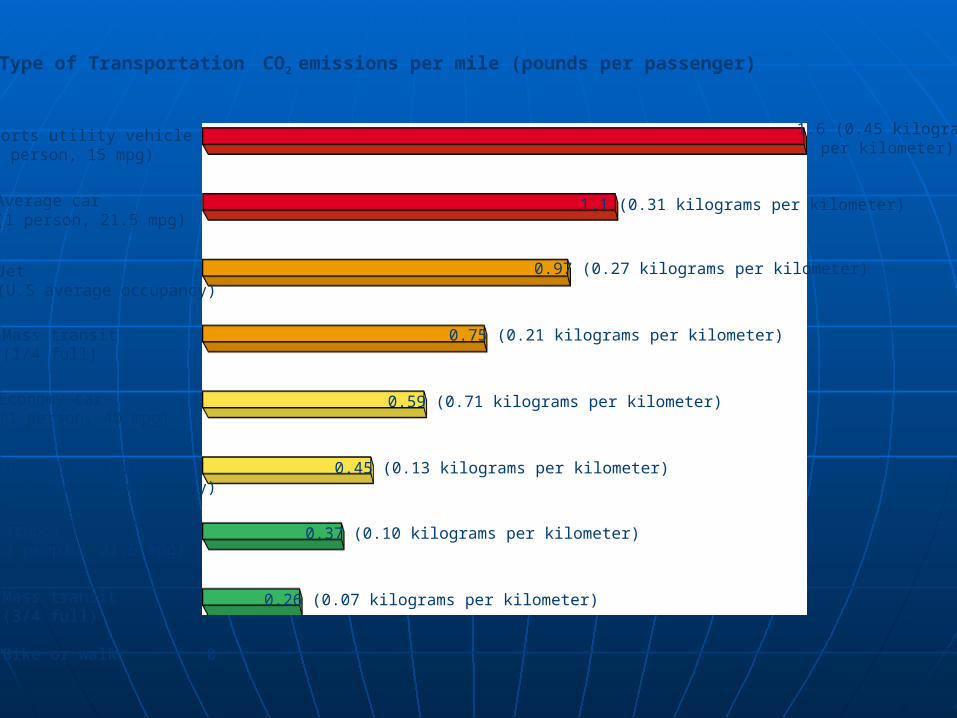
CO2 emissions per mile (pounds per passenger)Type of Transportation
1.6 (0.45 kilogramsper kilometer)
Sports utility vehicle(1 person, 15 mpg)
Average car(1 person, 21.5 mpg)
Jet(U.S average occupancy)
Mass transit(1/4 full)
Economy car(1 person, 40 mpg)
Intercity train(U.S average occupancy)
Carpool(3 people, 21.5 mpg)
Mass transit(3/4 full)
Bike or walk 0
1.1 (0.31 kilograms per kilometer)
0.97 (0.27 kilograms per kilometer)
0.75 (0.21 kilograms per kilometer)
0.59 (0.71 kilograms per kilometer)
0.45 (0.13 kilograms per kilometer)
0.37 (0.10 kilograms per kilometer)
0.26 (0.07 kilograms per kilometer)
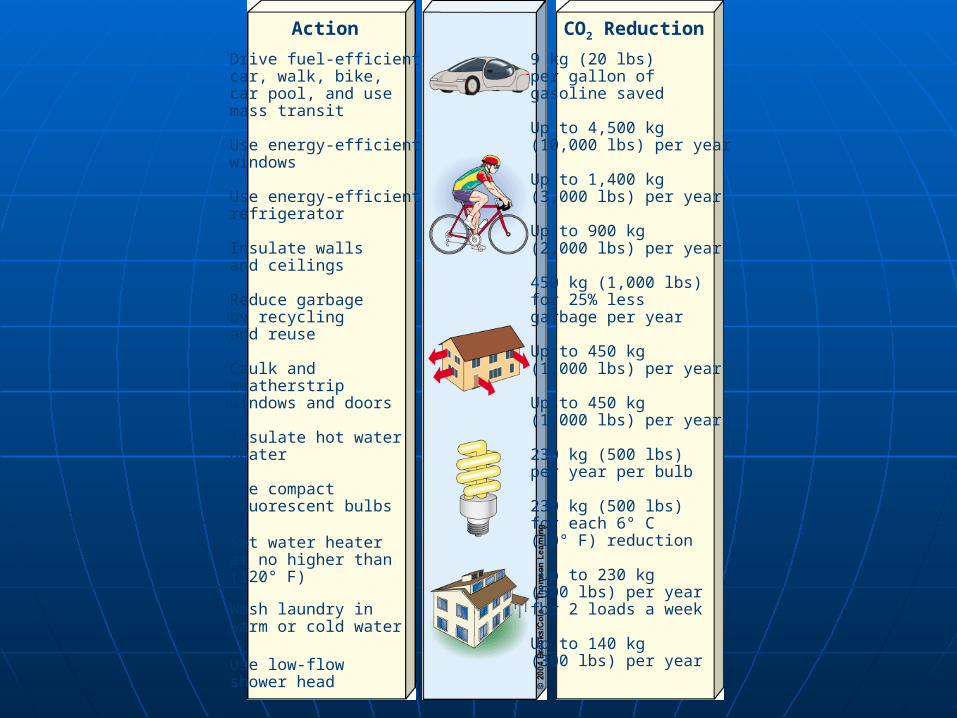
Action CO2 Reduction
Drive fuel-efficientcar, walk, bike, car pool, and use mass transit Use energy-efficient windows Use energy-efficient refrigerator Insulate wallsand ceilings Reduce garbageby recyclingand reuse Caulk andweatherstripwindows and doors Insulate hot waterheater Use compactfluorescent bulbs
Set water heaterat no higher than (120° F)
Wash laundry inwarm or cold water
Use low-flowshower head
9 kg (20 lbs)per gallon ofgasoline saved Up to 4,500 kg(10,000 lbs) per year Up to 1,400 kg(3,000 lbs) per year Up to 900 kg(2,000 lbs) per year 450 kg (1,000 lbs)for 25% lessgarbage per year
Up to 450 kg(1,000 lbs) per year Up to 450 kg(1,000 lbs) per year 230 kg (500 lbs)per year per bulb
230 kg (500 lbs)for each 6° C(10° F) reduction
Up to 230 kg(500 lbs) per yearfor 2 loads a week Up to 140 kg(300 lbs) per year
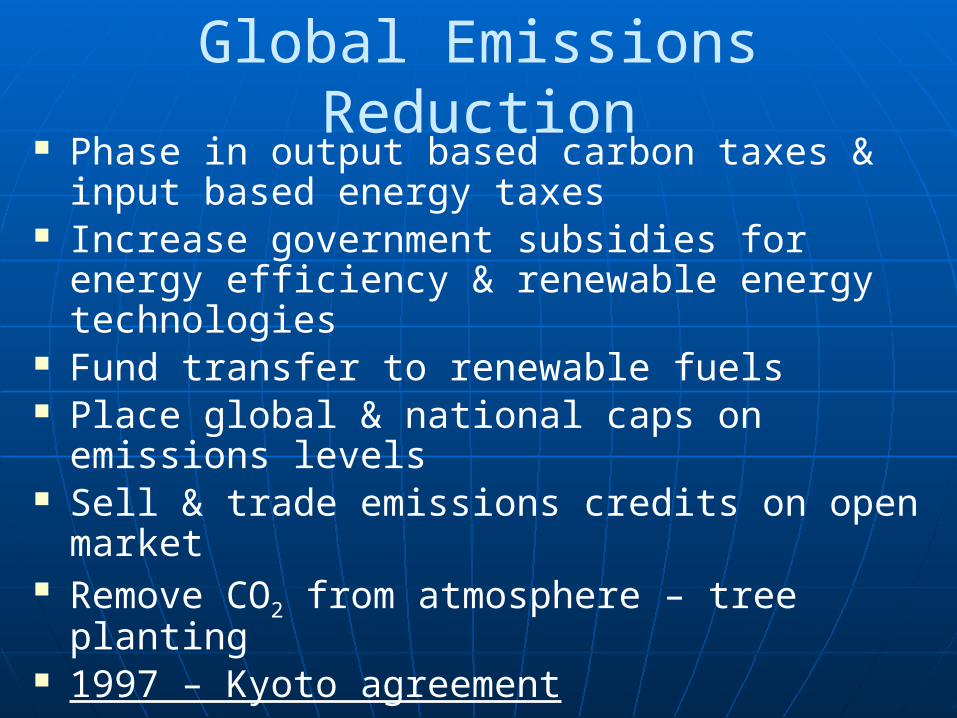
Global Emissions Reduction Phase in output based carbon taxes & input
based energy taxes Increase government subsidies for energy
efficiency & renewable energy technologies Fund transfer to renewable fuels Place global & national caps on emissions
levels Sell & trade emissions credits on open market Remove CO2 from atmosphere – tree planting 1997 – Kyoto agreement
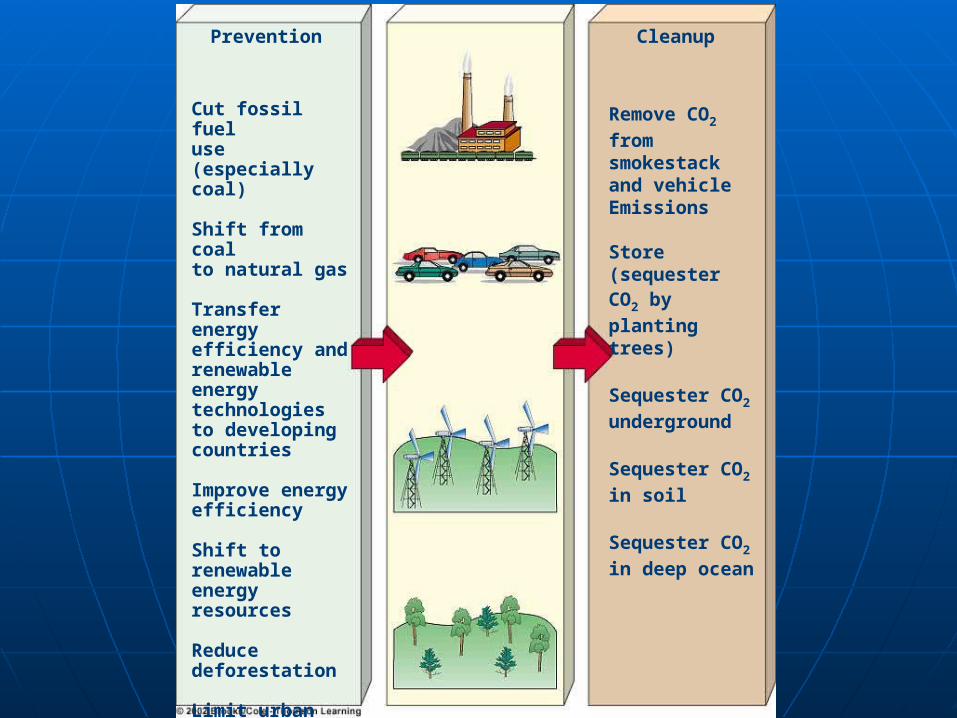
Prevention Cleanup
Cut fossil fueluse (especiallycoal)
Shift from coalto natural gas
Transfer energyefficiency andrenewable energytechnologiesto developingcountries
Improve energyefficiency
Shift torenewableenergy resources
Reducedeforestation
Limit urban spawl
Slow populationgrowth
Remove CO2
from smokestackand vehicleEmissions
Store (sequesterCO2 by planting
trees)
Sequester CO2
underground
Sequester CO2
in soil
Sequester CO2
in deep ocean
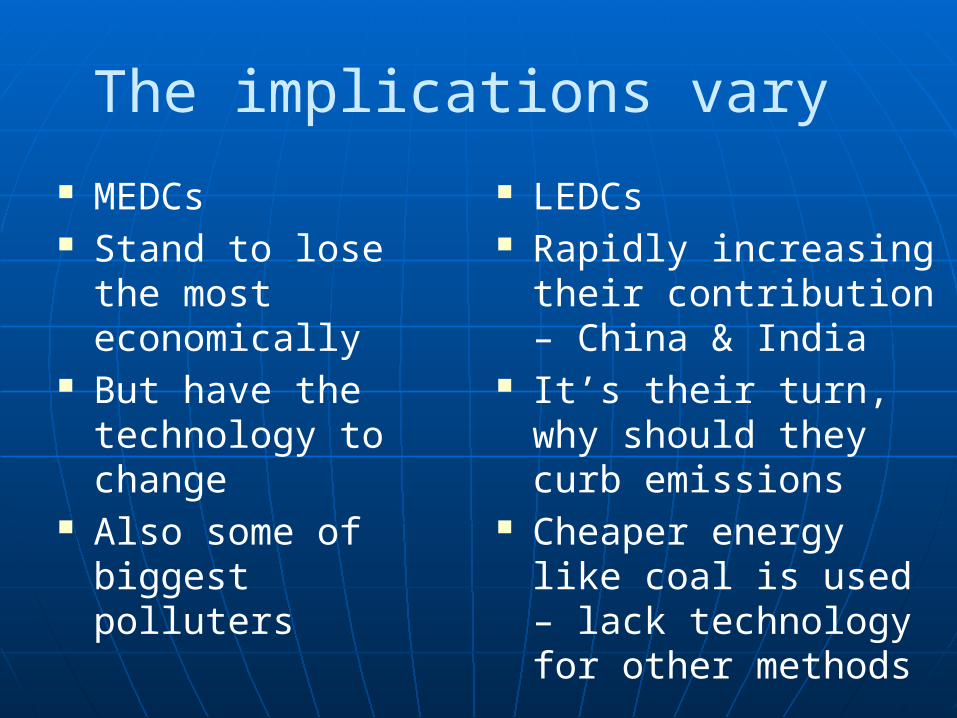
The implications vary
MEDCs Stand to lose the
most economically But have the
technology to change
Also some of biggest polluters
LEDCs Rapidly increasing
their contribution – China & India
It’s their turn, why should they curb emissions
Cheaper energy like coal is used – lack technology for other methods
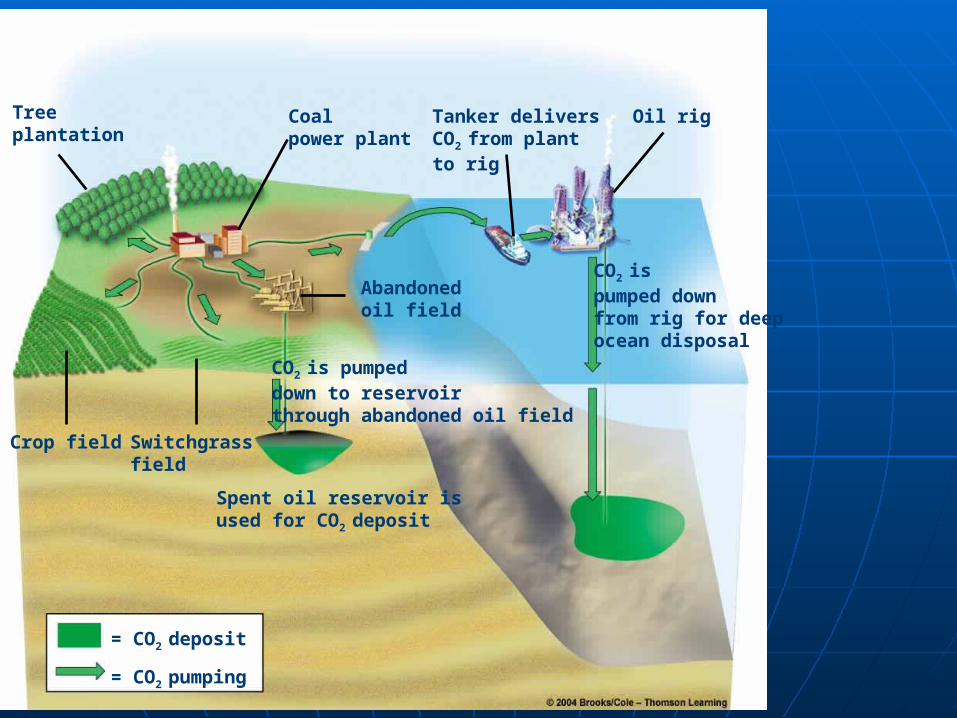
Figure 18-21Page 467Tree
plantationCoalpower plant
Tanker deliversCO2 from plantto rig
Oil rig
Crop field Switchgrassfield
Spent oil reservoir isused for CO2 deposit
CO2 is pumpeddown to reservoir through abandoned oil field
Abandonedoil field
CO2 ispumped downfrom rig for deepocean disposal
= CO2 deposit
= CO2 pumping
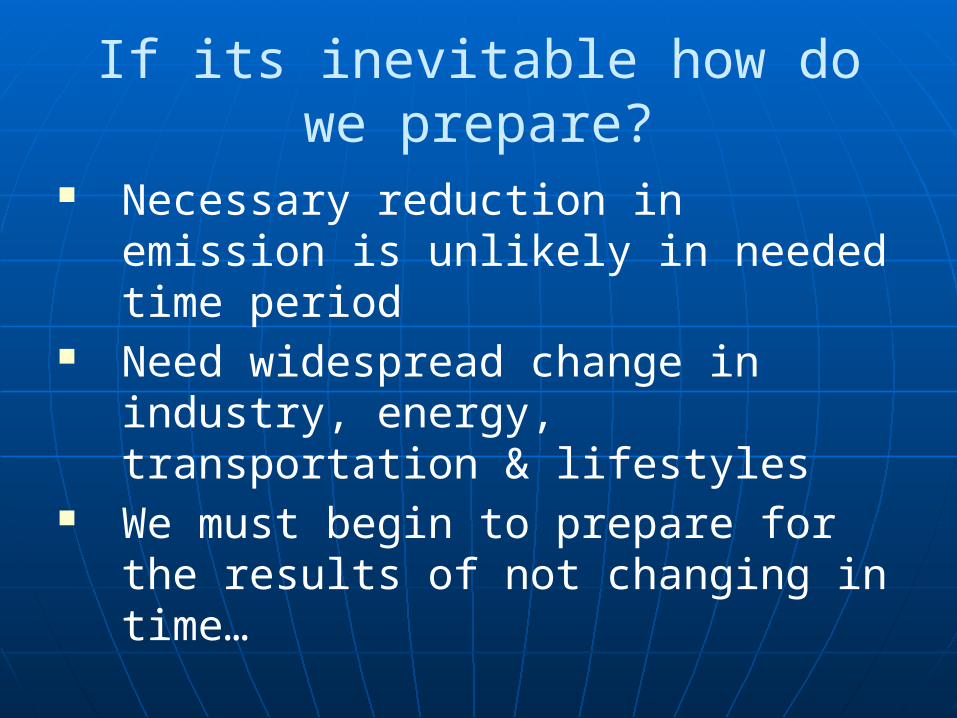
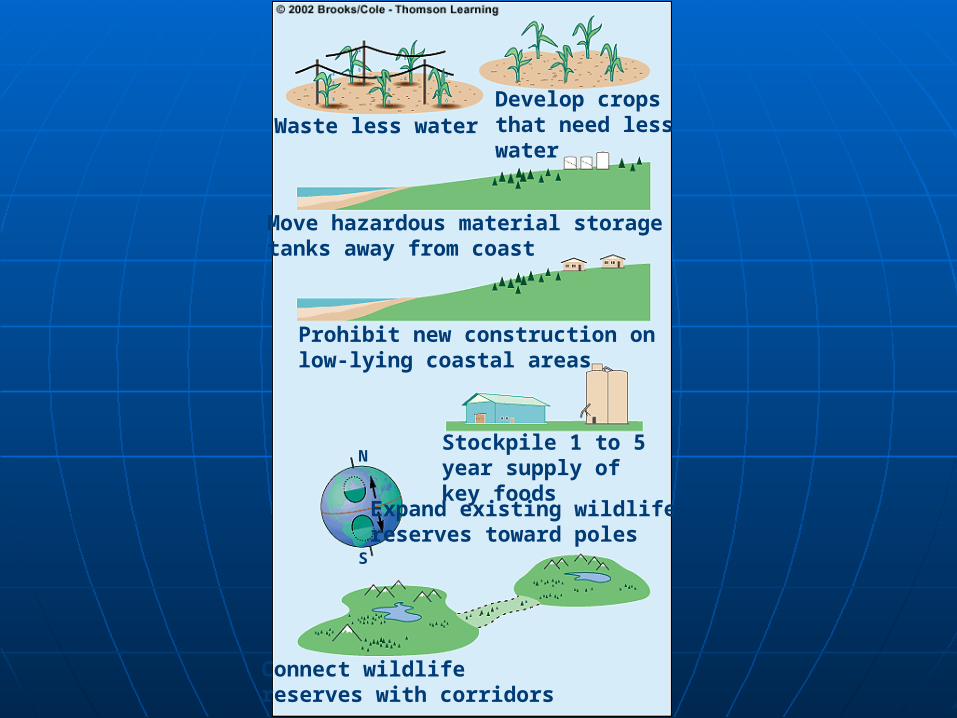
If its inevitable how do we prepare?
Necessary reduction in emission is unlikely in needed time period
Need widespread change in industry, energy, transportation & lifestyles
We must begin to prepare for the results of not changing in time…
N
S
Waste less waterDevelop crops that need less water
Move hazardous material storage tanks away from coast
Prohibit new construction on low-lying coastal areas
Stockpile 1 to 5 year supply of key foods
Expand existing wildlife reserves toward poles
Connect wildlife reserves with corridors

So what’s the argument?
Realize even now there are dissenters
Based on• The complexity of the problem• The uncertainty of computer models• The percieved potential harm that will
be caused economic cascade caused by doing something about it
But remember the precautionary principle• If an action is potentially harmful it is
the responsibility of the group causing the harm to prove that it is not, rather than those being harmed having to prove that they are
• Better safe than sorry


Canada
China
Russia
Japan
India
Germany
United Kingdom
United States
Italy
France
25.5%
11.2%
6.7%
5.1%
4.1%
3.9%
2.6%
2.5%
2.0%
1.8%
Contribution to Global Total (1%)
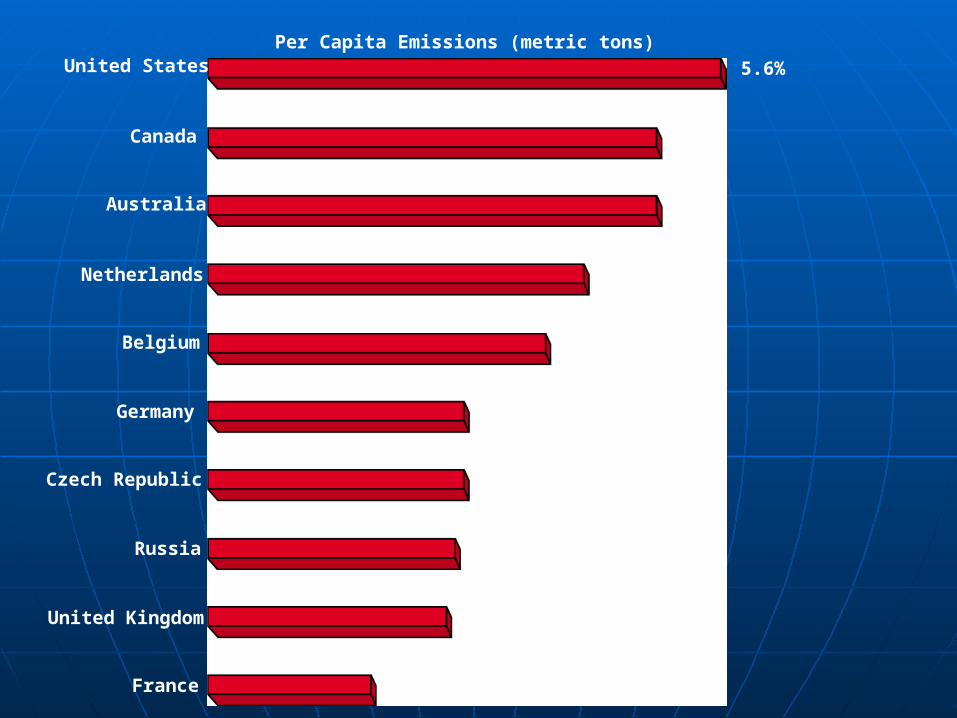
Russia
Canada
Australia
Netherlands
Belgium
Germany
Czech Republic
United States
United Kingdom
France
5.6%
4.9%
4.9%
4.1%
3.7%
2.8%
2.8%
2.7%
2.6%
1.8%
Per Capita Emissions (metric tons)
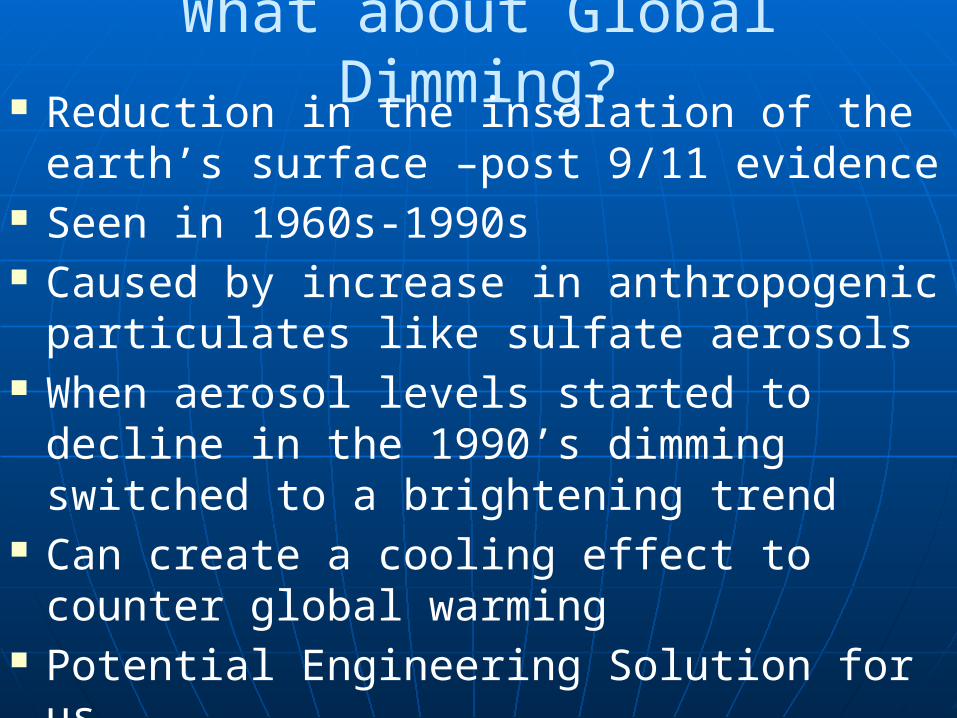
What about Global Dimming? Reduction in the insolation of the earth’s
surface –post 9/11 evidence Seen in 1960s-1990s Caused by increase in anthropogenic
particulates like sulfate aerosols When aerosol levels started to decline in
the 1990’s dimming switched to a brightening trend
Can create a cooling effect to counter global warming
Potential Engineering Solution for us

You should be able to evaluate the contrasting human perceptions on this issue
Explore / defend your position based on this evaluation

Remember your choices will
determine our future
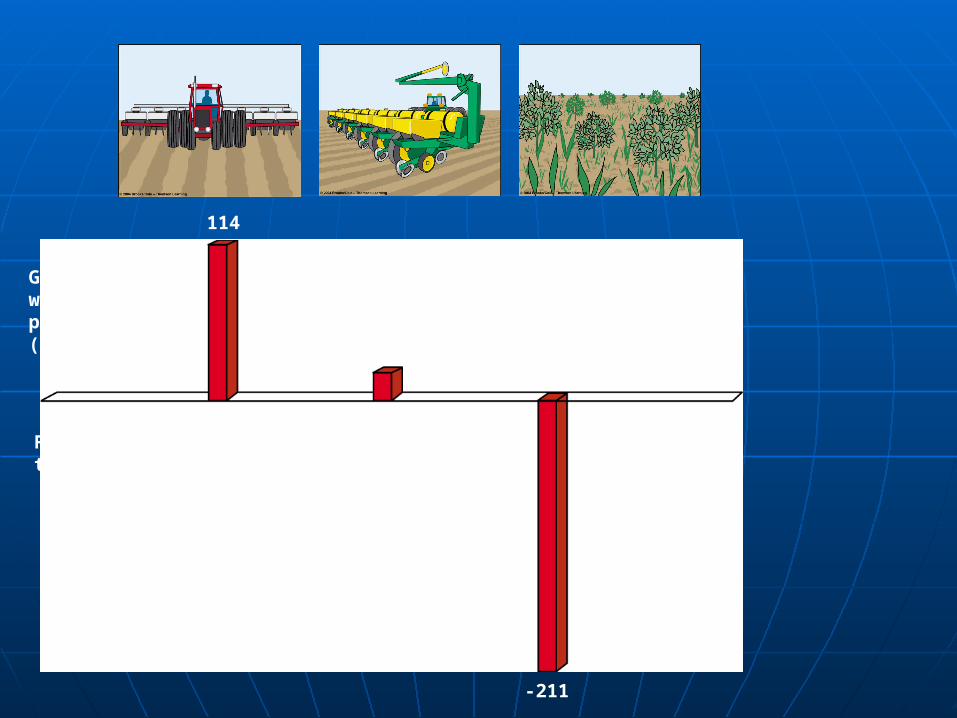
-211
114
14
Globalwarmingpotential(GWP)
Fieldtype
Conventionaltillage
No-tillcultivation
Conservationreserve