Embed Size (px)
Citation preview
Credit Research Analysis December 21, 2016
Abhinav Ananta
+1 617 599 4129 Credit Research & Strategy Page 1
Scientific Games Corp. (TICKER: SGMS)
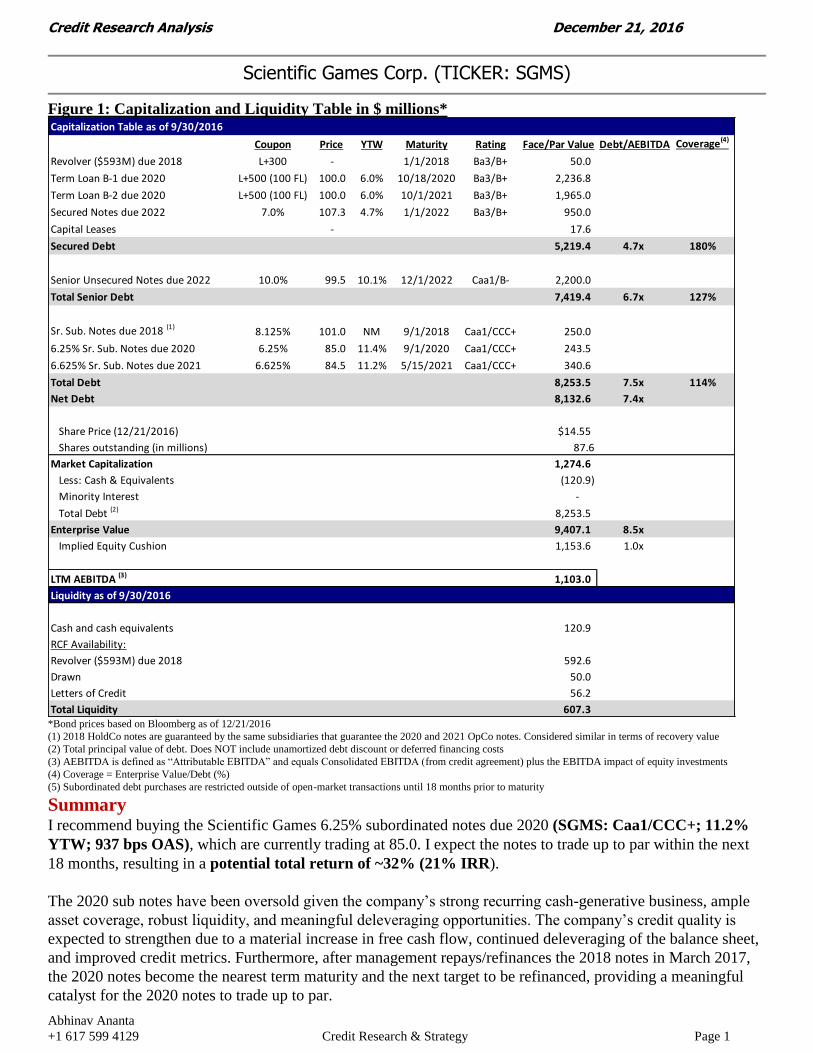
Figure 1: Capitalization and Liquidity Table in $ millions* Capitalization Table as of 9/30/2016
Coupon Price YTW Maturity Rating Face/Par Value Debt/AEBITDA Coverage(4)
Revolver ($593M) due 2018 L+300 - 1/1/2018 Ba3/B+ 50.0
Term Loan B-1 due 2020 L+500 (100 FL) 100.0 6.0% 10/18/2020 Ba3/B+ 2,236.8
Term Loan B-2 due 2020 L+500 (100 FL) 100.0 6.0% 10/1/2021 Ba3/B+ 1,965.0
Secured Notes due 2022 7.0% 107.3 4.7% 1/1/2022 Ba3/B+ 950.0
Capital Leases - 17.6
Secured Debt 5,219.4 4.7x 180%
Senior Unsecured Notes due 2022 10.0% 99.5 10.1% 12/1/2022 Caa1/B- 2,200.0
Total Senior Debt 7,419.4 6.7x 127%
Sr. Sub. Notes due 2018 (1)8.125% 101.0 NM 9/1/2018 Caa1/CCC+ 250.0
6.25% Sr. Sub. Notes due 2020 6.25% 85.0 11.4% 9/1/2020 Caa1/CCC+ 243.5
6.625% Sr. Sub. Notes due 2021 6.625% 84.5 11.2% 5/15/2021 Caa1/CCC+ 340.6
Total Debt 8,253.5 7.5x 114%
Net Debt 8,132.6 7.4x
Share Price (12/21/2016) $14.55
Shares outstanding (in millions) 87.6
Market Capitalization 1,274.6
Less: Cash & Equivalents (120.9)
Minority Interest -
Total Debt (2) 8,253.5
Enterprise Value 9,407.1 8.5x
Implied Equity Cushion 1,153.6 1.0x
LTM AEBITDA (3) 1,103.0
Liquidity as of 9/30/2016
Cash and cash equivalents 120.9
RCF Availability:
Revolver ($593M) due 2018 592.6
Drawn 50.0
Letters of Credit 56.2
Total Liquidity 607.3 *Bond prices based on Bloomberg as of 12/21/2016
(1) 2018 HoldCo notes are guaranteed by the same subsidiaries that guarantee the 2020 and 2021 OpCo notes. Considered similar in terms of recovery value
(2) Total principal value of debt. Does NOT include unamortized debt discount or deferred financing costs
(3) AEBITDA is defined as “Attributable EBITDA” and equals Consolidated EBITDA (from credit agreement) plus the EBITDA impact of equity investments
(4) Coverage = Enterprise Value/Debt (%)
(5) Subordinated debt purchases are restricted outside of open-market transactions until 18 months prior to maturity
Summary I recommend buying the Scientific Games 6.25% subordinated notes due 2020 (SGMS: Caa1/CCC+; 11.2%
YTW; 937 bps OAS), which are currently trading at 85.0. I expect the notes to trade up to par within the next
18 months, resulting in a potential total return of ~32% (21% IRR).
The 2020 sub notes have been oversold given the company’s strong recurring cash-generative business, ample
asset coverage, robust liquidity, and meaningful deleveraging opportunities. The company’s credit quality is
expected to strengthen due to a material increase in free cash flow, continued deleveraging of the balance sheet,
and improved credit metrics. Furthermore, after management repays/refinances the 2018 notes in March 2017,
the 2020 notes become the nearest term maturity and the next target to be refinanced, providing a meaningful
catalyst for the 2020 notes to trade up to par.
Abhinav Ananta
+1 617 599 4129 Credit Research & Strategy Page 2
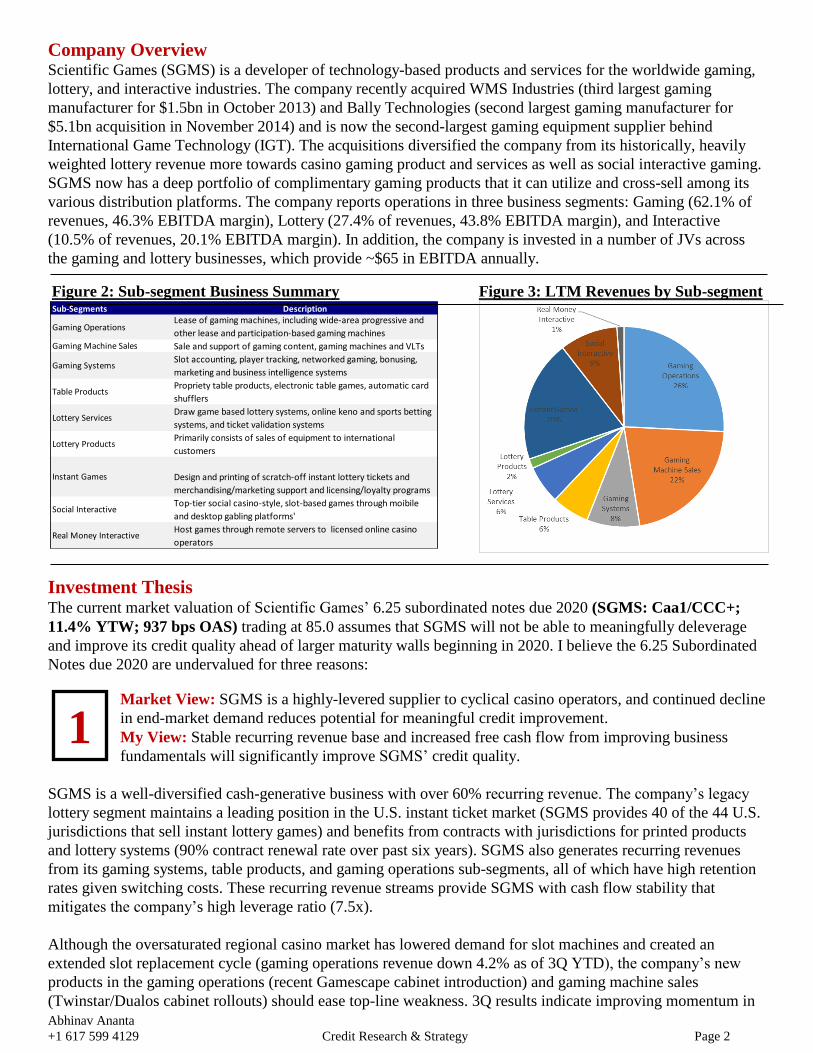
Sub-Segments Description
Gaming OperationsLease of gaming machines, including wide-area progressive and
other lease and participation-based gaming machines
Gaming Machine Sales Sale and support of gaming content, gaming machines and VLTs
Gaming SystemsSlot accounting, player tracking, networked gaming, bonusing,
marketing and business intelligence systems
Table ProductsPropriety table products, electronic table games, automatic card
shufflers
Lottery ServicesDraw game based lottery systems, online keno and sports betting
systems, and ticket validation systems
Lottery ProductsPrimarily consists of sales of equipment to international
customers
Instant Games Design and printing of scratch-off instant lottery tickets and
merchandising/marketing support and licensing/loyalty programs
Social InteractiveTop-tier social casino-style, slot-based games through moibile
and desktop gabling platforms'
Real Money InteractiveHost games through remote servers to licensed online casino
operators
1
Company Overview
Scientific Games (SGMS) is a developer of technology-based products and services for the worldwide gaming,
lottery, and interactive industries. The company recently acquired WMS Industries (third largest gaming
manufacturer for $1.5bn in October 2013) and Bally Technologies (second largest gaming manufacturer for
$5.1bn acquisition in November 2014) and is now the second-largest gaming equipment supplier behind
International Game Technology (IGT). The acquisitions diversified the company from its historically, heavily
weighted lottery revenue more towards casino gaming product and services as well as social interactive gaming.
SGMS now has a deep portfolio of complimentary gaming products that it can utilize and cross-sell among its
various distribution platforms. The company reports operations in three business segments: Gaming (62.1% of
revenues, 46.3% EBITDA margin), Lottery (27.4% of revenues, 43.8% EBITDA margin), and Interactive
(10.5% of revenues, 20.1% EBITDA margin). In addition, the company is invested in a number of JVs across
the gaming and lottery businesses, which provide ~$65 in EBITDA annually.
Figure 2: Sub-segment Business Summary Figure 3: LTM Revenues by Sub-segment
Investment Thesis
The current market valuation of Scientific Games’ 6.25 subordinated notes due 2020 (SGMS: Caa1/CCC+;
11.4% YTW; 937 bps OAS) trading at 85.0 assumes that SGMS will not be able to meaningfully deleverage
and improve its credit quality ahead of larger maturity walls beginning in 2020. I believe the 6.25 Subordinated
Notes due 2020 are undervalued for three reasons:
Market View: SGMS is a highly-levered supplier to cyclical casino operators, and continued decline
in end-market demand reduces potential for meaningful credit improvement.
My View: Stable recurring revenue base and increased free cash flow from improving business
fundamentals will significantly improve SGMS’ credit quality.
SGMS is a well-diversified cash-generative business with over 60% recurring revenue. The company’s legacy
lottery segment maintains a leading position in the U.S. instant ticket market (SGMS provides 40 of the 44 U.S.
jurisdictions that sell instant lottery games) and benefits from contracts with jurisdictions for printed products
and lottery systems (90% contract renewal rate over past six years). SGMS also generates recurring revenues
from its gaming systems, table products, and gaming operations sub-segments, all of which have high retention
rates given switching costs. These recurring revenue streams provide SGMS with cash flow stability that
mitigates the company’s high leverage ratio (7.5x).
Although the oversaturated regional casino market has lowered demand for slot machines and created an
extended slot replacement cycle (gaming operations revenue down 4.2% as of 3Q YTD), the company’s new
products in the gaming operations (recent Gamescape cabinet introduction) and gaming machine sales
(Twinstar/Dualos cabinet rollouts) should ease top-line weakness. 3Q results indicate improving momentum in
Abhinav Ananta
+1 617 599 4129 Credit Research & Strategy Page 3
2
gaming machine sales (gaming units shipped +27% YoY) and revenue in the segment has increased 13.0%
YTD. Furthermore, the lottery industry’s trend toward higher margin instant games, where SGMS has the
leading market share, and continued growth in the interactive segment also offset the challenges in the core
gaming business’ end-markets.
I believe the improvement in SGMS’ business fundamentals (lottery, interactive, new product sales) and sizable
cost-savings from its roll-up strategy (recently announced $75mn annual cost cutting initiative) will significantly
improve free cash flow and normalized cash flow (See Appendices: Model) over the next three years. Free cash
flow is expected to increase from $90mn in FY15 to $203mn in FY17 and Normalized Cash Flow (AEBITDA-
Capex) to Net Debt Ratio is forecasted to average ~11.0% from FY16 to FY18. SGMS’s strong free cash flow
metrics (See Appendices: Credit Metrics) offset the credit risk associated with the company’s high leverage.
Market View: Management may look to monetize assets for shareholders instead of continuing to
deleverage balance sheet.
My View: Management will continue to pay down debt, and assets may be sold to meaningfully de-
lever balance sheet.
Given that SGMS’ recently designated two wholly owned social gaming subsidiaries as unrestricted under debt
agreements, and that Ron Perelman has a large minority stake in the business (owns 39.7% of common stock),
investors are worried that management may strip asset value from the bondholders or monetize assets to benefit
shareholders instead of paying down debt. I believe that management designated the subsidiaries as unrestricted
to create more flexibility to grow (i.e. bolt-on acquisitions or JVs) and monetize (sale or IPO) the interactive
business. Management’s decision frees up a wider range of options that would have been limited if the social
gaming assets been kept in the restricted group.
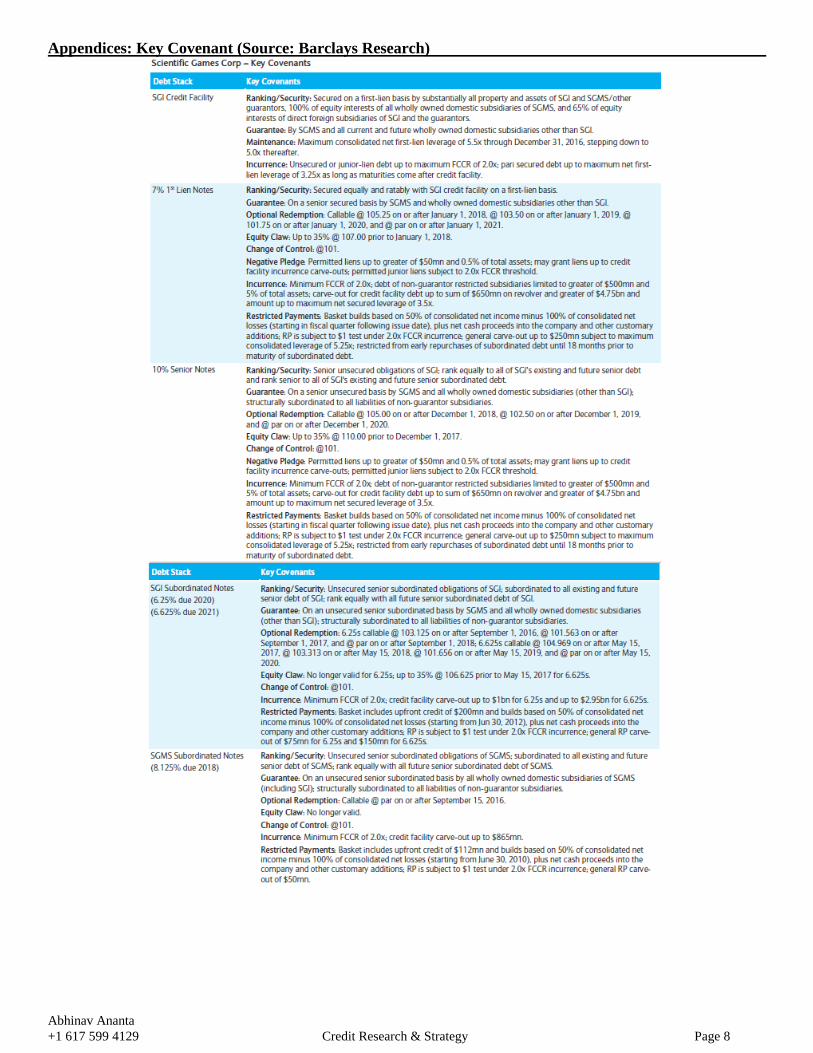
While the unrestricted subsidiaries operate outside of the credit agreement/indentures, they remain wholly
owned by guarantor entities (Bally Technologies) that sit within the restricted group (See Appendices: Corporate
Structure). Any cash dividend (including cash from operations, asset sales, and IPO proceeds) from the
unrestricted group to the restricted group would be subject to restrictive covenants and treated as part of bank
EBITDA, preventing leakage to shareholders through RP language (See Appendices: Key Covenants).
Although the unrestricted subsidiaries have the ability to raise structurally senior non-recourse debt, I believe
this is very unlikely given management’s recent strategy of paying down debt with free cash flow. SGMS took
out $80mn in face value of debt during fiscal 2Q, including the repurchase of $66mn across the 6.25%/6.625%
sub notes due 2020/2021. SGMS faces a large maturity wall beginning in 2020 (~$4.5bn due) and is
incentivized to de-leverage the balance sheet by that time to mitigate refinancing risk. Therefore, it is much
more likely that management will sell or IPO the interactive gaming business (~$940mn valuation based on
FY17E Interactive segment EBITDA at 12.0x EV) to meaningfully de-lever the balance sheet than raise more
debt.
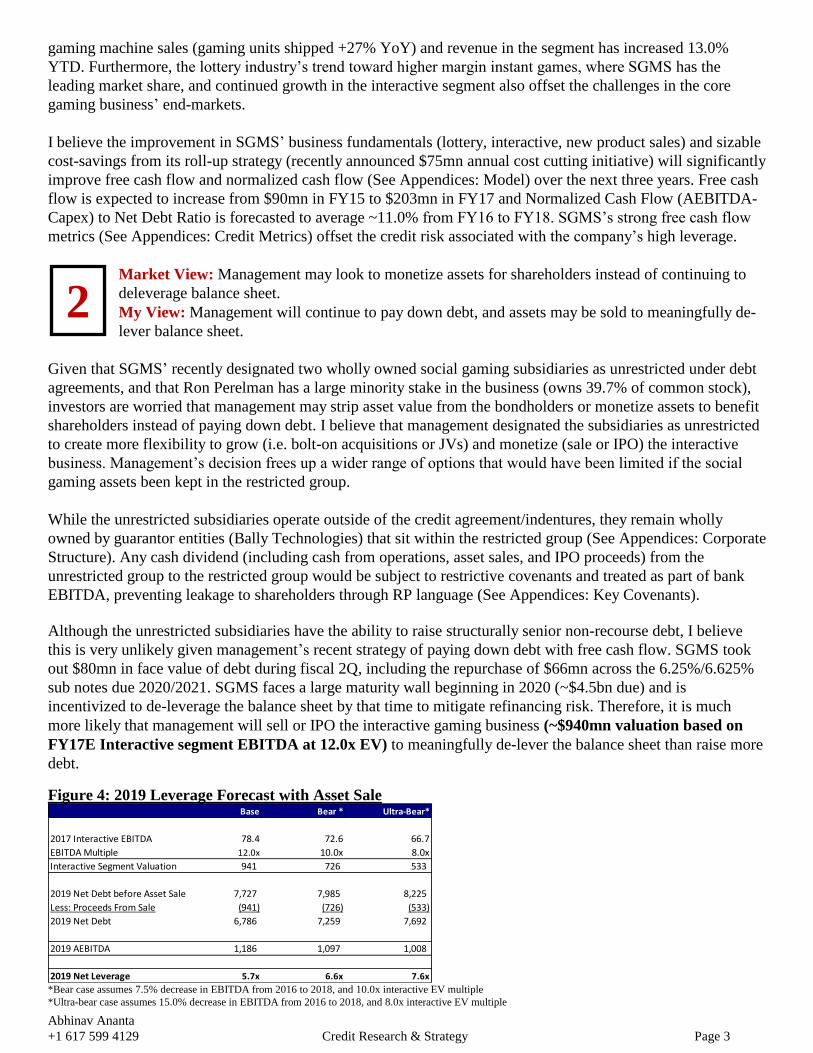
Figure 4: 2019 Leverage Forecast with Asset Sale Base Bear * Ultra-Bear*
2017 Interactive EBITDA 78.4 72.6 66.7
EBITDA Multiple 12.0x 10.0x 8.0x
Interactive Segment Valuation 941 726 533
2019 Net Debt before Asset Sale 7,727 7,985 8,225
Less: Proceeds From Sale (941) (726) (533)
2019 Net Debt 6,786 7,259 7,692
2019 AEBITDA 1,186 1,097 1,008
2019 Net Leverage 5.7x 6.6x 7.6x *Bear case assumes 7.5% decrease in EBITDA from 2016 to 2018, and 10.0x interactive EV multiple
*Ultra-bear case assumes 15.0% decrease in EBITDA from 2016 to 2018, and 8.0x interactive EV multiple
Abhinav Ananta
+1 617 599 4129 Credit Research & Strategy Page 4
3
Management is expected to refinance the 2018 subordinated notes in March of 2017 (notes are already trading to
call) to create runway, and is looking to monetize the interactive business over the next 18 to 24 months to
further pay down debt. In my base case, SGMS is forecasted to generate ~$602mn of discretionary free cash
flow (CFO – Capex – mandatory debt payments) from FY17 to FY19. If the company were to monetize the
interactive segment for ~$940mn (base case) and use the proceeds to pay down debt, net leverage would be
~5.7x in FY19, positioning the company to successfully recapitalize ahead of the 2020 maturity wall (See Figure
4). In the ultra-bear case, which results in 7.6x net leverage, I still believe SGMS will generate enough free cash
flow and asset coverage to warrant refinancing, albeit at less than favorable terms.
Market View: 2020 sub notes are currently valued at ~85.0, implying an 11.2% YTW and limited
asset coverage.
My View: 2020 sub notes are undervalued and should be trading at tighter spreads given maturity
position and strong asset coverage
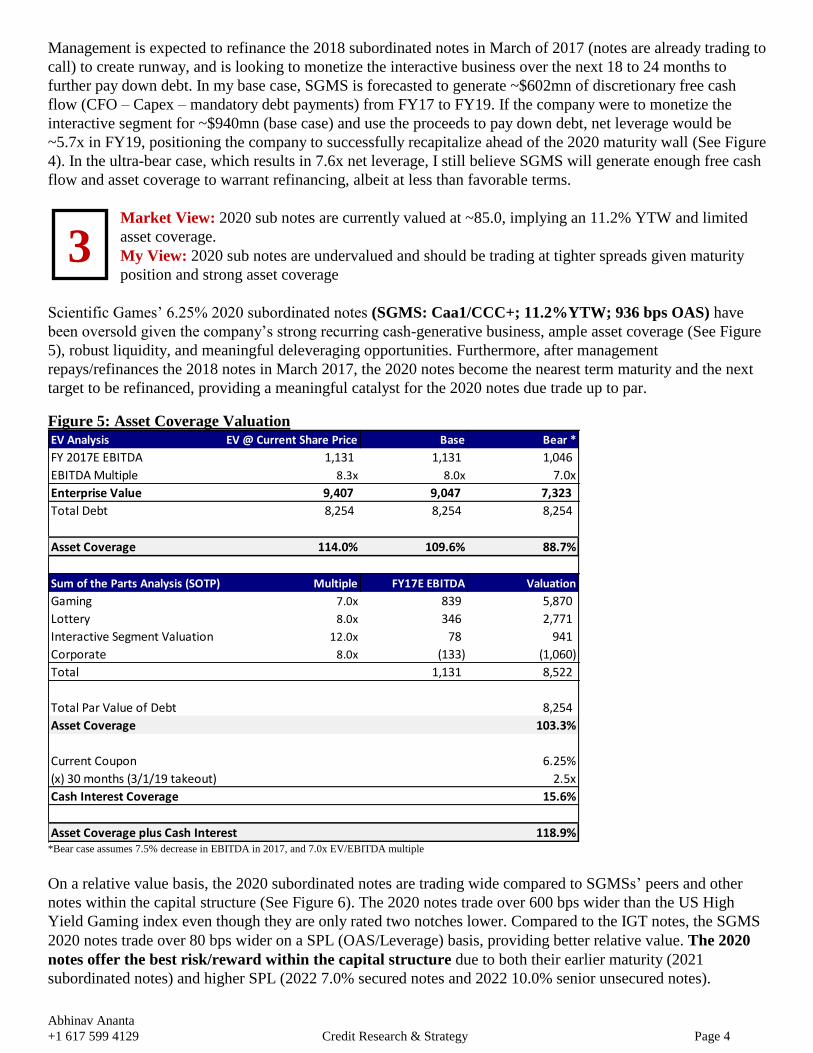
Scientific Games’ 6.25% 2020 subordinated notes (SGMS: Caa1/CCC+; 11.2%YTW; 936 bps OAS) have
been oversold given the company’s strong recurring cash-generative business, ample asset coverage (See Figure
5), robust liquidity, and meaningful deleveraging opportunities. Furthermore, after management
repays/refinances the 2018 notes in March 2017, the 2020 notes become the nearest term maturity and the next
target to be refinanced, providing a meaningful catalyst for the 2020 notes due trade up to par.
Figure 5: Asset Coverage Valuation EV Analysis EV @ Current Share Price Base Bear *
FY 2017E EBITDA 1,131 1,131 1,046
EBITDA Multiple 8.3x 8.0x 7.0x
Enterprise Value 9,407 9,047 7,323
Total Debt 8,254 8,254 8,254
Asset Coverage 114.0% 109.6% 88.7%
Sum of the Parts Analysis (SOTP) Multiple FY17E EBITDA Valuation
Gaming 7.0x 839 5,870
Lottery 8.0x 346 2,771
Interactive Segment Valuation 12.0x 78 941
Corporate 8.0x (133) (1,060)
Total 1,131 8,522
Total Par Value of Debt 8,254
Asset Coverage 103.3%
Current Coupon 6.25%
(x) 30 months (3/1/19 takeout) 2.5x
Cash Interest Coverage 15.6%
Asset Coverage plus Cash Interest 118.9% *Bear case assumes 7.5% decrease in EBITDA in 2017, and 7.0x EV/EBITDA multiple
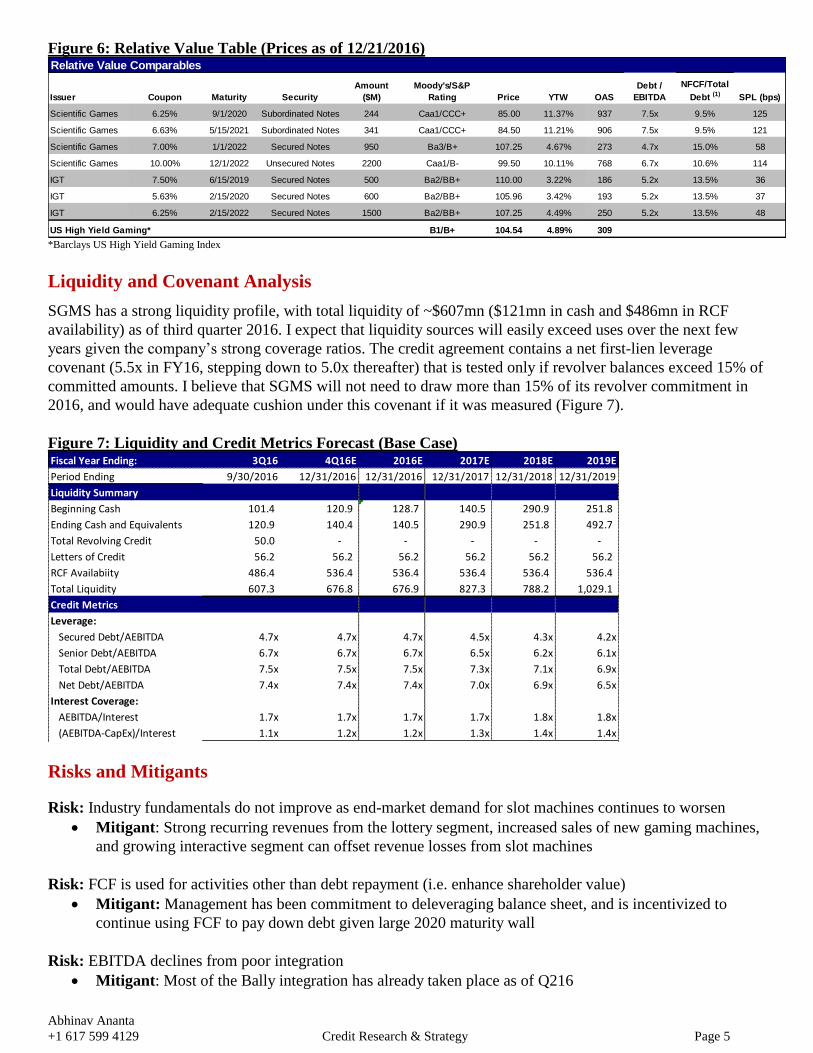
On a relative value basis, the 2020 subordinated notes are trading wide compared to SGMSs’ peers and other
notes within the capital structure (See Figure 6). The 2020 notes trade over 600 bps wider than the US High
Yield Gaming index even though they are only rated two notches lower. Compared to the IGT notes, the SGMS
2020 notes trade over 80 bps wider on a SPL (OAS/Leverage) basis, providing better relative value. The 2020
notes offer the best risk/reward within the capital structure due to both their earlier maturity (2021
subordinated notes) and higher SPL (2022 7.0% secured notes and 2022 10.0% senior unsecured notes).
Abhinav Ananta
+1 617 599 4129 Credit Research & Strategy Page 5
Figure 6: Relative Value Table (Prices as of 12/21/2016) Relative Value Comparables
Issuer Coupon Maturity Security
Amount
($M)
Moody's/S&P
Rating Price YTW OAS
Debt /
EBITDA
NFCF/Total
Debt (1) SPL (bps)
Scientific Games 6.25% 9/1/2020 Subordinated Notes 244 Caa1/CCC+ 85.00 11.37% 937 7.5x 9.5% 125
Scientific Games 6.63% 5/15/2021 Subordinated Notes 341 Caa1/CCC+ 84.50 11.21% 906 7.5x 9.5% 121
Scientific Games 7.00% 1/1/2022 Secured Notes 950 Ba3/B+ 107.25 4.67% 273 4.7x 15.0% 58
Scientific Games 10.00% 12/1/2022 Unsecured Notes 2200 Caa1/B- 99.50 10.11% 768 6.7x 10.6% 114
IGT 7.50% 6/15/2019 Secured Notes 500 Ba2/BB+ 110.00 3.22% 186 5.2x 13.5% 36
IGT 5.63% 2/15/2020 Secured Notes 600 Ba2/BB+ 105.96 3.42% 193 5.2x 13.5% 37
IGT 6.25% 2/15/2022 Secured Notes 1500 Ba2/BB+ 107.25 4.49% 250 5.2x 13.5% 48
US High Yield Gaming* B1/B+ 104.54 4.89% 309 *Barclays US High Yield Gaming Index
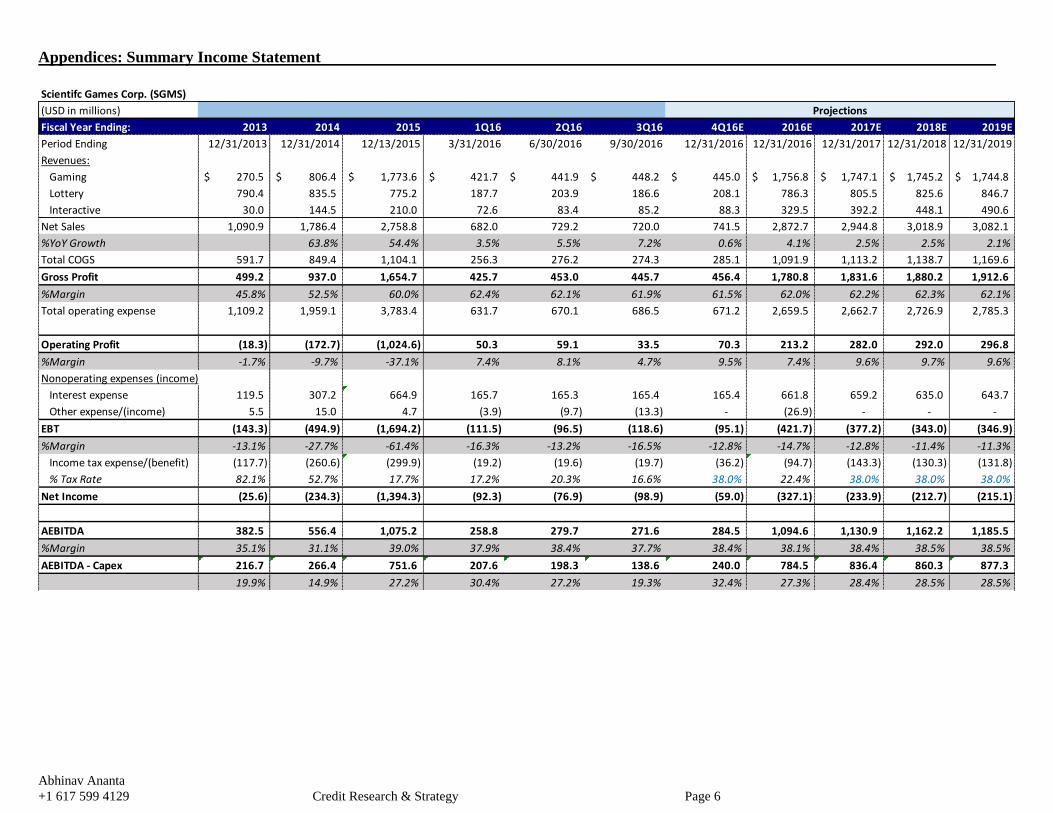
Liquidity and Covenant Analysis
SGMS has a strong liquidity profile, with total liquidity of ~$607mn ($121mn in cash and $486mn in RCF
availability) as of third quarter 2016. I expect that liquidity sources will easily exceed uses over the next few
years given the company’s strong coverage ratios. The credit agreement contains a net first-lien leverage
covenant (5.5x in FY16, stepping down to 5.0x thereafter) that is tested only if revolver balances exceed 15% of
committed amounts. I believe that SGMS will not need to draw more than 15% of its revolver commitment in
2016, and would have adequate cushion under this covenant if it was measured (Figure 7).
Figure 7: Liquidity and Credit Metrics Forecast (Base Case) Fiscal Year Ending: 3Q16 4Q16E 2016E 2017E 2018E 2019E
Period Ending 9/30/2016 12/31/2016 12/31/2016 12/31/2017 12/31/2018 12/31/2019
Liquidity Summary
Beginning Cash 101.4 120.9 128.7 140.5 290.9 251.8
Ending Cash and Equivalents 120.9 140.4 140.5 290.9 251.8 492.7
Total Revolving Credit 50.0 - - - - -
Letters of Credit 56.2 56.2 56.2 56.2 56.2 56.2
RCF Availabiity 486.4 536.4 536.4 536.4 536.4 536.4
Total Liquidity 607.3 676.8 676.9 827.3 788.2 1,029.1
Credit Metrics
Leverage:
Secured Debt/AEBITDA 4.7x 4.7x 4.7x 4.5x 4.3x 4.2x
Senior Debt/AEBITDA 6.7x 6.7x 6.7x 6.5x 6.2x 6.1x
Total Debt/AEBITDA 7.5x 7.5x 7.5x 7.3x 7.1x 6.9x
Net Debt/AEBITDA 7.4x 7.4x 7.4x 7.0x 6.9x 6.5x
Interest Coverage:
AEBITDA/Interest 1.7x 1.7x 1.7x 1.7x 1.8x 1.8x
(AEBITDA-CapEx)/Interest 1.1x 1.2x 1.2x 1.3x 1.4x 1.4x
Risks and Mitigants
Risk: Industry fundamentals do not improve as end-market demand for slot machines continues to worsen
Mitigant: Strong recurring revenues from the lottery segment, increased sales of new gaming machines,
and growing interactive segment can offset revenue losses from slot machines
Risk: FCF is used for activities other than debt repayment (i.e. enhance shareholder value)
Mitigant: Management has been commitment to deleveraging balance sheet, and is incentivized to
continue using FCF to pay down debt given large 2020 maturity wall
Risk: EBITDA declines from poor integration
Mitigant: Most of the Bally integration has already taken place as of Q216
Abhinav Ananta
+1 617 599 4129 Credit Research & Strategy Page 6
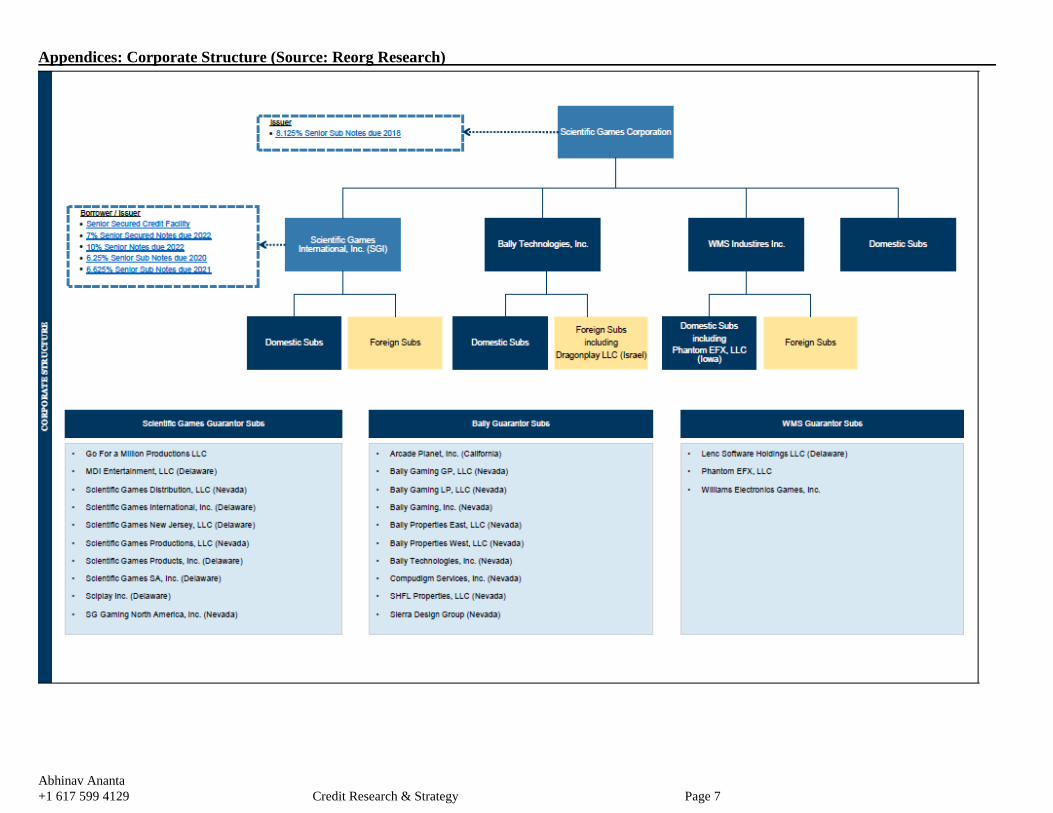
Appendices: Summary Income Statement
Scientifc Games Corp. (SGMS)
(USD in millions)
Fiscal Year Ending: 2013 2014 2015 1Q16 2Q16 3Q16 4Q16E 2016E 2017E 2018E 2019E
Period Ending 12/31/2013 12/31/2014 12/13/2015 3/31/2016 6/30/2016 9/30/2016 12/31/2016 12/31/2016 12/31/2017 12/31/2018 12/31/2019
Revenues:
Gaming 270.5$ 806.4$ 1,773.6$ 421.7$ 441.9$ 448.2$ 445.0$ 1,756.8$ 1,747.1$ 1,745.2$ 1,744.8$
Lottery 790.4 835.5 775.2 187.7 203.9 186.6 208.1 786.3 805.5 825.6 846.7
Interactive 30.0 144.5 210.0 72.6 83.4 85.2 88.3 329.5 392.2 448.1 490.6
Net Sales 1,090.9 1,786.4 2,758.8 682.0 729.2 720.0 741.5 2,872.7 2,944.8 3,018.9 3,082.1
%YoY Growth 63.8% 54.4% 3.5% 5.5% 7.2% 0.6% 4.1% 2.5% 2.5% 2.1%
Total COGS 591.7 849.4 1,104.1 256.3 276.2 274.3 285.1 1,091.9 1,113.2 1,138.7 1,169.6
Gross Profit 499.2 937.0 1,654.7 425.7 453.0 445.7 456.4 1,780.8 1,831.6 1,880.2 1,912.6
%Margin 45.8% 52.5% 60.0% 62.4% 62.1% 61.9% 61.5% 62.0% 62.2% 62.3% 62.1%
Total operating expense 1,109.2 1,959.1 3,783.4 631.7 670.1 686.5 671.2 2,659.5 2,662.7 2,726.9 2,785.3
Operating Profit (18.3) (172.7) (1,024.6) 50.3 59.1 33.5 70.3 213.2 282.0 292.0 296.8
%Margin -1.7% -9.7% -37.1% 7.4% 8.1% 4.7% 9.5% 7.4% 9.6% 9.7% 9.6%
Nonoperating expenses (income)
Interest expense 119.5 307.2 664.9 165.7 165.3 165.4 165.4 661.8 659.2 635.0 643.7
Other expense/(income) 5.5 15.0 4.7 (3.9) (9.7) (13.3) - (26.9) - - -
EBT (143.3) (494.9) (1,694.2) (111.5) (96.5) (118.6) (95.1) (421.7) (377.2) (343.0) (346.9)
%Margin -13.1% -27.7% -61.4% -16.3% -13.2% -16.5% -12.8% -14.7% -12.8% -11.4% -11.3%
Income tax expense/(benefit) (117.7) (260.6) (299.9) (19.2) (19.6) (19.7) (36.2) (94.7) (143.3) (130.3) (131.8)
% Tax Rate 82.1% 52.7% 17.7% 17.2% 20.3% 16.6% 38.0% 22.4% 38.0% 38.0% 38.0%
Net Income (25.6) (234.3) (1,394.3) (92.3) (76.9) (98.9) (59.0) (327.1) (233.9) (212.7) (215.1)
AEBITDA 382.5 556.4 1,075.2 258.8 279.7 271.6 284.5 1,094.6 1,130.9 1,162.2 1,185.5
%Margin 35.1% 31.1% 39.0% 37.9% 38.4% 37.7% 38.4% 38.1% 38.4% 38.5% 38.5%
AEBITDA - Capex 216.7 266.4 751.6 207.6 198.3 138.6 240.0 784.5 836.4 860.3 877.3
19.9% 14.9% 27.2% 30.4% 27.2% 19.3% 32.4% 27.3% 28.4% 28.5% 28.5%
Projections
Abhinav Ananta
+1 617 599 4129 Credit Research & Strategy Page 7
Appendices: Corporate Structure (Source: Reorg Research)
Abhinav Ananta
+1 617 599 4129 Credit Research & Strategy Page 8
Appendices: Key Covenant (Source: Barclays Research)
Abhinav Ananta
+1 617 599 4129 Credit Research & Strategy Page 9
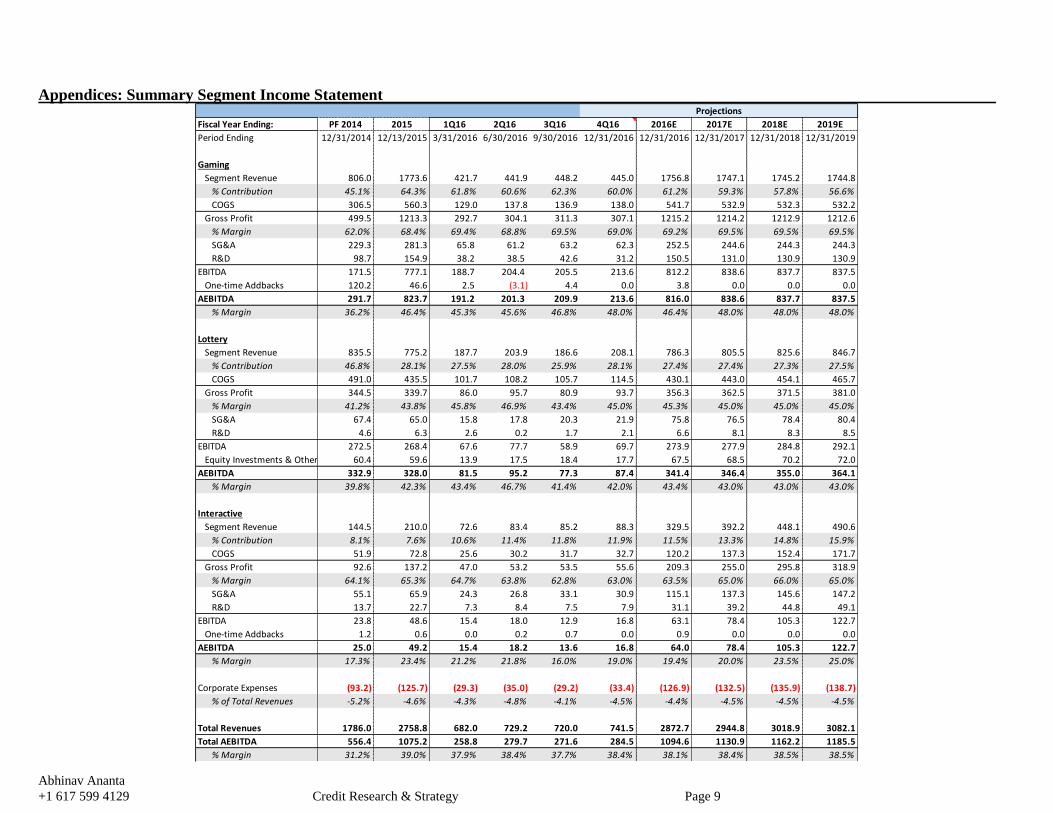
Appendices: Summary Segment Income Statement
Fiscal Year Ending: PF 2014 2015 1Q16 2Q16 3Q16 4Q16 2016E 2017E 2018E 2019E
Period Ending 12/31/2014 12/13/2015 3/31/2016 6/30/2016 9/30/2016 12/31/2016 12/31/2016 12/31/2017 12/31/2018 12/31/2019
Gaming
Segment Revenue 806.0 1773.6 421.7 441.9 448.2 445.0 1756.8 1747.1 1745.2 1744.8
% Contribution 45.1% 64.3% 61.8% 60.6% 62.3% 60.0% 61.2% 59.3% 57.8% 56.6%
COGS 306.5 560.3 129.0 137.8 136.9 138.0 541.7 532.9 532.3 532.2
Gross Profit 499.5 1213.3 292.7 304.1 311.3 307.1 1215.2 1214.2 1212.9 1212.6
% Margin 62.0% 68.4% 69.4% 68.8% 69.5% 69.0% 69.2% 69.5% 69.5% 69.5%
SG&A 229.3 281.3 65.8 61.2 63.2 62.3 252.5 244.6 244.3 244.3
R&D 98.7 154.9 38.2 38.5 42.6 31.2 150.5 131.0 130.9 130.9
EBITDA 171.5 777.1 188.7 204.4 205.5 213.6 812.2 838.6 837.7 837.5
One-time Addbacks 120.2 46.6 2.5 (3.1) 4.4 0.0 3.8 0.0 0.0 0.0
AEBITDA 291.7 823.7 191.2 201.3 209.9 213.6 816.0 838.6 837.7 837.5
% Margin 36.2% 46.4% 45.3% 45.6% 46.8% 48.0% 46.4% 48.0% 48.0% 48.0%
Lottery
Segment Revenue 835.5 775.2 187.7 203.9 186.6 208.1 786.3 805.5 825.6 846.7
% Contribution 46.8% 28.1% 27.5% 28.0% 25.9% 28.1% 27.4% 27.4% 27.3% 27.5%
COGS 491.0 435.5 101.7 108.2 105.7 114.5 430.1 443.0 454.1 465.7
Gross Profit 344.5 339.7 86.0 95.7 80.9 93.7 356.3 362.5 371.5 381.0
% Margin 41.2% 43.8% 45.8% 46.9% 43.4% 45.0% 45.3% 45.0% 45.0% 45.0%
SG&A 67.4 65.0 15.8 17.8 20.3 21.9 75.8 76.5 78.4 80.4
R&D 4.6 6.3 2.6 0.2 1.7 2.1 6.6 8.1 8.3 8.5
EBITDA 272.5 268.4 67.6 77.7 58.9 69.7 273.9 277.9 284.8 292.1
Equity Investments & Other 60.4 59.6 13.9 17.5 18.4 17.7 67.5 68.5 70.2 72.0
AEBITDA 332.9 328.0 81.5 95.2 77.3 87.4 341.4 346.4 355.0 364.1
% Margin 39.8% 42.3% 43.4% 46.7% 41.4% 42.0% 43.4% 43.0% 43.0% 43.0%
Interactive
Segment Revenue 144.5 210.0 72.6 83.4 85.2 88.3 329.5 392.2 448.1 490.6
% Contribution 8.1% 7.6% 10.6% 11.4% 11.8% 11.9% 11.5% 13.3% 14.8% 15.9%
COGS 51.9 72.8 25.6 30.2 31.7 32.7 120.2 137.3 152.4 171.7
Gross Profit 92.6 137.2 47.0 53.2 53.5 55.6 209.3 255.0 295.8 318.9
% Margin 64.1% 65.3% 64.7% 63.8% 62.8% 63.0% 63.5% 65.0% 66.0% 65.0%
SG&A 55.1 65.9 24.3 26.8 33.1 30.9 115.1 137.3 145.6 147.2
R&D 13.7 22.7 7.3 8.4 7.5 7.9 31.1 39.2 44.8 49.1
EBITDA 23.8 48.6 15.4 18.0 12.9 16.8 63.1 78.4 105.3 122.7
One-time Addbacks 1.2 0.6 0.0 0.2 0.7 0.0 0.9 0.0 0.0 0.0
AEBITDA 25.0 49.2 15.4 18.2 13.6 16.8 64.0 78.4 105.3 122.7
% Margin 17.3% 23.4% 21.2% 21.8% 16.0% 19.0% 19.4% 20.0% 23.5% 25.0%
Corporate Expenses (93.2) (125.7) (29.3) (35.0) (29.2) (33.4) (126.9) (132.5) (135.9) (138.7)
% of Total Revenues -5.2% -4.6% -4.3% -4.8% -4.1% -4.5% -4.4% -4.5% -4.5% -4.5%
Total Revenues 1786.0 2758.8 682.0 729.2 720.0 741.5 2872.7 2944.8 3018.9 3082.1
Total AEBITDA 556.4 1075.2 258.8 279.7 271.6 284.5 1094.6 1130.9 1162.2 1185.5
% Margin 31.2% 39.0% 37.9% 38.4% 37.7% 38.4% 38.1% 38.4% 38.5% 38.5%
Projections
Abhinav Ananta
+1 617 599 4129 Credit Research & Strategy Page 10
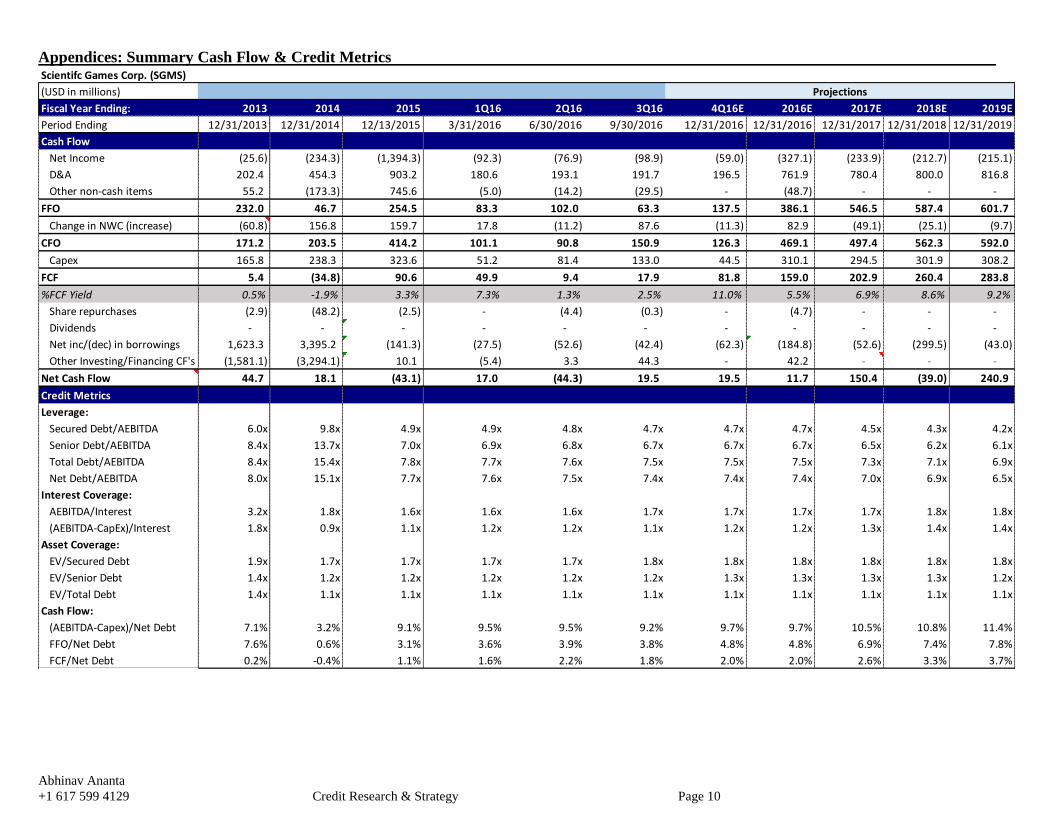
Appendices: Summary Cash Flow & Credit Metrics Scientifc Games Corp. (SGMS)
(USD in millions)
Fiscal Year Ending: 2013 2014 2015 1Q16 2Q16 3Q16 4Q16E 2016E 2017E 2018E 2019E
Period Ending 12/31/2013 12/31/2014 12/13/2015 3/31/2016 6/30/2016 9/30/2016 12/31/2016 12/31/2016 12/31/2017 12/31/2018 12/31/2019
Cash Flow
Net Income (25.6) (234.3) (1,394.3) (92.3) (76.9) (98.9) (59.0) (327.1) (233.9) (212.7) (215.1)
D&A 202.4 454.3 903.2 180.6 193.1 191.7 196.5 761.9 780.4 800.0 816.8
Other non-cash items 55.2 (173.3) 745.6 (5.0) (14.2) (29.5) - (48.7) - - -
FFO 232.0 46.7 254.5 83.3 102.0 63.3 137.5 386.1 546.5 587.4 601.7
Change in NWC (increase) (60.8) 156.8 159.7 17.8 (11.2) 87.6 (11.3) 82.9 (49.1) (25.1) (9.7)
CFO 171.2 203.5 414.2 101.1 90.8 150.9 126.3 469.1 497.4 562.3 592.0
Capex 165.8 238.3 323.6 51.2 81.4 133.0 44.5 310.1 294.5 301.9 308.2
FCF 5.4 (34.8) 90.6 49.9 9.4 17.9 81.8 159.0 202.9 260.4 283.8
%FCF Yield 0.5% -1.9% 3.3% 7.3% 1.3% 2.5% 11.0% 5.5% 6.9% 8.6% 9.2%
Share repurchases (2.9) (48.2) (2.5) - (4.4) (0.3) - (4.7) - - -
Dividends - - - - - - - - - - -
Net inc/(dec) in borrowings 1,623.3 3,395.2 (141.3) (27.5) (52.6) (42.4) (62.3) (184.8) (52.6) (299.5) (43.0)
Other Investing/Financing CF's (1,581.1) (3,294.1) 10.1 (5.4) 3.3 44.3 - 42.2 - - -
Net Cash Flow 44.7 18.1 (43.1) 17.0 (44.3) 19.5 19.5 11.7 150.4 (39.0) 240.9
Credit Metrics
Leverage:
Secured Debt/AEBITDA 6.0x 9.8x 4.9x 4.9x 4.8x 4.7x 4.7x 4.7x 4.5x 4.3x 4.2x
Senior Debt/AEBITDA 8.4x 13.7x 7.0x 6.9x 6.8x 6.7x 6.7x 6.7x 6.5x 6.2x 6.1x
Total Debt/AEBITDA 8.4x 15.4x 7.8x 7.7x 7.6x 7.5x 7.5x 7.5x 7.3x 7.1x 6.9x
Net Debt/AEBITDA 8.0x 15.1x 7.7x 7.6x 7.5x 7.4x 7.4x 7.4x 7.0x 6.9x 6.5x
Interest Coverage:
AEBITDA/Interest 3.2x 1.8x 1.6x 1.6x 1.6x 1.7x 1.7x 1.7x 1.7x 1.8x 1.8x
(AEBITDA-CapEx)/Interest 1.8x 0.9x 1.1x 1.2x 1.2x 1.1x 1.2x 1.2x 1.3x 1.4x 1.4x
Asset Coverage:
EV/Secured Debt 1.9x 1.7x 1.7x 1.7x 1.7x 1.8x 1.8x 1.8x 1.8x 1.8x 1.8x
EV/Senior Debt 1.4x 1.2x 1.2x 1.2x 1.2x 1.2x 1.3x 1.3x 1.3x 1.3x 1.2x
EV/Total Debt 1.4x 1.1x 1.1x 1.1x 1.1x 1.1x 1.1x 1.1x 1.1x 1.1x 1.1x
Cash Flow:
(AEBITDA-Capex)/Net Debt 7.1% 3.2% 9.1% 9.5% 9.5% 9.2% 9.7% 9.7% 10.5% 10.8% 11.4%
FFO/Net Debt 7.6% 0.6% 3.1% 3.6% 3.9% 3.8% 4.8% 4.8% 6.9% 7.4% 7.8%
FCF/Net Debt 0.2% -0.4% 1.1% 1.6% 2.2% 1.8% 2.0% 2.0% 2.6% 3.3% 3.7%
Projections
Abhinav Ananta
+1 617 599 4129 Credit Research & Strategy Page 11
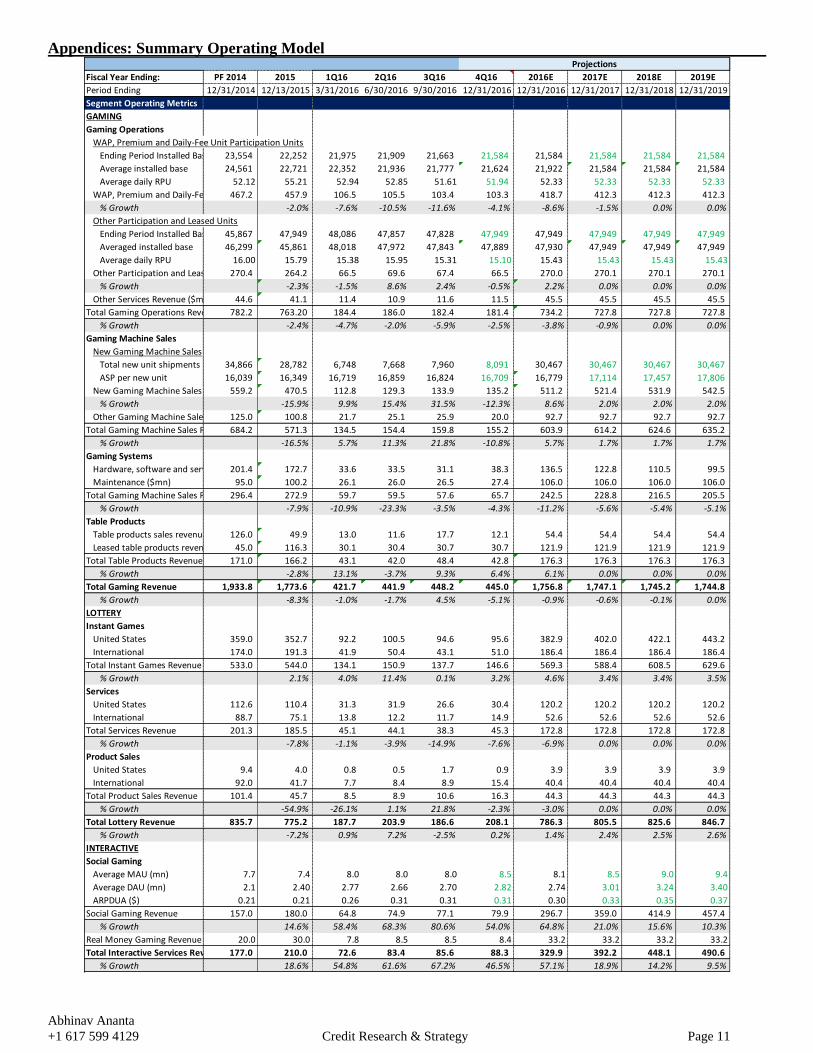
Appendices: Summary Operating Model
Fiscal Year Ending: PF 2014 2015 1Q16 2Q16 3Q16 4Q16 2016E 2017E 2018E 2019E
Period Ending 12/31/2014 12/13/2015 3/31/2016 6/30/2016 9/30/2016 12/31/2016 12/31/2016 12/31/2017 12/31/2018 12/31/2019
Segment Operating Metrics
GAMING
Gaming Operations
WAP, Premium and Daily-Fee Unit Participation Units
Ending Period Installed Base 23,554 22,252 21,975 21,909 21,663 21,584 21,584 21,584 21,584 21,584
Average installed base 24,561 22,721 22,352 21,936 21,777 21,624 21,922 21,584 21,584 21,584
Average daily RPU 52.12 55.21 52.94 52.85 51.61 51.94 52.33 52.33 52.33 52.33
WAP, Premium and Daily-Fee Participation Revenue ($mn)467.2 457.9 106.5 105.5 103.4 103.3 418.7 412.3 412.3 412.3
% Growth -2.0% -7.6% -10.5% -11.6% -4.1% -8.6% -1.5% 0.0% 0.0%
Other Participation and Leased Units
Ending Period Installed Base 45,867 47,949 48,086 47,857 47,828 47,949 47,949 47,949 47,949 47,949
Averaged installed base 46,299 45,861 48,018 47,972 47,843 47,889 47,930 47,949 47,949 47,949
Average daily RPU 16.00 15.79 15.38 15.95 15.31 15.10 15.43 15.43 15.43 15.43
Other Participation and Leased Revenue ($mn)270.4 264.2 66.5 69.6 67.4 66.5 270.0 270.1 270.1 270.1
% Growth -2.3% -1.5% 8.6% 2.4% -0.5% 2.2% 0.0% 0.0% 0.0%
Other Services Revenue ($mn) 44.6 41.1 11.4 10.9 11.6 11.5 45.5 45.5 45.5 45.5
Total Gaming Operations Revenue 782.2 763.20 184.4 186.0 182.4 181.4 734.2 727.8 727.8 727.8
% Growth -2.4% -4.7% -2.0% -5.9% -2.5% -3.8% -0.9% 0.0% 0.0%
Gaming Machine Sales
New Gaming Machine Sales
Total new unit shipments 34,866 28,782 6,748 7,668 7,960 8,091 30,467 30,467 30,467 30,467
ASP per new unit 16,039 16,349 16,719 16,859 16,824 16,709 16,779 17,114 17,457 17,806
New Gaming Machine Sales ($mn) 559.2 470.5 112.8 129.3 133.9 135.2 511.2 521.4 531.9 542.5
% Growth -15.9% 9.9% 15.4% 31.5% -12.3% 8.6% 2.0% 2.0% 2.0%
Other Gaming Machine Sales ($mn)125.0 100.8 21.7 25.1 25.9 20.0 92.7 92.7 92.7 92.7
Total Gaming Machine Sales Revenue684.2 571.3 134.5 154.4 159.8 155.2 603.9 614.2 624.6 635.2
% Growth -16.5% 5.7% 11.3% 21.8% -10.8% 5.7% 1.7% 1.7% 1.7%
Gaming Systems
Hardware, software and services revenue ($mn)201.4 172.7 33.6 33.5 31.1 38.3 136.5 122.8 110.5 99.5
Maintenance ($mn) 95.0 100.2 26.1 26.0 26.5 27.4 106.0 106.0 106.0 106.0
Total Gaming Machine Sales Revenue296.4 272.9 59.7 59.5 57.6 65.7 242.5 228.8 216.5 205.5
% Growth -7.9% -10.9% -23.3% -3.5% -4.3% -11.2% -5.6% -5.4% -5.1%
Table Products
Table products sales revenue 126.0 49.9 13.0 11.6 17.7 12.1 54.4 54.4 54.4 54.4
Leased table products revenue 45.0 116.3 30.1 30.4 30.7 30.7 121.9 121.9 121.9 121.9
Total Table Products Revenue 171.0 166.2 43.1 42.0 48.4 42.8 176.3 176.3 176.3 176.3
% Growth -2.8% 13.1% -3.7% 9.3% 6.4% 6.1% 0.0% 0.0% 0.0%
Total Gaming Revenue 1,933.8 1,773.6 421.7 441.9 448.2 445.0 1,756.8 1,747.1 1,745.2 1,744.8
% Growth -8.3% -1.0% -1.7% 4.5% -5.1% -0.9% -0.6% -0.1% 0.0%
LOTTERY
Instant Games
United States 359.0 352.7 92.2 100.5 94.6 95.6 382.9 402.0 422.1 443.2
International 174.0 191.3 41.9 50.4 43.1 51.0 186.4 186.4 186.4 186.4
Total Instant Games Revenue 533.0 544.0 134.1 150.9 137.7 146.6 569.3 588.4 608.5 629.6
% Growth 2.1% 4.0% 11.4% 0.1% 3.2% 4.6% 3.4% 3.4% 3.5%
Services
United States 112.6 110.4 31.3 31.9 26.6 30.4 120.2 120.2 120.2 120.2
International 88.7 75.1 13.8 12.2 11.7 14.9 52.6 52.6 52.6 52.6
Total Services Revenue 201.3 185.5 45.1 44.1 38.3 45.3 172.8 172.8 172.8 172.8
% Growth -7.8% -1.1% -3.9% -14.9% -7.6% -6.9% 0.0% 0.0% 0.0%
Product Sales
United States 9.4 4.0 0.8 0.5 1.7 0.9 3.9 3.9 3.9 3.9
International 92.0 41.7 7.7 8.4 8.9 15.4 40.4 40.4 40.4 40.4
Total Product Sales Revenue 101.4 45.7 8.5 8.9 10.6 16.3 44.3 44.3 44.3 44.3
% Growth -54.9% -26.1% 1.1% 21.8% -2.3% -3.0% 0.0% 0.0% 0.0%
Total Lottery Revenue 835.7 775.2 187.7 203.9 186.6 208.1 786.3 805.5 825.6 846.7
% Growth -7.2% 0.9% 7.2% -2.5% 0.2% 1.4% 2.4% 2.5% 2.6%
INTERACTIVE
Social Gaming
Average MAU (mn) 7.7 7.4 8.0 8.0 8.0 8.5 8.1 8.5 9.0 9.4
Average DAU (mn) 2.1 2.40 2.77 2.66 2.70 2.82 2.74 3.01 3.24 3.40
ARPDUA ($) 0.21 0.21 0.26 0.31 0.31 0.31 0.30 0.33 0.35 0.37
Social Gaming Revenue 157.0 180.0 64.8 74.9 77.1 79.9 296.7 359.0 414.9 457.4
% Growth 14.6% 58.4% 68.3% 80.6% 54.0% 64.8% 21.0% 15.6% 10.3%
Real Money Gaming Revenue 20.0 30.0 7.8 8.5 8.5 8.4 33.2 33.2 33.2 33.2
Total Interactive Services Revenue 177.0 210.0 72.6 83.4 85.6 88.3 329.9 392.2 448.1 490.6
% Growth 18.6% 54.8% 61.6% 67.2% 46.5% 57.1% 18.9% 14.2% 9.5%
Projections