Embed Size (px)
Citation preview

Scientific Figure Design
v2018-02
Simon Andrews, Anne Segonds-Pichon, Boo Virk, Jo [email protected]
[email protected]@babraham.ac.uk
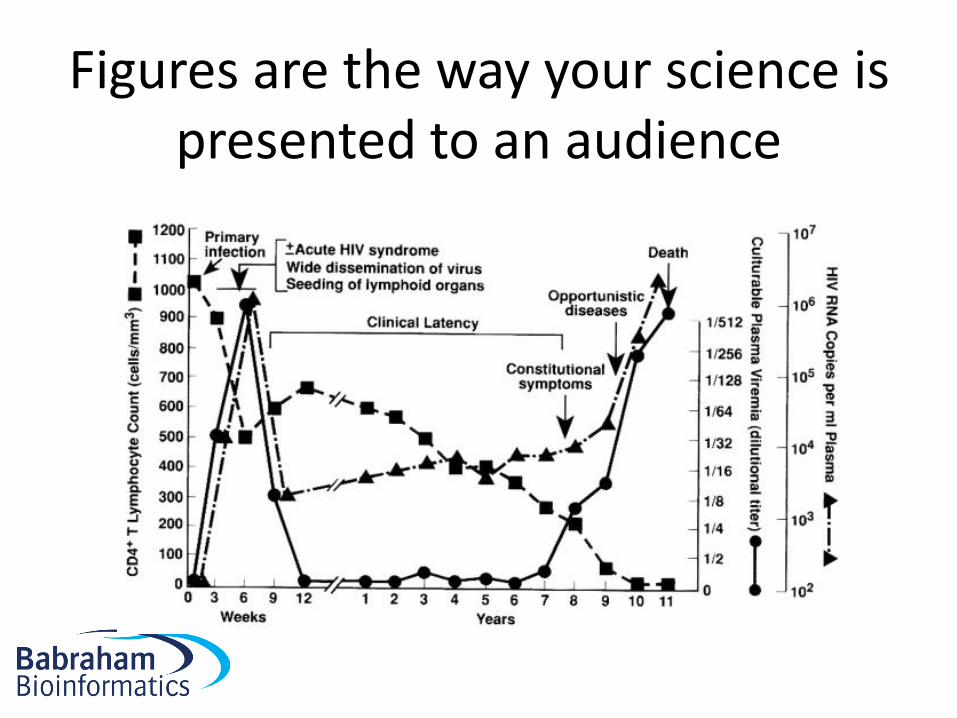
Figures are the way your science is presented to an audience
What this course covers…
• Theory of data visualisation
– Why do some figures work better than others?
• Ethics of data representation
• Elements of graphic design
• Editing bitmap images in GIMP
• Vector editing and compositing in Inkscape
• Journal submissions
What this course doesn’t cover…
• How to draw graphs in specific programs– R Introduction
– Statistics with R
– Statistics with GraphPad
– Plotting with R/ggplot
• Network representations
• Spatial data representations
Timetable
• Morning
– Introduction
– Data Visualisation Theory
• Coffee
– Data Representation Practical
– Ethics and plots talk
– Design theory talk
• Afternoon
– GIMP Tutorial
– GIMP Practical
• Coffee
– Inkscape Tutorial
– Inkscape Practical
– Final practical
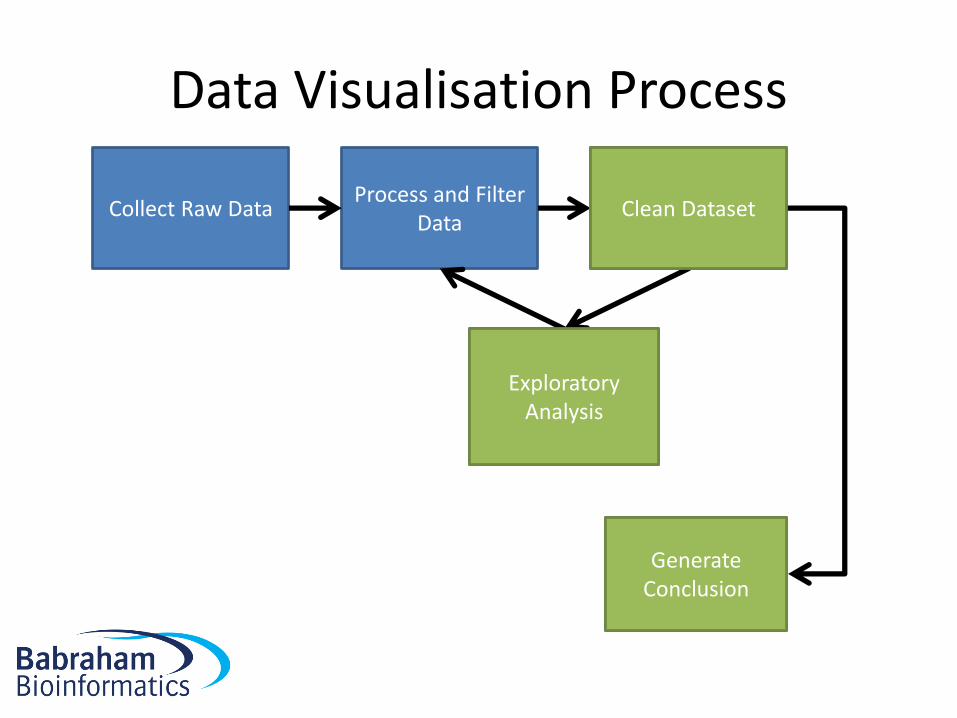
Collect Raw DataProcess and Filter
DataClean Dataset
Exploratory Analysis
Generate Conclusion
Data Visualisation Process
Clean Dataset
Exploratory Analysis
Generate Conclusion
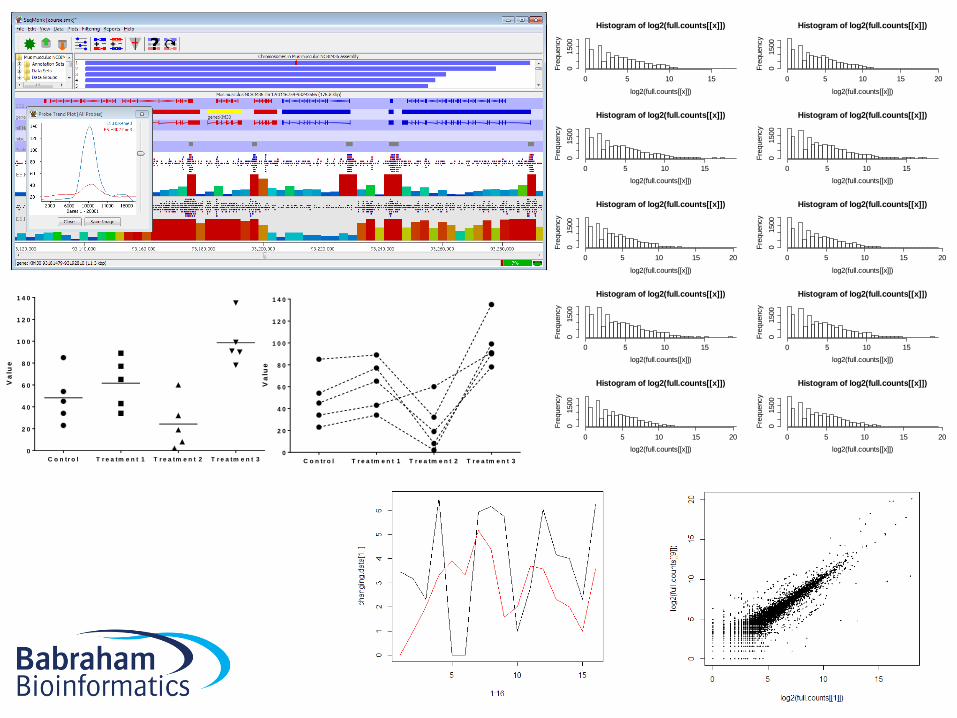
Exploratory visualisation
• Understand your data
• Multiple ways to present and summarise
• Crude representations
• Interactive
• Not intended for final publication
– Can be adapted for publication
C o n tr o l T r e a tm e n t 1 T r e a tm e n t 2 T r e a tm e n t 3
0
2 0
4 0
6 0
8 0
1 0 0
1 2 0
1 4 0
Va
lue
C o n tr o l T r e a tm e n t 1 T r e a tm e n t 2 T r e a tm e n t 3
0
2 0
4 0
6 0
8 0
1 0 0
1 2 0
1 4 0
Va
lue
Histogram of log2(full.counts[[x]])
log2(full.counts[[x]])
Fre
quency
0 5 10 15
01500
Histogram of log2(full.counts[[x]])
log2(full.counts[[x]])
Fre
quency
0 5 10 15 20
01500
Histogram of log2(full.counts[[x]])
log2(full.counts[[x]])
Fre
quency
0 5 10 15
01500
Histogram of log2(full.counts[[x]])
log2(full.counts[[x]])
Fre
quency
0 5 10 15
01500
Histogram of log2(full.counts[[x]])
log2(full.counts[[x]])
Fre
quency
0 5 10 15 20
01500
Histogram of log2(full.counts[[x]])
log2(full.counts[[x]])
Fre
quency
0 5 10 15 20
01500
Histogram of log2(full.counts[[x]])
log2(full.counts[[x]])
Fre
quency
0 5 10 15
01500
Histogram of log2(full.counts[[x]])
log2(full.counts[[x]])
Fre
quency
0 5 10 15
01500
Histogram of log2(full.counts[[x]])
log2(full.counts[[x]])
Fre
quency
0 5 10 15 20
01500
Histogram of log2(full.counts[[x]])
log2(full.counts[[x]])
Fre
quency
0 5 10 15 20
01500
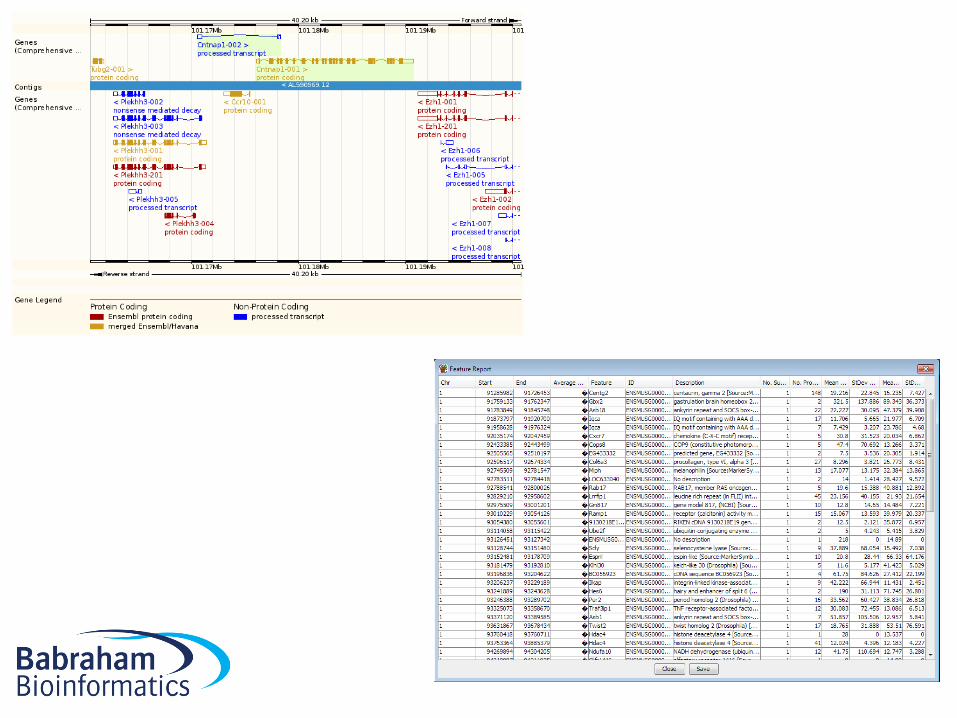
Reference visualisation
• Using your data as a resource
• Allows users to look up data of interest
• Tabular / Configurable
• Interactive
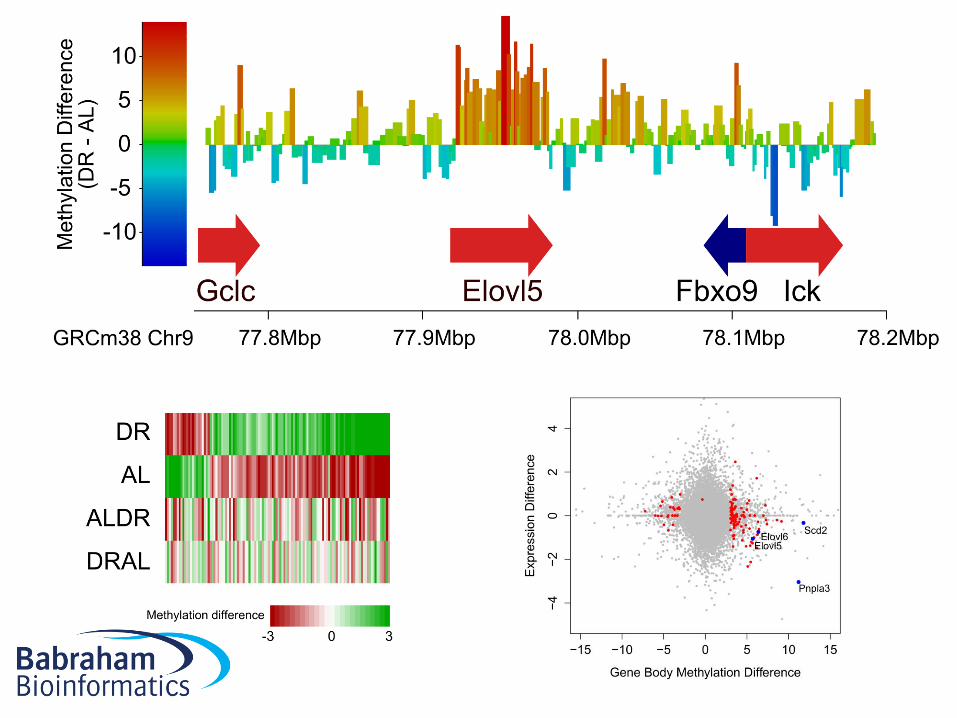
Illustrative visualisation
• Intended to convey a specific point
• Carefully chosen subset of data
• Optimised presentation
• Good design
• Used for figures in papers
What makes a good figure?
• Has a clear message– Helps to tell a story– Adds to the text, and links to it
• Is focused– Don’t confuse one message with another
• Is easy to interpret correctly– Good data visualisation– Good design
• Is an honest and true reflection of the data