Embed Size (px)
Citation preview
205
www.scientiaresearchlibrary.com tAvailable online a
Scientia Research Library ISSN 2348-0416 USA CODEN: JASRHB
Journal of Applied Science And Research, 2014, 2 (1):205-229
)http://www.scientiaresearchlibrary.com/arhcive.php(
Study On Post Production Arun LNG Refinery Utilization as LNG Receving Terminal And Regasification
Upon Local Economy
Alisastromijoyo[1], Ukar W. Soelistijo[2], Aryo P. Wibowo[1a]
1 Faculty of Mining and Oil Engineering, Institute Technology Bandung (ITB); 2 Faculty of Mining and Oil Engineering, Institute Technology Bandung (ITB);
Faculty of Engineering, University of Islam Bandung (UNISBA)[1a]
ABSTARCT The aim of the study is the development analysis of post production Arun LNG refinery whose period of operation within 1978-2014, then modified and utilized as LNG receiving terminal and regasification is useful to satisfy gas requirement in Aceh and North Sumatera provinces. To realize the feasibility of a project, a study of economy was conducted in 2 years period of improvement, 20 years operation, and supply of LNG some 150 MMSCFD for first year, and stage by stage up to 350 MMSCFD fifth year to twentieth year for maximum capacity of production. The study of the project feasibility is carried out by way of 4 parameters: NPV, IRR, BCR, and PBP analyses in 3 scenarios. As for the best result of the economic economic analysis feasible in first scenario whith the NPV is US$ 831.564 million, IRR 19%, B/C Ratio 4 and PP on 5th year to 6 months of operation. PT. Arun was delivering significant contributions of 52.88% North Aceh economic composing sectors; it is visible while in reduction of 2006-2012 North Aceh Gross Regional Domestic Product (GRDP), a reduction of IDR 7.68 trillion in 2006 to IDR 4.32 trillion in 2012. with the average rate of growth minus nine percent (-9%) per year. Based on the mean rate of growth (3%) per year, the condition reflects potential decline of local output and their considerable relevance to decrease in production of PT. Arun. Based on the study, the Arun post production LNG Refinery Re-utilization will be delivering contribution of GRDP some IDR 1.081 trillion in 2015, rise to IDR 2.651 trillion in 2034 and the rate of growth at 16% per year. When the degree of change in GRDP (∆Y) is related to Arun LNG Refinery Re-utilization, the projection of investment and job opportunity for formation of GRDP per year will be discovered. Growth rate of labor productivity declines due to the growth of labor is higher than the growth of capital and capital productivity would other wise rise. Labor productivity level in capital-labor ratio in Y/L and Y/K with LNG Refinery Re-utilization larger than Y/L and Y/K without Arun LNG Refinery Re-utilization.This project have net social gain (NSG) in 2015 IDR 72.12 billion with net gain coefficient (NGC) some 6.70% had increase in 2034 some IDR 91.44 billion or NGC some 3.64% with average NGC some 3.77% per annum.
Keywords: Arun LNG Refinery, Receiving Terminal, Regasification, Economic Analysis, Local Economy
Alisastromijoyo et al J. of Appl. Sci. And Research, 2014,2(1):205:229
______________________________________________________________________________
206
INTRODUCTION
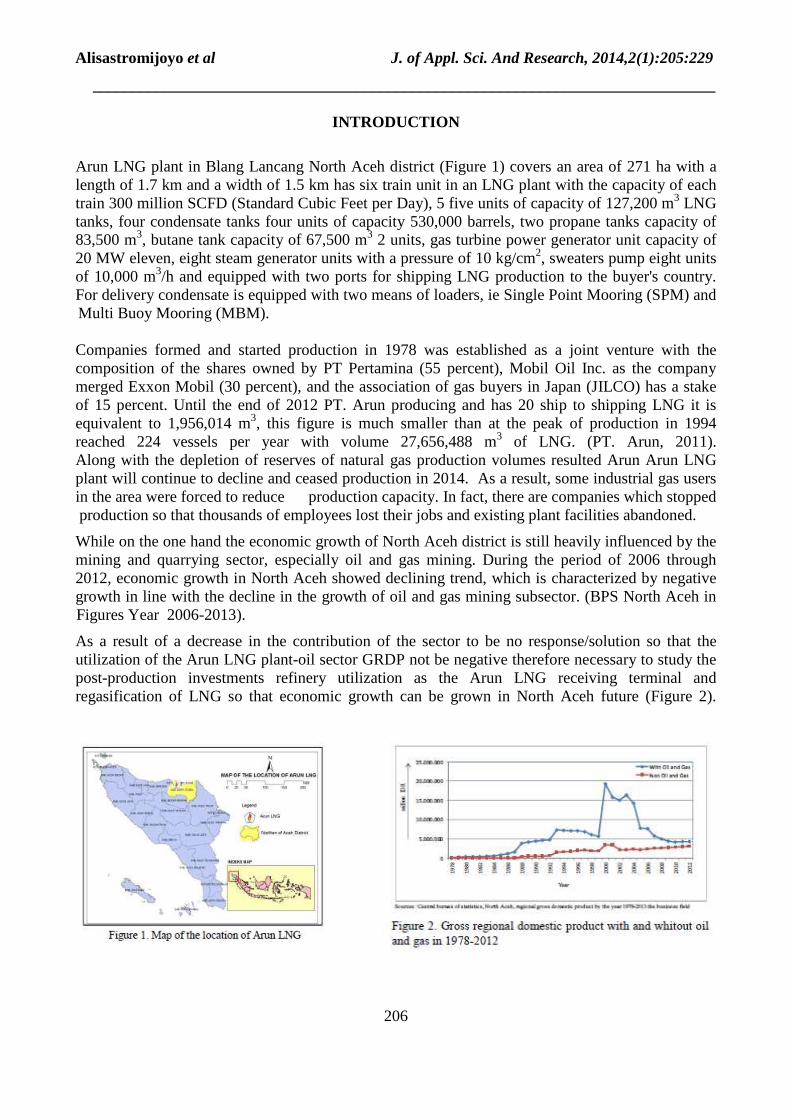
Arun LNG plant in Blang Lancang North Aceh district (Figure 1) covers an area of 271 ha with a length of 1.7 km and a width of 1.5 km has six train unit in an LNG plant with the capacity of each train 300 million SCFD (Standard Cubic Feet per Day), 5 five units of capacity of 127,200 m3 LNG tanks, four condensate tanks four units of capacity 530,000 barrels, two propane tanks capacity of 83,500 m3, butane tank capacity of 67,500 m3 2 units, gas turbine power generator unit capacity of 20 MW eleven, eight steam generator units with a pressure of 10 kg/cm2, sweaters pump eight units of 10,000 m3/h and equipped with two ports for shipping LNG production to the buyer's country. For delivery condensate is equipped with two means of loaders, ie Single Point Mooring (SPM) and Multi Buoy Mooring (MBM).
Companies formed and started production in 1978 was established as a joint venture with the composition of the shares owned by PT Pertamina (55 percent), Mobil Oil Inc. as the company merged Exxon Mobil (30 percent), and the association of gas buyers in Japan (JILCO) has a stake of 15 percent. Until the end of 2012 PT. Arun producing and has 20 ship to shipping LNG it is equivalent to 1,956,014 m3, this figure is much smaller than at the peak of production in 1994 reached 224 vessels per year with volume 27,656,488 m3 of LNG. (PT. Arun, 2011). Along with the depletion of reserves of natural gas production volumes resulted Arun Arun LNG plant will continue to decline and ceased production in 2014. As a result, some industrial gas users in the area were forced to reduce production capacity. In fact, there are companies which stopped production so that thousands of employees lost their jobs and existing plant facilities abandoned.
While on the one hand the economic growth of North Aceh district is still heavily influenced by the mining and quarrying sector, especially oil and gas mining. During the period of 2006 through 2012, economic growth in North Aceh showed declining trend, which is characterized by negative growth in line with the decline in the growth of oil and gas mining subsector. (BPS North Aceh in Figures Year 2006-2013).
As a result of a decrease in the contribution of the sector to be no response/solution so that the utilization of the Arun LNG plant-oil sector GRDP not be negative therefore necessary to study the post-production investments refinery utilization as the Arun LNG receiving terminal and regasification of LNG so that economic growth can be grown in North Aceh future (Figure 2).
Alisastromijoyo et al J. of Appl. Sci. And Research, 2014,2(1):205:229
______________________________________________________________________________
207
MATERIAL AND METHOD
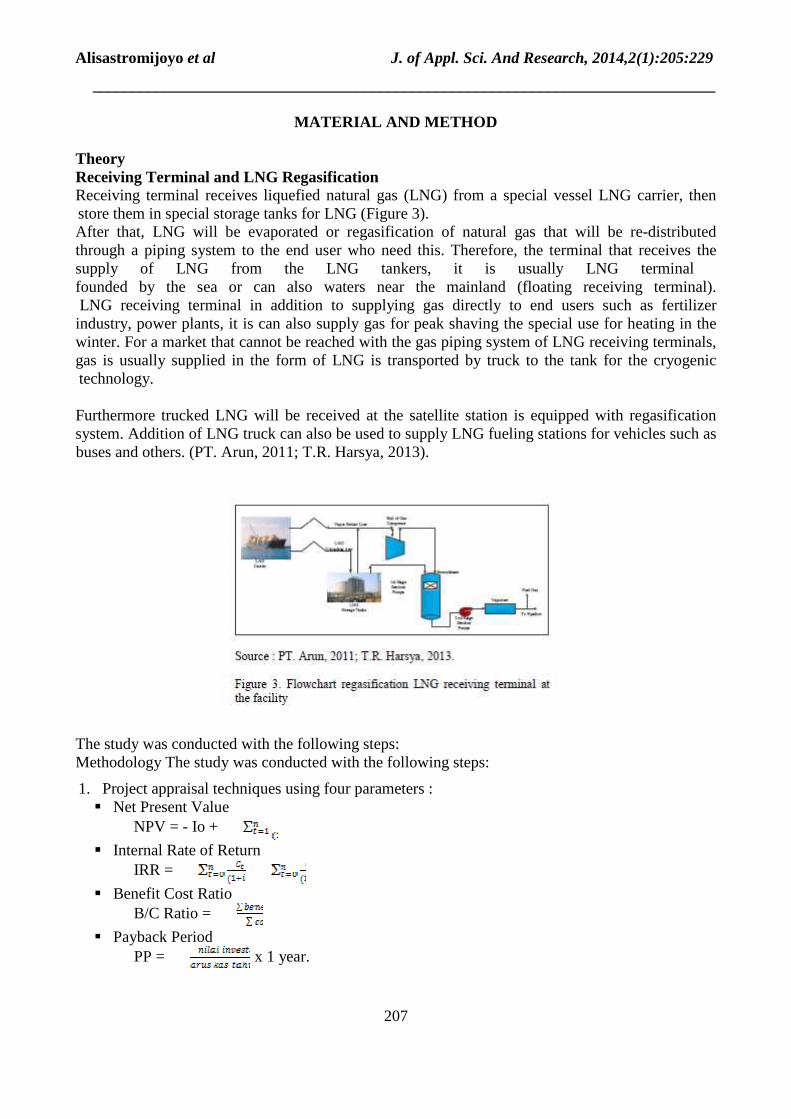
Theory Receiving Terminal and LNG Regasification Receiving terminal receives liquefied natural gas (LNG) from a special vessel LNG carrier, then store them in special storage tanks for LNG (Figure 3). After that, LNG will be evaporated or regasification of natural gas that will be re-distributed through a piping system to the end user who need this. Therefore, the terminal that receives the supply of LNG from the LNG tankers, it is usually LNG terminal founded by the sea or can also waters near the mainland (floating receiving terminal). LNG receiving terminal in addition to supplying gas directly to end users such as fertilizer industry, power plants, it is can also supply gas for peak shaving the special use for heating in the winter. For a market that cannot be reached with the gas piping system of LNG receiving terminals, gas is usually supplied in the form of LNG is transported by truck to the tank for the cryogenic technology.
Furthermore trucked LNG will be received at the satellite station is equipped with regasification system. Addition of LNG truck can also be used to supply LNG fueling stations for vehicles such as buses and others. (PT. Arun, 2011; T.R. Harsya, 2013).
The study was conducted with the following steps: Methodology The study was conducted with the following steps:
1. Project appraisal techniques using four parameters : � Net Present Value
NPV = - Io +
� Internal Rate of Return IRR =
� Benefit Cost Ratio B/C Ratio =
� Payback Period PP = x 1 year.
Alisastromijoyo et al J. of Appl. Sci. And Research, 2014,2(1):205:229
______________________________________________________________________________
208
2. Input-Output Model (Miernyk, 1965) :
Income multiplier (IM) =
Investment multiplier (I) =
Employment multiplier (LM) = .
3. Net Social Gain Revenue – Cost ± Net External Effect.
RESULT AND DISCUSSION
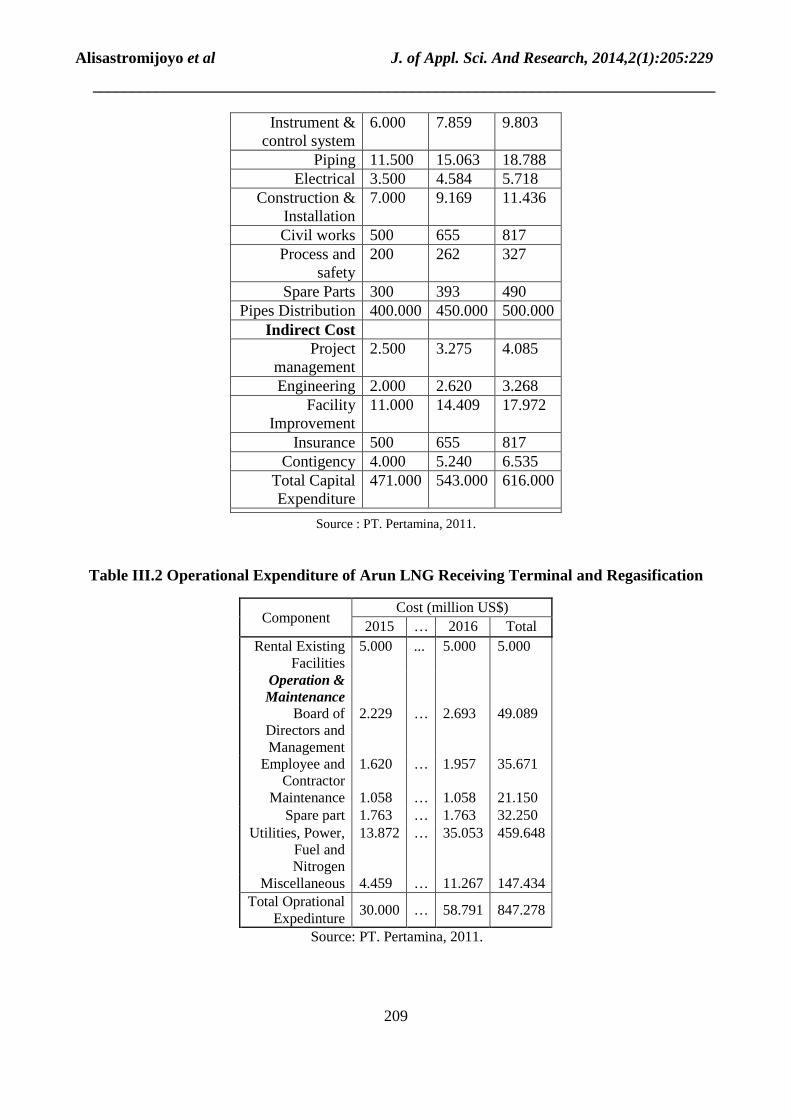
Capital Expenditure The costs incurred for the construction of an LNG receiving terminal post production Arun consists of several components as shown in Table III.1. These costs are incurred in the first year since the project started which is the process of development and utilization adjustment Arun LNG plant into a receiving terminal which covers LNG regasification process. The total investment cost incurred for this project is US$ 471 million for the first scenario, US$ 543 million for the second scenario, and US$ 616 million for the third scenario. With the biggest cost is the cost of building the pipeline distribution of US$ 400 – US$ 500 million and the cost of additional equipment for the gasification of US$ 22-35 million. (PT. Pertamina, 2011; T.R. Harsya, 2013).
Operational Expenditure The cost of operation of the receiving terminal and regasification of LNG Arun covers the cost of production (regasification), maintenance, employee payments, utilities, fuel, contractors, spares, and other costs to support the passage of the process of distribution and in the Arun LNG regasification. In addition to operating costs, there is the cost of leasing existing equipment such as LNG storage tanks that paid to the Government. Total operating costs for 20 years of operation is known of US$ 847.278 million as shown in Table III.2. (PT. Pertamina, 2011; T.R. Harsya, 2013).
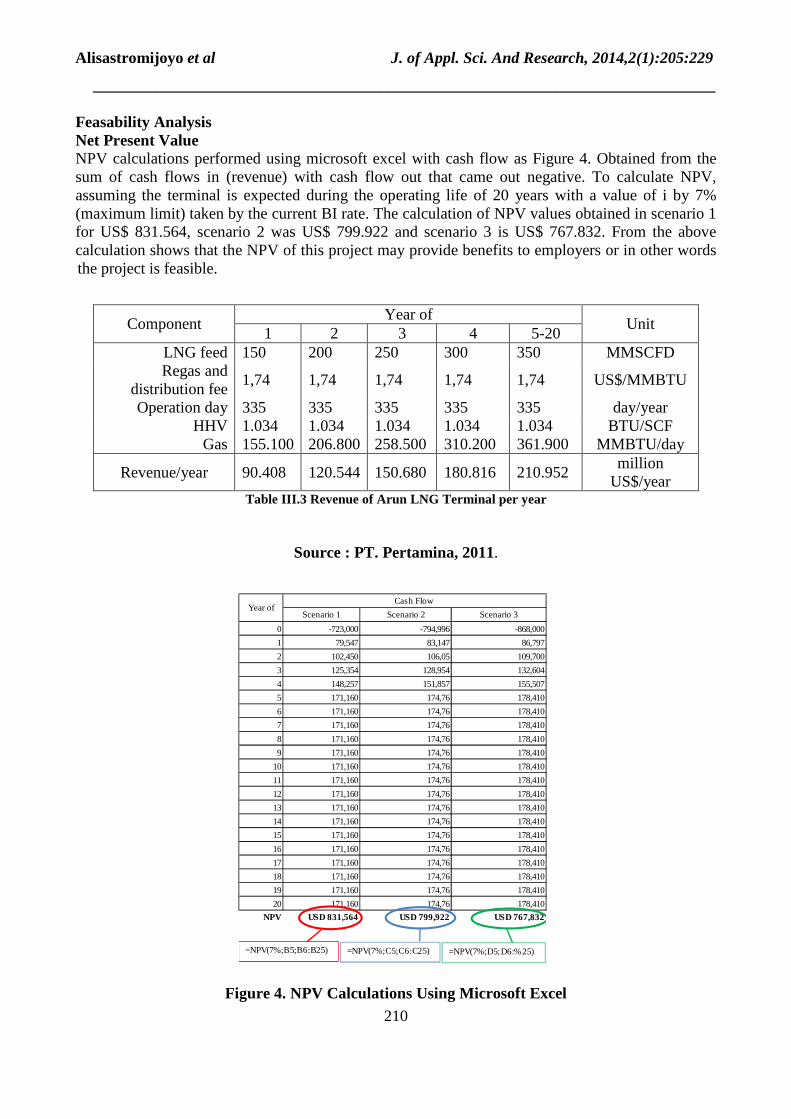
Revenue Income derived from LNG regasification costs before distributed to PLN industries and areas of Aceh and North Sumatra. Determination of the gas price to the industry and the PLN did not become a revenue structure of this project because it is an agreement between a supplier of LNG (LNG Tangguh and other suppliers) to the purchaser (buyer). Based on the data obtained, known revenue from LNG regasification process in year 1 of US$ 90.408 million, year-to-2 to US$ 120,544 million, and 3 increased to US$ 150.544 then the 4th year of US$ 180.816 million and constant from year 5 to 20 per year is US$ 210.952 million as shown in Table III.3. (PT. Pertamina, 2011; T.R. Harsya, 2013).
Table III.1 Capital Expenditure of Arun LNG Terminal
Item Cost Cost (million US$) Scenario
1 2 3 Direct Cost
Regasification Equipment
22.000 28.817 35.943
Alisastromijoyo et al J. of Appl. Sci. And Research, 2014,2(1):205:229
______________________________________________________________________________
209
Source : PT. Pertamina, 2011.
Table III.2 Operational Expenditure of Arun LNG Receiving Terminal and Regasification
Instrument & control system
6.000 7.859 9.803
Piping 11.500 15.063 18.788 Electrical 3.500 4.584 5.718
Construction & Installation
7.000 9.169 11.436
Civil works 500 655 817 Process and
safety 200 262 327
Spare Parts 300 393 490 Pipes Distribution 400.000 450.000 500.000
Indirect Cost Project
management 2.500 3.275 4.085
Engineering 2.000 2.620 3.268 Facility
Improvement 11.000 14.409 17.972
Insurance 500 655 817 Contigency 4.000 5.240 6.535
Total Capital Expenditure
471.000 543.000 616.000
Component Cost (million US$)
2015 … 2016 Total Rental Existing
Facilities 5.000 ... 5.000 5.000
Operation & Maintenance
Board of Directors and Management
2.229 … 2.693 49.089
Employee and Contractor
1.620 … 1.957 35.671
Maintenance 1.058 … 1.058 21.150 Spare part 1.763 … 1.763 32.250
Utilities, Power, Fuel and Nitrogen
13.872 … 35.053 459.648
Miscellaneous 4.459 … 11.267 147.434 Total Oprational
Expedinture 30.000 … 58.791 847.278
Source: PT. Pertamina, 2011.
Alisastromijoyo et al J. of Appl. Sci. And Research, 2014,2(1):205:229
______________________________________________________________________________
210
Feasability Analysis Net Present Value NPV calculations performed using microsoft excel with cash flow as Figure 4. Obtained from the sum of cash flows in (revenue) with cash flow out that came out negative. To calculate NPV, assuming the terminal is expected during the operating life of 20 years with a value of i by 7% (maximum limit) taken by the current BI rate. The calculation of NPV values obtained in scenario 1 for US$ 831.564, scenario 2 was US$ 799.922 and scenario 3 is US$ 767.832. From the above calculation shows that the NPV of this project may provide benefits to employers or in other words the project is feasible.
Table III.3 Revenue of Arun LNG Terminal per year
Source : PT. Pertamina, 2011.
Figure 4. NPV Calculations Using Microsoft Excel
Component Year of
Unit 1 2 3 4 5-20
LNG feed 150 200 250 300 350 MMSCFD Regas and
distribution fee 1,74 1,74 1,74 1,74 1,74 US$/MMBTU
Operation day 335 335 335 335 335 day/year HHV 1.034 1.034 1.034 1.034 1.034 BTU/SCF
Gas 155.100 206.800 258.500 310.200 361.900 MMBTU/day
Revenue/year 90.408 120.544 150.680 180.816 210.952 million
US$/year
Scenario 1 Scenario 2 Scenario 3
0 -723,000 -794,996 -868,000
1 79,547 83,147 86,797
2 102,450 106,05 109,700
3 125,354 128,954 132,604
4 148,257 151,857 155,507
5 171,160 174,76 178,410
6 171,160 174,76 178,410
7 171,160 174,76 178,410
8 171,160 174,76 178,410
9 171,160 174,76 178,410
10 171,160 174,76 178,410
11 171,160 174,76 178,410
12 171,160 174,76 178,410
13 171,160 174,76 178,410
14 171,160 174,76 178,410
15 171,160 174,76 178,410
16 171,160 174,76 178,410
17 171,160 174,76 178,410
18 171,160 174,76 178,410
19 171,160 174,76 178,410
20 171,160 174,76 178,410
NPV USD 831,564 USD 799,922 USD 767,832
Cash Flow Year of
=NPV(7%;B5;B6:B25) =NPV(7%;C5;C6:C25) =NPV(7%;D5;D6:%25)
Alisastromijoyo et al J. of Appl. Sci. And Research, 2014,2(1):205:229
______________________________________________________________________________
211
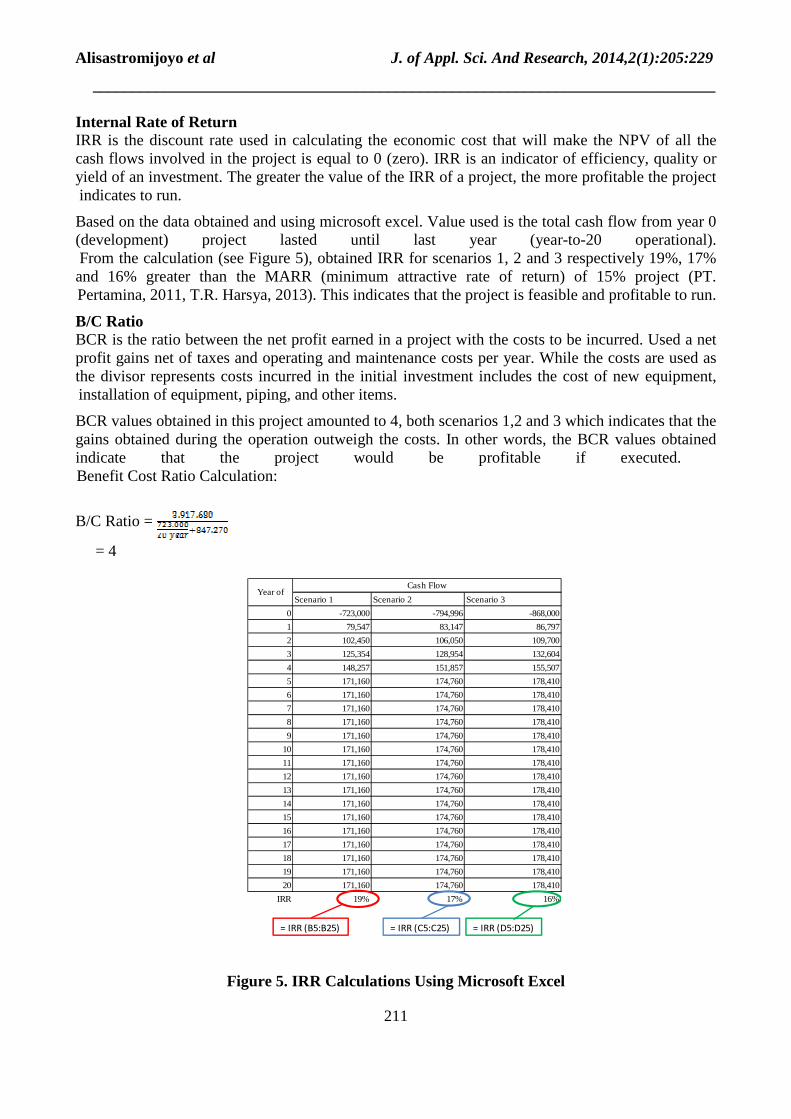
Internal Rate of Return IRR is the discount rate used in calculating the economic cost that will make the NPV of all the cash flows involved in the project is equal to 0 (zero). IRR is an indicator of efficiency, quality or yield of an investment. The greater the value of the IRR of a project, the more profitable the project indicates to run.
Based on the data obtained and using microsoft excel. Value used is the total cash flow from year 0 (development) project lasted until last year (year-to-20 operational). From the calculation (see Figure 5), obtained IRR for scenarios 1, 2 and 3 respectively 19%, 17% and 16% greater than the MARR (minimum attractive rate of return) of 15% project (PT. Pertamina, 2011, T.R. Harsya, 2013). This indicates that the project is feasible and profitable to run.
B/C Ratio BCR is the ratio between the net profit earned in a project with the costs to be incurred. Used a net profit gains net of taxes and operating and maintenance costs per year. While the costs are used as the divisor represents costs incurred in the initial investment includes the cost of new equipment, installation of equipment, piping, and other items.
BCR values obtained in this project amounted to 4, both scenarios 1,2 and 3 which indicates that the gains obtained during the operation outweigh the costs. In other words, the BCR values obtained indicate that the project would be profitable if executed. Benefit Cost Ratio Calculation:
B/C Ratio =
= 4
Figure 5. IRR Calculations Using Microsoft Excel
Scenario 1 Scenario 2 Scenario 3
0 -723,000 -794,996 -868,000
1 79,547 83,147 86,797
2 102,450 106,050 109,700
3 125,354 128,954 132,604
4 148,257 151,857 155,507
5 171,160 174,760 178,410
6 171,160 174,760 178,410
7 171,160 174,760 178,410
8 171,160 174,760 178,410
9 171,160 174,760 178,410
10 171,160 174,760 178,410
11 171,160 174,760 178,410
12 171,160 174,760 178,410
13 171,160 174,760 178,410
14 171,160 174,760 178,410
15 171,160 174,760 178,410
16 171,160 174,760 178,410
17 171,160 174,760 178,410
18 171,160 174,760 178,410
19 171,160 174,760 178,410
20 171,160 174,760 178,410
IRR 19% 17% 16%
Year ofCash Flow
= IRR (B5:B25) = IRR (C5:C25) = IRR (D5:D25)
Alisastromijoyo et al J. of Appl. Sci. And Research, 2014,2(1):205:229
______________________________________________________________________________
212
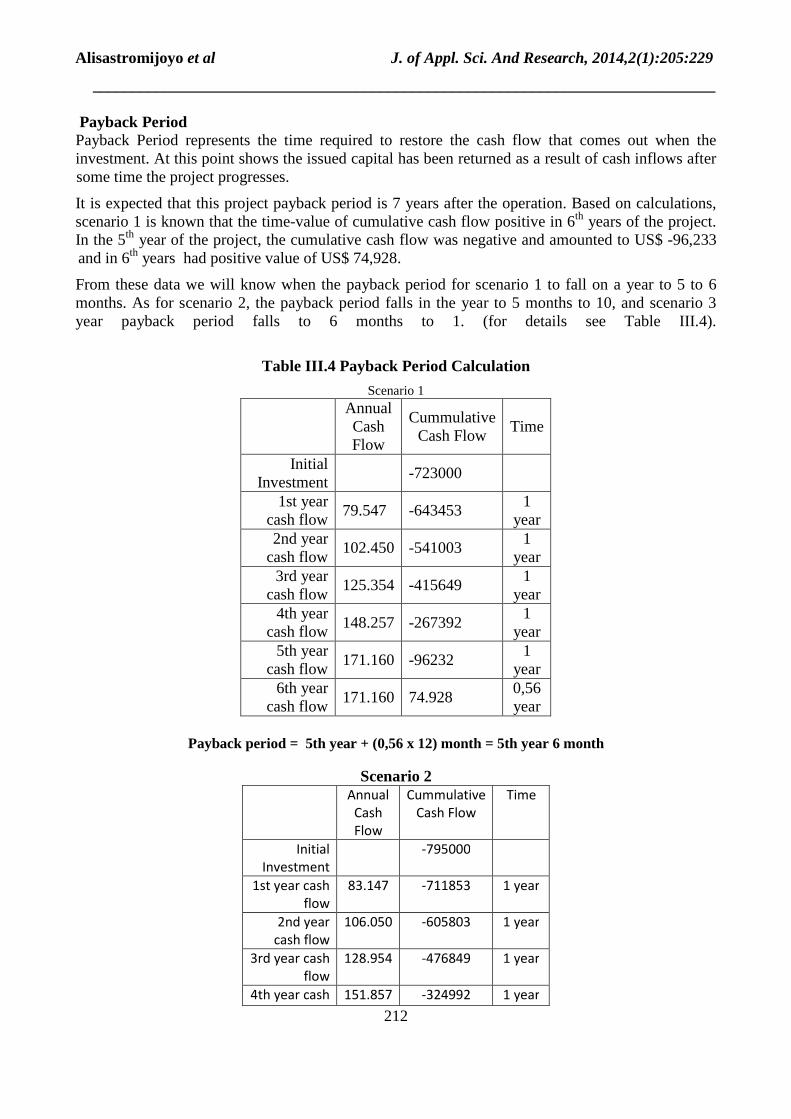
Payback Period Payback Period represents the time required to restore the cash flow that comes out when the investment. At this point shows the issued capital has been returned as a result of cash inflows after some time the project progresses.
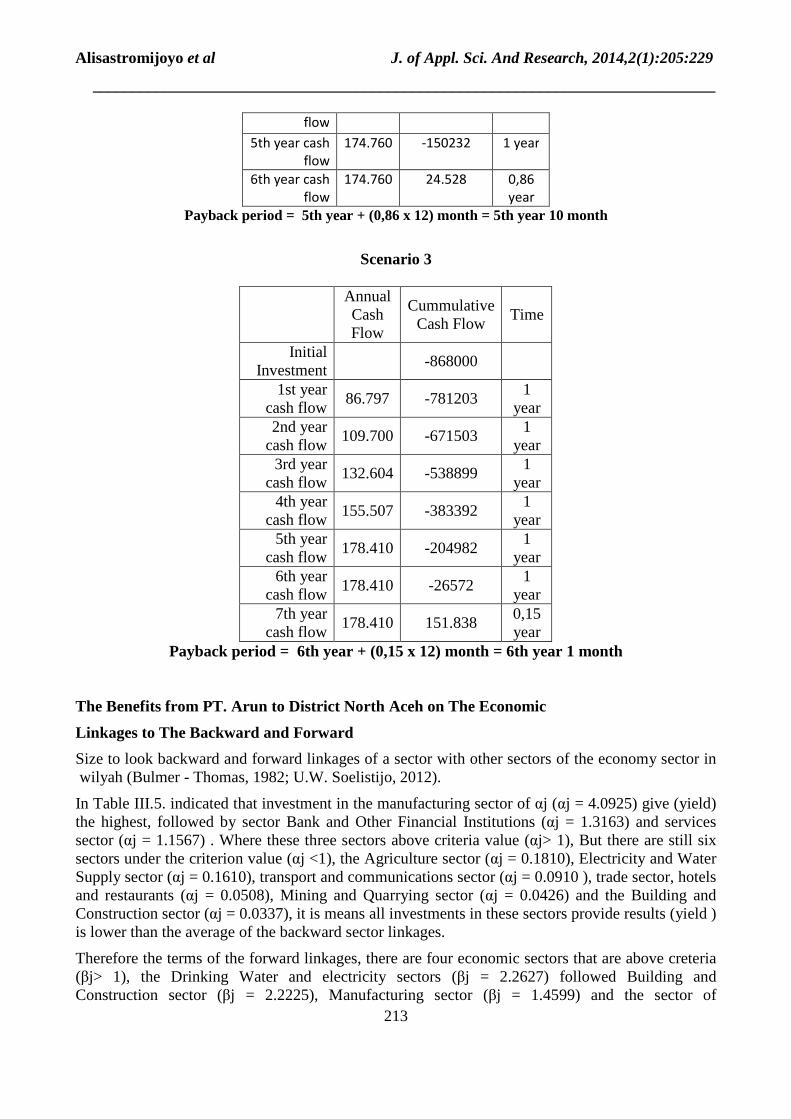
It is expected that this project payback period is 7 years after the operation. Based on calculations, scenario 1 is known that the time-value of cumulative cash flow positive in 6th years of the project. In the 5th year of the project, the cumulative cash flow was negative and amounted to US$ -96,233 and in 6th years had positive value of US$ 74,928.
From these data we will know when the payback period for scenario 1 to fall on a year to 5 to 6 months. As for scenario 2, the payback period falls in the year to 5 months to 10, and scenario 3 year payback period falls to 6 months to 1. (for details see Table III.4).
Table III.4 Payback Period Calculation
Scenario 1
Annual Cash Flow
Cummulative Cash Flow
Time
Initial Investment
-723000
1st year cash flow
79.547 -643453 1
year 2nd year
cash flow 102.450 -541003
1 year
3rd year cash flow
125.354 -415649 1
year 4th year
cash flow 148.257 -267392
1 year
5th year cash flow
171.160 -96232 1
year 6th year
cash flow 171.160 74.928
0,56 year
Payback period = 5th year + (0,56 x 12) month = 5th year 6 month
Scenario 2
Annual
Cash
Flow
Cummulative
Cash Flow
Time
Initial
Investment
-795000
1st year cash
flow
83.147 -711853 1 year
2nd year
cash flow
106.050 -605803 1 year
3rd year cash
flow
128.954 -476849 1 year
4th year cash 151.857 -324992 1 year
Alisastromijoyo et al J. of Appl. Sci. And Research, 2014,2(1):205:229
______________________________________________________________________________
213
flow
5th year cash
flow
174.760 -150232 1 year
6th year cash
flow
174.760 24.528 0,86
year
Payback period = 5th year + (0,86 x 12) month = 5th year 10 month
Scenario 3
Annual Cash Flow
Cummulative Cash Flow
Time
Initial Investment
-868000
1st year cash flow
86.797 -781203 1
year 2nd year
cash flow 109.700 -671503
1 year
3rd year cash flow
132.604 -538899 1
year 4th year
cash flow 155.507 -383392
1 year
5th year cash flow
178.410 -204982 1
year 6th year
cash flow 178.410 -26572
1 year
7th year cash flow
178.410 151.838 0,15 year
Payback period = 6th year + (0,15 x 12) month = 6th year 1 month
The Benefits from PT. Arun to District North Aceh on The Economic
Linkages to The Backward and Forward
Size to look backward and forward linkages of a sector with other sectors of the economy sector in wilyah (Bulmer - Thomas, 1982; U.W. Soelistijo, 2012).
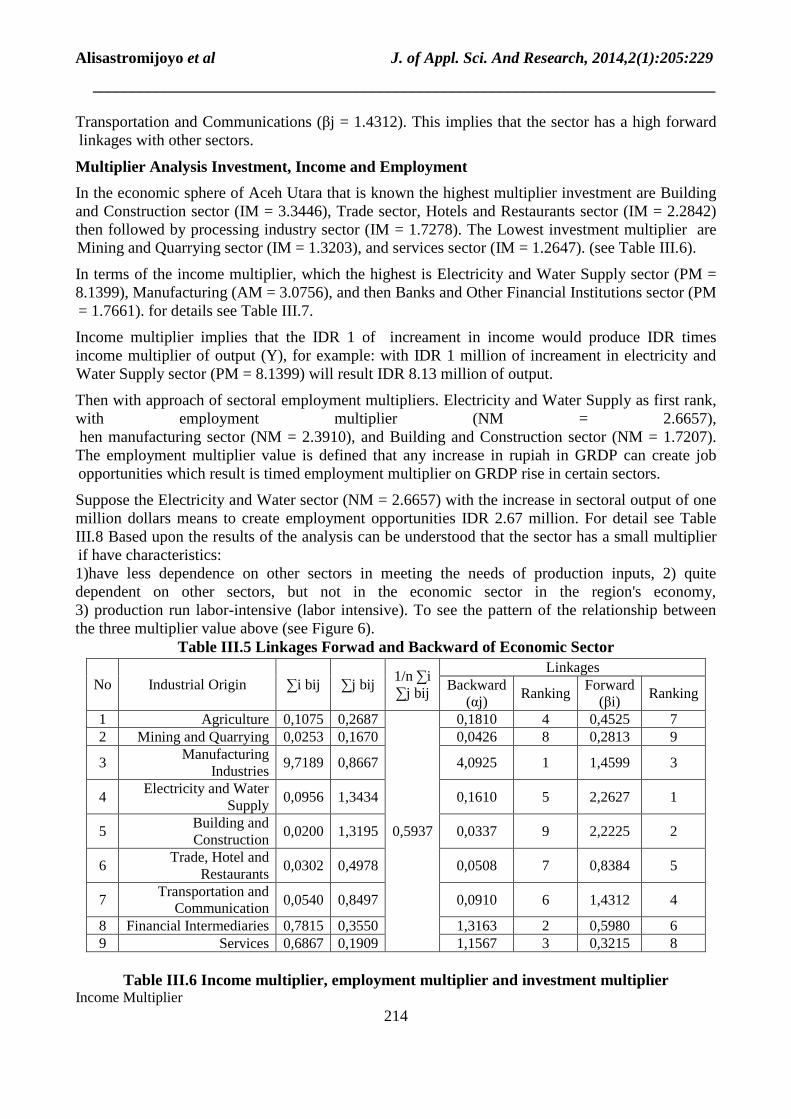
In Table III.5. indicated that investment in the manufacturing sector of αj (αj = 4.0925) give (yield) the highest, followed by sector Bank and Other Financial Institutions (αj = 1.3163) and services sector (αj = 1.1567) . Where these three sectors above criteria value (αj> 1), But there are still six sectors under the criterion value (αj <1), the Agriculture sector (αj = 0.1810), Electricity and Water Supply sector (αj = 0.1610), transport and communications sector (αj = 0.0910 ), trade sector, hotels and restaurants (αj = 0.0508), Mining and Quarrying sector (αj = 0.0426) and the Building and Construction sector (αj = 0.0337), it is means all investments in these sectors provide results (yield ) is lower than the average of the backward sector linkages.
Therefore the terms of the forward linkages, there are four economic sectors that are above creteria (βj> 1), the Drinking Water and electricity sectors (βj = 2.2627) followed Building and Construction sector (βj = 2.2225), Manufacturing sector (βj = 1.4599) and the sector of
Alisastromijoyo et al J. of Appl. Sci. And Research, 2014,2(1):205:229
______________________________________________________________________________
214
Transportation and Communications (βj = 1.4312). This implies that the sector has a high forward linkages with other sectors.
Multiplier Analysis Investment, Income and Employment
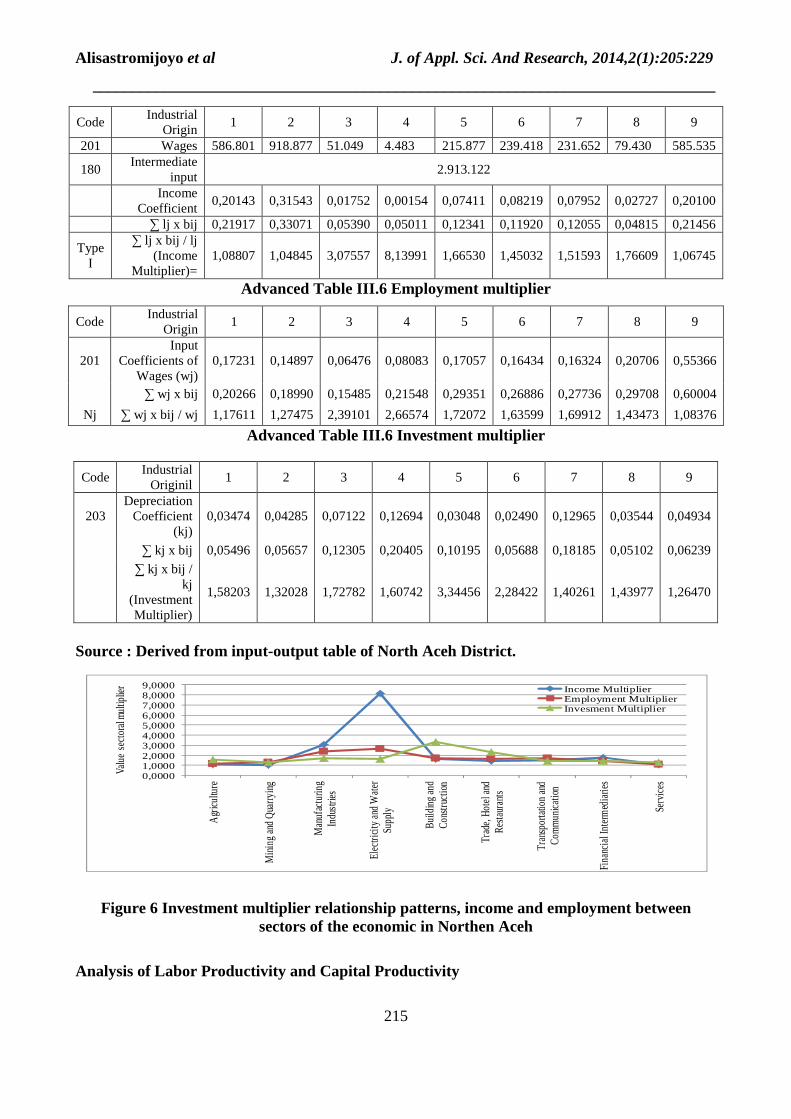
In the economic sphere of Aceh Utara that is known the highest multiplier investment are Building and Construction sector (IM = 3.3446), Trade sector, Hotels and Restaurants sector (IM = 2.2842) then followed by processing industry sector (IM = 1.7278). The Lowest investment multiplier are Mining and Quarrying sector (IM = 1.3203), and services sector (IM = 1.2647). (see Table III.6).
In terms of the income multiplier, which the highest is Electricity and Water Supply sector (PM = 8.1399), Manufacturing (AM = 3.0756), and then Banks and Other Financial Institutions sector (PM = 1.7661). for details see Table III.7.
Income multiplier implies that the IDR 1 of increament in income would produce IDR times income multiplier of output (Y), for example: with IDR 1 million of increament in electricity and Water Supply sector (PM = 8.1399) will result IDR 8.13 million of output.
Then with approach of sectoral employment multipliers. Electricity and Water Supply as first rank, with employment multiplier (NM = 2.6657), hen manufacturing sector (NM = 2.3910), and Building and Construction sector (NM = 1.7207). The employment multiplier value is defined that any increase in rupiah in GRDP can create job opportunities which result is timed employment multiplier on GRDP rise in certain sectors.
Suppose the Electricity and Water sector (NM = 2.6657) with the increase in sectoral output of one million dollars means to create employment opportunities IDR 2.67 million. For detail see Table III.8 Based upon the results of the analysis can be understood that the sector has a small multiplier if have characteristics: 1)have less dependence on other sectors in meeting the needs of production inputs, 2) quite dependent on other sectors, but not in the economic sector in the region's economy, 3) production run labor-intensive (labor intensive). To see the pattern of the relationship between the three multiplier value above (see Figure 6).
Table III.5 Linkages Forwad and Backward of Economic Sector
Table III.6 Income multiplier, employment multiplier and investment multiplier
Income Multiplier
No Industrial Origin ∑i bij ∑j bij 1/n ∑i ∑j bij
Linkages Backward
(αj) Ranking
Forward (βi)
Ranking
1 Agriculture 0,1075 0,2687
0,5937
0,1810 4 0,4525 7 2 Mining and Quarrying 0,0253 0,1670 0,0426 8 0,2813 9
3 Manufacturing
Industries 9,7189 0,8667 4,0925 1 1,4599 3
4 Electricity and Water
Supply 0,0956 1,3434 0,1610 5 2,2627 1
5 Building and Construction
0,0200 1,3195 0,0337 9 2,2225 2
6 Trade, Hotel and
Restaurants 0,0302 0,4978 0,0508 7 0,8384 5
7 Transportation and
Communication 0,0540 0,8497 0,0910 6 1,4312 4
8 Financial Intermediaries 0,7815 0,3550 1,3163 2 0,5980 6 9 Services 0,6867 0,1909 1,1567 3 0,3215 8
Alisastromijoyo et al J. of Appl. Sci. And Research, 2014,2(1):205:229
______________________________________________________________________________
215
Advanced Table III.6 Employment multiplier
Advanced Table III.6 Investment multiplier
Source : Derived from input-output table of North Aceh District.
Figure 6 Investment multiplier relationship patterns, income and employment between sectors of the economic in Northen Aceh
Analysis of Labor Productivity and Capital Productivity
Code Industrial
Origin 1 2 3 4 5 6 7 8 9
201 Wages 586.801 918.877 51.049 4.483 215.877 239.418 231.652 79.430 585.535
180 Intermediate
input 2.913.122
Income
Coefficient 0,20143 0,31543 0,01752 0,00154 0,07411 0,08219 0,07952 0,02727 0,20100
∑ lj x bij 0,21917 0,33071 0,05390 0,05011 0,12341 0,11920 0,12055 0,04815 0,21456
Type I
∑ lj x bij / lj (Income
Multiplier)= 1,08807 1,04845 3,07557 8,13991 1,66530 1,45032 1,51593 1,76609 1,06745
Code Industrial
Origin 1 2 3 4 5 6 7 8 9
201 Input
Coefficients of Wages (wj)
0,17231 0,14897 0,06476 0,08083 0,17057 0,16434 0,16324 0,20706 0,55366
∑ wj x bij 0,20266 0,18990 0,15485 0,21548 0,29351 0,26886 0,27736 0,29708 0,60004
Nj ∑ wj x bij / wj 1,17611 1,27475 2,39101 2,66574 1,72072 1,63599 1,69912 1,43473 1,08376
Code Industrial
Originil 1 2 3 4 5 6 7 8 9
203 Depreciation
Coefficient (kj)
0,03474 0,04285 0,07122 0,12694 0,03048 0,02490 0,12965 0,03544 0,04934
∑ kj x bij 0,05496 0,05657 0,12305 0,20405 0,10195 0,05688 0,18185 0,05102 0,06239
∑ kj x bij / kj
(Investment Multiplier)
1,58203 1,32028 1,72782 1,60742 3,34456 2,28422 1,40261 1,43977 1,26470
0,00001,00002,00003,00004,00005,00006,00007,00008,00009,0000
Agric
ultu
re
Min
ing
and
Qua
rryin
g
Man
ufac
turin
gIn
dust
ries
Elec
tricit
y an
d W
ater
Supp
ly
Build
ing
and
Con
stru
ctio
n
Trad
e, H
otel
and
Res
taur
ants
Tran
spor
tatio
n an
dC
omm
unica
tion
Fina
ncia
l Int
erm
edia
ries
Serv
ices
Income MultiplierEmployment MultiplierInvesment Multiplier
Valu
e se
ctor
al m
ultip
lier
Alisastromijoyo et al J. of Appl. Sci. And Research, 2014,2(1):205:229
______________________________________________________________________________
216
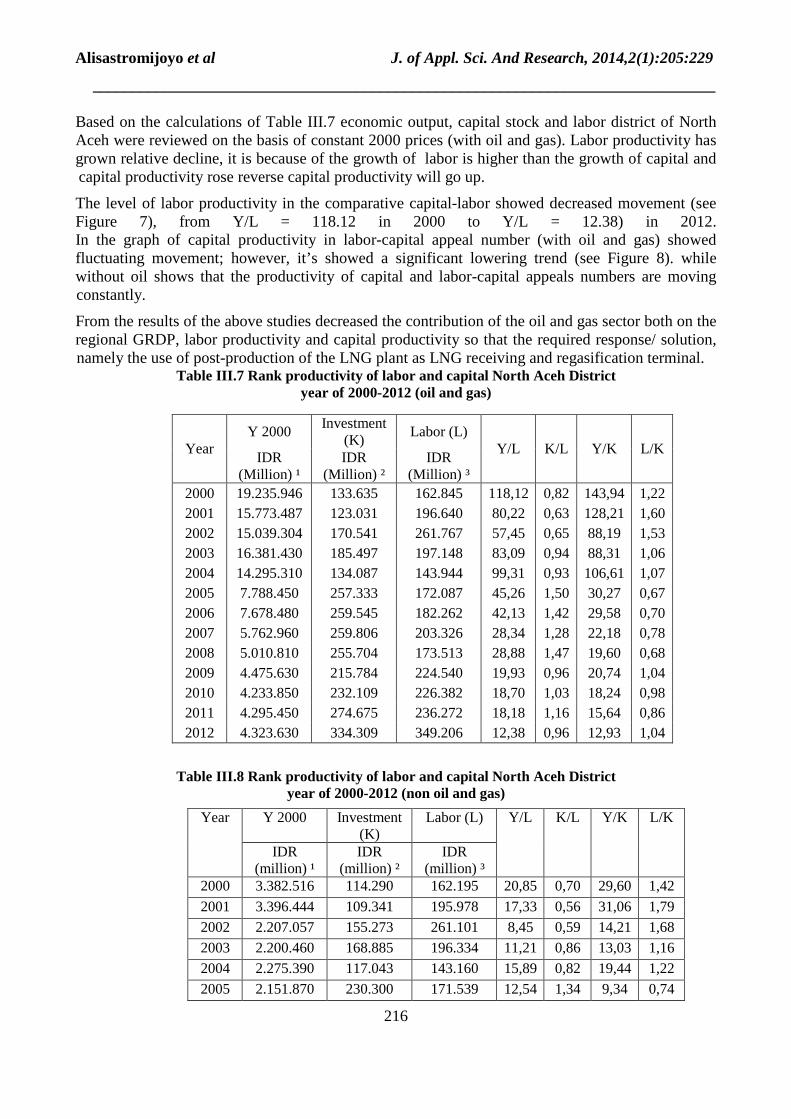
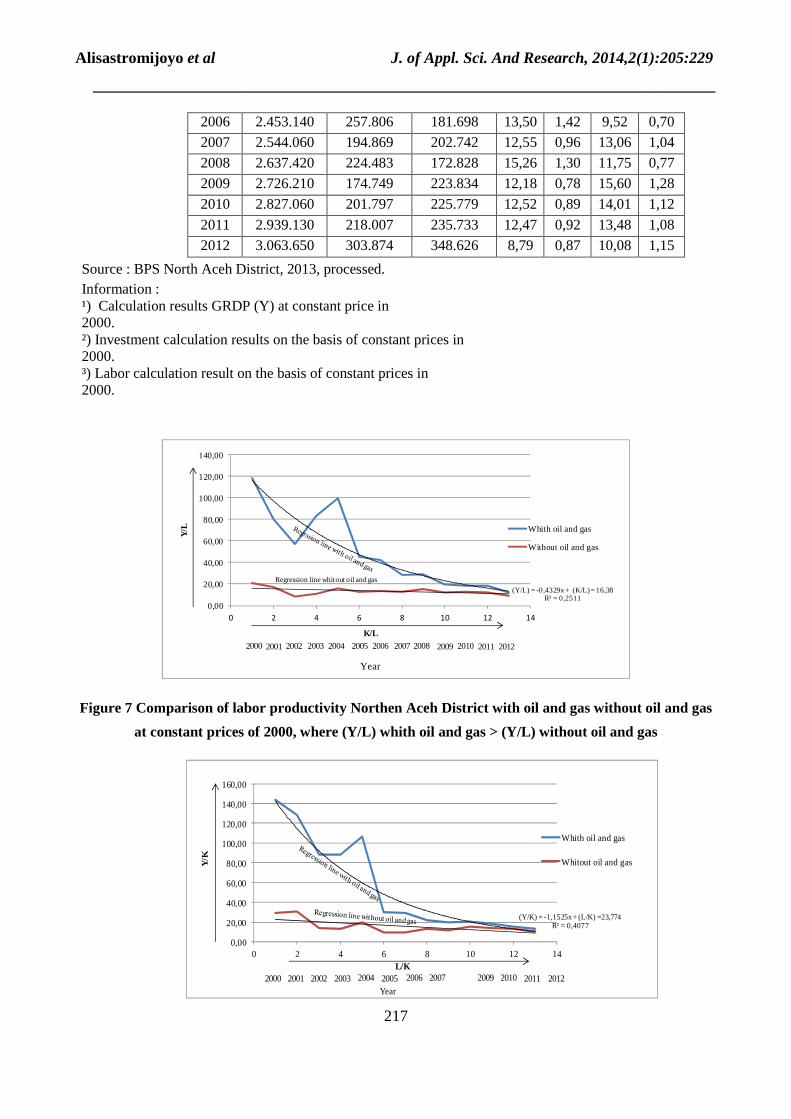
Based on the calculations of Table III.7 economic output, capital stock and labor district of North Aceh were reviewed on the basis of constant 2000 prices (with oil and gas). Labor productivity has grown relative decline, it is because of the growth of labor is higher than the growth of capital and capital productivity rose reverse capital productivity will go up.
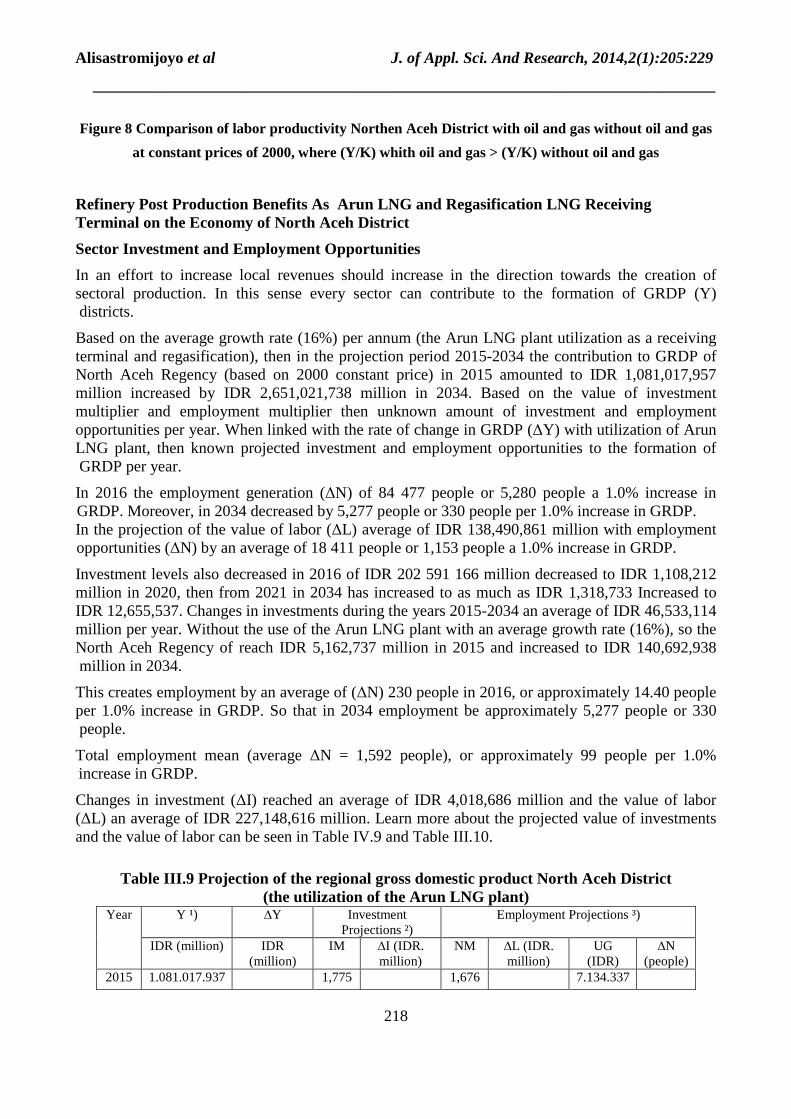
The level of labor productivity in the comparative capital-labor showed decreased movement (see Figure 7), from Y/L = 118.12 in 2000 to Y/L = 12.38) in 2012. In the graph of capital productivity in labor-capital appeal number (with oil and gas) showed fluctuating movement; however, it’s showed a significant lowering trend (see Figure 8). while without oil shows that the productivity of capital and labor-capital appeals numbers are moving constantly.
From the results of the above studies decreased the contribution of the oil and gas sector both on the regional GRDP, labor productivity and capital productivity so that the required response/ solution, namely the use of post-production of the LNG plant as LNG receiving and regasification terminal.
Table III.7 Rank productivity of labor and capital North Aceh District year of 2000-2012 (oil and gas)
Table III.8 Rank productivity of labor and capital North Aceh District
year of 2000-2012 (non oil and gas)
Year Y 2000
Investment (K)
Labor (L) Y/L K/L Y/K L/K
IDR (Million) ¹
IDR (Million) ²
IDR (Million) ³
2000 19.235.946 133.635 162.845 118,12 0,82 143,94 1,22 2001 15.773.487 123.031 196.640 80,22 0,63 128,21 1,60 2002 15.039.304 170.541 261.767 57,45 0,65 88,19 1,53 2003 16.381.430 185.497 197.148 83,09 0,94 88,31 1,06 2004 14.295.310 134.087 143.944 99,31 0,93 106,61 1,07 2005 7.788.450 257.333 172.087 45,26 1,50 30,27 0,67 2006 7.678.480 259.545 182.262 42,13 1,42 29,58 0,70 2007 5.762.960 259.806 203.326 28,34 1,28 22,18 0,78 2008 5.010.810 255.704 173.513 28,88 1,47 19,60 0,68 2009 4.475.630 215.784 224.540 19,93 0,96 20,74 1,04 2010 4.233.850 232.109 226.382 18,70 1,03 18,24 0,98 2011 4.295.450 274.675 236.272 18,18 1,16 15,64 0,86 2012 4.323.630 334.309 349.206 12,38 0,96 12,93 1,04
Year Y 2000 Investment (K)
Labor (L) Y/L K/L Y/K L/K
IDR (million) ¹
IDR (million) ²
IDR (million) ³
2000 3.382.516 114.290 162.195 20,85 0,70 29,60 1,42
2001 3.396.444 109.341 195.978 17,33 0,56 31,06 1,79
2002 2.207.057 155.273 261.101 8,45 0,59 14,21 1,68
2003 2.200.460 168.885 196.334 11,21 0,86 13,03 1,16
2004 2.275.390 117.043 143.160 15,89 0,82 19,44 1,22
2005 2.151.870 230.300 171.539 12,54 1,34 9,34 0,74
Alisastromijoyo et al J. of Appl. Sci. And Research, 2014,2(1):205:229
______________________________________________________________________________
217
Source : BPS North Aceh District, 2013, processed. Information : ¹) Calculation results GRDP (Y) at constant price in 2000. ²) Investment calculation results on the basis of constant prices in 2000. ³) Labor calculation result on the basis of constant prices in 2000.
CONCLUSION
Figure 7 Comparison of labor productivity Northen Aceh District with oil and gas without oil and gas
at constant prices of 2000, where (Y/L) whith oil and gas > (Y/L) without oil and gas
2006 2.453.140 257.806 181.698 13,50 1,42 9,52 0,70
2007 2.544.060 194.869 202.742 12,55 0,96 13,06 1,04
2008 2.637.420 224.483 172.828 15,26 1,30 11,75 0,77
2009 2.726.210 174.749 223.834 12,18 0,78 15,60 1,28
2010 2.827.060 201.797 225.779 12,52 0,89 14,01 1,12
2011 2.939.130 218.007 235.733 12,47 0,92 13,48 1,08
2012 3.063.650 303.874 348.626 8,79 0,87 10,08 1,15
(Y/L) = -0,4329x + (K/L) = 16,38R² = 0,2511
0,00
20,00
40,00
60,00
80,00
100,00
120,00
140,00
0 2 4 6 8 10 12 14
Whith oil and gas
Without oil and gas
K/L
Y/L
2000 2001 2002 2003 2004 2005 2006 2007 20082009 2010 2011 2012
Year
Regression line whitout oil and gas
(Y/K) = -1,1525x + (L/K) =23,774R² = 0,4077
0,00
20,00
40,00
60,00
80,00
100,00
120,00
140,00
160,00
0 2 4 6 8 10 12 14
Whith oil and gas
Whitout oil and gasY/K
L/K
Year2000 2001 2002 20032004 2005 2006 2007 2009 20102011 2012
Alisastromijoyo et al J. of Appl. Sci. And Research, 2014,2(1):205:229
______________________________________________________________________________
218
Figure 8 Comparison of labor productivity Northen Aceh District with oil and gas without oil and gas
at constant prices of 2000, where (Y/K) whith oil and gas > (Y/K) without oil and gas
Refinery Post Production Benefits As Arun LNG and Regasification LNG Receiving Terminal on the Economy of North Aceh District
Sector Investment and Employment Opportunities
In an effort to increase local revenues should increase in the direction towards the creation of sectoral production. In this sense every sector can contribute to the formation of GRDP (Y) districts.
Based on the average growth rate (16%) per annum (the Arun LNG plant utilization as a receiving terminal and regasification), then in the projection period 2015-2034 the contribution to GRDP of North Aceh Regency (based on 2000 constant price) in 2015 amounted to IDR 1,081,017,957 million increased by IDR 2,651,021,738 million in 2034. Based on the value of investment multiplier and employment multiplier then unknown amount of investment and employment opportunities per year. When linked with the rate of change in GRDP (∆Y) with utilization of Arun LNG plant, then known projected investment and employment opportunities to the formation of GRDP per year.
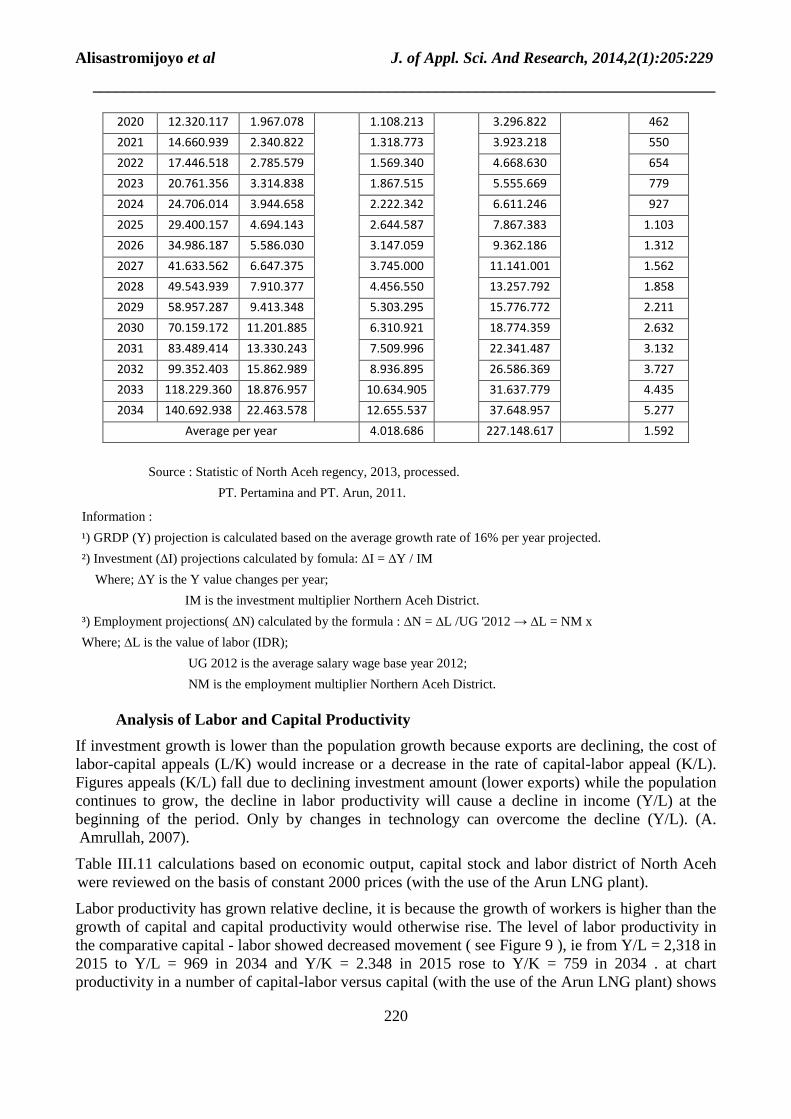
In 2016 the employment generation (∆N) of 84 477 people or 5,280 people a 1.0% increase in GRDP. Moreover, in 2034 decreased by 5,277 people or 330 people per 1.0% increase in GRDP. In the projection of the value of labor (∆L) average of IDR 138,490,861 million with employment opportunities (∆N) by an average of 18 411 people or 1,153 people a 1.0% increase in GRDP.
Investment levels also decreased in 2016 of IDR 202 591 166 million decreased to IDR 1,108,212 million in 2020, then from 2021 in 2034 has increased to as much as IDR 1,318,733 Increased to IDR 12,655,537. Changes in investments during the years 2015-2034 an average of IDR 46,533,114 million per year. Without the use of the Arun LNG plant with an average growth rate (16%), so the North Aceh Regency of reach IDR 5,162,737 million in 2015 and increased to IDR 140,692,938 million in 2034.
This creates employment by an average of (∆N) 230 people in 2016, or approximately 14.40 people per 1.0% increase in GRDP. So that in 2034 employment be approximately 5,277 people or 330 people.
Total employment mean (average ∆N = 1,592 people), or approximately 99 people per 1.0% increase in GRDP.
Changes in investment (∆I) reached an average of IDR 4,018,686 million and the value of labor (∆L) an average of IDR 227,148,616 million. Learn more about the projected value of investments and the value of labor can be seen in Table IV.9 and Table III.10.
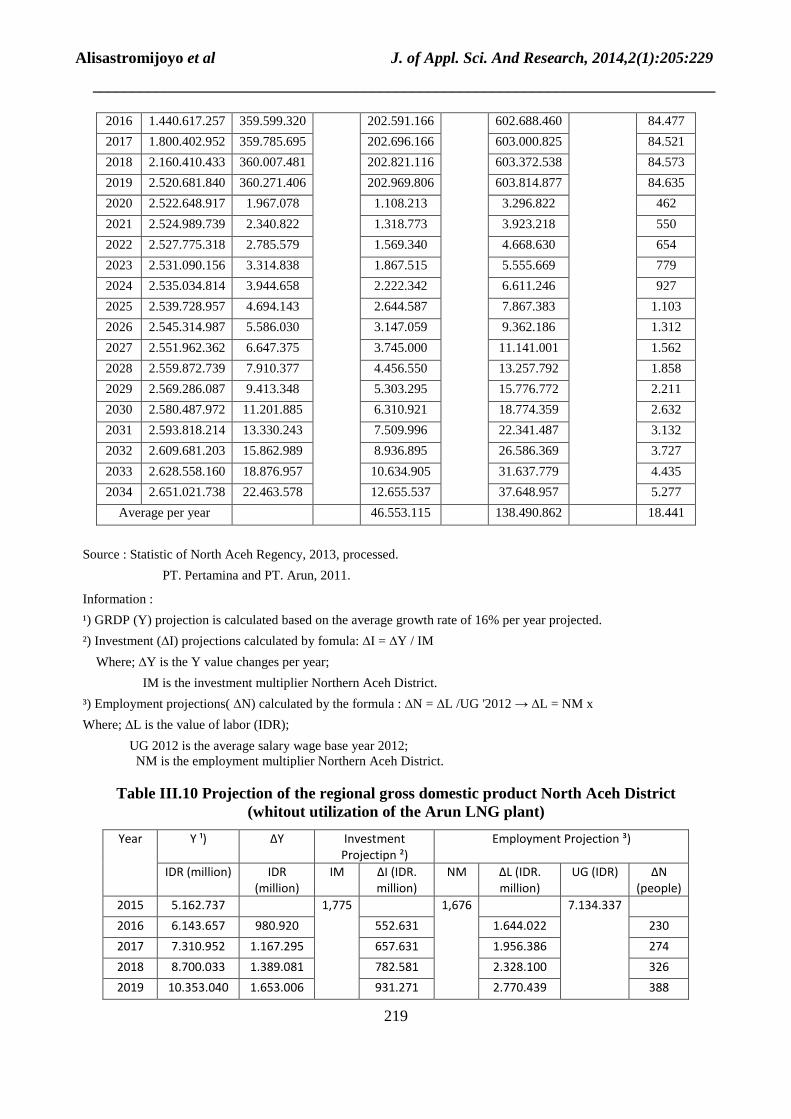
Table III.9 Projection of the regional gross domestic product North Aceh District
(the utilization of the Arun LNG plant) Year Y ¹) ∆Y Investment
Projections ²) Employment Projections ³)
IDR (million) IDR (million)
IM ∆I (IDR. million)
NM ∆L (IDR. million)
UG (IDR)
∆N (people)
2015 1.081.017.937 1,775 1,676 7.134.337
Alisastromijoyo et al J. of Appl. Sci. And Research, 2014,2(1):205:229
______________________________________________________________________________
219
Source : Statistic of North Aceh Regency, 2013, processed.
PT. Pertamina and PT. Arun, 2011.
Information :
¹) GRDP (Y) projection is calculated based on the average growth rate of 16% per year projected.
²) Investment (∆I) projections calculated by fomula: ∆I = ∆Y / IM
Where; ∆Y is the Y value changes per year;
IM is the investment multiplier Northern Aceh District.
³) Employment projections( ∆N) calculated by the formula : ∆N = ∆L /UG '2012 → ∆L = NM x
Where; ∆L is the value of labor (IDR);
UG 2012 is the average salary wage base year 2012; NM is the employment multiplier Northern Aceh District.
Table III.10 Projection of the regional gross domestic product North Aceh District
(whitout utilization of the Arun LNG plant)
2016 1.440.617.257 359.599.320 202.591.166 602.688.460 84.477
2017 1.800.402.952 359.785.695 202.696.166 603.000.825 84.521
2018 2.160.410.433 360.007.481 202.821.116 603.372.538 84.573
2019 2.520.681.840 360.271.406 202.969.806 603.814.877 84.635
2020 2.522.648.917 1.967.078 1.108.213 3.296.822 462
2021 2.524.989.739 2.340.822 1.318.773 3.923.218 550
2022 2.527.775.318 2.785.579 1.569.340 4.668.630 654
2023 2.531.090.156 3.314.838 1.867.515 5.555.669 779
2024 2.535.034.814 3.944.658 2.222.342 6.611.246 927
2025 2.539.728.957 4.694.143 2.644.587 7.867.383 1.103
2026 2.545.314.987 5.586.030 3.147.059 9.362.186 1.312
2027 2.551.962.362 6.647.375 3.745.000 11.141.001 1.562
2028 2.559.872.739 7.910.377 4.456.550 13.257.792 1.858
2029 2.569.286.087 9.413.348 5.303.295 15.776.772 2.211
2030 2.580.487.972 11.201.885 6.310.921 18.774.359 2.632
2031 2.593.818.214 13.330.243 7.509.996 22.341.487 3.132
2032 2.609.681.203 15.862.989 8.936.895 26.586.369 3.727
2033 2.628.558.160 18.876.957 10.634.905 31.637.779 4.435
2034 2.651.021.738 22.463.578 12.655.537 37.648.957 5.277
Average per year 46.553.115 138.490.862 18.441
Year Y ¹) ∆Y Investment
Projectipn ²)
Employment Projection ³)
IDR (million) IDR
(million)
IM ∆I (IDR.
million)
NM ∆L (IDR.
million)
UG (IDR) ∆N
(people)
2015 5.162.737 1,775 1,676 7.134.337
2016 6.143.657 980.920 552.631 1.644.022 230
2017 7.310.952 1.167.295 657.631 1.956.386 274
2018 8.700.033 1.389.081 782.581 2.328.100 326
2019 10.353.040 1.653.006 931.271 2.770.439 388
Alisastromijoyo et al J. of Appl. Sci. And Research, 2014,2(1):205:229
______________________________________________________________________________
220
Source : Statistic of North Aceh regency, 2013, processed.
PT. Pertamina and PT. Arun, 2011.
Information : ¹) GRDP (Y) projection is calculated based on the average growth rate of 16% per year projected.
²) Investment (∆I) projections calculated by fomula: ∆I = ∆Y / IM Where; ∆Y is the Y value changes per year; IM is the investment multiplier Northern Aceh District. ³) Employment projections( ∆N) calculated by the formula : ∆N = ∆L /UG '2012 → ∆L = NM x
Where; ∆L is the value of labor (IDR); UG 2012 is the average salary wage base year 2012; NM is the employment multiplier Northern Aceh District.
Analysis of Labor and Capital Productivity
If investment growth is lower than the population growth because exports are declining, the cost of labor-capital appeals (L/K) would increase or a decrease in the rate of capital-labor appeal (K/L). Figures appeals (K/L) fall due to declining investment amount (lower exports) while the population continues to grow, the decline in labor productivity will cause a decline in income (Y/L) at the beginning of the period. Only by changes in technology can overcome the decline (Y/L). (A. Amrullah, 2007).
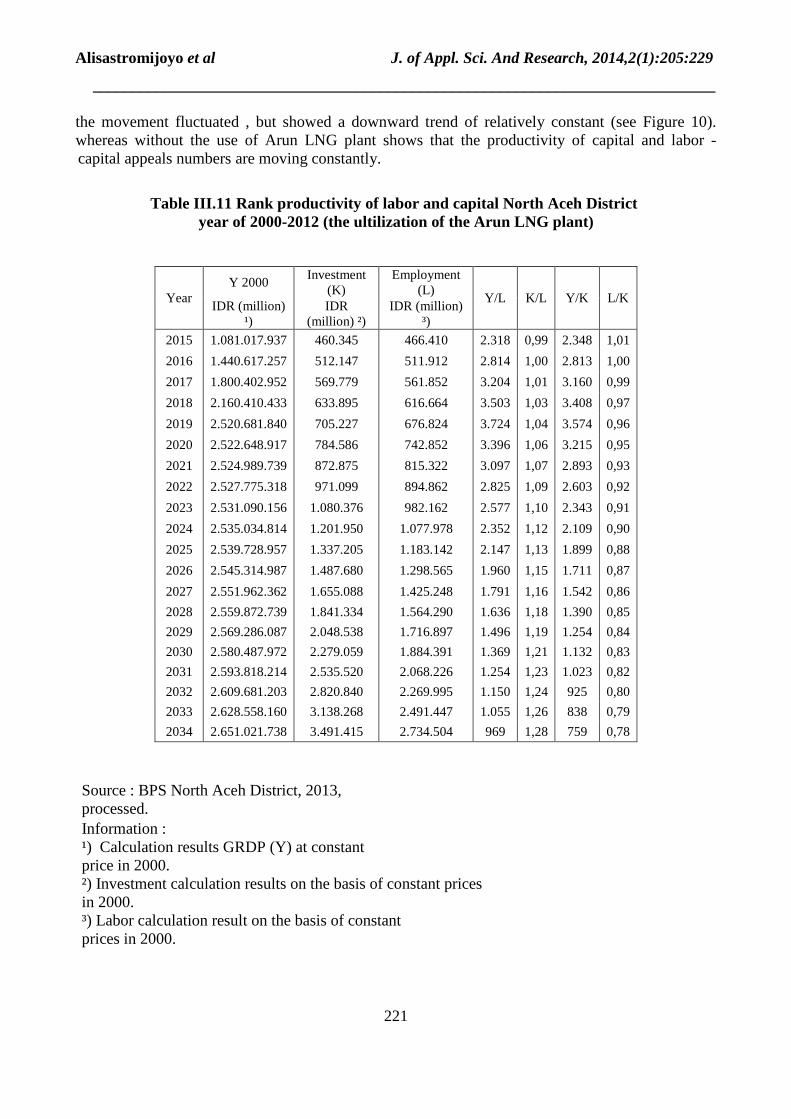
Table III.11 calculations based on economic output, capital stock and labor district of North Aceh were reviewed on the basis of constant 2000 prices (with the use of the Arun LNG plant).
Labor productivity has grown relative decline, it is because the growth of workers is higher than the growth of capital and capital productivity would otherwise rise. The level of labor productivity in the comparative capital - labor showed decreased movement ( see Figure 9 ), ie from Y/L = 2,318 in 2015 to Y/L = 969 in 2034 and Y/K = 2.348 in 2015 rose to Y/K = 759 in 2034 . at chart productivity in a number of capital-labor versus capital (with the use of the Arun LNG plant) shows
2020 12.320.117 1.967.078 1.108.213 3.296.822 462
2021 14.660.939 2.340.822 1.318.773 3.923.218 550
2022 17.446.518 2.785.579 1.569.340 4.668.630 654
2023 20.761.356 3.314.838 1.867.515 5.555.669 779
2024 24.706.014 3.944.658 2.222.342 6.611.246 927
2025 29.400.157 4.694.143 2.644.587 7.867.383 1.103
2026 34.986.187 5.586.030 3.147.059 9.362.186 1.312
2027 41.633.562 6.647.375 3.745.000 11.141.001 1.562
2028 49.543.939 7.910.377 4.456.550 13.257.792 1.858
2029 58.957.287 9.413.348 5.303.295 15.776.772 2.211
2030 70.159.172 11.201.885 6.310.921 18.774.359 2.632
2031 83.489.414 13.330.243 7.509.996 22.341.487 3.132
2032 99.352.403 15.862.989 8.936.895 26.586.369 3.727
2033 118.229.360 18.876.957 10.634.905 31.637.779 4.435
2034 140.692.938 22.463.578 12.655.537 37.648.957 5.277
Average per year 4.018.686 227.148.617 1.592
Alisastromijoyo et al J. of Appl. Sci. And Research, 2014,2(1):205:229
______________________________________________________________________________
221
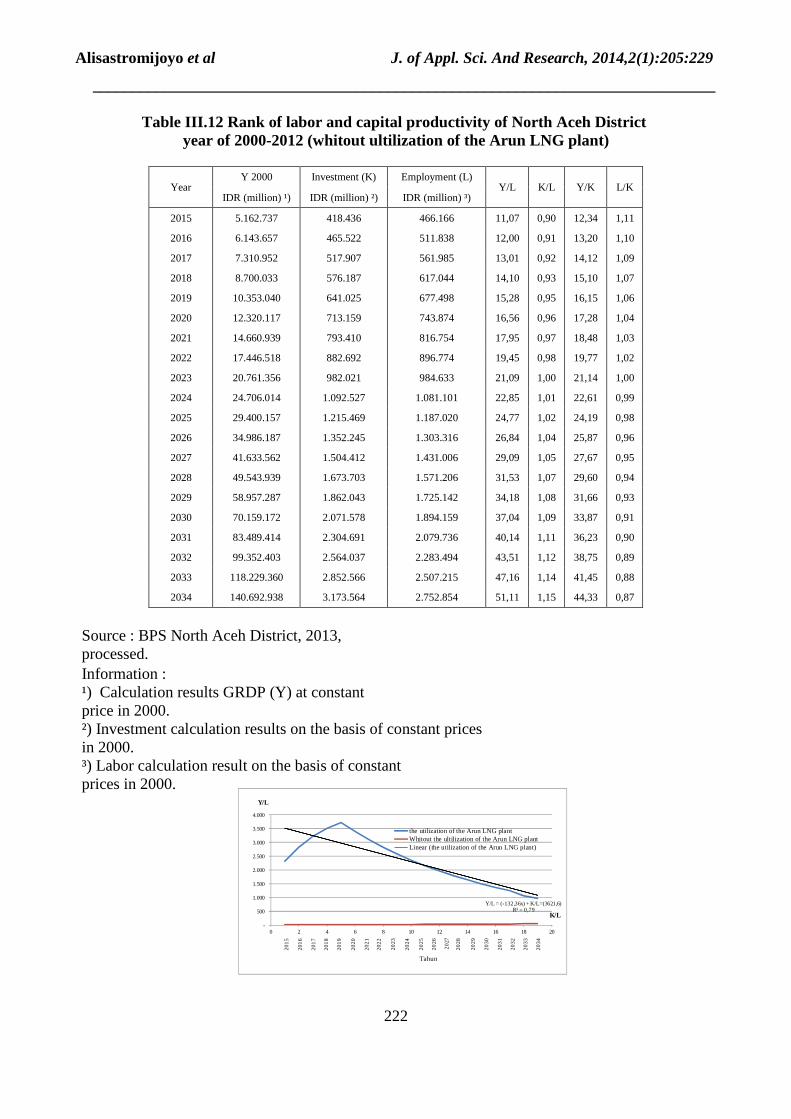
the movement fluctuated , but showed a downward trend of relatively constant (see Figure 10). whereas without the use of Arun LNG plant shows that the productivity of capital and labor - capital appeals numbers are moving constantly.
Table III.11 Rank productivity of labor and capital North Aceh District
year of 2000-2012 (the ultilization of the Arun LNG plant)
Source : BPS North Aceh District, 2013, processed. Information : ¹) Calculation results GRDP (Y) at constant price in 2000. ²) Investment calculation results on the basis of constant prices in 2000. ³) Labor calculation result on the basis of constant prices in 2000.
Year Y 2000
Investment (K)
Employment (L)
Y/L K/L Y/K L/K IDR (million)
¹) IDR
(million) ²) IDR (million)
³)
2015 1.081.017.937 460.345 466.410 2.318 0,99 2.348 1,01
2016 1.440.617.257 512.147 511.912 2.814 1,00 2.813 1,00
2017 1.800.402.952 569.779 561.852 3.204 1,01 3.160 0,99
2018 2.160.410.433 633.895 616.664 3.503 1,03 3.408 0,97
2019 2.520.681.840 705.227 676.824 3.724 1,04 3.574 0,96
2020 2.522.648.917 784.586 742.852 3.396 1,06 3.215 0,95
2021 2.524.989.739 872.875 815.322 3.097 1,07 2.893 0,93
2022 2.527.775.318 971.099 894.862 2.825 1,09 2.603 0,92
2023 2.531.090.156 1.080.376 982.162 2.577 1,10 2.343 0,91
2024 2.535.034.814 1.201.950 1.077.978 2.352 1,12 2.109 0,90
2025 2.539.728.957 1.337.205 1.183.142 2.147 1,13 1.899 0,88
2026 2.545.314.987 1.487.680 1.298.565 1.960 1,15 1.711 0,87
2027 2.551.962.362 1.655.088 1.425.248 1.791 1,16 1.542 0,86
2028 2.559.872.739 1.841.334 1.564.290 1.636 1,18 1.390 0,85
2029 2.569.286.087 2.048.538 1.716.897 1.496 1,19 1.254 0,84
2030 2.580.487.972 2.279.059 1.884.391 1.369 1,21 1.132 0,83
2031 2.593.818.214 2.535.520 2.068.226 1.254 1,23 1.023 0,82
2032 2.609.681.203 2.820.840 2.269.995 1.150 1,24 925 0,80
2033 2.628.558.160 3.138.268 2.491.447 1.055 1,26 838 0,79
2034 2.651.021.738 3.491.415 2.734.504 969 1,28 759 0,78
Alisastromijoyo et al J. of Appl. Sci. And Research, 2014,2(1):205:229
______________________________________________________________________________
222
Table III.12 Rank of labor and capital productivity of North Aceh District year of 2000-2012 (whitout ultilization of the Arun LNG plant)
Source : BPS North Aceh District, 2013, processed. Information : ¹) Calculation results GRDP (Y) at constant price in 2000. ²) Investment calculation results on the basis of constant prices in 2000. ³) Labor calculation result on the basis of constant prices in 2000.
Year Y 2000 Investment (K) Employment (L)
Y/L K/L Y/K L/K IDR (million) ¹) IDR (million) ²) IDR (million) ³)
2015 5.162.737 418.436 466.166 11,07 0,90 12,34 1,11
2016 6.143.657 465.522 511.838 12,00 0,91 13,20 1,10
2017 7.310.952 517.907 561.985 13,01 0,92 14,12 1,09
2018 8.700.033 576.187 617.044 14,10 0,93 15,10 1,07
2019 10.353.040 641.025 677.498 15,28 0,95 16,15 1,06
2020 12.320.117 713.159 743.874 16,56 0,96 17,28 1,04
2021 14.660.939 793.410 816.754 17,95 0,97 18,48 1,03
2022 17.446.518 882.692 896.774 19,45 0,98 19,77 1,02
2023 20.761.356 982.021 984.633 21,09 1,00 21,14 1,00
2024 24.706.014 1.092.527 1.081.101 22,85 1,01 22,61 0,99
2025 29.400.157 1.215.469 1.187.020 24,77 1,02 24,19 0,98
2026 34.986.187 1.352.245 1.303.316 26,84 1,04 25,87 0,96
2027 41.633.562 1.504.412 1.431.006 29,09 1,05 27,67 0,95
2028 49.543.939 1.673.703 1.571.206 31,53 1,07 29,60 0,94
2029 58.957.287 1.862.043 1.725.142 34,18 1,08 31,66 0,93
2030 70.159.172 2.071.578 1.894.159 37,04 1,09 33,87 0,91
2031 83.489.414 2.304.691 2.079.736 40,14 1,11 36,23 0,90
2032 99.352.403 2.564.037 2.283.494 43,51 1,12 38,75 0,89
2033 118.229.360 2.852.566 2.507.215 47,16 1,14 41,45 0,88
2034 140.692.938 3.173.564 2.752.854 51,11 1,15 44,33 0,87
Y/L = (-132,36x) + K/L=(3621,6)R² = 0,79
-
500
1.000
1.500
2.000
2.500
3.000
3.500
4.000
0 2 4 6 8 10 12 14 16 18 20
the utilization of the Arun LNG plantWhitout the ultilization of the Arun LNG plantLinear (the utilization of the Arun LNG plant)
K/L
Y/L
Tahun
20
15
20
16
20
17
20
18
20
19
20
20
20
21
20
22
20
23
20
24
20
25
20
26
20
27
20
28
20
29
20
30
20
32
20
33
20
31
20
34
Alisastromijoyo et al J. of Appl. Sci. And Research, 2014,2(1):205:229
______________________________________________________________________________
223
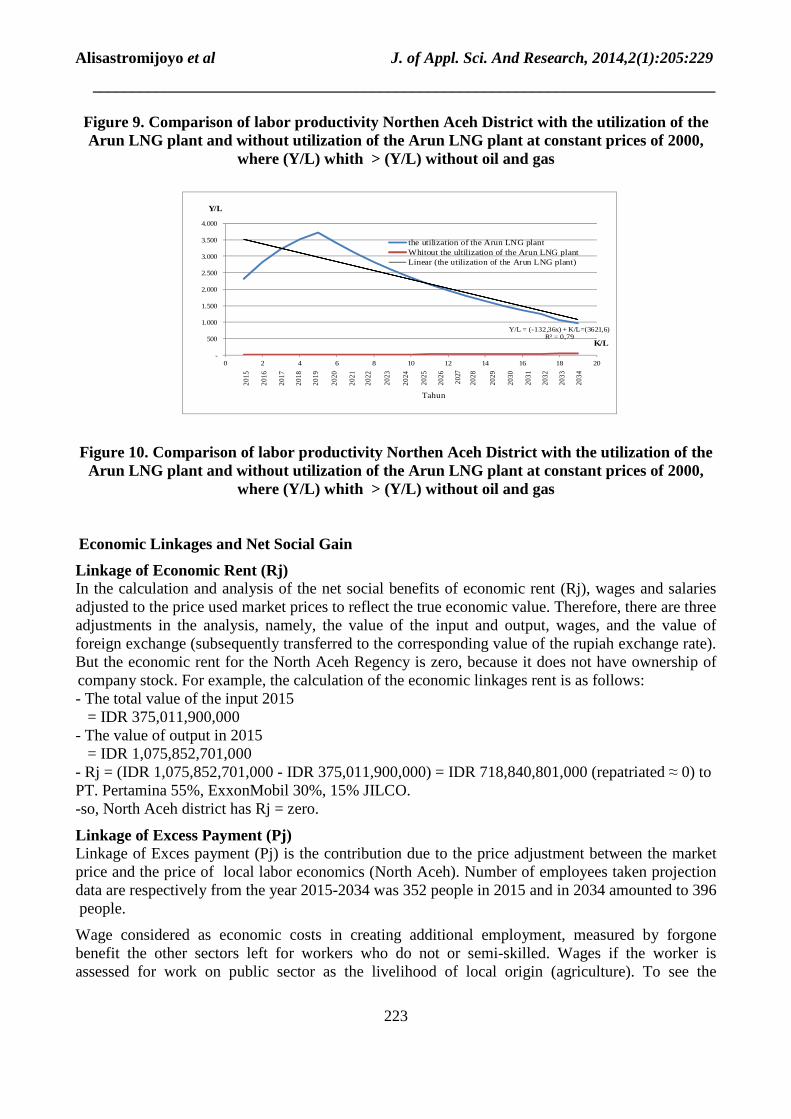
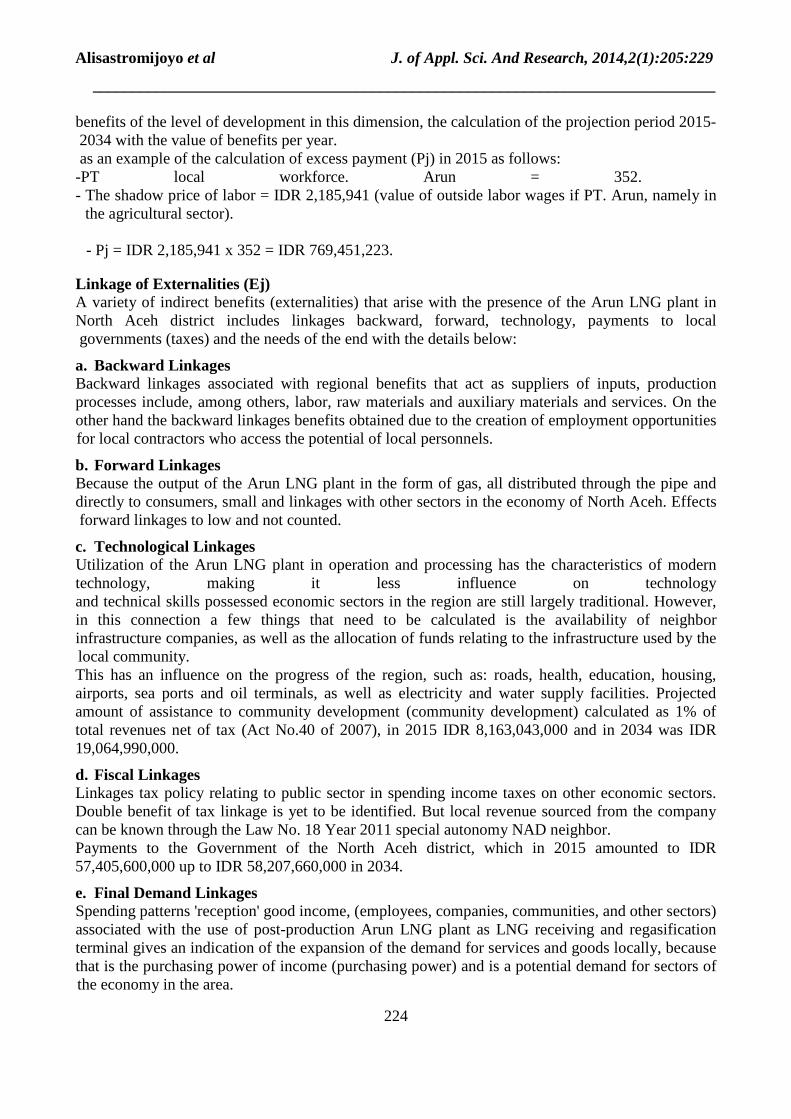
Figure 9. Comparison of labor productivity Northen Aceh District with the utilization of the Arun LNG plant and without utilization of the Arun LNG plant at constant prices of 2000,
where (Y/L) whith > (Y/L) without oil and gas
Figure 10. Comparison of labor productivity Northen Aceh District with the utilization of the Arun LNG plant and without utilization of the Arun LNG plant at constant prices of 2000,
where (Y/L) whith > (Y/L) without oil and gas
Economic Linkages and Net Social Gain
Linkage of Economic Rent (Rj) In the calculation and analysis of the net social benefits of economic rent (Rj), wages and salaries adjusted to the price used market prices to reflect the true economic value. Therefore, there are three adjustments in the analysis, namely, the value of the input and output, wages, and the value of foreign exchange (subsequently transferred to the corresponding value of the rupiah exchange rate). But the economic rent for the North Aceh Regency is zero, because it does not have ownership of company stock. For example, the calculation of the economic linkages rent is as follows: - The total value of the input 2015 = IDR 375,011,900,000 - The value of output in 2015 = IDR 1,075,852,701,000 - Rj = (IDR 1,075,852,701,000 - IDR 375,011,900,000) = IDR 718,840,801,000 (repatriated ≈ 0) to PT. Pertamina 55%, ExxonMobil 30%, 15% JILCO. -so, North Aceh district has Rj = zero.
Linkage of Excess Payment (Pj) Linkage of Exces payment (Pj) is the contribution due to the price adjustment between the market price and the price of local labor economics (North Aceh). Number of employees taken projection data are respectively from the year 2015-2034 was 352 people in 2015 and in 2034 amounted to 396 people.
Wage considered as economic costs in creating additional employment, measured by forgone benefit the other sectors left for workers who do not or semi-skilled. Wages if the worker is assessed for work on public sector as the livelihood of local origin (agriculture). To see the
Y/L = (-132,36x) + K/L=(3621,6)R² = 0,79
-
500
1.000
1.500
2.000
2.500
3.000
3.500
4.000
0 2 4 6 8 10 12 14 16 18 20
the utilization of the Arun LNG plantWhitout the ultilization of the Arun LNG plantLinear (the utilization of the Arun LNG plant)
K/L
Y/L
Tahun
201
5
201
6
201
7
201
8
201
9
202
0
202
1
202
2
2023
202
4
2025
2026
202
7
2028
2029
2030
2032
2033
2031
2034
Alisastromijoyo et al J. of Appl. Sci. And Research, 2014,2(1):205:229
______________________________________________________________________________
224
benefits of the level of development in this dimension, the calculation of the projection period 2015-2034 with the value of benefits per year. as an example of the calculation of excess payment (Pj) in 2015 as follows: -PT local workforce. Arun = 352. - The shadow price of labor = IDR 2,185,941 (value of outside labor wages if PT. Arun, namely in
the agricultural sector).
- Pj = IDR 2,185,941 x 352 = IDR 769,451,223.
Linkage of Externalities (Ej) A variety of indirect benefits (externalities) that arise with the presence of the Arun LNG plant in North Aceh district includes linkages backward, forward, technology, payments to local governments (taxes) and the needs of the end with the details below:
a. Backward Linkages Backward linkages associated with regional benefits that act as suppliers of inputs, production processes include, among others, labor, raw materials and auxiliary materials and services. On the other hand the backward linkages benefits obtained due to the creation of employment opportunities for local contractors who access the potential of local personnels.
b. Forward Linkages Because the output of the Arun LNG plant in the form of gas, all distributed through the pipe and directly to consumers, small and linkages with other sectors in the economy of North Aceh. Effects forward linkages to low and not counted.
c. Technological Linkages Utilization of the Arun LNG plant in operation and processing has the characteristics of modern technology, making it less influence on technology and technical skills possessed economic sectors in the region are still largely traditional. However, in this connection a few things that need to be calculated is the availability of neighbor infrastructure companies, as well as the allocation of funds relating to the infrastructure used by the local community. This has an influence on the progress of the region, such as: roads, health, education, housing, airports, sea ports and oil terminals, as well as electricity and water supply facilities. Projected amount of assistance to community development (community development) calculated as 1% of total revenues net of tax (Act No.40 of 2007), in 2015 IDR 8,163,043,000 and in 2034 was IDR 19,064,990,000.
d. Fiscal Linkages Linkages tax policy relating to public sector in spending income taxes on other economic sectors. Double benefit of tax linkage is yet to be identified. But local revenue sourced from the company can be known through the Law No. 18 Year 2011 special autonomy NAD neighbor. Payments to the Government of the North Aceh district, which in 2015 amounted to IDR 57,405,600,000 up to IDR 58,207,660,000 in 2034.
e. Final Demand Linkages Spending patterns 'reception' good income, (employees, companies, communities, and other sectors) associated with the use of post-production Arun LNG plant as LNG receiving and regasification terminal gives an indication of the expansion of the demand for services and goods locally, because that is the purchasing power of income (purchasing power) and is a potential demand for sectors of the economy in the area.
Alisastromijoyo et al J. of Appl. Sci. And Research, 2014,2(1):205:229
______________________________________________________________________________
225
So as to encourage increased productivity in other sectors due to the double effect of regional. 2015-2024 Projected year end number needs PT. Arun and his family reached IDR 60,511,500,000 the number of employees increased to 3,621 people. IDR 66,841,110,000 and employs 3,851 people in the year 2025 to 2034.
Net Social Benefit Utilization of Post Production Arun LNG Refinery
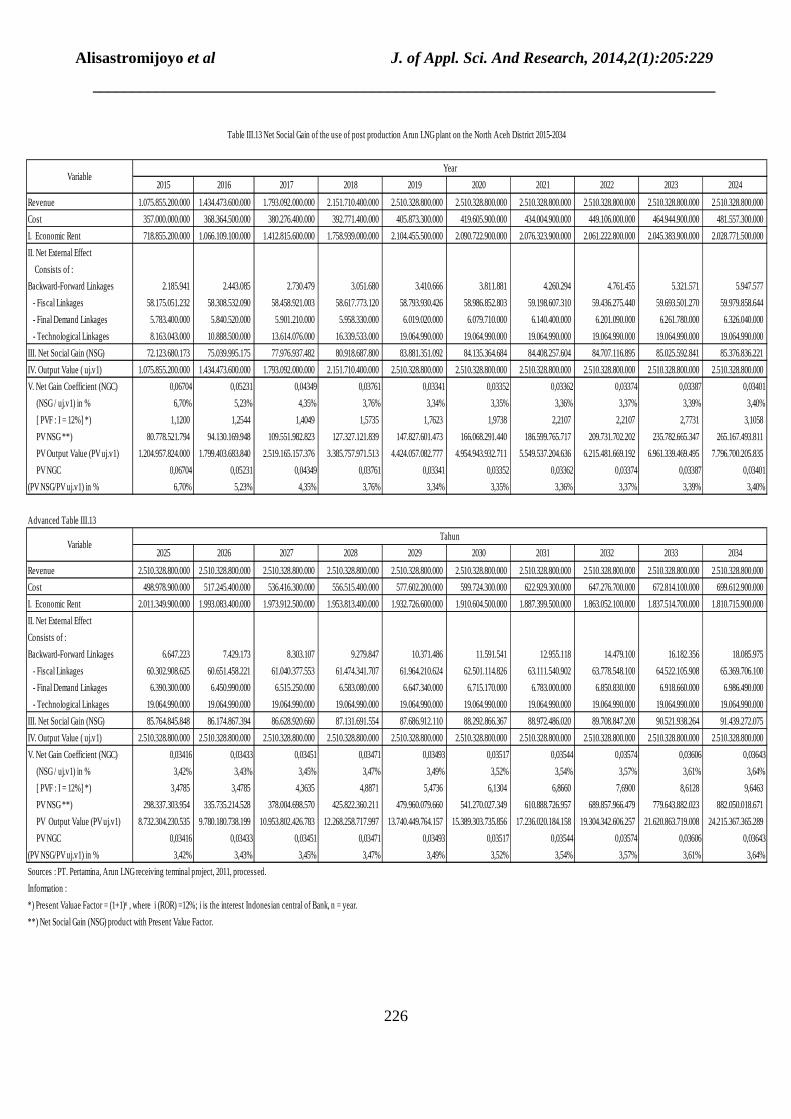
Based on the model used in this study, that the NSG consists of economic rent (Rj), the excess payment (Pj) and externality (Ej). (Bulmer – Thomas, 1982; Pearson and Cownie, 1974; U.W. Soelistijo, 2009, 2012, 2013). So it is known, that the existence of an LNG refinery utilization Arun Post Production in North Aceh Regency net social benefits over the current price. In 2015 of IDR 72,123,680,173 the coefficient of net benefits (NGC) has increased by 6.70% in 2034 of IDR 91,439,272,075 or NGC = 3.64%, which decreased NGC caused by the output value is greater than the value of the NSG and the year to 5-20 has a constant output value, while the value of the NSG have continued to rise up to 20 years (see Table III.13).
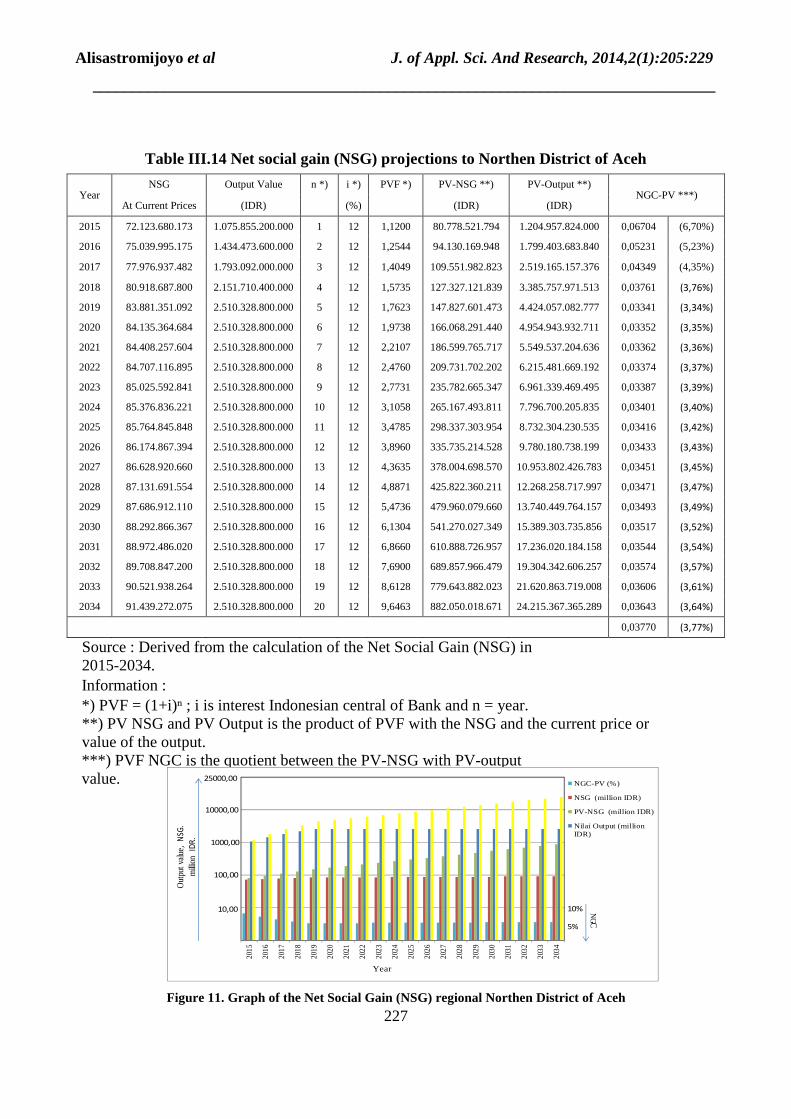
Changes in Net Social Benefit (NSG) Changes in the utilization of net social benefits Post Production Arun LNG plant based on present value (PVF with the 2014 Bank Indonesia interest (i = 12%) note that in 2015 US$ 80,778,521,794 the coefficient of net benefits (NGC = 0.06704 or ≈ 6.70%). In 2034 increased by IDR 882,050,018,671 with a net gain coefficient (3.64%). More results on equalization NSG can be seen in Table III.14. The NSG coefficient means that if the firm's output increases, for example IDR 1.000.000,- the impact on the increase in value of the NSG in a given year is equivalent to the result of multiplying the number of coefficients, for example, in 2015 amounted to 6.70% means that the impact on the increase in value of NSG of IDR 67.000.
Alisastromijoyo et al J. of Appl. Sci. And Research, 2014,2(1):205:229
______________________________________________________________________________
226
2015 2016 2017 2018 2019 2020 2021 2022 2023 2024
Revenue 1.075.855.200.000 1.434.473.600.000 1.793.092.000.000 2.151.710.400.000 2.510.328.800.000 2.510.328.800.000 2.510.328.800.000 2.510.328.800.000 2.510.328.800.000 2.510.328.800.000
Cost 357.000.000.000 368.364.500.000 380.276.400.000 392.771.400.000 405.873.300.000 419.605.900.000 434.004.900.000 449.106.000.000 464.944.900.000 481.557.300.000
I. Economic Rent 718.855.200.000 1.066.109.100.000 1.412.815.600.000 1.758.939.000.000 2.104.455.500.000 2.090.722.900.000 2.076.323.900.000 2.061.222.800.000 2.045.383.900.000 2.028.771.500.000
II. Net External Effect
Consists of :
Backward-Forward Linkages 2.185.941 2.443.085 2.730.479 3.051.680 3.410.666 3.811.881 4.260.294 4.761.455 5.321.571 5.947.577
- Fiscal Linkages 58.175.051.232 58.308.532.090 58.458.921.003 58.617.773.120 58.793.930.426 58.986.852.803 59.198.607.310 59.436.275.440 59.693.501.270 59.979.858.644
- Final Demand Linkages 5.783.400.000 5.840.520.000 5.901.210.000 5.958.330.000 6.019.020.000 6.079.710.000 6.140.400.000 6.201.090.000 6.261.780.000 6.326.040.000
- Technological Linkages 8.163.043.000 10.888.500.000 13.614.076.000 16.339.533.000 19.064.990.000 19.064.990.000 19.064.990.000 19.064.990.000 19.064.990.000 19.064.990.000
III. Net Social Gain (NSG) 72.123.680.173 75.039.995.175 77.976.937.482 80.918.687.800 83.881.351.092 84.135.364.684 84.408.257.604 84.707.116.895 85.025.592.841 85.376.836.221
IV. Output Value ( uj.v1) 1.075.855.200.000 1.434.473.600.000 1.793.092.000.000 2.151.710.400.000 2.510.328.800.000 2.510.328.800.000 2.510.328.800.000 2.510.328.800.000 2.510.328.800.000 2.510.328.800.000
V. Net Gain Coefficient (NGC) 0,06704 0,05231 0,04349 0,03761 0,03341 0,03352 0,03362 0,03374 0,03387 0,03401
(NSG / uj.v1) in % 6,70% 5,23% 4,35% 3,76% 3,34% 3,35% 3,36% 3,37% 3,39% 3,40%
[ PVF : I = 12%] *) 1,1200 1,2544 1,4049 1,5735 1,7623 1,9738 2,2107 2,2107 2,7731 3,1058
PV NSG **) 80.778.521.794 94.130.169.948 109.551.982.823 127.327.121.839 147.827.601.473 166.068.291.440 186.599.765.717 209.731.702.202 235.782.665.347 265.167.493.811
PV Output Value (PV uj.v1) 1.204.957.824.000 1.799.403.683.840 2.519.165.157.376 3.385.757.971.513 4.424.057.082.777 4.954.943.932.711 5.549.537.204.636 6.215.481.669.192 6.961.339.469.495 7.796.700.205.835
PV NGC 0,06704 0,05231 0,04349 0,03761 0,03341 0,03352 0,03362 0,03374 0,03387 0,03401
(PV NSG/PV uj.v1) in % 6,70% 5,23% 4,35% 3,76% 3,34% 3,35% 3,36% 3,37% 3,39% 3,40%
Advanced Table III.13
2025 2026 2027 2028 2029 2030 2031 2032 2033 2034
Revenue 2.510.328.800.000 2.510.328.800.000 2.510.328.800.000 2.510.328.800.000 2.510.328.800.000 2.510.328.800.000 2.510.328.800.000 2.510.328.800.000 2.510.328.800.000 2.510.328.800.000
Cost 498.978.900.000 517.245.400.000 536.416.300.000 556.515.400.000 577.602.200.000 599.724.300.000 622.929.300.000 647.276.700.000 672.814.100.000 699.612.900.000
I. Economic Rent 2.011.349.900.000 1.993.083.400.000 1.973.912.500.000 1.953.813.400.000 1.932.726.600.000 1.910.604.500.000 1.887.399.500.000 1.863.052.100.000 1.837.514.700.000 1.810.715.900.000
II. Net External Effect
Consists of :
Backward-Forward Linkages 6.647.223 7.429.173 8.303.107 9.279.847 10.371.486 11.591.541 12.955.118 14.479.100 16.182.356 18.085.975
- Fiscal Linkages 60.302.908.625 60.651.458.221 61.040.377.553 61.474.341.707 61.964.210.624 62.501.114.826 63.111.540.902 63.778.548.100 64.522.105.908 65.369.706.100
- Final Demand Linkages 6.390.300.000 6.450.990.000 6.515.250.000 6.583.080.000 6.647.340.000 6.715.170.000 6.783.000.000 6.850.830.000 6.918.660.000 6.986.490.000
- Technological Linkages 19.064.990.000 19.064.990.000 19.064.990.000 19.064.990.000 19.064.990.000 19.064.990.000 19.064.990.000 19.064.990.000 19.064.990.000 19.064.990.000
III. Net Social Gain (NSG) 85.764.845.848 86.174.867.394 86.628.920.660 87.131.691.554 87.686.912.110 88.292.866.367 88.972.486.020 89.708.847.200 90.521.938.264 91.439.272.075
IV. Output Value ( uj.v1) 2.510.328.800.000 2.510.328.800.000 2.510.328.800.000 2.510.328.800.000 2.510.328.800.000 2.510.328.800.000 2.510.328.800.000 2.510.328.800.000 2.510.328.800.000 2.510.328.800.000
V. Net Gain Coefficient (NGC) 0,03416 0,03433 0,03451 0,03471 0,03493 0,03517 0,03544 0,03574 0,03606 0,03643
(NSG / uj.v1) in % 3,42% 3,43% 3,45% 3,47% 3,49% 3,52% 3,54% 3,57% 3,61% 3,64%
[ PVF : I = 12%] *) 3,4785 3,4785 4,3635 4,8871 5,4736 6,1304 6,8660 7,6900 8,6128 9,6463
PV NSG **) 298.337.303.954 335.735.214.528 378.004.698.570 425.822.360.211 479.960.079.660 541.270.027.349 610.888.726.957 689.857.966.479 779.643.882.023 882.050.018.671
PV Output Value (PV uj.v1) 8.732.304.230.535 9.780.180.738.199 10.953.802.426.783 12.268.258.717.997 13.740.449.764.157 15.389.303.735.856 17.236.020.184.158 19.304.342.606.257 21.620.863.719.008 24.215.367.365.289
PV NGC 0,03416 0,03433 0,03451 0,03471 0,03493 0,03517 0,03544 0,03574 0,03606 0,03643
(PV NSG/PV uj.v1) in % 3,42% 3,43% 3,45% 3,47% 3,49% 3,52% 3,54% 3,57% 3,61% 3,64%
Sources : PT. Pertamina, Arun LNG receiving terminal project, 2011, processed.
Information :
*) Present Valuae Factor = (1+1)ⁿ , where i (ROR) =12%; i is the interest Indonesian central of Bank, n = year.
**) Net Social Gain (NSG) product with Present Value Factor.
Variable
Variable
Year
Tahun
Table III.13 Net Social Gain of the use of post production Arun LNG plant on the North Aceh District 2015-2034
Alisastromijoyo et al J. of Appl. Sci. And Research, 2014,2(1):205:229
______________________________________________________________________________
227
Table III.14 Net social gain (NSG) projections to Northen District of Aceh
Source : Derived from the calculation of the Net Social Gain (NSG) in 2015-2034. Information : *) PVF = (1+i)n ; i is interest Indonesian central of Bank and n = year. **) PV NSG and PV Output is the product of PVF with the NSG and the current price or value of the output. ***) PVF NGC is the quotient between the PV-NSG with PV-output value.
Figure 11. Graph of the Net Social Gain (NSG) regional Northen District of Aceh
Year NSG Output Value n *) i *) PVF *) PV-NSG **) PV-Output **)
NGC-PV ***) At Current Prices (IDR)
(%)
(IDR) (IDR)
2015 72.123.680.173 1.075.855.200.000 1 12 1,1200 80.778.521.794 1.204.957.824.000 0,06704 (6,70%)
2016 75.039.995.175 1.434.473.600.000 2 12 1,2544 94.130.169.948 1.799.403.683.840 0,05231 (5,23%)
2017 77.976.937.482 1.793.092.000.000 3 12 1,4049 109.551.982.823 2.519.165.157.376 0,04349 (4,35%)
2018 80.918.687.800 2.151.710.400.000 4 12 1,5735 127.327.121.839 3.385.757.971.513 0,03761 (3,76%)
2019 83.881.351.092 2.510.328.800.000 5 12 1,7623 147.827.601.473 4.424.057.082.777 0,03341 (3,34%)
2020 84.135.364.684 2.510.328.800.000 6 12 1,9738 166.068.291.440 4.954.943.932.711 0,03352 (3,35%)
2021 84.408.257.604 2.510.328.800.000 7 12 2,2107 186.599.765.717 5.549.537.204.636 0,03362 (3,36%)
2022 84.707.116.895 2.510.328.800.000 8 12 2,4760 209.731.702.202 6.215.481.669.192 0,03374 (3,37%)
2023 85.025.592.841 2.510.328.800.000 9 12 2,7731 235.782.665.347 6.961.339.469.495 0,03387 (3,39%)
2024 85.376.836.221 2.510.328.800.000 10 12 3,1058 265.167.493.811 7.796.700.205.835 0,03401 (3,40%)
2025 85.764.845.848 2.510.328.800.000 11 12 3,4785 298.337.303.954 8.732.304.230.535 0,03416 (3,42%)
2026 86.174.867.394 2.510.328.800.000 12 12 3,8960 335.735.214.528 9.780.180.738.199 0,03433 (3,43%)
2027 86.628.920.660 2.510.328.800.000 13 12 4,3635 378.004.698.570 10.953.802.426.783 0,03451 (3,45%)
2028 87.131.691.554 2.510.328.800.000 14 12 4,8871 425.822.360.211 12.268.258.717.997 0,03471 (3,47%)
2029 87.686.912.110 2.510.328.800.000 15 12 5,4736 479.960.079.660 13.740.449.764.157 0,03493 (3,49%)
2030 88.292.866.367 2.510.328.800.000 16 12 6,1304 541.270.027.349 15.389.303.735.856 0,03517 (3,52%)
2031 88.972.486.020 2.510.328.800.000 17 12 6,8660 610.888.726.957 17.236.020.184.158 0,03544 (3,54%)
2032 89.708.847.200 2.510.328.800.000 18 12 7,6900 689.857.966.479 19.304.342.606.257 0,03574 (3,57%)
2033 90.521.938.264 2.510.328.800.000 19 12 8,6128 779.643.882.023 21.620.863.719.008 0,03606 (3,61%)
2034 91.439.272.075 2.510.328.800.000 20 12 9,6463 882.050.018.671 24.215.367.365.289 0,03643 (3,64%)
0,03770 (3,77%)
2015
2016
2017
2018
2019
2020
2021
2022
2023
2024
2025
2026
2027
2028
2029
2030
2031
2032
2033
2034
NGC-PV (%)
NSG (million IDR)
PV-NSG (million IDR)
Nilai Output (millionIDR)
10,00
100,00
1000,00
10000,00
25000,00
10%
millio
nID
R.
5%
Year
NGC
Out
put v
alue,
NSG
.
Alisastromijoyo et al J. of Appl. Sci. And Research, 2014,2(1):205:229
______________________________________________________________________________
228
CONCLUSION
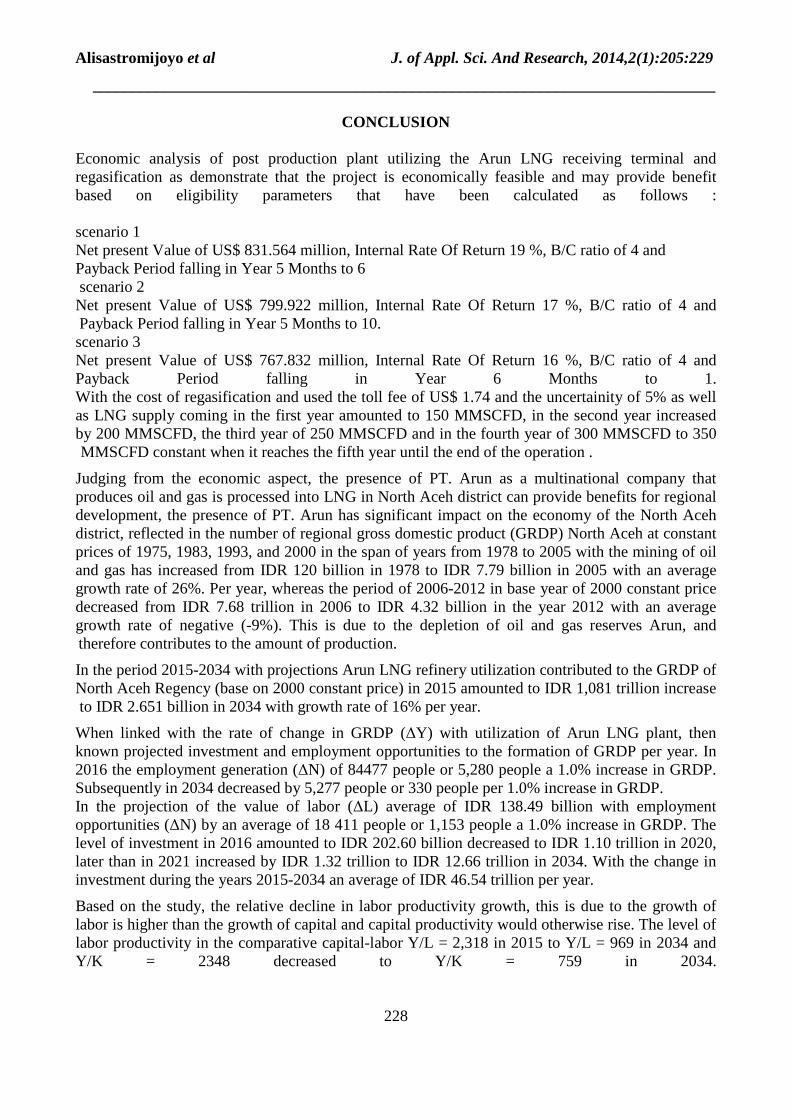
Economic analysis of post production plant utilizing the Arun LNG receiving terminal and regasification as demonstrate that the project is economically feasible and may provide benefit based on eligibility parameters that have been calculated as follows :
scenario 1 Net present Value of US$ 831.564 million, Internal Rate Of Return 19 %, B/C ratio of 4 and Payback Period falling in Year 5 Months to 6 scenario 2 Net present Value of US$ 799.922 million, Internal Rate Of Return 17 %, B/C ratio of 4 and Payback Period falling in Year 5 Months to 10. scenario 3 Net present Value of US$ 767.832 million, Internal Rate Of Return 16 %, B/C ratio of 4 and Payback Period falling in Year 6 Months to 1. With the cost of regasification and used the toll fee of US$ 1.74 and the uncertainity of 5% as well as LNG supply coming in the first year amounted to 150 MMSCFD, in the second year increased by 200 MMSCFD, the third year of 250 MMSCFD and in the fourth year of 300 MMSCFD to 350 MMSCFD constant when it reaches the fifth year until the end of the operation .
Judging from the economic aspect, the presence of PT. Arun as a multinational company that produces oil and gas is processed into LNG in North Aceh district can provide benefits for regional development, the presence of PT. Arun has significant impact on the economy of the North Aceh district, reflected in the number of regional gross domestic product (GRDP) North Aceh at constant prices of 1975, 1983, 1993, and 2000 in the span of years from 1978 to 2005 with the mining of oil and gas has increased from IDR 120 billion in 1978 to IDR 7.79 billion in 2005 with an average growth rate of 26%. Per year, whereas the period of 2006-2012 in base year of 2000 constant price decreased from IDR 7.68 trillion in 2006 to IDR 4.32 billion in the year 2012 with an average growth rate of negative (-9%). This is due to the depletion of oil and gas reserves Arun, and therefore contributes to the amount of production.
In the period 2015-2034 with projections Arun LNG refinery utilization contributed to the GRDP of North Aceh Regency (base on 2000 constant price) in 2015 amounted to IDR 1,081 trillion increase to IDR 2.651 billion in 2034 with growth rate of 16% per year.
When linked with the rate of change in GRDP (∆Y) with utilization of Arun LNG plant, then known projected investment and employment opportunities to the formation of GRDP per year. In 2016 the employment generation (∆N) of 84477 people or 5,280 people a 1.0% increase in GRDP. Subsequently in 2034 decreased by 5,277 people or 330 people per 1.0% increase in GRDP. In the projection of the value of labor (∆L) average of IDR 138.49 billion with employment opportunities (∆N) by an average of 18 411 people or 1,153 people a 1.0% increase in GRDP. The level of investment in 2016 amounted to IDR 202.60 billion decreased to IDR 1.10 trillion in 2020, later than in 2021 increased by IDR 1.32 trillion to IDR 12.66 trillion in 2034. With the change in investment during the years 2015-2034 an average of IDR 46.54 trillion per year.
Based on the study, the relative decline in labor productivity growth, this is due to the growth of labor is higher than the growth of capital and capital productivity would otherwise rise. The level of labor productivity in the comparative capital-labor Y/L = 2,318 in 2015 to Y/L = 969 in 2034 and Y/K = 2348 decreased to Y/K = 759 in 2034.
Alisastromijoyo et al J. of Appl. Sci. And Research, 2014,2(1):205:229
______________________________________________________________________________
229
NSG approach at current prices, demonstrate the benefits of North Aceh district during the period 2015-2034 reached IDR 72.12 billion with a net gain coefficient (NGC) of 6.70% in 2015 to increase the nominal value in 2034 of IDR NGC = 91.44 billion, or 3.64%, NGC caused by declining output value is greater than the value of the NSG and the year to 5 s/d 20 has a constant output value, while the value of the NSG have continued to rise up to 20 years. The average value of the net gain coefficient (NGC) the period of 3.77% per year.
REFERENCES
[1] Act No.18 of 2001 on Special Autonomy of Aceh. [2] Act No.40 of 2007 on Limited Company. [3] A. Amrullah. Study on Role of PT. Inco (PT) in Supporting Economic Development Luwu East -South Sulawesi Regional Autonomy: Inter-Industry Approach, Thesis, ITB, 2007. [4] Arun LNG. (N.d). PT. Arun Natural Gas Liquefaction Company, Lhokseumawe, North Aceh, 2011. [5] Bulmer - Thomas. V, Input-Output Analysis in Developing Countries, 1982. [6] BPS NAD. Input-Output Table Povinsi Nanggroe Aceh Darussalam, Tahun 2006, 2006. [7] BPS North Aceh District, Gross Domestic Income, Year 1975-2012 by Industry. [8] BPS North Aceh District, North Aceh in Figures, Year 2006-2013. [9] BPS North Aceh District, Gross Domestic Income, Appropriated By Year 2008-2011. [10] BPS North Aceh District, for Economic Analysis (Model Table IO) North Aceh district in 2011. [11] Pertamina. Arun LNG Receiving Terminal Project, Jakarta : PT. Pertamina ( Persero ), 2011. [12] S.R. Pearson and J. Cownie, Commodity exports and African economic development. Lexington Books, 285 pages, 1974. [13] T.R. Harsya. Economical Analysis of Arun LNG Plant Utilization In Gas Receiving Terminal in Aceh Province, Thesis, School of Chemical Engineering, UI, 2013. [14] U.W. Soelistijo. Special Topics of Special Fields in Mineral Economics, Lecture Materials, Post Graduate Master Program, Mining Engineering, Mineral Economics Special Affairs, FTTM, ITB, 2009. [15] U.W. Soelistijo. Sustainable Regional Development, Instructional Materials , Master and Doctoral Studies Program Mining Engineering, FTTM, ITB, 2012. [16] U.W. Soelistijo. “The Value Added of Economic Indicators in Indonesia: Energy and Mineral Resource Sector”, Journal of Mineral and Coal Technology, Volume 9, Number 1, January 2013 : pages 35-49, 2013. [17] W.H. Miernyk. The Elements of Input - Output Analysis, Random House Inc. of Canada Limited, 1965.