Embed Size (px)
Citation preview

2006 TEXAQS/GoMACCSScience and Implementation Plan
Combining Climate Change and Air Quality ResearchMarch 2005
-108 -106 -104 -102 -100 -98 -96 -94 -92
Longitude
26
28
30
32
34
36
Lati
tud
e
Boundary-layer profilers
Serial rawinsondes
Full tropospheric profilers
Boundary-layer profilers
NWS Rawinsondes
NEXRAD
Existing Upper-air Network
TexAQS-II Enhancements

Table of Contents
Introduction 3The Aim of the 2006 Study 3
Importance of Ozone and Aerosols in Air Quality and Climate Change 4
Combining Climate Change and Air Quality Intensive Field Campaigns 5
Emissions Verification 8
Transport and Mixing 16
Chemical Transformation 24
Aerosol Properties and Radiative Effects 29
Forecast Models 42
Mobile Platform Descriptions 47NOAA WP-3D Lockheed Orion 47
Remote Sensing Aircraft 53
NOAA R/V Ronald H. Brown 55
Other Measurements 61Ground-Based Measurements 61Satellite Observations 63
References 67

Introduction
Meeting Society’s Needs: The Aim of the 2006 StudyThe challenge of properly managing our atmospheric resources is complex. Improvedunderstanding to inform policy development and implementation is needed in severalareas. NOAA has established the Climate and Air Quality programs to address theseissues. These comprehensive programs have as one of their foci an improvedunderstanding of the workings of the chemical processes in the atmosphere. Majorcomponents in both the Climate and Air Quality programs include laboratory studies,field measurements, and modeling studies. The field studies include long termmonitoring, short term limited deployments and intensive field campaigns using multipleplatforms and a large array of instruments.
As a part of this overall program in 2006, NOAA will help lead a major multi-institutional intensive field program that will focus on investigating important scientificquestions that are common to both climate and air quality. The NOAA components ofthe program are the Texas Air Quality Study (TEXAQS) and the Gulf of MexicoAtmospheric Composition and Climate Study (GoMACCS). This intensive field studywill focus on providing a better understanding of the sources and atmospheric processesresponsible for the formation and distribution of ozone and aerosols in the atmosphereand the influence that these species have on the radiative forcing of climate regionallyand globally, as well as, their impact on human health and regional haze. The study areawill be Texas and the northwestern Gulf of Mexico.
The NOAA Climate Change Focus in 2006 – GoMACCS, the NOAA climate changecomponent of this field program, will characterize marine/continental chemical andmeteorological processes over Texas and the Gulf of Mexico in order to improve thesimulation of the radiative forcing of climate change by lower-atmosphere ozone andaerosols. In addition to clear-sky radiative effects, GoMACCS will investigate theinfluence of aerosols on cloud properties and the role of clouds in chemicaltransformation.
The NOAA Air Quality Focus in 2006 –TexAQS 2006,the NOAA air quality component of this fieldexperiment, will investigate the sources and processesthat are responsible for photochemical pollution andregional haze during the summertime in Texas.Figure 1 indicates the counties in Texas that areexperiencing air quality problems associated with thisozone. In addition, there is growing concern thatadditional counties in the state may be facing similarissues in the near future. The 2006 study will provideinformation on the sources of the ozone and aerosolsprecursors and processes responsible for the formationand distribution of ozone and aerosols in the state. Severe Serious Moderate Near
Fig. 1: Counties in Texas withair quality problems.
The focus of the study will be the transport of ozone and ozone precursors within thestate and the impact of the long-range transport of ozone or its precursors into (and outof?) the state. In this regard, special attention will be paid to nighttime chemistry andtransport. The study will also investigate how the various urban, industrial and naturalsources of aerosols and aerosol precursors within the state and the transport of aerosolsfrom outside the state contribute to the regional haze that is observed in the state.
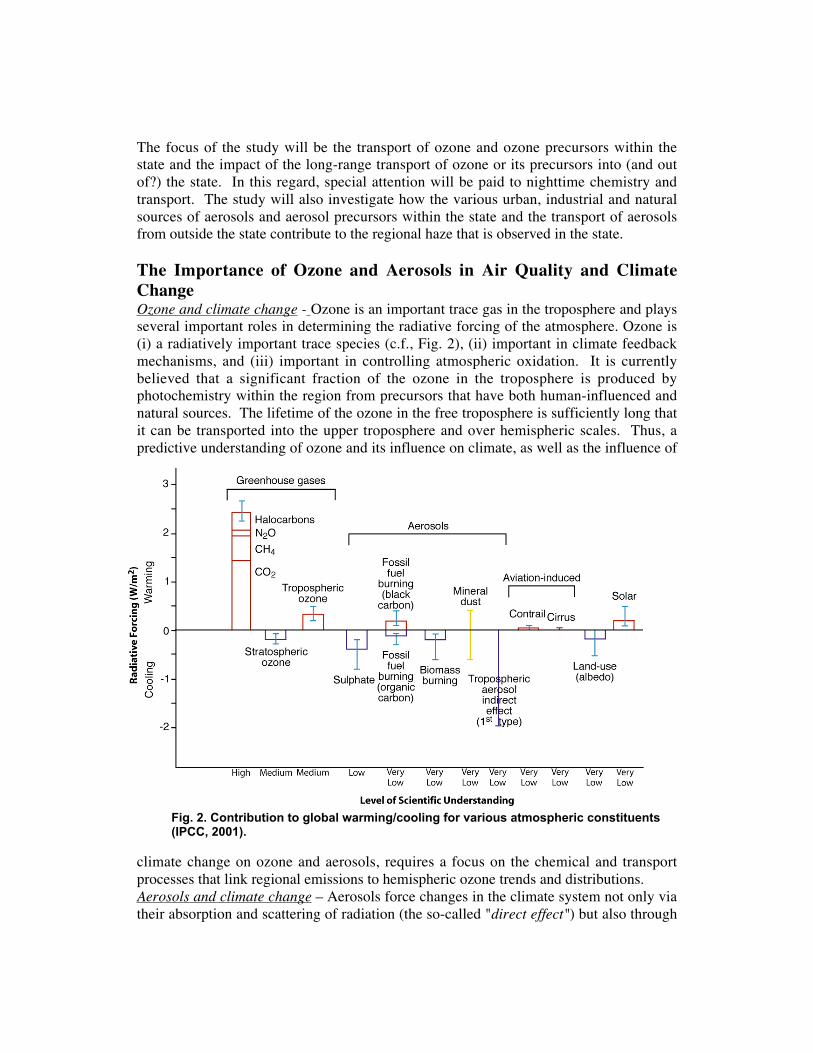
The Importance of Ozone and Aerosols in Air Quality and ClimateChangeOzone and climate change - Ozone is an important trace gas in the troposphere and playsseveral important roles in determining the radiative forcing of the atmosphere. Ozone is(i) a radiatively important trace species (c.f., Fig. 2), (ii) important in climate feedbackmechanisms, and (iii) important in controlling atmospheric oxidation. It is currentlybelieved that a significant fraction of the ozone in the troposphere is produced byphotochemistry within the region from precursors that have both human-influenced andnatural sources. The lifetime of the ozone in the free troposphere is sufficiently long thatit can be transported into the upper troposphere and over hemispheric scales. Thus, apredictive understanding of ozone and its influence on climate, as well as the influence of
climate change on ozone and aerosols, requires a focus on the chemical and transportprocesses that link regional emissions to hemispheric ozone trends and distributions.Aerosols and climate change – Aerosols force changes in the climate system not only viatheir absorption and scattering of radiation (the so-called "direct effect") but also through
Fig. 2. Contribution to global warming/cooling for various atmospheric constituents(IPCC, 2001).

indirect effects by changing cloud properties (c.f., Fig. 2). Namely, increasing thenumber of cloud-forming aerosols in the atmosphere, at a given amount of condensablewater, tends to yield larger number of smaller droplets and brighter clouds (the so-called"Twomey effect"). Brighter clouds reflect more radiation back to space and hence tend tocool the climate system. Aerosols can also alter the precipitating capability and, hence,the longevity (and brightness) of clouds and atmospheric convection. The indirect effectsof aerosols are currently deemed to be the most uncertain of all the forcings (See Figure2). Research is needed to reduce the aerosol-cloud-climate uncertainty and determine thesources and evolution of aerosols in the atmosphere.
Ozone and air quality – Ozone plays a central role in determining air quality. From thestandpoint of health effects, ozone is the principal pollutant associated withphotochemical smog. Elevated and potentially harmful levels of ozone are observed inmany areas of the United States during the summer. Although the highest levels of ozoneare recorded in urban areas, and these are sufficient to be a human health hazard, ozone inrural areas can also do significant damage to sensitive vegetation. Of all the pollutantsthat are addressed in the Clean Air Act, ozone has proven to be the most difficult tocontrol.
Aerosols and air quality – Studies have indicated thattens of thousands of people die each year in theUnited States as a direct result of exposure to highlevels of aerosols, with many more suffering adversehealth impacts that result in lost work and hospitalvisits. The aerosols found in polluted air can causeregional haze that obscures scenic vistas and present ahazard to aircraft(c.f. Fig. 3). As air pollutants fallback to earth they can acidify our lakes and streamsand foul our coastal waters with serious consequencesfor these sensitive ecosystems (Lovett, and Lindberg,1996; Fenn et al, 2003).
The NOAA Approach: Combining Climate Change and Air Quality
Intensive Field CampaignsUntil recently NOAA’s research-intensive field campaigns in the Climate Forcing
component of the Climate Program and the regional air quality component of the
Weather and Water program have been conducted as separate, albeit related, activities.
One focus of this research has been a better understanding of global-scale transport and
transformation processes, which is linked to other national and international efforts
through the International Global Atmospheric Chemistry Program (IGAC). NOAA
organized major field campaigns to study pollutant transport from North America to the
North Atlantic under the North Atlantic Regional Experiment (NARE) in 1993, 1996 and
1997. NOAA also co-organized major field campaigns to study regional distributions of
aerosol properties and their radiative effects as part of the IGAC Aerosol Characterization
Experiments (ACE) in 1995, 1997, and 2001. More recently, the transport of Asian
Fig. 3. A polluted haze coversdowntown Houston.

pollution to the U. S. west coast was studied in 2002 under the Intercontinental Transport
and Chemical Transformation (ITCT) program.
NOAA’s Health of the Atmosphere (HoA) research is focused on the atmospheric science
that underlies regional and continental air quality, with the goal of enhancing our ability
to predict and monitor future changes, leading to improved scientific input to decision-
making. The HoA program is a collaborative effort involving several NOAA laboratories
and university scientists. Under this program NOAA joined with other federal agencies,
university research groups, and interested parties from the private sector to study factors
controlling the formation and distribution of ozone and aerosols in a number of settings
including: Nashville, TN (1994, 1995, 1999), Atlanta, GA (1999), Houston TX (2000)
and New England (2002, 2004).
The Texas study in 2000 is particularly germane to the 2006 Study. Scientificunderstanding gained from Texas 2000 Air Quality Study was of keen interest to decisionmakers since the region experiences some of the most severe episodes of poor air qualityin the Nation. New insights emerged from the field study that relate to hydrocarbonemissions from the petrochemical facilities. Emissions of the hydrocarbons are estimatedby industry using modeling approaches, and the Texas 2000 Air Quality Study data wereof particular interest because they provided the opportunity to cross-check thoseemissions inventory estimates. Additional findings that elucidated the role of various andrelatively unique sources of ozone and aerosol precursorsin the region (such as transportation, the petrochemicalindustries, and other industrial sources), as well as thespecific atmospheric processes associated with the region(in which departing air is "re-circulated" over the Gulf ofMexico and returned back to the land area) were analyzedand assessed.
During each of the previous intensives NOAA hadspecific climate or air quality goals. In these intensivesNOAA operated instrumented aircraft and participated inspecialized ground based and remote sensingmeasurements that were directed to achieving thosespecific goals. However, the distinction between the research objectives of the climate orair quality intensive field campaigns was, at least in part, simply a matter of perspectiveand scale. Many of the chemical and meteorological processes of interest were commonto both. In addition, intercontinental transport is either the starting point or the end pointof regional air quality concerns depending on whether you are on the west coast (inflow)or east coast (outflow) of the U. S. Thus, in recognition of this strong linkage NOAAconducted its first joint regional air quality and climate change study in the summer of2004. The study combined the elements of the previous ITCT and NEAQS studies. Thestudy focused on air quality along the Eastern Seaboard and transport of North Americanemissions into the North Atlantic. The major NOAA assets (the two aircraft and the ship)were being deployed in a manner that supported the objectives of both research programs.The TexAQS/GoMACCS intensive in 2006 is a continuation of this approach.
Fig. 3. Major petrochemicalindustries are located in
Houston.

Research Areas
The research planned for the TexAQS/GoMACCS 2006 field campaign has been
organized around the following five research areas, each with an associated science
question.
Emissions verification and assessment - How well do current inventories represent actual
emissions for: cities, point sources, ships, and vegetation?
Transport and mixing – What are the relative amounts of pollution imported to Texas and
exported from the continental boundary layer to the marine boundary layer and the free
troposphere?
Chemical transformation – How do gaseous and aerosol emissions evolve chemically and
physically as they are transported away from the source regions to the remote
atmosphere?
Aerosol properties and radiative effects – What are the chemical, physical, and optical
properties of the aerosol in this region and how do these properties affect regional haze
and aerosol direct and indirect radiative forcing of climate?
Forecast models – What is the current skill of air quality forecast models on local,
regional and global scales and what improvements can be made to enhance the accuracy
and extend the periods of these forecasts?
The specific goals and planned approach for each of these research areas is described in
more detail in the following sections.

Science Objectives and Associated Science Questions
Emissions Verification and Assessment
Relevance
Improving the quantitative understanding of the location, timing, and speciation of
gaseous and aerosol emissions into the atmosphere is critical to advancing the knowledge
of tropospheric chemistry, transport, and transformation on a variety of spatial scales.
Known or suspected inaccuracies in current emissions inventories of both anthropogenic
and biogenic sources account for a substantial amount of the total uncertainty in model
simulations of air quality [Jang and Fast, 2004] and climate change processes [IPCC,
2001]. Reports suggest that while some U.S. inventories are reasonably accurate (e.g.,
point source NOx and SO2: [Ryerson et al., 1998]), others may have substantial errors
(e.g., on-road emissions of CO: [Parrish et al., 2002]; petrochemical alkenes: [Wert et
al., 2003]). A goal of the NOAA 2006 summer field intensive is to use ambient
measurements to better constrain the emissions inventories of anthropogenic and biogenic
compounds relevant to both regional air quality and climate change.
Science QuestionsQuantitative information on the emissions from a variety of point and area sources is
required to understand their relative impacts on the atmosphere, both in terms of air
quality and of radiative effects from aerosol formation. Substantial contributions from
petrochemical industrial facilities, on-road vehicles and from large electric utility power
plants to anthropogenic gas- and aerosol-phase pollutants in the summertime Texas
airshed are expected. Other potentially significant contributions may come from off-roadtransport such as commercial shipping. Substantial biogenic contributions to reactive
VOC compounds involved in ozone and secondary organic aerosol formation are also
expected.
The summer 2006 intensive will provide data that will help answer the following basic
questions for a variety of source types. Direct emissions of a variety of species will be
studied, including aerosol (e.g., light absorbing carbon (LAC)) as well as gas-phase (e.g.,
VOCs, SO2, CO, etc.) compounds. The top-down approach that we use provides an
independent assessment of existing inventories. This approach has four distinct features:
Measurement of ratios of co-emitted pollutants compared with predictions
derived from existing emissions inventories: Many sources emit more than one
species at a time. Measurements of the ratios of these species in the emissionplume provides a check on the existing emission inventories, and may be used toidentify a particular source among several possible emitters. Also, sources with
differing emissions ratios, such as for (VOC/NOx), can have substantially
different impacts on the rates of photochemical transformations occurring
downwind. Spatial patterns of transport and deposition of secondary
photoproducts and aerosol particles may depend on ratios of direct emissions
from a given source. Thus, more accurate estimates of emissions ratios will

improve the ability to predict the various impacts of a given source on the
atmosphere downwind.
Measurement of absolute amounts of emitted pollutants compared with estimates
derived from inventories: Model-measurement differences can arise due to
inaccuracies in the source emissions rates used as model input. Actual emissions
rates can vary substantially on timescales of hours, days, seasons, or years, some
of which may not be captured by a given inventory compilation. Improved
estimates of the absolute amounts of emissions from a variety of different source
types will minimize this potential source of model-measurement bias, and
enhance the utility of models to usefully explore future “If … then…” emissions
control scenarios.
Measurements of spatial patterns of emissions compared with estimates derived
from inventories: As an example, the geographic distribution of SO2, NH3, and
biogenic terpenoid emissions will determine the relative contribution of
anthropogenic sulfate to biogenic secondary organic aerosol for a given receptor
region. The location and magnitude of aerosol light absorbing carbon (LAC)
sources will influence the radiative impacts of transported emissions downwind.
Regional surveys will provide data to evaluate and improve the spatial accuracy
of current inventories for both air quality and climate-relevant species.
Measurement of temporal variations in emissions strength and composition
compared with estimates derived from inventories: Biogenic emissions of
isoprene and monoterpenes are highly dependent on sunlight, temperature, and
drought conditions. Anthropogenic emissions can also vary substantially across a
range of timescales, including diurnal cycles and weekday-weekend differences.
Variability in either can influence the chemical composition and radiative
properties that result from their release to the atmosphere. In-situ measurements
over the course of the 2004 summer field intensive will provide information on
emissions variability on timescales of hours to weeks, covering the range of
ambient conditions occurring during the study period.
Based on this top down approach, we hope to address the following five specific sciencequestions during the 2006 intensive.
The sources of the precursors of ozone and aerosols are widely distributed in Texas. Thisis illustrated in Figure 4 which shows the distributed anthopogenic CO emissions andmajor point sources of NOx in Texas. In the figure, area wide CO emissions are color-coded according to the intensity of the sources and the point sources are indicated as redcircles with the magnitude of the source proportional to the size of the circle (c.f.,Emissions Web Browser [http://map.ngdc.noaa.gov/website/al/emissions/], NOAA,
1. What is the regional distribution of anthropogenic and biogenic emissions inTexas?

Fig. 4. The spatial distributionof CO and NOx emissions inTexas.
National Geophysical Data Center). The spatialdistribution of the CO emissions, are concentrated inthe large metropolitan Areas of Dallas - Fort Worth,Houston and San Antonio - Austin. Thesemetropolitan areas account approximately 70 % of theCO emissions over Eastern Texas. The rest of the COemissions come from distributed emissions along thehighways connecting these cities and from smallerurban centers as well as a few significant pointsources.
In addition to the area CO emissions, the figure alsoshows the location of large industrial NOx pointsources (indicated by the red circles in the figure), such as electric power generatingunits. Several of the large power plants in east Texas are located in the forested, ruralareas of northeastern Texas and between Dallas and Houston. Hence, the potential forozone formation on a regional basis will rely on the distribution of the reactive biogenicVOCs. According to the EPA National Emission Inventory (NEI) 1999 these pointsources contributed approximately 45 % of the NOx emissions in Eastern Texas.However, since the 2000 study the NOx emissions from many of the power plants havebeen substantially reduced through the installation of control equipment.
The implication of the distribution of these sources, their relation to each other and thechanges in emission with time play an important role in assessing their contribution of theregional distribution and long-range redistribution of ozone and aerosols. The use of top-down measurements can help the assess the current situation and changes that haveoccurred.
What sets Houston apart from other urban areas of its size, like for example Dallas – FortWorth and Atlanta, is the presence of the petrochemical complex along the Ship Channeland Galveston Bay with its collocated emissions of NOx, SO2, and reactivehydrocarbons. The impact of these collocated emissions on the measured mixing ratios ofseveral gas-phase species is illustrated in Figure 5. On 28 August 2000 the winds duringthe morning hours were from the south-southeast at about 4-5 m/s and the measurementacross the Houston airshed along the transect at 29.8 N give a good representation of thecontribution of the major emission sources. On the western side of the transect, the plumeof the coal and gas fired W.A Parish power plant with a generating capacity of 3600 MWcan be clearly seen in the traces of the NOy, SO2 and CO2 concentrations. On the easternside of the transect, the gas and oil fired Cedar Bayou power plant with a generatingcapacity of 2260 MW leads to a plume of enhanced NOy and CO2 concentrations, butlow SO2 levels. While the urban center contributes noticeably to the NOx emissions in
2. What are the relative contributions from urban area sources, power plants,and industrial emissions within the Houston metropolitan air shed?
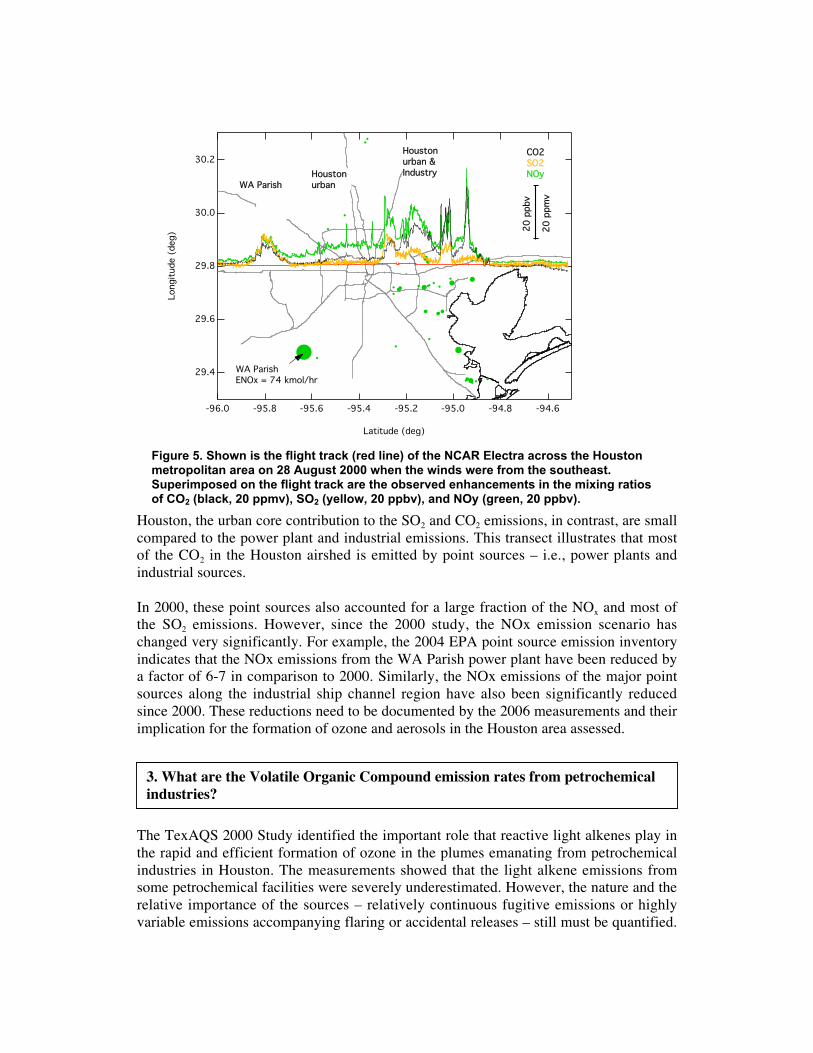
Houston, the urban core contribution to the SO2 and CO2 emissions, in contrast, are smallcompared to the power plant and industrial emissions. This transect illustrates that mostof the CO2 in the Houston airshed is emitted by point sources – i.e., power plants andindustrial sources.
In 2000, these point sources also accounted for a large fraction of the NOx and most ofthe SO2 emissions. However, since the 2000 study, the NOx emission scenario haschanged very significantly. For example, the 2004 EPA point source emission inventoryindicates that the NOx emissions from the WA Parish power plant have been reduced bya factor of 6-7 in comparison to 2000. Similarly, the NOx emissions of the major pointsources along the industrial ship channel region have also been significantly reducedsince 2000. These reductions need to be documented by the 2006 measurements and theirimplication for the formation of ozone and aerosols in the Houston area assessed.
The TexAQS 2000 Study identified the important role that reactive light alkenes play inthe rapid and efficient formation of ozone in the plumes emanating from petrochemicalindustries in Houston. The measurements showed that the light alkene emissions fromsome petrochemical facilities were severely underestimated. However, the nature and therelative importance of the sources – relatively continuous fugitive emissions or highlyvariable emissions accompanying flaring or accidental releases – still must be quantified.
3. What are the Volatile Organic Compound emission rates from petrochemicalindustries?
30.2
30.0
29.8
29.6
29.4
Longit
ude (
deg)
-96.0 -95.8 -95.6 -95.4 -95.2 -95.0 -94.8 -94.6
Latitude (deg)
20
ppbv
20
ppm
v
CO2SO2NOy
WA ParishENOx = 74 kmol/hr
WA ParishHoustonurban
Houstonurban &Industry
Figure 5. Shown is the flight track (red line) of the NCAR Electra across the Houstonmetropolitan area on 28 August 2000 when the winds were from the southeast.Superimposed on the flight track are the observed enhancements in the mixing ratiosof CO2 (black, 20 ppmv), SO2 (yellow, 20 ppbv), and NOy (green, 20 ppbv).

The processes responsible for the emissions need to be understood before emissionfactors can be developed that can be included in regulatory and chemical forecast models.
In the TexAQS 2000 studies airborne measurements downwind of isolated petrochemical
complexes were used to determine the absolute emissions rate of NOx and the emission
ratios of hydrocarbons to NOx. While the emission rate of NOx inferred from these
measurements compared well with those reported by the state of Texas, the ratios of
ethylene and propylene to NOx were higher by more than an order of magnitude than
those included in the State emission inventory. This was observed on all flights thatmeasured in these emission plumes. While the hydrocarbon measurements were based on
a few individual canister samples taken during plume intercepts, measurements of
reaction products that were made at a higher temporal resolution confirmed that the high
hydrocarbon to NOx emission ratios were representative. Measurements of the reactive
hydrocarbons at a few seconds time resolution will be required during the TexAQS2006
study to improve the estimates of the hydrocarbon to NOx emission ratios. This will be of
particular importance in the spatial allocation of the hydrocarbon emissions in the
Houston Ship Channel region, with its complex agglomeration of a multitude of
petrochemical facilities.
To address the important question of the temporal characteristics of the emissions from
the petrochemical industries the use of ground based in-situ and/or remote sensing
approaches should be investigated as a practical and cost effective alternative and
supplement to airborne observations. Determination of the emission rates by several
independent measurement approaches will build confidence and allow definition of the
uncertainty in the current understanding of the emission rates of reactive hydrocarbons by
petrochemical facilities.
The weekly cycle of the human activity pattern in industrialized countries is reflected inlower NOx concentrations on weekends that have been seen at ground sites in urban areas(Marr and Harley, 2002, and references therein) as well by satellite measurements of theNO2 tropospheric column (Beirle et al., 2003). Urban emissions are a mixture from avariety of different emission sources that have specific diurnal and weekly activitypatterns.
Traffic related sources have distinctive diurnal and weekly patterns. Gasoline poweredvehicles emit CO, NOx, VOCs, CO2 and aerosols. Diesel powered vehicles emit NOx,CO2, aerosols, and in particular aerosols that contain light absorbing carbon (LAC). Onweekdays, the emission from gasoline powered vehicles peak during the morning andevening rush hours, whereas truck traffic tends to peak during midday. On weekends thetruck traffic strongly decreases, as does the morning rush hour peak of the gasoline-powered vehicles. Construction equipment that is mainly powered by Diesel engines isalso mainly operated on weekdays. The stronger reduction of the Diesel engine emissions
4. Do ambient measurements of pollutant mixing ratios (e.g., CO/NOx,VOC/NOx, CO/CO2, LAC/CO, NH3/CO) reflect the temporal variation of urbanemission ratios through diurnal cycles and weekday/weekend contrasts?

on weekends compared to the gasoline engine emissions leads to a maximum in the VOCto NOx and CO to NOx ratios on weekends (Marr and Harley, 2002). As ozone formationis hydrocarbon limited in many urban areas, a reduction of the anthropogenic emissionsthat is accompanied by an increase in the VOC to NOx ratios can result in higher ozoneconcentrations in urban areas on weekends compared to weekdays (Marr and Harley,2002, and references therein).
Baumgardner et al. (2002) have analyzed the relationship between light absorbing carbon(LAC) and carbon monoxide by comparing measurements from two sites in Mexico Cityand five urban areas in Germany. They found that the most important factors that affectthe LAC to CO relationship appear to be the ratio of diesel to gasoline usage and thecombustion efficiency of vehicles in a particular urban area. The LAC /CO ambient ratioscan be compared to tunnel measurements of the emission ratios of the automotive source(Miguel et al., 1998). Furthermore, measurement of the LAC /CO ratio as well as theparticulate to CO ratio at ground sites in the Dallas Ft. Worth and Houston airshed thuspromises an important evaluation of the emission inventories.
Participants and Platforms:NOAA and its extramural partners will instrument and deploy the NOAA WP-3D thatwill play an important role in emission verification. In addition, the NOAA Twin Otterlidar aircraft, the NOAA research vessel Ronald H. Brown and various instrumentedground sites and/or mobile sampling vans will be used to acquire data that can providetargeted emission verification for specific localized sources. The measured distribution ofvarious trace gases will also be compared with satellite observations.
Deployment strategy
Comparison of ambient data to emissions inventories has been an integral part of NOAA
tropospheric field programs in the past. The three NOAA-sponsored mobile platforms –
the WP-3D, the Twin Otter with the ETL lidar, and the R/V Ronald H. Brown along with
several instrumented ground sites and satellites – will all acquire data suitable for
emissions inventory comparison in the course of pursuing other scientific objectives. As
such, this research area is relatively easily integrated within the overall requirements of
regional air quality and climate change research, and will complement the other
deployment activities described in this document. Some examples of ship or aircraft
tracks that will generate data suitable for emissions inventory assessment are briefly
described below. In addition to the use of the NOAA platforms, during the 2006
intensive we hope to make use of the composition of gas phase and aerosol distribution
derived from retrievals based on satellite observations. Martin et al. (2004) haveevaluated the GOME satellite measurements of tropospheric NO2 using the regional datafrom the TexAQS 2000 as well as the 1999 Southern Oxidants Study. A similarevaluation study will be of particular interest due the much improved spatial resolution ofcurrent satellite NO2 measurements as well as the significant reduction of the point
5. Can the direct emission of aerosols including black carbon be characterized bymeasurement of their ratio to major urban pollutants such as CO.

source NOx emissions that should be detectable by comparison of the 2006 and 2000satellite measurements.
Emissions ratios
Data generated in near-field plume transects within or immediately downwind of source
regions can be used to assess emissions ratios of pairs of co-emitted compounds. Near
field transects reduce the uncertainty in deriving emissions ratios by minimizing the
effects of differential removal rates and of plume dilution into different background
abundances of the two species in question. Near-field transects also enhance the
observed mixing ratio enhancements above background, maximizing the signal-to-noise
for the two species; given substantial in-plume enhancements, to first order, dilution will
be equal for both co-emitted species. The slope of a two-sided linear regressions fit to
the plume transect data will give a direct measure of the emissions ratio.
Under these conditions, the uncertainty of the emissions ratio derived from measured data
is determined by the combined uncertainty of the individual instrument calibrations. For
well-operated instruments, this uncertainty can be less than ±10%, providing an
independent and accurate check on the ratio derived from an emissions inventory.
Appropriate data can be generated by a single WP-3D traverse of a plume within the
boundary layer; typically, this is repeated to build statistics, to capture temporal
variability, and to ensure that differential lofting of emissions (e.g., from multiple sources
at different release heights) can be taken into consideration. Atmospheric variability will
cause directly emitted species to co-vary over time, generating a trend line with a
characteristic slope reflecting the ratio of two species at the time of emission. As long as
the assumption of negligible differential loss is met, emissions ratios estimated from
ambient measurements provide a robust and independent benchmark value against which
emissions inventories can be compared.
Using the above analysis, the geographic and temporal distributions of emissions can be
evaluated from measurements and compared to available inventories. Highly time-
resolved data from continuous emissions monitoring systems (CEMS) can be directly
compared to ambient plume measurements taken concurrently. Comparison of accurate
but annually averaged inventory values to ambient data taken on shorter time scales can
provide information on the expected range about the averaged tabulated value.
Absolute emission rates
Knowledge of the magnitude of emissions from a single source is more difficult to extract
from ambient measurements. While emissions ratios are relatively insensitive to
dilution, deriving absolute emission rates from ambient data requires that dilution be
taken into account in the calculation. One way to derive emission rates uses a mass
balance approach, in which the total flux of molecules in an emissions plume is
calculated and compared to the reported emissions rate (e.g., [White et al., 1976]).
Additional assumptions inherent in this analysis increase the resulting uncertainty above
that for calculating emissions ratios. Given the large potential errors, these assumptions
must be evaluated quantitatively for a given plume. Under ideal meteorological
conditions, however, the uncertainty in deriving absolute emissions rates from ambient

measurements appears to be ± 25% or less, which is sufficiently low to provide a useful
check on point source emissions inventories.
Data used to calculate absolute emission rates are taken in a manner similar to that
employed for calculating emission ratios. Near-field transects of large point or area
sources, repeated at different altitudes and distances downwind, will be carried out to
generate sufficient data to calculate absolute emission rates as well as to quantify the
assumptions inherent in the analysis. If logistics permit a joint aircraft mission, the ETL
profiling lidar aircraft could provide important information on plume vertical structure
and boundary layer height while the WP-3D performs plume transects within the
boundary layer.

Transport and Mixing
RelevanceRegional air quality and regional climate in Texas and the Gulf of Mexico are highlydependent on the transport and mixing of trace gases and aerosol particles. Theseprocesses occur on a variety of spatial scales, including atmospheric boundary layer(ABL), regional, intra-continental, and intercontinental. Boundary layer processesinfluence export to the free troposphere over the region. On the broader, continentalscale, Wotowa and Trainer [2000] have shown that large quantities of carbon monoxidefrom Canadian forest fires can impact the eastern United States during summer. And onthe intercontinental scale, pollutant transport from Africa is believed to have an impact onbackground particulate matter concentrations across the United States. The 2006 study isprepared to examine the full range of transport scales and their influence on regional airquality and climate in Texas. A clear understanding of transport on these scales willallow us to assess the impact from local, regional, and distant sources on the air quality ofair masses as they impact Texas or are exported to downwind locations.
Two specific goals of the 2006 TexAQS /GoMACCS deployment are to furtherunderstand the meteorological and chemical processes leading to high-pollution events inthe local Houston/Ship-Channel/Galveston-Bay area and to better understand controls onregional air quality, including factors affecting rural background levels of ozone,aerosols, and other pollutants. The local problem was already a major thrust of the 2000project, and the regional focus is a new emphasis for 2006.
The sources of regional pollution include urban centers, industrial centers, automobiletraffic, and power plants, which tend to be localized. Thus, the factors that controlregional and background concentrations of pollutants are chiefly atmospheric transportprocesses acting on many length and time scales to carry pollutants and pollutantprecursors away from the source areas. These length scales can range from local tointercontinental. For example, based on the case study day that produced the highestozone concentrations during 2000, Banta et al. [2005] have shown that characteristics ofthe sea breeze at very local scales led to high ozone concentrations during the daytime,but nocturnal accelerations of the flow aloft could carry the pollution hundreds ofkilometers from the sources overnight. The action of the nighttime transport thustransforms the localized daytime production of pollution into a regional transportproblem, even during what might be considered “stagnation” or at least “light wind”conditions.
Science Questions
Atmospheric-boundary-layer scale.Many aspects of the ABL behavior were found to be important for pollutionaccumulation and transport during 2000. Increased daytime mixed-layer depth over theHouston urban heat island and over the sea-breeze convergence zone carries pollutants togreat heights during daytime (cf. Fig. 6); the suppression of vertical mixing over water(Galveston Bay, the Gulf of Mexico) keeps pollution concentrations high in the morning

offshore-flow layer; and in the eveningsurface cooling decouples the flow inthe upper part of the previous-afternoon’s mixed layer from surfacefriction. Such decoupling leads tonighttime acceleration of the windsaloft and thus becomes important forregional transport as noted. Contrastsin surface thermal properties, especiallythe land-sea contrasts, can generatesignificant horizontal variability indaytime mixing depths, includingshallow mixing depths at the coastlinethat grow inland with distance from theshore during onshore flow conditions.These issues were identified during thedrought conditions of 2000 usingsurface sensor arrays, ground-basedremote sensing, and airbornemeasurements. The 2006 deploymentshould allow investigation of theseprocesses under more normal (non-drought) conditions, and the addition ofthe R/V Ronald H. Brown and offshore profiler measurements will allow betterspecification of fluxes and ABL processes over water.
The daytime boundary layer over land is often well mixed through its depth, but if the airpasses over a cooler water surface or when the land surface cools at night, the boundarylayer develops layers of different properties, including speed and directional changes ofthe winds with height. Such shear can produce horizontal transport that varies stronglywith height in the lowest 1-2 km above ground. When the underlying surface becomeswarmer again, these layers generally mix out, which can result in fumigation of pollutantlayers and increases in ground-level pollutant concentrations via downward mixing.Fully documented examples of such fumigation events are rare, and their overall impacton air quality needs to be evaluated.
Vertical ABL transport processes include exchange between the ABL and the surface viadeposition and exchange between the ABL and the troposphere above the boundary layer.
2. What are the major processes that remove pollutants from the ABL?
1. How do the heating and cooling cycle at the earth’s surface and the resultingchanges in ABL vertical structure affect horizontal transport from themajor sources?
Figure 6: Time-height cross-sectionshowing high ozone concentration airtransported vertically within the sea breezefront at the western edge of Galveston Bay.

The effectiveness of dry deposition processes at night is generally assumed to be small,but in fact is unknown. Examples of exchange between the ABL and free troposphereinclude cloud venting of boundary layer air, detrainment of boundary-layer air into thetroposphere at discontinuities in the depth of the mixed layer, and entrainment of freetropospheric air that may contain pollution from distant sources or stratospheric O3. .
Differences in surface properties produce differences in mixed-layer depth [Banta et al.1998], such as the deeper boundary layer over the relatively warmer urban “heat island”[Angevine et al. 2002], with the potential for pollutants to escape from the deeper mixedlayer into the free troposphere above the boundary layer. This process has not been welldocumented in the atmosphere, nor has its potential for reducing pollutant concentrationsin the mixed layer. When the daytime flow is onshore along the Gulf Coast, the mixedlayer coming off the cooler water surface is shallow, but as it is transported inland, themixed layer depth grows as an ‘internal boundary layer.’ Effects of this transition onvertical and horizontal transport are not well known.
Local scale.High-pollution days occur preferentially during periods of light gradient, or large-scale,winds in southeast Texas. Such days are characterized by local sea-breeze developmentduring daytime, followed by accelerated winds above the surface at night. Pollutantsoften accumulate in the vicinity of the sources during daytime and can be lofted deep intothe PBL (c.f., Fig. 6). Studies have shown that high pollution concentrations are mostoften associated with a late-morning through mid-afternoon reversal of the near-surfacewinds at sites along the coast and just inland, as a result of the sea-breeze passage [Darby2005], with many days featuring pollutant buildup during morning and midday near theHouston urban-industrial sources, often followed by northward sea-breeze transport ofthe pollutants. Very high pollution events, however, occur when the sea breeze beginslater in the afternoon and stalls, and a 1-3 hour stagnation period ensues just inland fromthe coast in mid to late afternoon [cf. Banta et al 2005].
A key factor controlling local pollution events in the Houston /Ship-Channel /Galveston-Bay area is the way in which the sea breeze develops on a given day. The strongestinfluence on the development of the sea breeze seems to be the large-scale, gradient windvector, about which the diurnal sea-breeze cycle rotates [Nielsen-Gammon 2002, Banta etal. 2005]. The roles of other factors, which may include moisture and cloudiness, soil-moisture variation, lower-atmospheric stability, the depth of the sea-breeze flow layer,
3. What is the horizontal variability of the boundary layer depth and whateffects does this have on transport and mixing?
4. How do day-to-day variations in sea-breeze development (timing,intensity, etc.) affect peak local pollutant concentrations?
5. What is the extent of inland transport by the sea breeze, and whatother factors control this transport?

etc., are not well known. The availability of offshore measurements by a wind profilerand the R/V Ronald H. Brown will be critical enhancements over 2000 for understandingthe influence of the sea-breeze cycle on local-scale pollution.
The relationship between sea-breeze development and high pollution days also include anumber of specific issues. Days with a reversal from morning offshore flow to late-morning or mid-afternoon sea-breeze flow are associated with high pollution, but do alldays with a reversal have high pollution concentrations somewhere? As just described,the resultant sea breeze behavior as measured at a site near the coast is dependent on the“large-scale” wind, about which the diurnal sea breeze cycle rotates, but what is theappropriate measure of this large-scale wind, and can it be determined in advance forforecasting purposes and numerical model assessment? Additionally, what is thelingering effect of the previous day having been a high-pollution day, and how does thiseffect combine with the influence of the sea breeze?
Regional scales.Regional processes affect both smaller regions, such as Eastern Texas, where ruralpollutant levels are increased by direct transport and mixing from the major sources, tolarger regions, such as the south-central United States (Texas, Louisiana and thenorthwest Gulf of Mexico), where intra-regional export, import, or recirculation ofpollutants are important issues. Regional scale transport poses three important questions.
Under the daytime sea-breeze-reversal scenario justdescribed, the lofting of pollution into the ABLresults in deep columns of pollution by sunset,which are then distributed over the surroundingcountryside by the accelerated nocturnal windsaloft (Fig. 7). Thus, as described previously, theseconditions produce local pollution during daytime,but also contribute to regional pollution as a resultof nocturnal transport. These types of day oftencluster together into multi-day episodes, duringwhich rural background concentrations ofpollutants also increase, as a result of the nocturnaltransport from the source regions and the overallrelatively weak background winds. An issue forepisodes is whether pollutants are carried out of theregion or whether the sea breeze and other regional
6. Under what conditions does local urban pollution have a significantimpact on other areas in the region?
7. How effective are nocturnal transport and subsequent daytime verticalmixing in dispersing pollution from the major sources into thesurrounding region?
8. Are fugitive emissions from oil production important for regionalpollution episodes?
Fig. 7. Transport of localpollution during nighttimehours.

winds can re-circulate the pollutants and combine them with pollutants from othersources along the Gulf Coast.
Houston-area sources can also contribute toregional pollution when conditions areunfavorable for sea-breeze formation, aswhen boundary-layer winds are stronger (5-8 m s-1 or so). The wind speed anddirection are more regional and persistent,and the diurnal sea-breeze cycle is at most aminor perturbation on the overall windfield. Winds of this velocity in theatmospheric boundary layer (ABL) producea more plume-like behavior of thepollution, as shown in the airborne ozonelidar maps in Fig. 8. Despite the strongerwinds, these conditions can still producehigh hourly-averaged ozone concentrations,although overall concentrations are lowerthan in the previous scenario because ofwind-speed dilution effects. Ozone andaerosols along with their precursors aretransported over the countryside both dayand night, and relevant issues are, whetherthe flow above the surface acceleratessignificantly at night, and whether thepollution continues to be carried out of theregion.
Long-range, continental scales:Long-range transport has implications for both air quality and climate. Several long-range transport issues can be identified that relate to the export of ozone and aerosols andtheir precursors from Texas to other regions of the United States or elsewhere, or to theimport of the species into Texas from distant sources.
Can pollution originating in Texas remain at high enough concentrations to affect areassuch as Atlanta, Chicago, the Ohio River Valley, or the East Coast of the United States?Can this pollution be carried northward to become entrained into the Great Plainsnocturnal low-level jet and be incorporated into long-range transport (continental scales)?
9. Do conditions exist when specific areas in Texas represent a source ofpollution to other areas of the United States?
Figure 8: Flight track of ozone plumetracked downwind from Houston duringthe 2000 experiment. Ozone values areaveraged over the layer between 200 and1000 m AGL. Flow is from northeast tosouthwest. One site southwest ofHouston registered hourly ozoneconcentrations of > 125 ppb.

Candidate distant source regions to affect Texas might include the Los Angeles area,Mexico, Central America, or recirculation from the southeast United States. Forest firesand other biomass burning were observed to affect Houston air quality during 2000, andsmoke plumes from boreal fires in Canada and Alaska, tracked with satellite imagery,were observed above the northern Gulf Coast during July 2004. Saharan dust could addto the aerosol burden of the air over southeastern Texas. The impact of these distantsources on Texas air quality should be measured and the conditions attendant to themidentified.
APPROACHParticipants and PlatformsNOAA researchers and extramural collaborators will address transport and mixingquestions with arrays of instrumentation systems to measure the time-dependent 3-Ddistribution of meteorological and chemical quantities. A mesonet of surface stationswill augment existing measurements sites to measure meteorological variables andchemistry at ground level, and some sites will be equipped to measure fluxes and surfaceenergy budget components. Information on the vertical structure of these quantities willbe documented by both ground-based and airborne instrumentation systems. Verticalprofiles of wind and temperature, plus mixing height, will be provided by surface-basedarrays of radar wind profilers with RASS, serial rawinsonde ascents, and a Doppler lidar,which will measure the fine-scale structure of the boundary layer either on the ship or at aland site. NOAA airborne platforms, including the WP-3D and the airborne ozone DIALon a Twin Otter, will provide important information on the vertical and horizontaldistribution of pollutants for forecast and model verification. Two other importantcapabilities are over-pressured “smart” balloons and the R/V Ronald H. Brown, whichwill carry surface-flux and energy-balance measurement capability, a Doppler windprofiler, an O3 profiling lidar, a sophisticated complement of air chemistry sensors, andother instrumentation.
Numerical modeling. Numerical weather prediction (NWP) models are an important toolfor diagnosing or predicting the effects of transport and mixing, and a number ofmodeling groups will participate in the execution and post analysis of the 2006 campaign.Important questions are, when can model results be used with confidence to predicttransport of pollutants, what processes need to be better represented to improve thesetransport predictions, what is the nature of the limitations and uncertainties that exist inthe model predictions, and what is their impact on predicted transport? Assessing modelperformance is a major thrust of TexAQS in 2006 and the subject of a later section of thisdocument. These models also have the ability to be used as an effective tool to predicthorizontal and vertical transport, improving the deployment and staging of mobilemeasurement platforms in 2006.
10. What conditions exist when elevated background concentrationsimported from distant source regions outside of Texas impact air qualityor climate in the state?

Deployment strategy
Measurement Strategy: The strategy for addressing the science questions is listed belowas related to each scale of interest.
Atmospheric boundary layer scale: ABL-scale science questions will require knowledgeof surface variables and fluxes and vertical profiles of many quantities. The verticalstructure of the ABL and its relationship to surface heating and cooling will be addressedby the surface mesonet array, the profiler/RASS array, serial rawinsonde ascents, theDoppler lidar, and measurements on the R/V Ronald H. Brown. Airborne measurementswill also provide vertical profile information, as well as other important spatial-distribution data to address transport effects and removal processes. Horizontalvariability of the daytime mixing height and other quantities will be measured byairborne instrumentation and the profiler array.
Local scale. The same complement of instrumentation as used for the boundary-layermeasurements will address the local-scale research questions. Especially important fordefining the characteristics of the local sea breeze and its effect on pollutant distributionwill be the airborne measurements, including the airborne DIAL and the WP-3D. TheDoppler lidar provides important information on the fine-scale timing and verticalstructure of the sea breeze flow for characterization of the sea-breeze behavior and fornumerical model validation. The offshore measurements will be an importantenhancement to the instrumentation deployed during 2000.
Regional scale. The focus on regional transport and regional air quality in 2006 willrequire a careful assessment of the effectiveness of various meteorological processes totransport pollutants from the major source areas to other areas of interest. One of themajor questions is the role of nocturnal transport. Banta et al. [1998] report successfullyusing trajectories from hourly profiler-array data to find urban ozone blobs afterovernight transport. For 2006, profiler data will be available in near real time, and atrajectory-calculating tool will be available for analysis, also in near real time. Thisresource should be used to guide sampling aircraft, including the airborne ozone DIALand the WP-3D, during nighttime and early-morning flights to find the pollution layersand to characterize the regional transport and the fate of pollutants from the previous day.The airborne DIAL would probe the location, extent (horizontal and vertical), andproperties of the O3 distribution (diffuse or ‘patchy’), and the WP-3D measurementswould be used to confirm the origin and characterize the photochemical age of the airmass. On occasions when pollution is diagnosed as being transported to the north-northwest, the CMDL data from the tall tower near Waco, Texas, should be consulted toverify and characterize the transport. Analyses of these data sets will be used to assessthe ability of NWP forecast models to properly and accurately represent regionaltransport processes.
Another tool that should be very useful in investigating regional transport is the over-pressured ‘smart’ balloon, which would be provided by extramural collaborators. Thesecould be released close to the source regions at a representative altitude of interest to

track the overnight progress of the pollution, to confirm the profiler trajectories, and toaid in guiding the aircraft to the pollution. These platforms could be especially useful inmulti-day episodes, to determine whether pollution originating in the Houston area canbecome recirculated in the Gulf Coast region or whether it is carried out of the regioneven during the episode.
Continental and larger scales: Regional- to hemispheric-scale transport models such asFLEXPART will be run in forecast mode during the experiment to identify pollutionplumes transported within the south-central United States as well as polluted air massesbeing imported to the region. The NOAA aircraft and Ronald H. Brown can then bepositioned to intercept these plumes. Furthermore forecast forward trajectories can berun from a flight track as soon as the flight is over to indicate the location of the sampledair masses over the next several days. The aircraft can then target these trajectorylocations on subsequent days to create a regional scale Lagrangian study of the chemicaland dispersive evolution of polluted air masses.
For long-range transport studies the NOAA aircraft will be able to wait for polluted airmasses that are forecast to originate from other regions of North America or even Africato be imported into the region. However, the NOAA aircraft will not have the range toeffectively sample air masses far beyond the boundaries of the south central UnitedStates, unless suitcase flights are planned. The in situ measurement of polluted airmasses that leave the borders of the south central United States will have to be madeserendipitously by either stationary surface/tower instrumented sites, or other mobileairborne platforms. These additional mobile platforms include MOZAIC aircraft andNOAA CMDL aircraft. The European-funded Measurement of Ozone and Water Vaporby Airbus In-Service Aircraft (MOZAIC) program makes profiles of ozone and CO atairports in Houston, Dallas, Atlanta, Washington D.C., Chicago, Philadelphia, New York,Boston, Toronto, Montreal and Los Angeles. Although these profiles are not made on asystematic basis, 6-10 profiles are generally available somewhere over the United Statesfor any given day, plus data at cruising altitude over North America and across theAtlantic to Europe. Also NOAA CMDL’s new aircraft-based monitoring network will bepartly available in 2006, providing additional trace-gas measurements up to 6 km atseveral locations across the United States on a weekly basis (the prospect of having theseprofiles made at a higher frequency during the study period needs to be pursued).Finally, remotely sensed trace gas measurements from polar-orbiting satelliteinstrumentation such as AIRS, MOPITT, SCHIAMACHY, or HRDLS (and otherinstruments on the new AURA satellite) can be used to track exported pollution plumes.

Chemical Transformation
Relevance
Chemical transformation is one of the principal processes controlling the abundance,
distribution, and properties of ozone and aerosols in the atmosphere. As a consequence,
chemical transformation affects their impact on climate, the environment, and human
health.
The section on “Emission Verification” discussed research that will be undertaken to
better identify and quantify the sources responsible for the direct emission of aerosols and
the sources of the chemicals responsible for the secondary production of ozone and
aerosols in the study region. The section on “Transport and Mixing” indicated the
research to be undertaken to understand the processes that mix ozone and aerosols from
these sources through the atmosphere and that transport those compounds from the source
regions and deliver them to receptor locations. This section describes the research that
will be undertaken during the study to better understand the chemical processes that lead
to the formation and loss of ozone in the atmosphere, the formation of aerosols and their
transformation during transport.
The proposed research is based on the recognition that while the daytime chemistry that
leads to ozone formation is qualitatively understood, nighttime chemical processes
involving ozone and the importance of these processes is much less certain. On the other
hand, the processes controlling aerosol formation and transformation during transport are
even less well known.
Science Questions
The 2006 TexAQS/GoMACCS intensive will provide chemical transformation data that
will help to address three overarching questions:
The challenge of the 2006 intensive will be to determine how gaseous and aerosolemissions in plumes from urban, power plant and petrochemical sources evolvechemically and physically as they are transported away from these source regions duringthe daytime and nighttime.
1. What primary processes characterize the chemical evolution of ozone,
aerosols and their precursors as they are transported from the source
regions?
2. How do emissions from local and distant source regions interact to determine
the air quality in Texas?
3. Do emissions in Texas influence the regional air quality and climate in distant
regions?

Ozone is formed in the troposphere by photochemical reactions involving the oxides ofnitrogen NO and NO2 (summed as NOx) and reactive volatile organic compounds (VOCs)[Haagen-Smit, 1952; Seinfeld and Pandis, 1998 and references therein]. Model studieshave shown that O3 formation rates and yields per NOx molecule oxidized are dependentupon both the absolute concentrations of NOx and VOCs and upon the ratios of thesespecies [e.g., Liu et al., 1987, Derwent and Davies, 1994, Sillman, 2000]. Results fromambient measurements have confirmed that substantial differences in the rate andmagnitude of O3 production consistently occur in plumes downwind of differentanthropogenic source types, characterized by different NOx and VOC emission rates andthe VOC/NOx ratios that result [e.g., Ryerson et al., 1998, 2001, 2003; Daum et al., 2000;Nunnermacker et al., 2000; Kleinman et al., 2002]. In particular the measurements duringthe TexAQS 2000 study have shown that petrochemical industrial facilities can emit largeamounts of highly reactive hydrocarbons and NOx to the atmosphere; in the summertime,such collocated emissions are shown to consistently result in rapid and efficient ozoneformation downwind [Kleinman et al., 2002; Ryerson et al., 2003; Neuman et al., 2002].
Along with the formation of ozone, particle growth in urban, power plant and industrialplumes has been systematically measured [Brock et al., 2002, 2003]. For example,during TexAQS 2000 plumes originating from the Parish gas-fired and coal-fired powerplant, petrochemical industries along the Houston ship channel, the petrochemicalfacilities near the Gulf coast, and the urban center of Houston were studied (Figure 9).Most of the particle mass flux advected downwind of the Houston area came from theindustries and electrical utilities at the periphery of the city rather than from sources inthe urban core. In fact, clearly detectable gas-to-particle conversion was found only inplumes from large SO2 sources. In SO2-rich plumes that did not contain elevatedconcentrations of VOCs, the gas-to-particle conversion was consistent with the expectedoxidation of SO2. However, in plumes that were rich in both SO2 and VOCs, theobserved particle growth greatly exceeded that expected from SO2 oxidation, indicatingthe formation of organic particulate mass (Brock et al., 2003). Finally, in plumes thatwere enhanced in VOCs but had little SO2, and in the plume of the Houston urban center,no particle volume growth with increasing plume oxidation was detected. Sincesubstantial particle volume growth was associated only with SO2-rich plumes, theseresults suggest that photochemical oxidation of SO2 is the key process regulating particlemass growth in all the studied plumes in the Houston-Galveston airshed. Clearlyhowever, organic matter must contribute substantially to particle mass in petrochemicalplumes rich in both SO2 and VOCs. Quantitative studies of particle formation and growthin photochemical systems containing NOx, VOCs, and SO2, with improved real-timecapability to measure particle composition, will be an important part of the 2006 study.
4. What are the rate and efficiency of processes that control ozone and secondaryaerosol formation during the daytime downwind of urban areas, power plants,and industrial sources?
5. How did the change in emissions from 2000 to 2006 affect the gas-phase andaerosol concentrations?

The oxidation of volatile organic compounds (VOCs) in the presence of nitrogen oxidesleads to the formation of ozone in the troposphere. Besides ozone, other secondaryspecies such as carbonyls and organic nitrates are formed that are characteristic of theparent VOC species. Ambient measurements of secondary species reflect the integratedeffect of emissions, photochemical production and loss, as well as other removalprocesses. Analysis of ambient measurements of select secondary species can be used toevaluate the understanding of tropospheric photochemistry (Wert et al., 2003; Roberts etal., 2001, 2003).
In addition to the oxidation of gas phase VOCs, the investigation of the very sizablefraction of volatile organic compounds in aerosols is largely unstudied but of greatimportance in assessing the processes that determine air quality and climate.Measurements aimed at observing these chemical oxidation processes will be undertakenduring the 2006 study.
30.5
30.0
29.5
29.0
Lati
tude
-96.0 -95.5 -95.0 -94.5
Longitude
Partic
le V
olu
me (c
m-3
)
15
12
9
6
3
0
50 25 10 5
SO2 Emissions
x106 kg SO 2 yr
-1
Figure 9. The figure illustrates the evolution of aerosols downwind of power plant,urban area and urban/industrial emissions that were observed during the flight of 28August 2000. The locations of the SO2 point sources are given by the yellow circlesthat are sized according to their emission strength as given in the legend.
5. Are the measurements of the products of VOC oxidation consistent with thecurrent understanding of hydrocarbon chemistry?

The chemical processing that occurs during the nighttime hours is much less well
understood. The ability of models to properly simulate the full diurnal cycle must beevaluated. The section on “Transport and Mixing” emphasized the importance oftransport during the night on regional air quality and climate. Horizontal transport can begreatly enhanced while vertical mixing is greatly reduced. This means that plumes canremain relatively concentrated while they are transported over greater distances.
The 2006 study will address the importance of the nighttime oxidation as a loss processfor NOx and investigate its influence on ozone production. Measurements over differentsource regions will provide important new information concerning loss mechanisms forNOx at night. However, understanding the chemistry over the continent during the nightwill present a significant challenge due to the vertical layering of the atmosphere. Thisvertical layering that is encountered during the night makes finding and tracking plumesat the surface or from an aircraft extremely difficult.
Participants and Platforms:NOAA and its extramural partners will instrument and deploy the NOAA WP-3D thatwill play an important role in understanding chemical transformation in the region. Inaddition, the NOAA Twin Otter lidar aircraft, the NOAA research vessel Ronald H.Brown and various instrumented ground sites and/or mobile sampling vans will be usedto acquire data that can provide useful ancillary information concerning the chemicaltransformations that occur in plumes emitted by specific localized sources. The measureddistribution of various trace gases will also be compared with satellite observations.
Deployment Strategy:Daytime Chemistry: To study the emissions from power plants, industrial facilities, andurban centers during the daytime the WP-3D will fly transects within the planetaryboundary layer (PBL) approximately perpendicular to the mean wind direction, upwindand at several distances downwind of the pollution sources of interest. Figure 9 shows anexample of such a flight track that was flown during the TexAQS2000 study to examinethe emissions and their chemical evolution from Houston and the surrounding powerplants and the petrochemical facilities (Brock et al., 2003, Ryerson et al., 2003, Wert etal., 2003). Occasional profiles are included to probe the vertical extent of the mixed layerand the contrast in chemical composition of the PBL and the adjacent free troposphere.To determine if a particular plume is well mixed throughout the PBL, a transect or part ofa transect can be repeated at multiple altitudes within and just above the PBL. Toexamine a vertical enhancement of the height of the PBL by, for example, the urban heatisland effect, a spiral profile in the center and outside of the urban plume can be included.Since multiple transects and vertical profiling require additional flight time, a betteralternative for the documentation of the vertical extent of the plume and the vertical
6. What is the contribution of nighttime chemistry to the oxidation of NOx andwhat are the consequences for the formation and removal of ozone andaerosols?

mixing within the PBL would be the co-deployment of the aircraft with extensive in situchemical probes together with the ETL Lidar aircraft. While the Lidar aircraft maps thephysical dimension of the plume by the height resolved measurement of ozone andaerosols along the flight track, the WP-3D documents the detailed chemical composition.This strategy proved highly successful during several research flights during the TexAQS2000 study. During TexAQS 2000, this deployment strategy has been used to study theemissions near the Houston, Dallas - Ft. Worth, and the power plants in northeasternTexas as well as south of Dallas. In addition during these plume studies the aircraft mapsout the distribution of the biogenic emissions over the different regions of eastern Texasand their interaction with the anthropogenic pollution. The profiles upwind of theemission sources of interest determine the importance of regional transport of pollution ineast Texas.
Nighttime Chemistry: In situ measurements of NO3 and N2O5 have been for the first timedeployed on board the WP-3D during the NEAQS 2004 study. Building upon thisexperience systematic plume studies during the TexAQS/GoMACCS 2006 study willinvolve in situ measurements of NO2, NO3, and N2O5 along with the end products such asHNO3, particulate NO3
-, and organic nitrogen in aerosols.
Urban: During the late afternoon rush hour and at nighttime urban pollutants are emittedinto the transient PBL with reduced vertical exchange. The accumulation of the pollutantsin the lowest hundreds of meters renders the study of the evolution of urban emissionsduring the nighttime problematic. However, the experience gained during NEAQS 2002and 2004 demonstrates that nighttime emissions into the shallow boundary layer can befollowed by ship borne measurements. For example, during TexAQS/GoMACCS in 2006the RV Ronald H, Brown will be able to sample the emissions that the land breeze carriesfrom Houston to Galveston Bay or from Texas City to the Gulf of Mexico. This does nothave to be done in a truly Lagrangian fashion, but intermittent plume interception atvarious distances from the sources will allow investigation of the chemical state of theplume at different ages since emission.
Power plant: Airborne studies of the evolution of power plant plumes will focus on theoxidation of NOx emitted during the nighttime into the stable remnant PBL. Due to theabsence of turbulent mixing at night these plumes will be concentrated in well-definedlayers. The challenge will be for an aircraft, such as the WP-3D with in situinstrumentation, to locate these plumes in the horizontal as well as the vertical.
Daytime remnant: A second focus on the nighttime study will be to determine the fate ofremnant NOx that was emitted by urban areas or point sources during the daytime. Asturbulent mixing decreases in the late afternoon vertical wind shear can contribute to thehorizontal dispersion of NOx in these plumes. The section on “Transport and Mixing”outlines a strategy that predicts nocturnal dispersion and transport using trajectorycalculations that are based on wind profiler observations. That approach may allow airparcels to be followed and mapped during the night. If so, this approach can be used toguide aircraft to the plumes even after several hours of nighttime transport.

Aerosol Properties and Radiative Effects
Relevance:Accumulation mode (�0.1 μm < Dp < �1.0 μm) and coarse mode (Dp > �1.0 μm) aerosolparticles scatter and absorb solar radiation affecting visibility (Malm et al., 1994) and theEarth’s radiative balance (e.g., Rasool and Schneider, 1971; Charlson et al., 1992;Ramanathan and Vogelmann, 1997). These particles can also act as cloud condensationnuclei (CCN), thereby influencing the albedo (first indirect effect, Twomey, 1974),lifetime (Albrecht, 1989), precipitation (Warner, 1968; Rosenfeld, 2000) and extent(Ramanathan et al., 2001) of clouds. Aerosol concentrations and their optical andradiative impacts are particularly high in regions downwind of sources, where diurnallyaveraged clear sky surface forcing range up to 30 Wm-2 (Russell et al., 1999; Ramanathanet al., 2001; Conant et al., 2003). International field campaigns during the past nineyears have studied aerosol properties and their direct radiative effects downwind ofEastern North America (1996 – TARFOX; 2004 – ICARTT), Southwestern Europe (1997– ACE-2), Southeast Asia (1999 – INDOEX), and Eastern Asia (2001 – ACE-Asia).During these nine years of major field programs, our scientific tools for measuringaerosols and their radiative properties and our understanding of aerosol chemistry andtransport and transformation processes have evolved tremendously (IPCC, 2001).Nevertheless, the current understanding of aerosol effects on climate, both with respect totheir direct radiative impact and the multiple (and mutual) effects of aerosol on clouds,leaves us with many unanswered questions. This situation is exacerbated by thecomplexity and regional/temporal variability of aerosol chemistry that is the source oflarge uncertainties in the optical, radiative, and cloud nucleating properties of the aerosol.At this time aerosols pose the largest uncertainties in calculations of radiative forcing ofthe climate system (IPCC, 2001, Figure 2).
As part of TexAQS/GoMACCS 2006, we propose to study the processes controlling theformation, transport and transformation of aerosol particles (see section on ChemicalTransformation above) and the effect of chemical composition and mass size distributionon the optical, radiative, and cloud nucleating properties of the aerosol. In addition, wepropose to directly measure the clear–sky radiative impact of aerosol over the Gulf ofMexico. Below we separate our science questions into aerosol “direct” radiative effects incloud-free conditions and aerosol “indirect effects” where the focus is on aerosol-cloudinteractions.
Aerosol Direct Effect Scientific Questions: The aerosol-radiation research plan isfocused on several scientific questions described below.
1. What are the regional scale aerosol optical properties in Texas/Gulf of Mexicounder different meteorological conditions and how do these properties change withaltitude, location, distance from their source, time of day, and with changes inmeteorological conditions?

Strategy: Measure/calculate aerosol properties under a variety of conditions (e.g.downwind of different point and regional sources; at various altitudes and distances fromshore; at different times of day; under different meteorological conditions). Comparedirectly measured aerosol scattering, backscattering, and absorption coefficients withthose calculated from the measured size distributions and chemical composition (localclosure).
Since 1995, many field experiments have focused on the characterization of troposphericaerosol properties to improve estimates of aerosol direct radiative forcing of climate.Several of these experiments have been located in marine environments immediatelydownwind of known continental aerosol source regions and have involved intensive fieldoperations with measurements from ships, aircraft, and coastal land sites. Measurementsover the ocean are prompted by satellite observations of backscattered radiation thatreveal persistent seasonal aerosol plumes downwind of continents and the relative ease ofaccounting for the surface albedo over a uniform, dark ocean compared toinhomogeneous, bright land surfaces. In situ shipboard measurements have played animportant role in these experiments as they provide information about aerosol chemicalcomposition, size distributions, optical properties, and mass loadings in the boundarylayer (Quinn and Bates, 2005). This information is required to fully understand theimpact of regional aerosol plumes on climate and air quality.
2. How well can chemical transport models define the regional aerosol distribution?
Strategy: Compare measured aerosol chemical and optical properties with thosedetermined from chemical transport models.
Radiative transfer models are used to calculate regional aerosol radiative forcing. Thesemodels require as inputs regional aerosol optical properties (single scattering albedo,backscatter fraction, mass scattering efficiencies, the functional dependence of scatteringon RH) and aerosol mass distributions calculated from chemical transport models.Aerosol sampling during TexAQS/GoMACCS 2006 will be used to validate and refinethe ability of chemical transport models to define the three dimensional aerosoldistribution in this region (see following section on Validation of Forecasting Models).
3. How does the aerosol chemical composition affect the humidity dependence ofaerosol light scattering?
Strategy: Compare directly measured f(RH) (extinction and scattering) with valuescalculated from aerosol size distributions and chemical composition. Compare f(RH)values during periods of different organic mass fraction. Compare aerosol extinction atthe surface measured by several techniques.
A major finding during NEAQS 2004 was that f(RH) (extinction and scattering) was afunction of the POM mass fraction. This needs to be further studied under differentemission and meteorological conditions. It will also be critical to explore organicspeciation to determine what compounds are controlling this RH dependency.

4. What are the dominant aerosol chemical components affecting aerosol lightscattering (haze)?
Strategy: Calculate aerosol mass fractions and mass scattering fractions using multiplelinear regression and Mie modeling approaches.
Organic aerosols dominated the total sub-micron aerosol mass and light scattering in themarine boundary layer off the New England coast during the summer of 2002 (Bates etal., 2005). This situation is not characteristic of aerosols downwind of Asia or Europe(Quinn and Bates, 2005). An understanding of the dominant aerosol mass and scatteringfractions is critical for determining the health and radiative (e.g. water uptake, cloudnucleating properties) impacts of the aerosol and to develop mitigation strategies ifneeded.
5. What is the amount of light absorbing aerosol over Texas and the Gulf of Mexico?
Strategy: Measure the absorbing component of the aerosol at surface stations and withairborne in-situ and remote sensing instruments.
The deployment of numerous instruments that will measure both aerosol chemicalcomposition and optical properties will enable assessment of the prevalence of lightabsorbing aerosol in the region and its spatial and temporal variability. This will provideinformation on an optical parameter crucial for assessment of aerosol radiative forcing,namely the single scatter albedo.
Strategy: Measure/calculate clear sky radiative forcing under a variety of conditions(e.g. downwind of different point and regional sources; at various altitudes and distancesfrom shore; at different times of day; under different meteorological conditions).Compare aerosol optical depth spectra measured by sunphotometers (surface andairborne) and retrieved from satellite radiances. Compare radiative fluxes determinedfrom shipboard, aircraft, and satellite sensors (clear sky column closure). Compare clearsky forcing derived from models using measured aerosol properties and flux radiometers.Compare single scattering albedo measured at the surface and aloft with that derivedfrom airborne sunphotometer and solar spectral flux measurements. Integrate the resultsof these measurements/comparisons to assess the regional clear-sky direct radiativeforcing (c.f., Figure 10).
The radiative impacts of aerosols are particularly high in regions downwind of sources,where diurnally averaged clear sky surface forcing range up to 30 Wm-2 (Russell et al.,1999; Ramanathan et al., 2001; Conant et al., 2003). To date direct measurements of
6. What is the direct (clear-sky) radiative impact of the aerosols in the study regionover of Gulf of Mexico?

clear-sky radiative forcing have not been made over the Gulf of Mexico.TexAQS/GoMACCS 2006 will provide an opportunity to combine radiative flux andaerosol optical depth measurements at the surface, within the atmospheric column andfrom satellite. In 2006 a number of satellite sensors will be able to provide aerosol datafrom space. To reap the maximum benefit from these satellite measurements it is criticalthat we test and validate these measurements with in-situ and lower atmosphere/surfacebased column measurements (Diner et al., 2004). These measurements duringTexAQS/GoMACCS 2006 can be made under a variety of aerosol/meteorologicalconditions over the Gulf of Mexico. This will likely be the first multi-platform integratedvalidation study for many of these new sensors.
Participants and PlatformsNOAA and their extramural partners will instrument and deploy the RV Ronald H. Brownand one or two small aircraft that are devoted to aerosol radiation studies. The NOAAWP-3 will be devoted primarily to process studies during TexAQS/GoMACCS but willparticipate in some multi-aircraft/ship experiments. The in situ and suborbital remotesensing measurements will be guided in the field with a hierarchy of model products andsatellite observations.
Figure 10. Schematic of platform deployment for measurements of the clear-sky radiative effect ofaerosols.
Deployment Strategy (regional characterization and direct radiative forcing)

In situ and column measurements of aerosol properties will be made continuously aboardRonald H. Brown in a variety of air masses to assess the effect of transport andtransformation on these properties. Chemical forecast models and lidars (surface,aircraft and satellite (CALIPSO) will be used to determine the location and verticaldistribution of aerosol plumes for targeted multiplatform column closure experiments.The ship and aircraft (c.f., Figure 10 and Figure 11) will be positioned to make in situmeasurements (c.f., Table 1) of aerosol size distributions, chemical composition, f(RH),and scattering and absorbing properties within the plumes at the surface (ship) and aloft(aircraft). Aerosol optical depth will be measured at the surface (ship), verticallyresolved within the atmosphere (aircraft and ship lidars) and at the top of the atmosphere(satellite). In addition, downwelling radiative fluxes will be measured at the surface(ship), up- and downwelling radiative fluxes will be measured above and below aerosollayers aloft (aircraft) and upwelling radiative fluxes will be measured from space(satellite). Measurements will be coordinated with satellite overpasses (Terra, Aura,CALIPSO). Combining these measurements will allow for a complete characterization ofthe aerosol at the surface and throughout the lower troposphere and a determination ofclear sky forcing through a variety of techniques (Conant et al., 2003, Kahn et al., 2004;Schmid et al., 2003).
Figure 11. Illustration of the flight patterns used to reveal aerosol radiative effects and relate them toaerosol properties determined from space, air, land and sea. (1) Survey Vertical Profile. (2) Minimum-Altitude Transect. (3) Parking Garage. (4) Above-Cloud Transect.
The deployment strategy illustrated in Figure 11 can address the following experimentsthat will be required to (1) quantify aerosol properties and the direct aerosol radiativeforcing and (2) intercompare and/or verify critical measurements:� Measure/calculate aerosol properties and clear sky radiative forcing under a variety of
conditions (e.g. downwind of different point and regional sources; at various altitudes

and distances from shore; at different times of day; under different meteorologicalconditions).
� Compare directly measured aerosol scattering, backscattering, and absorptioncoefficients with those calculated from the measured size distributions and chemicalcomposition (local closure).
� Compare directly measured f(RH) (extinction and scattering) with values calculatedfrom aerosol size distributions and chemical composition.
� Compare measured aerosol properties with those determined from chemical transportmodels.
� Compare aerosol extinction at the surface measured by several techniques� Comparison of aerosol optical depth spectra measured by sunphotometers (surface
and airborne) and retrieved from satellite radiances� Compare radiative fluxes determined from shipboard, aircraft, and satellite sensors
(clear sky column closure)� Compare clear sky forcings derived from models using measured aerosol properties
and flux radiometers.� Compare single scattering albedo measured at the surface and aloft with that derived
from airborne sunphotometer and solar spectral flux measurements.� Integrate the results of these measurements/comparisons to assess the regional clear-
sky direct radiative forcing.

Table 1. Proposed measurements and platforms for aerosol characterization and directradiative forcing studies.
CATEGORY Parameters to Measure PlatformRHB Plane* Satellite
AerosolChemistry vs Size
Anions and cationsElemental carbon (EC)Organic carbon (OC)Organic carbon (speciated)Organic function groupsTrace elements
XXXOOX
OOO
Aerosol Physicala n d O p t i c a lMeasurements vsSize
Number vs size, accumulation & coarsemodes
Absorption (spectral)Scattering and backscattering (spectral)Aerosol light scattering hygroscopic growthAerosol light extinction hygroscopic growthAerosol hygroscopic growthLidar backscatter profiles
X
XXXXXX
O
OOO
RadiationMeasurements
Aerosol Optical Depth (spectral)Radiative fluxes, solar and longwave,
upwelling and downwelling (spectral)Direct, diffuse, and total irradiances (spectral
where possible)UV flux
XO
O
O
OO
O
OSatellite-retrievedFields of:
Aerosol Optical Depth (spectral)Radiative fluxes, solar and longwaveSurface albedo (spectral where possible)Aerosol vertical profiles
Terra (MODIS, MISR)Aqua (MODIS)
CALIPSOMeteorologicalMeasurements
Wind speed, direction, RH, T, pressure,cloud type and amount, visibility
XX
O
RHB – NOAA R/V Ronald H. BrownPLANE – small plane devoted to aerosol radiation studiesX – indicates NOAA in-house capabilityO – indicates needed measurement* Note: the NOAA WP-3 will include complementary aerosol instrumentation (Table 4,page 49) that may be used in this study.

Aerosol –Cloud Interaction (Indirect Effect) Science Questions
The overarching science question to be addressed is:
How do the continental aerosols over the Houston metropolitan area and the Gulf ofMexico affect cloud microphysical and macrophysical properties and how do cloudsaffect aerosol size distribution and chemical properties?
The Houston metropolitan area is characterized by a range of aerosol types, as discussedin the previous section on “Chemical Transformations”. The size distribution andcomposition of these particles are expected to vary greatly based on emissions, chemicalprocesses (e.g., gas-to-particle conversion and heterogeneous processes), and transport(advection, venting, and fumigation). This range of aerosol conditions will provide ameans of investigating the extent to which aerosol amount and composition effect cloudmicrophysics, and in particular cloud droplet number concentration. We will also explorethe effect of aerosol on cloud lifetime. By addressing the following specific sciencequestions our goal is to provide important information for evaluating the Twomey (1974)indirect effect, i.e., the effect of aerosol on cloud reflectance, and to reduce theuncertainty in cloud radiative forcing depicted in the IPCC chart (Figure 2).
Focused Science Questions:
1. How important is composition in determining the cloud condensation nucleatingproperties of an aerosol?
The literature contains a wealth of studies regarding the importance of aerosolcomposition, particularly with respect to inorganic, and more recently, water-solubleorganic compounds. In addition, chemical effects on droplet activation such as nitric acid,surfactants, and organic films have been shown to be of potential importance (e.g., Neneset al. 2002). The complexity of aerosol sources in the Houston area will afford anexcellent opportunity to study the importance of composition vis-à-vis droplet formation.
� Strategy: Compare measured CCN spectra with those calculated by thermodynamicmodels of aerosol activation, given measured aerosol size distribution and (size-resolved) chemical composition (CCN closure)
The cloud condensation nucleus spectrum is an important property of the aerosolpopulation and represents the number of particles that will grow to droplet sizes at aprescribed water vapor supersaturation. It is important to establish whether aerosol-CCNclosure experiments can be achieved under a range of aerosol conditions, including thosecontaining high organic aerosol fractions. Recent attempts at this closure (VanReken etal. 2003) during the CRYSTAL-FACE experiment were more successful than earlierattempts (e.g. Chuang et al. 2000) likely due to an aerosol composition dominated byammonium sulfate, and improvements in CCN instrumentation. During the LBA-CLAIRE 2001 experiment, Rissler et al. (2004) predicted CCN concentrations typicallyto within 25% of the measured CCN, in a region where biomass-burning aerosols were
common. Organic species may represent a large source of uncertainty in closure studies(Charlson et al., 2001).� Many aerosol-CCN comparisons implement Köhler theory andassume a mixture of a pure soluble salt, such as ammonium sulfate and insolublematerial, neglecting detailed treatment of organic materials. Theoretical and laboratorystudies indicate that organics may alter the activation characteristics of aerosol byreducing the mass accommodation coefficient of water (Bigg et al., 1986; Saxena et al.,1995; Feingold and Chuang, 2002) or by decreasing droplet surface tension (Facchini etal., 1999).�� Partially soluble aerosols (Shulman et al., 1996) and soluble gases(Laaksonen et al. 1998) may also contribute to uncertainties in the predictions of Köhlertheory when the concentrations or properties of such species are unknown.� The range ofaerosol and gas-phase conditions in the Houston area will provide further challenges forCCN closure.
2. How well do our models represent aerosol activation in real clouds?
� Strategy: Compare cloud drop number concentrations measured near cloud base withthose predicted by models of cloud activation given observed updraft velocity andCCN spectrum (CCN-cloud droplet number closure). Assess the importance ofchemical composition on CCN-cloud droplet number closure.
Aerosol-drop concentration closure is similar in concept to aerosol-CCN closure exceptthat model predictions of cloud drop concentration based on measured CCN (or aerosolsize and composition) and cloud updraft velocity are compared to those measured directlyby cloud probes. During the ACE-2 experiment, Snider and Brenguier (2000) predictedcloud droplet number concentrations from CCN measurements and the use of theTwomey (1959) parameterization and found them to be within a factor of two comparedto measured concentrations. During the CRYSTAL-FACE experiment, Conant et al.(2004) found agreement between predicted (based on subcloud aerosol size andcomposition, and updraft) and measured drop number concentrations to ~ 15%. It isexpected that closure is easier to achieve for particles of homogeneous and knowncomposition, but is more difficult to achieve for heterogeneous composition, or in thepresence of certain organic species. Closure is likely also easier to achieve in theunmixed cores of cumulus clouds such as those targeted by Conant et al. (2004). Closuremay be more difficult in stratocumulus clouds, where the advection of drops may obscurethe relationship between aerosol activation and drop number concentration.
An important part of this CCN-drop number closure effort is the measurement of thecloud updraft velocity that drives the production of supersaturation. For example, Leaitchet al. (1996) showed the importance of updraft in determining drop concentrations overthe Gulf of Maine. The natural variability in updraft velocity and associated variability insupersaturation means that measurement of a supersaturation spectrum is of moreimportance in this closure effort than in the aerosol-CCN closure. The targeting ofcumulus clouds with distinct updraft regions will facilitate this closure. Models willingest aerosol size distribution/composition and vertical velocity measurements fromaircraft and will compare measured and model-derived drop concentrations. Comparisonswill be made both for individual clouds and in a statistical sense by using probabilitydensity functions (pdfs) of input parameters and comparing pdfs of model output with

pdfs of observed parameters.
3. How well do dynamical boundary layer models represent real clouds?
� Strategy: Assess the ability of large eddy models to represent observed cloudmicrophysical processes, cloud dynamical and microphysical evolution, cloudlifetime and precipitation efficiency.
The measurements to be acquired during TexAQS/GoMACCS 2006 represent anopportunity to test various models of aerosol-cloud interactions within a dynamicalframework. Observations will provide constraints on boundary layer thermodynamicprofiles, wind velocity components, microphysical properties, cloud depth, andprecipitation formation. Visible satellite imagery will provide a geostationary view ofcloud fields at 1-km resolution. Large eddy simulation models that integrate coupleddynamics, aerosol and cloud microphysics, and radiation (e.g., Feingold and Kreidenweis2002), will be applied to a number of case studies. Model simulations will be used to testhypotheses pertaining to aerosol indirect effects, including aerosol effects on cloudfraction, cloud lifetime, and precipitation.
4. Can we detect evidence for cloud processing of aerosol and soluble gases?
� Strategy: Look for evidence of cloud processing in observed soluble gas-phasespecies and aerosol size distributions in pollution plumes, up and downwind ofclouds.
Cloud processing of aerosol and gases can manifest itself in various ways, e.g., aqueousproduction of sulfate that creates a characteristic signature in the aerosol size distribution(Hoppel et al. 1991), perturbations in gas-phase chemistry as soluble gases are absorbedby clouds, removal of aerosol and soluble gases via precipitation (e.g., Respondek et al.,1995), and new particle formation in the vicinity of clouds (e.g., Hegg et al., 1990).Aircraft measurements upwind and downwind of cloud fields affected by pollution willbe compared. When continental convective cloud formation is triggered by surfaceheating, pre-and post-cloud conditions will be compared. Convective redistribution ofaerosol and gases by shallow cumulus clouds (a few km deep) will also be explored.Large eddy models will be brought to bear on these problems using trace gas and soluble-aerosol tracking tools.
5. Can we detect evidence for cloud suppression by absorbing aerosol?
� Strategy: Identify the role of absorbing aerosols in reducing cloud development.
Absorbing aerosol particles such as black carbon have been linked to reductions in cloudfraction and cloud liquid water path (Grassl 1975; Hansen et al. 1997; Ackerman et al.2000; Koren et al. 2004) primarily through heating and stabilizing of the boundary layer.The importance of these absorbing aerosol particles is strongly linked to the verticallocation of the particles (Johnson et al. 2004) and, over land, to the response of surfacelatent and sensible heat fluxes to the existence of the aerosol (Feingold et al. 2005).

During TexAQS/GoMACCS 2006 characterization of aerosol will include measurementsof aerosol absorption profiles and calculation of associated heating rates. Assessments ofcloud amount will be performed using remote sensing tools such as GOES 1-kmresolution visible imagery. Other relevant measurements such as atmospheric temperatureand humidity soundings will be used in the analysis. Large eddy models that represent theradiative effects of absorbing aerosol will be used to simulate case studies.
Deployment Strategy (indirect radiative forcing):
The primary focus for the TexAQS/GoMACCS 2006 aerosol indirect effect experimentwill be on in-situ airborne measurements using a yet-to-be-identified small aircraft. Theaircraft will be outfitted to provide a complete set of measurements pertaining to aerosolsize, composition (inorganic and organic), hygroscopic growth and optical properties.Accurate characterization of cloud droplet size distributions will be a priority.Simultaneous measurements of updraft velocity and important meteorological parameterswill be essential to this effort. Measurement requirements are listed in Table 2.
The small aircraft will perform independent missions associated with the science goalsand will follow flight patterns that sequentially sample sub-cloud and in-cloud air.Specific flight plans will depend on the science questions being addressed. If possible,the small aircraft will coordinate with the NOAA WP-3D, which will havecomplementary aerosol and gas-phase measurement capabilities. This will enablestacked, column-type measurements, with the NOAA WP-3D focusing oncharacterization of sub-cloud aerosol while the small aircraft characterizes the drop sizedistributions. These stacked aircraft flights will simultaneously measure sub-cloud in-situaerosol properties used to calculate CCN (physical size distribution, chemical sizedistribution, f(RH)), CCN, cloud droplet number concentration, drop size distributions,updraft velocities and liquid water content.
It is expected, based on prior climatological studies, that cumulus clouds will developover the continent in association with daytime heating and moisture associated with thesea breeze. Flight planning will proceed accordingly and with consideration of thevariability (in amount and composition) of local aerosol pollution sources. We will planfor overflights of the R/V Ronald H. Brown to assist with column closure experimentspertaining to aerosol direct radiative forcing and to target clouds over the Gulf of Mexico.Overflights of ground stations will be made as necessary. The preferred cloud-samplingmode will be a statistical one where multiple clouds at similar stages of development aretargeted. Level legs below cloud and just above cloud base will be the preferred mode forthe CCN and droplet number closure studies. Independent CCN closure studies will bemade at surface sites such as the R/V Ronald H. Brown, since they do not require cloudsampling.

lidar
extinction profiles
Below cloud
measurements of
aerosol size/compositionand optical properties
Figure 12: Schematic of deployment strategy for Indirect Radiative Effects.
In cloud measurements of aerosol
and drop size distributions, aerosol
composition, droplet residuals,
optical properties
Below cloud and surface
measurements of aerosolchemical, physical, and
optical, properties, f(RH)

Table 2. Proposed measurements and platforms for aerosol indirect radiative forcingstudies.
CATEGORY Parameters to Measure PlatformRHB PLANE* SATELLITE
AerosolChemistry v Size
Anions and cationsElemental carbon (EC)Organic carbon (OC)Organic carbon (speciated)Trace elementsOrganic functional groups
XXXOXO
OOO
Aerosol/CloudMicrophysical andOpticalMeasurements vsSize
Number vs size, nucleation, Aitken,accumulation &coarse modes
Absorption (spectral)Scattering and backscattering
(spectral)Aerosol light scattering hygroscopic
growth (f(RH))CCNCloud drop size distributionCloud water content and surface areaDroplet residual properties (including
chemistry)Lidar backscatter profiles
X
XX
X
X
X
O
OO
O
OOOO
RadiationMeasurements
Aerosol Optical Depth (spectral)Cloud optical depthCloud reflectanceRadiative fluxes, solar and longwave,
upwelling and downwelling(spectral where possible)
Direct, diffuse, and total irradiances(spectral where possible)
UV fluxSurface Albedo
X OOOO
O
O
Terra (MODIS, MISR)Terra (MODIS, MISR)Terra (MODIS, MISR)Terra
Aqua (MODIS)MeteorologicalMeasurements
Wind speed, direction, RH, T,pressure
Cloud type and amount, visibilityUpdraft velocity
X
X
O
OO
RHB – NOAA R/V Ronald H. BrownPLANE – small plane devoted to aerosol-cloud-radiation studies;* Note: the NOAA WP-3 will include complementary aerosol instrumentation (Table 4,page 49) that may be used in this study.X – indicates NOAA in-house capabilityO – indicates needed measurement

Evaluation of Forecast Models
RelevanceThe effective management of the Nation's air quality requires a robust and reliable predictivecapability. In addition, reliable air quality forecasts that provide sufficient warning of futureadverse air quality provide a means for the public to minimize exposure. In 2004 NOAA initiatedan air quality forecasting capability for the northeastern U.S. This system is being extended to theentire country. To be successful this system must combine an adequate understanding of the basicchemical and dynamical processes that determine atmospheric composition, reliable emissioninventories, dependable forecast models, and an adequate monitoring network that providesinformation needed to initialize the models.
An essential component of the system is the development of adequate model systems that synthesizeour current understanding of atmospheric transport, emissions, chemical, and physicaltransformations of key pollutants and their precursors. During the 2006 field study, NOAA willdeploy two prototype air quality forecast models that can provide operational air quality forecasts.The evaluation of these models with data collected in the 2006 field study will allow modeldevelopers valuable insight concerning the applicability of the various model components thatcomprise the air quality forecast model.
In addition to goals aimed at the development of operational air-quality forecasting models, thestudy in 2006 will allow informal comparison of forecasts made by regional air-quality models withchemical/transport models that operate at hemispheric and global scales. The information will allowconclusions to be drawn concerning the reliability of the different model simulations as a function ofaltitude and proximity to major sources.
Science questionsAir quality forecast models are essentially a computational synthesis of our collectiveunderstanding of how anthropogenic pollutants are emitted, transformed, and transported. The variousmeasurements and platforms that constitute the 2006 field study will provide diverse and rigoroustests of this basic understanding. A model-measurement comparison should not only characterizethe accuracy of the forecast models, but also identify elements of the models that limit theiraccuracy, and point the way to better forecasts. On the other hand, utilizing the predictedmeteorological and chemical fields from forecast models is an important component of a well-integrated field campaign. There is also an important time interval, during the first examination ofa day's measurements, when it is extremely valuable to principal investigators and experimentplanners to know what the forecast models predicted. These inherent synergisms between thefield experiment and the forecast models are the impetus and framework for the forecast componentof the 2006 study.
One of the important goals of the air quality component of the study will be to determine how wellcurrent state-of-the-art air quality models can forecast air quality in Texas. There is a twenty-yearprecedence for the statistical evaluation of ozone predicted by air quality models based primarily oncomparisons with the EPA AIRS air quality monitoring network. Model evaluation studies for
1. How well can air quality models forecast air quality in Texas?

aerosols and the precursors for aerosol and ozone are severely limited by a lack of data both aloftand at the surface. The 2006 study is unique in that it will provide a glimpse of both the gas-phaseoxidant component of air quality (i.e. ozone) and the particulate-phase components (i.e. PM2.5 andPM10 aerosol) over a large horizontal and vertical extent of Texas. This data set will thereforerepresent the centerpiece not only for model evaluation of ozone and its precursors, but for aerosolsand visibility in Texas as well.
Model evaluations are most meaningful when results from two or more independent models areavailable for coincident comparisons. The cross-evaluation of several air quality forecasts is animportant aspect of the 2006 evaluation study. There are fundamental differences in the basicformulation and meteorological foundations of the current operational and research air quality forecastmodels. Most models use off-line meteorology to drive pollutant transport, while other models suchas the WRF-CHEM use online, or lock step calculation of meteorology and pollution transport.The effect these different model formulations have on Texas air quality predictions justifies adetailed statistical evaluation between the various models. Other important elements of air qualityforecasts, such as the treatment of vertical transport and turbulent mixing, the photochemicalmechanism, and the sensitivity to horizontal resolution can only be compared and evaluated withinthe context of multiple model forecasts.
While the first science question addresses the end result of pollution formation and the raw outputof the model forecasts, it is important from a scientific perspective to determine how accuratelythe forecast models represent the individual processes controlling air pollution formation andtransport. Three broad subsets of processes are the focus of the field program.
Emissions estimates: Air quality forecast models are fundamentally limited by the accuracy of theemissions estimates of ozone and aerosol precursors imposed on the model. Conversely, theconsiderable resources and effort put into quantifying emissions from thousands of sources, andeventually deriving an emissions inventory, are not sufficiently matched by resources or effort putinto validation of the inventories. As discussed in the emissions evaluation section of this report, akey focus of the aircraft and ship-based platforms during the study is the evaluation of emissionsinventories on a relative as well as an absolute basis. Air quality forecast models comprise animportant computational intermediates that relate the emissions inventories to atmosphericconcentrations. This model evaluation study will provide the developers of the forecast models aclear picture of the ability of the models to capture both relative and absolute precursorabundances as they are reflected by and with in state uncertainties of the measurements. This allowsindirect evaluations of the magnitude and relative location of the sources in the emissions inventories.
Photochemical and physical transformations: Since ozone, and particulates to a large degree, aresecondary products formed during the oxidation and transport of primary emitted species, theaccuracy of air quality forecasts is highly dependent on the veracity of the model's varioustransformation processes. The aircraft and ship-based studies of individual sources and urban regionsplanned for 2006 lend themselves directly to the evaluation of the photochemical and/or aerosol
2. How accurately do the forecast models represent the individual processes controlling air
pollution formation and transport?

mechanisms within each forecast model. The forecast models predict key oxidants (OH, O3 in thedaytime, NO3 and N2O5 at night), as well as the various secondary products produced from primarynitrogen, sulfur, anthropogenic and biogenic hydrocarbon emissions that will be measured duringthe field study. Comparisons between observed and modeled relationships among the varioussecondary and primary emitted species in combination with oxidant abundances will allow bothquantitative and relative evaluations of the individual forecast models.
Meteorology and transport: The experience from the previous research outlined in the beginning ofthis report has unequivocally shown that the key to understanding pollution at the surface is tounderstand the processes controlling pollution aloft. The various upper-air platforms planned forthe study (aircraft, wind profilers, ozone and aerosol lidars, and doppler lidar) provide broadcoverage in terms of area, physical, and photochemical parameters with which to evaluate theforecast models. Since forecasting winds, convection, and vertical transport correctly areprerequisite to accurate air quality forecasts, it is particularly important to evaluate the model'sability to adequately characterize the various scales of transport, from near surface to synoptic andregional scales.
Deployment StrategyLessons Learned in 2004:The air quality forecast model evaluation component of theNEAQS/ITCT 2004 study serves as a useful framework for model evaluation planning anddeployment during 2006. Eight models with significant differences in terms of their basic structure,physical parameterizations, photochemical mechanisms, and emissions processing were evaluated.The model forecasts were compared with O3 measurements at several AIRNow sites, with O3 andits precursors taken at the four University of New Hampshire AIRMAP ground sites and aboard theR.V. Ronald H. Brown, and with upper-air measurements from wind profilers and RASStemperature sounders at several locations. Time series of preliminary observations and modelforecasts of O3, CO, reactive nitrogen, and a number of surface and upper-air meteorologicalparameters were posted on a web site in near real-time that was accessible to the planners,participants and forecasters involved with the field program, allowing a qualitative glimpse offorecast reliability relative to the observations. Model forecasts were also used as guidance for thedeployment of aircraft and the R.V. Ronald H. Brown. This allowed the interception of urbanplumes during the study period that proved useful for model evaluation.
In addition, the O3 forecasts from the eight models available during the NEAQS/ITCT 2004 studywere used to generate an ensemble O3 forecast and a bias-corrected ensemble O3 forecast thatwere also made available in near real time. Post-deployment analysis revealed that the ensembleforecasts of O3, as well as the ensemble forecasts of PM2.5, are statistically more accurate than forany individual forecast model. The TEXAQS/GoMACCS 2006 study would likewise realizethis added benefit of having the best available air quality forecasts by centralizing the results ofthe forecast models available during the 2006 study period.
Close collaboration between the individual air quality forecast groups and evaluation team isessential to the success of a formal evaluation study. A pre-deployment consensus on evaluationprotocol, model domains, common data sets and model products will be necessary. One of thelessons from the NEAQS/ITCT 2004 study is that a large uncertainty in explaining modeldifferences would be eliminated if the emissions inventory were consistent between the models. It
is highly recommended that a common emissions inventory for seven ozone and particulateprecursors (NOx, CO, VOC, SO2, PM10, PM2.5, and NH3) be made available to those forecast andmodeling groups involved in the study to insure compatibility between different models anddifferent model resolutions. Close coordination with TCEQ and the University of Houston willbe needed to adequately incorporate the best available emissions estimates for Texas into thevarious forecast models.
Regional Air Quality Forecast Models: The 2006 study will involve a real-time comparison phasebased on the preliminary field measurements, a post-field study phase where evaluations areperformed for the entire summer based on the preliminary measurements, and a final evaluationphase based on finalized, quality assured data. It is anticipated that models will be run during2006 to evaluate skill at predicting ozone photochemistry and PM10 and PM2.5 aerosol concentration.Forecasts will be available at several model resolutions. Nested domains of 2 and 6 km centeredover Texas within a 24 km grid covering the entire U.S. for the WRF-CHEM model are currentlybeing considered. Forecasts from the NCEP/NWS model (either ETA/CMAQ or WRF-NMM/CMAQ) at 12 km resolution will also be available. The TAMU/UH (Texas A&MUniversity/University of Houston) air quality forecast model would also be operational duringthe summers of 2005 and 2006. These three regional-scale forecast models are high prioritiesbecause of their spatial detail, the rigor of the basic physics and dynamics, and the importancethey serve as operational or community based forecast models.
Additional Air Quality Models: At least two other regional scale air quality forecast modelsoperational during ICARTT/NEAQS-2004 are also expected to be available during 2006. Theseinclude the BARON AMS, Inc. MAQSIP-RT model and the University of Iowa STEM regionalmodel, which both operate multiple forecasts using different horizontal resolution. A number ofhemispheric to global scale models that participated in ICARTT/NEAQS in 2004 are also expectedto be operational during TEXAQS/GoMACCS in 2006. These include the Harvard UniversityGEOS-CHEM model, the MOZART model from GFDL/NOAA, the University of Iowa long-rangetransport model, and the FLEXPART trajectory based model of Andreas Stohl. The coarsehorizontal resolution and scale of these models are best suited for intercontinental transport studies,but they naturally include Texas as a source region. These models will therefore provideadditional points of comparison for the observational platforms, albeit without the detail of theregional AQ forecast models. These models also include Texas as a receptor region to variousbiomass-burning and anthropogenic sources occurring well outside the Texas study area. Theytherefore have the potential to serve as a valuable link in the comparison of regional versus long-range impacts to the visibility and air quality within Texas.
Model Evaluation: During ICARTT/NEAQS-2004, real-time comparisons of model forecastswere provided to ground-based and shipboard observers. Plans are being made to provide similarforecasts during 2006 to facilitate model evaluation. In addition, comparisons of model forecastresults with the aircraft platform(s), and comparisons of model forecast aerosol fields with theobservations will be undertaken. The Aeronomy Laboratory and the Environmental TechnologyLaboratory will provide the software, hardware, and personnel to assume these additional tasks.
The post-analysis of model forecasts is scientifically the most important aspect of the evaluationstudy. Model performance will be judged using a quantitative, statistical framework with

sampling throughout the entire ozone season . The air quality forecasts acquired during the studywill be archived in a central location for convenient post-study analysis. NOAA will provide thesoftware, hardware, and personnel to assume these additional tasks.
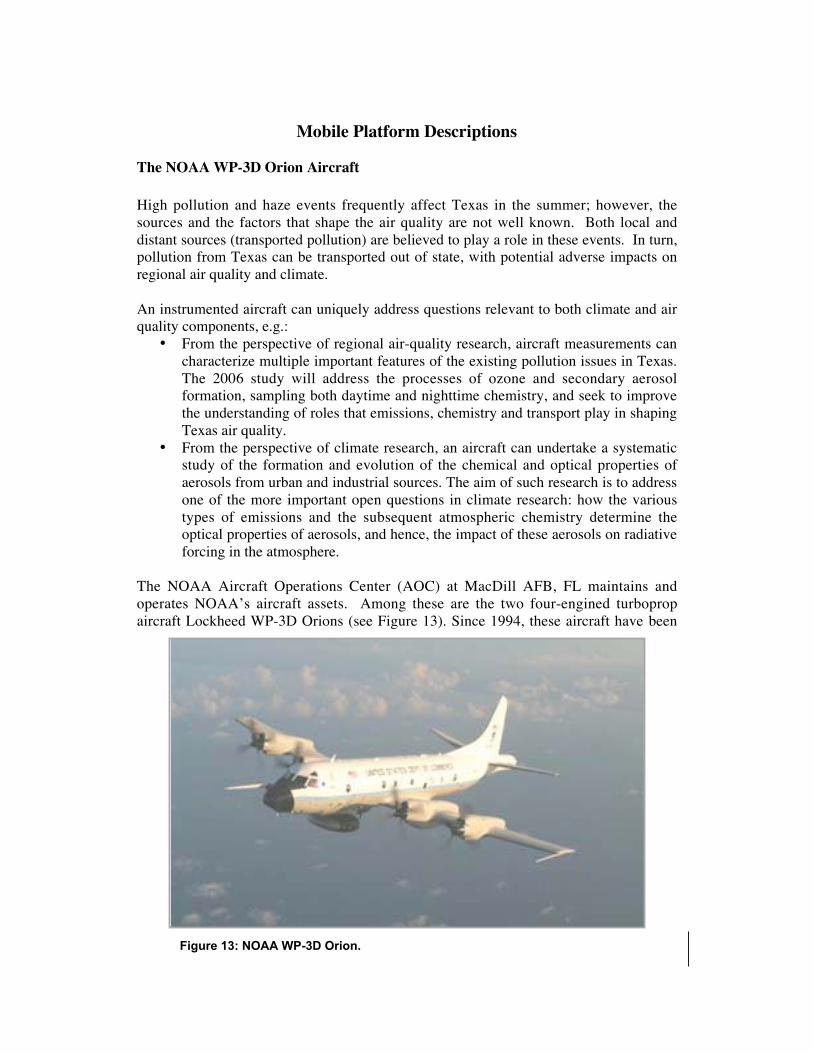
Mobile Platform Descriptions
The NOAA WP-3D Orion Aircraft
High pollution and haze events frequently affect Texas in the summer; however, thesources and the factors that shape the air quality are not well known. Both local anddistant sources (transported pollution) are believed to play a role in these events. In turn,pollution from Texas can be transported out of state, with potential adverse impacts onregional air quality and climate.
An instrumented aircraft can uniquely address questions relevant to both climate and airquality components, e.g.:
• From the perspective of regional air-quality research, aircraft measurements cancharacterize multiple important features of the existing pollution issues in Texas.The 2006 study will address the processes of ozone and secondary aerosolformation, sampling both daytime and nighttime chemistry, and seek to improvethe understanding of roles that emissions, chemistry and transport play in shapingTexas air quality.
• From the perspective of climate research, an aircraft can undertake a systematicstudy of the formation and evolution of the chemical and optical properties ofaerosols from urban and industrial sources. The aim of such research is to addressone of the more important open questions in climate research: how the varioustypes of emissions and the subsequent atmospheric chemistry determine theoptical properties of aerosols, and hence, the impact of these aerosols on radiativeforcing in the atmosphere.
The NOAA Aircraft Operations Center (AOC) at MacDill AFB, FL maintains andoperates NOAA’s aircraft assets. Among these are the two four-engined turbopropaircraft Lockheed WP-3D Orions (see Figure 13). Since 1994, these aircraft have been
Figure 13: NOAA WP-3D Orion.

temporarily converted into highly sophisticated airborne air chemistry and aerosolresearch platforms.
Platform
The operational characteristics and specifications of the NOAA WP-3D Orion aircraft are
summarized in Table 3.
Table 3: NOAA WP-3D Orion specifications and operational parameters
Parameter Specification
Length 116’ 10”
Span 99’ 8”
Fuselage diameter 11’ 3”
Ceiling when fully instrumented 25,000 feet
Research speed 200 knots indicated air speed
Range 1600+ nautical miles
Fuel burn 4500 - 6000 pounds per hour
Fuel load 58,000 lbs, including reserves
Science payload ~5000 lbs inside fuselage;additional instruments in external wing pods
The operating range is ample to permit sampling of the primary pollution source regions,
and to follow the transport and transformation of their emissions across Texas. Figure 14
shows the range of the WP-3D operating out of Ellington Field with a range of 700
nautical miles, assuming a return to Ellington.
The above-cited operational range is an estimate
and actual range is determined by how much
fuel can be loaded within the maximum aircraft
gross weight limit of 135,000 lbs. We anticipate
the aircraft to be ‘max zero fuel weight’ limited,
i.e., with the fuselage loaded to capacity and
additional instrumentation operated in external
stores (pods) under the wings.
The WP-3D aircraft are operated by an AOC
crew of seven (aircraft commander, pilot, flight
engineer, navigator, flight director/
meteorologist, and two technicians) and can
carry in addition several science personnel. The
planned payload relies on having the full aircraft
space and payload weight capacity available.
Instrumentation
Table 4 lists the proposed instrumentation package for the WP-3D duringTEXAQS/GoMACCS 2006. Figure 15 illustrates the proposed payload.
Figure 14. Operating range of theNOAA WP-3D Orion.

Table 4: Proposed 2006 scientific payload for the NOAA WP-3D Orion aircraft.
Species Instrument
Ozone (O3) NO/O3 chemiluminescence
Nitric oxide (NO) NO/O3 chemiluminescence
Nitrogen dioxide (NO2) UV photolysis & NO/O3 chemiluminescence
Total reactive nitrogen oxides (NOy) Au conversion & NO/O3 chemiluminescence
Carbon dioxide (CO2) Non-dispersive infrared (NDIR) absorption
In-situ volatile organic compounds (VOCs) Proton transfer reaction mass spectrometer
(PTRMS)
Canister VOCs1
Ethylene1
Sulfur dioxide (SO2) UV pulsed fluorescence
Carbon monoxide (CO) Vacuum UV resonance fluorescence
Formaldehyde (CH2O)1
PANs (PAN, PPN, etc.) Chemical ionization mass spectrometer (CIMS)
HNO3, NH3 CIMS
Hydroxyl radical (OH), peroxy radicals (HO2 +RO2)
1
NO3, N2O5 Cavity ring-down spectroscopy (CRDS)
Sulfuric acid (H2SO4)1
Aerosol bulk ionic composition1
Aerosol bulk composition Aerosol mass spectrometer (AMS)
Aerosol number and size distribution (0.003 - 8 �m) Nucleation mode aerosol size spectrometer(NMASS), laser optical particle counter (OPC), and
white light OPC
Total (dry), sub-�m (as f(RH)) aerosol extinction Cavity ringdown spectrometer
Dry sub-�m aerosol absorption (450, 550, 700 nm) Particle soot absorption photometer (PSAP)
Fraction of absorbing aerosols Soot incandescence
Cloud condensation nucleus (CCN) counter CCN spectrometer
Actinic flux Spectrally resolved radiometers
Broadband radiation Pyrgeometers and pyranometers
Water vapor (H2O) TDL absorption
Air temperature Platinum RTD
Dewpoint/frostpoint temperatures Dewpoint/frostpoint hygrometer1
Desired but not yet specified.

Figure 15. Proposed 2006 payload for the NOAA WP-3D Orion aircraft.
Operations
AOC operates the WP-3D aircraft under visual flight rules (VFR) and Instrument Flight
Ranging (IFR) conditions, with some restrictions. As the external wing stores lack icing
protection, flight into known icing conditions is not permitted. Minimum operating
altitudes are determined by local flight conditions, but cannot override FAA regulations.
Typical minimum daytime horizontal flight levels are 500 feet over land and 300 feet
over water, depending on local air traffic and obstructions. We have in the past sampled
over water for short periods at 150 feet. Over land, flying missed-approach patterns over
local airfields permitted a temporary decrease in minimum operating height.
Typical Flight Planning Schedule
For the past eleven years NOAA has used a WP-3D aircraft extensively for air chemistry
and aerosol research. From this experience an operational schedule for flight planning has
evolved.

On the day before a planned flight:
1300 hrs local:
• After discussions with the modelers the flight planner submits the requested flight
plan to AOC for review and for AOC coordination with the appropriate FAA and
military authorities.
• After submission this flight plan still can be fine-tuned to react to changes in
weather and/or model forecasts.
Late in the afternoon:
• Pre-flight flight readiness and flight goals briefing for all instrument PIs and the
project science team.
• The flight planner reviews the latest available weather and model forecast and
adjusts the flight plan if necessary.
On the day of the flight:
3-4 hrs before take-off:
• The flight planner reviews the latest weather and model forecast and adjusts flight
plan if necessary.
About 2 hrs before take-off:
• Flight crew (pilots, navigator, and flight director) are briefed on the final flight
plan, and last-minute adjustments are discussed.
• After the meeting the flight crew files the flight plan with the FAA and confirms
with military contacts if necessary.
Flight plans
Preliminary flight plans have been developed. In any given flight, the focus will be on
more than just one objective or science question. The flight plans will use the allotted
resources (i.e. flight hours) in the most prudent way by addressing as many questions
and/or objectives as possible on each flight.
The flights will reach into the suspected source regions to study the primary emissions of
point and urban sources by gathering information on the signatures of the primary
emission mix. This allows, by comparison with existing emissions inventories, to verify
them. In the downwind regime the flights will follow the plumes advected across the
study region, to study dispersion and chemical and physical conversions within the
plumes at progressing transport times.
Actual flight plans can only be finalized in the field according to the encountered
meteorology and transport regimes. Nevertheless, some flight strategies and patterns have
been developed over the years and they will be used in the TEXAQS/GoMACCS 2006
study. Since several objectives and questions will be addressed in each flight, several
strategies and patterns might be combined.

Coordination with Lidar aircraft
The capabilities on the in-situ (WP-3D) and the remote sensing NOAA Twin Otter
(Lidar) aircraft strongly complement each other for many kinds of studies. Therefore,
flights on any given day will be coordinated between the flight planners of the WP-3D
and the Lidar aircraft during the flight planning process in the field to take advantage of
having these two valuable resources available simultaneously.

NOAA Twin Otter
OverviewAn important component of the 2006 experiment will be a differential absorption lidar(DIAL) deployed on a NOAA Twin Otter aircraft for remote sensing of local andregional ozone and aerosol distribution. Previous field studies have benefitted greatlyfrom airborne measurements of ozone and aerosol profiles to characterize the three-dimensional structure of pollution plumes and measure variability in mixing layer height(Alvarez et al, 1998, Senff et al, 1998, Banta et al, 1998, Banta et al, 2005). Airborneremote sensing enables tracking of plumes from urban areas and point sources,identification of isolated regions and layers of high ozone concentration, observations ofatmospheric layering as characterized by aerosol structure, and investigation of localmeteorological effects such as sea breezes and urban heat islands on pollution transportand mixing.
Inclusion of a remote sensing aircraft will also provide information on the three-dimensional representativeness of in situ observations made on the WP-3D and otheraircraft during those periods when the flight tracks of the two aircraft sample the sameregion.
Aircraft PlatformThe new ozone/aerosol instrumentation will be mounted on the NOAA DeHavillandTwin Otter. The NOAA remote sensing aircraft will tentatively be based at Ellington AirForce Base and will fly unpressurized at approximately 3-4 km above ground level formissions extending over approximately four to five hours. Relevant operatingspecifications for the aircraft during the experiment are expected to be as follows:
• Ground speed: 65 m s-1
• Endurance: 4-5 hours• Range: 550 nm• Over-water capability• Capability for multiple flights/day
On-board sensorsFlight plans for the Twin Otter will specifically address scientific objectives associatedwith the transport and evolution of pollution plumes, boundary layer structure, air qualityforecasting, and intercomparison of observations. The primary instrument to be deployedon the aircraft will be a new down-looking ozone/aerosol DIAL system, which producesprofiles of ozone and aerosol structure in the boundary layer and lower troposphere. Thelidar system employs three tunable wavelengths in the ultraviolet spectral region between280 and 300 nm. Each wavelength is characterized by a different ozone absorption cross-section, enabling measurements to be made over a wide range of ozone values. Themulti-wavelength capability of the system also provides flexibility for the correction ofpotential errors in ozone calculations caused by aerosol backscatter gradients. Ozonemeasurements will be made at a horizontal resolution of approximately 600 m andvertical resolution of 90 m. Precision of the ozone measurement is expected to vary from

about 3 to 10 ppbV, depending on range and amount of intervening ozone. The longestof the three wavelengths at approximately 300 nm, which is least absorbed by ozone, isused to measure aerosol backscatter profiles, after correction for ozone extinction.Resolution for the aerosol measurements will be 600 m horizontally and 15 m vertically.Onboard the aircraft, a global positioning system provides a precise location for eachlidar measurement, as for the plume tracking measurements in Figure 5 in the Transportand Mixing section. Data are analyzed and displayed on board the aircraft in real time,enabling adjustment or changes in the science mission if unexpected features or eventsare observed.
A key measurement objective for the Houston study will be the characterization of thestructure of the boundary layer, including mixing layer height. Mixing layer height isestimated from the gradient of the lidar aerosol signal, as indicated in Figure 16.Investigation of mixed layer properties over different surfaces and the relationship withozone concentrations will be important for understanding layering, transport, and verticalmixing. To provide additional information on surface properties, we also plan to mounta downward looking infrared radiometer on the aircraft alongside the ozone lidar tomeasure surface skin temperature.
At this time, we are investigating thefeasibility of incorporating adropsonde capability on the NOAATwin Otter. Dropsondes, particularlyover the ocean, can provideinformation on wind structureassociated with pollution layers,providing important information onthe potential source of plumesobserved distant from known sources.This decision will be based on theavailability of funding and onassurances that reliable dropsondescan be procured.
Figure 16: Vertical profile of lidar-observedaerosol backscatter showing a sharpchange in mixing layer height at the Gulf ofMexico coast.

NOAA Research Vessel Ronald H. Brown
Transport of polluted air within the Gulf of Mexico plays an important role in shaping the
air quality in coastal Texas. These same pollutants can also affect the regional radiation
budget, as well as precipitation and the lifetime and extent of clouds. The polluted air is
a result of both re-circulation of pollution from urban areas within Texas and long-range
transport. Over the Gulf of Mexico the marine boundary layer (MBL) can act as a huge
chemical reactor, converting primary pollutants like nitrogen oxides and organics into
more toxic secondary pollutants like ozone and fine particles, which can be transported
back onto shore by the land-sea breeze circulation.
An instrumented ship is an ideal platform to study the meteorological and chemical
processes occurring off the coast of Texas and along the Houston and Galveston Ship
channels. A ship can be used to sample polluted air masses as they move offshore or
onshore and study the chemical transformations in the polluted marine boundary layer.
Indeed, deployment of R.V. Ronald H. Brown (see Figure 17) during NEAQS 2002 and
NEAQS/ITCT 2004 demonstrated unequivocally the value of this platform for providing
unique sampling opportunities, unlike those from on-shore sites, which yield data that are
frequently difficult to interpret due to contamination by local land-based sources, and
unlike those from aircraft, which have short duration and result in limited data sets.
Figure 17. The NOAA Research Vessel Ronald H. Brown
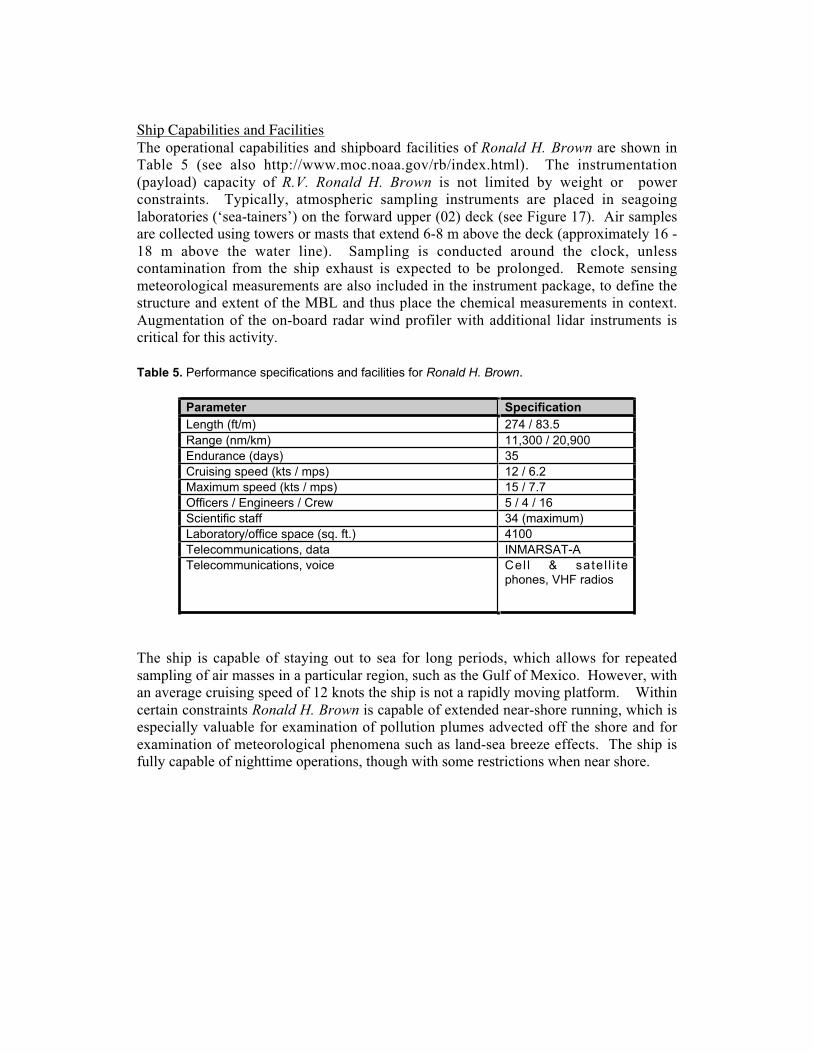
Ship Capabilities and FacilitiesThe operational capabilities and shipboard facilities of Ronald H. Brown are shown in
Table 5 (see also http://www.moc.noaa.gov/rb/index.html). The instrumentation
(payload) capacity of R.V. Ronald H. Brown is not limited by weight or power
constraints. Typically, atmospheric sampling instruments are placed in seagoing
laboratories (‘sea-tainers’) on the forward upper (02) deck (see Figure 17). Air samples
are collected using towers or masts that extend 6-8 m above the deck (approximately 16 -
18 m above the water line). Sampling is conducted around the clock, unless
contamination from the ship exhaust is expected to be prolonged. Remote sensing
meteorological measurements are also included in the instrument package, to define the
structure and extent of the MBL and thus place the chemical measurements in context.
Augmentation of the on-board radar wind profiler with additional lidar instruments is
critical for this activity.
Table 5. Performance specifications and facilities for Ronald H. Brown.
Parameter Specification
Length (ft/m) 274 / 83.5
Range (nm/km) 11,300 / 20,900
Endurance (days) 35
Cruising speed (kts / mps) 12 / 6.2
Maximum speed (kts / mps) 15 / 7.7
Officers / Engineers / Crew 5 / 4 / 16
Scientific staff 34 (maximum)
Laboratory/office space (sq. ft.) 4100
Telecommunications, data INMARSAT-A
Telecommunications, voice Cel l & satel l i tephones, VHF radios
The ship is capable of staying out to sea for long periods, which allows for repeated
sampling of air masses in a particular region, such as the Gulf of Mexico. However, with
an average cruising speed of 12 knots the ship is not a rapidly moving platform. Within
certain constraints Ronald H. Brown is capable of extended near-shore running, which is
especially valuable for examination of pollution plumes advected off the shore and for
examination of meteorological phenomena such as land-sea breeze effects. The ship is
fully capable of nighttime operations, though with some restrictions when near shore.

The instrumentation proposed for deployment on RHB (see Table 6) will provide
characterization of the atmospheric dynamics, gas-phase chemistry, aerosol chemical,
physical, and optical properties, and radiation fields in this complex environment.
Central to this field deployment will be techniques that yield information on the
interactions between gas-phase and aerosol chemistry and how the evolving aerosol
properties affect the radiation fields. A critical requirement is understanding how these
chemical effects are influenced by transport to, from, and within the MBL. Thus
particular emphasis has been placed on the need to understand the dynamical structure of
the MBL at large scales via remote sensing instruments. Smaller scales will also be
studied with the addition of instrumentation to investigate the turbulence structure from
the surface layer to the top of the MBL. Coincident with this activity will be
measurements of chemical fluxes of CO2, and possibly O3.
Table 6. Proposed instrumentation for deployment on Ronald H. Brown.Parameter Method
Photolysis rates (j-values) Spectral radiometerOzone (O3) UV absorbanceOzone NO chemiluminescenceCarbon monoxide (CO) Nondispersive IRCarbon dioxide (CO2) Nondispersive IRSulfur dioxide (SO2) Pulsed UV fluorescenceNitric oxide (NO) ChemiluminescenceNitrogen dioxide (NO2) Photolysis/chemiluminescenceTotal reactive nitrogen oxides (NOy) Au tube/chemiluminescencePeroxyacyl nitric anhydrides (PANs) GC/ECDAlkyl nitrates (RONO2) GC/MSNitrate radical (NO3); Dinitrogen pentoxide (N2O5) Cavity ring-down spectrometryNitric acid (HNO3) Mist chamber/ICWater vapor (H2O) Nondispersive IRContinuous Speciation of VOCs PTR-MS/CIMSVOC Speciation GC/MSFormaldehyde (HCHO) CHD fluorimetryRadon (Rn) Radon gas decaySeawater/atmospheric CO2 Nondispersive IREnhanced measurement of radiative fluxes Spectral radiometersAerosol optical depth MicroTOPSIrradiance Portable Radiation Package (PRP)Size-resolved aerosol composition and gravimetric mass Impactors (IC, XRF, and thermal-optical OC/EC)OC/EC On-line thermal opticalIonic Aerosol Composition Particle In Liquid Sampler (PILS)-ICAerosol Size and Composition Aerosol Mass SpectrometerOrganic function groups FTIRAerosol scattering (400, 550, 700 nm) TSI Model 3563 NephelometerAerosol absorption (400, 550, 700 nm) Radiance Research PSAPAerosol number CNCAerosol size distribution Twin DMAs and an APSAerosol light scattering hygroscopic growth f(RH) Twin TSI 3563 nephelometersAerosol size hygroscopic growth g(RH) Tandem DMAsAerosol light extinction hygroscopic growth f(RH) Cavity ring-down spectrometerTotal and sub-micron aerosol extinction Cavity ring-down spectrometerOzone/aerosol vertical profiles O3/Aerosol Lidar (OPAL)Wind/temperature vertical profiles 915 MHz wind RadarHigh-resolution BL winds/aerosol Doppler Lidar (HRDL)Wind profiles/microscale turbulence C-band radarTemperature/relative humidity profiles RadiosondesSurface energy balance (fluxes) Eddy covariance (bow mounted)High resolution BL turbulence structure Doppler mini-Sodar

Ship Operations
Because the ship cannot rapidly deploy to different areas to take advantage of sampling
opportunities, meteorological forecasting is essential for planning ship operations.
Coordination of these forecasts (meteorological and air quality) with ship track planning
in 2004 was very successful. This activity will be augmented in 2006 by more frequent
communication between the ship and forecast personnel on shore. In addition extensive
coordination between the ship and the various aircraft will be required. Efforts will be
made to maximize opportunities for measurement comparisons between the ship and the
various aircraft.
A significant restriction on ship operations, and therefore ship track planning, is the need
for the relative wind to be forward of the beam of the ship in order to avoid sample
contamination from the ship exhaust. Accurate forecasting of surface winds is essential
for this; just as essential is having several sampling options available (see below). Since
this strategy worked very well during NEAQS/ITCT 2004, it will be expanded upon for
2006.
Figures 18 and 19 indicate the working area and intensive sampling area proposed for
R.V. Ronald H. Brown during TEXAQS/GoMOACCS 2006.
Ship Sampling Objectives
There are four major scientific objectives, each associated with unique, but necessarily
overlapping, sampling strategies.
Characterization of sources: Near-shore and ship canal survey tracks are planned under
conditions when polluted continental air is expected to be transported into the surface
marine layer (i.e. nighttime, early morning, or late day). Also, special effort will be made
to characterize marine vessel emissions (MVE).
Study of transport and transformation processes: A focus of the proposed research is the
study of the chemical and physical evolution of polluted air masses in the Gulf of
Mexico. When possible, plumes advected offshore will be sampled at successively
longer distances downwind to examine chemical transformations related to plume aging
in the MBL. Opportunities to sample well-aged plumes that have remained in the MBL
for several days should be possible. Also, since significant chemical transformations
occur at night, these studies of polluted air masses will occur during the entire diurnal
cycle. Of particular interest is how the chemical and physical evolution of aerosols
affects their optical properties.
Study of coastal impacts: Along-shore cruise tracks and transits up the Galveston ship
channel are planned to characterize the effects of the recirculation of air masses by the
sea-breeze/land-breeze circuit.
Study of radiative effects of aerosols: Cruise tracks are planned to examine aerosol
properties in both polluted and clean conditions. In-situ MBL measurements will be

coordinated with aircraft measurements and satellite overpasses to assess the direct and
indirect radiative effects of the aerosol.
Figure 18. Ronald H. Brown working area in the Gulf of Mexico (within red square).

Figure 19. Intensive operations area showing ship track through Galveston Bay and up theHouston ship channel (heavy red line).

Other Measurements
Ground-based MeasurementsUpper-air observationsEast Texas experiences a complex diurnal cycle of meteorology caused by its proximityto the Gulf Coast, large urban areas and other heterogeneous land-surface types thatproduce local circulations, and varying synoptic regimes experienced during differentseasons. A multi-season characterization of the meteorological processes controlling thestagnation and transport of atmospheric pollutants in and out of East Texas is, therefore,required in order to gain a better understanding of the region’s air quality. The long-termmeteorological measurements collected during TEXAQS/GoMACCS will also allowscientists to study how the mixing and transport mechanisms outlined in Section 2brespond to diurnal, seasonal, and annual cycles.
NOAA and partners in TEXAQS/GoMACCS will enhance the upper-air observingsystem in central and southeastern Texas by deploying seven integrated boundary layerobserving systems for a ~1.5 year extended observing period starting in April 2005 (c.f.,Fig. 20). Included in the plans for this network is a wind profiler deployed on an oilplatform in the Gulf of Mexico. The enhanced profiler network was designed to captureimportant transport corridors within East Texas. The 915-MHz Doppler wind profilers inthe enhanced network are of the type described by Carter et al. (1995). Theseinstruments provide continuous profiles of wind speed and wind direction in theboundary layer and lower free troposphere and derived mixing heights. Each land-basedprofiler will also include a radio acoustic sounding system (RASS) for temperatureprofiling. The vertical coverage of the wind profilers is typically 120 m to 4000 m,depending on atmospheric conditions, and the profiles are sampled with either 60-m or100-m vertical resolution. The vertical coverage of the temperature profilers is typically120 m to 1500 m, but degraded performance can be expected in high wind conditions. Inaddition, four of the profiler sites deployed by the NOAA Environmental TechnologyLaboratory will include a global positioning system (GPS) receiver for integrated watervapor measurements and a 10-m tower for characterizing surface meteorology (pressure,temperature, relative humidity, wind, precipitation, solar and net radiation). Additionalprofiler deployments may be added for the intensive observing period in 2006. Duringthis period, serial rawinsondes will be launched (by non-NOAA participants) in theHouston area at a site to be determined.
Hourly data from the existing and enhanced wind profiler networks will be available inreal-time via web sites hosted by NOAA. An interactive web-based profiler trajectorytool developed by the NOAA Environmental Technology Laboratory will also beavailable to help scientists document transport in the region and to help in the planningand execution of missions for the mobile platforms during the 2006 intensive.

-108 -106 -104 -102 -100 -98 -96 -94 -92
Longitude
26
28
30
32
34
36
Lati
tud
e
Boundary-layer profilers
Serial rawinsondes
Full tropospheric profilers
Boundary-layer profilers
NWS Rawinsondes
NEXRAD
Existing Upper-air Network
TexAQS-II Enhancements
Fig. 20. Regional map showing the locations of upper-air observing sites in the existingoperational network and enhancements to the network in central and southeast Texas thatwill be in place for TEXAQS/GoMACCS.

Satellite Observations
BackgroundRetrievals of aerosol and trace gas information from current research and operationalsatellites have great potential to assist in several of the TEXAQS/GoMACCS scienceobjectives. Instruments on NASA and NOAA satellites are currently able to observeseveral of EPA’s criteria pollutants (Table 7). While polar-orbiting satellites (e.g.,MODIS) provide coverage once a day globally, geostationary satellites (e.g., GOES)provide coverage over the continental United States once every fifteen minutes. Amultiple platform and sensor approach, integrating in situ and satellite data withmodeling, might be essential to address TEXAQS/GoMACCS science objectives.
Table 7. A list of NOAA and NASA satellites and their measurement capabilities.Satellite Platform:Web site
Instruments Some key data products VerticalResolution
NASA Aura:http://eos-aura.gsfc.nasa.gov
TESOMI
CO, CH4, O3, HNO3, NO2
O3, NO2, SO2, H2CO, aerosoloptical depth, aerosol type
Trop. column/4 kmTrop. column
NASA Aqua:http://eos-pm.gsfc.nasa.gov
MODIS*
AIRS*
AIRS*
AIRS*
Aerosol optical depthO3
COAerosol optical depth
Trop. columnUTLSTrop. columnTrop. column
NASA Terra:http://eos-am.gsfc.nasa.gov
MOPITTMISRMODIS*
COAerosol optical depthAerosol optical depth
Trop. columnTrop. columnTrop. column
NASA CALIPSOhttp://www.calipso.larc.nasa.gov
CALIOP Aerosol backscatter ratio Trop . ver t i ca lprofile
NOAA GOEShttp://www.ssd.noaa.gov/PS/FIRE/GASP/gasp.html
Imager Aerosol optical depth (30minute interval)
Trop. column(land and water)
NOAA N16, N17, N18http://www.osdpd.noaa.gov/PSB/EPS/Aerosol/Aerosol.html
AVHRR Aerosol optical depth Trop. column,(water only)
NOAA GOEShttp://www.orbit.nesdis.noaa.gov/smcd/emb/gsip/index.html
Imager Shortwave flux (hourly) Surface
NOAA GOES Imager UV (erythemal) flux (hourly) SurfaceNASAhttp://asd-www.larc.nasa.gov/ceres/ASDeceres.html
CERES Shortwave and longwaveflux
T o p o f t h eatmosphere;surface
*Available through NOAA in near real time

Although satellite data has some disadvantages compared with other means of observingozone and aerosols, the advantages of including satellite information currently outweighthe disadvantages. Accuracies of satellite retrieved aerosol optical depths and trace gasesare not as good as measurements made from ground because satellite retrievals tend tohave higher uncertainties. These uncertainties are associated with converting slantcolumn retrievals to column amounts and isolating the tropospheric column from the totalcolumn in the case of trace gases. For aerosol retrievals, difficulties in modeling aerosoltype and variability in surface reflectance lead to large uncertainties. Nevertheless, whilethe ability to measure trace gases and aerosols at the desired spatial resolution, temporalresolution, and accuracy might not be realized for several years, the benefits of exploitingthese measurements for air quality studies are so substantial that the validation requiredto exploit them should be pursued immediately. .
Satellite data of aerosols and trace gases have three potential applications for theTEXAQS/GoMACCS field campaign:Using the satellite data in near real time:
• Image loops (especially from GOES) for aircraft/ship flight deployment• Comparisons with in situ measurements• Assimilation into forward trajectory models to forecast plume location
Retrospective looks at the data collected during TEXAQS/GoMACCS:• Comparisons of satellite and ground/aircraft/ship based measurements of
various parameters• Validation of satellite retrievals using in situ measurements. Assessment of
uncertainties in the retrieval algorithms due to various assumptions.Reprocessing of satellite data with assimilated field measurements
• Extending the spatial (horizontal) dimension for studying problems such ascontributions of long range transport to local air quality
Using the satellite data in modeling studies:• Verifying chemistry and transport model forecasts with satellite data• Diagnosing sources of uncertainties in chemistry and transport models• Assimilating satellite data to improve initial and boundary conditions in the
models• Radiative effects of aerosols
These applications will cover various TEXAQS/GoMACCS research topics as describedbelow.
Emissions VerificationSatellite retrievals of CO, NO2, SO2, and H2CO will be a good data resource forquantifying emissions from various sources in Texas. Studies are already underway to
determine isoprene emissions from OMI H2CO data (Jacob et al., 2005). AIRS andMOPITT CO retrievals have thus far been primarily used to track plumes from biomassburning; plumes from biomass burning stay aloft and are easy to detect from satellites. Itis unclear how useful satellite measurements of CO can be to study urban/industrialemissions if CO remains close to the ground. However, studies can be carried out todetermine their usefulness, especially in combination of OMI’s light absorbing aerosolindex to characterize the source as diesel or gasoline. Satellite data have never been usedto study processes at such small spatial scales, and TEXAQS/GoMACCS will providethat opportunity. For the satellite community, these studies can be very beneficial, asthey will expose limitations in satellite retrievals and offer insights into neededimprovements in sensor technologies and algorithms, so that these kinds of routineapplications can be realized.
Long Range TransportSatellite data have been very useful in diagnosing long-range transport, primarily becauseit occurs in free troposphere and is easily detectable by satellites. We would like toaddress the issue of entrainment of pollutants transported from remote sources into theboundary layer, and the impact on local air quality. NASA will be launching CALIPSOin June 2005, which has a lidar that can detect tropospheric vertical profiles of aerosolbackscatter ratio. These measurements, combined with GOES, MODIS, OMI, and MISRaerosol optical depth retrievals, will be valuable in providing a three-dimensional look atpollution plumes. Additionally, integrating data from multiple sensors will optimize theinformation on aerosol type, and location in space (horizontal and vertical scale) and time(GOES aerosol observations have a refresh rate of 30 minutes).
Numerical ModelingNOAA’s National Weather Service has a mandate to issue nationwide hourly ozone (by2009) and PM2.5 forecasts (by 2014). The NWS has already begun issuing ozoneforecasts for the northeast and conducting experimental PM2.5 forecasts. It is currentlyusing the Eta-CMAQ modeling system and will soon migrate to the WRF model withintegrated meteorology and chemistry. Primary sources of uncertainty in model forecastsare uncertainties in intial/boundary conditions and emissions. Satellite data have thepotential to improve forecasts by providing more precise initial/boundary conditions. Insitu data collected during the TEXAQS/GoMACCS will also be useful in verifyingforecasts and diagnosing various sources of uncertainties. In addition, a retrospectiveanalysis of the TEXAQS/GoMACCS data from an integrated satellite-in situ-modelapproach will help to determine biases and errors in the air quality modeling system.
Aerosols and Radiative ForcingEstimating the radiative impact of aerosols requires concurrent aerosol and radiationmeasurements. The spatial (and temporal) variability of both quantities is readilyobserved by satellites. Aerosol optical depth (the primary factor affecting radiativeforcing) over the ocean has been retrieved operationally at NOAA/NESDIS for over twodecades. For example, AVHRR observations have been used to estimate the aerosolindirect effect for summertime stratiform clouds in the Northeastern Atlantic (Matheson,Coakley and Tahnk, 2004). Instruments flown on NASA satellites have also been

providing aerosol data: TOMS has the ability to estimate absorbing aerosols, and theMODIS instrument is capable of estimating aerosol optical depth both over land andocean in two different particle size regimes (fine and coarse modes). Thesemeasurements, coupled with top of atmosphere (TOA) and surface fluxes derived fromthe Clouds and the Earth’s Radiant Energy System (CERES) instrument on NASA’s EOSsatellites, have been used to estimate the direct radiative forcing of aerosols in theshortwave and longwave part of the electromagnetic spectrum. In addition, satellitederived radiative fluxes can be used to constrain models at the upper and lowerboundaries of the atmosphere for estimating the radiative impact of aerosols. However,before satellite measured fluxes can be used in assessing the radiative effects of aerosolsthey need to be thoroughly tested and evaluated with surface measurements; theirconsistency must also be characterized.
Validation of Satellite Retrievals using TEXAQS/GoMACCS DataNOAA/NESDIS will use data collected during TEXAQS/GoMACCS in evaluatingvarious assumptions made in our GOES and AIRS aerosol optical depth retrievalalgorithms. The aerosol algorithms use look-up tables created using a continental aerosolmodel, for which the single scattering albedo is ~0.9. This includes assumptions aboutaerosol type, size distribution, and refractive index. However, studies have shown thatthere are significant variations in aerosol type and size distributions over the CONUS.These variations are largely dictated by sources of pollution (e.g., forest fires,urban/industrial, or dust). Ground-based and aircraft-based observations of aerosolparameters (size distribution, vertical profiles, etc.) will be used to build new aerosolmodels and create new look-up tables. Sensitivity studies will be performed to test theimpact of measured aerosol information on GOES aerosol optical depth retrievals.
Infusing satellite Data into Environmental Applications (IDEA)IDEA is a two-dimensional, near real-time system that integrates MODIS aerosol opticaldepth, PM2.5 measurements, meteorological data, and models for use by EPA and stateand local forecasters in monitoring and predicting PM2.5 concentrations for publicnotification (Al Saadi et al., 2005). IDEA was developed in a cooperative projectbetween NOAA, EPA and NASA to provide real-time views of AOD from MODIS,compare these with the EPA AIRNow ground monitors, include trajectory informationfor forecast guidance, and provide a brief analysis for the public. Planning is underwayat NESDIS to transition IDEA to NOAA to run in an operational (24-hour, seven-day)environment. This product, if up and running at NOAA by summer of 2006, will be avery useful forecast tool to coordinate ship/aircraft deployment. If it is not ready tobecome operational at NOAA by 2006, arrangements can be made with University ofWisconsin (U. Wisc) to provide IDEA forecast guidance. It is currently running atWisconsin in a pre-operational mode.
Reference
Ackerman, A. S., O. B. Toon, D. E. Stevens, A. J. Heymsfield, V. Ramanathan, and E. J.Welton, Reduction of tropical cloudiness by soot. Science, 288, 1042-1047, 2000.Albrecht, B.A., Aerosols, Cloud Microphysics, and Fractional Cloudiness, Science, 245,1227-1230, 1989.
Ackerman, A. S., O. B. Toon, D. E. Stevens, A. J. Heymsfield, V. Ramanathan, and E. J.Welton, Reduction of tropical cloudiness by soot. Science, 288, 1042-1047, 2000.
Albrecht, B.A., Aerosols, Cloud Microphysics, and Fractional Cloudiness, Science, 245,1227-1230, 1989.
Al-Saadi, J., J. Szykman, B. Pierce, C. Kittaka, D. Neil, A. Chu, L. Remer, L. Gumley, E.Prins, L. Weinstock, C. MacDonald, R. Wayland, F. Dimmick, J. Fishman, ImprovingNational Air Quality Forecasts with Satellite Aerosol Observations, BAMS, in review
Alvarez, R. J., C. J. Senff, R. M. Hardesty, D. D. Parrish, W. T. Luke, T. B. Watson, P.H. Daum, and N. Gillani, Comparisons of airborne lidar measurements of ozone withairborne in situ measurements during the 1995 Southern Oxidants Study. J. Geophys.Res., 103, 31155-31,171, 1998.
Angevine, W., A.B. White, C.J. Senff, M. Trainer, R.M. Banta, and M.A. Ayoub, 2003:Urban-rural contrasts in mixing height and cloudiness over Nashville in 1999. J.Geophys. Res., 108 (D3) 4092, doi: 10.1029/2001/JD001061.
Banta, R.M., C.J. Senff, T.B. Ryerson, J. Nielsen-Gammon, L.S. Darby, R.J. Alvarez,S.P. Sandberg, E.J. Williams, and M. Trainer, 2005: A bad air day in Houston. Bull.Amer. Meteor. Soc., in press.
Banta, R. M., C. J. Senff, A. B. White, M. Trainer, R. T. McNider, R. J., Valente, S. D.Mayor, R. J. Alvarez, R. M. Hardesty, D. Parrish, and F. C. Fehsenfeld, Daytime buildupand nighttime transport of urban ozone in the boundary layer during a stagnation episode.J. Geophys, Res., 103, 22,519-22,544, 1998.
Banta, R.M., P.B. Shepson, J.W. Bottenheim, K.G. Anlauf, H.A. Wiebe, A.J. Gallant, T.Biesenthal, L.D. Olivier, C.-J. Zhu, I.G. McKendry, and D.G. Steyn, 1997: Nocturnalcleansing flows in a tributary valley. Atmos. Environ., 31, 2147-2162.
Bates, T.S., P.K. Quinn, D.J. Coffman, J.E. Johnson, and A.M. Middlebrook (2005), Thedominance of organic aerosols over the Gulf of Maine during NEAQS 2002. J. Geophys.Res., submitted.
Baumgardner, D., G. Raga, O. Peralta, I. Rosas, T. Castro, T. Kuhlbusch, A. John, and A.Petzold, Diagnosing black carbon trends in large urban areas using carbon monoxidemeasurements, J. Geophys. Res., 107, doi:10.1029/2001JD000626, 2002.

Bigg, E.K., Discrepancy between observation and prediction of concentrations of cloudcondensation nuclei, Atmos. Res., 20, 81-86, 1986.
Beirle, S., U. Platt, M. Wenig, and T. Wagner, Weekly cycle of NO2 by GOMEmeasurements: a signature of anthropogenic sources, Atmos. Chem. Phys., 3, 2225-2232,2003.
Brock, C.A., et al., Particle growth in plumes of coal-fired power plants, J. Geophys.Res., 107, 4155, doi:10.1029/2001JD001062, 2002.
Brock, C.A., et al., Particle growth in urban and industrial plumes in Texas, J. Geophys.Res., 108, 411, doi:10.1029/2002JD002746, 2003.
Carter, D.A., K.S. Gage, W.L. Ecklund, W.M. Angevine, P.E. Johnston, A.C. Riddle, J.S.Wilson, and C.R. Williams, 1995: Developments in UHF lower tropospheric windprofiling at NOAA’s Aeronomy Laboratory. Radio Sci., 30, 997-1001.
Charlson, R.J., S.E. Schwartz, J.M. Hales, R.D. Cess, J.A. Coakley, Jr., J.E. Hansen, andD.J. Hofmann, Climate forcing by anthropogenic aerosols, Science, 255, 423-430, 1992.
Chuang, P.Y., D.R. Collins, H. Pawlowska, J.R. Snider, H.H. Jonsson, J.-L. Brenguier,R.C. Flagan, and J.H. Seinfeld, CCN measurements during ACE-2 and their relationshipto cloud microphysical properties, Tellus, 52B, 843-867, 2000.
Charlson, R.J., J.H. Seinfeld, A. Nenes, M. Kulmala, A. Laaksonen, M.C. Facchini,Reshaping the theory of cloud formation, Science, 292, 2025-2026, 2001.
Charlson, R.J., S.E. Schwartz, J.M. Hales, R.D. Cess, J.A. Coakley, Jr., J.E. Hansen, andD.J. Hofmann, Climate forcing by anthropogenic aerosols, Science, 255, 423-430, 1992.
Conant, W.C., J.H. Seinfeld, J. Wang, G.R. Carmichael, Y. Tang, I. Uno; P.J. Flatau,K.M. Markowicz, and P.K. Quinn, A model for the radiative forcing during ACE-Asiaderived from CIRPAS Twin Otter and R/V Ronald H. Brown data and comparison withobservations,� J. Geophys. Res., 108(D23), 8661 doi:10.1029/2002JD003260, 2003.
Conant, W. C., T. M. VanReken, T. A. Rissman, V. Varutbangkul, H. H. Jonsson, A.Nenes, J. L. Jimenez, A. E. Delia, R. Bahreini, G. C. Roberts, R. C. Flagan, and J. H.Seinfeld, Aerosol-cloud drop concentration closure in warm cumulus, J. Geophys. Res.,109, D13204, doi:10.1029/2003JD004324, 2004.
Darby, L.S., 2005:� Cluster analysis of surface winds in Houston, Texas and the impact ofwind patterns on ozone.� J. Appl. Meteor, accepted pending revision.
Daum, P. H., L. Kleinman, D.G. Imre, L.J. Nunnermacker, Y.-N. Lee, S.R. Springston, L.Newman, and J. Weinstein-Lloyd, Analysis of the processingof Nashville urbanemissions on July 3 and July 18, 1995, J. Geophys., Res., 105, 9155-9164, 2000.

Derwent, R.G., and T.J. Davies, Modelling the impact of NOx or hydrocarbon control onphotochemical ozone in Europe, Atmos. Environ., 28, 2039-2052, 1994.
Diner et al., PARAGON – an integrated approach for characterizing aerosol climateimpacts and environmental interactions, Bull. Am. Meteor. Soc., 85, 1491-1501, 2004.
Facchini, M.C., M. Mircea, S. Fuzzi, R.J. Charlson, Cloud albedo enhancement bysurface-active organic solutes in growing droplets, Nature, 401, 257-259, 1999.
Feingold, G. and P.Y. Chuang, Analysis of the influence of film-forming compounds ondroplet growth: Implications for cloud microphysical processes and climate, J. Atmos.Sci., 59, 2006-2018, 2002.
Feingold, G., and S. M. Kreidenweis, Cloud processing of aerosol as modeled by a largeeddy simulation with coupled microphysics and aqueous chemistry. J. Geophys. Res.,107, D23, 4687, doi:10.1029/2002JD002054.
Feingold, G., H. Jiang, and J. Y. Harrington, 2005: On smoke suppression of clouds inAmazonia. Geophys. Res. Lett., 32, No. 2, L02804, 10.1029/2004GL021369.
Fenn M, E., J. S. Baron, E. B. Allen, H. M. Rueth, K. R. Nydick, L. Geiser, W. D.Bowman, J. O. Sickman, T. Meixner, D. W. Johnson, P. Neitlich, Ecological effects ofnitrogen deposition in the western United States, BIOSCIENCE 53 (4): 404-420 APR2003.
Grassl, H., Albedo reduction and radiative heating of clouds by absorbing aerosolparticles, Beitr. Physik der Atmos., 48, 199-210, 1975.
Haagen-Smit, A.J., Chemistry and physiology of Los Angeles smog, Ind. Eng. Chem.,44, 1342-1346, 1952.
Hansen, J., M. Sato, and R. Ruedy, Radiative forcing and climate response, J. Geophys.Res., 102, No. D6, 6831--6864, 1997.
Hegg, D. A., L. F. Radke, and P. V. Hobbs, Particle production associated with marineclouds, J. Geophys. Res., 95, 13,917-13,926, 1990
Hoppel, W. A., J. W. Fitzgerald, G. M. Frick, and R. E. Larson, Aerosol size distributionsand optical properties found in the marine boundary layer over the Atlantic Ocean, J.Geophys. Res., 95, 3659-3686, 1990.
Jacob D,.J., Paul I. Palmer, Tzung-May Fu, Dylan B. Millet, Dorian S. Abbot, SoleneTurquety, Kelly V. Chance and Thomas Kurosu, Top-down estimates of VOC emissionsfrom space-based HCHO column observations: from GOME to OMI, OMI Science TeamMeeting, Pasadena, CA, March 2005.

Johnson, B. T., K. P. Shine and P. M. Forster, The semi-direct aerosol effect: Impact ofabsorbing aerosols on marine stratocumulus, Q. Jnl. Roy. Meteor. Soc., 30, 1407-1422,2004.
Kahn, R., J. Anderson, T.L. Anderson, T. Bates, F. Brechtel, C.M. Carrico, A. Clarke,S.J. Doherty, E. Dutton, R. Flagan, R. Frouin, H. Fukushima, B. Holben, S. Howell, B.Huebert, A. Jefferson, H. Jonsson, O. Kalashnikova, J. Kim, S-W. Kim, P. Kus, W-H. Li,J.M. Livingston, C. McNaughton, J. Merrill, S. Mukai, T. Murayama, T. Nakajima, P.Quinn, J. Redemann, M. Rood, P. Russell, I. Sano, B. Schmid, J. Seinfeld, N. Sugimoto,J. Wang, E.J. Welton, J-G. Won, and S-C. Yoon. Environmental snapshots from ACE-Asia, J. Geophys. Res., 109,�D19S14, 10.1029/2003JD004339, 2004.
Kleinman, L.I., P.H. Daum, D.G. Imre, Y.-N. Lee, L.J. Nunnermacker, S.R. Springston,J. Weinstein-Lloyd, and J. Rudolph, Ozone production rate and hydrocarbon reactivity in5 urban areas: A cause of high ozone concentration in Houston, Geophys. Res. Lett., 29,10.1029/2001GL014569, 2003.
Koren, I., Y. J. Kaufman, L. A. Remer, and J. V. Martins, Measurement of the effect ofAmazon smoke on inhibition of cloud formation, Science, 303, 1342-1345, 2004.
Laaksonen, A., P. Korhonen, M. Kulmala, and R.J. Charlson, Modification of the Köhlerequation to include soluble trace gases and slightly soluble substances, J. Atmos. Sci., 55,853-862, 1998
Leaitch, W.R., C.M. Banic, G.A. Isaac, M.D. Couture, P.S.K. Liu, I. Gultepe, S.-M. Li,L. Kleinman, P.H. Daum, and J.I. MacPherson, Physical and chemical observations inmarine stratus during the 1993 North Atlantic Regional Experiment: Factors controllingcloud droplet number concentrations, J. Geophys. Res., 101, 29123-29136, 1996.
Liu, S.C., M. Trainer, F.C. Fehsenfeld, D.D. Parrish, E.J. Williams, D.W. Fahey, G.Hübler, and P.C. Murphy, Ozone production in the rural troposphere and the implicationsfor regional and global ozone distributions, J. Geophys. Res., 92, 4191-4207, 1987.
Lovett, G. M. and S. E. Lindberg, Dry deposition of nitrate to a deciduous forest,Biogeochemistry 2, 137-148, 1996.
Malm, W.C., J.F. Sisler, D. Huffman, R.A. Eldred, and T.A. Cahill, Spatial and seasonaltrends in particle concentration and optical extinction in the United States, J. Geophys.Res., 99, 1347-1370, 1994.
Marr, L.C., R.A. Harley, Modeling the effect of weekday – weekend differences in motorvehicle emissions on photochemical air pollution in Central California, Environ. Sci.Technol., 36, 4099-4106, 2002.

Martin, R.V., D.D. Parrish, T.B. Ryerson, D.K. Nicks, Jr., K. Chance, T.P. Kurosu, D.J.Jacob, E.D. Sturges, A. Fried, and B.P. Wert, Evaluation of GOME satellitemeasurements of tropospheric NO2 and HCHO using regional data from aircraftcampaigns in the southeastern United States., J. Geophys. Res., 109,doi:10.1029/2004JD004869, 2004.
Miguel, A.H., T.W. Kirchstetter, R.A. Harley, and S.V. Hering, On-road emissions ofparticulate polycyclic aromatic hydrocarbons and black carbon from gasoline and Dieselvehicles, Environ. Sci. Technol., 1998, 32, 450-455.
Neuman, J. A., L. G. Huey, R. W. Dissly, F. C. Fehsenfeld, F. Flocke, J. C. Holecek, J. S.Holloway, G. Hübler, R. Jakoubek, D. K. Nicks Jr., D. D. Parrish, T.B. Ryerson, D. T.Sueper, and A. J. Weinheimer, Fast-response airborne in situ measurements of HNO3during the Texas 2000 Air Quality Study, J. Geophys. Res., 107(D20), 4436,doi:10.1029/2001JD001437, 2002.
Nielsen-Gammon, J., 2002: Houston ozone concentrations and the role of the large-scalesea breeze circulation. Presentation, 4th Conf on Atmospheric Chemistry: Urban,Regional, and Global Scale Impacts of Air Pollutants. 13-18 January, Orlando FL.Amer. Meteor. Soc.; and personal communication.
Nunnermacker, L.J., L.I. Kleinman, D. Imre, P.H. Daum, Y.-N. Lee, J.H. Lee, S.R.Springston, L. Newman, and N. Gillani, Noy lifetimes, and O3 production efficiencies inurban and power plant plumes: Analysis of field data, J. Geophys. Res., 105, 9165-9176,2000.
Quinn, P.K. and T.S. Bates (2005), Regional aerosol properties: Comparisons from ACE1, ACE 2, Aerosols99, INDOEX, ACE Asia, TARFOX, and NEAQS, J. Geophys. Res.,in press.
Ramanathan, V., P.J. Crutzen, J.T. Kiehl, and D. Rosenfeld, Aerosols, climate, and thehydrological cycle, Science, 294, 2119-2124, 2001.
Ramanathan, V., and A.M. Vogelmann, Greenhouse Effect, Atmospheric SolarAbsorption, and the Earth's Radiation Budget: From the Arrhenius-Langely Era to the1990's, Ambio, 26 (1), 38-46, 1997.
Rasool, S. I., and S. H. Schneider, Atmospheric carbon dioxide and aerosols: Effects oflarge increases on global climate, Science, 173, 138-141.
Respondek, P. S., A. I. Flossmann, R. R. Alheit, and H. R. Pruppacher, A theoreticalstudy of the wet removal of atmospheric pollutants. Part V: the uptake, redistribution anddeposition of (NH4)2SO4 by a convective cloud containing ice. J. Atmos. Sci., 52, 2121-2132, 1995.
Rissler, J., E. Swietlicki, J. Zhou, G. Roberts, M. O. Andreae, L. V. Gatti, and P. Artaxo,Physical properties of submicrometer aerosol over the Amazon rain forest during the wet-
to-dry season transition – comparison of modeled and measured CCN concentrations,Atmos. Chem. Phys., 4, 2119-2143, 2004.
Roberts, J.M., et al., Observations of APAN during TexAQS 2000, Geophys. Res. Lett.,28, 4195-4198, 2001.
Roberts, J.M., et al., An examination of the chemistry of peroxycarboxylic nitricanhydrides and related volatile organic compounds during Texas Air Quality Study 2000using ground-based measurements, J. Geophys. Res., 108, 4495,doi:10.1029/2003JD003383, 2003.
Rosenfeld, D., Suppression of rain and snow by urban and industrial air pollution,Science, 287, 1793-1796, 2000.
Russell, P.B., J. M. Livingston, P. Hignett, S. Kinne, J. Wong, A. Chien, R. Bergstrom, P.Durkee and P. V. Hobbs, Aerosol-induced radiative flux changes off the United Statesmid-Atlantic coast: Comparison of values calculated from sunphotometer and in situ datawith those measured by airborne pyranometer, J. Geophys. Res., 104, 2289-2307, 1999.
Ryerson, T.B. et al., Emissions lifetimes ozone formation in power plant plumes, J.Geophys. Res., 103, 22569-22583, 1998.
Ryerson, T.B. et al., Observations of ozone formation in power plant plumes andimplications for ozone control strategies, Science, 292, 719-723, 2001.
Ryerson, T.B. et al., Effect of petrochemical industrial emissions of reactive alkenes andNOx on tropospheric ozone formation in Houston, Texas, J. Geophys. Res., 108,doi:10.1029/2002JD003070, 2003.
Saxena, P., L. M. Hildemann, P. H. McMurry, J.H. Seinfeld, Organics alter hygroscopicbehavior of atmospheric particles, J. Geophys. Res., 100, 18755-18770, 1995.
Schmid, B., D.A. Hegg, J. Wang, D. Bates, J. Redemann, P.B. Russell, J.M. Livingston,H.H. Jonsson, E.J. Welton, J.H. Seinfeld, R.R. Flagan, D.S. Covert, O. Dubovik, and A.Jefferson, Column closure studies of lower tropospheric aerosol and water vapor duringACE-Asia using airborne Sun photometer and airborne in-situ and ship-based lidarmeasurements, J. Geophys. Res., 108, 8656, doi 10.1029/2002JD003361, 2003.
Seinfeld, J.H., and S. N. Pandis, Atmospheric Chemistry and Physics, From Air Pollutionto Climate Change, John Wiley & Sons, Inc., New York, NY, 1998.
Senff, C. J., R. M. Hardesty, R. J. Alvarez, and S. D. Mayor, Airborne lidarcharacterization of power plant plumes during the 1995 Southern Oxidants Study, J.Geophys. Res., 103, 31,173-31,189, 1998.
Shulman, M.L., M.C. Jacobson, R.J. Charlson, R.E. Synovec, and T.E. Young,Dissolution behaviour and surface tension effects of organic compounds in nucleatingcloud droplets, Geophys. Res. Lett., 23, 277-280, 1996.

Sillman S., Ozone production efficiency and loss of NOx in power plant plumes:Photochemical model and interpretation of measurements in Tennessee, J. Geophys. Res.,105, 9189-9202, 2000.
Snider, J. R., and J.-L. Brenguier, Cloud condensation nuclei and cloud dropletmeasurements during ACE-2, Tellus, 52B, 828-842, 2000.
Twomey, S., Aerosols, Clouds and Radiation, Atmos. Environ., 25A (11), 2435-2442,1991.
VanReken, T., M., T. A. Rissman, G. C. Roberts, V. Varutbangkul, H. H. Jonsson, R. C.Flagan, and J. H. Seinfeld, Toward aerosol/cloud condensation nuclei (CCN) closureduring CRYSTAL-FACE, J. Geophys. Res., 108, 4633, doi:10.1029/2003JD003582, 20
Warner, J., A Reduction in Rainfall Associated with Smoke from Sugar-Cane Fires--AnInadvertent Weather Modification?. J. Appl. Meteor. 7, 247-251, 1968.
Wert, B.P., et al., Signatures of terminal alkene oxidation in airborne formaldehydemeasurements during TexAQS 2000, J. Geophys. Res., 108, 4104,doi:10.1029/2002JD002502, 2003.