Embed Size (px)
Citation preview
Science of the Total Environment 695 (2019) 133888
Contents lists available at ScienceDirect
Science of the Total Environment
j ourna l homepage: www.e lsev ie r .com/ locate /sc i totenv
Nutrient criteria for surface waters under the European Water Frame-work Directive: Current state-of-the-art, challenges and future outlook
Sandra Poikane a,⁎, Martyn G. Kelly b,c, Fuensanta Salas Herrero a, Jo-Anne Pitt d, Helen P. Jarvie e,Ulrich Claussen f, Wera Leujak f, Anne Lyche Solheim g, Heliana Teixeira h, Geoff Phillips i
a European Commission, Joint Research Centre (JRC), I-21027 Ispra, Italyb Bowburn Consultancy, 11 Monteigne Drive, Bowburn, Durham DH6 5QB, UKc Department of Geography, Nottingham University, Nottingham NG7 2RD, UKd Environment Agency, Horizon House, Bristol BS1 5AH, UKe Centre for Ecology and Hydrology, Wallingford, Oxfordshire OX10 8BB, UKf Federal Environment Agency, Wörlitzer Platz 1, 06844 Dessau-Rosslau, Germanyg Norwegian Institute for Water Research (NIVA), Gaustadalleen 21, 0348 Oslo, Norwayh Department of Biology & CESAM, University of Aveiro, Campus de Santiago, 3810-193 Aveiro, Portugali School of Biological and Environmental Sciences, University of Stirling, Stirling FK9 4LA, UK
H I G H L I G H T S G R A P H I C A L A B S T R A C T
• We review the nutrient criteria used inEurope under theWater Framework Di-rective.
• Different nutrients (nitrogen and/orphosphorus) used in different watersand countries
• Different metrics used severely hampercomparability between countries.
• A wide range in nutrient criteria valuesare found even within common types.
• Approach to criteria setting has a signif-icant effect on the nutrient criteria.
⁎ Corresponding author.E-mail address: [email protected] (S. Poik
https://doi.org/10.1016/j.scitotenv.2019.1338880048-9697/© 2019 The Authors. Published by Elsevier B.V
a b s t r a c t
a r t i c l e i n f oArticle history:Received 12 July 2019Received in revised form 10 August 2019Accepted 10 August 2019Available online xxxx
Editor: Damia Barcelo
The aim of European water policy is to achieve good ecological status in all rivers, lakes, coastal and transitionalwaters by 2027. Currently,more than half of water bodies are in a degraded condition and nutrient enrichment isone of themain culprits. Therefore, there is a pressing need to establish reliable and comparable nutrient criteriathat are consistent with good ecological status.This paper highlights thewide range of nutrient criteria currently in use byMember States of the EuropeanUnionto support good ecological status and goes on to suggest that inappropriate criteriamay behindering the achieve-ment of good status. Along with a comprehensive overview of nutrient criteria, we provide a critical analysis ofthe threshold concentrations and approaches bywhich these are set.We identify four essential issues: (1) Differ-ent nutrients (nitrogen and/or phosphorus) are used for different water categories in different countries. (2) Theuse of different nutrient fractions (total, dissolved inorganic) and statistical summarymetrics (e.g.,mean, percen-tiles, seasonal, annual) currently hampers comparability between countries, particularly for rivers, transitional
Keywords:EutrophicationEcological statusPhosphorus
ane).
. This is an open access article under the CC BY license (http://creativecommons.org/licenses/by/4.0/).
2 S. Poikane et al. / Science of the Total Environment 695 (2019) 133888
and coastal waters. (3) Wide ranges in nutrient threshold values within shared water body types, in some casesshowingmore than a 10-fold difference in concentrations. (4)Different approaches used to set threshold nutrientconcentrations to define the boundary between “good” and “moderate” ecological status. Expert judgement-based methods resulted in significantly higher (less stringent) good-moderate threshold values comparedwith data-driven approaches, highlighting the importance of consistent and rigorous approaches to criteriasetting.We suggest that further development of nutrient criteria should be based on relationships between ecologicalstatus and nutrient concentrations, taking into account the need for comparability between different water cat-egories, water body types within these categories, and countries.
© 2019 The Authors. Published by Elsevier B.V. This is an open access article under the CC BY license (http://creativecommons.org/licenses/by/4.0/).
NitrogenInland watersCoastal waters
Table 1Abbreviations and terminology used throughout this paper.
Abbreviation Meaning
BQE Biological quality element (biological communities,e.g., phytoplankton, benthic invertebrates, used to assessecological status)
Classification The WFD classification scheme for ecological statusspecifies five status classes: high, good, moderate, poorand bad, based on the extent of deviation from reference(=near-natural) conditions
DIN Dissolved inorganic nitrogen: nitrate-N + nitrite-N +ammonium-N, measured on a filtered water sample
Ecological status Assessment of the quality of the structure and functioningof surface water ecosystems; determined by biologicalquality elements, supported by hydromorphological andphysico-chemical quality elements
Good ecological status WFD objective for all water bodies; defined as a slightvariation from undisturbed conditions
N NitrogenNutrient criteria Water quality standards used to protect the waters from
nutrient enrichment, consisting of nutrient parameter,metrics and threshold
• Parameter N or P fraction measured (TN, TP, SRP etc.)• Metrics Statistics used (mean, median, percentile, annual,
seasonal etc.)• Threshold Nutrient concentration representing the threshold
between two quality classes; good-moderate classthreshold – between good and moderate class
P PhosphorusSRP Soluble Reactive Phosphorus: measures dissolved
inorganic P + readily-hydrolysed (labile organic-,condensed- and colloidal-) P fractions in a filtered watersample with no digestion stepa
TN Total Nitrogen: measures dissolved + particulateinorganic and organic N fractions in an unfiltered watersample with a digestion step
TP Total Phosphorus; measures TRP + dissolved andparticulate organic P fractions in an unfiltered watersample with a digestion step.
TRP Total Reactive Phosphorus: measures SRP +readily-hydrolysed particulate P fractions in an unfilteredwater sample without a digestion stepa
Water FrameworkDirective WFD
Water Framework Directive 2000/60/EC establishing aframework for community action in the field of waterpolicy.
a See Jarvie et al. (2002).
1. Introduction
Europeanwater policy aims to attain good ecological status (definedas no more than a slight deviation from near-natural conditions) in allrivers, lakes, coastal and transitional waters by 2015 or, at the latest,by 2027 (EC, 2000). However, by the most recent estimate (EEA,2018; updated with recent data), 57% of rivers, 44% of lakes, 40% ofcoastal waters and 66% of transitional waters failed to achieve this. Var-ious human drivers - agriculture, urbanization, hydropower generationand climate change – are responsible for this degradation of aquatic eco-systems (Borgwardt et al., 2019)with 50% of Europeanwater bodies im-pacted by more than one pressure and only 18% of surfacewater bodieswith no significant pressures identified (EEA, 2018). Nutrient enrich-ment from both diffuse and point-sources remains one of themain rea-sons for the degradation of Europeanwater bodies (EEA, 2018; Grizzettiet al., 2017). Eutrophication threatens the provision of essential ecosys-tem services such as the supply of drinking water, recreation, and hab-itat provision for fish and wildlife (Culhane et al., 2019).
In Europe, the Water Framework Directive (WFD; EC, 2000) wasadopted to protect and enhance the status of aquatic ecosystems.Under the WFD, ecological status is assessed in an integrated waythrough the use of biological quality elements (phytoplankton, benthicflora, benthic invertebrate and fish fauna) together with supportinghydromorphology and physico-chemical parameters, including nutri-ent conditions. TheWFD stipulates that, at good ecological status, nutri-ent concentrations must “not exceed the levels established so as toensure the functioning of the ecosystem and the achievement of valuesspecified (for good status) for the biological quality elements” (AnnexV,1.2). Thus, the WFD does not provide nutrient concentration targetsspecifically but requires EU countries to determine type-specific nutri-ent criteria ensuring/supporting good ecological status.While a huge ef-fort has been devoted to the development of the assessment methodsusing biological quality elements (BQEs) (Birk et al., 2012; Poikaneet al., 2015), much less attention has been paid until recently to settingnutrient criteria (but see Dolman et al., 2016; Poikane et al., 2019; SalasHerrero et al., 2019). The requirement to intercalibrate the biological el-ements has led to a common view of good status (Birk et al., 2013; Kellyet al., 2014; Poikane et al., 2014); however, this process was not re-quired for the supporting elements.
Recently, the focus has shifted from the assessment of ecological sta-tus towards identifying themanagementmeasures to reach good status(Carvalho et al., 2019). This has been fueled by the observation that, fif-teen years after theWFDwas introduced, less thanhalf of all surfacewa-ters are in good ecological status, and there has been little or noimprovement between 2009 and 2015 (EEA, 2018). Many reasons liebehind this lack of restoration success, including the lag-time betweenthe implementation of managementmeasures and ecosystem response(Jarvie et al., 2013; Sharpley et al., 2013). However, concerns about theweak linkages between management targets for nutrients and ecologi-cal status have also been raised (Carvalho et al., 2019), and the widerange of nutrient criteria established by different countries (Laaneet al., 2005; Phillips and Pitt, 2016) raises the possibility that some ofthese may not be fit-for-purpose. Selecting appropriate nutrient criteriais vital to enable management of eutrophication of surface waters to
achieve good ecological status. It is also important to ensure that man-agement targets are consistent between countries andwater categories,especially for transboundary water management (Hering et al., 2010;Dave andMunawar, 2014). Despite the critical importance of this ques-tion, to date no analysis nor overview has been conducted of the nutri-ent criteria used by member states to support good ecological statusunder the Water Framework Directive.
This study aims (i) to provide an overview of nutrient criteria, in-cluding thresholds for good ecological status and approaches used toset these; (ii) to identify whether nutrient criteria currently in use actu-ally support good ecological status and are consistent between coun-tries with similar water bodies; and, (iii) to provide recommendationsfor further work.
3S. Poikane et al. / Science of the Total Environment 695 (2019) 133888
2. Material and methods
2.1. Collection of data on nutrient criteria and supporting information
Information on nutrient (phosphorus, P, and nitrogen, N; see Table 1for a list of abbreviations and terminology) criteria were gathered frommember states using a questionnaire. This included information on thenutrient parameters measured, units and metrics used and high-goodand good-moderate class threshold concentrations for all types of sur-facewater body aswell as descriptions of the approaches used to derivenutrient criteria. Twenty-eightmember states reported nutrient criteriafor rivers, 26 for lakes, 23 for coastal waters and 18 for transitional wa-ters (Table 2). A more detailed overview is presented as Supporting in-formation for lakes and rivers (Table S1) and coastal and transitionalwaters (Table S2).
2.2. Comparison of nutrient criteria within common types
When making comparisons of threshold concentrations betweencountries it is important to use similar water body types. The WFDleaves countries to determine their own water body typology, basedon WFD Annex II type descriptors (System A or B), which has resultedin the description of N1500 national types of water bodies acrossEurope (Lyche Solheim et al., 2015, 2019), too many for effective com-parison. To simplify this those freshwater types that shared a similar de-scriptors (underlying geology, altitude, catchment size for rivers,surface area and mean depth for lakes) were grouped into European‘broad types’ (Lyche Solheim et al., 2015, 2019) (Tables S3 and S4).
In the case of coastal and transitional waters (CTW), reported na-tional types were linked to regional ‘common types’ established for
Table 2Number of countries reporting different nutrient criteria for rivers, lakes, coastal and transitionregion (e.g., France - Mediterranean Sea Region and France - North East Atlantic Sea region). B
Member state Lakes Rivers
P N P N
Austria x Not used x xBelgium-Flanders x x x xBelgium-Wallonia No lakes No lakes x xBulgaria x x x xCroatia x x x xCyprus x Not used x xCzech Republic x Not used x xDenmark x x Not usedEstonia x x x xFinland x x x x
France x x x x
Germany x Not used x Not used
Greece x x x xHungary x x x xIreland x Not used x xItaly x Not used x xLatvia x x x xLithuania x x x xLuxemburg No lakes No lakes x xMalta In developmentNetherlands x x x xNorway x x x xPoland x x x xPortugal x x x xRomania x x x xSlovakia No lakes No lakes x xSlovenia x Not used x x
Spain x Not used x x
Sweden x Not used x Not usedUnited Kingdom x Not used x Not usedTotal 26 16 28 25
the intercalibration of the biological assessment systems (Tables S5and S6).
For rivers, nutrient criteria for 680 national types were reported and80% of records were matched to 20 broad types; for lakes, nutrientcriteria for 369 national types were reported, 73% of which could bematched to broad types, while for coastal and transitional waters 231national types were reported, of which 60% were allocated to commontypes.
Comparisons of nutrient criteria within broad typeswere carried outfor thoseN and P parameters assessed by themajority of countries: totalphosphorus (TP) and total nitrogen (TN) for rivers and lakes, and TP anddissolved inorganic nitrogen (DIN) for coastal and transitional waters.Most countries use mean (or median) values for nutrient criteria; how-ever several countries use a 90th percentile summary metric. For com-parison, the values of these percentiles were halved (analyses of alarge UK data set for both TP and TRP suggested that a 90th percentilewould be approximately double the value of a mean (Phillips and Pitt,2016).
2.3. Methods to set the good-moderate threshold concentration
Each country was asked to summarise information about the waythat the good-moderate threshold concentration was set. For bothfreshwaters and saline waters a wide range of methods were used; forsimplification these have been grouped into six main approaches:
1. Regression between nutrient and biological response (Phillips et al.,2018);
2. Modelling – e.g. two countries predict reference TP in lakes frommodels of alkalinity and depth;
al waters. x– nutrient criteria reported. Some countries report criteria for more than oneALT = Baltic Sea; MED= Mediterranean; NEA= North-East Atlantic.
Coastal waters Transitional waters
P N P N
No coastal and transitional watersx x x xNo coastal and transitional watersx x x xx x x xx x TRW not definedNo coastal and transitional watersNot used TRW not definedx x TRW not definedx x TRW not defined
MED In development x xNEA Not used x Not used xBALT x x TRW not definedNEA x x x x
x x x xNo coastal and transitional watersNot used x x Not usedx Not used x xx x x xx x x xNo coastal and transitional waters
Not used x Not used xx x TRW not definedx x x xx x x xx x x xNo coastal and transitional watersx x TRW not defined
MED x x x xNEA x x x x
x x x xNot used x Not used x20 23 16 18
0 2 4 6 8 10 12 14 16
Nitrogen metrics not used
Growth season max NO3
Growth season means NO3
Annual mean NO3
Annual mean TN
Growth season mean or median TN
Growth season mean SRP
Annual mean SRP
75th TP
Annual mean TP
Growth season mean or median TP
negortiN
surohps ohPNutrient metrics used in lakes
0 2 4 6 8 10 12 14 16
Nitrogen metrics not usedAnnual 90th or 95th or max NO3
Growth season mean NO3Annual mean or median NO3
Annual 90th TNGrowth season mean TN
Annual mean or median TNAnnual 90th SRP
Growth season mean SRPAnnual mean and median SRP
Annual 95th TRPAnnual mean TRP
Annual 90th TPGrowth season mean TP
Annual mean and median TP
negortiN
surohp soh P
Nutrient metrics used in rivers
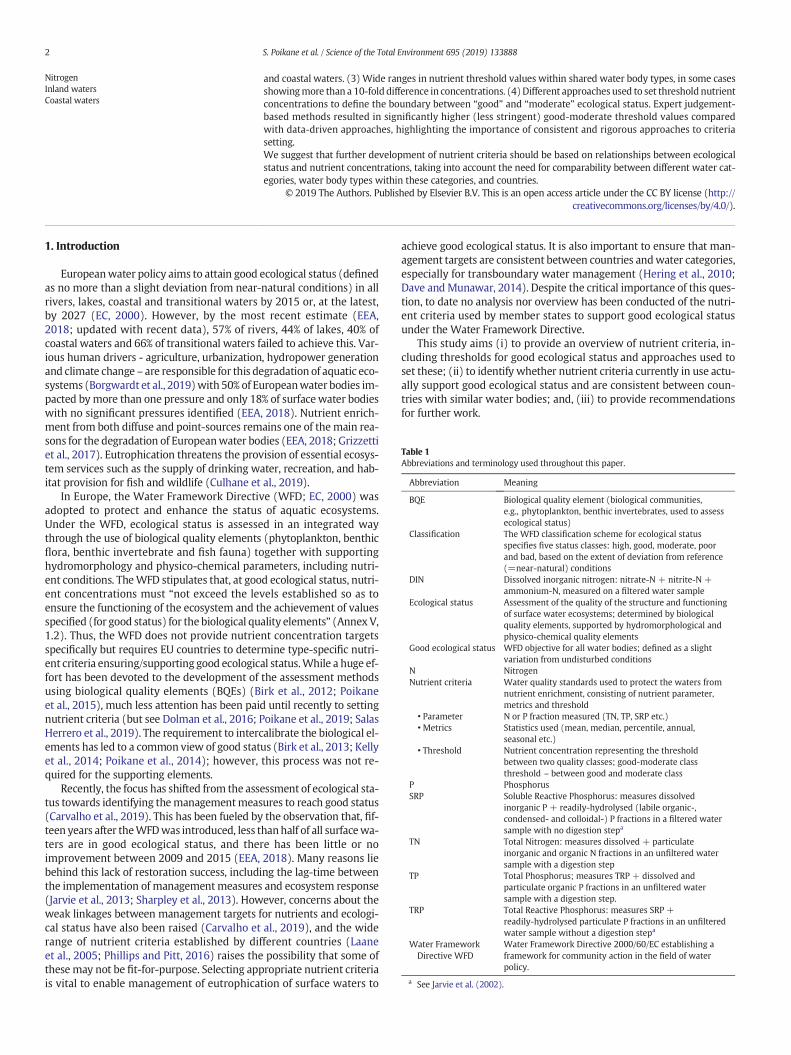
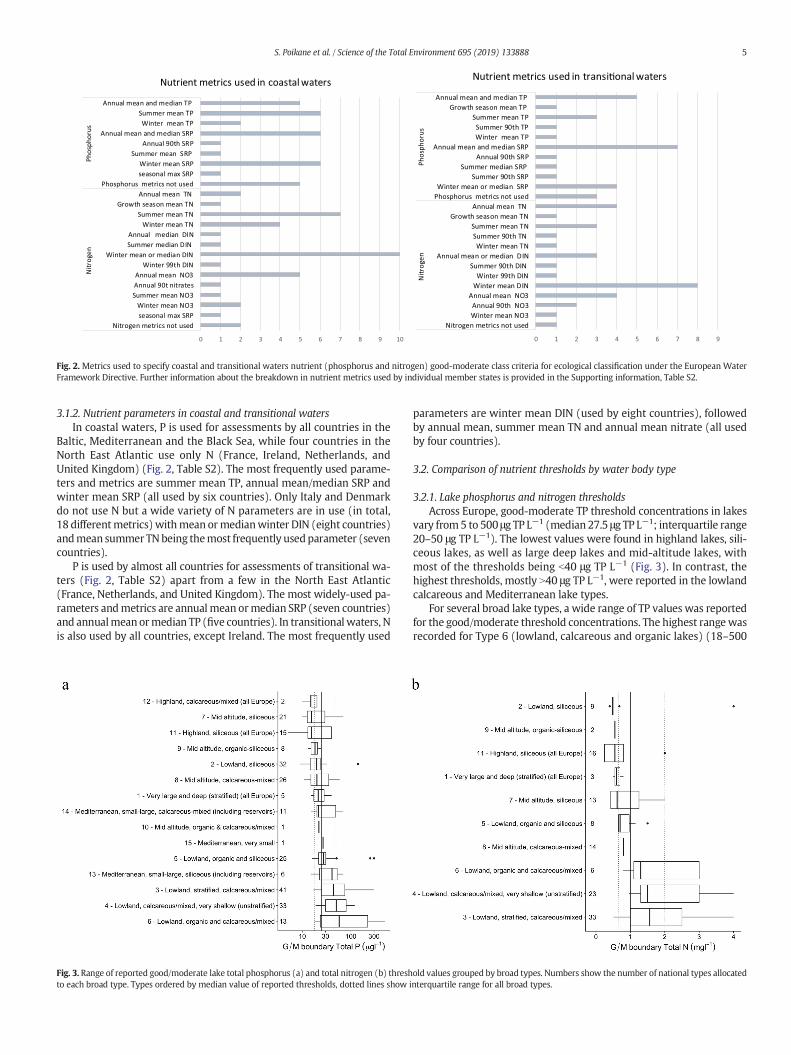
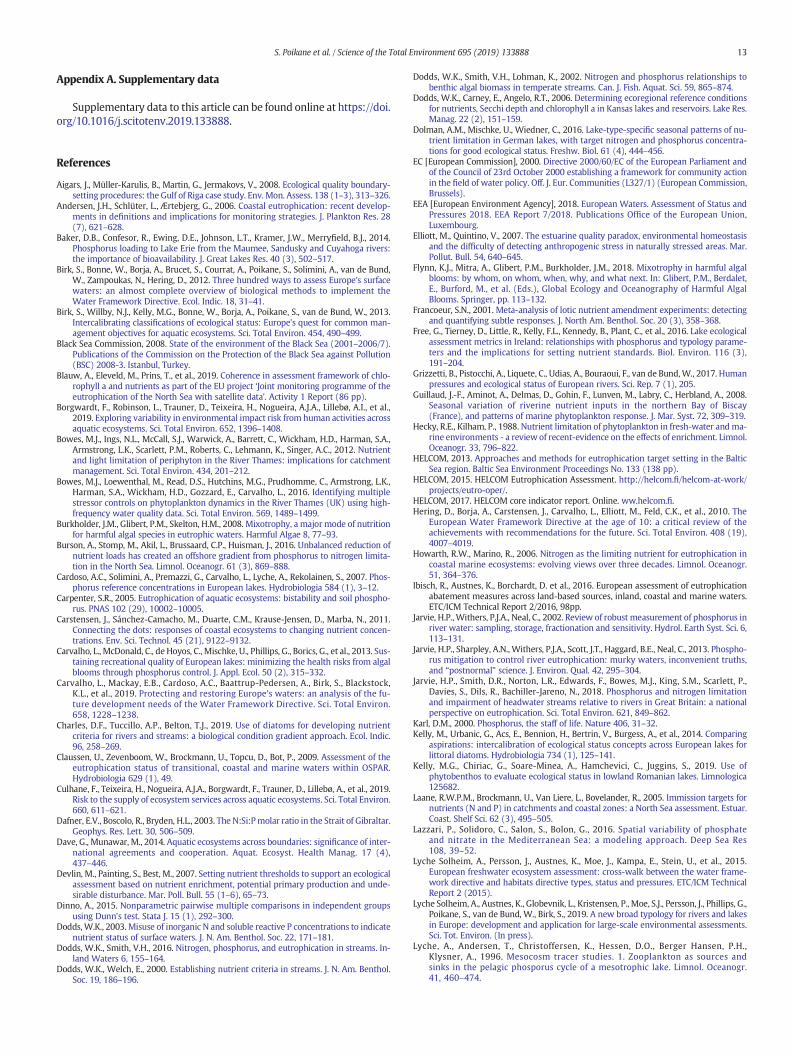
Fig. 1.Metrics used to specify lake and river nutrient (phosphorus and nitrogen) good-moderate class criteria for ecological classification under the EuropeanWater Framework Directive.Further information about the breakdown in nutrient metrics used by individual member states is provided in the Supporting information, Table S1.
4 S. Poikane et al. / Science of the Total Environment 695 (2019) 133888
3. Distribution of nutrient concentrations in water bodies classified(using ecological criteria) as high, good and moderate status(Phillips et al., 2018);
4. Distribution of nutrient concentrations in all water bodies – usingthis approach the nutrient criteria are defined from an arbitrary per-centile of the distribution of nutrient concentrations from all waterbodies (Dodds and Welch, 2000).
5. Expert judgement, including values taken from the literature or fromolder European Directives. For example, for nitrate, the common useof the value 5.65mg-N L−1 in freshwaters is likely to be derived fromthe guideline value of 25 mg L−1 of nitrate in the Nitrates Directive(91/676/EEC) or now repealed Drinking Water Directive (80/778/EC).
6. For coastal and transitional water, the so-called OSPAR Comprehen-sive Procedure is used widely. In this, a water body is considered tobe an ‘Eutrophication Problem Area’ if actual status deviates 50% ormore from reference conditions (OSPAR, 2013).
2.4. Statistical analysis
Statistical analysis of reported threshold valueswas performedusingR 3.5.3. (R Core Team, 2019). The significance of different criteria settingmethods was tested by Kruskal-Wallis Rank Sum Test and post-hocDunn's Test (Dinno, 2015). Effects were considered statistically signifi-cant at p b 0.05.
Table 3Nutrient parameters used by member states (number of countries and percentage of countries
Nutrient parameters used in ecological classification # of countries
Lakesa Riversb
Phosphorus parametersTotal phosphorus (TP) 26 24Total reactive phosphorus (TRP) 0 2Soluble reactive phosphorus (SRP) 3 14Not using P parameters 0 1Nitrogen parametersTotal nitrogen (TN) 14 13Dissolved inorganic nitrogen (DIN) 0 0Nitrate (NO3) 6 20Not using N metrics 10 4
26 29
a Countries with no lakes (Belgium-Wallonia, Luxembourg, Slovakia) and Malta not includeb Belgium-Flanders and Belgium-Wallonia counted separately, Malta not included.c Countries may report criteria for more than one region (e.g., France - Mediterranean Sea R
3. Results
3.1. Nutrient criteria: parameters and metrics
3.1.1. Nutrient parameters and metrics in lakes and riversFor lakes, all countries use TP and three additionally report solu-
ble reactive phosphorus (SRP) (Fig. 1, Table 3). In contrast, only six-teen countries have a threshold value for N in lakes. The majority useTN (singly or in combination with nitrate), with two using only ni-trate. Ten countries (38% of reporting countries) do not use N inlake assessment. Almost all countries use measures of central ten-dency (mean, median or geometric mean), with just Spain using anupper (75th) percentile.
For rivers, the majority (24 countries out of 29) reported TPthresholds, singly or in combination with SRP. However, four only re-ported soluble reactive phosphorus (SRP) (Austria and Spain) or TRP(Ireland and United Kingdom). Twenty-two countries reportedthreshold values for N in rivers, most use nitrate-N (20 countries)rather than TN (13 countries) while four countries do not use N met-rics in rivers (Table 3). More countries used upper percentiles (e.g.90th percentiles) summary metrics rather than measures of centraltendency for rivers than was the case for lakes. One country(Denmark) has no nutrient thresholds for rivers for any nutrientparameter.
). CW–coastal waters, TW – transitional waters (estuaries, coastal lagoons etc.)
% of all countries reported
CWc TRWc Lakes Rivers CW TRW
12 10 100% 82.8% 46.2% 52.6%0 0 0 6.9% 0 014 12 11.5% 48.3% 53.9% 63.2%5 3 0 3.4% 19.2% 15.8%
10 8 53.9% 44.8% 38.5% 42.1%9 11 0 0 32.1% 57.9%10 7 23.1% 69.0% 38.5% 36.8%1 1 38.5% 13.8% 3.9% 5.3%23 19
d.
egion and France - North East Atlantic Sea region).
0 1 2 3 4 5 6 7 8 9 10
Nitrogen metrics not usedseasonal max SRPWinter mean NO3
Summer mean NO3Annual 90t nitratesAnnual mean NO3
Winter 99th DINWinter mean or median DIN
Summer median DINAnnual median DIN
Winter mean TNSummer mean TN
Growth season mean TNAnnual mean TN
Phosphorus metrics not usedseasonal max SRPWinter mean SRP
Summer mean SRPAnnual 90th SRP
Annual mean and median SRPWinter mean TP
Summer mean TPAnnual mean and median TP
negortiN
surohpsohPNutrient metrics used in coastal waters
0 1 2 3 4 5 6 7 8 9
Nitrogen metrics not usedWinter mean NO3Annual 90th NO3
Annual mean NO3Winter mean DINWinter 99th DIN
Summer 90th DINAnnual mean or median DIN
Winter mean TNSummer 90th TNSummer mean TN
Growth season mean TNAnnual mean TN
Phosphorus metrics not usedWinter mean or median SRP
Summer 90th SRPSummer median SRP
Annual 90th SRPAnnual mean and median SRP
Winter mean TPSummer 90th TP
Summer mean TPGrowth season mean TP
Annual mean and median TP
negortiN
surohpsohP
Nutrient metrics used in transi�onal waters
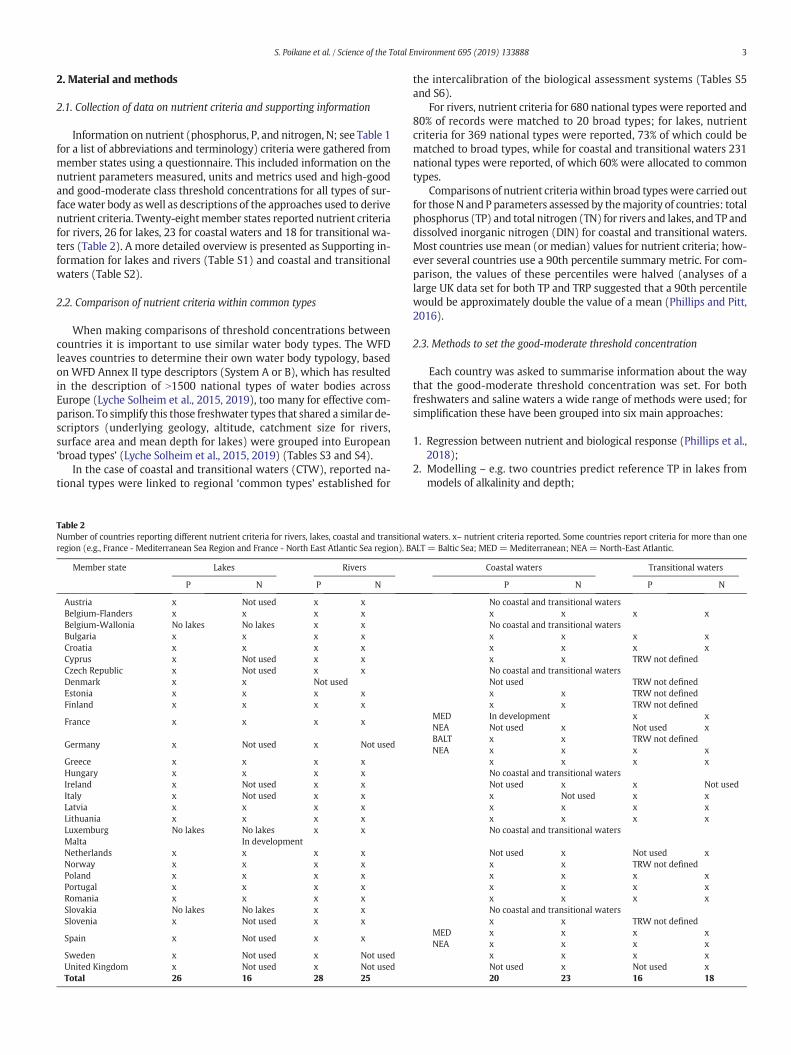
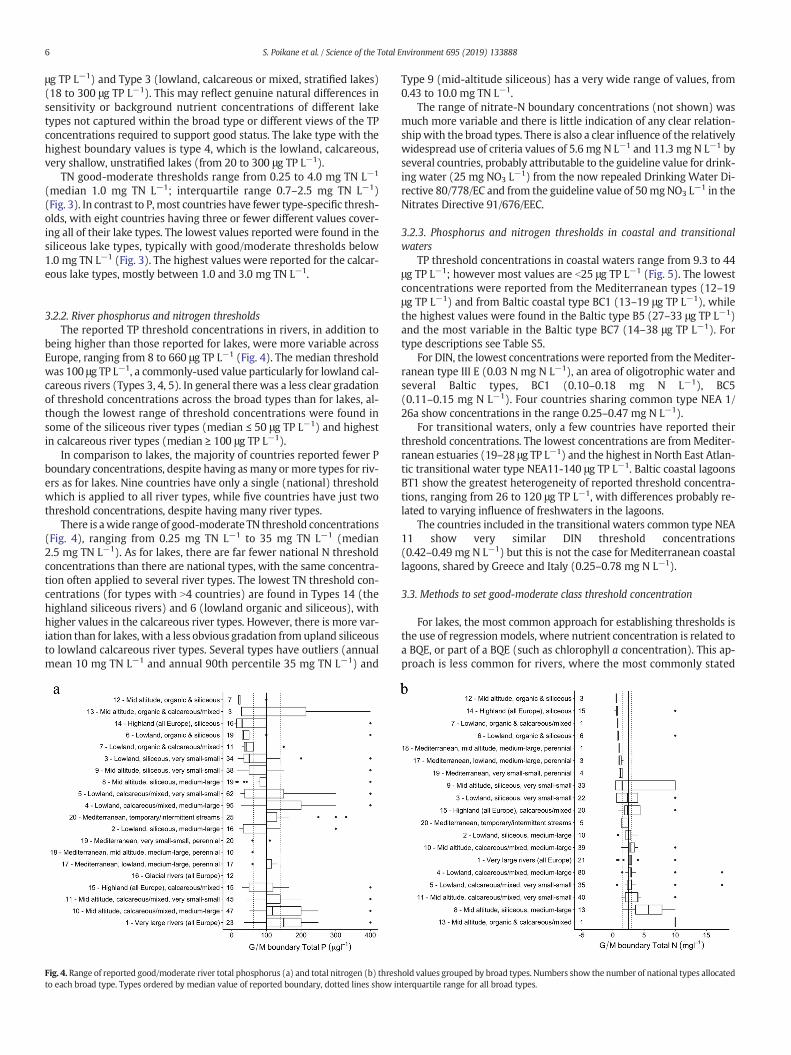
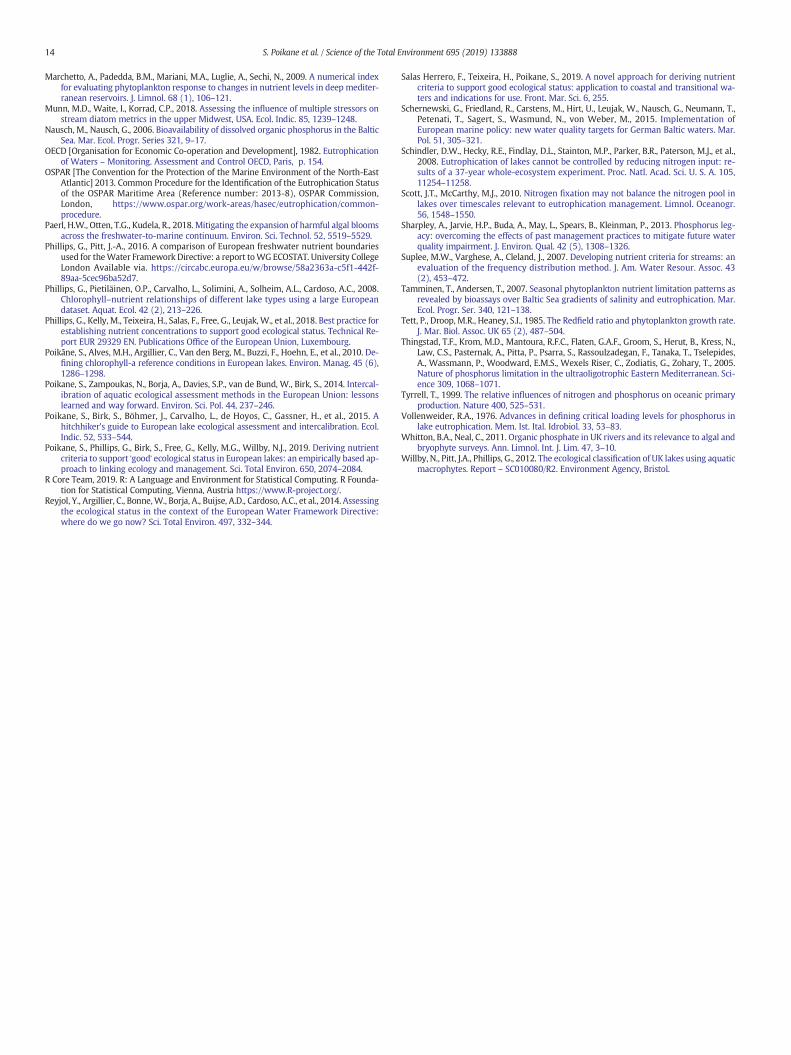
Fig. 2. Metrics used to specify coastal and transitional waters nutrient (phosphorus and nitrogen) good-moderate class criteria for ecological classification under the European WaterFramework Directive. Further information about the breakdown in nutrient metrics used by individual member states is provided in the Supporting information, Table S2.
5S. Poikane et al. / Science of the Total Environment 695 (2019) 133888
3.1.2. Nutrient parameters in coastal and transitional watersIn coastal waters, P is used for assessments by all countries in the
Baltic, Mediterranean and the Black Sea, while four countries in theNorth East Atlantic use only N (France, Ireland, Netherlands, andUnited Kingdom) (Fig. 2, Table S2). The most frequently used parame-ters and metrics are summer mean TP, annual mean/median SRP andwinter mean SRP (all used by six countries). Only Italy and Denmarkdo not use N but a wide variety of N parameters are in use (in total,18 differentmetrics) withmean ormedianwinter DIN (eight countries)andmean summer TN being themost frequently usedparameter (sevencountries).
P is used by almost all countries for assessments of transitional wa-ters (Fig. 2, Table S2) apart from a few in the North East Atlantic(France, Netherlands, and United Kingdom). The most widely-used pa-rameters andmetrics are annualmean ormedian SRP (seven countries)and annualmean ormedian TP (five countries). In transitionalwaters, Nis also used by all countries, except Ireland. The most frequently used
Fig. 3. Range of reported good/moderate lake total phosphorus (a) and total nitrogen (b) threshto each broad type. Types ordered by median value of reported thresholds, dotted lines show i
parameters are winter mean DIN (used by eight countries), followedby annual mean, summer mean TN and annual mean nitrate (all usedby four countries).
3.2. Comparison of nutrient thresholds by water body type
3.2.1. Lake phosphorus and nitrogen thresholdsAcross Europe, good-moderate TP threshold concentrations in lakes
vary from5 to 500 μg TP L−1 (median 27.5 μg TP L−1; interquartile range20–50 μg TP L−1). The lowest values were found in highland lakes, sili-ceous lakes, as well as large deep lakes and mid-altitude lakes, withmost of the thresholds being b40 μg TP L−1 (Fig. 3). In contrast, thehighest thresholds, mostly N40 μg TP L−1, were reported in the lowlandcalcareous and Mediterranean lake types.
For several broad lake types, a wide range of TP values was reportedfor the good/moderate threshold concentrations. The highest rangewasrecorded for Type 6 (lowland, calcareous and organic lakes) (18–500
old values grouped by broad types. Numbers show the number of national types allocatednterquartile range for all broad types.
6 S. Poikane et al. / Science of the Total Environment 695 (2019) 133888
μg TP L−1) and Type 3 (lowland, calcareous or mixed, stratified lakes)(18 to 300 μg TP L−1). This may reflect genuine natural differences insensitivity or background nutrient concentrations of different laketypes not captured within the broad type or different views of the TPconcentrations required to support good status. The lake type with thehighest boundary values is type 4, which is the lowland, calcareous,very shallow, unstratified lakes (from 20 to 300 μg TP L−1).
TN good-moderate thresholds range from 0.25 to 4.0 mg TN L−1
(median 1.0 mg TN L−1; interquartile range 0.7–2.5 mg TN L−1)(Fig. 3). In contrast to P,most countries have fewer type-specific thresh-olds, with eight countries having three or fewer different values cover-ing all of their lake types. The lowest values reported were found in thesiliceous lake types, typically with good/moderate thresholds below1.0 mg TN L−1 (Fig. 3). The highest values were reported for the calcar-eous lake types, mostly between 1.0 and 3.0 mg TN L−1.
3.2.2. River phosphorus and nitrogen thresholdsThe reported TP threshold concentrations in rivers, in addition to
being higher than those reported for lakes, were more variable acrossEurope, ranging from 8 to 660 μg TP L−1 (Fig. 4). The median thresholdwas 100 μg TP L−1, a commonly-used value particularly for lowland cal-careous rivers (Types 3, 4, 5). In general there was a less clear gradationof threshold concentrations across the broad types than for lakes, al-though the lowest range of threshold concentrations were found insome of the siliceous river types (median ≤ 50 μg TP L−1) and highestin calcareous river types (median ≥ 100 μg TP L−1).
In comparison to lakes, the majority of countries reported fewer Pboundary concentrations, despite having as many or more types for riv-ers as for lakes. Nine countries have only a single (national) thresholdwhich is applied to all river types, while five countries have just twothreshold concentrations, despite having many river types.
There is awide range of good-moderate TN threshold concentrations(Fig. 4), ranging from 0.25 mg TN L−1 to 35 mg TN L−1 (median2.5 mg TN L−1). As for lakes, there are far fewer national N thresholdconcentrations than there are national types, with the same concentra-tion often applied to several river types. The lowest TN threshold con-centrations (for types with N4 countries) are found in Types 14 (thehighland siliceous rivers) and 6 (lowland organic and siliceous), withhigher values in the calcareous river types. However, there is more var-iation than for lakes, with a less obvious gradation fromupland siliceousto lowland calcareous river types. Several types have outliers (annualmean 10 mg TN L−1 and annual 90th percentile 35 mg TN L−1) and
Fig. 4. Range of reported good/moderate river total phosphorus (a) and total nitrogen (b) threshto each broad type. Types ordered by median value of reported boundary, dotted lines show in
Type 9 (mid-altitude siliceous) has a very wide range of values, from0.43 to 10.0 mg TN L−1.
The range of nitrate-N boundary concentrations (not shown) wasmuch more variable and there is little indication of any clear relation-shipwith the broad types. There is also a clear influence of the relativelywidespread use of criteria values of 5.6 mg N L−1 and 11.3 mg N L−1 byseveral countries, probably attributable to the guideline value for drink-ing water (25 mg NO3 L−1) from the now repealed Drinking Water Di-rective 80/778/EC and from the guideline value of 50mgNO3 L−1 in theNitrates Directive 91/676/EEC.
3.2.3. Phosphorus and nitrogen thresholds in coastal and transitionalwaters
TP threshold concentrations in coastal waters range from 9.3 to 44μg TP L−1; however most values are b25 μg TP L−1 (Fig. 5). The lowestconcentrations were reported from the Mediterranean types (12–19μg TP L−1) and from Baltic coastal type BC1 (13–19 μg TP L−1), whilethe highest values were found in the Baltic type B5 (27–33 μg TP L−1)and the most variable in the Baltic type BC7 (14–38 μg TP L−1). Fortype descriptions see Table S5.
For DIN, the lowest concentrations were reported from theMediter-ranean type III E (0.03 N mg N L−1), an area of oligotrophic water andseveral Baltic types, BC1 (0.10–0.18 mg N L−1), BC5(0.11–0.15 mg N L−1). Four countries sharing common type NEA 1/26a show concentrations in the range 0.25–0.47 mg N L−1).
For transitional waters, only a few countries have reported theirthreshold concentrations. The lowest concentrations are fromMediter-ranean estuaries (19–28 μg TP L−1) and the highest in North East Atlan-tic transitional water type NEA11-140 μg TP L−1. Baltic coastal lagoonsBT1 show the greatest heterogeneity of reported threshold concentra-tions, ranging from 26 to 120 μg TP L−1, with differences probably re-lated to varying influence of freshwaters in the lagoons.
The countries included in the transitional waters common type NEA11 show very similar DIN threshold concentrations(0.42–0.49 mg N L−1) but this is not the case for Mediterranean coastallagoons, shared by Greece and Italy (0.25–0.78 mg N L−1).
3.3. Methods to set good-moderate class threshold concentration
For lakes, the most common approach for establishing thresholds isthe use of regressionmodels, where nutrient concentration is related toa BQE, or part of a BQE (such as chlorophyll a concentration). This ap-proach is less common for rivers, where the most commonly stated
old values grouped by broad types. Numbers show the number of national types allocatedterquartile range for all broad types.
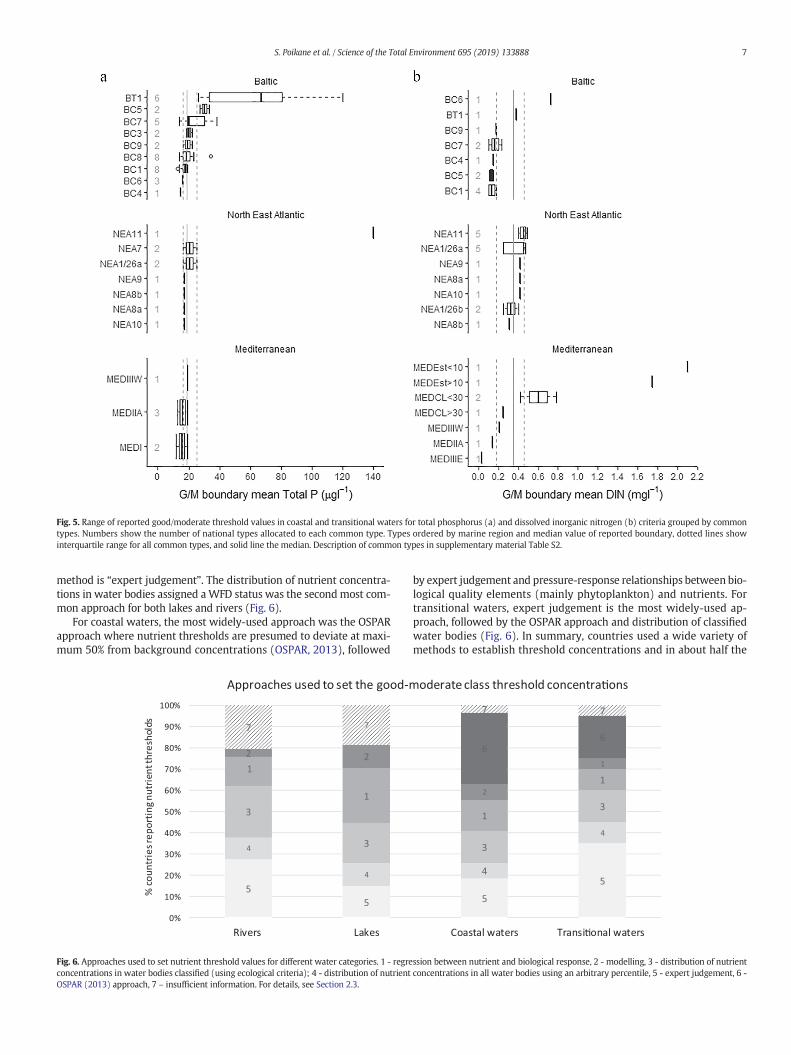
Fig. 5. Range of reported good/moderate threshold values in coastal and transitional waters for total phosphorus (a) and dissolved inorganic nitrogen (b) criteria grouped by commontypes. Numbers show the number of national types allocated to each common type. Types ordered by marine region and median value of reported boundary, dotted lines showinterquartile range for all common types, and solid line the median. Description of common types in supplementary material Table S2.
7S. Poikane et al. / Science of the Total Environment 695 (2019) 133888
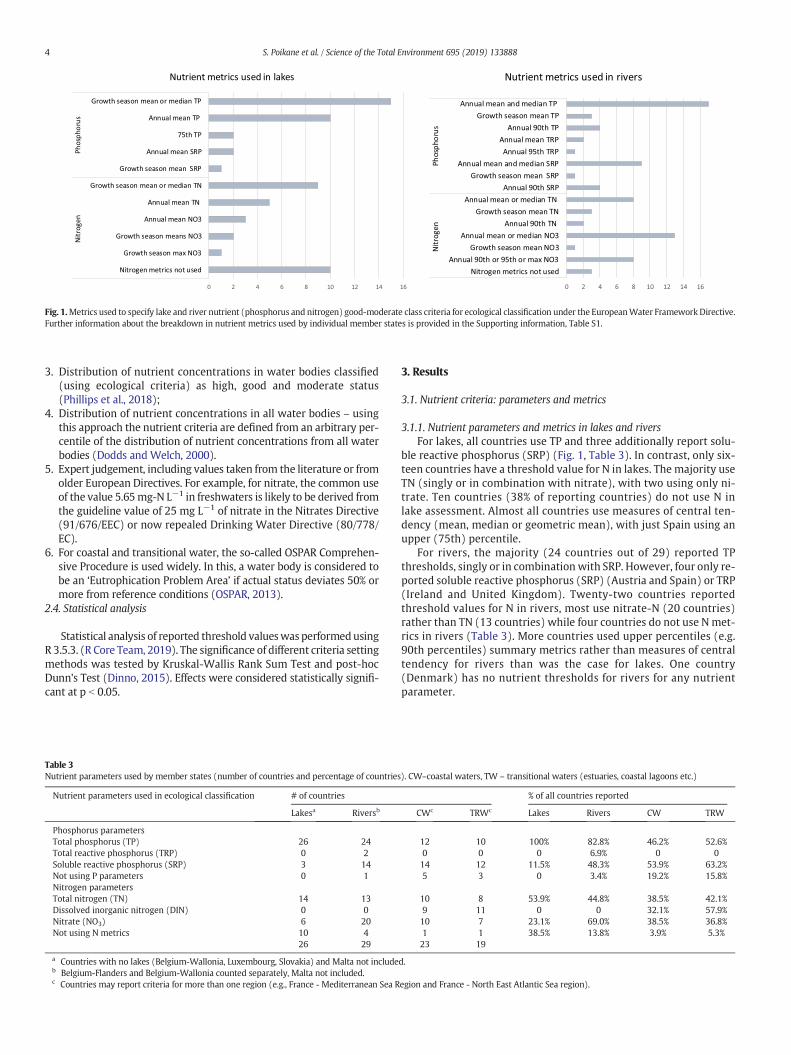
method is “expert judgement”. The distribution of nutrient concentra-tions in water bodies assigned aWFD status was the secondmost com-mon approach for both lakes and rivers (Fig. 6).
For coastal waters, the most widely-used approach was the OSPARapproach where nutrient thresholds are presumed to deviate at maxi-mum 50% from background concentrations (OSPAR, 2013), followed
55
4
4
3
3
1
1
2 2
7 7
0%
10%
20%
30%
40%
50%
60%
70%
80%
90%
100%
Rivers Lakes
sdlohserht t neirtun gni tr oper seirtnuo c %
Approaches used to set the good-m
Fig. 6. Approaches used to set nutrient threshold values for different water categories. 1 - regreconcentrations in water bodies classified (using ecological criteria); 4 - distribution of nutrientOSPAR (2013) approach, 7 – insufficient information. For details, see Section 2.3.
by expert judgement and pressure-response relationships between bio-logical quality elements (mainly phytoplankton) and nutrients. Fortransitional waters, expert judgement is the most widely-used ap-proach, followed by the OSPAR approach and distribution of classifiedwater bodies (Fig. 6). In summary, countries used a wide variety ofmethods to establish threshold concentrations and in about half the
5
54
4
3
31
12
1
66
7 7
Coastal waters Transi�onal waters
oderate class threshold concentra�ons
ssion between nutrient and biological response, 2 - modelling, 3 - distribution of nutrientconcentrations in all water bodies using an arbitrary percentile, 5 - expert judgement, 6 -
8 S. Poikane et al. / Science of the Total Environment 695 (2019) 133888
cases the process is not linked to ecological status or an objective eval-uation of reference conditions (i.e. approaches 4 and 5 in Section 2.3).
3.4. Comparison of nutrient thresholds by method of derivation
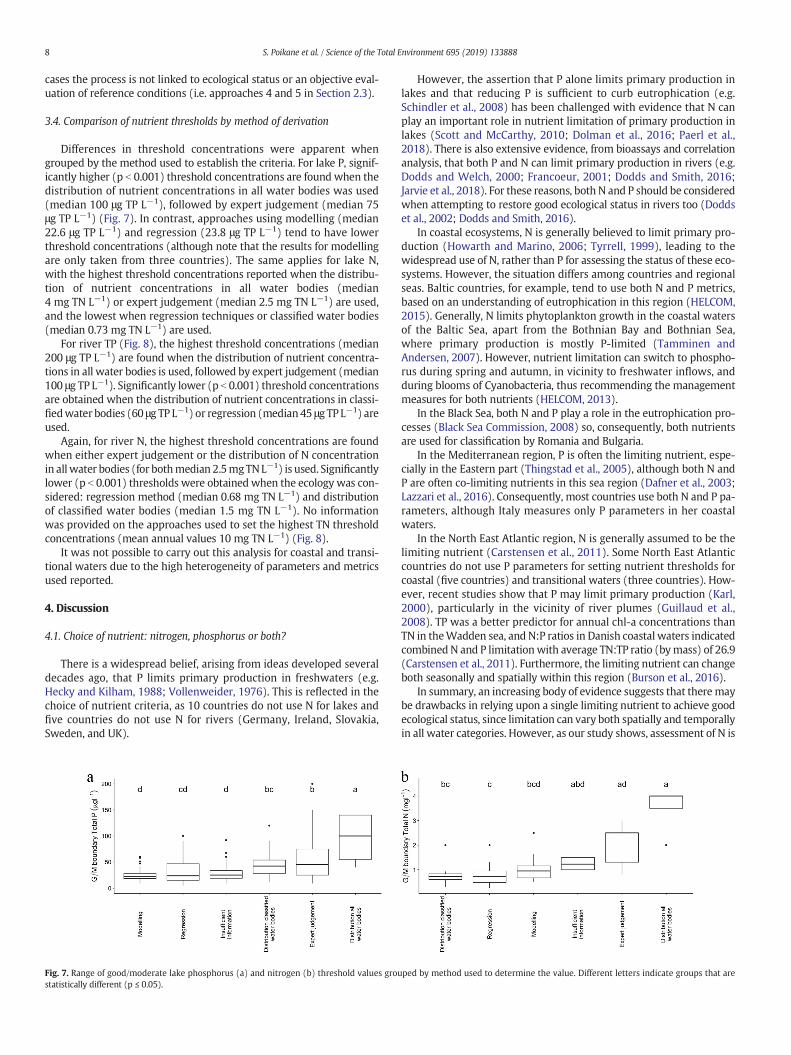
Differences in threshold concentrations were apparent whengrouped by the method used to establish the criteria. For lake P, signif-icantly higher (p b 0.001) threshold concentrations are found when thedistribution of nutrient concentrations in all water bodies was used(median 100 μg TP L−1), followed by expert judgement (median 75μg TP L−1) (Fig. 7). In contrast, approaches using modelling (median22.6 μg TP L−1) and regression (23.8 μg TP L−1) tend to have lowerthreshold concentrations (although note that the results for modellingare only taken from three countries). The same applies for lake N,with the highest threshold concentrations reported when the distribu-tion of nutrient concentrations in all water bodies (median4 mg TN L−1) or expert judgement (median 2.5 mg TN L−1) are used,and the lowest when regression techniques or classified water bodies(median 0.73 mg TN L−1) are used.
For river TP (Fig. 8), the highest threshold concentrations (median200 μg TP L−1) are found when the distribution of nutrient concentra-tions in all water bodies is used, followed by expert judgement (median100 μg TP L−1). Significantly lower (p b 0.001) threshold concentrationsare obtained when the distribution of nutrient concentrations in classi-fiedwater bodies (60 μg TP L−1) or regression (median45 μg TP L−1) areused.
Again, for river N, the highest threshold concentrations are foundwhen either expert judgement or the distribution of N concentrationin allwater bodies (for bothmedian 2.5mgTNL−1) is used. Significantlylower (p b 0.001) thresholds were obtained when the ecology was con-sidered: regression method (median 0.68 mg TN L−1) and distributionof classified water bodies (median 1.5 mg TN L−1). No informationwas provided on the approaches used to set the highest TN thresholdconcentrations (mean annual values 10 mg TN L−1) (Fig. 8).
It was not possible to carry out this analysis for coastal and transi-tional waters due to the high heterogeneity of parameters and metricsused reported.
4. Discussion
4.1. Choice of nutrient: nitrogen, phosphorus or both?
There is a widespread belief, arising from ideas developed severaldecades ago, that P limits primary production in freshwaters (e.g.Hecky and Kilham, 1988; Vollenweider, 1976). This is reflected in thechoice of nutrient criteria, as 10 countries do not use N for lakes andfive countries do not use N for rivers (Germany, Ireland, Slovakia,Sweden, and UK).
Fig. 7. Range of good/moderate lake phosphorus (a) and nitrogen (b) threshold values groustatistically different (p ≤ 0.05).
However, the assertion that P alone limits primary production inlakes and that reducing P is sufficient to curb eutrophication (e.g.Schindler et al., 2008) has been challenged with evidence that N canplay an important role in nutrient limitation of primary production inlakes (Scott and McCarthy, 2010; Dolman et al., 2016; Paerl et al.,2018). There is also extensive evidence, from bioassays and correlationanalysis, that both P and N can limit primary production in rivers (e.g.Dodds and Welch, 2000; Francoeur, 2001; Dodds and Smith, 2016;Jarvie et al., 2018). For these reasons, both N and P should be consideredwhen attempting to restore good ecological status in rivers too (Doddset al., 2002; Dodds and Smith, 2016).
In coastal ecosystems, N is generally believed to limit primary pro-duction (Howarth and Marino, 2006; Tyrrell, 1999), leading to thewidespread use of N, rather than P for assessing the status of these eco-systems. However, the situation differs among countries and regionalseas. Baltic countries, for example, tend to use both N and P metrics,based on an understanding of eutrophication in this region (HELCOM,2015). Generally, N limits phytoplankton growth in the coastal watersof the Baltic Sea, apart from the Bothnian Bay and Bothnian Sea,where primary production is mostly P-limited (Tamminen andAndersen, 2007). However, nutrient limitation can switch to phospho-rus during spring and autumn, in vicinity to freshwater inflows, andduring blooms of Cyanobacteria, thus recommending the managementmeasures for both nutrients (HELCOM, 2013).
In the Black Sea, both N and P play a role in the eutrophication pro-cesses (Black Sea Commission, 2008) so, consequently, both nutrientsare used for classification by Romania and Bulgaria.
In the Mediterranean region, P is often the limiting nutrient, espe-cially in the Eastern part (Thingstad et al., 2005), although both N andP are often co-limiting nutrients in this sea region (Dafner et al., 2003;Lazzari et al., 2016). Consequently, most countries use both N and P pa-rameters, although Italy measures only P parameters in her coastalwaters.
In the North East Atlantic region, N is generally assumed to be thelimiting nutrient (Carstensen et al., 2011). Some North East Atlanticcountries do not use P parameters for setting nutrient thresholds forcoastal (five countries) and transitional waters (three countries). How-ever, recent studies show that P may limit primary production (Karl,2000), particularly in the vicinity of river plumes (Guillaud et al.,2008). TP was a better predictor for annual chl-a concentrations thanTN in theWadden sea, and N:P ratios in Danish coastal waters indicatedcombined N and P limitationwith average TN:TP ratio (bymass) of 26.9(Carstensen et al., 2011). Furthermore, the limiting nutrient can changeboth seasonally and spatially within this region (Burson et al., 2016).
In summary, an increasing body of evidence suggests that there maybe drawbacks in relying upon a single limiting nutrient to achieve goodecological status, since limitation can vary both spatially and temporallyin all water categories. However, as our study shows, assessment of N is
ped by method used to determine the value. Different letters indicate groups that are
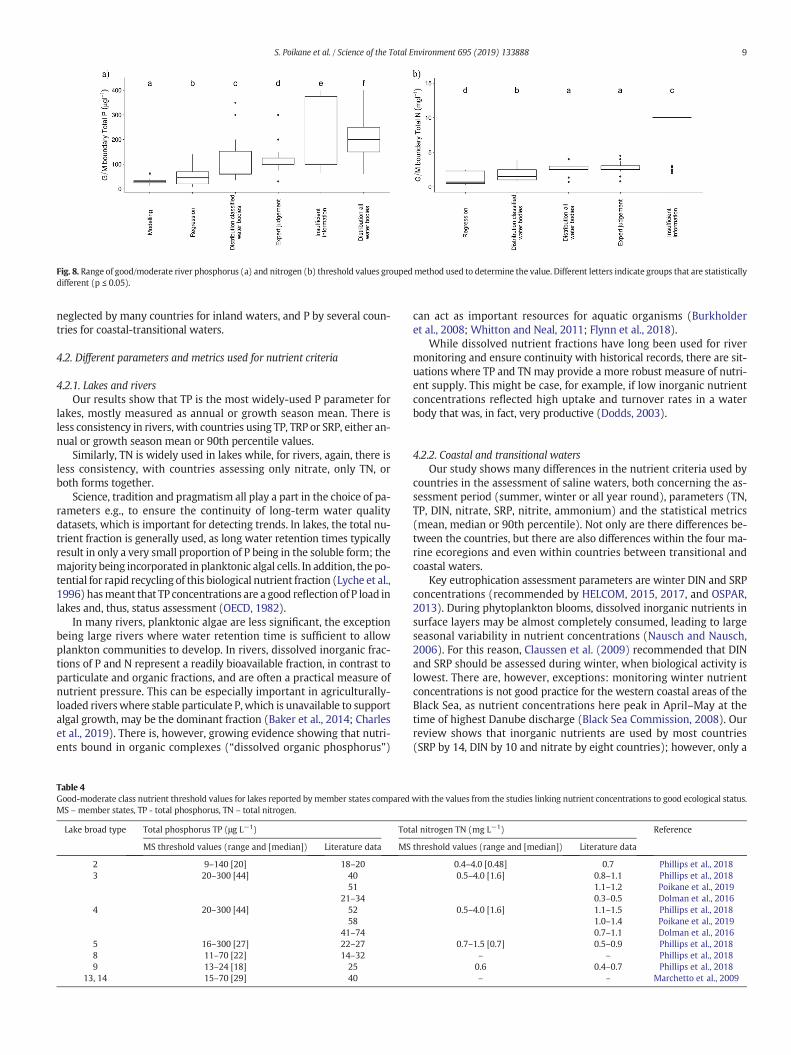
Fig. 8. Range of good/moderate river phosphorus (a) and nitrogen (b) threshold values groupedmethod used to determine the value. Different letters indicate groups that are statisticallydifferent (p ≤ 0.05).
9S. Poikane et al. / Science of the Total Environment 695 (2019) 133888
neglected by many countries for inland waters, and P by several coun-tries for coastal-transitional waters.
4.2. Different parameters and metrics used for nutrient criteria
4.2.1. Lakes and riversOur results show that TP is the most widely-used P parameter for
lakes, mostly measured as annual or growth season mean. There isless consistency in rivers, with countries using TP, TRP or SRP, either an-nual or growth season mean or 90th percentile values.
Similarly, TN is widely used in lakes while, for rivers, again, there isless consistency, with countries assessing only nitrate, only TN, orboth forms together.
Science, tradition and pragmatism all play a part in the choice of pa-rameters e.g., to ensure the continuity of long-term water qualitydatasets, which is important for detecting trends. In lakes, the total nu-trient fraction is generally used, as long water retention times typicallyresult in only a very small proportion of P being in the soluble form; themajority being incorporated in planktonic algal cells. In addition, the po-tential for rapid recycling of this biological nutrient fraction (Lyche et al.,1996) hasmeant that TP concentrations are a good reflection of P load inlakes and, thus, status assessment (OECD, 1982).
In many rivers, planktonic algae are less significant, the exceptionbeing large rivers where water retention time is sufficient to allowplankton communities to develop. In rivers, dissolved inorganic frac-tions of P and N represent a readily bioavailable fraction, in contrast toparticulate and organic fractions, and are often a practical measure ofnutrient pressure. This can be especially important in agriculturally-loaded riverswhere stable particulate P,which is unavailable to supportalgal growth, may be the dominant fraction (Baker et al., 2014; Charleset al., 2019). There is, however, growing evidence showing that nutri-ents bound in organic complexes (“dissolved organic phosphorus”)
Table 4Good-moderate class nutrient threshold values for lakes reported by member states comparedMS – member states, TP - total phosphorus, TN – total nitrogen.
Lake broad type Total phosphorus TP (μg L−1) Tot
MS threshold values (range and [median]) Literature data MS
2 9–140 [20] 18–203 20–300 [44] 40
5121–34
4 20–300 [44] 5258
41–745 16–300 [27] 22–278 11–70 [22] 14–329 13–24 [18] 25
13, 14 15–70 [29] 40
can act as important resources for aquatic organisms (Burkholderet al., 2008; Whitton and Neal, 2011; Flynn et al., 2018).
While dissolved nutrient fractions have long been used for rivermonitoring and ensure continuity with historical records, there are sit-uations where TP and TN may provide a more robust measure of nutri-ent supply. This might be case, for example, if low inorganic nutrientconcentrations reflected high uptake and turnover rates in a waterbody that was, in fact, very productive (Dodds, 2003).
4.2.2. Coastal and transitional watersOur study shows many differences in the nutrient criteria used by
countries in the assessment of saline waters, both concerning the as-sessment period (summer, winter or all year round), parameters (TN,TP, DIN, nitrate, SRP, nitrite, ammonium) and the statistical metrics(mean, median or 90th percentile). Not only are there differences be-tween the countries, but there are also differences within the four ma-rine ecoregions and even within countries between transitional andcoastal waters.
Key eutrophication assessment parameters are winter DIN and SRPconcentrations (recommended by HELCOM, 2015, 2017, and OSPAR,2013). During phytoplankton blooms, dissolved inorganic nutrients insurface layers may be almost completely consumed, leading to largeseasonal variability in nutrient concentrations (Nausch and Nausch,2006). For this reason, Claussen et al. (2009) recommended that DINand SRP should be assessed during winter, when biological activity islowest. There are, however, exceptions: monitoring winter nutrientconcentrations is not good practice for the western coastal areas of theBlack Sea, as nutrient concentrations here peak in April–May at thetime of highest Danube discharge (Black Sea Commission, 2008). Ourreview shows that inorganic nutrients are used by most countries(SRP by 14, DIN by 10 and nitrate by eight countries); however, only a
with the values from the studies linking nutrient concentrations to good ecological status.
al nitrogen TN (mg L−1) Reference
threshold values (range and [median]) Literature data
0.4–4.0 [0.48] 0.7 Phillips et al., 20180.5–4.0 [1.6] 0.8–1.1 Phillips et al., 2018
1.1–1.2 Poikane et al., 20190.3–0.5 Dolman et al., 2016
0.5–4.0 [1.6] 1.1–1.5 Phillips et al., 20181.0–1.4 Poikane et al., 20190.7–1.1 Dolman et al., 2016
0.7–1.5 [0.7] 0.5–0.9 Phillips et al., 2018– – Phillips et al., 20180.6 0.4–0.7 Phillips et al., 2018– – Marchetto et al., 2009
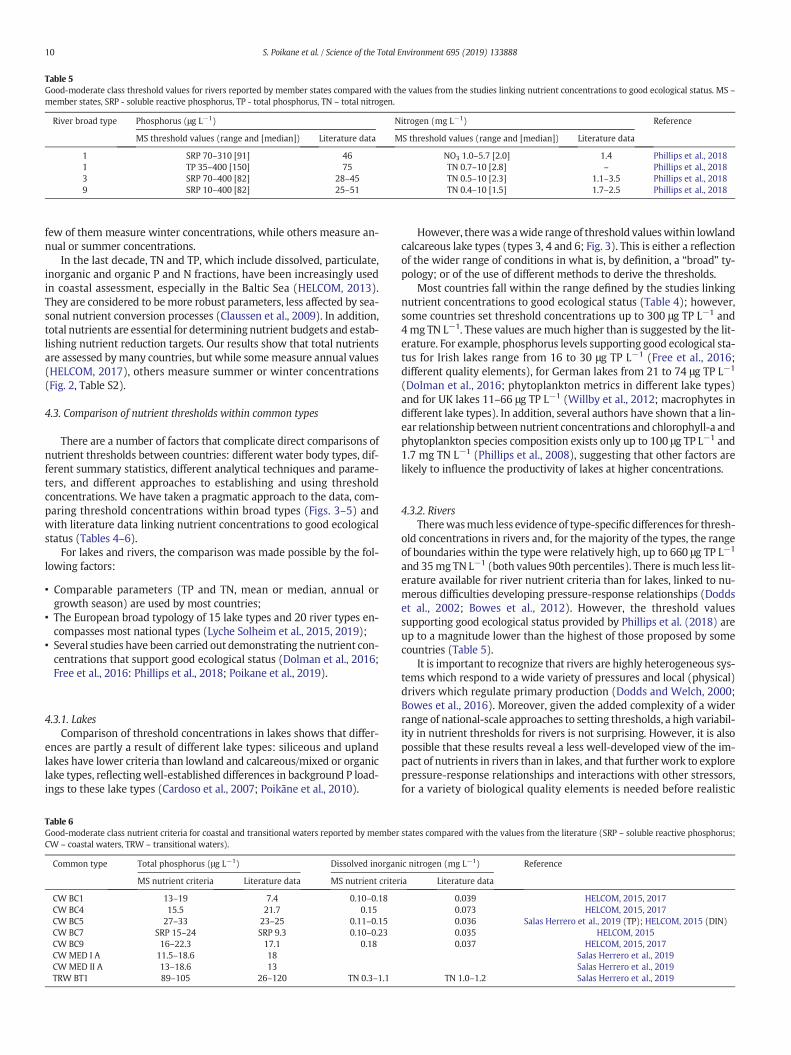
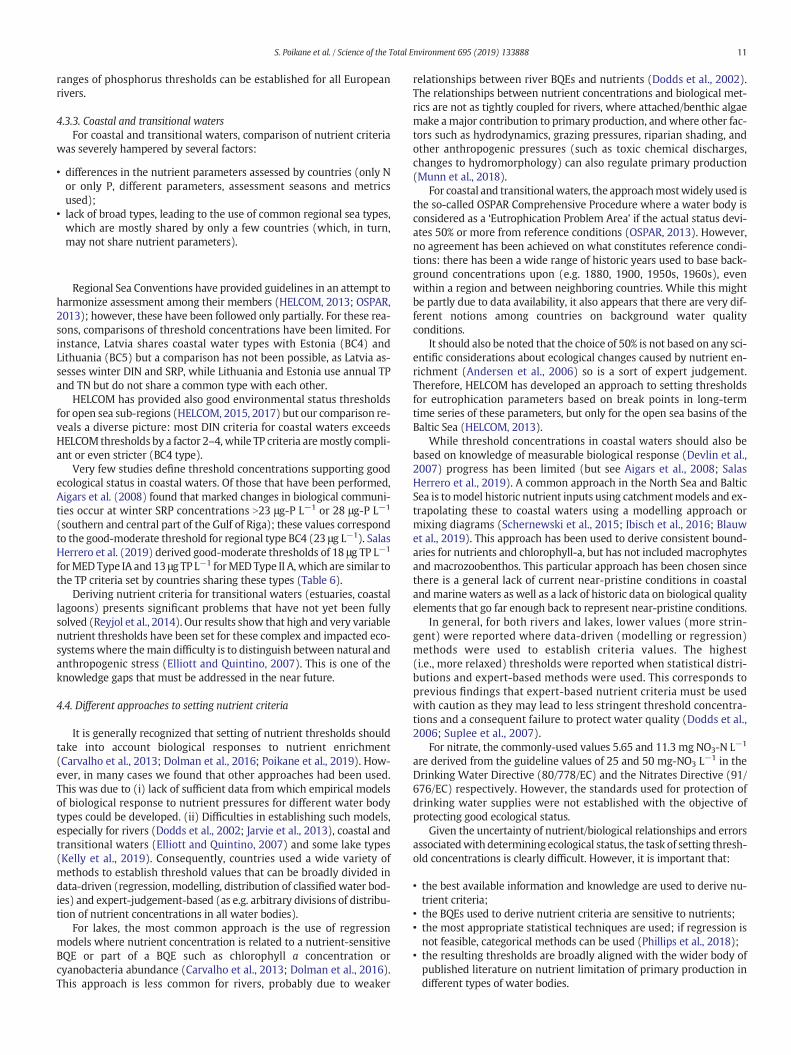
Table 5Good-moderate class threshold values for rivers reported by member states compared with the values from the studies linking nutrient concentrations to good ecological status. MS –member states, SRP - soluble reactive phosphorus, TP - total phosphorus, TN – total nitrogen.
River broad type Phosphorus (μg L−1) Nitrogen (mg L−1) Reference
MS threshold values (range and [median]) Literature data MS threshold values (range and [median]) Literature data
1 SRP 70–310 [91] 46 NO3 1.0–5.7 [2.0] 1.4 Phillips et al., 20181 TP 35–400 [150] 75 TN 0.7–10 [2.8] – Phillips et al., 20183 SRP 70–400 [82] 28–45 TN 0.5–10 [2.3] 1.1–3.5 Phillips et al., 20189 SRP 10–400 [82] 25–51 TN 0.4–10 [1.5] 1.7–2.5 Phillips et al., 2018
10 S. Poikane et al. / Science of the Total Environment 695 (2019) 133888
few of them measure winter concentrations, while others measure an-nual or summer concentrations.
In the last decade, TN and TP, which include dissolved, particulate,inorganic and organic P and N fractions, have been increasingly usedin coastal assessment, especially in the Baltic Sea (HELCOM, 2013).They are considered to bemore robust parameters, less affected by sea-sonal nutrient conversion processes (Claussen et al., 2009). In addition,total nutrients are essential for determining nutrient budgets and estab-lishing nutrient reduction targets. Our results show that total nutrientsare assessed bymany countries, but while somemeasure annual values(HELCOM, 2017), others measure summer or winter concentrations(Fig. 2, Table S2).
4.3. Comparison of nutrient thresholds within common types
There are a number of factors that complicate direct comparisons ofnutrient thresholds between countries: different water body types, dif-ferent summary statistics, different analytical techniques and parame-ters, and different approaches to establishing and using thresholdconcentrations. We have taken a pragmatic approach to the data, com-paring threshold concentrations within broad types (Figs. 3–5) andwith literature data linking nutrient concentrations to good ecologicalstatus (Tables 4–6).
For lakes and rivers, the comparison was made possible by the fol-lowing factors:
• Comparable parameters (TP and TN, mean or median, annual orgrowth season) are used by most countries;
• The European broad typology of 15 lake types and 20 river types en-compasses most national types (Lyche Solheim et al., 2015, 2019);
• Several studies have been carried out demonstrating the nutrient con-centrations that support good ecological status (Dolman et al., 2016;Free et al., 2016: Phillips et al., 2018; Poikane et al., 2019).
4.3.1. LakesComparison of threshold concentrations in lakes shows that differ-
ences are partly a result of different lake types: siliceous and uplandlakes have lower criteria than lowland and calcareous/mixed or organiclake types, reflectingwell-established differences in background P load-ings to these lake types (Cardoso et al., 2007; Poikāne et al., 2010).
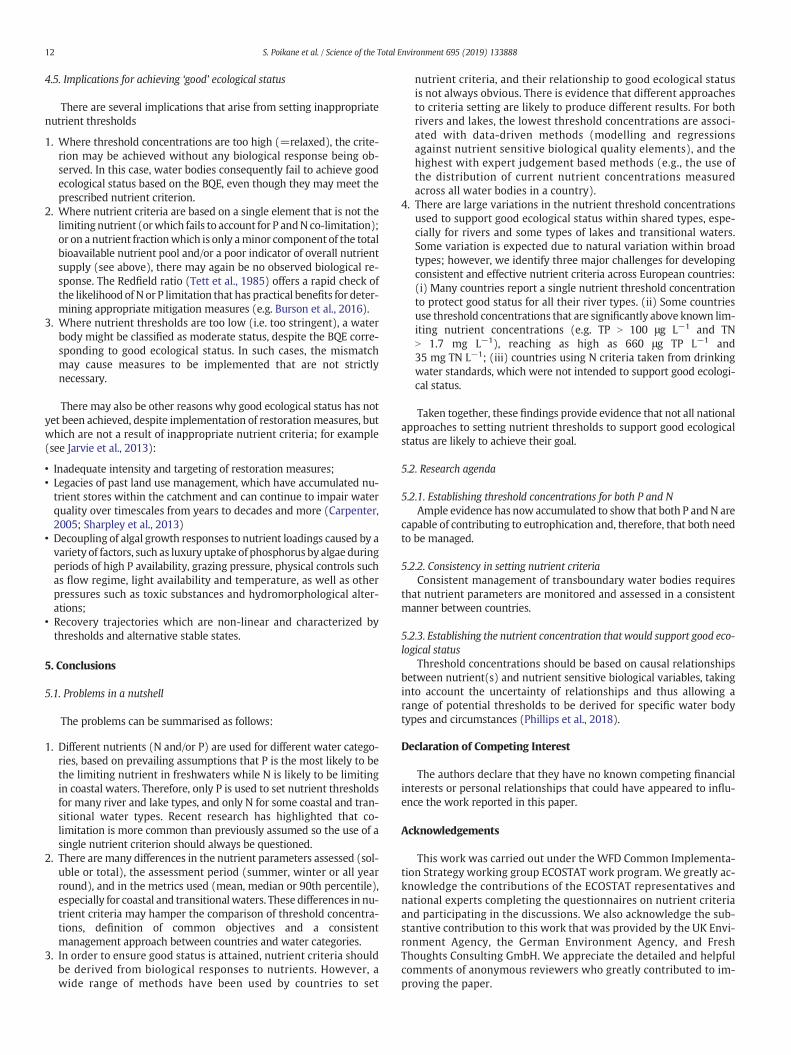
Table 6Good-moderate class nutrient criteria for coastal and transitional waters reported by memberCW – coastal waters, TRW – transitional waters).
Common type Total phosphorus (μg L−1) Dissolved inorgan
MS nutrient criteria Literature data MS nutrient criter
CW BC1 13–19 7.4 0.10–0.18CW BC4 15.5 21.7 0.15CW BC5 27–33 23–25 0.11–0.15CW BC7 SRP 15–24 SRP 9.3 0.10–0.23CW BC9 16–22.3 17.1 0.18CW MED I A 11.5–18.6 18CW MED II A 13–18.6 13TRW BT1 89–105 26–120 TN 0.3–1.1
However, therewas awide range of threshold valueswithin lowlandcalcareous lake types (types 3, 4 and 6; Fig. 3). This is either a reflectionof the wider range of conditions in what is, by definition, a “broad” ty-pology; or of the use of different methods to derive the thresholds.
Most countries fall within the range defined by the studies linkingnutrient concentrations to good ecological status (Table 4); however,some countries set threshold concentrations up to 300 μg TP L−1 and4mg TN L−1. These values are much higher than is suggested by the lit-erature. For example, phosphorus levels supporting good ecological sta-tus for Irish lakes range from 16 to 30 μg TP L−1 (Free et al., 2016;different quality elements), for German lakes from 21 to 74 μg TP L−1
(Dolman et al., 2016; phytoplankton metrics in different lake types)and for UK lakes 11–66 μg TP L−1 (Willby et al., 2012; macrophytes indifferent lake types). In addition, several authors have shown that a lin-ear relationship between nutrient concentrations and chlorophyll-a andphytoplankton species composition exists only up to 100 μg TP L−1 and1.7 mg TN L−1 (Phillips et al., 2008), suggesting that other factors arelikely to influence the productivity of lakes at higher concentrations.
4.3.2. RiversTherewasmuch less evidence of type-specific differences for thresh-
old concentrations in rivers and, for the majority of the types, the rangeof boundaries within the type were relatively high, up to 660 μg TP L−1
and 35mg TN L−1 (both values 90th percentiles). There is much less lit-erature available for river nutrient criteria than for lakes, linked to nu-merous difficulties developing pressure-response relationships (Doddset al., 2002; Bowes et al., 2012). However, the threshold valuessupporting good ecological status provided by Phillips et al. (2018) areup to a magnitude lower than the highest of those proposed by somecountries (Table 5).
It is important to recognize that rivers are highly heterogeneous sys-tems which respond to a wide variety of pressures and local (physical)drivers which regulate primary production (Dodds and Welch, 2000;Bowes et al., 2016). Moreover, given the added complexity of a widerrange of national-scale approaches to setting thresholds, a high variabil-ity in nutrient thresholds for rivers is not surprising. However, it is alsopossible that these results reveal a less well-developed view of the im-pact of nutrients in rivers than in lakes, and that further work to explorepressure-response relationships and interactions with other stressors,for a variety of biological quality elements is needed before realistic
states compared with the values from the literature (SRP – soluble reactive phosphorus;
ic nitrogen (mg L−1) Reference
ia Literature data
0.039 HELCOM, 2015, 20170.073 HELCOM, 2015, 20170.036 Salas Herrero et al., 2019 (TP); HELCOM, 2015 (DIN)0.035 HELCOM, 20150.037 HELCOM, 2015, 2017
Salas Herrero et al., 2019Salas Herrero et al., 2019
TN 1.0–1.2 Salas Herrero et al., 2019
11S. Poikane et al. / Science of the Total Environment 695 (2019) 133888
ranges of phosphorus thresholds can be established for all Europeanrivers.
4.3.3. Coastal and transitional watersFor coastal and transitional waters, comparison of nutrient criteria
was severely hampered by several factors:
• differences in the nutrient parameters assessed by countries (only Nor only P, different parameters, assessment seasons and metricsused);
• lack of broad types, leading to the use of common regional sea types,which are mostly shared by only a few countries (which, in turn,may not share nutrient parameters).
Regional Sea Conventions have provided guidelines in an attempt toharmonize assessment among their members (HELCOM, 2013; OSPAR,2013); however, these have been followed only partially. For these rea-sons, comparisons of threshold concentrations have been limited. Forinstance, Latvia shares coastal water types with Estonia (BC4) andLithuania (BC5) but a comparison has not been possible, as Latvia as-sesses winter DIN and SRP, while Lithuania and Estonia use annual TPand TN but do not share a common type with each other.
HELCOM has provided also good environmental status thresholdsfor open sea sub-regions (HELCOM, 2015, 2017) but our comparison re-veals a diverse picture: most DIN criteria for coastal waters exceedsHELCOM thresholds by a factor 2–4, while TP criteria aremostly compli-ant or even stricter (BC4 type).
Very few studies define threshold concentrations supporting goodecological status in coastal waters. Of those that have been performed,Aigars et al. (2008) found that marked changes in biological communi-ties occur at winter SRP concentrations N23 μg-P L−1 or 28 μg-P L−1
(southern and central part of the Gulf of Riga); these values correspondto the good-moderate threshold for regional type BC4 (23 μg L−1). SalasHerrero et al. (2019) derived good-moderate thresholds of 18 μg TP L−1
forMED Type IA and 13 μg TP L−1 forMED Type II A, which are similar tothe TP criteria set by countries sharing these types (Table 6).
Deriving nutrient criteria for transitional waters (estuaries, coastallagoons) presents significant problems that have not yet been fullysolved (Reyjol et al., 2014). Our results show that high and very variablenutrient thresholds have been set for these complex and impacted eco-systemswhere themain difficulty is to distinguish between natural andanthropogenic stress (Elliott and Quintino, 2007). This is one of theknowledge gaps that must be addressed in the near future.
4.4. Different approaches to setting nutrient criteria
It is generally recognized that setting of nutrient thresholds shouldtake into account biological responses to nutrient enrichment(Carvalho et al., 2013; Dolman et al., 2016; Poikane et al., 2019). How-ever, in many cases we found that other approaches had been used.This was due to (i) lack of sufficient data from which empirical modelsof biological response to nutrient pressures for different water bodytypes could be developed. (ii) Difficulties in establishing such models,especially for rivers (Dodds et al., 2002; Jarvie et al., 2013), coastal andtransitional waters (Elliott and Quintino, 2007) and some lake types(Kelly et al., 2019). Consequently, countries used a wide variety ofmethods to establish threshold values that can be broadly divided indata-driven (regression, modelling, distribution of classifiedwater bod-ies) and expert-judgement-based (as e.g. arbitrary divisions of distribu-tion of nutrient concentrations in all water bodies).
For lakes, the most common approach is the use of regressionmodels where nutrient concentration is related to a nutrient-sensitiveBQE or part of a BQE such as chlorophyll a concentration orcyanobacteria abundance (Carvalho et al., 2013; Dolman et al., 2016).This approach is less common for rivers, probably due to weaker
relationships between river BQEs and nutrients (Dodds et al., 2002).The relationships between nutrient concentrations and biological met-rics are not as tightly coupled for rivers, where attached/benthic algaemake amajor contribution to primary production, andwhere other fac-tors such as hydrodynamics, grazing pressures, riparian shading, andother anthropogenic pressures (such as toxic chemical discharges,changes to hydromorphology) can also regulate primary production(Munn et al., 2018).
For coastal and transitionalwaters, the approachmostwidely used isthe so-called OSPAR Comprehensive Procedure where a water body isconsidered as a ‘Eutrophication Problem Area’ if the actual status devi-ates 50% or more from reference conditions (OSPAR, 2013). However,no agreement has been achieved on what constitutes reference condi-tions: there has been a wide range of historic years used to base back-ground concentrations upon (e.g. 1880, 1900, 1950s, 1960s), evenwithin a region and between neighboring countries. While this mightbe partly due to data availability, it also appears that there are very dif-ferent notions among countries on background water qualityconditions.
It should also be noted that the choice of 50% is not based on any sci-entific considerations about ecological changes caused by nutrient en-richment (Andersen et al., 2006) so is a sort of expert judgement.Therefore, HELCOM has developed an approach to setting thresholdsfor eutrophication parameters based on break points in long-termtime series of these parameters, but only for the open sea basins of theBaltic Sea (HELCOM, 2013).
While threshold concentrations in coastal waters should also bebased on knowledge of measurable biological response (Devlin et al.,2007) progress has been limited (but see Aigars et al., 2008; SalasHerrero et al., 2019). A common approach in the North Sea and BalticSea is tomodel historic nutrient inputs using catchmentmodels and ex-trapolating these to coastal waters using a modelling approach ormixing diagrams (Schernewski et al., 2015; Ibisch et al., 2016; Blauwet al., 2019). This approach has been used to derive consistent bound-aries for nutrients and chlorophyll-a, but has not included macrophytesand macrozoobenthos. This particular approach has been chosen sincethere is a general lack of current near-pristine conditions in coastalandmarine waters as well as a lack of historic data on biological qualityelements that go far enough back to represent near-pristine conditions.
In general, for both rivers and lakes, lower values (more strin-gent) were reported where data-driven (modelling or regression)methods were used to establish criteria values. The highest(i.e., more relaxed) thresholds were reported when statistical distri-butions and expert-based methods were used. This corresponds toprevious findings that expert-based nutrient criteria must be usedwith caution as they may lead to less stringent threshold concentra-tions and a consequent failure to protect water quality (Dodds et al.,2006; Suplee et al., 2007).
For nitrate, the commonly-used values 5.65 and 11.3 mg NO3-N L−1
are derived from the guideline values of 25 and 50 mg-NO3 L−1 in theDrinking Water Directive (80/778/EC) and the Nitrates Directive (91/676/EC) respectively. However, the standards used for protection ofdrinking water supplies were not established with the objective ofprotecting good ecological status.
Given the uncertainty of nutrient/biological relationships and errorsassociatedwith determining ecological status, the task of setting thresh-old concentrations is clearly difficult. However, it is important that:
• the best available information and knowledge are used to derive nu-trient criteria;
• the BQEs used to derive nutrient criteria are sensitive to nutrients;• the most appropriate statistical techniques are used; if regression isnot feasible, categorical methods can be used (Phillips et al., 2018);
• the resulting thresholds are broadly aligned with the wider body ofpublished literature on nutrient limitation of primary production indifferent types of water bodies.
12 S. Poikane et al. / Science of the Total Environment 695 (2019) 133888
4.5. Implications for achieving ‘good’ ecological status
There are several implications that arise from setting inappropriatenutrient thresholds
1. Where threshold concentrations are too high (=relaxed), the crite-rion may be achieved without any biological response being ob-served. In this case, water bodies consequently fail to achieve goodecological status based on the BQE, even though they may meet theprescribed nutrient criterion.
2. Where nutrient criteria are based on a single element that is not thelimitingnutrient (orwhich fails to account for P andN co-limitation);or on a nutrient fractionwhich is only aminor component of the totalbioavailable nutrient pool and/or a poor indicator of overall nutrientsupply (see above), there may again be no observed biological re-sponse. The Redfield ratio (Tett et al., 1985) offers a rapid check ofthe likelihoodof N or P limitation that has practical benefits for deter-mining appropriate mitigation measures (e.g. Burson et al., 2016).
3. Where nutrient thresholds are too low (i.e. too stringent), a waterbody might be classified as moderate status, despite the BQE corre-sponding to good ecological status. In such cases, the mismatchmay cause measures to be implemented that are not strictlynecessary.
There may also be other reasons why good ecological status has notyet been achieved, despite implementation of restorationmeasures, butwhich are not a result of inappropriate nutrient criteria; for example(see Jarvie et al., 2013):
• Inadequate intensity and targeting of restoration measures;• Legacies of past land use management, which have accumulated nu-trient stores within the catchment and can continue to impair waterquality over timescales from years to decades and more (Carpenter,2005; Sharpley et al., 2013)
• Decoupling of algal growth responses to nutrient loadings caused by avariety of factors, such as luxury uptake of phosphorus by algae duringperiods of high P availability, grazing pressure, physical controls suchas flow regime, light availability and temperature, as well as otherpressures such as toxic substances and hydromorphological alter-ations;
• Recovery trajectories which are non-linear and characterized bythresholds and alternative stable states.
5. Conclusions
5.1. Problems in a nutshell
The problems can be summarised as follows:
1. Different nutrients (N and/or P) are used for different water catego-ries, based on prevailing assumptions that P is the most likely to bethe limiting nutrient in freshwaters while N is likely to be limitingin coastal waters. Therefore, only P is used to set nutrient thresholdsfor many river and lake types, and only N for some coastal and tran-sitional water types. Recent research has highlighted that co-limitation is more common than previously assumed so the use of asingle nutrient criterion should always be questioned.
2. There are many differences in the nutrient parameters assessed (sol-uble or total), the assessment period (summer, winter or all yearround), and in the metrics used (mean, median or 90th percentile),especially for coastal and transitionalwaters. These differences in nu-trient criteria may hamper the comparison of threshold concentra-tions, definition of common objectives and a consistentmanagement approach between countries and water categories.
3. In order to ensure good status is attained, nutrient criteria shouldbe derived from biological responses to nutrients. However, awide range of methods have been used by countries to set
nutrient criteria, and their relationship to good ecological statusis not always obvious. There is evidence that different approachesto criteria setting are likely to produce different results. For bothrivers and lakes, the lowest threshold concentrations are associ-ated with data-driven methods (modelling and regressionsagainst nutrient sensitive biological quality elements), and thehighest with expert judgement based methods (e.g., the use ofthe distribution of current nutrient concentrations measuredacross all water bodies in a country).
4. There are large variations in the nutrient threshold concentrationsused to support good ecological status within shared types, espe-cially for rivers and some types of lakes and transitional waters.Some variation is expected due to natural variation within broadtypes; however, we identify three major challenges for developingconsistent and effective nutrient criteria across European countries:(i) Many countries report a single nutrient threshold concentrationto protect good status for all their river types. (ii) Some countriesuse threshold concentrations that are significantly above known lim-iting nutrient concentrations (e.g. TP N 100 μg L−1 and TNN 1.7 mg L−1), reaching as high as 660 μg TP L−1 and35 mg TN L−1; (iii) countries using N criteria taken from drinkingwater standards, which were not intended to support good ecologi-cal status.
Taken together, these findings provide evidence that not all nationalapproaches to setting nutrient thresholds to support good ecologicalstatus are likely to achieve their goal.
5.2. Research agenda
5.2.1. Establishing threshold concentrations for both P and NAmple evidence has now accumulated to show that both P andN are
capable of contributing to eutrophication and, therefore, that both needto be managed.
5.2.2. Consistency in setting nutrient criteriaConsistent management of transboundary water bodies requires
that nutrient parameters are monitored and assessed in a consistentmanner between countries.
5.2.3. Establishing the nutrient concentration that would support good eco-logical status
Threshold concentrations should be based on causal relationshipsbetween nutrient(s) and nutrient sensitive biological variables, takinginto account the uncertainty of relationships and thus allowing arange of potential thresholds to be derived for specific water bodytypes and circumstances (Phillips et al., 2018).
Declaration of Competing Interest
The authors declare that they have no known competing financialinterests or personal relationships that could have appeared to influ-ence the work reported in this paper.
Acknowledgements
This work was carried out under the WFD Common Implementa-tion Strategy working group ECOSTAT work program. We greatly ac-knowledge the contributions of the ECOSTAT representatives andnational experts completing the questionnaires on nutrient criteriaand participating in the discussions. We also acknowledge the sub-stantive contribution to this work that was provided by the UK Envi-ronment Agency, the German Environment Agency, and FreshThoughts Consulting GmbH. We appreciate the detailed and helpfulcomments of anonymous reviewers who greatly contributed to im-proving the paper.
13S. Poikane et al. / Science of the Total Environment 695 (2019) 133888
Appendix A. Supplementary data
Supplementary data to this article can be found online at https://doi.org/10.1016/j.scitotenv.2019.133888.
References
Aigars, J., Müller-Karulis, B., Martin, G., Jermakovs, V., 2008. Ecological quality boundary-setting procedures: the Gulf of Riga case study. Env. Mon. Assess. 138 (1–3), 313–326.
Andersen, J.H., Schlüter, L., Ærtebjerg, G., 2006. Coastal eutrophication: recent develop-ments in definitions and implications for monitoring strategies. J. Plankton Res. 28(7), 621–628.
Baker, D.B., Confesor, R., Ewing, D.E., Johnson, L.T., Kramer, J.W., Merryfield, B.J., 2014.Phosphorus loading to Lake Erie from the Maumee, Sandusky and Cuyahoga rivers:the importance of bioavailability. J. Great Lakes Res. 40 (3), 502–517.
Birk, S., Bonne, W., Borja, A., Brucet, S., Courrat, A., Poikane, S., Solimini, A., van de Bund,W., Zampoukas, N., Hering, D., 2012. Three hundred ways to assess Europe's surfacewaters: an almost complete overview of biological methods to implement theWater Framework Directive. Ecol. Indic. 18, 31–41.
Birk, S., Willby, N.J., Kelly, M.G., Bonne, W., Borja, A., Poikane, S., van de Bund, W., 2013.Intercalibrating classifications of ecological status: Europe's quest for common man-agement objectives for aquatic ecosystems. Sci. Total Environ. 454, 490–499.
Black Sea Commission, 2008. State of the environment of the Black Sea (2001–2006/7).Publications of the Commission on the Protection of the Black Sea against Pollution(BSC) 2008-3. Istanbul, Turkey.
Blauw, A., Eleveld, M., Prins, T., et al., 2019. Coherence in assessment framework of chlo-rophyll a and nutrients as part of the EU project ‘Joint monitoring programme of theeutrophication of the North Sea with satellite data’. Activity 1 Report (86 pp).
Borgwardt, F., Robinson, L., Trauner, D., Teixeira, H., Nogueira, A.J.A., Lillebø, A.I., et al.,2019. Exploring variability in environmental impact risk from human activities acrossaquatic ecosystems. Sci. Total Environ. 652, 1396–1408.
Bowes, M.J., Ings, N.L., McCall, S.J., Warwick, A., Barrett, C., Wickham, H.D., Harman, S.A.,Armstrong, L.K., Scarlett, P.M., Roberts, C., Lehmann, K., Singer, A.C., 2012. Nutrientand light limitation of periphyton in the River Thames: implications for catchmentmanagement. Sci. Total Environ. 434, 201–212.
Bowes, M.J., Loewenthal, M., Read, D.S., Hutchins, M.G., Prudhomme, C., Armstrong, L.K.,Harman, S.A., Wickham, H.D., Gozzard, E., Carvalho, L., 2016. Identifying multiplestressor controls on phytoplankton dynamics in the River Thames (UK) using high-frequency water quality data. Sci. Total Environ. 569, 1489–1499.
Burkholder, J.M., Glibert, P.M., Skelton, H.M., 2008. Mixotrophy, a majormode of nutritionfor harmful algal species in eutrophic waters. Harmful Algae 8, 77–93.
Burson, A., Stomp, M., Akil, L., Brussaard, C.P., Huisman, J., 2016. Unbalanced reduction ofnutrient loads has created an offshore gradient from phosphorus to nitrogen limita-tion in the North Sea. Limnol. Oceanogr. 61 (3), 869–888.
Cardoso, A.C., Solimini, A., Premazzi, G., Carvalho, L., Lyche, A., Rekolainen, S., 2007. Phos-phorus reference concentrations in European lakes. Hydrobiologia 584 (1), 3–12.
Carpenter, S.R., 2005. Eutrophication of aquatic ecosystems: bistability and soil phospho-rus. PNAS 102 (29), 10002–10005.
Carstensen, J., Sánchez-Camacho, M., Duarte, C.M., Krause-Jensen, D., Marba, N., 2011.Connecting the dots: responses of coastal ecosystems to changing nutrient concen-trations. Env. Sci. Technol. 45 (21), 9122–9132.
Carvalho, L., McDonald, C., de Hoyos, C., Mischke, U., Phillips, G., Borics, G., et al., 2013. Sus-taining recreational quality of European lakes: minimizing the health risks from algalblooms through phosphorus control. J. Appl. Ecol. 50 (2), 315–332.
Carvalho, L., Mackay, E.B., Cardoso, A.C., Baattrup-Pedersen, A., Birk, S., Blackstock,K.L., et al., 2019. Protecting and restoring Europe's waters: an analysis of the fu-ture development needs of the Water Framework Directive. Sci. Total Environ.658, 1228–1238.
Charles, D.F., Tuccillo, A.P., Belton, T.J., 2019. Use of diatoms for developing nutrientcriteria for rivers and streams: a biological condition gradient approach. Ecol. Indic.96, 258–269.
Claussen, U., Zevenboom, W., Brockmann, U., Topcu, D., Bot, P., 2009. Assessment of theeutrophication status of transitional, coastal and marine waters within OSPAR.Hydrobiologia 629 (1), 49.
Culhane, F., Teixeira, H., Nogueira, A.J.A., Borgwardt, F., Trauner, D., Lillebø, A., et al., 2019.Risk to the supply of ecosystem services across aquatic ecosystems. Sci. Total Environ.660, 611–621.
Dafner, E.V., Boscolo, R., Bryden, H.L., 2003. The N:Si:Pmolar ratio in the Strait of Gibraltar.Geophys. Res. Lett. 30, 506–509.
Dave, G., Munawar, M., 2014. Aquatic ecosystems across boundaries: significance of inter-national agreements and cooperation. Aquat. Ecosyst. Health Manag. 17 (4),437–446.
Devlin, M., Painting, S., Best, M., 2007. Setting nutrient thresholds to support an ecologicalassessment based on nutrient enrichment, potential primary production and unde-sirable disturbance. Mar. Poll. Bull. 55 (1–6), 65–73.
Dinno, A., 2015. Nonparametric pairwise multiple comparisons in independent groupsusing Dunn's test. Stata J. 15 (1), 292–300.
Dodds,W.K., 2003.Misuse of inorganic N and soluble reactive P concentrations to indicatenutrient status of surface waters. J. N. Am. Benthol. Soc. 22, 171–181.
Dodds, W.K., Smith, V.H., 2016. Nitrogen, phosphorus, and eutrophication in streams. In-land Waters 6, 155–164.
Dodds, W.K., Welch, E., 2000. Establishing nutrient criteria in streams. J. N. Am. Benthol.Soc. 19, 186–196.
Dodds, W.K., Smith, V.H., Lohman, K., 2002. Nitrogen and phosphorus relationships tobenthic algal biomass in temperate streams. Can. J. Fish. Aquat. Sci. 59, 865–874.
Dodds, W.K., Carney, E., Angelo, R.T., 2006. Determining ecoregional reference conditionsfor nutrients, Secchi depth and chlorophyll a in Kansas lakes and reservoirs. Lake Res.Manag. 22 (2), 151–159.
Dolman, A.M., Mischke, U., Wiedner, C., 2016. Lake-type-specific seasonal patterns of nu-trient limitation in German lakes, with target nitrogen and phosphorus concentra-tions for good ecological status. Freshw. Biol. 61 (4), 444–456.
EC [European Commission], 2000. Directive 2000/60/EC of the European Parliament andof the Council of 23rd October 2000 establishing a framework for community actionin the field of water policy. Off. J. Eur. Communities (L327/1) (European Commission,Brussels).
EEA [European Environment Agency], 2018. European Waters. Assessment of Status andPressures 2018. EEA Report 7/2018. Publications Office of the European Union,Luxembourg.
Elliott, M., Quintino, V., 2007. The estuarine quality paradox, environmental homeostasisand the difficulty of detecting anthropogenic stress in naturally stressed areas. Mar.Pollut. Bull. 54, 640–645.
Flynn, K.J., Mitra, A., Glibert, P.M., Burkholder, J.M., 2018. Mixotrophy in harmful algalblooms: by whom, on whom, when, why, and what next. In: Glibert, P.M., Berdalet,E., Burford, M., et al. (Eds.), Global Ecology and Oceanography of Harmful AlgalBlooms. Springer, pp. 113–132.
Francoeur, S.N., 2001. Meta-analysis of lotic nutrient amendment experiments: detectingand quantifying subtle responses. J. North Am. Benthol. Soc. 20 (3), 358–368.
Free, G., Tierney, D., Little, R., Kelly, F.L., Kennedy, B., Plant, C., et al., 2016. Lake ecologicalassessment metrics in Ireland: relationships with phosphorus and typology parame-ters and the implications for setting nutrient standards. Biol. Environ. 116 (3),191–204.
Grizzetti, B., Pistocchi, A., Liquete, C., Udias, A., Bouraoui, F., van de Bund,W., 2017. Humanpressures and ecological status of European rivers. Sci. Rep. 7 (1), 205.
Guillaud, J.-F., Aminot, A., Delmas, D., Gohin, F., Lunven, M., Labry, C., Herbland, A., 2008.Seasonal variation of riverine nutrient inputs in the northern Bay of Biscay(France), and patterns of marine phytoplankton response. J. Mar. Syst. 72, 309–319.
Hecky, R.E., Kilham, P., 1988. Nutrient limitation of phytoplankton in fresh-water andma-rine environments - a review of recent-evidence on the effects of enrichment. Limnol.Oceanogr. 33, 796–822.
HELCOM, 2013. Approaches and methods for eutrophication target setting in the BalticSea region. Baltic Sea Environment Proceedings No. 133 (138 pp).
HELCOM, 2015. HELCOM Eutrophication Assessment. http://helcom.fi/helcom-at-work/projects/eutro-oper/.
HELCOM, 2017. HELCOM core indicator report. Online. ww.helcom.fi.Hering, D., Borja, A., Carstensen, J., Carvalho, L., Elliott, M., Feld, C.K., et al., 2010. The
European Water Framework Directive at the age of 10: a critical review of theachievements with recommendations for the future. Sci. Total Environ. 408 (19),4007–4019.
Howarth, R.W., Marino, R., 2006. Nitrogen as the limiting nutrient for eutrophication incoastal marine ecosystems: evolving views over three decades. Limnol. Oceanogr.51, 364–376.
Ibisch, R., Austnes, K., Borchardt, D. et al., 2016. European assessment of eutrophicationabatement measures across land-based sources, inland, coastal and marine waters.ETC/ICM Technical Report 2/2016, 98pp.
Jarvie, H.P., Withers, P.J.A., Neal, C., 2002. Review of robust measurement of phosphorus inriver water: sampling, storage, fractionation and sensitivity. Hydrol. Earth Syst. Sci. 6,113–131.
Jarvie, H.P., Sharpley, A.N., Withers, P.J.A., Scott, J.T., Haggard, B.E., Neal, C., 2013. Phospho-rus mitigation to control river eutrophication: murky waters, inconvenient truths,and “postnormal” science. J. Environ. Qual. 42, 295–304.
Jarvie, H.P., Smith, D.R., Norton, L.R., Edwards, F., Bowes, M.J., King, S.M., Scarlett, P.,Davies, S., Dils, R., Bachiller-Jareno, N., 2018. Phosphorus and nitrogen limitationand impairment of headwater streams relative to rivers in Great Britain: a nationalperspective on eutrophication. Sci. Total Environ. 621, 849–862.
Karl, D.M., 2000. Phosphorus, the staff of life. Nature 406, 31–32.Kelly, M., Urbanic, G., Acs, E., Bennion, H., Bertrin, V., Burgess, A., et al., 2014. Comparing
aspirations: intercalibration of ecological status concepts across European lakes forlittoral diatoms. Hydrobiologia 734 (1), 125–141.
Kelly, M.G., Chiriac, G., Soare-Minea, A., Hamchevici, C., Juggins, S., 2019. Use ofphytobenthos to evaluate ecological status in lowland Romanian lakes. Limnologica125682.
Laane, R.W.P.M., Brockmann, U., Van Liere, L., Bovelander, R., 2005. Immission targets fornutrients (N and P) in catchments and coastal zones: a North Sea assessment. Estuar.Coast. Shelf Sci. 62 (3), 495–505.
Lazzari, P., Solidoro, C., Salon, S., Bolon, G., 2016. Spatial variability of phosphateand nitrate in the Mediterranean Sea: a modeling approach. Deep Sea Res108, 39–52.
Lyche Solheim, A., Persson, J., Austnes, K., Moe, J., Kampa, E., Stein, U., et al., 2015.European freshwater ecosystem assessment: cross-walk between the water frame-work directive and habitats directive types, status and pressures. ETC/ICM TechnicalReport 2 (2015).
Lyche Solheim, A., Austnes, K., Globevnik, L., Kristensen, P., Moe, S.J., Persson, J., Phillips, G.,Poikane, S., van de Bund, W., Birk, S., 2019. A new broad typology for rivers and lakesin Europe: development and application for large-scale environmental assessments.Sci. Tot. Environ. (In press).
Lyche, A., Andersen, T., Christoffersen, K., Hessen, D.O., Berger Hansen, P.H.,Klysner, A., 1996. Mesocosm tracer studies. 1. Zooplankton as sources andsinks in the pelagic phosporus cycle of a mesotrophic lake. Limnol. Oceanogr.41, 460–474.
14 S. Poikane et al. / Science of the Total Environment 695 (2019) 133888
Marchetto, A., Padedda, B.M., Mariani, M.A., Luglie, A., Sechi, N., 2009. A numerical indexfor evaluating phytoplankton response to changes in nutrient levels in deep mediter-ranean reservoirs. J. Limnol. 68 (1), 106–121.
Munn, M.D., Waite, I., Korrad, C.P., 2018. Assessing the influence of multiple stressors onstream diatom metrics in the upper Midwest, USA. Ecol. Indic. 85, 1239–1248.
Nausch, M., Nausch, G., 2006. Bioavailability of dissolved organic phosphorus in the BalticSea. Mar. Ecol. Progr. Series 321, 9–17.
OECD [Organisation for Economic Co-operation and Development], 1982. Eutrophicationof Waters – Monitoring. Assessment and Control OECD, Paris, p. 154.
OSPAR [The Convention for the Protection of the Marine Environment of the North-EastAtlantic] 2013. Common Procedure for the Identification of the Eutrophication Statusof the OSPAR Maritime Area (Reference number: 2013-8), OSPAR Commission,London, https://www.ospar.org/work-areas/hasec/eutrophication/common-procedure.
Paerl, H.W., Otten, T.G., Kudela, R., 2018. Mitigating the expansion of harmful algal bloomsacross the freshwater-to-marine continuum. Environ. Sci. Technol. 52, 5519–5529.
Phillips, G., Pitt, J.-A., 2016. A comparison of European freshwater nutrient boundariesused for theWater Framework Directive: a report toWGECOSTAT. University CollegeLondon Available via. https://circabc.europa.eu/w/browse/58a2363a-c5f1-442f-89aa-5cec96ba52d7.
Phillips, G., Pietiläinen, O.P., Carvalho, L., Solimini, A., Solheim, A.L., Cardoso, A.C., 2008.Chlorophyll–nutrient relationships of different lake types using a large Europeandataset. Aquat. Ecol. 42 (2), 213–226.
Phillips, G., Kelly, M., Teixeira, H., Salas, F., Free, G., Leujak, W., et al., 2018. Best practice forestablishing nutrient concentrations to support good ecological status. Technical Re-port EUR 29329 EN. Publications Office of the European Union, Luxembourg.
Poikāne, S., Alves, M.H., Argillier, C., Van den Berg, M., Buzzi, F., Hoehn, E., et al., 2010. De-fining chlorophyll-a reference conditions in European lakes. Environ. Manag. 45 (6),1286–1298.
Poikane, S., Zampoukas, N., Borja, A., Davies, S.P., van de Bund, W., Birk, S., 2014. Intercal-ibration of aquatic ecological assessment methods in the European Union: lessonslearned and way forward. Environ. Sci. Pol. 44, 237–246.
Poikane, S., Birk, S., Böhmer, J., Carvalho, L., de Hoyos, C., Gassner, H., et al., 2015. Ahitchhiker's guide to European lake ecological assessment and intercalibration. Ecol.Indic. 52, 533–544.
Poikane, S., Phillips, G., Birk, S., Free, G., Kelly, M.G., Willby, N.J., 2019. Deriving nutrientcriteria to support ʽgoodʼ ecological status in European lakes: an empirically based ap-proach to linking ecology and management. Sci. Total Environ. 650, 2074–2084.
R Core Team, 2019. R: A Language and Environment for Statistical Computing. R Founda-tion for Statistical Computing, Vienna, Austria https://www.R-project.org/.
Reyjol, Y., Argillier, C., Bonne,W., Borja, A., Buijse, A.D., Cardoso, A.C., et al., 2014. Assessingthe ecological status in the context of the European Water Framework Directive:where do we go now? Sci. Total Environ. 497, 332–344.
Salas Herrero, F., Teixeira, H., Poikane, S., 2019. A novel approach for deriving nutrientcriteria to support good ecological status: application to coastal and transitional wa-ters and indications for use. Front. Mar. Sci. 6, 255.
Schernewski, G., Friedland, R., Carstens, M., Hirt, U., Leujak, W., Nausch, G., Neumann, T.,Petenati, T., Sagert, S., Wasmund, N., von Weber, M., 2015. Implementation ofEuropean marine policy: new water quality targets for German Baltic waters. Mar.Pol. 51, 305–321.
Schindler, D.W., Hecky, R.E., Findlay, D.L., Stainton, M.P., Parker, B.R., Paterson, M.J., et al.,2008. Eutrophication of lakes cannot be controlled by reducing nitrogen input: re-sults of a 37-year whole-ecosystem experiment. Proc. Natl. Acad. Sci. U. S. A. 105,11254–11258.
Scott, J.T., McCarthy, M.J., 2010. Nitrogen fixation may not balance the nitrogen pool inlakes over timescales relevant to eutrophication management. Limnol. Oceanogr.56, 1548–1550.
Sharpley, A., Jarvie, H.P., Buda, A., May, L., Spears, B., Kleinman, P., 2013. Phosphorus leg-acy: overcoming the effects of past management practices to mitigate future waterquality impairment. J. Environ. Qual. 42 (5), 1308–1326.
Suplee, M.W., Varghese, A., Cleland, J., 2007. Developing nutrient criteria for streams: anevaluation of the frequency distribution method. J. Am. Water Resour. Assoc. 43(2), 453–472.
Tamminen, T., Andersen, T., 2007. Seasonal phytoplankton nutrient limitation patterns asrevealed by bioassays over Baltic Sea gradients of salinity and eutrophication. Mar.Ecol. Progr. Ser. 340, 121–138.
Tett, P., Droop, M.R., Heaney, S.I., 1985. The Redfield ratio and phytoplankton growth rate.J. Mar. Biol. Assoc. UK 65 (2), 487–504.
Thingstad, T.F., Krom, M.D., Mantoura, R.F.C., Flaten, G.A.F., Groom, S., Herut, B., Kress, N.,Law, C.S., Pasternak, A., Pitta, P., Psarra, S., Rassoulzadegan, F., Tanaka, T., Tselepides,A., Wassmann, P., Woodward, E.M.S., Wexels Riser, C., Zodiatis, G., Zohary, T., 2005.Nature of phosphorus limitation in the ultraoligotrophic Eastern Mediterranean. Sci-ence 309, 1068–1071.
Tyrrell, T., 1999. The relative influences of nitrogen and phosphorus on oceanic primaryproduction. Nature 400, 525–531.
Vollenweider, R.A., 1976. Advances in defining critical loading levels for phosphorus inlake eutrophication. Mem. Ist. Ital. Idrobiol. 33, 53–83.
Whitton, B.A., Neal, C., 2011. Organic phosphate in UK rivers and its relevance to algal andbryophyte surveys. Ann. Limnol. Int. J. Lim. 47, 3–10.
Willby, N., Pitt, J.A., Phillips, G., 2012. The ecological classification of UK lakes using aquaticmacrophytes. Report – SC010080/R2. Environment Agency, Bristol.