Embed Size (px)
Citation preview
Science and Engineering Applications 2(1) (2017) 112-120 ISSN-2456-2793(Online)
©JFIPS, India http://www.jfips.com/
Compatibility Studies of Polyacrylamide/Nanoclay/Copper oxide
Nanocomposites on the Fluidic Physical Properties for Improvement of
Inkjet Printability Neetika Singh, Hari Madhav, Paramjit Singh, and Gautam Jaiswar*
Department of Chemistry, Dr. B. R. Ambedkar University, Agra- 282 002, India
*Email: [email protected]
Abstract
Water-borne ink, an industrially important ink based on the polyacrylates, in that polyacrylamides imparts specific properties to the inks. Some
properties of inks such as glossy or hardness is also adjust by varying the polymers, so in the present studies, nanocomposites of Polyacrylamide
/Nanoclay/copper oxide nanoparticles were synthesized. The Nanoclay and Nanoparticles were varied to 0.5, 1 and 2% with respect to monomer
of acrylamide and the effect on physical properties of ink such as, density, viscosity, surface tension, drying and smudging were observed to see
the performance of it on polymer nanocomposites mixed in ink. The final product were characterized by UV-Vis and FTIR spectroscopy to see the
presence of individual component of nanocomposites. It was found that the solution with polymer nanocomposites shows, improved in the physical
properties with variation of 2% with respect to ink solution. Finally the biological activities were performed to see the effect of it on the ink solution.
Keywords: Copper oxide nanoparticles, Inkjet Ink, Nanoclay, Polyacrylamide, Survismeter.
Received : 28/1/2017 Published online : 5/4/2017
1. Introduction
Ink occupy an integral and versatile position in our daily life. On the basis of
different types and uses, researchers defined ink in various ways but in simplest
description, ink is a liquid or semi-liquid material used for writing, printing, or
drawing. In the chemist’s point of view, the ink is a colloidal system of fine
pigments particles which are dispersed in a solvent [1]. There are mainly four
elements of ink i.e. colorant, vehicle, solvent, and additives [2]. The first man
made ink dates back to 4,500 years in Egypt, which consisted of a mixture of
animal or vegetable charcoal (lampblack) and glue [3, 4].
On the basis of colorant, the ink is basically divided in two parts i.e. dye based
ink and pigment based ink. Some of the printing inks are; Quick-Set Ink, Heat-
Set Ink, Moisture-Set Ink, Radiation-Curing Ink, High-Gloss Ink, Metallic Ink,
Magnetic Ink, Fluorescents Ink, and Scuff-Resistant Ink [5].
In solvent-borne inks, the main polymers are based on nitrocellulose but in water-
borne ink the main polymers are based on polyacrylates. Many of the
homopolymers or copolymers of polyacrylates were widely used in water-borne
inks such as polyurethanes, polyacrylamide and polyesters are useful in imparting
specific properties of inks. Some properties of inks such as glossy or hardness is
also adjust by polymers. The final properties of inks are depends on the reactivity
of ink components with polymers. For e.g. the applicability and colour strength
of ink is affected when polymer-surfactants interaction detract from fine
properties such as dispersion stability [6-8].
Nanoclay is used to improve the ink properties such as avoiding pigment
sedimentation, to provide good colour distribution, to obtained desired film
thickness, reduction in misting, etc. [9]. The nanoparticles are Au, Ag, Cu, TiO2,
Fe3O4 etc. which were used to improve various properties of inkjet ink. Gold,
silver and Magnetic nanoparticles can be easily screen printed on to various type
of paper with the nanoparticles being so small that they seep into the paper’s pores
[10, 11].
So, in the present research work, an attempt were made to synthesis polymer
nanocomposites of PAM/ Nanoclay/ CuO nanoparticles and were treated with
Inkjet printer ink cyan, magenta and yellow to see the effect on density, viscosity,
surface tension, drying, smudging and antibacterial activity.
2 Experimental Details
2.1 MATERIALS USED
Acrylamide was purchased from Alfa Aesar, Germany. BPO, Ceric Ammonium
Nitrate, HNO3, HCl and Glacial acetic acid were obtained from Merck India.
Acetone and NaOH were obtained from Fisher Scientific, India. Ethanol was
purchased from Changshu Yangyuan Chemical, China. Double distilled water
was purchased from Veb Research Laboratory, India. Cupric acetate was obtained
from S. D. Fine-Chem. Ltd. India. Nanoclay (alkyl quaternary ammonium
bentonite) was requested from Esan Eczacıbaşı Endüstriyel Hammaddeler San.
Ve Tic. A. Ş. Istanbul, Turkey. nkjet ink was obtained from Pro-Dot, Datalink
Industrial Corporation, India. Desmat Glossy Paper was obtained from, Rational
Business Corporation Pvt. Ltd., India. All chemicals and materials are used as
they received and stored in a cool place.
2.2 CHARACTERIZATION
2.2.1 Density
The density of ink was calculated at t0C by density bottle using
the following expression [12],
𝜌 = 𝑤𝑡. 𝑜𝑓 𝑡ℎ𝑒 𝑙𝑖𝑞𝑢𝑖𝑑
𝑤𝑡. 𝑜𝑓 𝑒𝑞𝑢𝑎𝑙 𝑣𝑜𝑙𝑢𝑚𝑒 𝑜𝑓 𝑤𝑎𝑡𝑒𝑟× 𝐷𝑒𝑛𝑠𝑖𝑡𝑦 𝑜𝑓 𝑤𝑎𝑡𝑒𝑟 𝑎𝑡 𝑡0𝐶
2.2.2 Viscosity
The ink viscosity was measured by survismeter, which is patented instrument for
viscosity, surface tension and interfacial tension measurements and invented by
Prof. Man Singh [13], and calculated from the conventional formula-
ղ = (ρt
ρrtr
) ղ r
Where η and ηr are the viscosities, t and tr are the flow times, and ρ and ρr are the
densities of the measured and reference liquids at the given temperature,
respectively.
2.2.3 Surface Tension
The ink surface tension were also measured by the same Survismeter and surface
tension coefficient is calculated using the standard formula.
𝛾 = (𝜂𝑟 𝜌
𝜂𝜌𝑟
) 𝛾𝑟
Where, γ, γr = surface tension of sample and reference, η, ηr = number of drops
of sample and reference, ρ, ρr = density of sample and reference [13].
2.2.4 Drying
Contents lists available at JFIPS
Science and Engineering Applications
Journal home page: JFIPS SAEA
Neetika Singh, Hari Madhav, Paramjit Singh, and Gautam Jaiswar , Science and Engineering Applications 2(1) (2017) 112-120
©JFIPS, India http://www.jfips.com/
113
The test was performed on Desmat Glossy Paper at temperature 250 C. In this test,
the pattern of prepared ink samples were marked on glossy paper with the help of
drawing brush and the drying time was noted with the help of stopwatch.
2.2.5 Smudging
The test was performed on Desmat Glossy Paper at temperature 250 C. In this test,
the pattern of prepared ink samples were marked on glossy paper with the help of
drawing brush and smudged the ink with the help of hand thumb after interval of
3 sec.
2.2.6 UV-Vis Spectroscopy
UV-Vis. absorption spectra of polymer nanocomposite mixed ink samples were
obtained using a LABINDIA 3000+ Double beam spectrophotometer. The scan
range was from 300.00 to 1100.00 nm.
2.2.7 FTIR Spectroscopy
The FTIR spectra of ink samples were obtained by the instrument Bruker Alfa
FT-IR/FT-IR (ATR Mode) with ZnSe crystal.
2.2.8 Antimicrobial Test
The antimicrobial activity of the polymer nanocomposites modified ink was
tested against E. coli bacteria using by disc diffusion method. Nutrient agar plates
were prepared, sterilized and solidified. After solidification, bacterial cultures
were swabbed on the Petridish. The pure CuO nanoparticles, pure magenta, cyan,
yellow ink and the sample code PNCM6, PNCC9 and PNCY9 were placed in the
E. coli bacterial cultured nutrient agar plate and kept for incubation at 37 0C for
24 hrs. to see the effect of polymer nanocomposites modified ink against bacteria.
2.3 SYNTHESIS
2.3.1 Synthesis of CuO Nanoparticles
Nanoparticles of CuO were prepared by previously reported Sol-Gel method [14].
0.2 M cupric acetate solution was taken in a cleaned round bottom flask. 1 ml of
glacial acetic acid was added to above aqueous solution and heated at 1000C with
constant stirring on magnetic stirrer. Solution of 8 M NaOH was added drop wise
to above solution and heated till pH 7 is obtained and the colour of solution
immediately changed from blue to black. The large amount of black precipitate
of CuO nanoparticles were formed immediately which was collected. The
precipitate was centrifuged and washed 3-4 times with deionized water and dried
in air for 24 h.
2.3.2 Preparation of PAM/Nanoclay/CuO Nanocomposites
The solution of nanoclay was added drop wise in aqueous solution of acrylamide.
Both initiator BPO and appropriate solution of ceric ammonium nitrate in 1N
nitric acid (HNO3) were added and heated at 700C with continuous stirring to
complete polymerization. After 30 min, the sonicated CuO nanoparticles were
carefully and slowly mixed in this polymerized solution. The prepared polymer
nanocomposite was vigorously stirred for 4-5 hours to from viscous solution. The
solution was taken in petridish and precipitated in access of acetone in acidic
medium. This synthetic process was repeated for the variation studies of nanoclay
and nanoparticles, which was provide in table 1.
Table 1 Mixing Concentration of AAm/CuO/Nanoclay
Sample Code Acrylamide (AAm) (gm.) Nanoclay (gm.) CuO (gm.)
PNC 2 0.0 0.0
PNC51 2 0.1 0.02
PNC52 2 0.1 0.04
PNC54 2 0.1 0.08
PNC101 2 0.2 0.02
PNC102 2 0.2 0.04
PNC104 2 0.2 0.08
PNC201 2 0.4 0.02
PNC202 2 0.4 0.04
PNC204 2 0.4 0.08
The synthesized polymer nanocomposites were applied in ink and examined for
various parameters of ink.
2.3.3 Preparation of Ink samples with Polymer Nanocomposites
The different sets of ink were prepared by mixing of polymer nanocomposites in
three different main colour CMY ink. The ink samples were prepared by varying
the different concentration of polymer nanocomposites in ink. Each polymer
nanocomposites mixed with ink in variation of 0.5%, 1% and 2% in 30 ml of ink
respectively. The detailed mixing for the formation of final polymer
nanocomposites in inks is shown in table 2.
Table 2 Detail Mixing for the Formation of Final Polymer Nanocomposites in
Ink
Name of
Ink
Code of
Polymer
Nano-
composite
Quantity
of Ink
(ml.)
Quantity of
Polymer
Nano-
composites
(gm.)
Percentage
of Polymer
Nano-
composites
in Ink
Code of
Sample
Magenta
PNC52 30
0.158 0.5% PNCM1
0.316 1.0% PNCM2
0.632 2.0% PNCM3
PNC54 30
0.158 0.5% PNCM4
0.316 1.0% PNCM5
0.632 2.0% PNCM6
Cyan
PNC101 30
0.155 0.5% PNCC1
0.311 1.0% PNCC2
0.622 2.0% PNCC3
PNC102 30
0.155 0.5% PNCC4
0.311 1.0% PNCC5
0.622 2.0% PNCC6
PNC104 30
0.155 0.5% PNCC7
0.311 1.0% PNCC8
0.622 2.0% PNCC9
Yellow
PNC201 30
0.156 0.5% PNCY1
0.313 1.0% PNCY2
0.626 2.0% PNCY3
PNC202 30
0.156 0.5% PNCY4
0.313 1.0% PNCY5
0.626 2.0% PNCY6
PNC204 30
0.156 0.5% PNCY7
0.313 1.0% PNCY8
0.626 2.0% PNCY9
The properties of prepared ink samples were studied on the basis of following
physical parameters such as; Density, viscosity, surface tension, drying,
smudging.
3 Results and Discussions
3.1 Effect of Polymer Nanocomposites on Density of Ink
Density has traditionally been used as the primary means to control the printing
process. It has been widely held that it correlates well with the amount of colorant
that is put on the paper over a limited range of ink film thicknesses [15]. After
adding synthesized polymer nanocomposites in inks, the minor difference was
observed in density of mixed polymer nanocomposites inks and pure inks, and it
was observed that, the density was increased as comparison to the pure ink. The
data of density was given in the table 3. After adding polymer nanocomposites in
ink, the different graphs of density data were observed with different variations.
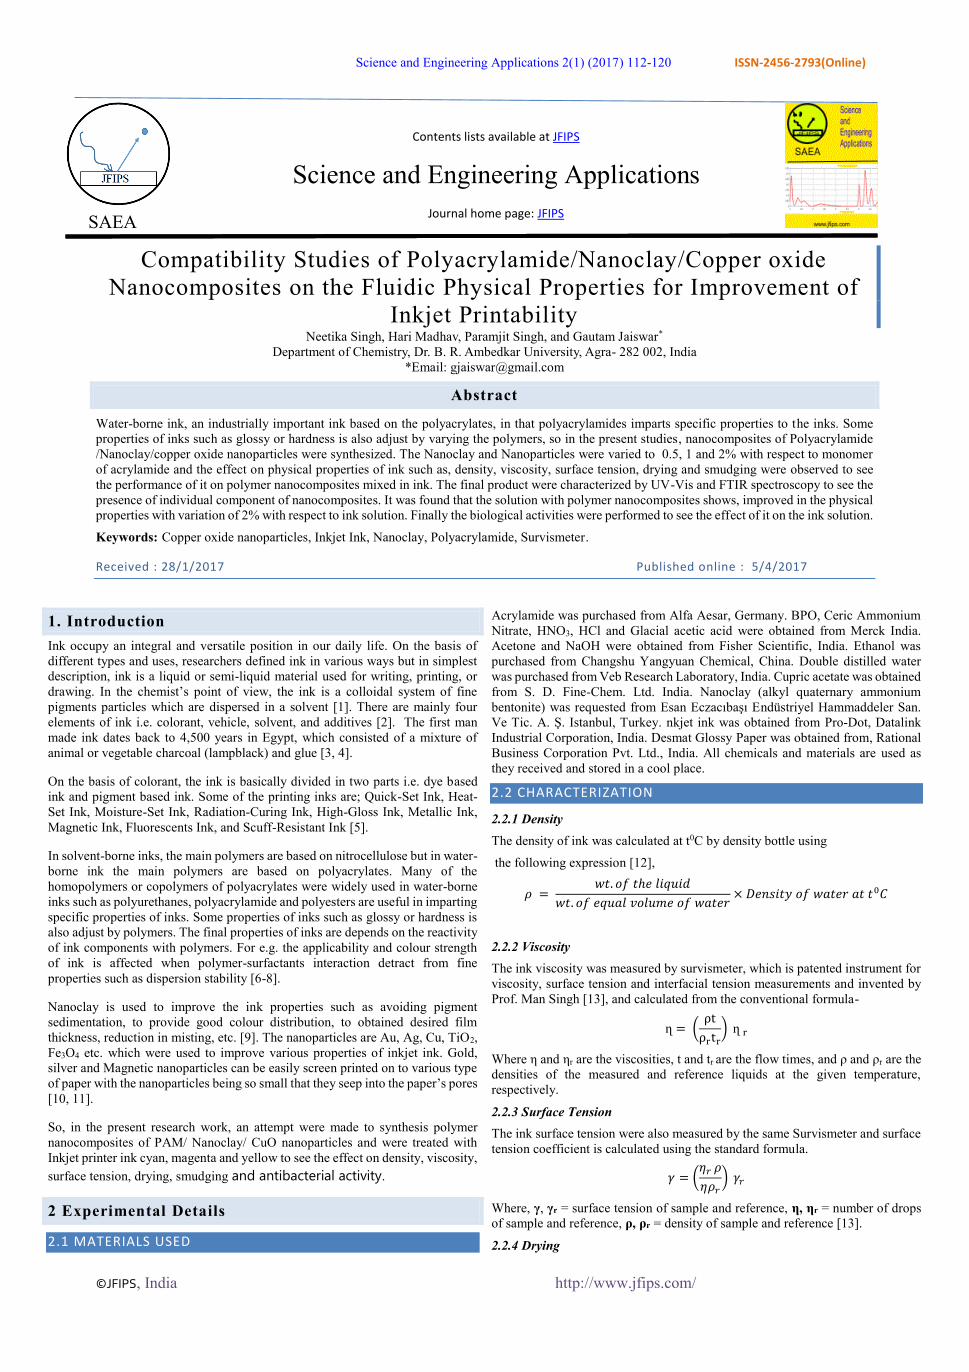
Graphical representation of magenta ink in figure 1 shows that, the density of pure
Neetika Singh, Hari Madhav, Paramjit Singh, and Gautam Jaiswar , Science and Engineering Applications 2(1) (2017) 112-120
©JFIPS, India http://www.jfips.com/
114
magenta ink was 1.053. After adding the polymer nanocomposites PNC52 and
PNC54 in the variation of 0.5%, 1% and 2% with respect to the ink, it was
observed that the density increases for each variation as compare to that of pure
ink. It was observed that in all the samples, the density got increases at every
steps.
Table 3 Experimental Density Data of Ink Samples
Colour of Ink
Density of Pure Ink (gm./cm3)
Sample Code
% of Polymer Nanocomposites in Ink
Density of Ink mixed with PNCs (gm./cm3)
Magenta
1.053
PNC52
0.5 1.055
1 1.059
2 1.066
PNC54
0.5 1.064
1 1.068
2 1.083
Cyan
1.037
PNC101
0.5 1.040
1 1.043
2 1.046
PNC102
0.5 1.076
1 1.083
2 1.095
PNC104
0.5 1.040
1 1.044
2 1.050
Yellow
1.044
PNC201
0.5 1.047
1 1.052
2 1.056
PNC202
0.5 1.050
1 1.058
2 1.063
PNC204
0.5 1.015
1 1.057
2 1.062
Fig. 1 Density Curves of Magenta Ink Samples
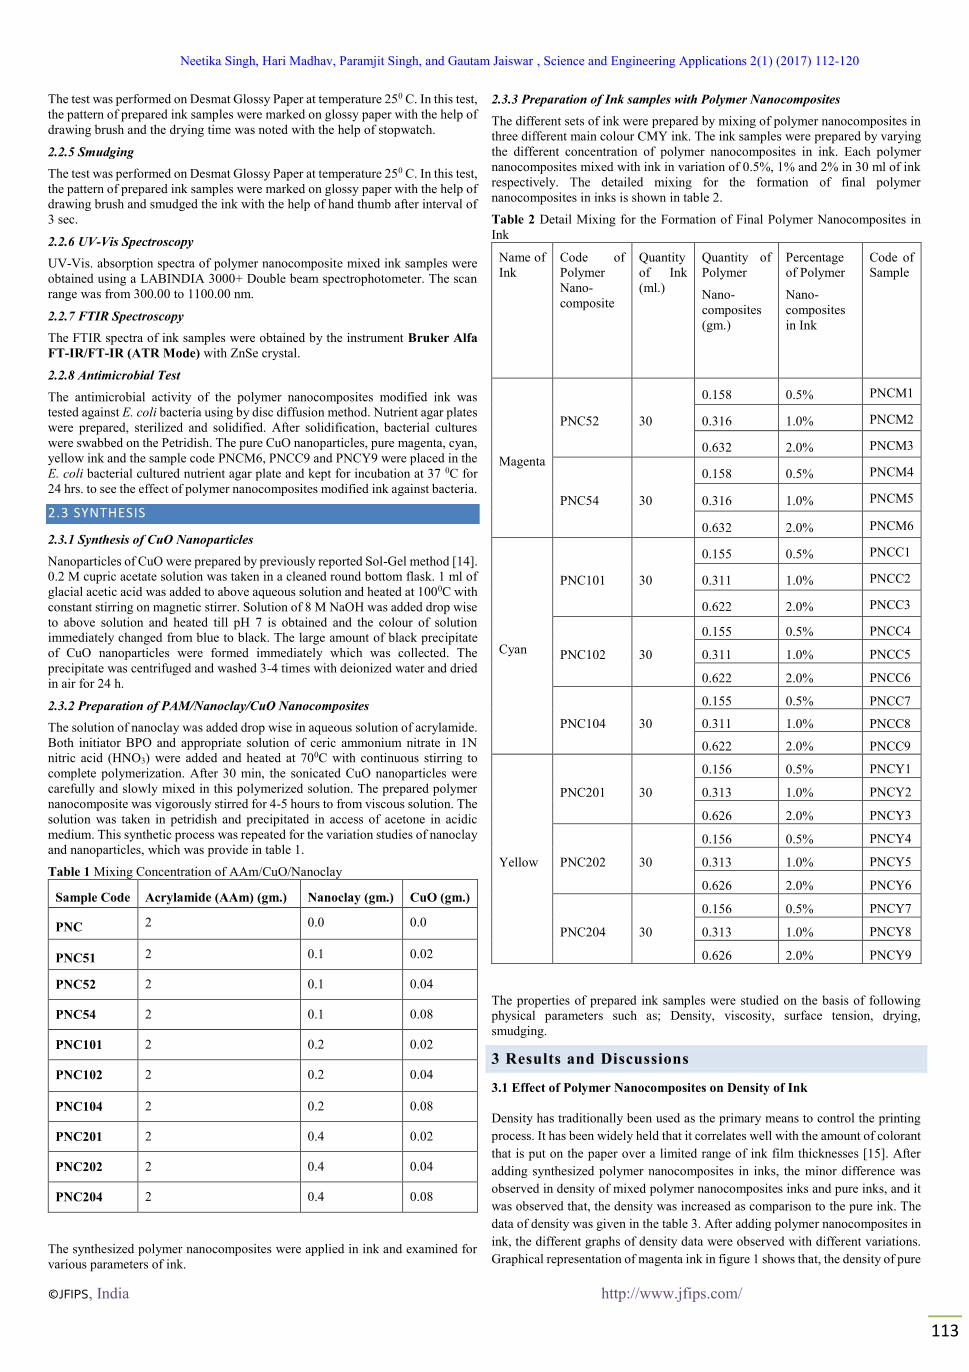
Graphical representation of cyan ink in figure 2 shows that, the density of pure
cyan ink was 1.037. After adding the polymer nanocomposites PNC101, PNC102
and PNC104 in the variation of 0.5%, 1% and 2% with respect to the ink, it was
observed that the density of all the samples increased at every step.
Fig. 2 Density Curves of Cyan Ink Samples
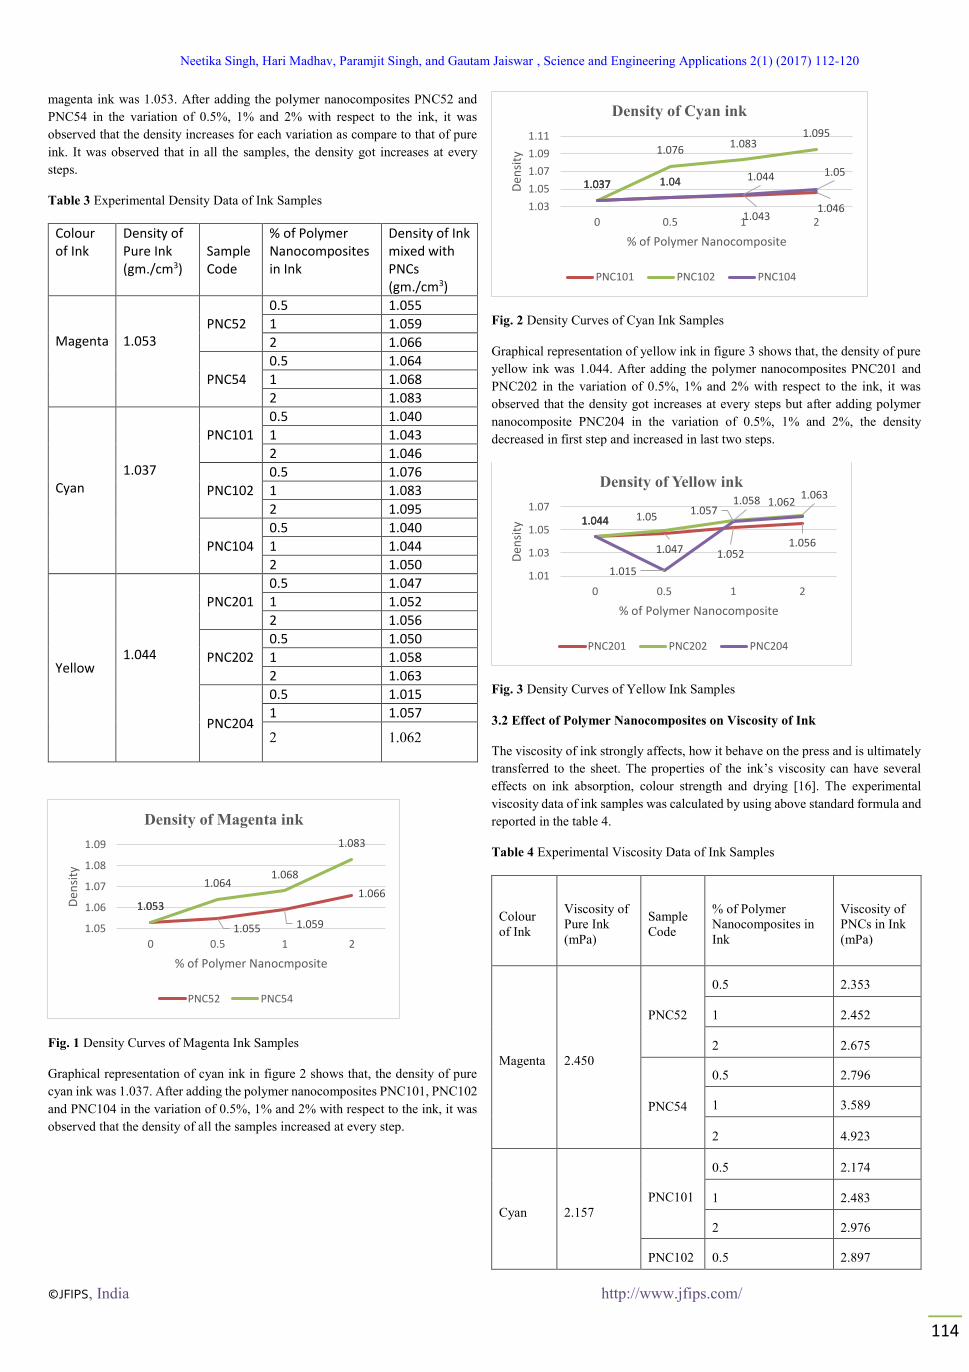
Graphical representation of yellow ink in figure 3 shows that, the density of pure
yellow ink was 1.044. After adding the polymer nanocomposites PNC201 and
PNC202 in the variation of 0.5%, 1% and 2% with respect to the ink, it was
observed that the density got increases at every steps but after adding polymer
nanocomposite PNC204 in the variation of 0.5%, 1% and 2%, the density
decreased in first step and increased in last two steps.
Fig. 3 Density Curves of Yellow Ink Samples
3.2 Effect of Polymer Nanocomposites on Viscosity of Ink
The viscosity of ink strongly affects, how it behave on the press and is ultimately
transferred to the sheet. The properties of the ink’s viscosity can have several
effects on ink absorption, colour strength and drying [16]. The experimental
viscosity data of ink samples was calculated by using above standard formula and
reported in the table 4.
Table 4 Experimental Viscosity Data of Ink Samples
Colour
of Ink
Viscosity of
Pure Ink
(mPa)
Sample
Code
% of Polymer
Nanocomposites in
Ink
Viscosity of
PNCs in Ink
(mPa)
Magenta 2.450
PNC52
0.5 2.353
1 2.452
2 2.675
PNC54
0.5 2.796
1 3.589
2 4.923
Cyan 2.157
PNC101
0.5 2.174
1 2.483
2 2.976
PNC102 0.5 2.897
1.053
1.055 1.059
1.0661.053
1.0641.068
1.083
1.05
1.06
1.07
1.08
1.09
0 0.5 1 2
Den
sity
% of Polymer Nanocmposite
Density of Magenta ink
PNC52 PNC54
1.037 1.04
1.0431.046
1.037
1.0761.083
1.095
1.037 1.04 1.044 1.05
1.03
1.05
1.07
1.09
1.11
0 0.5 1 2
Den
sity
% of Polymer Nanocomposite
Density of Cyan ink
PNC101 PNC102 PNC104
1.044
1.047 1.0521.056
1.044 1.05
1.058 1.063
1.044
1.015
1.0571.062
1.01
1.03
1.05
1.07
0 0.5 1 2
Den
sity
% of Polymer Nanocomposite
Density of Yellow ink
PNC201 PNC202 PNC204
Neetika Singh, Hari Madhav, Paramjit Singh, and Gautam Jaiswar , Science and Engineering Applications 2(1) (2017) 112-120
©JFIPS, India http://www.jfips.com/
115
1 3.269
2 4.176
PNC104
0.5 2.130
1 2.239
2 2.636
Yellow 1.169
PNC201
0.5 1.397
1 1.246
2 1.410
PNC202
0.5 2.319
1 2.541
2 2.807
PNC204
0.5 1.015
1 1.355
2 2.208
After adding polymer nanocomposites in ink, the following graphs of viscosity
data were observed with different variations. Graphical representation of magenta
ink in figure 4 shows that, the viscosity of pure magenta ink was 2.450. After
adding polymer nanocomposite PNC52 in the variation of 0.5%, 1% and 2% with
respect to the ink, it was observed that the viscosity got decreases in first step and
got increases in remaining two steps but After adding the polymer nanocomposite
PNC54 in the variation of 0.5%, 1% and 2%, it was observed that the viscosity
got increases at every steps.
Fig. 4 Viscosity Curve of Magenta Ink Samples
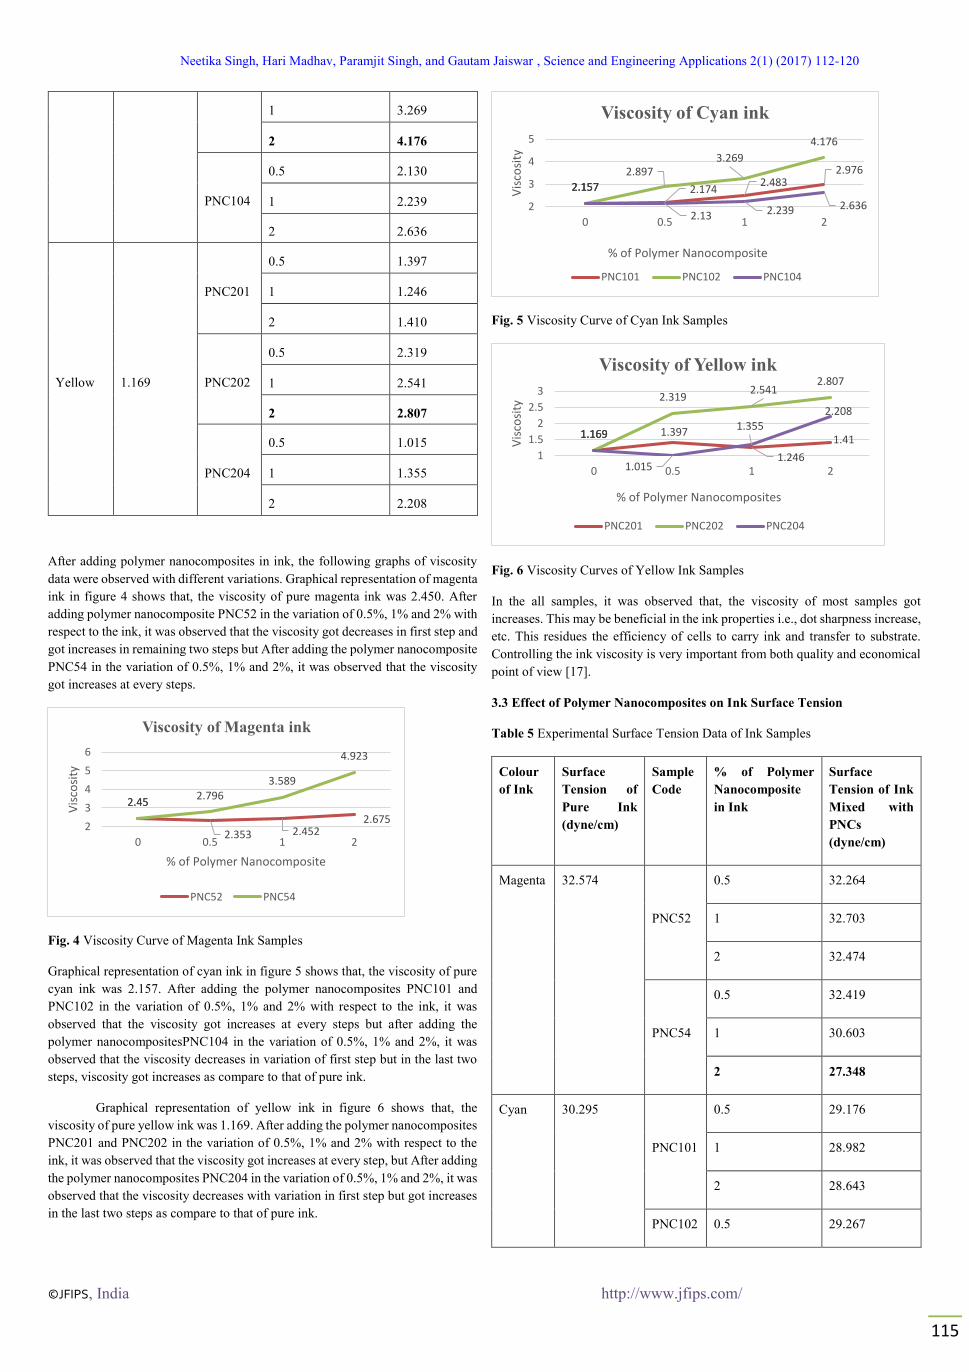
Graphical representation of cyan ink in figure 5 shows that, the viscosity of pure
cyan ink was 2.157. After adding the polymer nanocomposites PNC101 and
PNC102 in the variation of 0.5%, 1% and 2% with respect to the ink, it was
observed that the viscosity got increases at every steps but after adding the
polymer nanocompositesPNC104 in the variation of 0.5%, 1% and 2%, it was
observed that the viscosity decreases in variation of first step but in the last two
steps, viscosity got increases as compare to that of pure ink.
Graphical representation of yellow ink in figure 6 shows that, the
viscosity of pure yellow ink was 1.169. After adding the polymer nanocomposites
PNC201 and PNC202 in the variation of 0.5%, 1% and 2% with respect to the
ink, it was observed that the viscosity got increases at every step, but After adding
the polymer nanocomposites PNC204 in the variation of 0.5%, 1% and 2%, it was
observed that the viscosity decreases with variation in first step but got increases
in the last two steps as compare to that of pure ink.
Fig. 5 Viscosity Curve of Cyan Ink Samples
Fig. 6 Viscosity Curves of Yellow Ink Samples
In the all samples, it was observed that, the viscosity of most samples got
increases. This may be beneficial in the ink properties i.e., dot sharpness increase,
etc. This residues the efficiency of cells to carry ink and transfer to substrate.
Controlling the ink viscosity is very important from both quality and economical
point of view [17].
3.3 Effect of Polymer Nanocomposites on Ink Surface Tension
Table 5 Experimental Surface Tension Data of Ink Samples
Colour
of Ink
Surface
Tension of
Pure Ink
(dyne/cm)
Sample
Code
% of Polymer
Nanocomposite
in Ink
Surface
Tension of Ink
Mixed with
PNCs
(dyne/cm)
Magenta 32.574
PNC52
0.5 32.264
1 32.703
2 32.474
PNC54
0.5 32.419
1 30.603
2 27.348
Cyan 30.295
PNC101
0.5 29.176
1 28.982
2 28.643
PNC102 0.5 29.267
2.45
2.353 2.4522.675
2.452.796
3.589
4.923
2
3
4
5
6
0 0.5 1 2
Vis
cosi
ty
% of Polymer Nanocomposite
Viscosity of Magenta ink
PNC52 PNC54
2.157 2.1742.483
2.976
2.157
2.8973.269
4.176
2.157
2.13 2.239 2.6362
3
4
5
0 0.5 1 2
Vis
cosi
ty
% of Polymer Nanocomposite
Viscosity of Cyan ink
PNC101 PNC102 PNC104
1.169 1.397
1.246
1.411.169
2.3192.541
2.807
1.169
1.015
1.3552.208
1
1.5
2
2.5
3
0 0.5 1 2
Vis
cosi
ty
% of Polymer Nanocomposites
Viscosity of Yellow ink
PNC201 PNC202 PNC204
Neetika Singh, Hari Madhav, Paramjit Singh, and Gautam Jaiswar , Science and Engineering Applications 2(1) (2017) 112-120
©JFIPS, India http://www.jfips.com/
116
1 29.136
2 29.099
PNC104
0.5 30.786
1 29.843
2 28.074
Yellow 37.859
PNC201
0.5 37.847
1 37.999
2 37.411
PNC202
0.5 29.639
1 29.943
2 30.005
PNC204
0.5 38.426
1 36.328
2 35.958
Surface tension is an important physical property of inks, which was determining
ink meniscus recovery and drop formation from the print head nozzle. For
example, a low surface tension can result in excessive nozzle faceplate wetting
leading to poor ink ejection, thereby affecting jet reliability. On the other hand a
high surface tension can lead to insufficient faceplate wetting, which may
compromise droplet formation and ejection [18]. The experimental surface
tension data of ink samples was calculate by using above standard formula and
given in the table 5.
After adding polymer nanocomposites in ink, the following graphs of
surface tension data were observed with different variations. Graphical
representation of magenta ink in figure 7 shows that, the surface tension of pure
magenta ink was 32.574. After adding the polymer nanocomposites PNC52 in the
variation of 0.5%, 1% and 2% with respect to the ink, it was observed that the
surface tension increased in case of 1% variation as compare to the pure ink and
again decreased in 2% variation but after adding polymer nanocomposites PNC54
in the variation of 0.5%, 1% and 2%, it was observed that the surface tension
decreased at every step.
Fig. 7 Surface tension Curve of Magenta Ink Samples
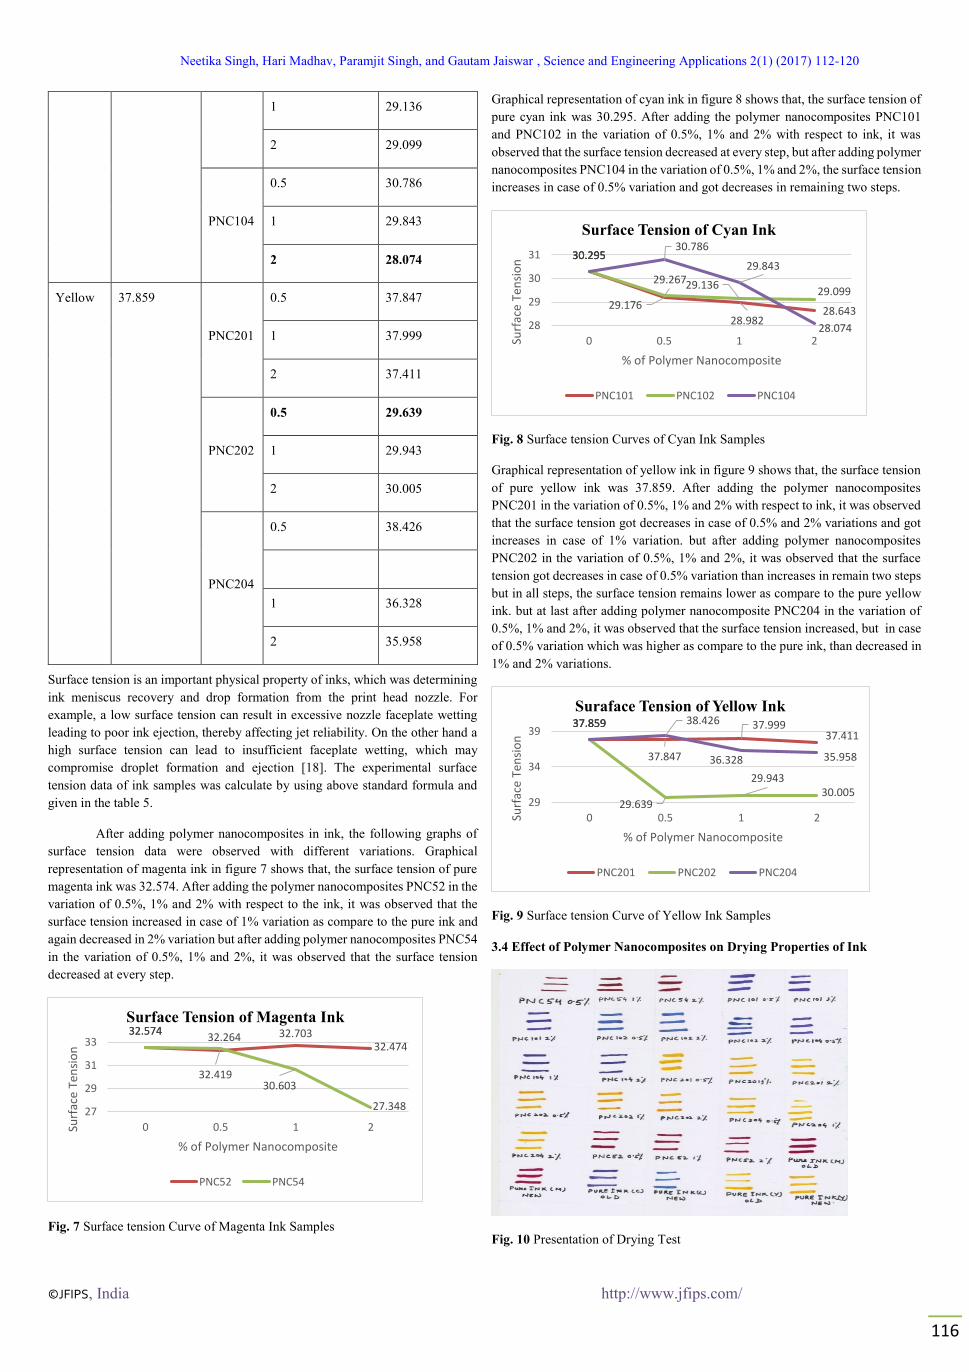
Graphical representation of cyan ink in figure 8 shows that, the surface tension of
pure cyan ink was 30.295. After adding the polymer nanocomposites PNC101
and PNC102 in the variation of 0.5%, 1% and 2% with respect to ink, it was
observed that the surface tension decreased at every step, but after adding polymer
nanocomposites PNC104 in the variation of 0.5%, 1% and 2%, the surface tension
increases in case of 0.5% variation and got decreases in remaining two steps.
Fig. 8 Surface tension Curves of Cyan Ink Samples
Graphical representation of yellow ink in figure 9 shows that, the surface tension
of pure yellow ink was 37.859. After adding the polymer nanocomposites
PNC201 in the variation of 0.5%, 1% and 2% with respect to ink, it was observed
that the surface tension got decreases in case of 0.5% and 2% variations and got
increases in case of 1% variation. but after adding polymer nanocomposites
PNC202 in the variation of 0.5%, 1% and 2%, it was observed that the surface
tension got decreases in case of 0.5% variation than increases in remain two steps
but in all steps, the surface tension remains lower as compare to the pure yellow
ink. but at last after adding polymer nanocomposite PNC204 in the variation of
0.5%, 1% and 2%, it was observed that the surface tension increased, but in case
of 0.5% variation which was higher as compare to the pure ink, than decreased in
1% and 2% variations.
Fig. 9 Surface tension Curve of Yellow Ink Samples
3.4 Effect of Polymer Nanocomposites on Drying Properties of Ink
Fig. 10 Presentation of Drying Test
32.57432.264 32.703
32.474
32.574
32.41930.603
27.34827
29
31
33
0 0.5 1 2Surf
ace
Ten
sio
n
% of Polymer Nanocomposite
Surface Tension of Magenta Ink
PNC52 PNC54
30.295
29.176
28.98228.643
30.295
29.26729.13629.099
30.29530.786
29.843
28.07428
29
30
31
0 0.5 1 2Surf
ace
Ten
sio
n
% of Polymer Nanocomposite
Surface Tension of Cyan Ink
PNC101 PNC102 PNC104
37.859
37.847
37.99937.411
37.859
29.639
29.94330.005
37.859 38.426
36.328 35.958
29
34
39
0 0.5 1 2Surf
ace
Ten
sio
n
% of Polymer Nanocomposite
Suraface Tension of Yellow Ink
PNC201 PNC202 PNC204
Neetika Singh, Hari Madhav, Paramjit Singh, and Gautam Jaiswar , Science and Engineering Applications 2(1) (2017) 112-120
©JFIPS, India http://www.jfips.com/
117
Drying is one of the most important parameter of printing ink. In our study, the
drying test was performed on the Desmat glossy paper which was shown in figure
10. In drying patterns, it was observed that, the pure magenta ink was dries on the
paper in 3 min 6 sec. cyan ink was dries on the paper in 2 min 4 sec. and the pure
yellow ink dries on the paper in 2 min 6 sec. The drying test shows that the
maximum drying time was 10 min 1 sec for sample code PNC102 with variation
of 2% and the minimum drying time was 1 min 5 sec for sample code PNC102
with variation of 1%. Drying time for each ink sample was given in table 6.
Table 6 Experimental Drying Time for Ink Samples
Code of
Sample
Observation
time
Code of Sample Observation
time
PNC52 (0.5%) 2 min 3 sec PNC104 (2%) 3min 8 sec
PNC52 (1%) 2 min 4 sec PNC201 (0.5%) 3 min 8 sec
PNC52 (2%) 2 mint 7 sec PNC201 (1%) 3 min
PNC54 (0.5%) 6 min 5 sec PNC201 (2%) 3 min 6 sec
PNC54 (1%) 5 min 4 sec PNC202 (0.5%) 3 min 3 sec
PNC54 (2%) 4 mint 4 sec PNC202 (1%) 2 min 9 sec
PNC101 (0.5%) 3 min 3 sec PNC202 (2%) 1 min 9sec
PNC101 (1%) 2 min 7 sec PNC204 (0.5%) 2 min 4 sec
PNC101 (2%) 2 min 7 sec PNC204 (1%) 1 min 6 sec
PNC102 (0.5%) 1 min 9 sec PNC204 (2%) 3 min 7 sec
PNC102 (1%) 1 min 5 sec Magenta 3 min 6 sec
PNC102 (2%) 10 min 1 sec Cyan 2 min 4 sec
PNC104 (0.5%) 2 min 4 sec Yellow 2 min 6 sec
PNC104 (1%) 3 min
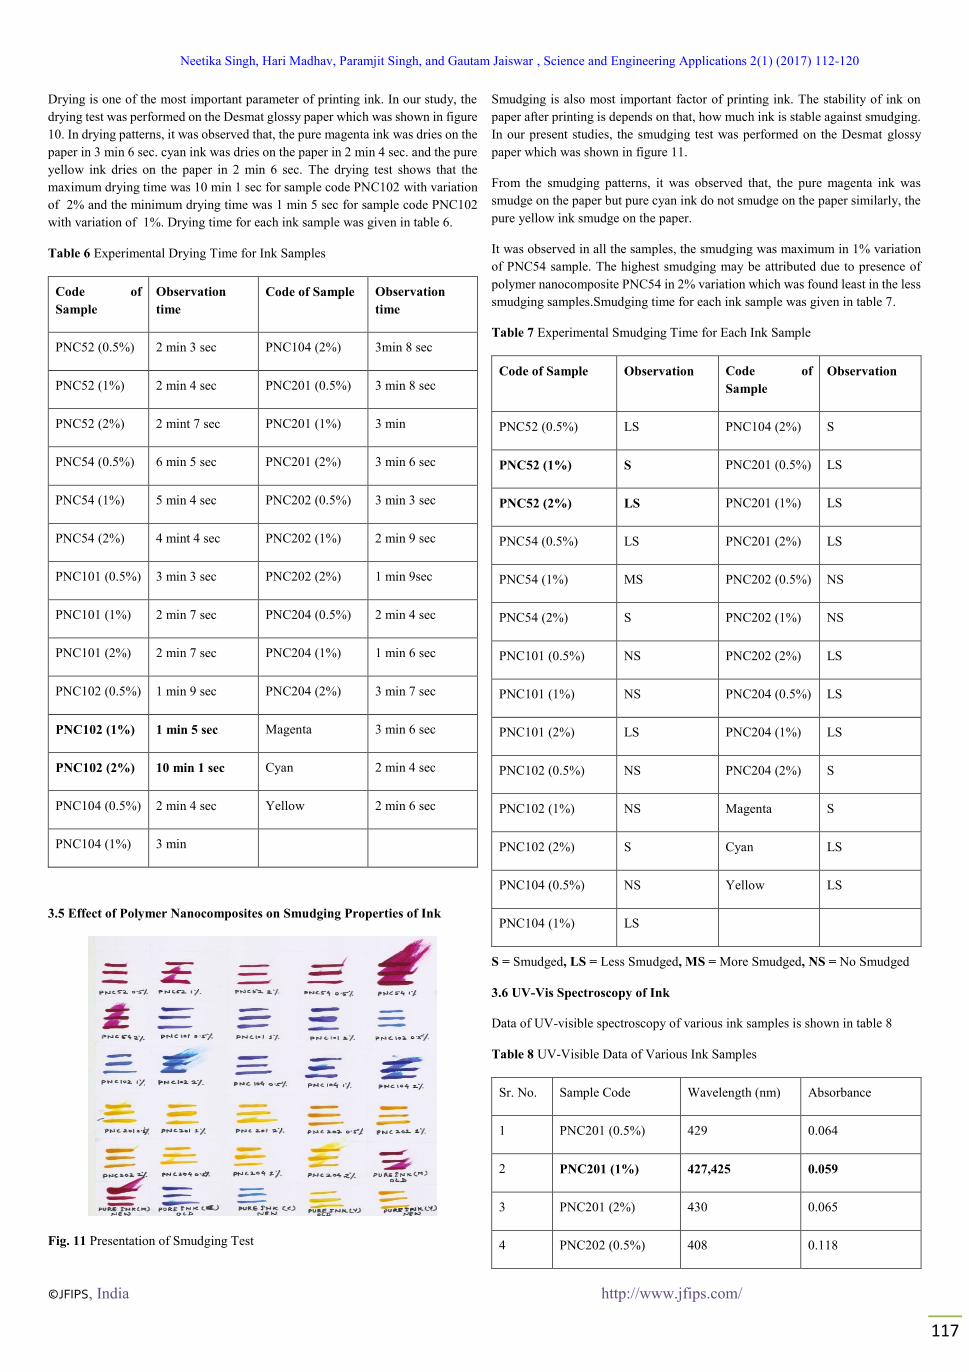
3.5 Effect of Polymer Nanocomposites on Smudging Properties of Ink
Fig. 11 Presentation of Smudging Test
Smudging is also most important factor of printing ink. The stability of ink on
paper after printing is depends on that, how much ink is stable against smudging.
In our present studies, the smudging test was performed on the Desmat glossy
paper which was shown in figure 11.
From the smudging patterns, it was observed that, the pure magenta ink was
smudge on the paper but pure cyan ink do not smudge on the paper similarly, the
pure yellow ink smudge on the paper.
It was observed in all the samples, the smudging was maximum in 1% variation
of PNC54 sample. The highest smudging may be attributed due to presence of
polymer nanocomposite PNC54 in 2% variation which was found least in the less
smudging samples.Smudging time for each ink sample was given in table 7.
Table 7 Experimental Smudging Time for Each Ink Sample
Code of Sample Observation Code of
Sample
Observation
PNC52 (0.5%) LS PNC104 (2%) S
PNC52 (1%) S PNC201 (0.5%) LS
PNC52 (2%) LS PNC201 (1%) LS
PNC54 (0.5%) LS PNC201 (2%) LS
PNC54 (1%) MS PNC202 (0.5%) NS
PNC54 (2%) S PNC202 (1%) NS
PNC101 (0.5%) NS PNC202 (2%) LS
PNC101 (1%) NS PNC204 (0.5%) LS
PNC101 (2%) LS PNC204 (1%) LS
PNC102 (0.5%) NS PNC204 (2%) S
PNC102 (1%) NS Magenta S
PNC102 (2%) S Cyan LS
PNC104 (0.5%) NS Yellow LS
PNC104 (1%) LS
S = Smudged, LS = Less Smudged, MS = More Smudged, NS = No Smudged
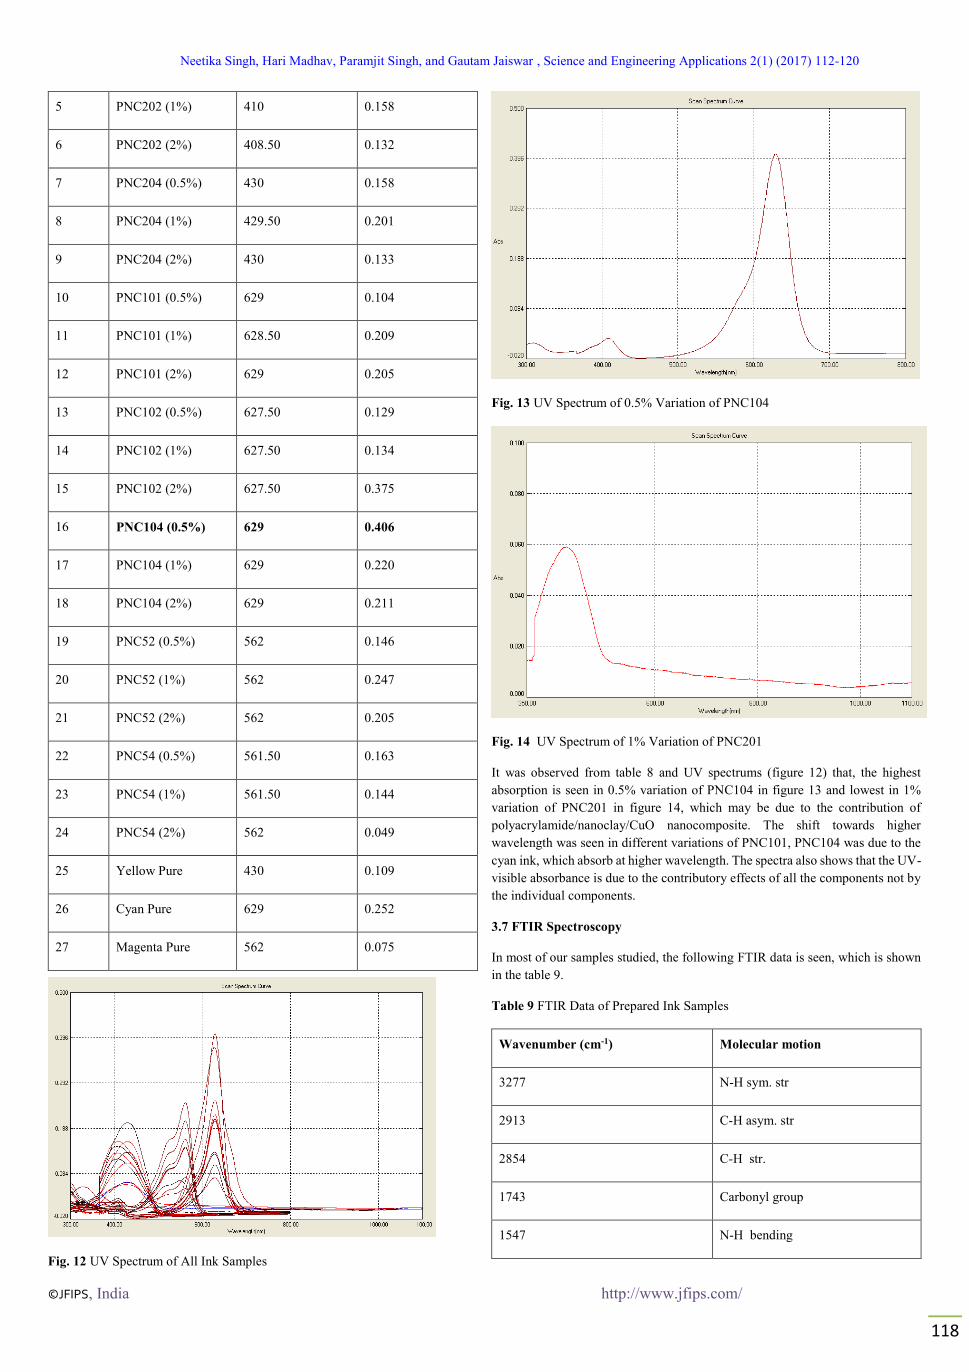
3.6 UV-Vis Spectroscopy of Ink
Data of UV-visible spectroscopy of various ink samples is shown in table 8
Table 8 UV-Visible Data of Various Ink Samples
Sr. No. Sample Code Wavelength (nm) Absorbance
1 PNC201 (0.5%) 429 0.064
2 PNC201 (1%) 427,425 0.059
3 PNC201 (2%) 430 0.065
4 PNC202 (0.5%) 408 0.118
Neetika Singh, Hari Madhav, Paramjit Singh, and Gautam Jaiswar , Science and Engineering Applications 2(1) (2017) 112-120
©JFIPS, India http://www.jfips.com/
118
5 PNC202 (1%) 410 0.158
6 PNC202 (2%) 408.50 0.132
7 PNC204 (0.5%) 430 0.158
8 PNC204 (1%) 429.50 0.201
9 PNC204 (2%) 430 0.133
10 PNC101 (0.5%) 629 0.104
11 PNC101 (1%) 628.50 0.209
12 PNC101 (2%) 629 0.205
13 PNC102 (0.5%) 627.50 0.129
14 PNC102 (1%) 627.50 0.134
15 PNC102 (2%) 627.50 0.375
16 PNC104 (0.5%) 629 0.406
17 PNC104 (1%) 629 0.220
18 PNC104 (2%) 629 0.211
19 PNC52 (0.5%) 562 0.146
20 PNC52 (1%) 562 0.247
21 PNC52 (2%) 562 0.205
22 PNC54 (0.5%) 561.50 0.163
23 PNC54 (1%) 561.50 0.144
24 PNC54 (2%) 562 0.049
25 Yellow Pure 430 0.109
26 Cyan Pure 629 0.252
27 Magenta Pure 562 0.075
Fig. 12 UV Spectrum of All Ink Samples
Fig. 13 UV Spectrum of 0.5% Variation of PNC104
Fig. 14 UV Spectrum of 1% Variation of PNC201
It was observed from table 8 and UV spectrums (figure 12) that, the highest
absorption is seen in 0.5% variation of PNC104 in figure 13 and lowest in 1%
variation of PNC201 in figure 14, which may be due to the contribution of
polyacrylamide/nanoclay/CuO nanocomposite. The shift towards higher
wavelength was seen in different variations of PNC101, PNC104 was due to the
cyan ink, which absorb at higher wavelength. The spectra also shows that the UV-
visible absorbance is due to the contributory effects of all the components not by
the individual components.
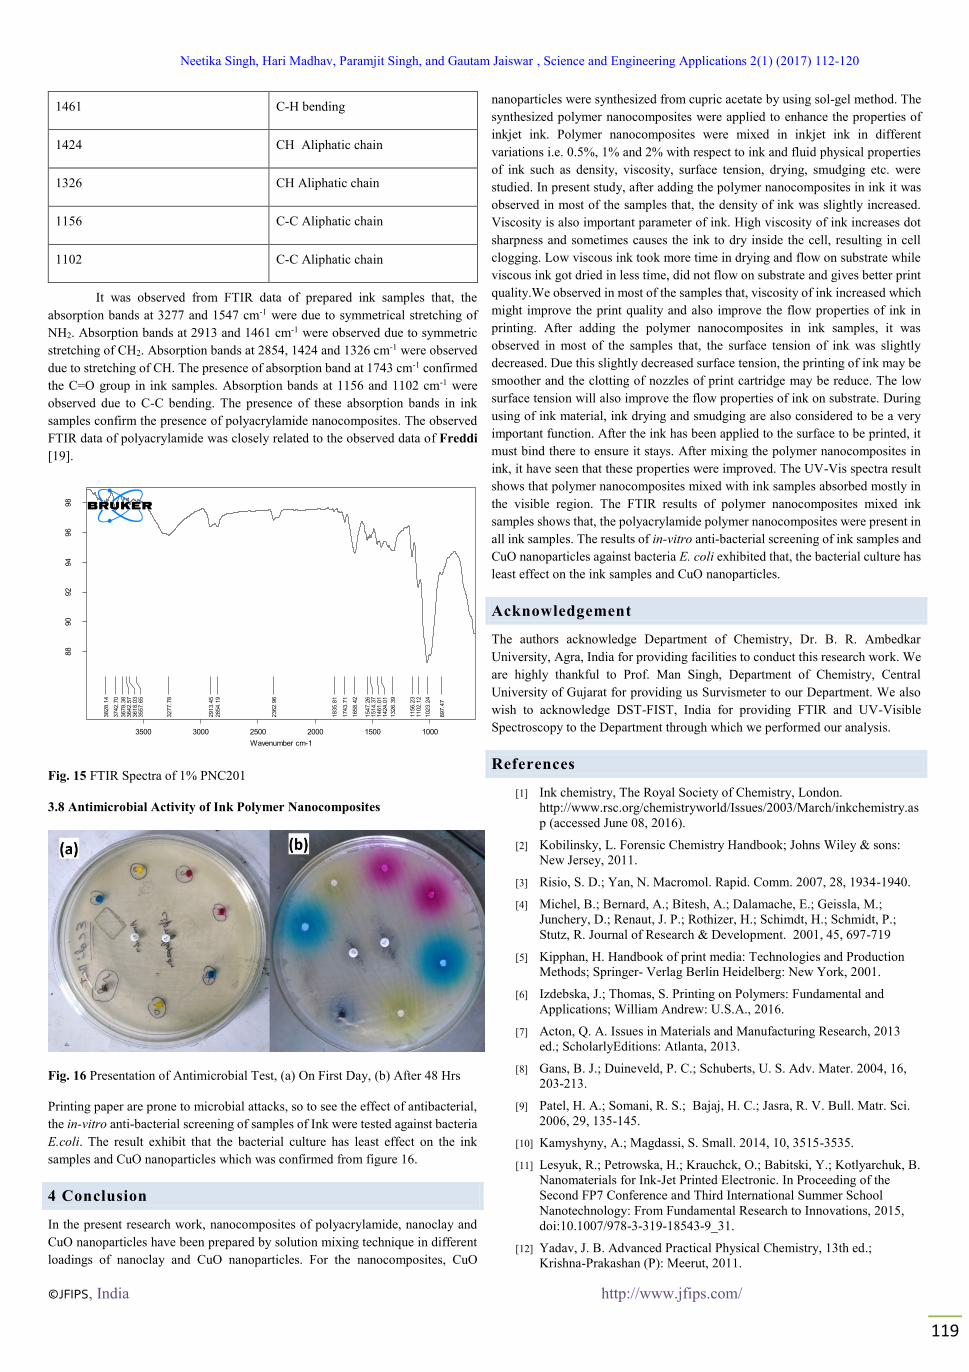
3.7 FTIR Spectroscopy
In most of our samples studied, the following FTIR data is seen, which is shown
in the table 9.
Table 9 FTIR Data of Prepared Ink Samples
Wavenumber (cm-1) Molecular motion
3277 N-H sym. str
2913 C-H asym. str
2854 C-H str.
1743 Carbonyl group
1547 N-H bending
Neetika Singh, Hari Madhav, Paramjit Singh, and Gautam Jaiswar , Science and Engineering Applications 2(1) (2017) 112-120
©JFIPS, India http://www.jfips.com/
119
1461 C-H bending
1424 CH Aliphatic chain
1326 CH Aliphatic chain
1156 C-C Aliphatic chain
1102 C-C Aliphatic chain
It was observed from FTIR data of prepared ink samples that, the
absorption bands at 3277 and 1547 cm-1 were due to symmetrical stretching of
NH2. Absorption bands at 2913 and 1461 cm-1 were observed due to symmetric
stretching of CH2. Absorption bands at 2854, 1424 and 1326 cm-1 were observed
due to stretching of CH. The presence of absorption band at 1743 cm-1 confirmed
the C=O group in ink samples. Absorption bands at 1156 and 1102 cm-1 were
observed due to C-C bending. The presence of these absorption bands in ink
samples confirm the presence of polyacrylamide nanocomposites. The observed
FTIR data of polyacrylamide was closely related to the observed data of Freddi
[19].
Fig. 15 FTIR Spectra of 1% PNC201
3.8 Antimicrobial Activity of Ink Polymer Nanocomposites
Fig. 16 Presentation of Antimicrobial Test, (a) On First Day, (b) After 48 Hrs
Printing paper are prone to microbial attacks, so to see the effect of antibacterial,
the in-vitro anti-bacterial screening of samples of Ink were tested against bacteria
E.coli. The result exhibit that the bacterial culture has least effect on the ink
samples and CuO nanoparticles which was confirmed from figure 16.
4 Conclusion
In the present research work, nanocomposites of polyacrylamide, nanoclay and
CuO nanoparticles have been prepared by solution mixing technique in different
loadings of nanoclay and CuO nanoparticles. For the nanocomposites, CuO
nanoparticles were synthesized from cupric acetate by using sol-gel method. The
synthesized polymer nanocomposites were applied to enhance the properties of
inkjet ink. Polymer nanocomposites were mixed in inkjet ink in different
variations i.e. 0.5%, 1% and 2% with respect to ink and fluid physical properties
of ink such as density, viscosity, surface tension, drying, smudging etc. were
studied. In present study, after adding the polymer nanocomposites in ink it was
observed in most of the samples that, the density of ink was slightly increased.
Viscosity is also important parameter of ink. High viscosity of ink increases dot
sharpness and sometimes causes the ink to dry inside the cell, resulting in cell
clogging. Low viscous ink took more time in drying and flow on substrate while
viscous ink got dried in less time, did not flow on substrate and gives better print
quality.We observed in most of the samples that, viscosity of ink increased which
might improve the print quality and also improve the flow properties of ink in
printing. After adding the polymer nanocomposites in ink samples, it was
observed in most of the samples that, the surface tension of ink was slightly
decreased. Due this slightly decreased surface tension, the printing of ink may be
smoother and the clotting of nozzles of print cartridge may be reduce. The low
surface tension will also improve the flow properties of ink on substrate. During
using of ink material, ink drying and smudging are also considered to be a very
important function. After the ink has been applied to the surface to be printed, it
must bind there to ensure it stays. After mixing the polymer nanocomposites in
ink, it have seen that these properties were improved. The UV-Vis spectra result
shows that polymer nanocomposites mixed with ink samples absorbed mostly in
the visible region. The FTIR results of polymer nanocomposites mixed ink
samples shows that, the polyacrylamide polymer nanocomposites were present in
all ink samples. The results of in-vitro anti-bacterial screening of ink samples and
CuO nanoparticles against bacteria E. coli exhibited that, the bacterial culture has
least effect on the ink samples and CuO nanoparticles.
Acknowledgement
The authors acknowledge Department of Chemistry, Dr. B. R. Ambedkar
University, Agra, India for providing facilities to conduct this research work. We
are highly thankful to Prof. Man Singh, Department of Chemistry, Central
University of Gujarat for providing us Survismeter to our Department. We also
wish to acknowledge DST-FIST, India for providing FTIR and UV-Visible
Spectroscopy to the Department through which we performed our analysis.
References
[1] Ink chemistry, The Royal Society of Chemistry, London.
http://www.rsc.org/chemistryworld/Issues/2003/March/inkchemistry.as
p (accessed June 08, 2016).
[2] Kobilinsky, L. Forensic Chemistry Handbook; Johns Wiley & sons:
New Jersey, 2011.
[3] Risio, S. D.; Yan, N. Macromol. Rapid. Comm. 2007, 28, 1934-1940.
[4] Michel, B.; Bernard, A.; Bitesh, A.; Dalamache, E.; Geissla, M.;
Junchery, D.; Renaut, J. P.; Rothizer, H.; Schimdt, H.; Schmidt, P.;
Stutz, R. Journal of Research & Development. 2001, 45, 697-719
[5] Kipphan, H. Handbook of print media: Technologies and Production
Methods; Springer- Verlag Berlin Heidelberg: New York, 2001.
[6] Izdebska, J.; Thomas, S. Printing on Polymers: Fundamental and
Applications; William Andrew: U.S.A., 2016.
[7] Acton, Q. A. Issues in Materials and Manufacturing Research, 2013
ed.; ScholarlyEditions: Atlanta, 2013.
[8] Gans, B. J.; Duineveld, P. C.; Schuberts, U. S. Adv. Mater. 2004, 16,
203-213.
[9] Patel, H. A.; Somani, R. S.; Bajaj, H. C.; Jasra, R. V. Bull. Matr. Sci.
2006, 29, 135-145.
[10] Kamyshyny, A.; Magdassi, S. Small. 2014, 10, 3515-3535.
[11] Lesyuk, R.; Petrowska, H.; Krauchck, O.; Babitski, Y.; Kotlyarchuk, B.
Nanomaterials for Ink-Jet Printed Electronic. In Proceeding of the
Second FP7 Conference and Third International Summer School
Nanotechnology: From Fundamental Research to Innovations, 2015,
doi:10.1007/978-3-319-18543-9_31.
[12] Yadav, J. B. Advanced Practical Physical Chemistry, 13th ed.;
Krishna-Prakashan (P): Meerut, 2011.
D:\NEETIKA\MEAS\Y8 1%.0 Y8 1% Instrument type and / or accessory 5/11/2016
3828.1
4
3742.7
0
3678.3
83642.5
73618.0
33557.6
5
3277.7
8
2913.4
5
2854.1
9
2362.9
6
1835.8
1
1743.7
1
1658.4
2
1547.2
61514.3
71461.0
11424.0
1
1326.3
9
1156.2
31102.1
2
1023.2
4
897.4
7
100015002000250030003500
Wavenumber cm-1
88
90
92
94
96
98
Tra
nsm
itta
nce [
%]
Page 1/1
Neetika Singh, Hari Madhav, Paramjit Singh, and Gautam Jaiswar , Science and Engineering Applications 2(1) (2017) 112-120
©JFIPS, India http://www.jfips.com/
120
[13] Singh, M. Surf. Interface. Anal. 2008, 40, 1344–1349.
[14] Aparna, Y.; Rao, K. V. E.; Subbarao, P. S. Synthesis and
Characterization of CuO Nano Particles by Novel Sol-Gel Method. In
International Proceeding of Chemical. Biological and Environmental
Engineering, 2012, doi: 10.7763/IPCBEE.
[15] Density & Dot Gain, Salmon Creek Publishing, U.S.
http://www.flexoglobal.com/flexomag/08-July/flexomag-ploumidis
(accessed July 13, 2016).
[16] For your print information: Ink Viscosity, Graphic Art Magzine,
Canada. http://graphicartsmag.com/articles/2011/02/for-your-print-
information-ink-viscosity (accessed July 13, 2016).
[17] Suganuma, K. Introduction to Printed Electronics; Springer: New
York, 2014.
[18] Printing Inks & Adhesives, Kibron Inc, Finland.
http://www.kibron.com/solutions/printing-inks-a-adhesives (accessed
July 13, 2016).
[19] Freddi, G.; Tsukada, M.; Beretta, S. J. Appl. Polym. Sci. 1999, 71,
1563-1571.